
Geological Significance of Bulk Density and Magnetic Susceptibility of the Rocks from Northwest Himalayas, Pakistan

 ,
,  ,
,  ,
,  , and
, and
Abstract

1. Introduction


| Age | Formation | Lithology | |
|---|---|---|---|
| Quaternary | Quaternary | Unconsolidated gravel, silt, sand, and clay deposits | |
| Sedimentary and metasedimentary rocks of the Indian Plate | |||
| Early to Middle Miocene | Kamlial Formation | Sandstone, shales, and siltstone interbedded with intraformational conglomerates | |
| Murree Formation | The cyclic deposits of siltstone, sandstone, shales, and mudstone | ||
| Early to Late Eocene | Kuldana Formation | Shales (variegated colour) with siltstone, sandstone and limestone lenses | |
| Chorgali Formation | Thinly bedded limestone with shales | ||
| Margala Hill Limestone | Nodular limestone with shales intercalations | ||
| Early to Late Paleocene | Patala Formation | Grey colour shale with subordinate limestone and marl beds | |
| Lockhart Limestone | Dark grey to grey nodular limestone with shales and marls intercalations | ||
| Hangu Formation | Ferruginous sandstone, Bauxite, Laterite and shales. Coal is also present | ||
| Cretaceous | Kawagarh Formation | Micritic and well-bedded limestone with few shale beds and marl | |
| Lumshiwal Formation | Ferruginous and glauconitic sandstone with shales | ||
| Chichali Formation | Black coloured splintery shales with minor sandstone | ||
| Jurassic | Samana Suk Formation | Bedded limestone that is intercalated with marls and shales | |
| Datta Formation | Sandstone (Ferruginous) and quartzite | ||
| Late Triassic to Jurassic | Banna Formation | Chlorite and graphitic schist, slates and marble | |
| Saidu Formation | Schist, graphitic phyllite with some calcite marble | ||
| Nikanai Ghar Formation | Calcite marble, dolomitic marble and minor phyllites | ||
| Triassic | Kashala Formation | Dolomitic marble, calcite marble, calcareous marble, schistose marble, and calc-garnet schist, | |
| Permian to Triassic | Surgun Group | Paragneisses, calcschist, mica schists, quartzites, marble, minor amphibolites and minor level of meta-conglomerates | |
| Late Carboniferous to Triassic | Marghazar Formation | Amphibolite, metapsammite, biotite schist, garnetiferous schist, hornblende schist, schistose marble, and marble | |
| Mekhband Formation | Amphibolite and schistose marble | ||
| Duma Formation | Phyllite, greenschist, biotite schist, quartzite, amphibolite, graphitic phyllite and marble argillite | ||
| Carboniferous | Jagfar Kandao Formation | Limestone, argillite, calcareous as well as argillaceous quartzite, with conglomerates | |
| Devonian | Nowshera Formation | Limestone, sandy dolomite, calcareous argillite, marble and calcareous quartzite | |
| Silurian | Panjpir Formation | Metasiltstone, argillite, Phyllite, minor argillaceous quartzite with some basal conglomerates | |
| Ordovician | Misri Banda Quartzite | Feldspathic quartzite, minor argillite with some local basal conglomerate | |
| Cambrian | Hazira Formation | Reddish to brownish coloured shales, sandstone and siltstone | |
| Abbottabad Formation | Dolomitic limestone, dolomite, calcareous sandstone and quartzite. Phosphate deposits are also present | ||
| Ambar Formation | Sandy dolomite, minor argillite and some basal conglomerate | ||
| Early to Late Proterozoic | Tanol Formation | Quartzose schist, quartzite, muscovite schist, biotite schist, garnet schist and some marble as well | |
| Jobra Formation | Garnet-biotite schist, quartzite, marble and amphibolite | ||
| Manglaur Formation | Muscovite-quartz schist, Garnet schist, marble, quartzite and some graphitic schist | ||
| Hazara Formation | Dominantly slates and phyllites, as well as minor gypsum and limestone | ||
| Salkhala Formation | Psammitic-pelitic meta-sedimentary quartz-mica schist and talc schist with some quartzite and marble | ||
| Gandaf Formation | Metapsammite, phyllite, graphitic slate, schist, graphitic garnet schist, argillite, quartzite and marble | ||
| Karora Group | Karora Formation | Graphitic schist, dolomite, marble and calcite, fine-grained and dark metapsammite | |
| Amlo Meta-conglomerate Member | Meta-conglomerate, graphitic schist and quartzite | ||
| Pinjkora Formation | Biotite gneiss, micaceous schist, pegmatite, leucogneiss, marble, and amphibolite | ||
| Higher Himalayan Crystalline | Dominantly ortho- and para-gneisses complex, relics of granulitic texture with minor metabasites, marble, granite and amphibolite | ||
| Kishar Formation | Dark, non-schistose and biotite-bearing quartzo-feldspathic rocks and gneisses, calc-silicate marble and quartzite | ||
| Indus Suture Melange Zone (MMT) | |||
| Mainly Cretaceous | Indus Melange Zone | Greenstones, phyllite, serpentinite, talc-carbonate schist, blueschist, greenschist, meta-gabbro, marble and ultramafics | |
| Kohistan Island Arc rocks | |||
| Cretaceous to Miocene | Kohistan Batholith | Diorite, granite, granodiorite, leucogranite, hornblendite and gabbro with some meta-volcanics and schist | |
| Chillas Complex | Pyroxene diorite-tonalite, olivine gabbro, gabbronorite with some peridotite, pyroxenite, dunite, hornblendite and anorthosite | ||
| Kamila Amphibolite Belt | Amphibolite, plagiogranite, hornblendite, pegmatite, diorite, as well as minor gabbro | ||
| Jijal/Sapat Complex | Dunite, pyroxenite, peridotite, high-pressure-garnet granulites and rare chromite with anorthosite and gabbro | ||
| Igneous and metaigneous rocks of the Indian Plate | |||
| Neogene | Leucogranite | Potash-quartz-feldspar-plagioclase- biotite-tourmaline-muscovite-garnet bearing leucogranites, aplite and pegmatites dykes | |
| Paleogene | Tourmaline Granite Gneiss | Tourmaline-muscovite bearing leucogranitic gneiss with some fine-grained biotite bearing granite gneiss | |
| Carboniferous to Permian | Ambela Complex | Nepheline syenite, syenite and alkali granite. Minor biotite-muscovite granite and carbonatite. The complex is intruded by tourmaline and diabase pegmatite | |
| Chakdara Orthogneiss | Leucocratic muscovite-biotite-quartz-plagioclase-potash feldspar granite gneiss | ||
| Panjal Formation | Panjal Metasediments | Meta-carbonates, quartzites and graphitic phyllites. Meta-psammitic to meta-pelitic rocks with some lenses of volcanics | |
| Panjal Volcanics | Basaltic lava flows with tuff layers, greenstones, lenses and intercalations of schistose and limestone rocks | ||
| Shewa Complex | Alkaline microgranites and porphyry. The complex is intruded by diorites | ||
| Cambrian to Ordovician | Neelum, Mansehra and Swat Granite and Granitic Gneiss | Primarily mega-crystal granite as well as granite gneiss, tourmaline bearing granite and pegmatite | |
| Late Proterozoic | Black Mountain Complex | Orthogneiss, mafic intrusions and pegmatites having minor garnet-bearing or biotite-bearing gneisses | |
| Early Proterozoic | Kotla Complex | Biotite-muscovite orthogneiss, pegmatite, mafic intrusions and leucogneiss | |
| Besham Complex | Shang hornblende-biotite bearing granodiorite gneisses, Lahor leucogranites, pegmatites, biotite bearing orthogneisses, leucogneisses and mafic intrusions | ||
2. Geological and Tectonic Setting
3. Methodology
3.1. Bulk Density Measurement
3.2. Magnetic Susceptibility Measurement
3.3. Bulk Density and Magnetic Susceptibility Tables
3.4. Frequency Histograms, Box and Whisker Plots and Henkel’s Plot
3.5. Spatial Distribution Maps of Bulk Density and Magnetic Susceptibility
4. Results and Discussion
4.1. Analysis of the Density and Magnetic Susceptibility Data
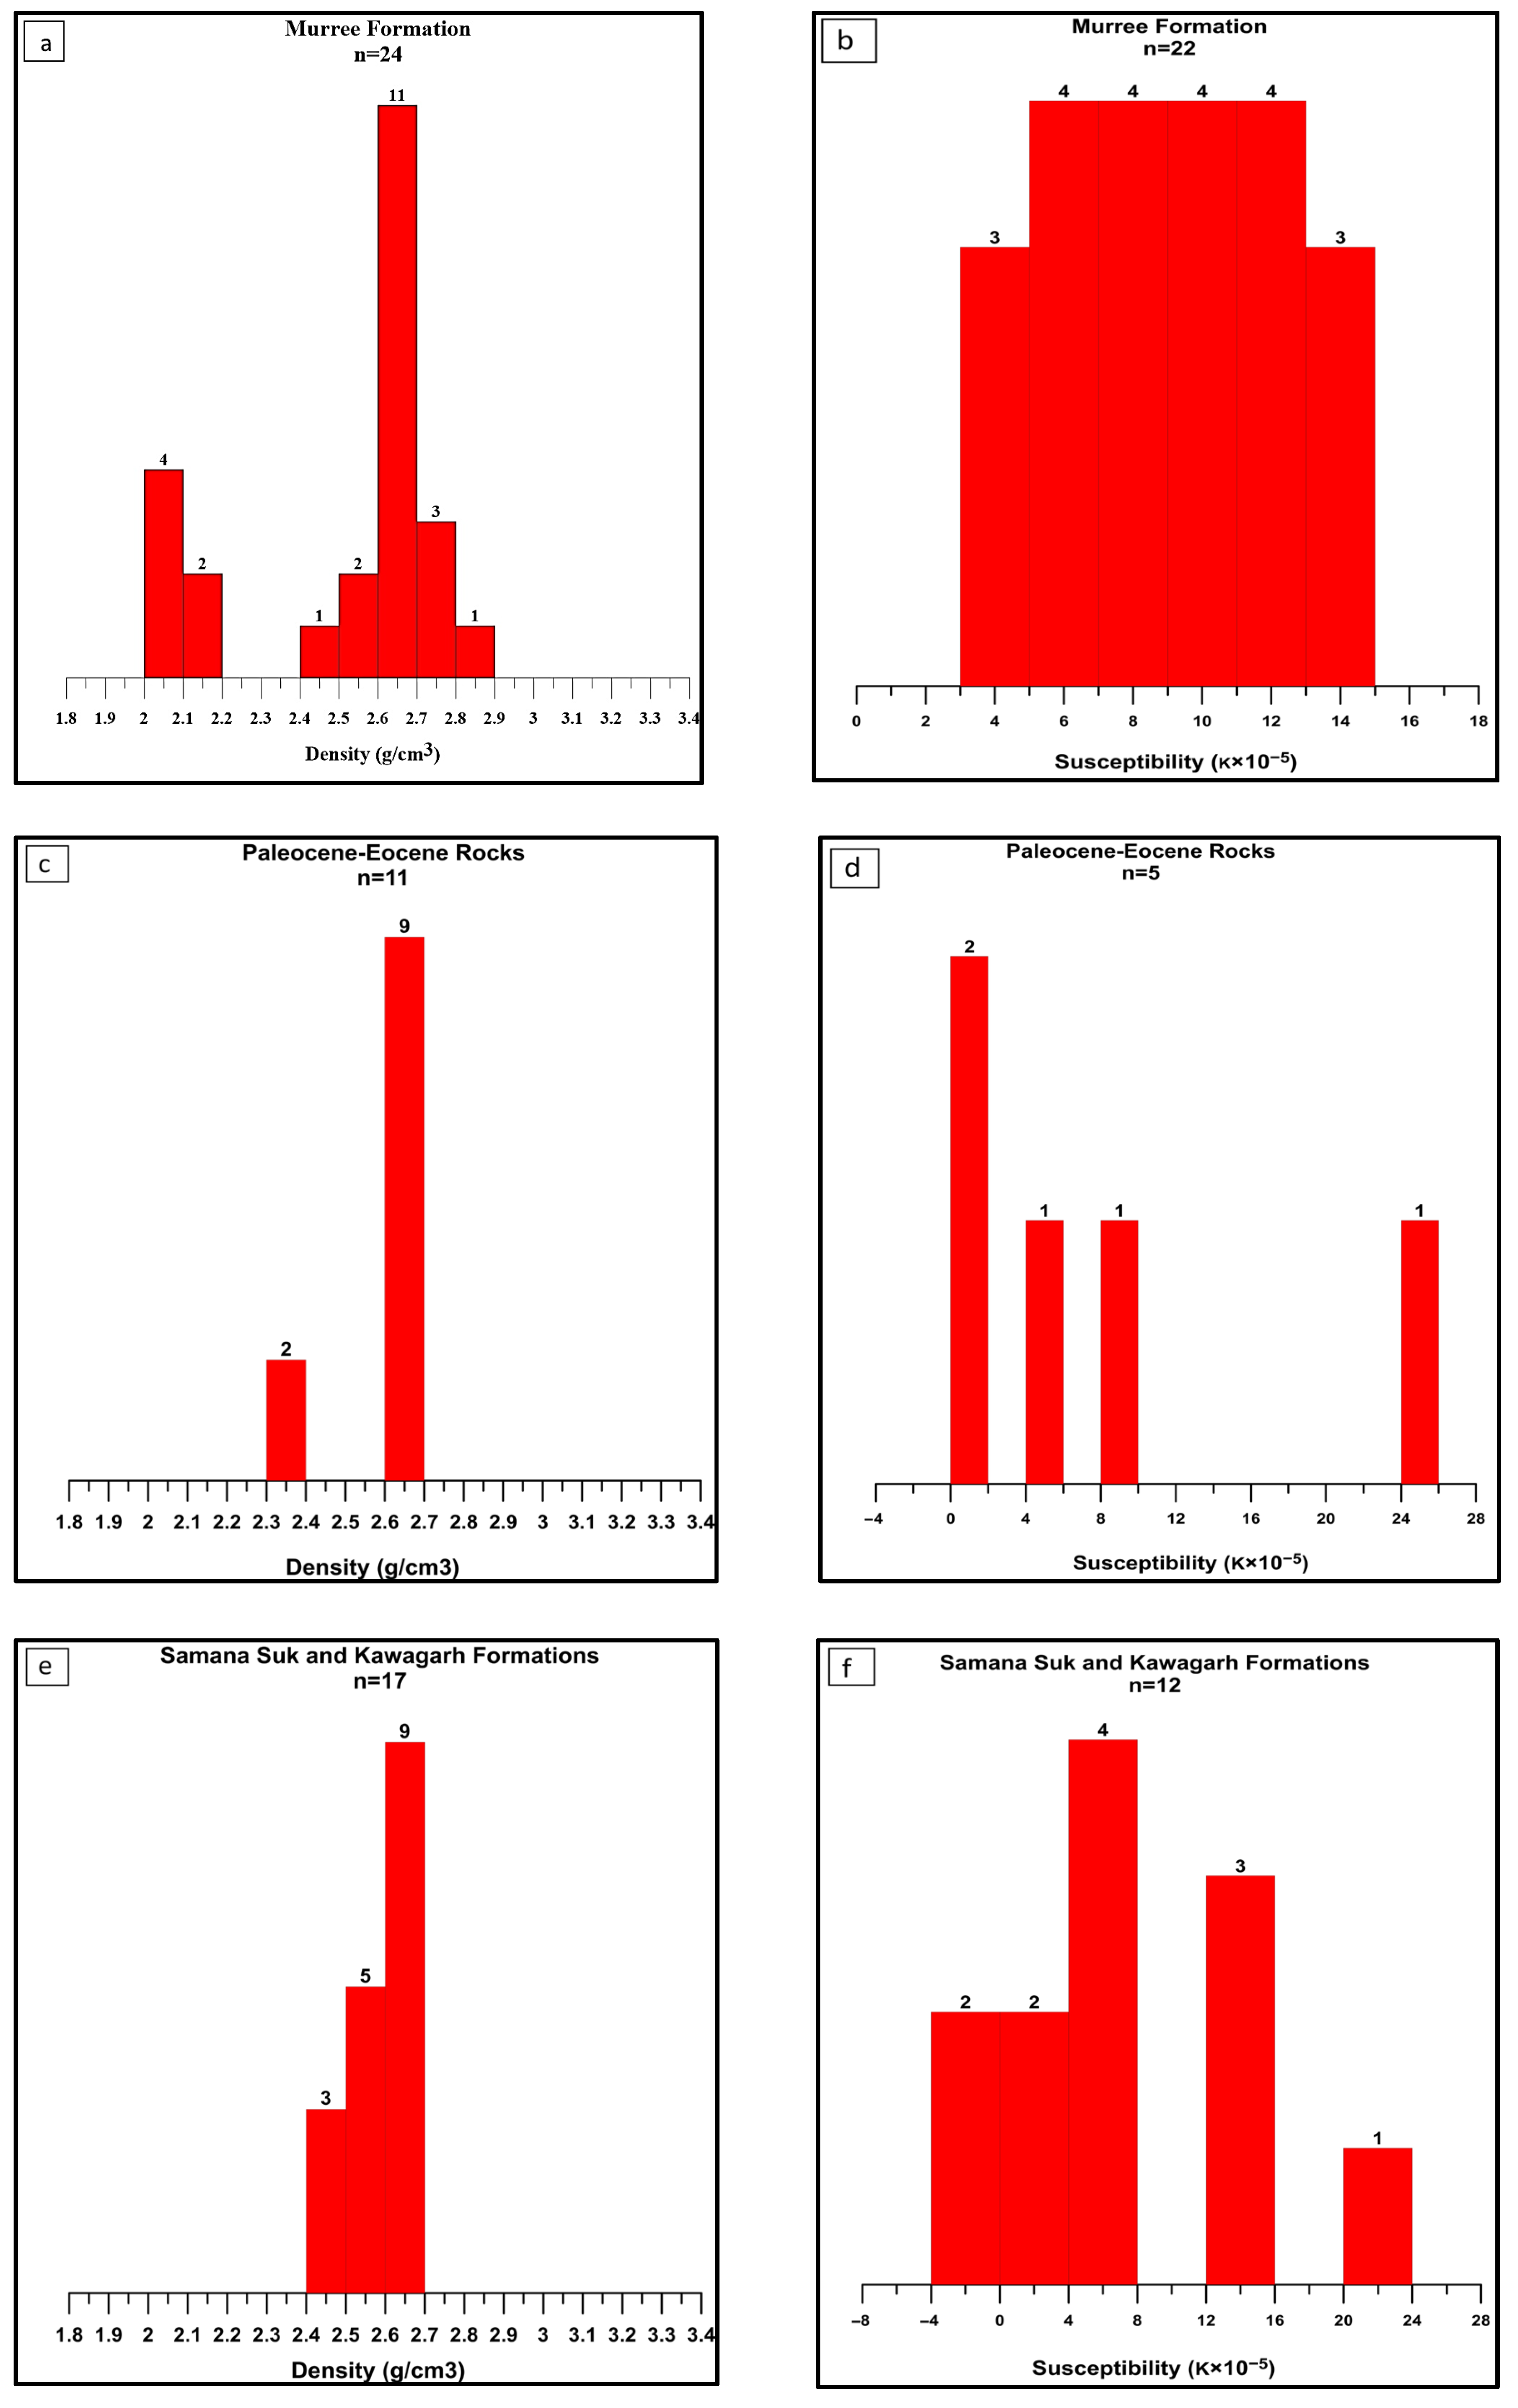
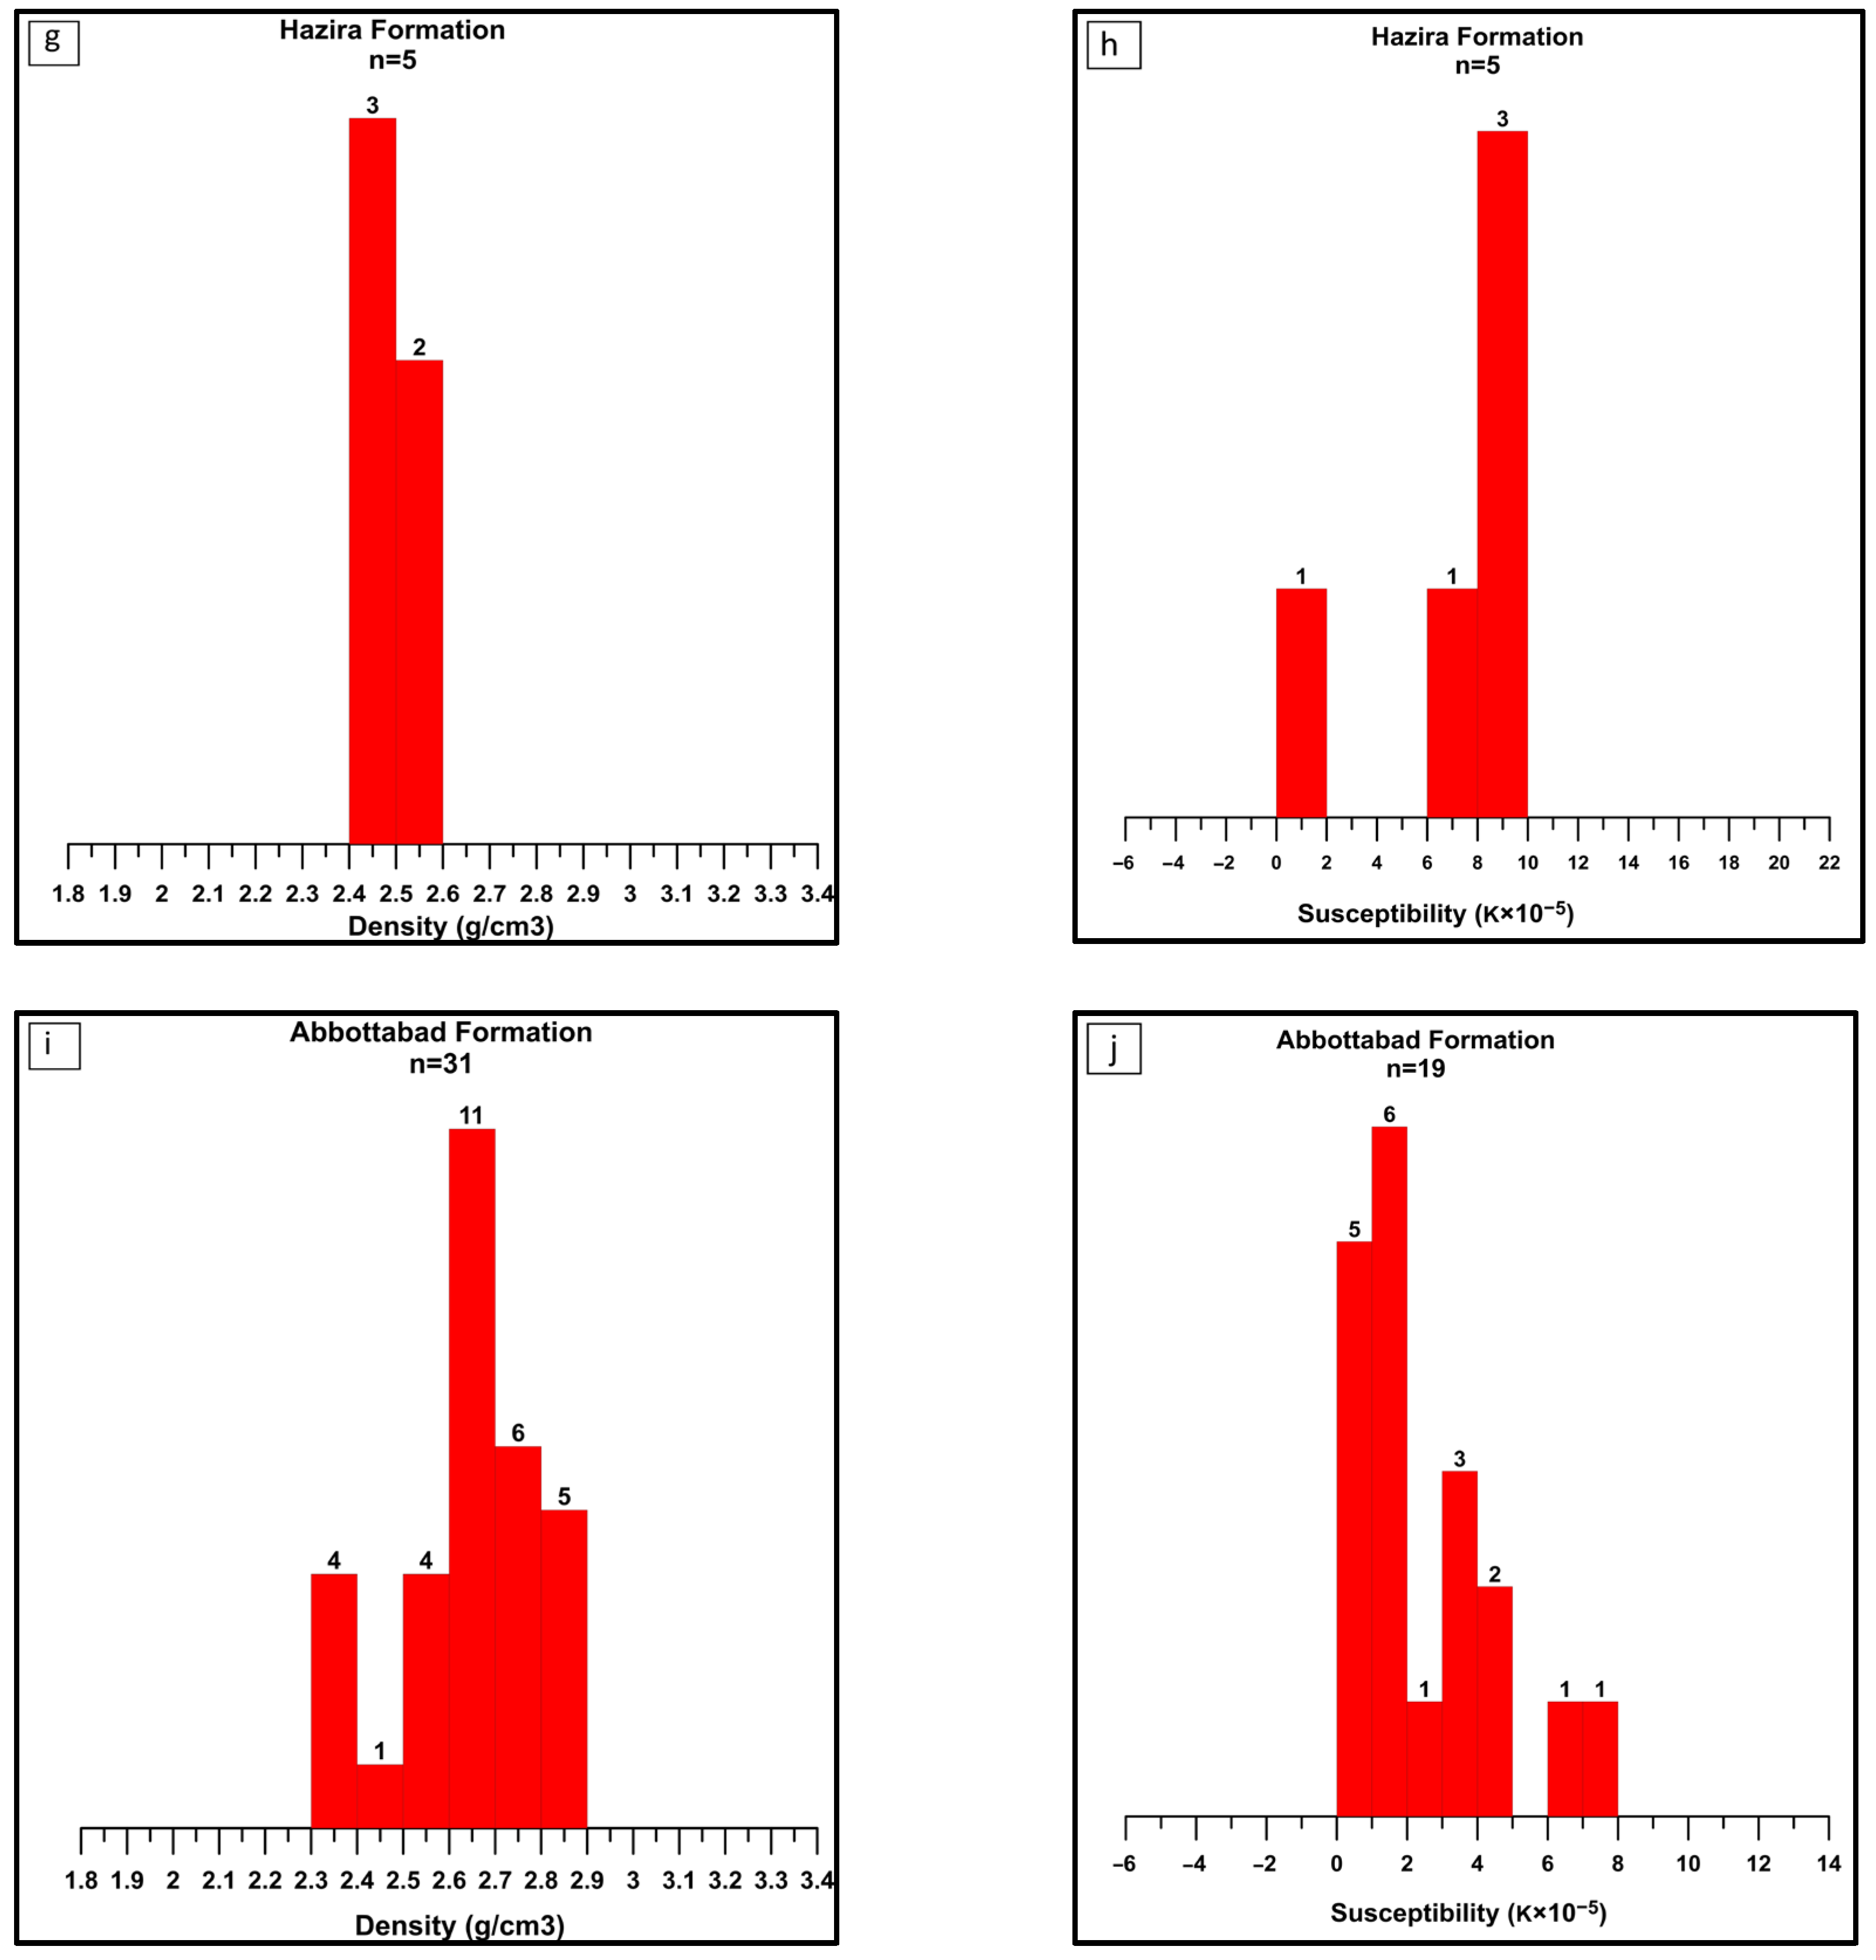
4.1.1. Bulk Density and Magnetic Susceptibility of the Sedimentary Rocks of the Indian Plate


| Formation | No. of Samples (n) | Minimum and Maximum Density (g/cm3) | Arithmetic Mean (g/cm3) | Standard Deviation (SD) | |
|---|---|---|---|---|---|
| Sedimentary rocks of the Indian Plate | |||||
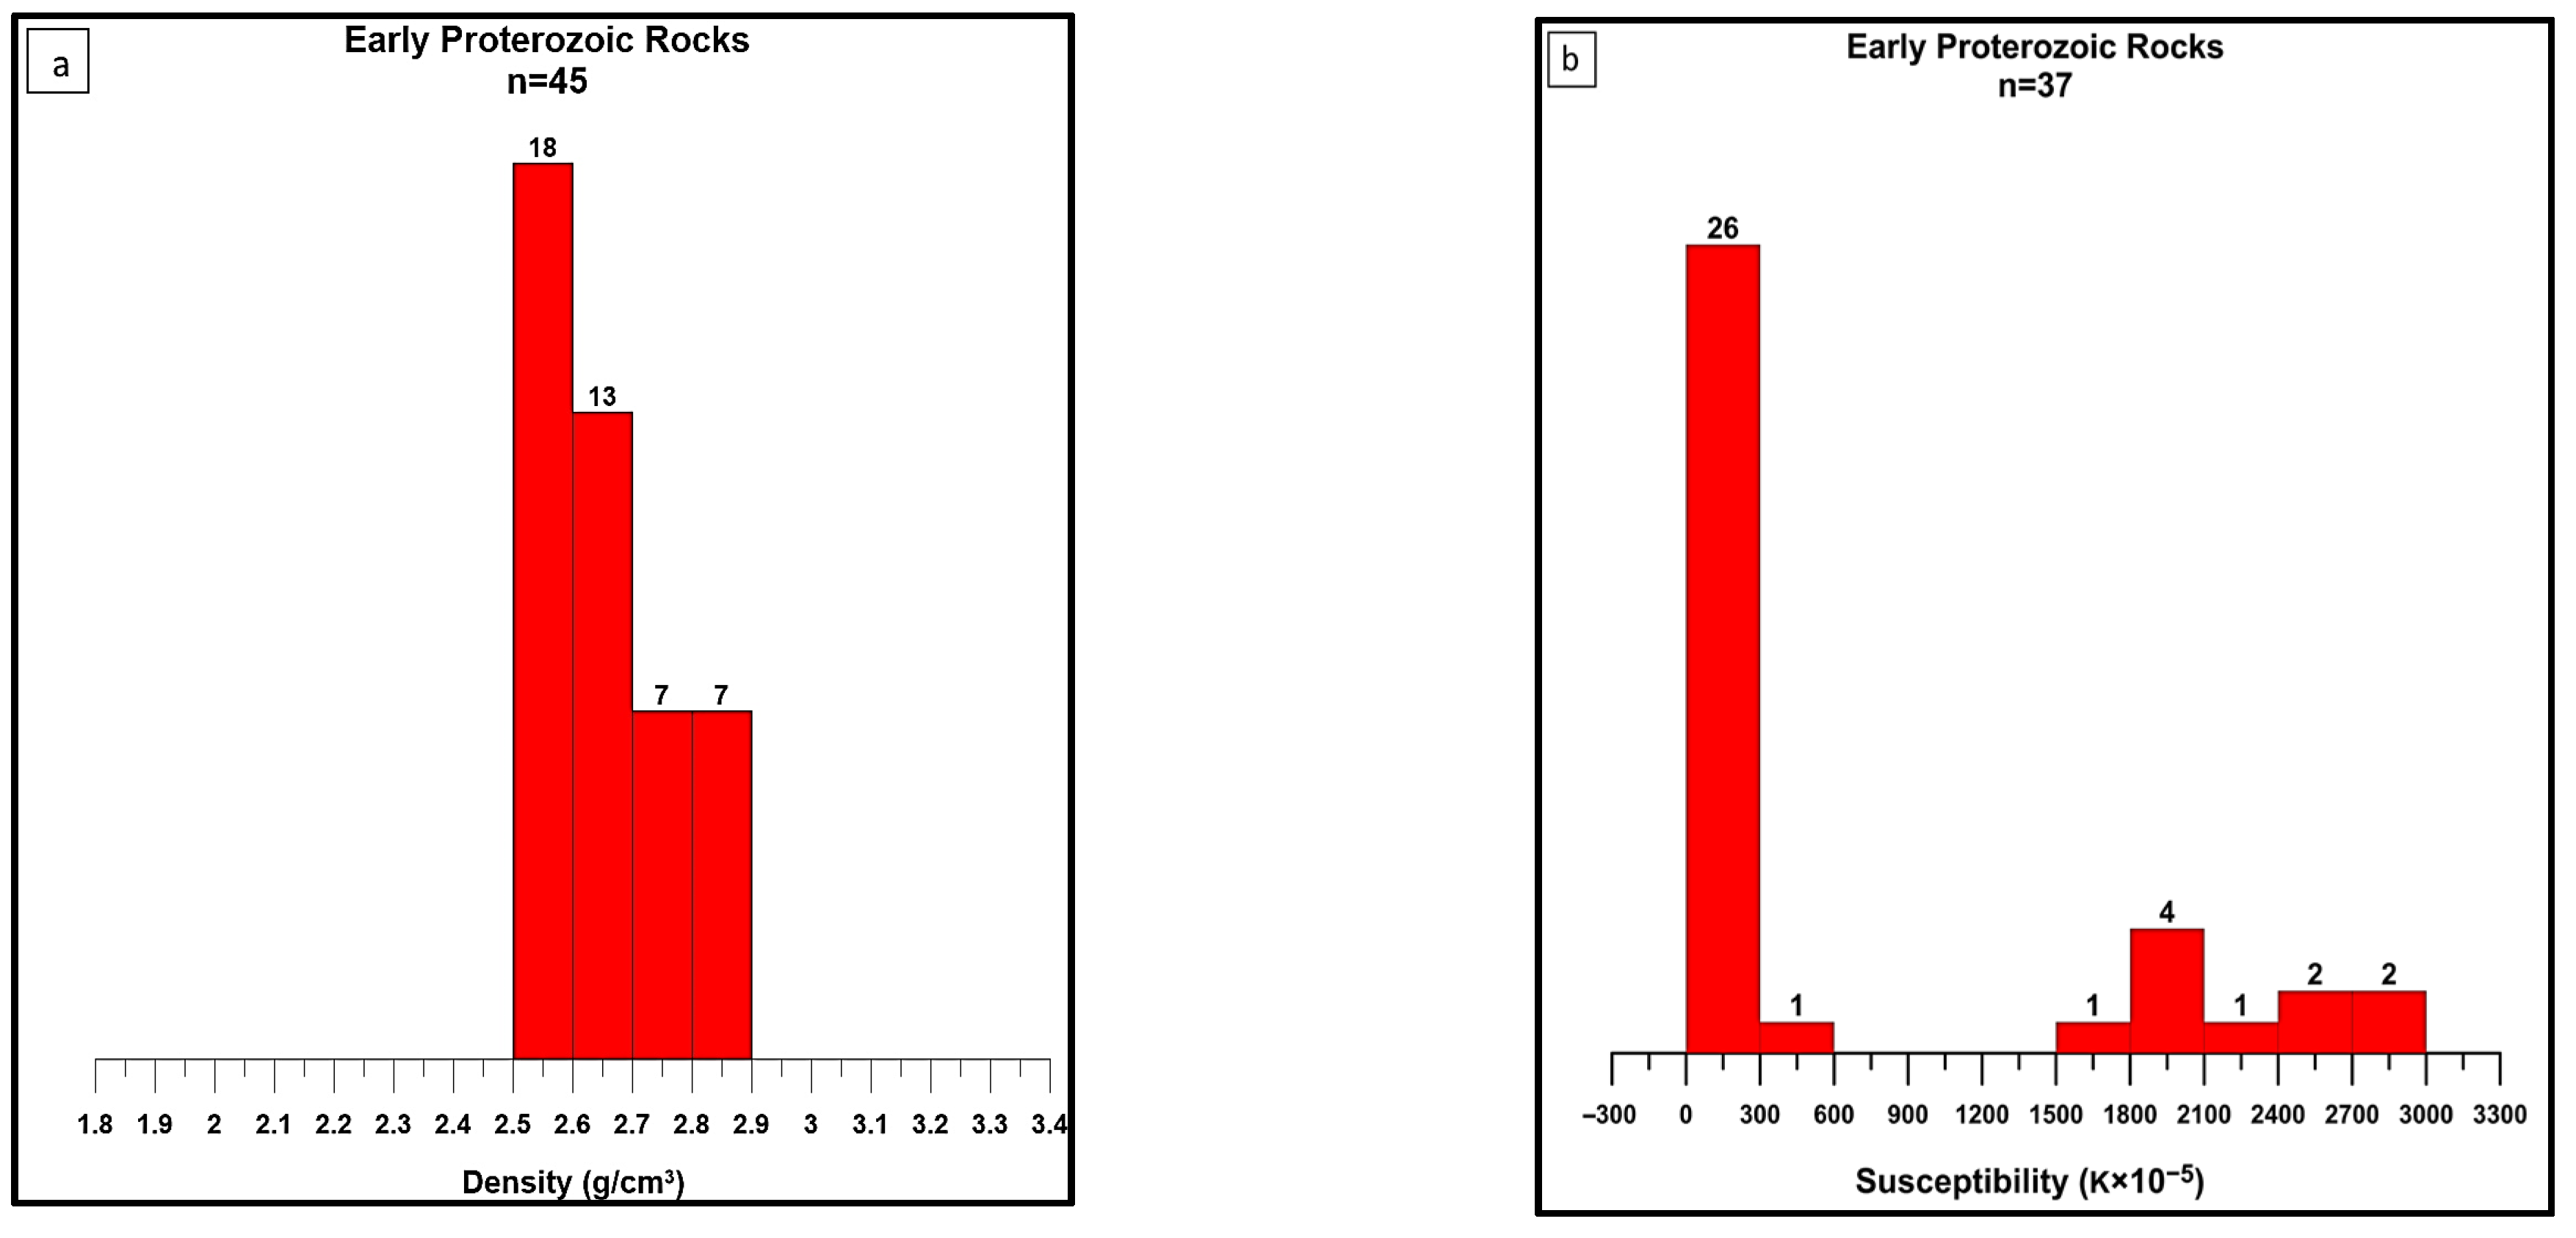
| Murree Formation | 24 | 2.026–2.874 | 2.510 | 2.585 | 0.262 |
| Paleocene and Eocene Rocks (Lockhart Limestone, Margalla Hill Limestone and Kuldana Formation) | 11 | 2.390–2.684 | 2.601 | 0.105 | |
| Samana Suk and Kawagarh formations | 17 | 2.480–2.696 | 2.598 | 0.081 | |
| Hazira Formation | 5 | 2.463–2.520 | 2.496 | 0.022 | |
| Abbottabad Formation | 31 | 2.354–2.878 | 2.644 | 0.142 | |
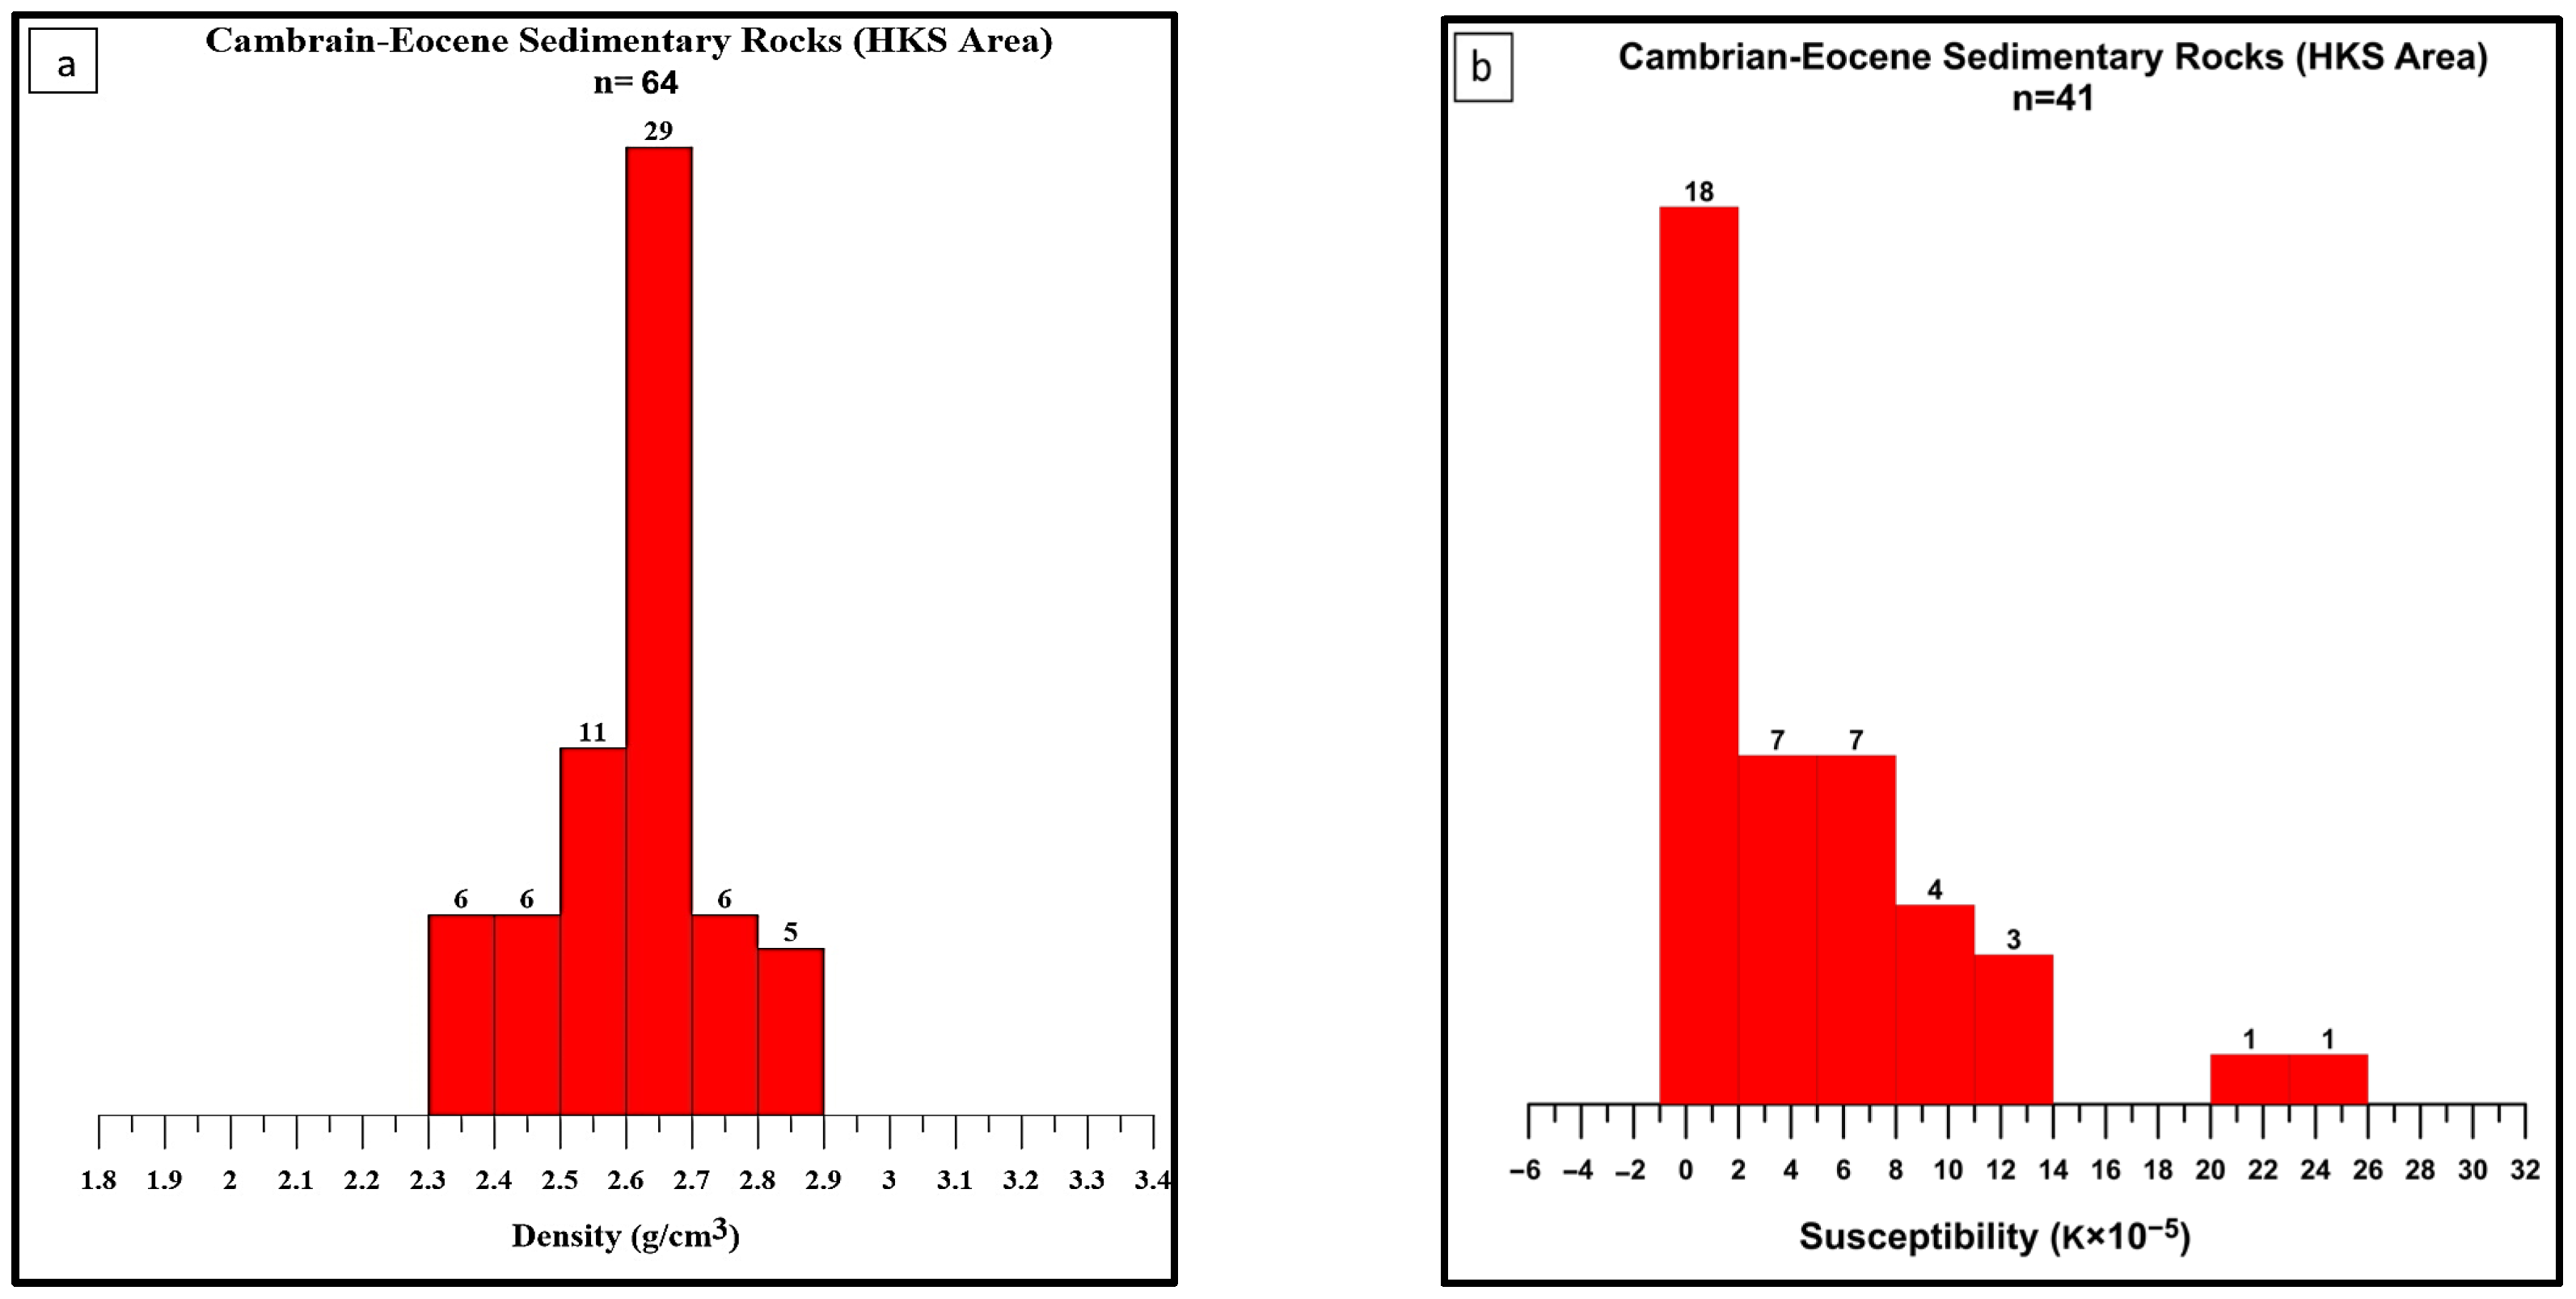
| Undivided Cambrian to Eocene Sedimentary Rocks from HKS area | |||||
| Undivided Cambrian to Eocene Sedimentary Rocks (Abbottabad, Hazira, Samana Suk and Kawagarh formations, Lockhart Limestone, Margalla Hill Limestone and Kuldana Formation) | 64 | 2.354–2.878 | 2.613 | 0.121 | |
| Metasedimentary rocks of the Indian Plate | |||||
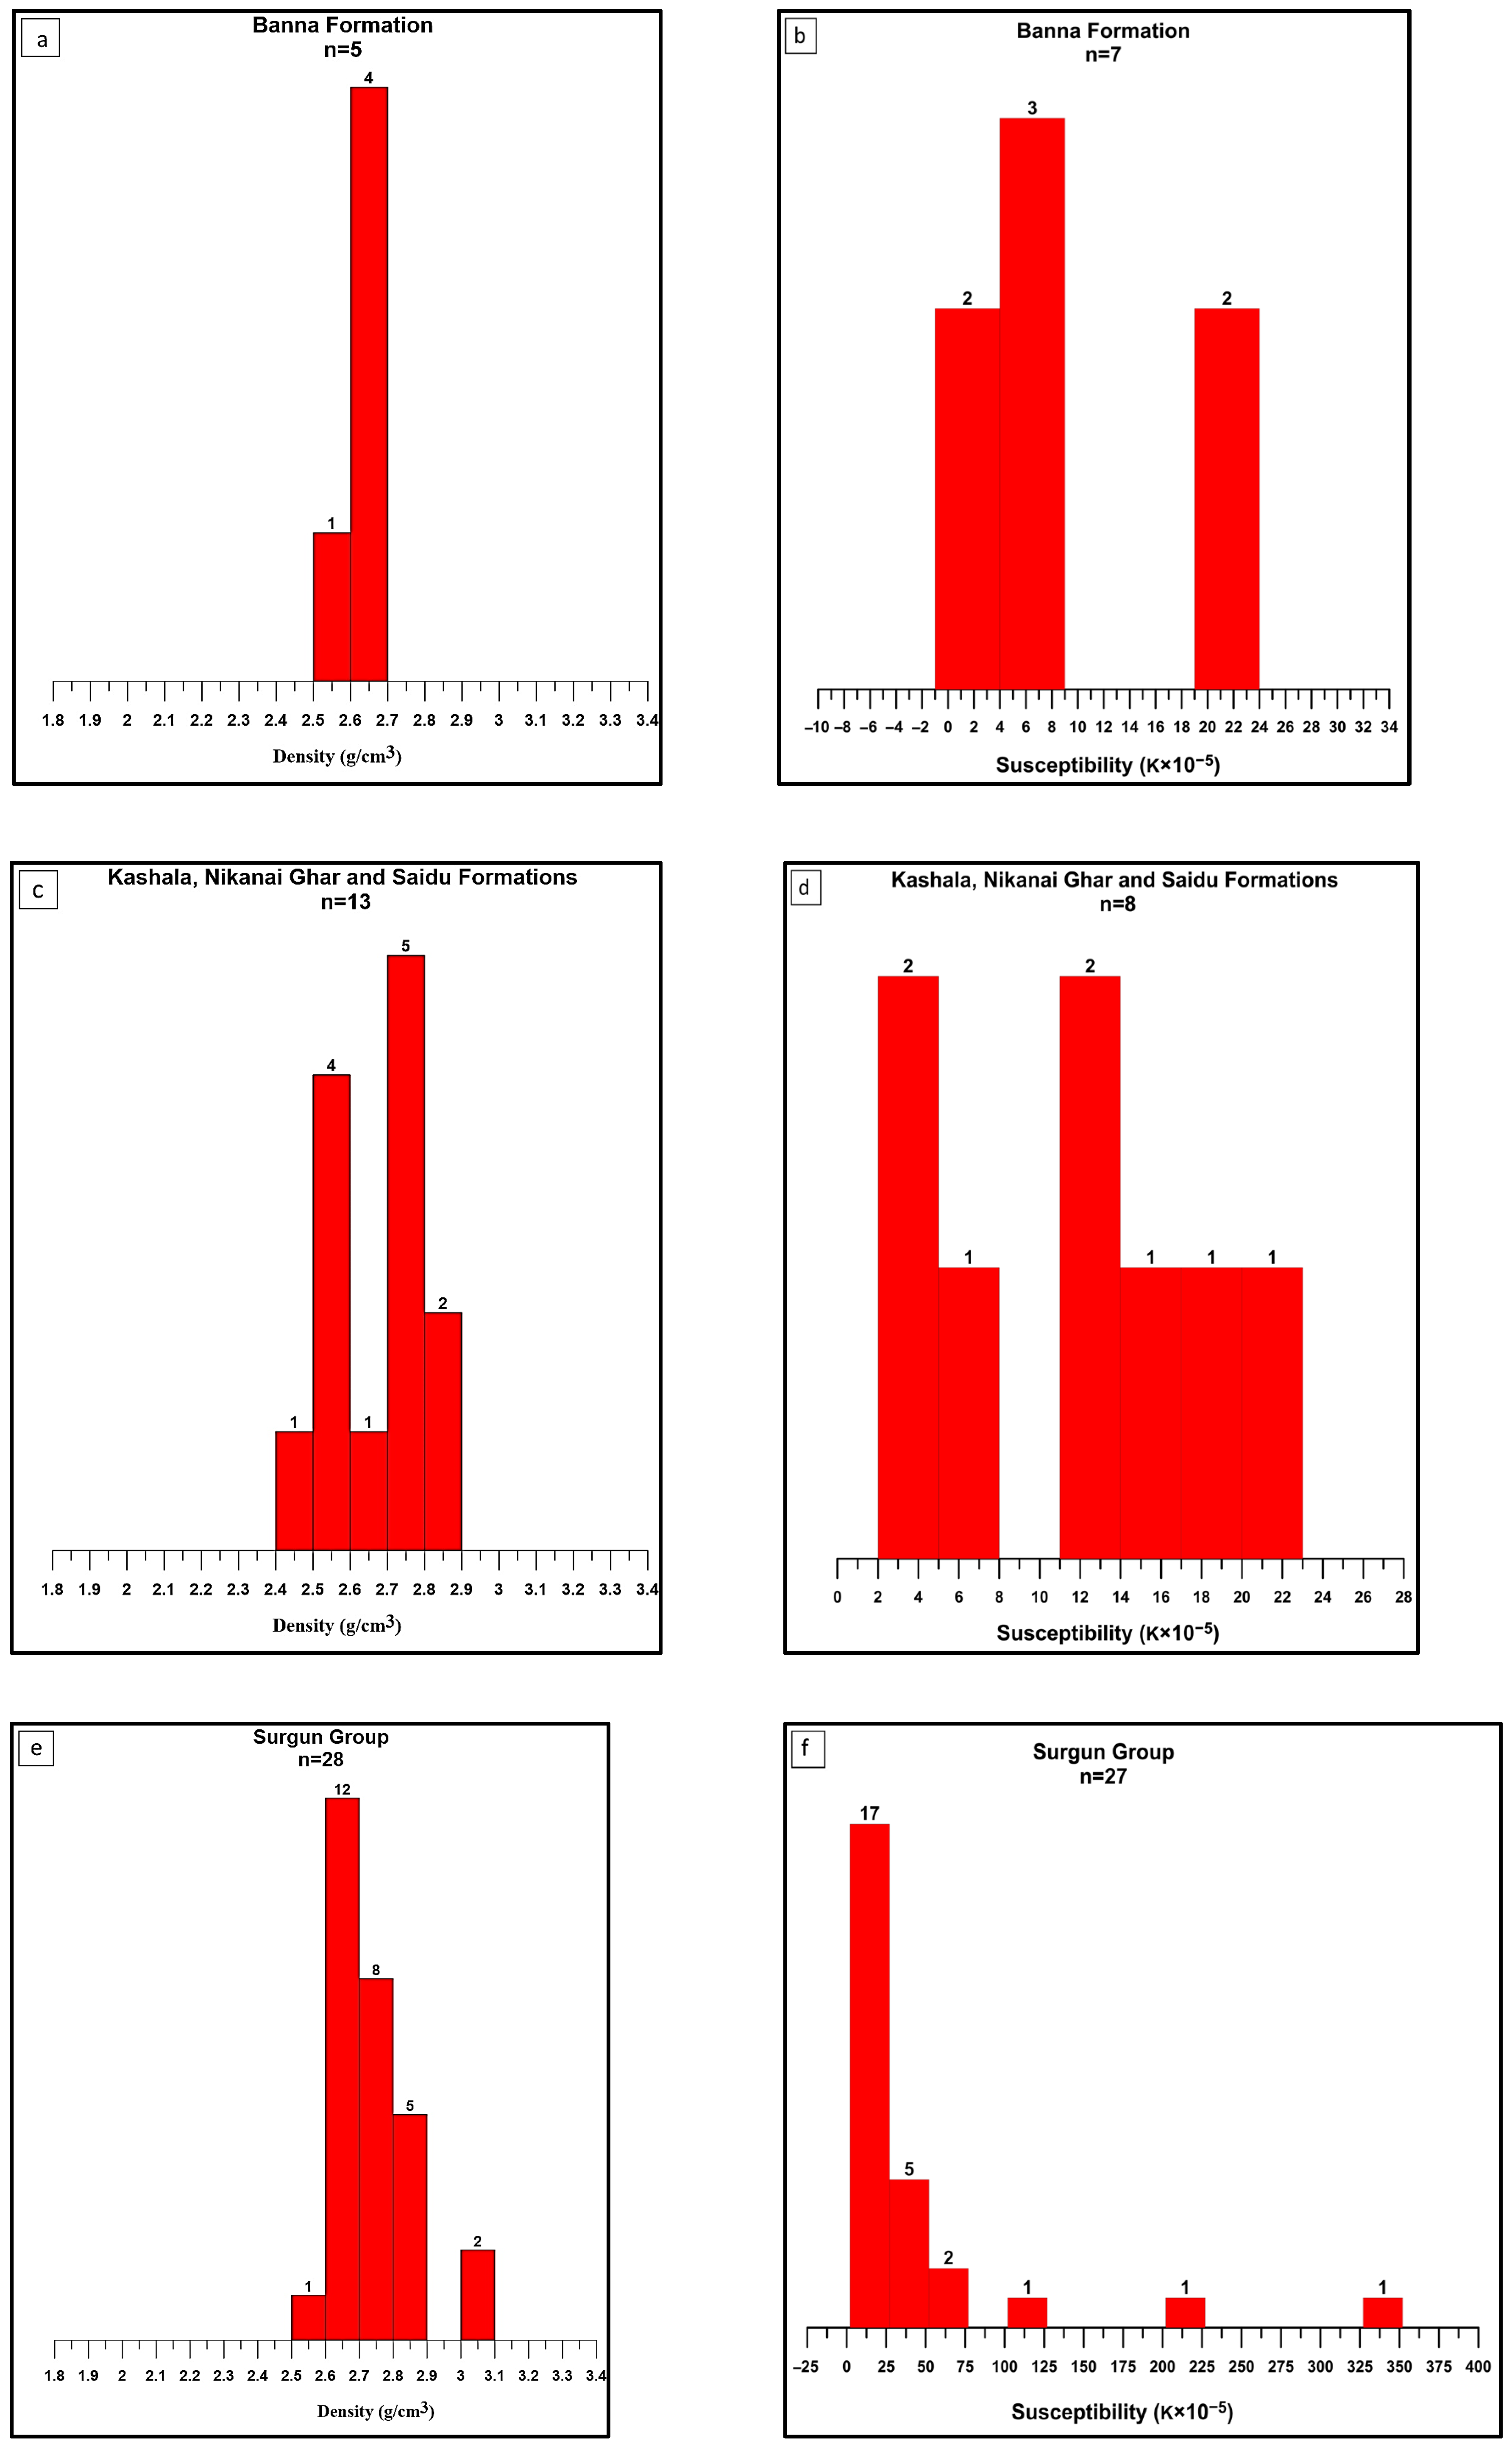
| Banna Formation | 05 | 2.555–2.636 | 2.603 | 2.652 | 0.029 |
| Kashala, Nikanai Ghar, and Saidu formations | 13 | 2.494–2.828 | 2.680 | 0.119 | |
| Surgun Group | 28 | 2.588–3.073 | 2.745 | 0.118 | |
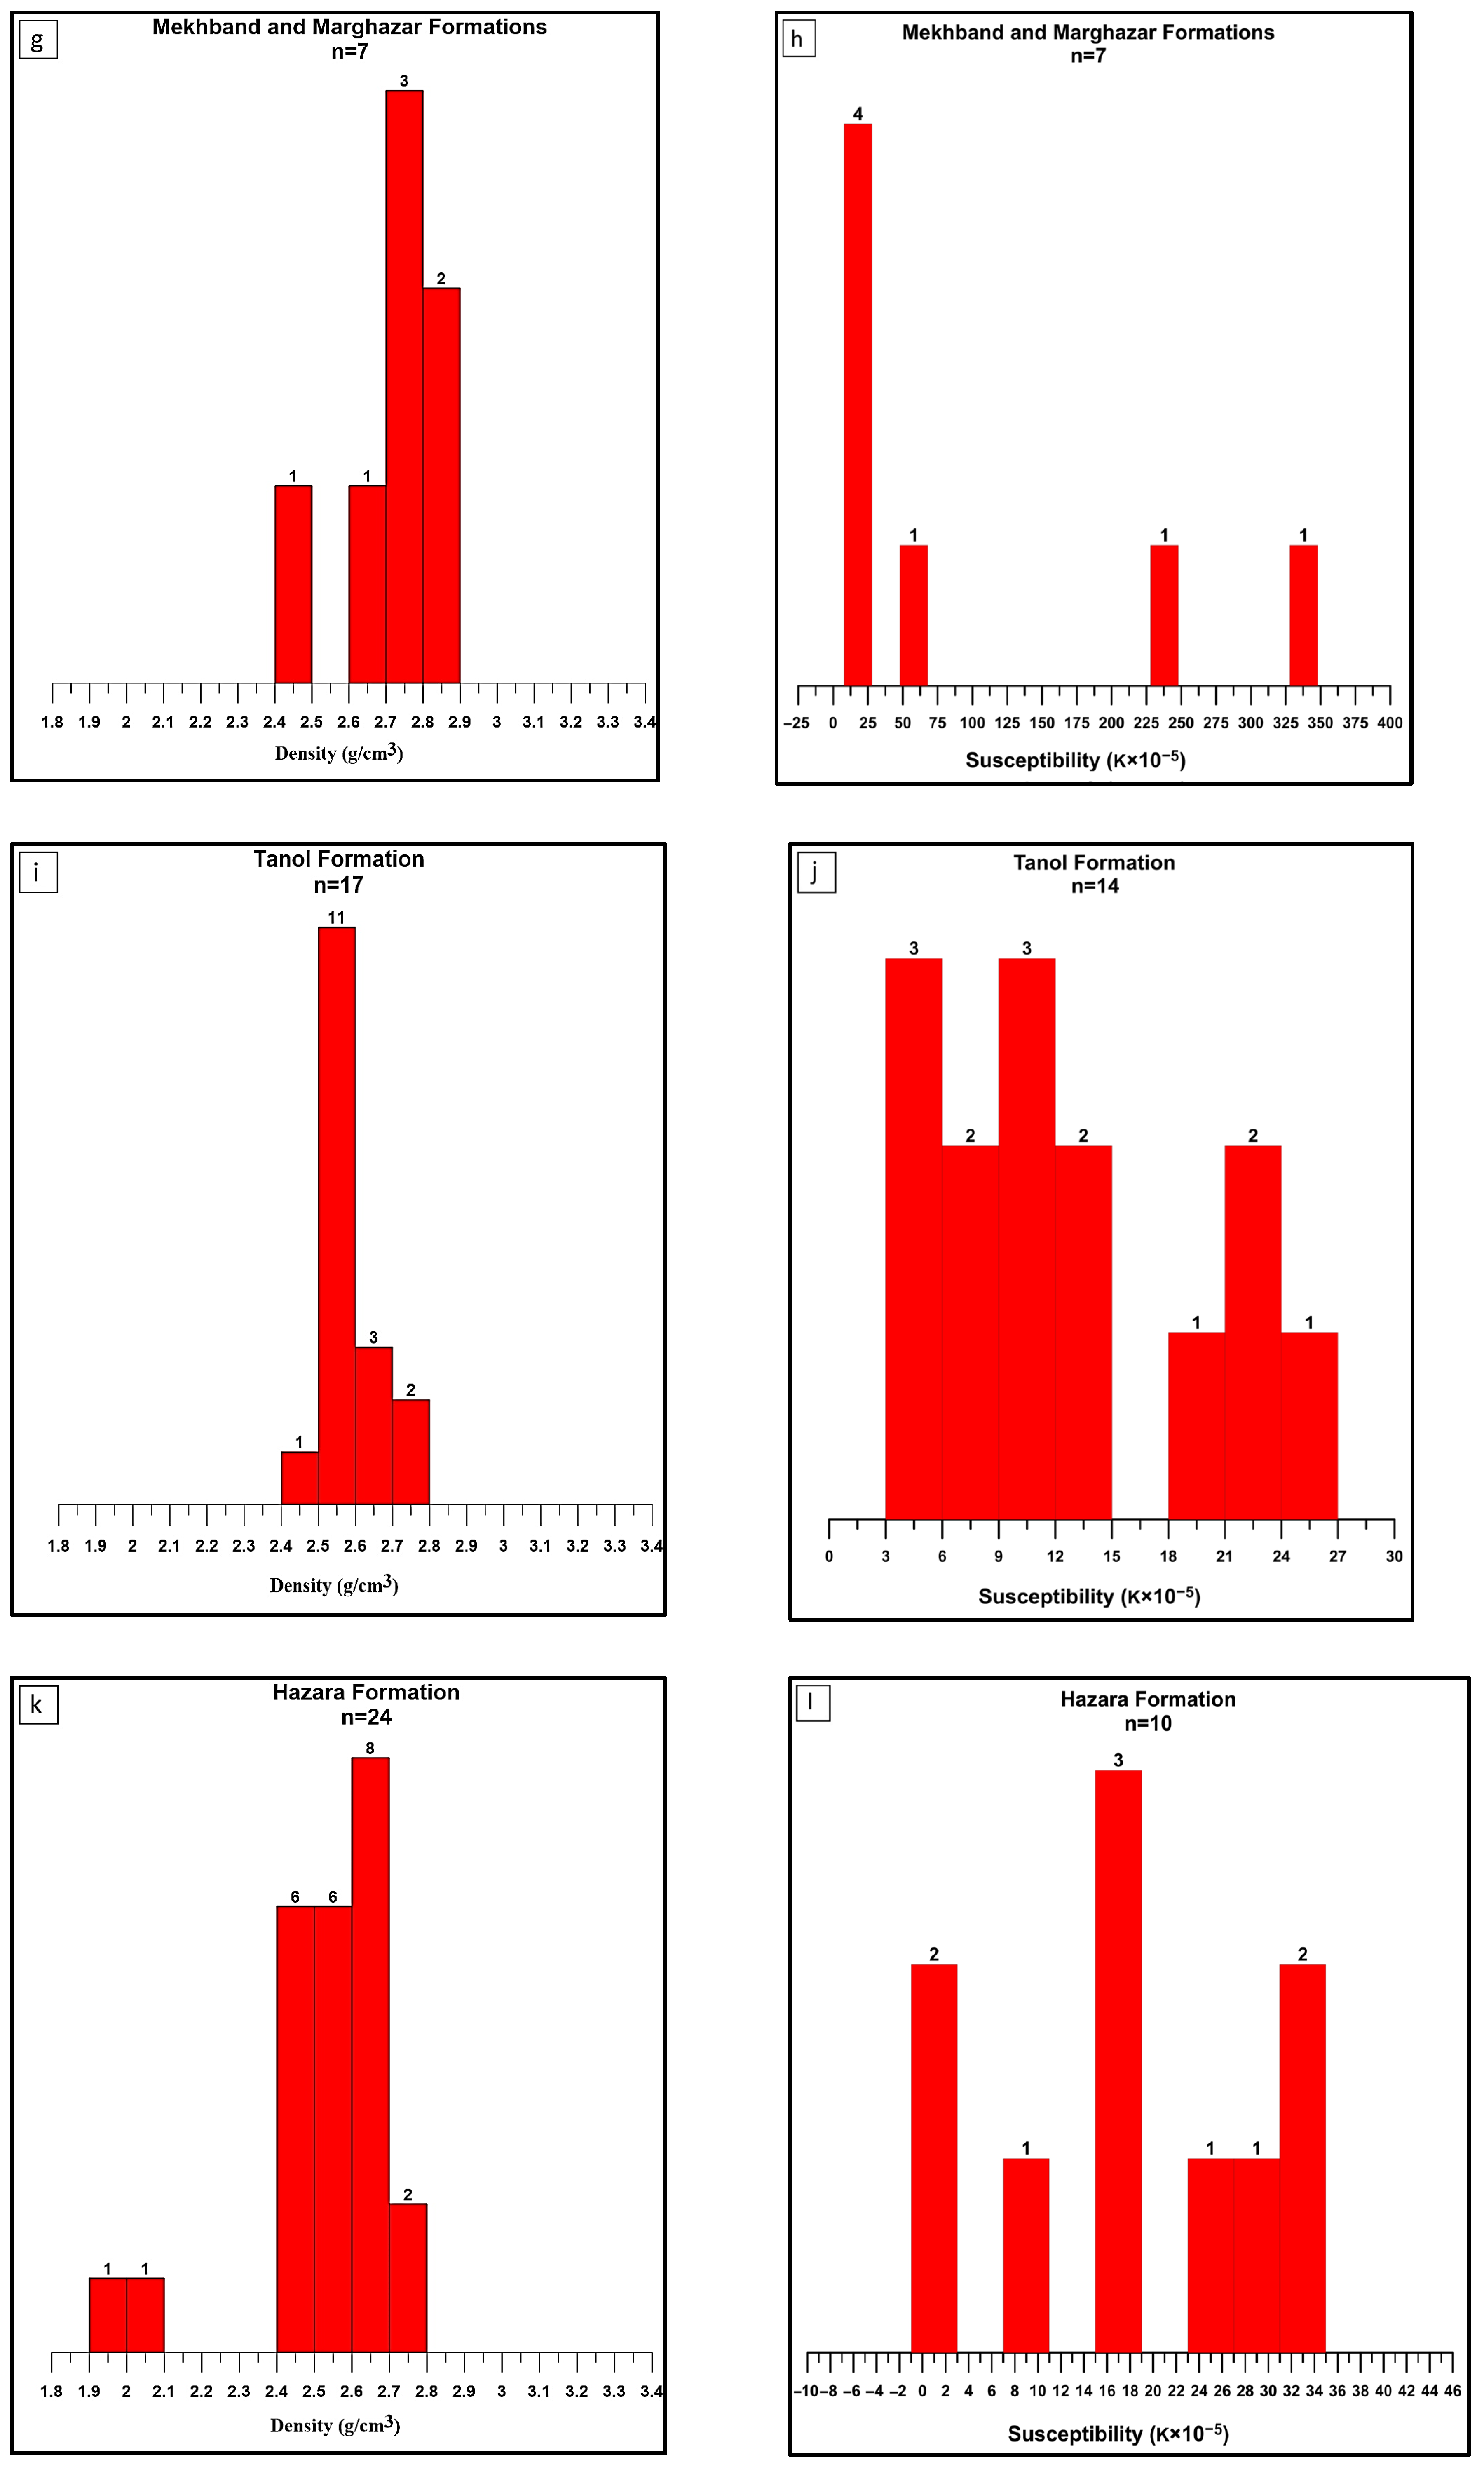
| Mekhband and Marghazar formations | 07 | 2.472–2.851 | 2.735 | 0.135 | |
| Tanol Formation | 17 | 2.485–2.771 | 2.587 | 0.081 | |
| Hazara Formation | 24 | 1.999–2.734 | 2.531 | 0.186 | |
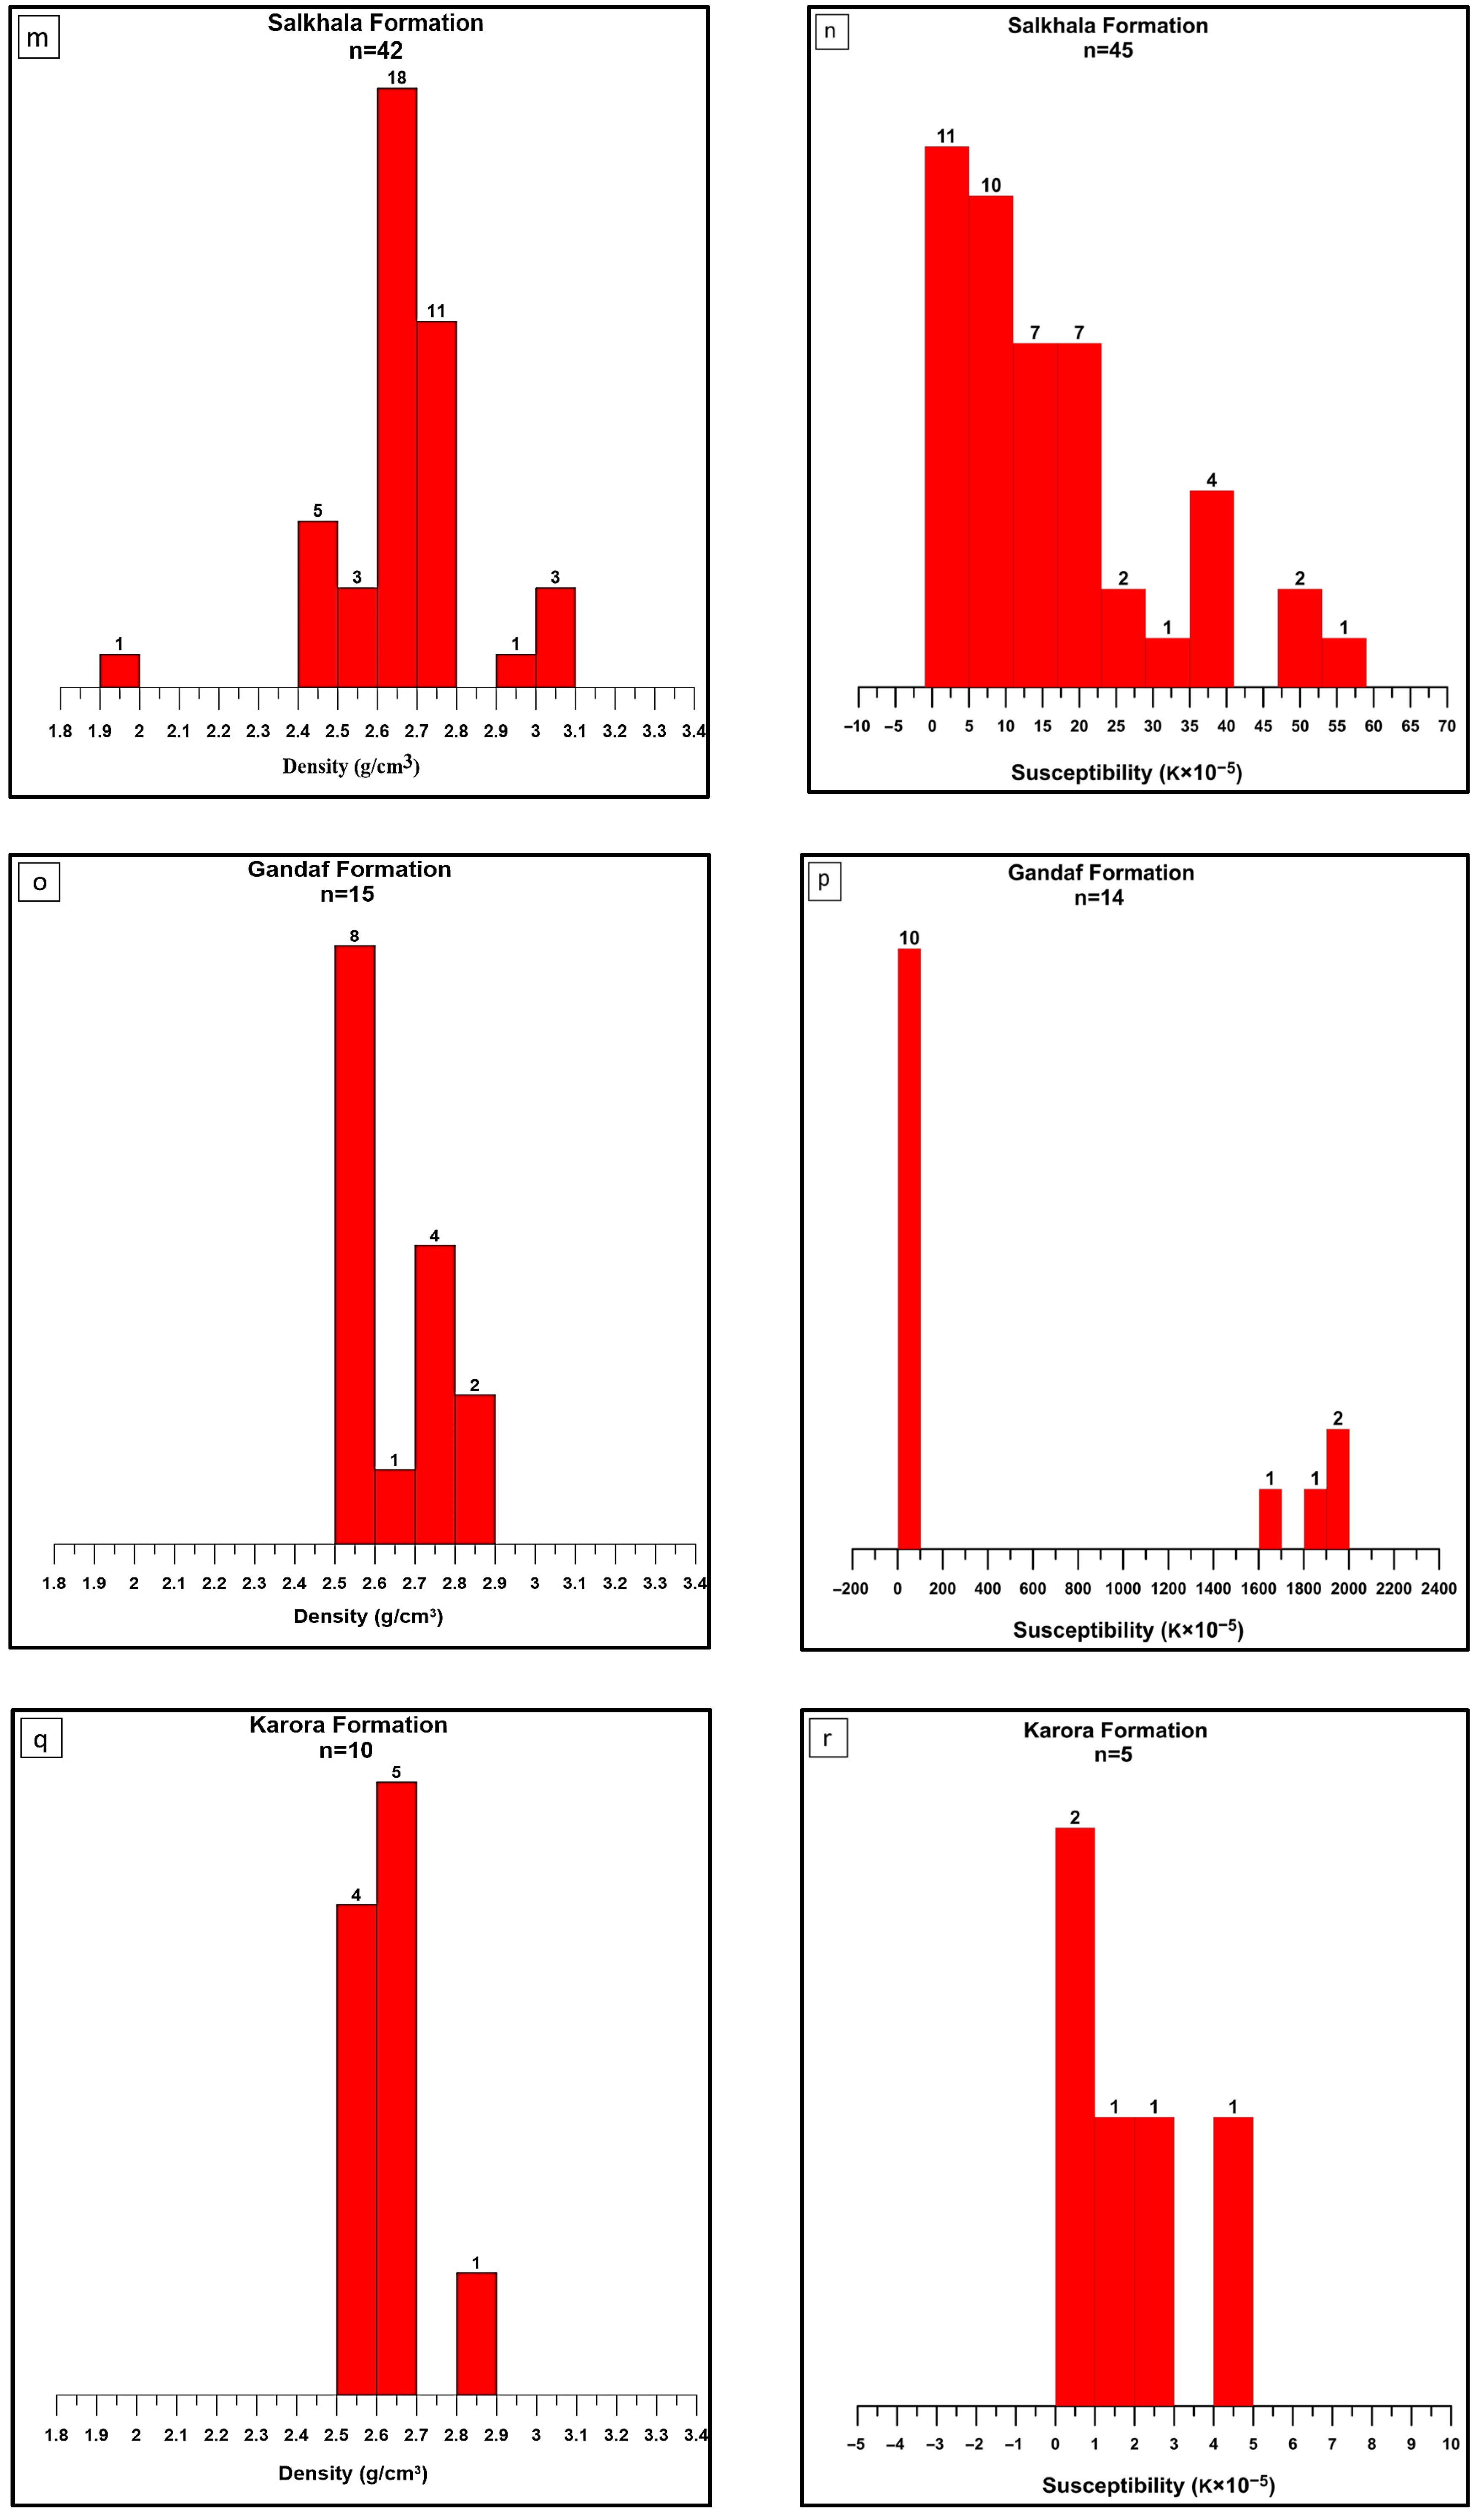
| Salkhala Formation | 42 | 1.971–3.059 | 2.659 | 0.178 | |
| Gandaf Formation | 15 | 2.502–2.894 | 2.653 | 0.129 | |
| Karora Formation | 10 | 2.531–2.821 | 2.627 | 0.086 | |
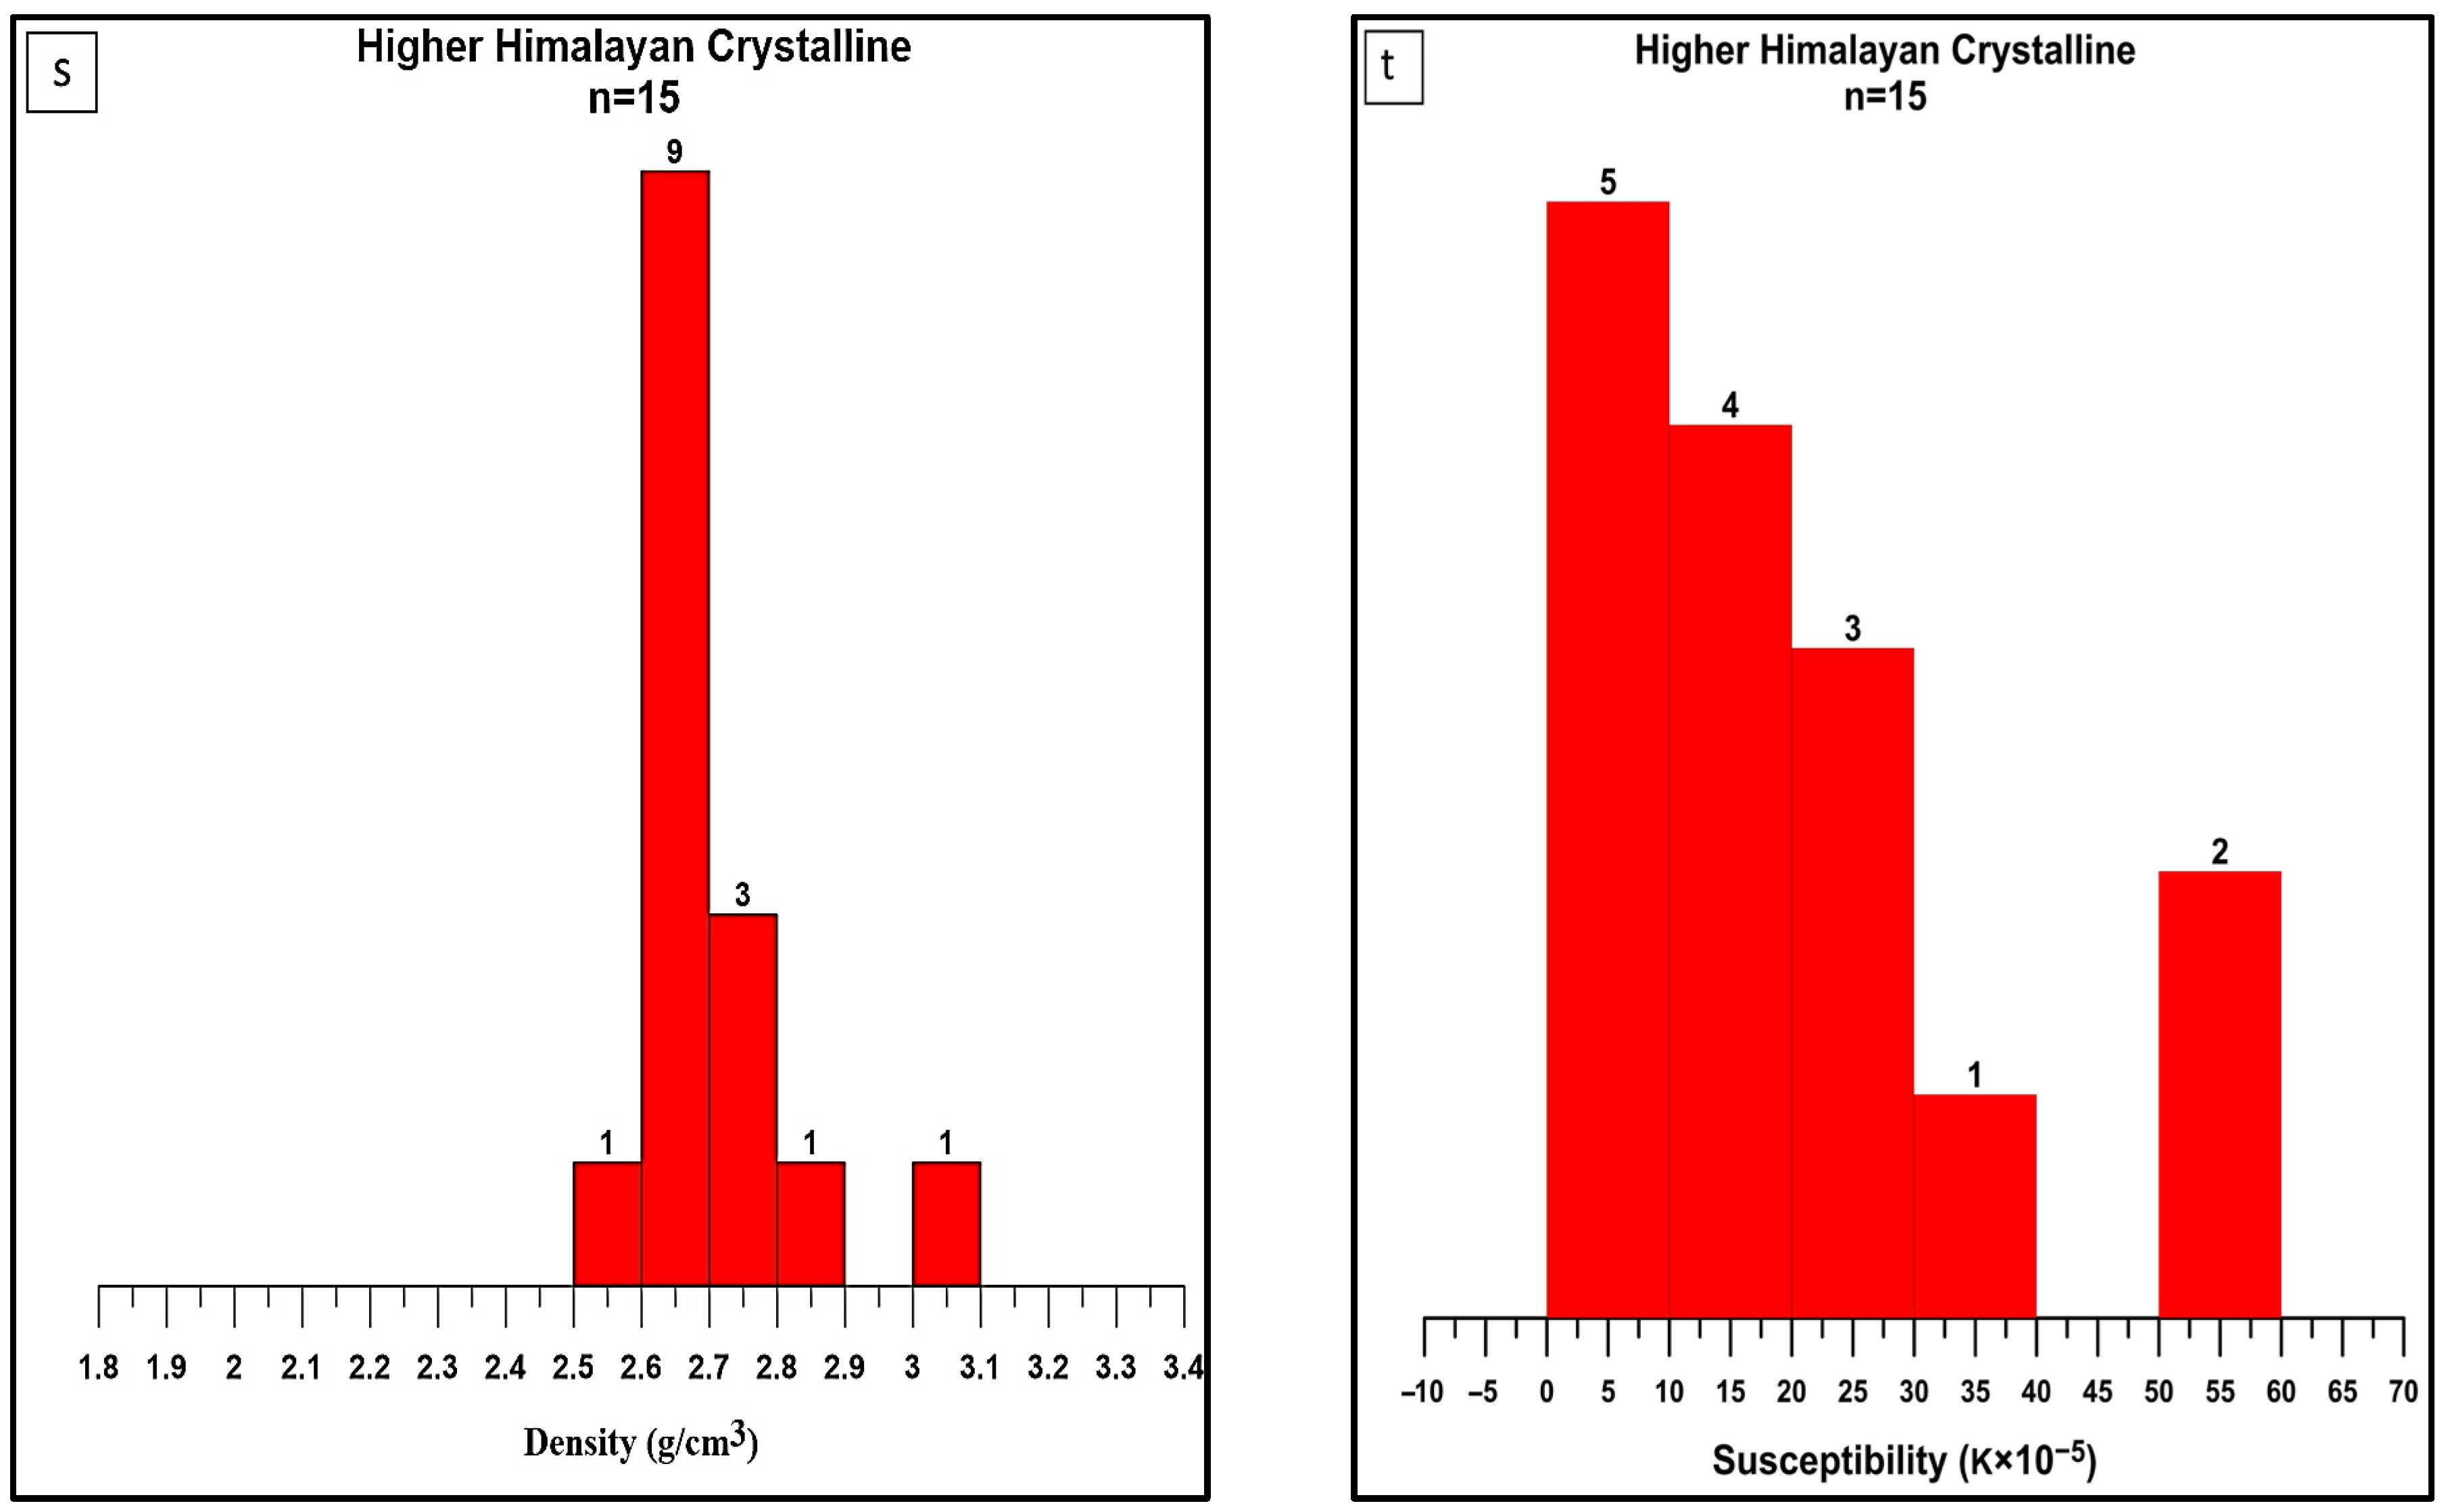
| Higher Himalayan Crystalline | 15 | 2.600–3.010 | 2.700 | 0.101 | |
| Indus Suture Melange Zone | |||||
| Indus Suture Melange Zone | 19 | 2.107–3.072 | 2.700 | 0.220 | |
| KIA rocks | |||||
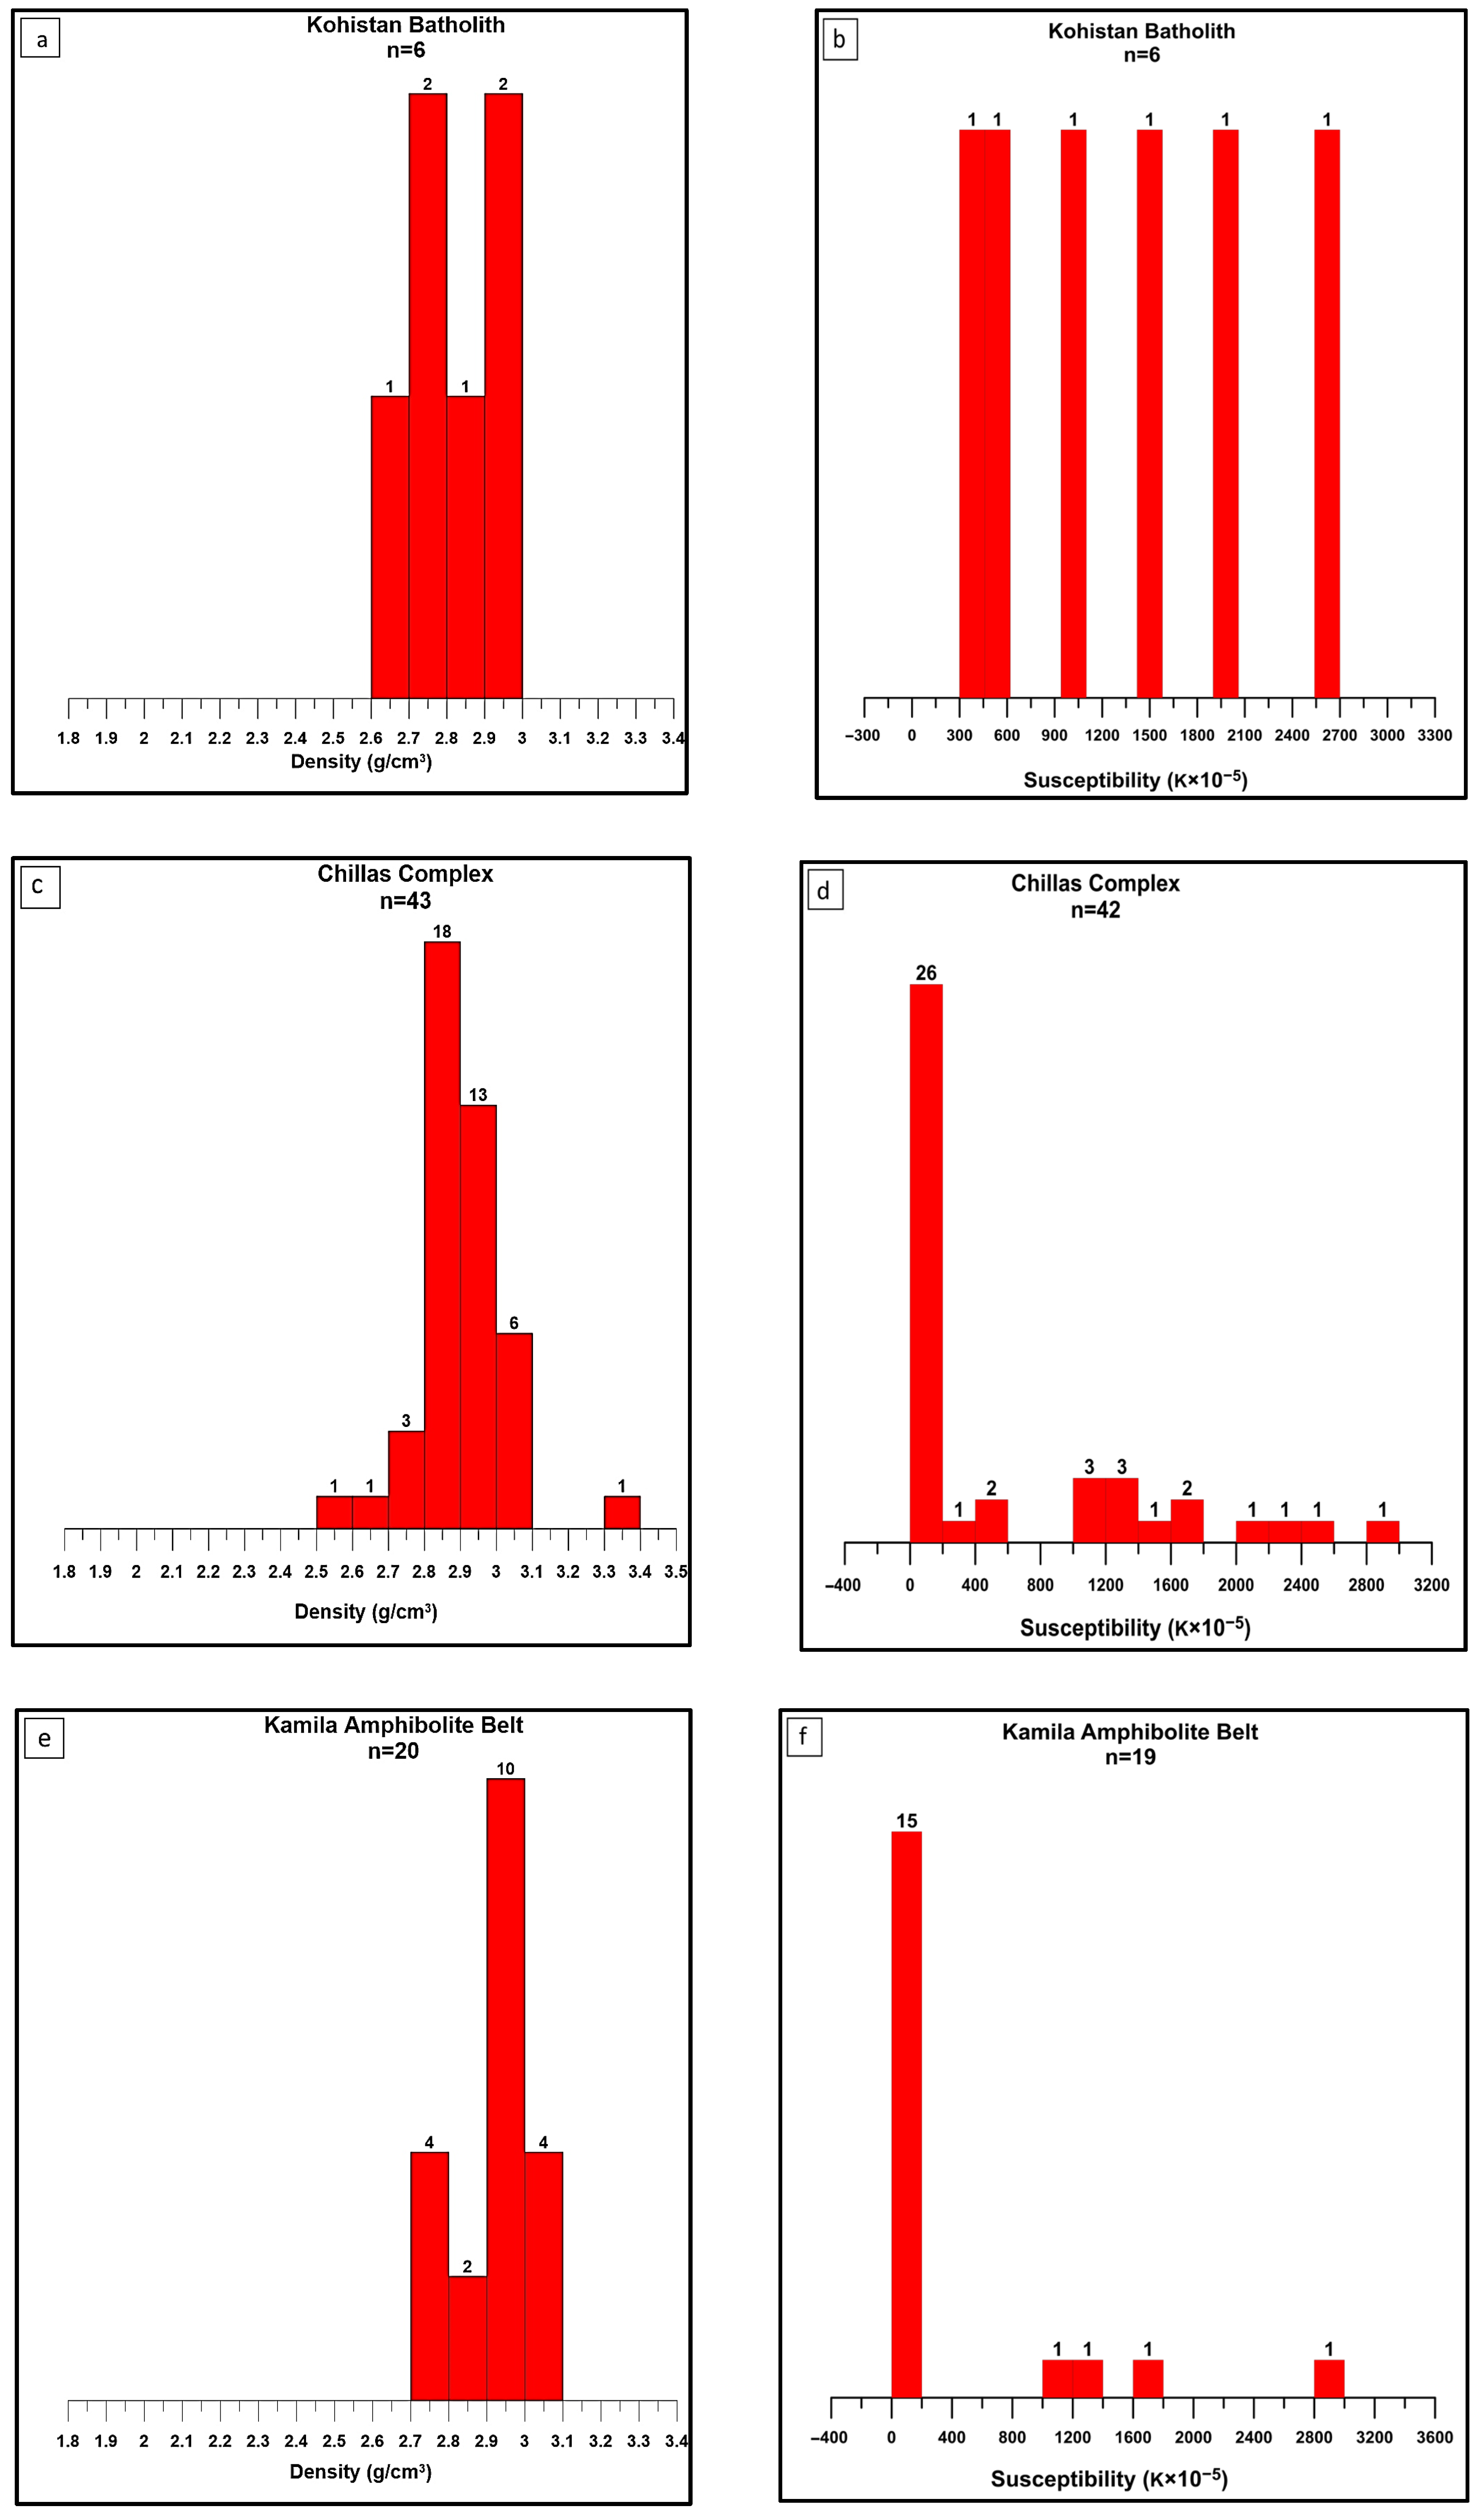
| Kohistan Batholith | 06 | 2.691–2.967 | 2.842 | 2.946 | 0.112 |
| Chillas Complex | 43 | 2.515–3.382 | 2.904 | 0.127 | |
| Kamila Amphibolite Belt | 20 | 2.756–3.098 | 2.930 | 0.103 | |
| Jijal/Sapat Complex | 18 | 2.953–3.256 | 3.100 | 0.099 | |
| Igneous and metaigneous rocks of the Indian Plate | |||||
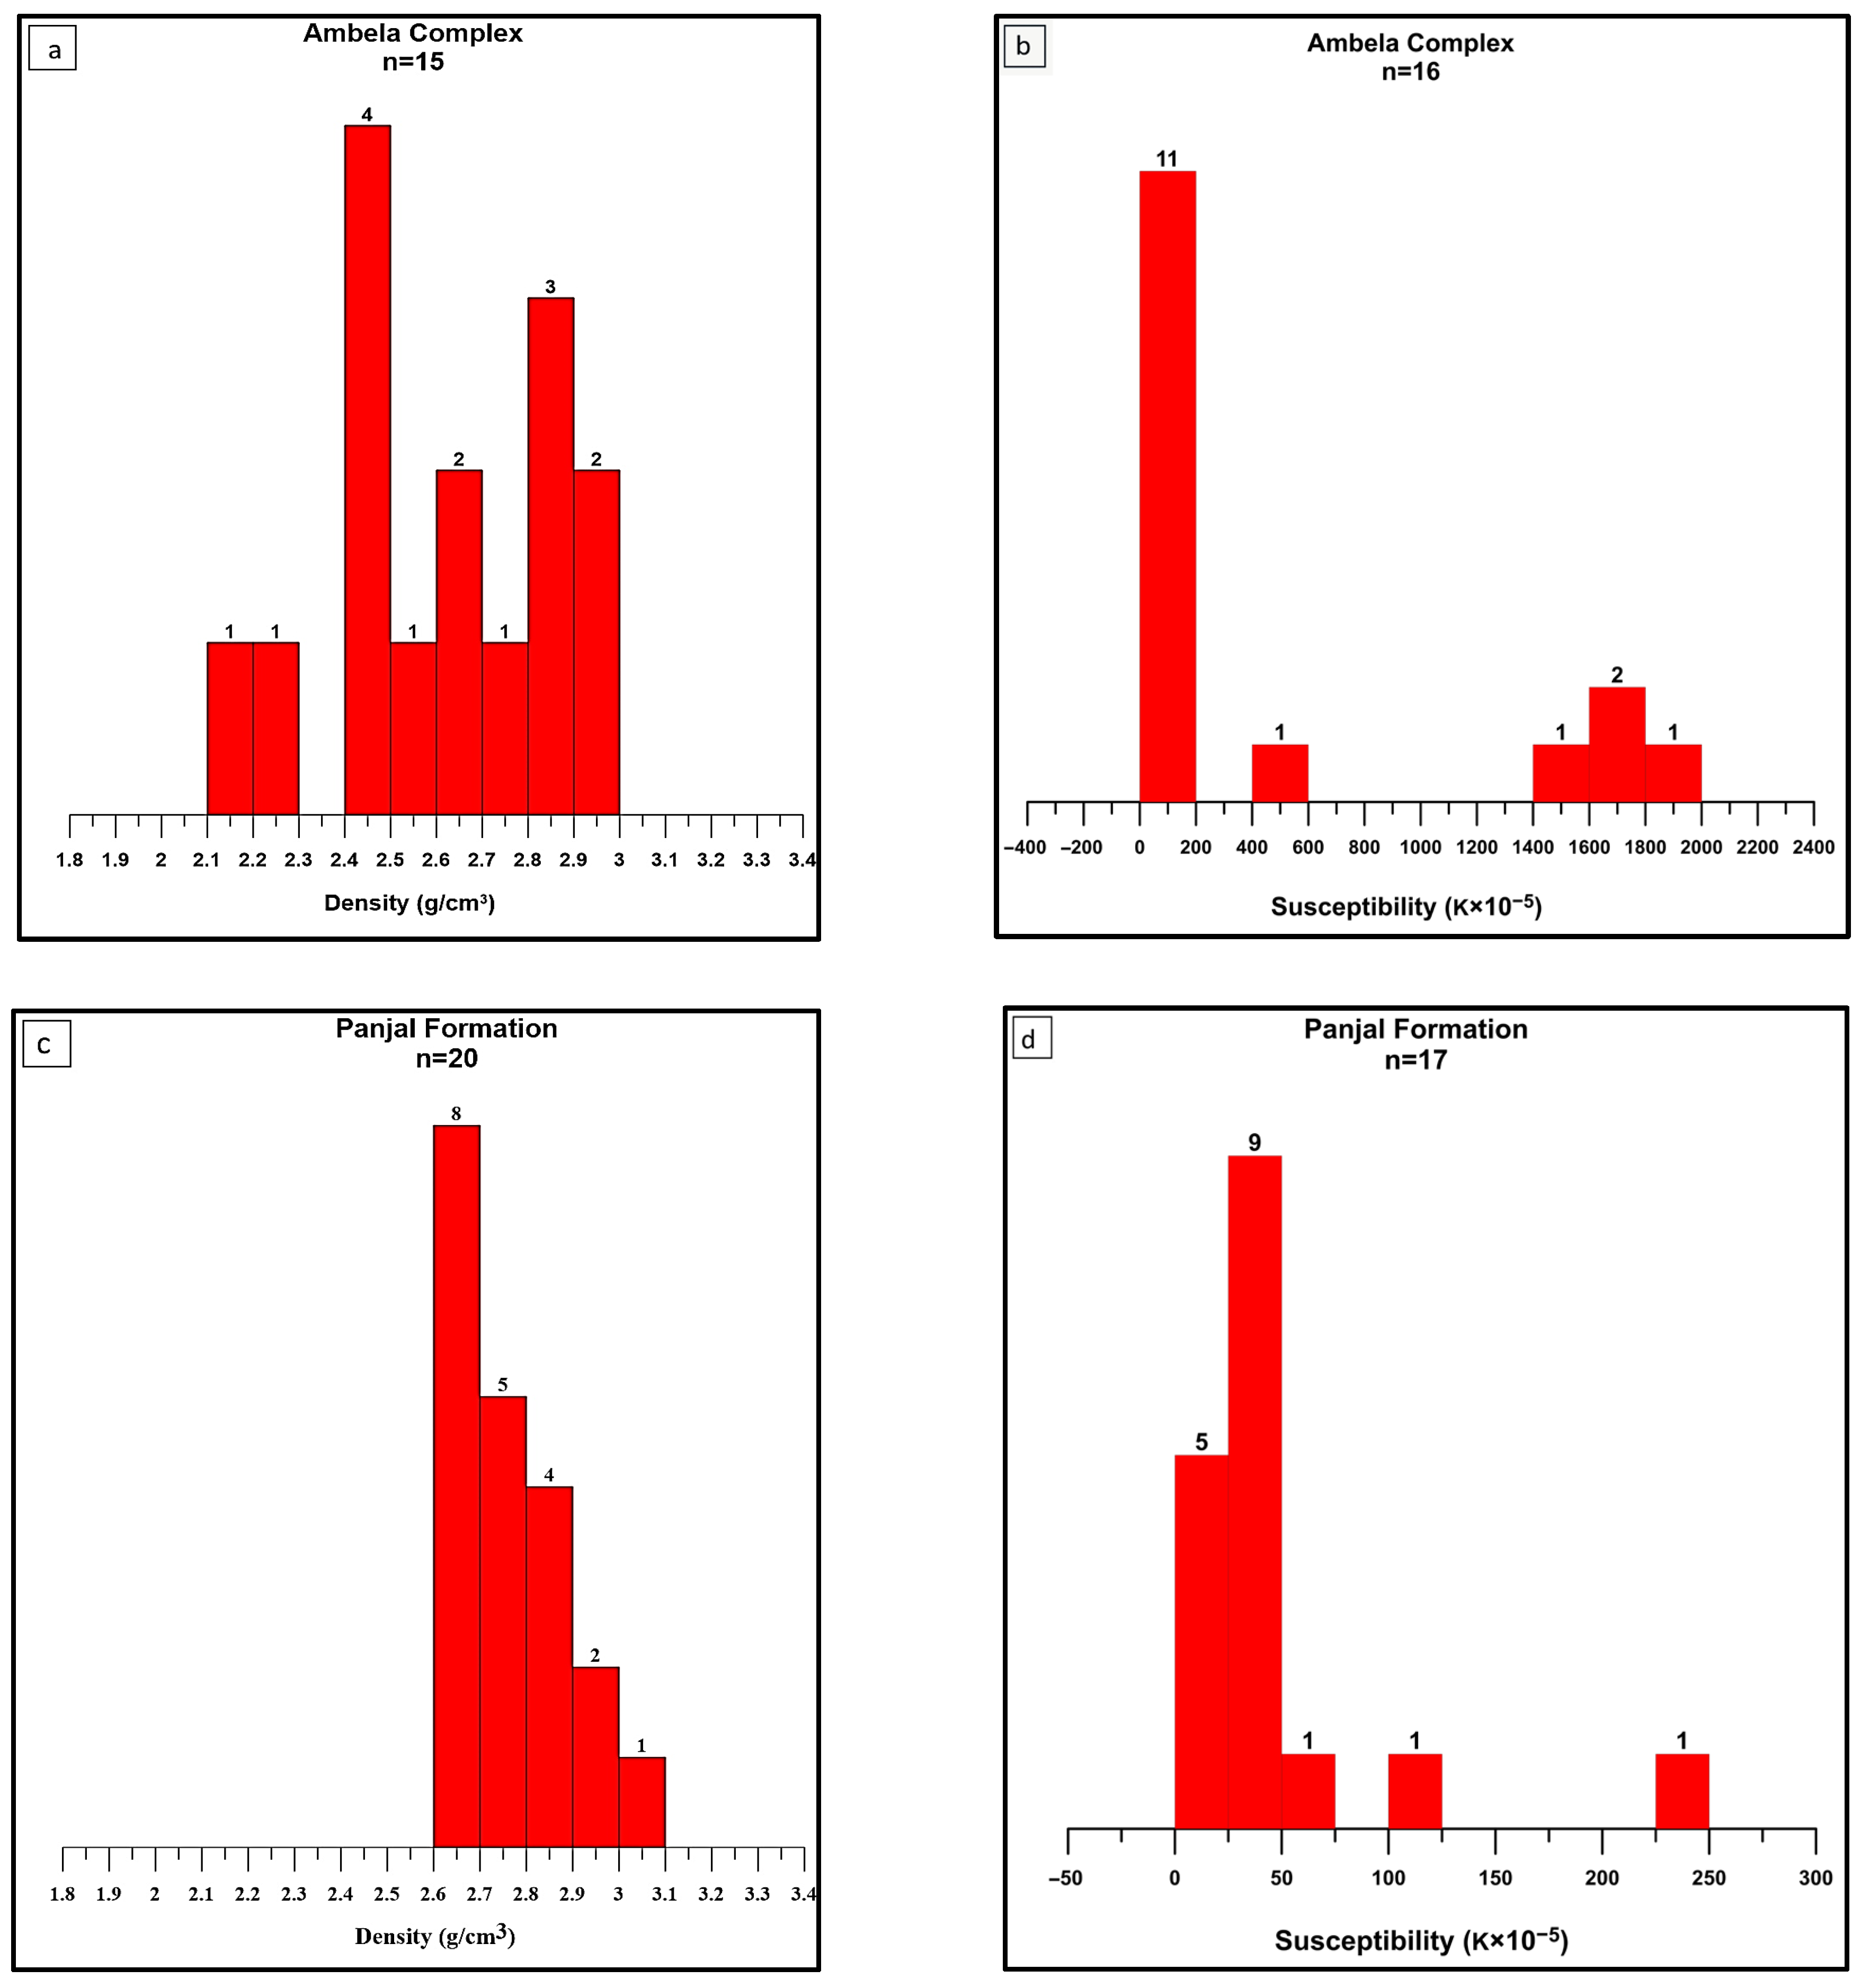
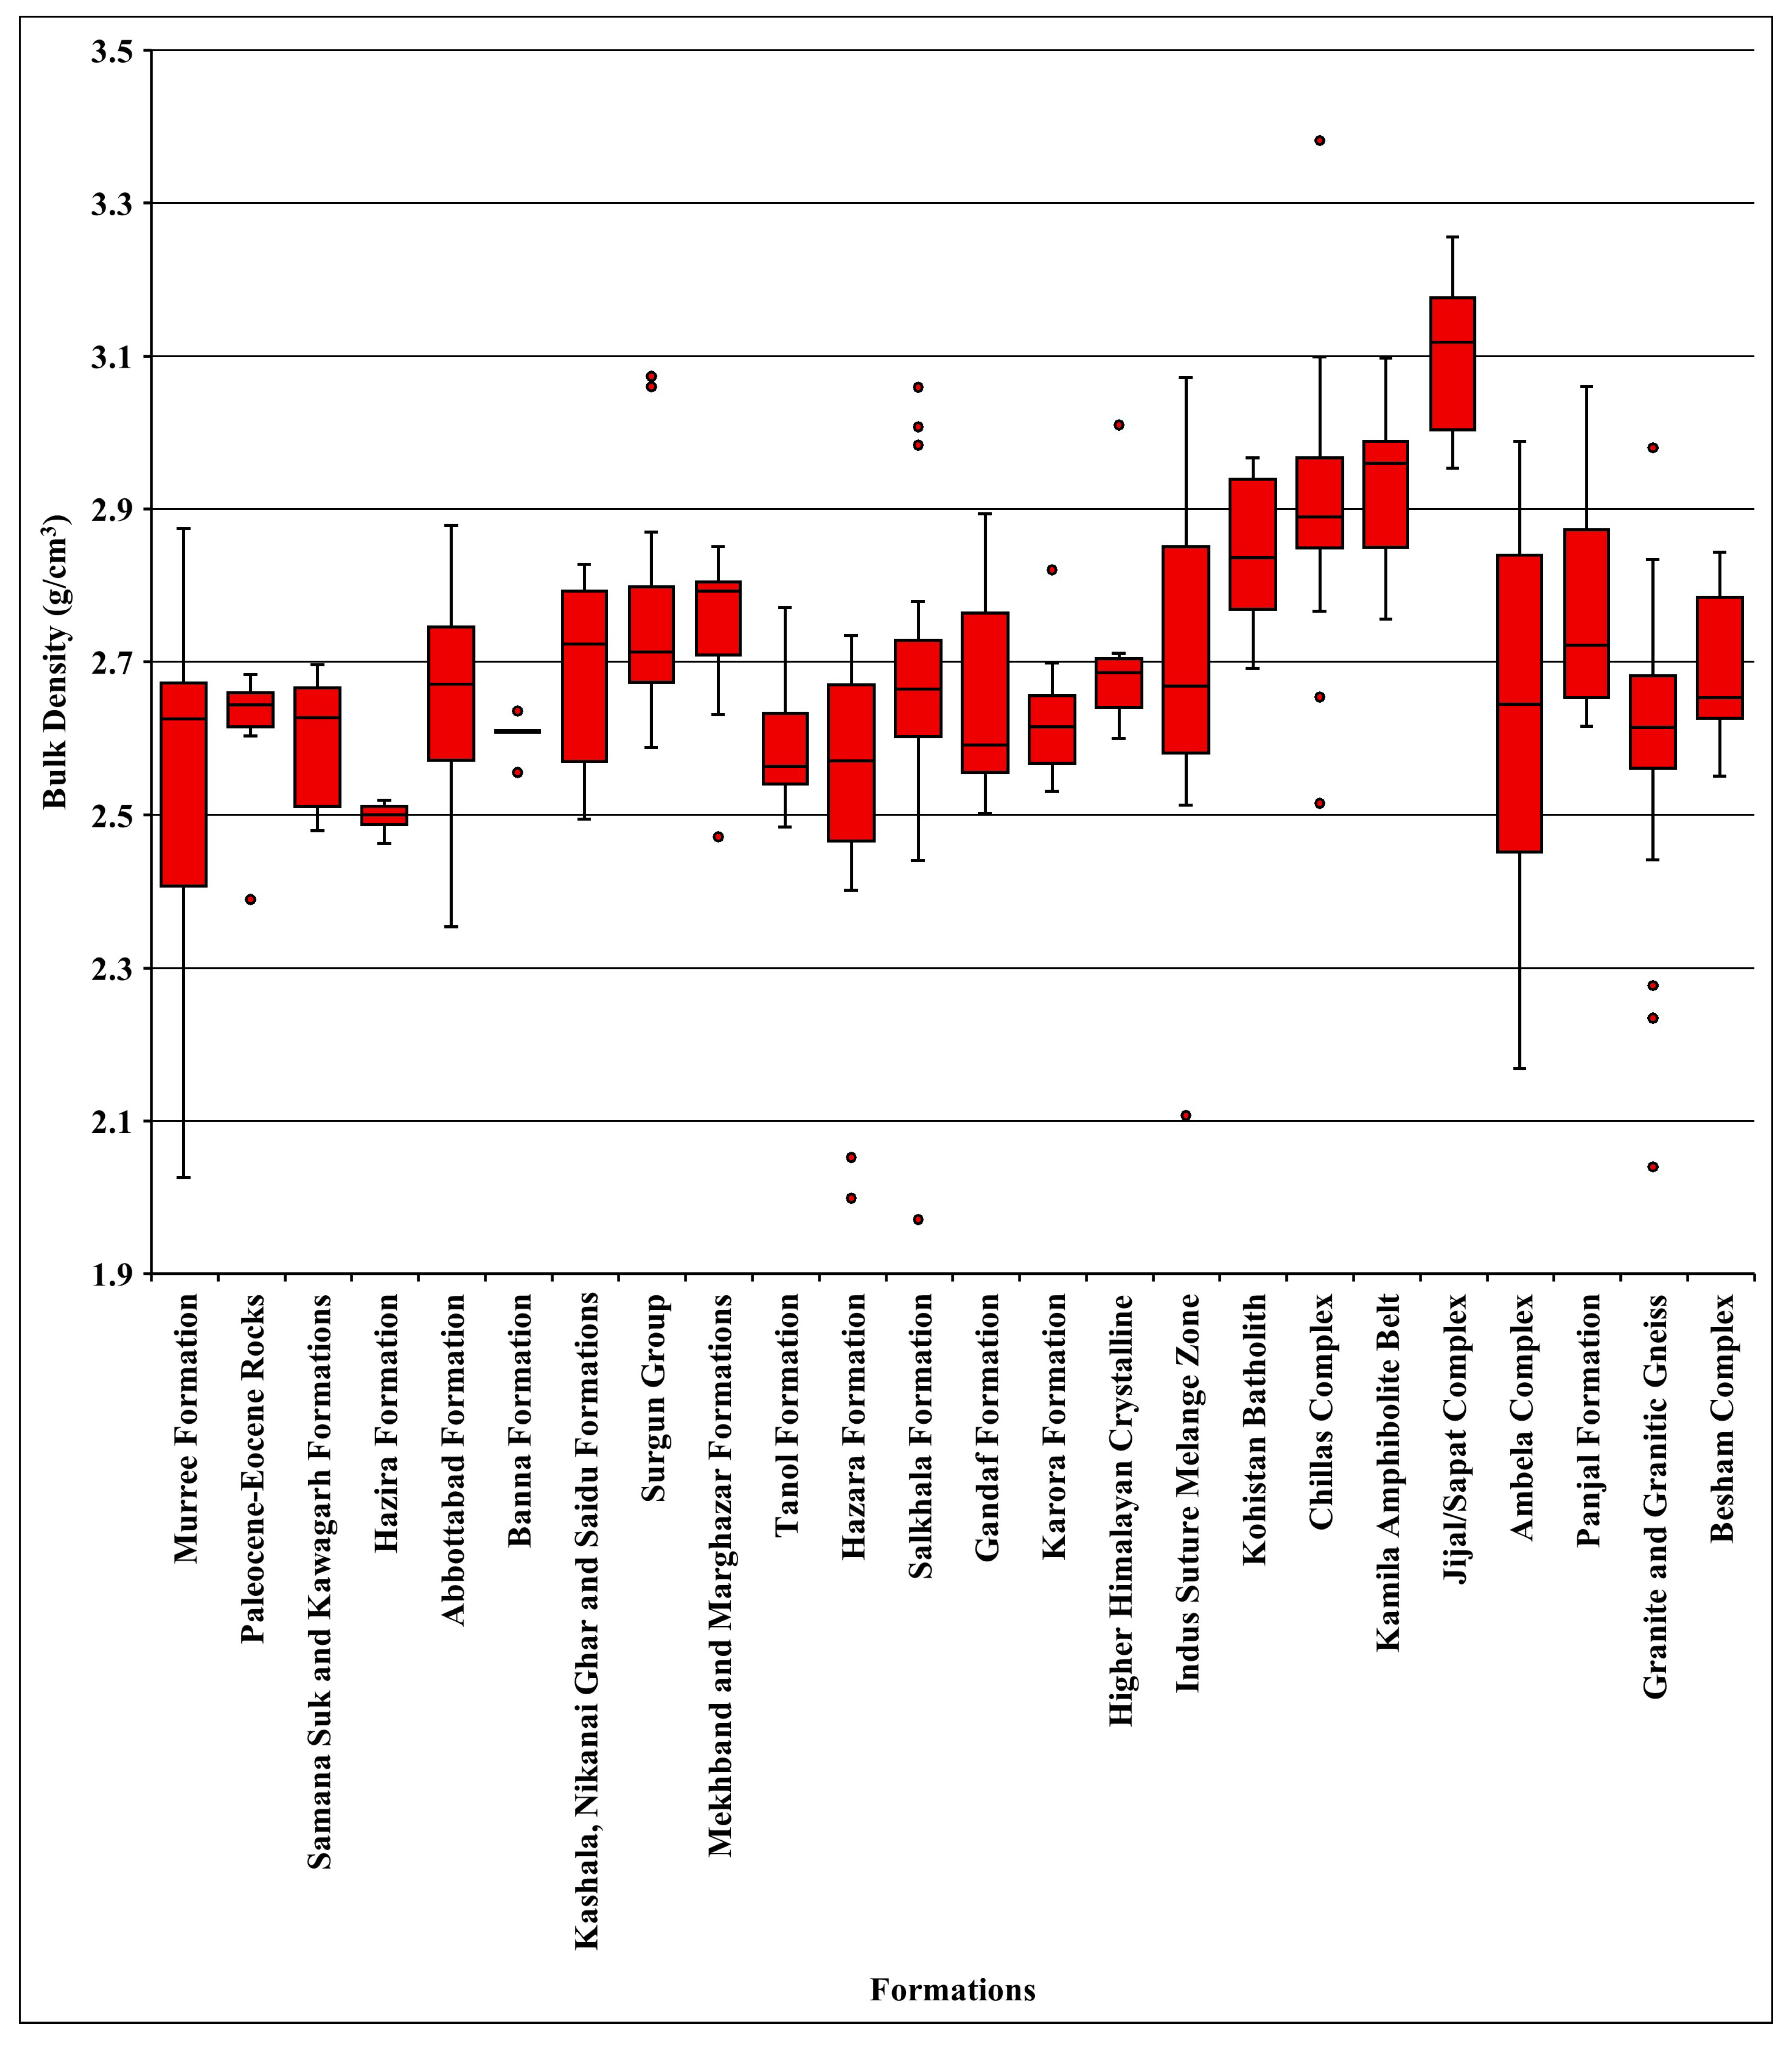
| Ambela Complex | 15 | 2.168–2.988 | 2.619 | 2.653 | 0.242 |
| Panjal Formation (volcanic and metasediments) | 20 | 2.615–3.060 | 2.761 | 0.132 | |
| Granite/Granite Gneiss (Neelum, Manshera and Swat) | 51 | 2.040–2.980 | 2.608 | 0.142 | |
| Besham Complex | 17 | 2.550–2.843 | 2.694 | 0.101 | |
| Undivided Early Proterozoic Rocks of the Indian Plate in Besham and surrounding areas | |||||
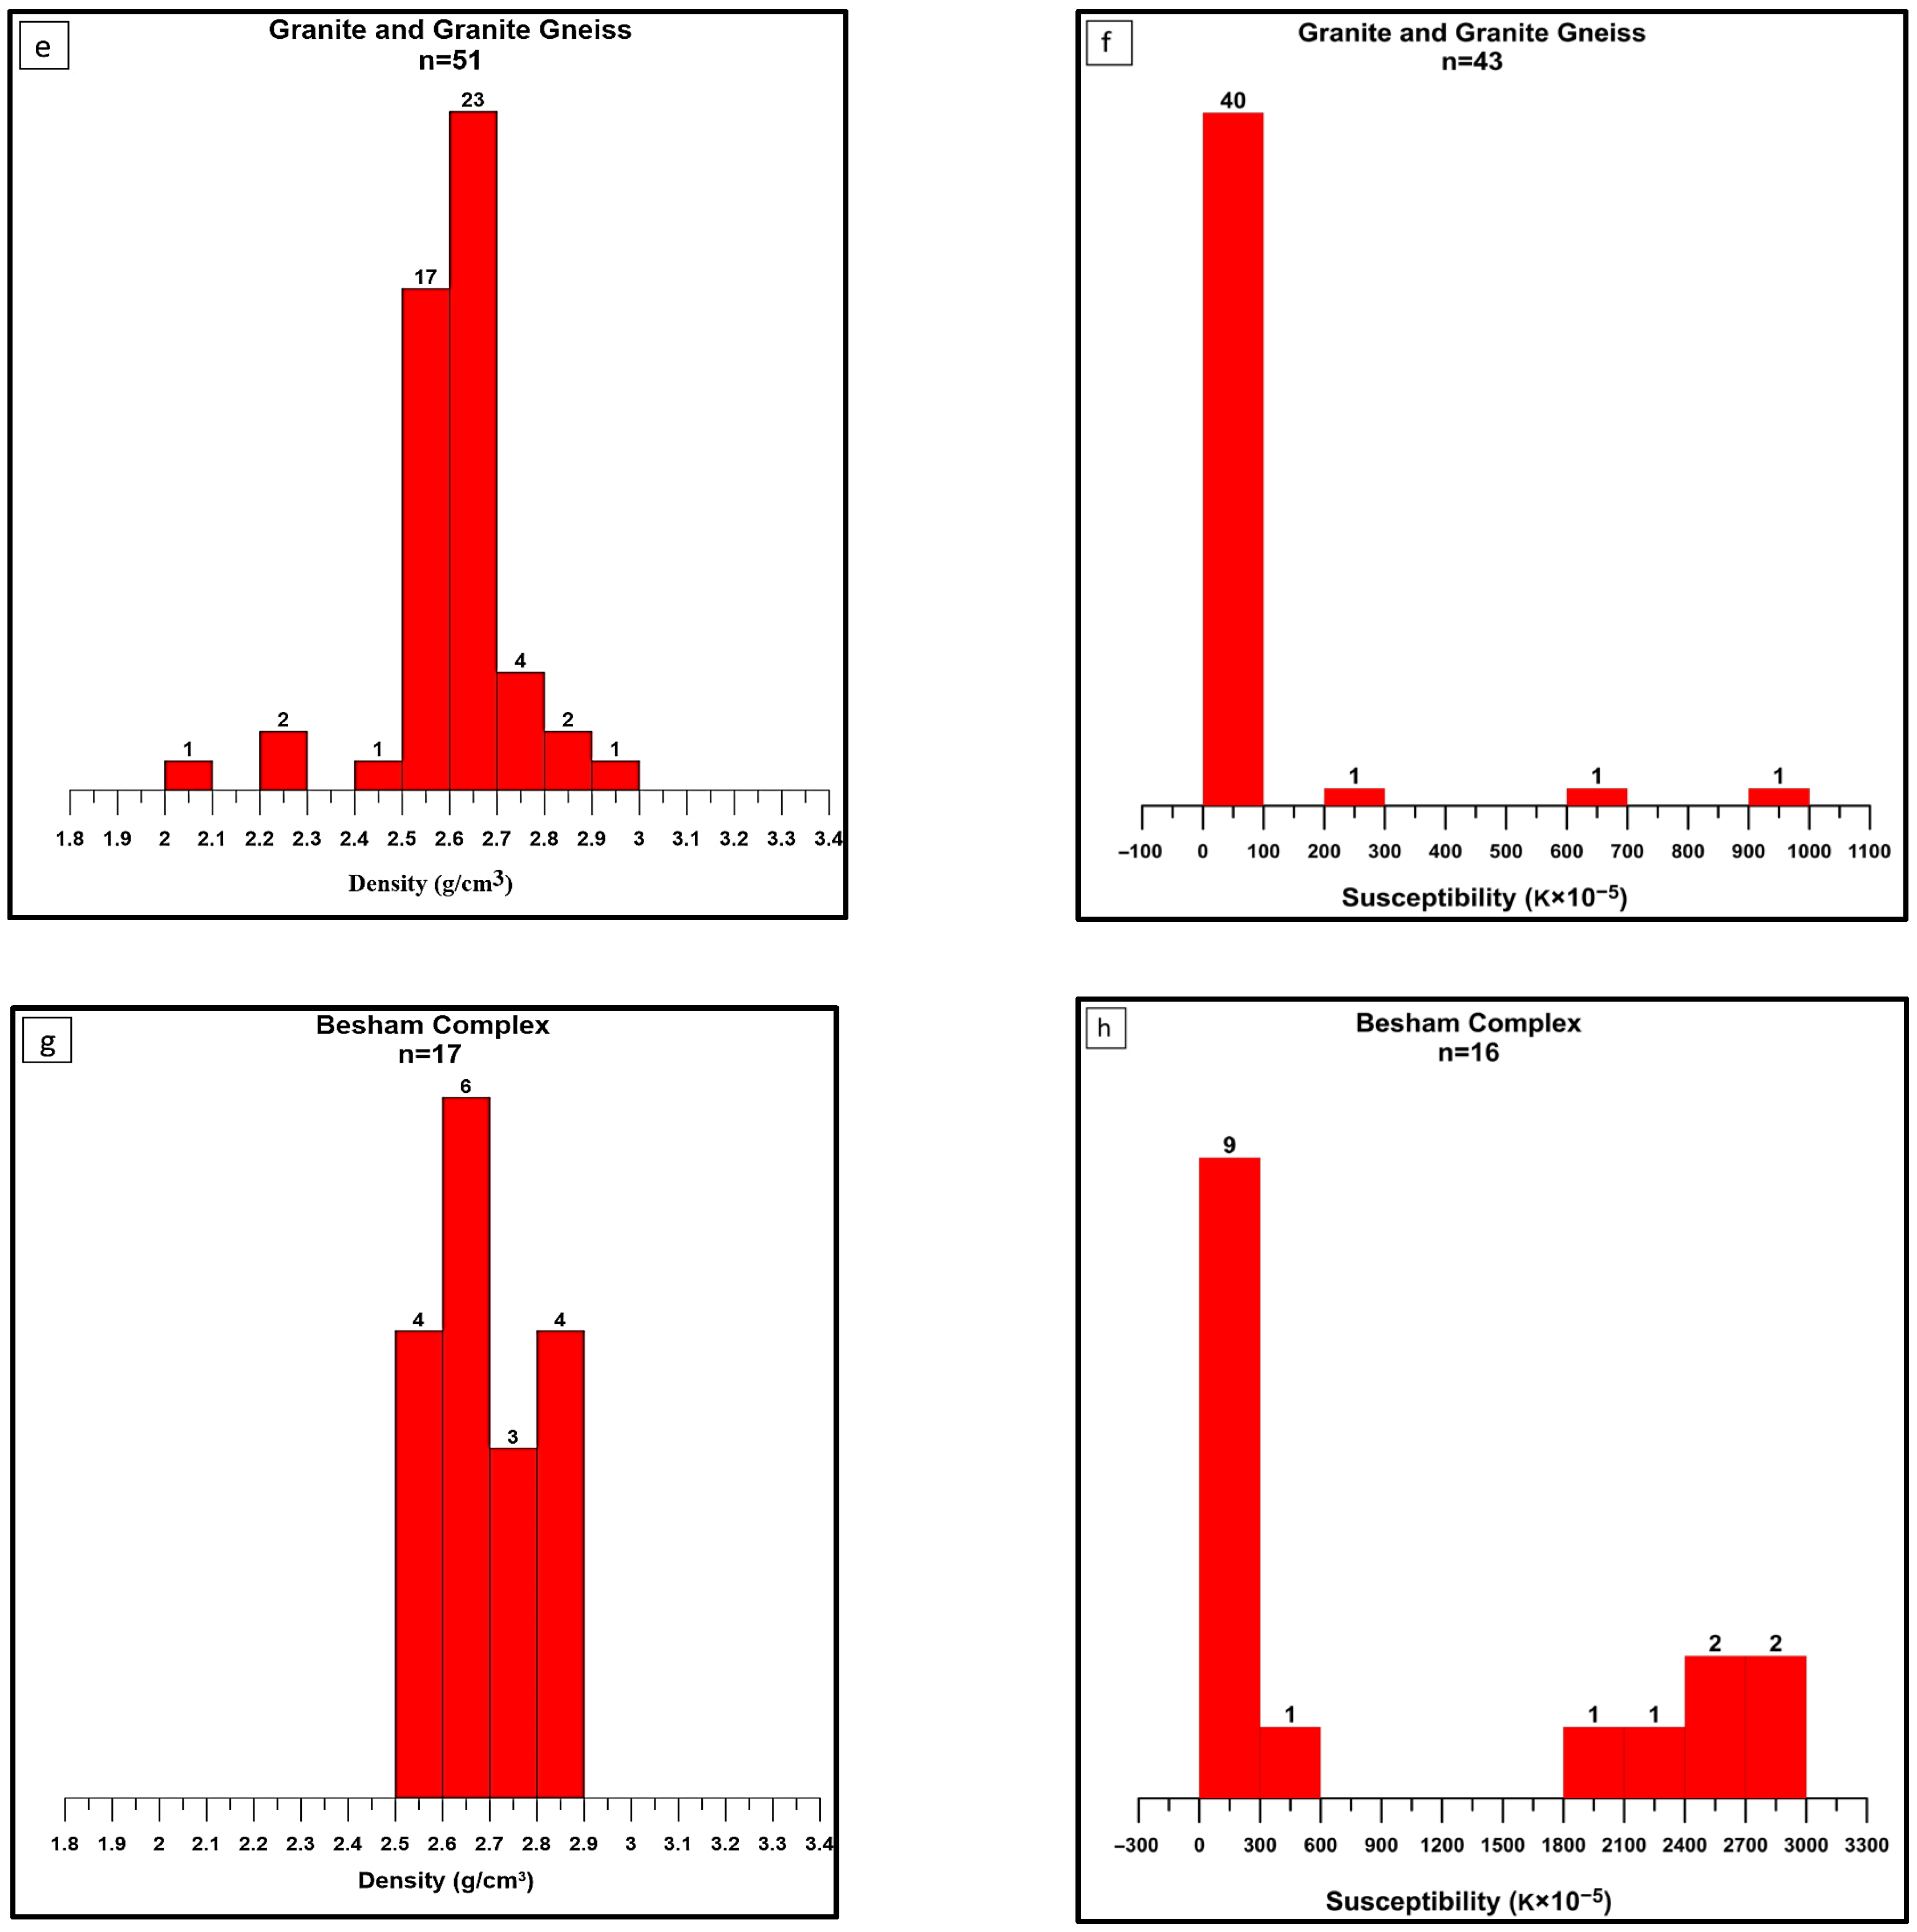
| Undivided Early Proterozoic rocks including Besham and Kotla complexes, Karora and Gandaf formations | 45 | 2.502–2.894 | 2.658 | 0.109 | |
| Formation | No. of Samples (n) | Minimum and Maximum Susceptibility (k × 10−5 SI) | Arithmetic Mean (k × 10−5 SI) | Standard Deviation (SD) | |
|---|---|---|---|---|---|
| Sedimentary rocks of the Indian Plate | |||||
| Murree Formation | 22 | 3.087–14.417 | 9.081 | 6.438 | 3.249 |
| Paleocene and Eocene Rocks (Lockhart Limestone, Margalla Hill Limestone and Kuldana Formation) | 5 | 0.505–25.939 | 8.733 | 10.267 | |
| Samana Suk and Kawagarh formations | 12 | −0.230–20.700 | 6.886 | 6.669 | |
| Hazira Formation | 5 | 0.330–9.298 | 6.546 | 3.598 | |
| Abbottabad Formation | 19 | 0.287–7.273 | 2.463 | 2.044 | |
| Undivided Cambrian to Eocene Sedimentary Rocks from HKS area | |||||
| Undivided Cambrian to Eocene Sedimentary Rocks (Abbottabad, Hazira, Samana Suk and Kawagarh formations, Lockhart Limestone, Margalla Hill Limestone and Kuldana Formation) | 41 | −0.230–25.939 | 5.020 | 5.667 | |
| Metasedimentary rocks of the Indian Plate | |||||
| Banna Formation | 7 | −0.179–23.159 | 9.713 | 73.702 | 9.768 |
| Kashala, Nikanai Ghar and Saidu formations | 8 | 2.535–22.998 | 11.615 | 7.062 | |
| Surgun Group | 27 | 2.556–351.879 | 46.128 | 75.866 | |
| Mekhband and Marghazar formations | 7 | 8.265–347.543 | 100.817 | 133.882 | |
| Tanol Formation | 14 | 3.681–25.968 | 12.642 | 7.020 | |
| Hazara Formation | 10 | −0.645–35.000 | 18.111 | 12.743 | |
| Salkhala Formation | 45 | −0.923–59.000 | 15.979 | 14.724 | |
| Gandaf Formation | 14 | 2.998–2001.975 | 551.086 | 871.338 | |
| Karora Formation | 5 | 0.399–4.523 | 1.959 | 1.666 | |
| Higher Himalayan Crystalline | 15 | 0.884–59.570 | 19.229 | 17.687 | |
| Indus Suture Melange Zone | |||||
| Indus Suture Melange Zone | 14 | 77.820–6172.863 | 2244.121 | 2258.127 | |
| KIA rocks | |||||
| Kohistan Batholith | 6 | 348.680–2660.867 | 1354.662 | 870.694 | 898.402 |
| Chillas Complex | 42 | 5.798–2942.107 | 573.526 | 809.634 | |
| Kamila Amphibolite Belt | 19 | 3.305–2967.406 | 395.771 | 801.269 | |
| Jijal/Sapat Complex | 20 | 40.098–9929.903 | 1800.733 | 2858.599 | |
| Igneous and metaigneous rocks of the Indian Plate | |||||
| Ambela Complex | 16 | 8.299–1914.250 | 513.785 | 293.543 | 740.667 |
| Panjal Formation (volcanics and metasediments) | 17 | 0.594–240.010 | 47.340 | 56.025 | |
| Granite/Granite Gneiss (Neelum, Manshera and Swat) | 43 | 0.134–987.610 | 53.281 | 176.680 | |
| Besham Complex | 16 | 0.849–2928.463 | 980.600 | 1235.772 | |
| Undivided Early Proterozoic Rocks of the Indian Plate in Besham and surrounding areas | |||||
| Undivided Early Proterozoic rocks including Besham and Kotla complexes, Karora and Gandaf formations | 37 | 0.399–2928.463 | 633.627 | 1021.431 | |
4.1.2. Bulk Density and Magnetic Susceptibility of the Metasedimentary Rocks of the Indian Plate
4.1.3. Bulk Density and Magnetic Susceptibility of the Rocks in the Indus Suture Zone Melange
4.1.4. Bulk Density and Magnetic Susceptibility of the Rocks in the KIA
4.1.5. Bulk Density and Magnetic Susceptibility of the Igneous and Metaigneous Rocks of the Indian Plate
4.1.6. Bulk Density and Magnetic Susceptibility of Undivided Early Proterozoic Rocks of the Indian Plate in Besham and Surrounding Areas

4.2. Interpretation of Spatial Distribution Maps of Bulk Density and Magnetic Susceptibility

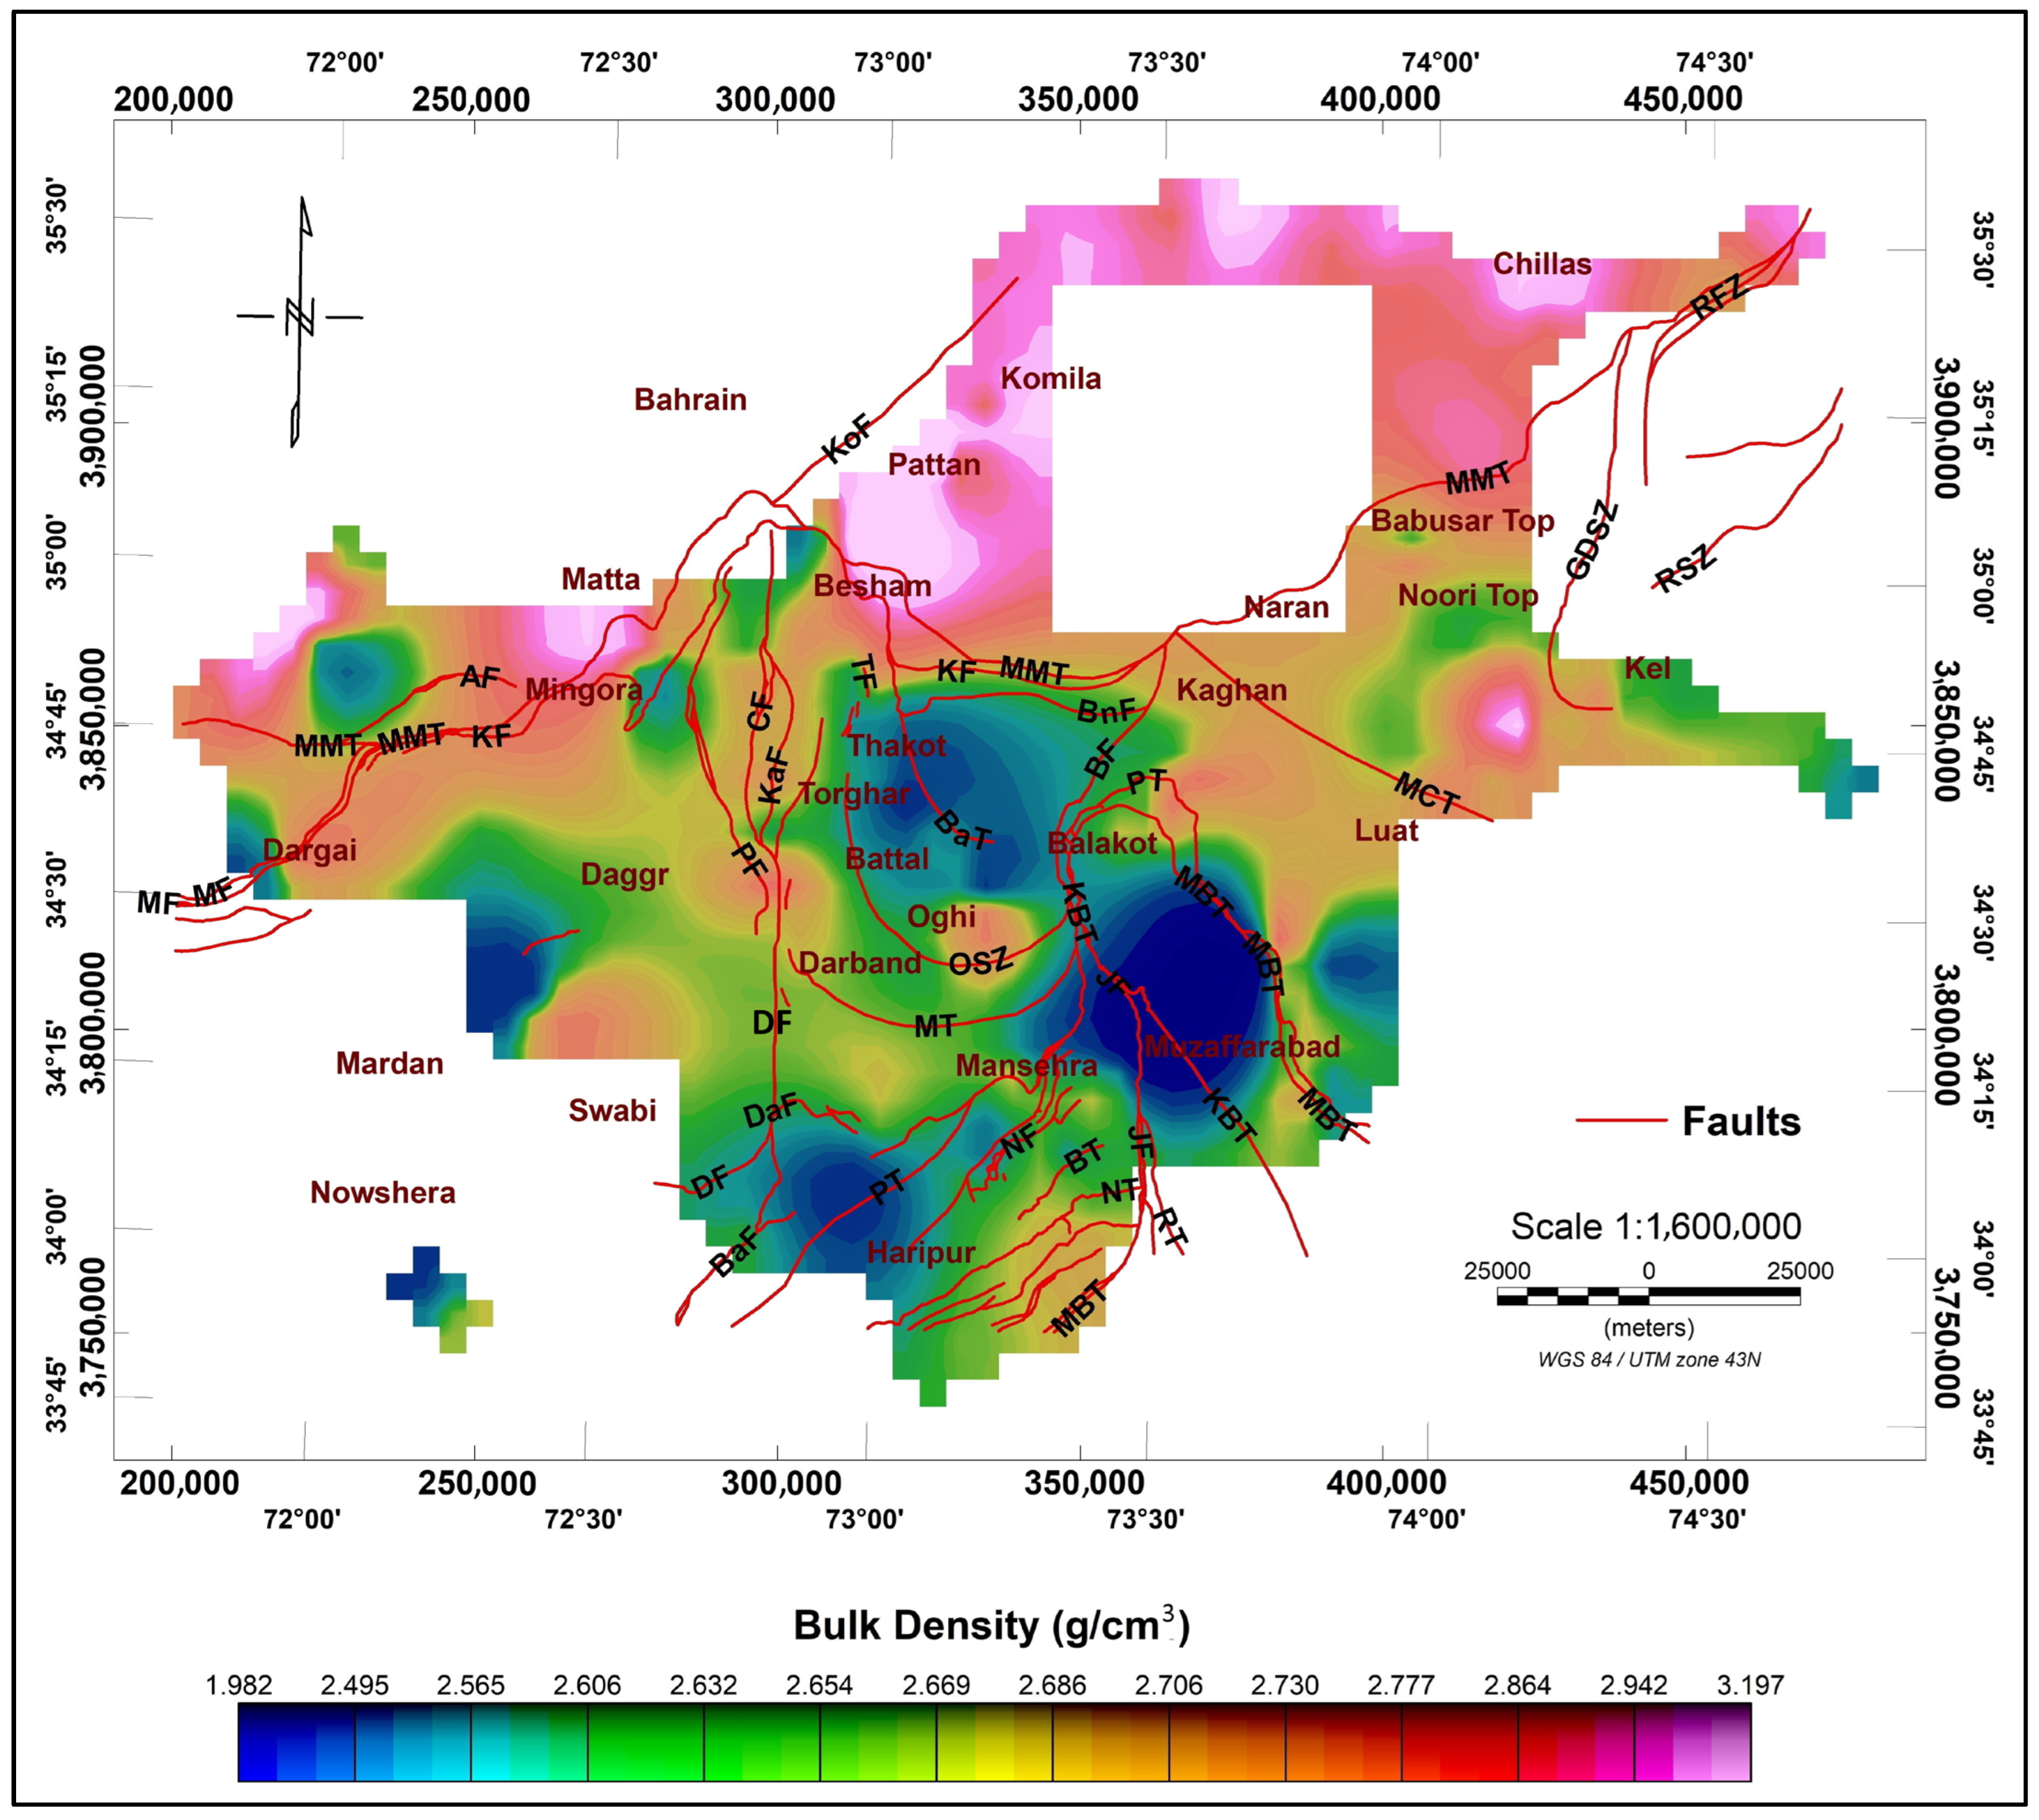
5. Conclusions

Supplementary Materials
Author Contributions
Funding
Data Availability Statement
Acknowledgments
Conflicts of Interest
Abbreviations
| SRTM | Shuttle Radar Topography Mission |
| Mw | Moment Magnitude |
| SD | Standard Deviation |
| MKT | Main Karakoram Thrust |
| HKS | Hazara Kashmir Syntaxis |
| MMT | Main Mantle Thrust |
| KIA | Kohistan Island Arc |
| MCT | Main Central Thrust |
| MBT | Main Boundary Thrust |
| PT | Panjal Thrust |
| NT | Nathia Gali Thrust |
| KBT | Kashmir Boundary Thrust |
| SRT | Salt Range Thrust |
| IS | Indus Syntaxis |
| NPS | Nanga Parbat Syntaxis |
| Wa | Dry Weight in Air |
| Ww | Saturated Weight in Water |
| Ws | Saturated Weight in Air |
| SI | International System of Units |
| Battal Thrust | BaT |
| Oghi Shear Zone | OSZ |
| Chakesar Fault | CF |
| Kandar Fault | KaF |
| Puran Fault | PF |
| Nawashahr Fault | NF |
| Bagnotor Fault | BT |
| Jhelum Fault | JF |
| Mansehra Thrust | MT |
| Darband Fault | DF |
References
- Henkel, H. Studies of density and magnetic properties of rocks from Northern Sweden. Pure Appl. Geophys. PAGEOPH 1976, 114, 235–249. [Google Scholar] [CrossRef]
- Rochette, P.; Jackson, M.; Aubourg, C. Rock magnetism and the interpretation of anisotropy of magnetic susceptibility. Rev. Geophys. 1992, 30, 209. [Google Scholar] [CrossRef]
- Tarling, D.H.; Hrouda, F. The Magnetic Anisotropy of Rocks; Chapman and Hall: London, UK, 1993. [Google Scholar]
- Berckhemer, H.; Rauen, A.; Winter, H.; Kern, H.; Kontny, A.; Lienert, M.; Nover, G.; Pohl, J.; Popp, T.; Schult, A.; et al. Petrophysical properties of the 9-km-deep crustal section at KTB. J. Geophys. Res. Solid Earth 1997, 102, 18337–18361. [Google Scholar] [CrossRef]
- Clark, D. Magnetic Petrophysics and Magnetic Petrology; Aids to Geological Interpretation of Magnetic Surveys. AGSO J. Aust. Geol. Geophys. 1997, 17, 83–103. [Google Scholar]
- Rybakov, M.; Goldshmidt, V.; Rotstein, Y.; Fleischer, L.; Goldberg, I. Petrophysical constraints on gravity/magnetic interpretation in Israel. Lead. Edge 1999, 18, 269–272. [Google Scholar] [CrossRef]
- Bosch, M.; McGaughey, J. Joint inversion of gravity and magnetic data under lithologic constraints. Lead. Edge 2001, 20, 877–881. [Google Scholar] [CrossRef]
- Törnberg, R.; Sturkell, E. Density and magnetic susceptibility of rocks from the Lockne and Tvären marine impact structures. Meteorit. Planet. Sci. 2005, 40, 639–651. [Google Scholar] [CrossRef]
- Lundin, A.I.; Bastani, M. Analysis of petrophysical properties of some granitoids in Sweden. J. Appl. Geophys. 2007, 62, 74–87. [Google Scholar] [CrossRef]
- Williams, N.C. Geologically-Constrained UBC–GIF Gravity and Magnetic Inversions with Examples from the Agnew-Wiluna Greenstone Belt, Western Australia. Ph.D. Thesis, University of British Columbia, Vancouver, BC, Canada, 2008. [Google Scholar]
- Heincke, B.; Jegen, M.; Moorkamp, M.; Chen, J.; Hobbs, R.W. Adaptive coupling strategy for simultaneous joint inversions that use petrophysical information as constraints. In SEG Technical Program Expanded Abstracts 2010; Society of Exploration Geophysicists: Houston, TX, USA, 2010; pp. 2805–2809. [Google Scholar]
- Akinyemi, O.; Alabi, A.; Ojo, A.; Adewusi, O. Characterization of Density and Porosity of Rocks Samples from Ogun State of Nigeria. Earth Sci. Res. 2012, 1, 98–105. [Google Scholar] [CrossRef]
- Yang, T.; Gao, J.; Gu, Z.; Dagva, B.; Tserenpil, B. Petrophysical Properties (Density and Magnetization) of Rocks from the Suhbaatar-Ulaanbaatar-Dalandzadgad Geophysical Profile in Mongolia and Their Implications. Sci. World J. 2013, 2013, 791918. [Google Scholar] [CrossRef] [PubMed]
- Kamm, J.; Lundin, I.A.; Bastani, M.; Sadeghi, M.; Pedersen, L.B. Joint inversion of gravity, magnetic, and petrophysical data—A case study from a gabbro intrusion in Boden, Sweden. Geophysics 2015, 80, B131–B152. [Google Scholar] [CrossRef]
- Wildan, D.; Akbar, A.; Novranza, K.; Sobirin, R.; Permadi, A.; Supriyanto. The importance of bulk density determination in gravity data processing for structure interpretation. AIP Conf. Proc. 2017, 1862, 030175. [Google Scholar] [CrossRef]
- Calkins, J.A.; Offield, T.W.; Abdullah, S.K.M.; Ali, S.T. Geology of the Southern Himalaya in Hazara, Pakistan, and Adjacent Areas; Geological Survey Professional Paper 716–C; United States Government Printing Office: Washington, DC, USA, 1975. [Google Scholar] [CrossRef]
- Searle, M.P.; Khan, M.A. Geological Map of North Pakistan and Adjacent Areas of Northern Ladakh and Western Tibet. Scale 1:650,000; Oxford University: Oxford, UK, 1996. [Google Scholar]
- Chaudhry, M.N.; Spencer, D.A.; Ghazanfar, M.; Hussain, S.S.; Dawood, H. The location of the main central thrust in the Northwest Himalaya of Pakistan: Tectonic implications. Geol. Bull. Punjab Univ. 1997, 31–32, 1–19. [Google Scholar]
- DiPietro, J.A.; Ahmad, I.; Hussain, A. Cenozoic kinematic history of the Kohistan fault in the Pakistan Himalaya. Geol. Soc. Am. Bull. 2008, 120, 1428–1440. [Google Scholar] [CrossRef]
- Khan, M.R.; Hameed, F.; Mughal, M.S.; Basharat, M.; Mustafa, S. Tectonic study of the Sub-Himalayas based on geophysical data in Azad Jammu and Kashmir and northern Pakistan. J. Earth Sci. 2016, 27, 981–988. [Google Scholar] [CrossRef]
- Hameed, F.; Khan, M.R.; Dentith, M. Crustal study based on integrated geophysical techniques in the Northwestern Himalayas, Pakistan. Geol. J. 2023, 58, 1523–1549. [Google Scholar] [CrossRef]
- Telford, W.M.; Geldart, L.P.; Sheriff, R.E. Applied Geophysics, 2nd ed.; Cambridge University Press: Cambridge, UK, 1990. [Google Scholar]
- Dentith, M.; Mudge, S. Geophysics for the Mineral Exploration Geoscientist; Cambridge University Press: Cambridge, UK, 2014. [Google Scholar] [CrossRef]
- Schon, J.H. Physical Properties of Rock: Handbook of Petroleum Exploration and Production; Elsevier: Amsterdam, The Netherlands, 2011; Volume 8, pp. 120–121. [Google Scholar]
- Ellis, D.V.; Singer, J.M. Well Logging for Earth Scientists, 2nd ed.; Springer: Berlin/Heidelberg, Germany, 2007. [Google Scholar] [CrossRef]
- Eshaghi, E.; Smith, R.S.; Ayer, J. Petrophysical Characterisation (I.E. Density and Magnetic Susceptibility) of Major Rock Units Within the Abitibi Greenstone Belt; publication number MERC-ME-2019-144; Laurentian University Mineral Exploration Research Centre: Sudbury, ON, Canada, 2019. [Google Scholar]
- Moon, C.J.; Whateley, M.K.G.; Evans, A.M. Introduction to Mineral Exploration, 2nd ed.; Blackwell Publishing: Hoboken, NJ, USA, 2006. [Google Scholar]
- Dentith, M.; Enkin, R.J.; Morris, W.; Adams, C.; Bourne, B. Petrophysics and mineral exploration: A workflow for data analysis and a new interpretation framework. Geophys. Prospect. 2020, 68, 178–199. [Google Scholar] [CrossRef]
- Coduto, D.P.; Yeung, M.R.; Kitch, W.A. Geotechnical Engineering: Principles and Practices, 2nd ed.; Pearson Education: London, UK, 2010. [Google Scholar]
- Houghton, B.F.; Carey, R.J. The Encyclopedia of Volcanoes, 2nd ed.; Academic Press: Cambridge, MA, USA, 2015. [Google Scholar]
- Dearing, J.A. Environmental Magnetic Susceptibility Using the Bartington MS2 System; Chi Publishing: Kenilworth, UK, 1999. [Google Scholar]
- Hrouda, F. Magnetic anisotropy of rocks and its application in geology and geophysics. Geophys. Surv. 1982, 5, 37–82. [Google Scholar] [CrossRef]
- Hansen, R.O.; Racic, L.; Grauch, V.J.S. Magnetic Methods in near-Surface Geophysics. In Near-Surface Geophysics; Butler, D.K., Ed.; Society of Exploration Geophysicists: Houston, TX, USA, 2005; pp. 151–176. [Google Scholar]
- Rochette, P. Magnetic susceptibility of the rock matrix related to magnetic fabric studies. J. Struct. Geol. 1987, 9, 1015–1020. [Google Scholar] [CrossRef]
- Da Silva, A.C.; Whalen, M.T.; Hladil, J.; Chadimova, L.; Chen, D. Magnetic Susceptibility Application: A Window onto Ancient Environments and Climatic Variations: Foreword; Special Publications 414; Geological Society: London, UK, 2015; pp. 1–13. [Google Scholar] [CrossRef]
- Abd El Rahman, A.A.; Elnaggar, O.M.; Mohamed, S.F. Magnetic susceptibility as an indication of reservoir properties of the Nubia Group in Aswan-Komombo, Southern Egypt. Egypt. J. Pet. 2023, 32, 31–41. [Google Scholar] [CrossRef]
- Messaoud, J.H.; Yaich, C. Middle–upper Eocene sediments and sea-level dynamics in central Tunisia. Mediterr. Geosci. Rev. 2024, 7, 51–67. [Google Scholar] [CrossRef]
- Anggraeni, F.K.A. Two dimensional modeling (2D) gravity method for interpreting subsurface structure of mount Merapi. J. Phys. Conf. Ser. 2021, 1832, 012002. [Google Scholar] [CrossRef]
- Dong, C.; Chen, B.; Wang, C. Magnetic anomaly characteristics and magnetic basement structure in earthquake-affected Changning area of Southern Sichuan Basin, China: A new perspective from land-based stations. Remote Sens. 2022, 15, 23. [Google Scholar] [CrossRef]
- Cisowski, S.M.; Fuller, M. The generation of magnetic anomalies by combustion metamorphism of sedimentary rock, and its significance to hydrocarbon exploration. Geol. Soc. Am. Bull. 1987, 99, 21–29. [Google Scholar] [CrossRef]
- Boroomand, M.; Safari, A.; Bahroudi, A. Magnetic susceptibility as a tool for mineral exploration (Case study: Southern of Zagros Mountains). Int. J. Min. Geo-Eng. 2015, 49, 57–66. [Google Scholar] [CrossRef]
- Borradaile, G.J. Magnetic susceptibility, petrofabrics and strain. Tectonophysics 1988, 156, 1–20. [Google Scholar] [CrossRef]
- Hrouda, F. Models of magnetic anisotropy variations in sedimentary thrust sheets. Tectonophysics 1991, 185, 203–210. [Google Scholar] [CrossRef]
- Lee, T.Q.; Angelier, J. Tectonic significance of magnetic susceptibility fabrics in Plio-Quaternary mudstones of southwestern foothills, Taiwan. Earth Planets Space 2000, 52, 527–538. [Google Scholar] [CrossRef]
- Henkel, H. Petrophysical properties (density and magnetization) of rocks from the northern part of the Baltic Shield. Tectonophysics 1991, 192, 1–19. [Google Scholar] [CrossRef]
- Henkel, H. Standard diagrams of magnetic properties and density—A tool for understanding magnetic petrology. J. Appl. Geophys. 1994, 32, 43–53. [Google Scholar] [CrossRef]
- Enkin, R.J.; Hamilton, T.S.; Morris, W.A. The Henkel petrophysical plot: Mineralogy and lithology from physical properties. Geochem. Geophys. Geosystems 2020, 21, e2019GC008818. [Google Scholar] [CrossRef]
- Eshaghi, E.; Vayavur, R.; Smith, R.S.; Mancuso, C.; Della Justina, F.; Ayer, J. Density and magnetic susceptibility of major rock types within the Abitibi greenstone belt: A compilation with examples of its use in constraining inversion. Explor. Geophys. 2023, 54, 647–669. [Google Scholar] [CrossRef]
- Tavakoli, S.; Elming, S.; Thunehed, H. Geophysical modelling of the central Skellefte district, Northern Sweden; an integrated model based on the electrical, potential field and petrophysical data. J. Appl. Geophys. 2012, 82, 84–100. [Google Scholar] [CrossRef]
- Latif, M.A. Explanatory notes on the geology of south eastern Hazara, to accompany the revised geological map. Jahrb. Geol. Sogischen Bundesanst. Wien Sonderband 1970, 15, 5–19. [Google Scholar]
- Greco, A.M.; Spencer, D.A. A section through the Indian Plate, Kaghan Valley, NW Himalaya, Pakistan. Geol. Soc. Lond. Spec. Publ. 1993, 74, 221–236. [Google Scholar] [CrossRef]
- Schneider, D.A.; Edwards, M.A.; Kidd, W.S.F.; Khan, M.A.; Seeber, L.; Zeitler, P.K. Tectonics of Nanga Parbat, western Himalaya: Synkinematic plutonism within the doubly vergent shear zones of a crustal-scale pop-up structure. Geology 1999, 27, 999–1002. [Google Scholar] [CrossRef]
- Edwards, M.A.; Kidd, W.S.F.; Khan, M.A.; Schneider, D.A. Tectonics of the SW margin of the Nanga Parbat-Haramosh massif. Geol. Soc. Lond. Spec. Publ. 2000, 170, 77–100. [Google Scholar] [CrossRef]
- Fontan, D.; Schouppe, M.; Hunziker, C.J.; Martinotti, G.; Verkaeren, J. Metamorphic evolution, 40Ar-39Ar chronology and tectonic model for the Neelum valley, Azad Kashmir, NE Pakistan. Geol. Soc. Lond. Spec. Publ. 2000, 170, 431–453. [Google Scholar] [CrossRef]
- DiPietro, J.A.; Isachsen, C.E. U-Pb zircon ages from the Indian plate in northwest Pakistan and their significance to Himalayan and pre-Himalayan geologic history. Tectonics 2001, 20, 510–525. [Google Scholar] [CrossRef]
- Pêcher, A.; Giuliani, G.; Garnier, V.; Maluski, H.; Kausar, A.; Malik, R.; Muntaz, H. Geology, geochemistry and Ar–Ar geochronology of the Nangimali ruby deposit, Nanga Parbat Himalaya (Azad Kashmir, Pakistan). J. Asian Earth Sci. 2002, 21, 265–282. [Google Scholar] [CrossRef]
- Akhtar, S.S.; Waliullah Hussain, A.; Muhammad, R. Geological Map of the Dhirkot Area, Muzaffarabad and Bagh Districts, AJK and Parts of Rawalpindi and Abbottabad Districts, NWFP, Pakistan; Geological Survey of Pakistan: Quetta, Pakistan, 2004. [Google Scholar]
- Hussain, A.; Mughal, N.; Haq, I.; Latif, A. Geological Map of the Ghari Habibullah Area, District Mansehra and Parts of Muzaffarabad District, AJK; Geological Survey of Pakistan: Quetta, Pakistan, 2004. [Google Scholar]
- Hussain, A.; DiPietro, J.A.; Pogue, K.R.; Ahmad, I. Geological Map of the 43B Degree Sheet, NWFP, Pakistan; Geological Survey of Pakistan Degree Sheet Map Series, Geological Map; Geological Survey of Pakistan: Quetta, Pakistan, 2004. [Google Scholar]
- Iqbal, S.; Nasir, S.; Hussain, A. Geological Map of the Nauseri Area, District Muzaffarabad, AJK; Geological Survey of Pakistan: Quetta, Pakistan, 2004. [Google Scholar]
- Nasir, S.; Latif, A.; Hussain, A. Geological Map of the Mahandri Area, Mansehra District and Parts of Muzaffarabad District, AJK; Geological Survey of Pakistan: Quetta, Pakistan, 2004. [Google Scholar]
- Latif, A.; Afridi, A.G.K.; Majid, A.N.; Hussain, A. Geological Map of the Balakot Quadrangle (Earthquake Affected Area), District Mansehra, NWFP, Pakistan; Geological Survey of Pakistan: Quetta, Pakistan, 2008. [Google Scholar]
- Shah, S.M.I. Stratigraphy of Pakistan; Memoir of the Geological Survey of Pakistan; Geological Survey of Pakistan: Quetta, Pakistan, 2009; Volume 22, pp. 1–308. [Google Scholar]
- Afridi, A.G.K.; Hussain, A. Geological Map of the Nathia Gali Quadrangle, Abbottabad and Mansehra Districts, Khyber Pakhtunkhwa, and Parts of Rawalpindi and Muzaffarabad Districts; Geological Survey of Pakistan: Quetta, Pakistan, 2010. [Google Scholar]
- Hinze, W.; Von Frese, R.; Saad, A. Gravity and Magnetic Exploration: Principles, Practices, and Applications; Cambridge University Press: Cambridge, UK, 2012. [Google Scholar] [CrossRef]
- Malinconico, L.L., Jr. Structure of the Himalayan Suture Zone in Pakistan Interpreted from Gravity and Magnetic Data. Ph.D. Thesis, Dartmouth College, Hanover, NH, USA, 1982. [Google Scholar]
- Duroy, Y. Subsurface Densities & Lithospheric Flexure of the Himalayan Foreland in Pakistan, Interpreted from Gravity Data. Master’s Thesis, Oregon State University, Corvallis, OR, USA, 1986. Available online: https://ir.library.oregonstate.edu/concern/graduate_thesis_or_dissertations/tx31qk76m (accessed on 15 December 2019).
- Pudsey, C.J.; Maguire, P.K. Magnetic profiles across the northern suture, Kohistan, NW Pakistan. Geol. Bull. Univ. Peshawar 1986, 19, 47–60. [Google Scholar]
- Khan, M.R. Tectonic Modelling of Hazara and Its Adjoining Areas (Gravity Modelling). Ph.D. Thesis, Quaid-i-Azam University, Islamabad, Pakistan, 1994. [Google Scholar]
- Khan, M.R.; Ali, M. Tectonics of the Hazara and adjoining areas, based on gravity data, Northwest Himalaya, Pakistan. Geol. Bull. Univ. Peshawar 1997, 30, 273–283. [Google Scholar]
- Khan, M.R.; Bilali, S.S.; Hameed, F.; Rabnawaz, A.; Mustafa, S.; Azad, N.; Basharat, M.; Niaz, A. Application of gravity and magnetic methods for the crustal study and delineating associated ores in the western limb of Hazara Kashmir Syntaxis, Northwest Himalayas, Pakistan. Arab. J. Geosci. 2018, 11, 131. [Google Scholar] [CrossRef]
- Finetti, L.; Giorgetti, F.; Poretti, G. The Pakistani segment of the DSS-profile Nanga Parbat-Karakul (1974–1975). Boll. Geofis. Teor. Appl. 1979, 21, 159–171. [Google Scholar]
- Kaila, K. Structure and seismotectonics of the Himalaya-Pamir Hindukush region and the Indian plate boundary. Zagros Hindu Kush Himalaya: Geodyn. Evol. 1981, 3, 272–293. [Google Scholar] [CrossRef]
- Menke, W.; Jacob, K. Seismicity patterns in Pakistan and northwestern India associated with continental collision. Bull. Seismol. Soc. Am. 1976, 66, 1695–1711. [Google Scholar] [CrossRef]
- Molnar, P.; Tapponnier, P. Cenozoic Tectonics of Asia: Effects of a Continental Collision: Features of recent continental tectonics in Asia can be interpreted as results of the India-Eurasia collision. Science 1975, 189, 419–426. [Google Scholar] [CrossRef] [PubMed]
- Dewey, J.; Bird, J. Mountain belts and the new global tectonics. J. Geophys. Res. 1970, 75, 2625–2647. [Google Scholar] [CrossRef]
- Gansser, A. Geology of the Himalayas; Wiley InterScience: New York, NY, USA, 1964. [Google Scholar]
- Molnar, P. The geologic history and structure of the Himalaya. Am. Sci. 1986, 74, 144–154. [Google Scholar]
- Tahirkheli, R.A.K.; Mattauer, M.; Proust, F.; Tapponnier, P. The India Eurasia suture zone in northern Pakistan: Synthesis and interpretation of recent data at plate scale. In Geodynamics of Pakistan; Geological Survey of Pakistan: Quetta, Pakistan, 1979; pp. 125–130. [Google Scholar]
- Bard, J.P.; Maluski, H.; Matte, P.; Proust, F. The Kohistan sequence: Crust and mantle of an obducted island arc. Geol. Bull. Univ. Peshawar 1980, 13, 87–94. [Google Scholar]
- Molnar, P. A review of geophysical constraints on the deep structure of the Tibetan Plateau, the Himalaya and the Karakoram, and their tectonic implications. Philos. Trans. R. Soc. London. Ser. A Math. Phys. Sci. 1988, 326, 33–88. [Google Scholar] [CrossRef]
- Le Fort, P. Himalayas: The collided range. Present knowledge of the continental arc. Am. J. Sci. 1975, 275, 144. [Google Scholar]
- Yin, A. Cenozoic tectonic evolution of the Himalayan orogen as constrained by along-strike variation of structural geometry, exhumation history, and foreland sedimentation. Earth-Sci. Rev. 2006, 76, 1–131. [Google Scholar] [CrossRef]
- Martin, A.J. A review of Himalayan stratigraphy, magmatism, and structure. Gondwana Res. 2017, 49, 42–80. [Google Scholar] [CrossRef]
- Carmichael, R.S. Practical Handbook of Physical Properties of Rocks and Minerals; CRC Press: Boca Raton, FL, USA, 1989. [Google Scholar] [CrossRef]
- Pueyo, E.L.; Román-Berdiel, T.; Calvín, P.; Bouchez, J.L.; Beamud, E.; Ayala, C.; Loi, F.; Soto, R.; Clariana, P.; Margalef, A.; et al. Petrophysical Characterization of Non-Magnetic Granites; Density and Magnetic Susceptibility Relationships. Geosciences 2022, 12, 240. [Google Scholar] [CrossRef]

Disclaimer/Publisher’s Note: The statements, opinions and data contained in all publications are solely those of the individual author(s) and contributor(s) and not of MDPI and/or the editor(s). MDPI and/or the editor(s) disclaim responsibility for any injury to people or property resulting from any ideas, methods, instructions or products referred to in the content. |
© 2025 by the authors. Licensee MDPI, Basel, Switzerland. This article is an open access article distributed under the terms and conditions of the Creative Commons Attribution (CC BY) license (https://creativecommons.org/licenses/by/4.0/).
Share and Cite
Hameed, F.; Khan, M.R.; Tian, J.; Bilal, M.A.; Wang, C.; Wang, Y.; Mughal, M.S.; Niaz, A. Geological Significance of Bulk Density and Magnetic Susceptibility of the Rocks from Northwest Himalayas, Pakistan. Minerals 2025, 15, 781. https://doi.org/10.3390/min15080781
Hameed F, Khan MR, Tian J, Bilal MA, Wang C, Wang Y, Mughal MS, Niaz A. Geological Significance of Bulk Density and Magnetic Susceptibility of the Rocks from Northwest Himalayas, Pakistan. Minerals. 2025; 15(8):781. https://doi.org/10.3390/min15080781
Chicago/Turabian StyleHameed, Fahad, Muhammad Rustam Khan, Jiangtao Tian, Muhammad Atif Bilal, Cheng Wang, Yongzhi Wang, Muhammad Saleem Mughal, and Abrar Niaz. 2025. "Geological Significance of Bulk Density and Magnetic Susceptibility of the Rocks from Northwest Himalayas, Pakistan" Minerals 15, no. 8: 781. https://doi.org/10.3390/min15080781
APA StyleHameed, F., Khan, M. R., Tian, J., Bilal, M. A., Wang, C., Wang, Y., Mughal, M. S., & Niaz, A. (2025). Geological Significance of Bulk Density and Magnetic Susceptibility of the Rocks from Northwest Himalayas, Pakistan. Minerals, 15(8), 781. https://doi.org/10.3390/min15080781