Article

Mineral Characterization of Gold Ore Occurrences in the Khaptasynnakh Ore Zone, Anabar Shield, Far East Region, Russia

by
Boris Gerasimov
* and
Larisa Kondratieva
Diamond and Precious Metal Geology Institute, Siberian Branch, Russian Academy of Sciences, SB RAS, 39, prosp. Lenina, Yakutsk 677000, Russia
*
Author to whom correspondence should be addressed.
Minerals 2025, 15(8), 774; https://doi.org/10.3390/min15080774
Submission received: 5 June 2025 / Revised: 16 July 2025 / Accepted: 17 July 2025 / Published: 24 July 2025

Abstract

Mineral characterization of gold-bearing metasomatites in the Khaptasynnakh ore zone of the Anabar Shield is provided in detail. The following ore formation sequence of mineral associations in the Khaptasynnakh zone was found: pyrite and pyrrhotite → gersdorffite and molybdenite → chalcopyrite, sphalerite, and galena → bornite and chalcocite → tellurides, native gold, stibnite, cinnabar, and native bismuth. Native gold is characterized by varying fineness (550 to 926‰) and Cu impurity (up to 7.87%) values. Most often, it forms symplectite intergrowths with Au telluride–calaverite. Native gold and Au tellurides showed inclusions of chalcocite, bornite, altaite, tellurobismuthite, rickardite, petzite, and clausthalite. A two-stage formation process of the examined gold is suggested: Low-fineness gold was introduced into the system during early potassium metasomatism, while higher-fineness gold related to silica metasomatism resulted from its additional mobilization by fluid during late-stage formation. The low-temperature gold–telluride association observed in the mineral paragenesis of ore-bearing rocks, as well as its inclusions in native gold, suggests epithermal gold–telluride mineralization. Mineral inclusions examined in placer gold validate a genetic relation between the examined ores and gold placers in the Khaptasynnakh ore zone.

1. Introduction

The Anabar Shield (Far East region, Russia) still remains a little-explored exposure of the Precambrian crystalline basement of the North Asian craton (Figure 1). Until recently, accurate data on gold mineralization of the shield have been scarce, although numerous gold placers of unknown ore occurrences were found here. It should be noted that Almazy Anabara JSC discovered placer gold deposits in the rivers Borosku Unguokhtaakh and Ulakhan Khaptasynnakh in 2024. We investigated typomorphic features of placer gold from these streams at an earlier time and underlined the prospects for further geological studies, which were later supported by the discovery of economic placer deposits [1]. We continue to study the typomorphic features of native gold and the mineral characterization of ore bodies in the central Billyakh tectonic mélange zone to identify their mineral types and economic potential.
The study area is located in the central Billyakh tectonic mélange zone, which is based on contiguous fault segments intercalated with different re-metamorphosed and migmatitic plagiogneisses, granulite facies schists, and gneisses of the Upper Anabar Archean series, as well as amphibolite-facies biotite–amphibole gneisses of the Early Proterozoic Khapchan series [2]. The central part of the zone is occupied by the Billyakh Massif, composed of porphyraceous granodolerites metamorphosed in the amphibolite facies, monzonites, and granites (Billyakh Complex) transected by alaskite dykes (Figure 1). Dyke-like bodies of biotite monzogabbro and amphibole–biotite quartz monzonites can be found to the east of the massif. The chemical composition of granitoids from the Billyakh Massif corresponds to quartz monzonites, quartz syenites (granosyenites), moderately alkaline granites, granodiorites, and quartz diorites. A.P. Smelov et al. suggest that granitoids of the massif cannot be unequivocally classified as I, S, or A granitoids since they formed during late collision under transform plate boundary conditions [2]. A.P. Smelov et al. defined the Khaptasynnakh ore zone in the watershed of the rivers Ulakhan Khatasynnaakh and Borosku Unguokhtaakh [3].
Here, we present the results of the examination of gold-bearing samples from bedrock excavated by transverse reconnaissance trenches 112 and 114 (3 m deep) across the ore zone and eluvial deposits. Also, the mineral and geochemical features of native gold from the placers are characterized.

2. Materials and Methods

Field work involved placer and low-volume sampling of channel sediments, as well as reconnaissance traverses with placer sampling from bedrock exposure subjected to hydrothermal transformation. We also examined samples from reconnaissance trenches excavated by Almazy Anabara JSC, Yakutsk, Russia.
The chemical composition of gold was determined using a Camebax Micro microanalyzer. The detection limits of elements (wt.%) are as follows: Au—0.22; Ag—0.13; Cu—0.08; Hg—0.18. This study was conducted with the following conditions: accelerating voltage: 20 kV; probe current: 50 nA; measurement time: 10 s. Analyses of mineral inclusions in the placer gold and the gold–sulfide segregations were conducted on polished thin sections using a JEOL JSM-6480LV microscope equipped with Energy 350 Oxford Instruments wavelength and energy-dispersion spectrometers (accelerating voltage: 20 kV; probe current: 1.09 nA; measurement time: 7 s). The analytical lines were as follows: Au–Mα, Ag–α, and other elements–Kα. The standards were gold 850‰—Au and Ag; FeS2 (pyrite)—Fe and S; CuFeS2 (chalcopyrite)—Cu; FeAsS (arsenopyrite)—As; ZnS (sphalerite)—Zn; Ca5[PO4]3(F) (fluorapatite)—Ca, P, and F; Na[AlSi3O8] (albite)—Na, Al, and Si; K[AlSi3O8] (ortoclase)—K; CeO2 (cerianite)—Ce. The limits of element detection (in wt.%) were as follows: Au, 1.81; Ag, 1.11; Fe, 1.02; S, 0.71; Cu, 1.22; As, 1.07; Zn, 1.73; Ca, 0.62; F, 0.92; P, 0.44; Na, 0.44; Al, 0.36; Si, 0.57; K, 0.45; Ce, 1.68. The analyses were performed at the Department for Physico-Chemical Methods of Analysis, Diamond and Precious Metal Geology Institute SB RAS.
EDS mapping was performed on a TESCAN-MIRA 3-LMU scanning electron microscope equipped with an A-Advanced-Inca-Energy 350-X-ray energy-dispersive microanalyzer with an X-MAX-80 detector from Oxford Instruments, which is designed to carry out electron-probe microanalysis. The studies were conducted in the Central Analytical Laboratory of JSC ALROSA. The survey conditions were as follows: beam current accelerating voltage of 16.5 k, emission current of 157 pA, and measurement time of 40 s. The accuracy of determination reaches 1% (relative share). The sum is up to 102% (class III accuracy).
The internal structure of native-gold grains was studied after their etching using a reagent (HCl + HNO3 + FeCl3⋅6H2O + CrO3 + thiourea + water) following the standard method [4].

3. Results

3.1. Mineral Paragenesis of the Khaptasynnakh Orezone

The Khaptasynnakh ore zone is traced in a submeridional direction according to the strike of the Billyakh tectonic mélange zone, with a visible length of more than 20 km and a width of 1 to 10 km. It is traced by sulphidized rocks, which are not continuously developed within the studied area, and they represent local outcrops of limonitized rocks on the surface. But in general, the strike and width of the zone are traced quite clearly. These sulphidized formations are represented by varying degrees of metasomatically altered gneisses and granite gneisses. In addition, thin (1–2 mm) quartz veins with sulphide mineralization are noted.
Ore gold was discovered in samples taken from eluvial rocks and bedrocks uncovered by prospecting trenches. Trenches 112 and 114 exposed sulphidized rocks with a thickness of about 8 m. They are represented by gneisses that are transformed in the process of silica–potassium metasomatism. Hydrothermal–metasomatic changes are expressed in silicification, potassic metasomatism, sulfidization, and less frequently, in the presence of quartz and calcite veining.
Potassium feldspar (10%–30%), plagioclase (10%–20%), and biotite 5%–15% are the main minerals of siliceous–potassium metasomatites, along with quartz, for which its content varies between 30 and 60%. In thin sections, the fine-flaky sericitization of plagioclase and its replacement by lattice microcline, as well as the development of brown biotite laths, are observed (Figure 2). The associated minerals include apatite, zircon, rutile, ilmenite, monazite, chlorite, and barite.
The pyrite–pyrrhotite association is the earliest formed. Pyrrhotite usually forms aggregates of xenomorphic segregations along dark-colored source minerals. Pyrite occurs as uniformly dispersed hypidiomorphic crystals or thin 0.01–1 mm veinlets, and it is slightly susceptible to oxidation. They are often found in intergrowth (Figure 3a) and are a matrix for the micrograins of late ore minerals. This association also includes sporadic arsenic pyrite, gersdorffite, molybdenite, and scheelite, although they deposited somewhat later. Veinlets of molybdenite penetrate through cracks into pyrite and pyrrhotite, and rounded and veinlet-like grains of scheelite occur in pyrite. A single gersdorffite grain was found on a facet of idiomorphic pyrite. Prismatic crystals of arsenopyrite in the pores of quartz near grains of pyrite and pyrrhotite are found.
The medium polymetallic association is represented by chalcopyrite, galena, and sphalerite. Chalcopyrite is the most common, forming xenomorphic grains filling the spaces between pyrite and pyrrhotite or penetrating them through cracks (Figure 3a,c). Sphalerite was visibly intergrown with chalcopyrite (Figure 3a) or appeared in the form of inclusions. Galena, judging by the relationships, is the latest mineral in this association. (Figure 3c). It rarely forms relatively large grains of up to 100 µm, and it is more often found in micron drop-shaped or veinlet-like inclusions of 5–15 µm. Occasionally, galena contains Se impurities up to 4.34 wt.%, and in low-iron (0–9.36 wt.%, avg. 5.30 wt.%) environments, it contains sphalerite-Cd impurities up to 2.51 wt.%. Later, chalcocite and bornite were formed, forming rims and veinlets replacing chalcopyrite (Figure 3d,e). The shape of tellurides is oval, oval–elongated, or irregular. The most commonly observed instance is hessite, and the less common instances are tellurobismuthite, hedleyite, and altaite (Table 1). Native bismuth has also been found in association with the unspecified minerals of bismuth in hessite (Figure 3i).
Native gold was found in the form of microparticles (3–8 µm) with irregular shape in pyrite and pyrrhotite (Figure 3k). Fineness varies from 550 to 613‰ (Table 2), which allows us to classify it as electrum. The constant iron admixture is due to the influence of the background matrix minerals. Electrum is often found in association with tellurides or directly intergrown with hessite (Figure 3l). Also, single grains of stibnite, cinnabar, and native bismuth are attributed to late formations. Hypergene minerals include goethite, jarosite, malachite, and covellite. The geochemical composition of minerals is given in Table 3.
Gold-bearing quartz metasomatites (samples I-638-1, I-638-4, and I-638-5, Figure 1) were found in eluvial rocks in the blocks and debris of the Upper Anabar series (Figure 4a,b). Their compositions consist of medium-grained gray quartz (up to 90%), with rare grains of potassium feldspar and plagioclase (Figure 4c). Ore mineralization is represented mainly by chalcocite and, to a lesser extent, by bornite (Figure 4d,e). Chalcopyrite and pyrite are very rare (Figure 4f). The chalcocite–bornite complex contains numerous inclusions of later telluride mineralization, Au, Ag, Cu, Pb, and Bi (calaverite, sylvanite, and hessite), and compounds of tellurium with oxygen. Native gold measured up to 50 µm in size, with a fineness of 794‰–886‰. An admixture of Cu up to 4.79% and intergrown with calaverite and chalcocite was found (Figure 4g,h).
In general, based on the analysis of the relationships between minerals, the following sequence of formation of ore mineral associations is proposed: pyrite and pyrrhotite → gersdorffite and molybdenite → chalcopyrite, sphalerite, and galena → bornite and chalcocite → tellurides, native gold, stibnite, cinnabar, and native bismuth.

3.2. Characterization of Native Gold from the Khaptasynnakh Zone Using Crushed Samples

From the crushed quartz metasomatites of samples 638-1, 638-4, and 638-5, 574 particles of native gold with a total weight of 18.4 mg were extracted, including the following: 34 grains of with a fraction of 0.25–0.5 mm (11.1 mg) and 540 grains with a fraction of −0.25 mm (7.3 mg). The studied gold is characterized mainly by lumpy, angular–lumpy, and, to a lesser extent, lamellar forms (Figure 5), and it has relatively low (794‰), medium (833‰–890‰), and high (908‰–926‰) fineness (Table 4). A Cu admixture from 0.8 to 7.87% was determined, which was found in all analyzed gold particles.
A detailed study of the ore gold showed that its main part is represented by symplectic intergrowths with Au tellurides–calaverites (Figure 6, Table 5). Au tellurides are characterized by a heterogeneous porous structure.
Sulfides, tellurides, and selenides as inclusions in native gold and Au tellurides were found. Chemical composition of inclusions is given in Table 5.
Sulphides include chalcocite and bornite. Chalcocite is most frequent, and it occurs as small oval grains in both native gold and calaverite (Figure 7a,b). Bornite is not as frequent as chalcocite, showing similar shapes and sizes (Figure 7c). Tellurides are quite common. Altaite is the most frequent. It is characterized by relatively large segregations with close to crystalline shapes (Figure 7d). Tellurobismuthite was identified in two grains of fine gold (Figure 7e) as small isometric inclusions. Rickardite is developed in high-grade gold and has fairly large dimensions (Figure 7f). Clausthalite is characterized by rather small irregular grains (Figure 7f). In one spongy gold grain with medium fineness, petzite was found (Figure 7g). Along with ore minerals, inclusions of quartz, potash feldspar, and plagioclase were defined.
In addition, a phase of the Au–Cu solid solution with a Cu content of up to 25% was identified, and it was observed in the form of thin (about 5 microns) shells and intergranular veinlets in high-grade gold (Figure 7h,i, Table 6). According to the calculation formula, this phase corresponds to cuproauride [5].

4. Discussion

4.1. Possible Genetic Types of Ore Bodies

It is well known that gold–telluride mineralization is generally typical for near-surface deposits [6,7].
The Au-Bi-Te-W association is characteristic of reduced gold systems related to intrusions (RIRGSs) [8]. It is important to note that the Fe2O3/FeO ratio of granitoids of the Billyakh massif we calculated based on [2] is >0.4, which allows us to classify them as an oxide series [9]. According to [10], Sn–W deposits are mainly related to reduced ilmenite series granitoids, while Cu–Mo–Au ores are related to oxidised magnetite series granitoids. This suggests that we can probably exclude RIRGS from consideration since it is related to reduced intrusions.
Based on the content of Cu impurities, gold from crushed samples belongs to the copper type. Gaskov [11] believes that higher Cu contents in native gold indicate a probable genetic relation of gold mineralization to basite–hyperbasite complexes or copper–porphyry deposits. Morrison et al. [12] suggest that gold from porphyry sources usually demonstrates higher Cu content than other deposit types. Townley et al. [13] analyzed the composition of native gold from various hydrothermal deposits. The analysis suggests that the Au–Ag–Cu system can be used to classify epithermal, gold–porphyry, and gold–copper–porphyry systems. In the ternary Au-Ag-Cu diagram, the majority of figurative points are localized in the gold–copper–porphyry area (Figure 8).
These data agree with previous conclusions, which predicted the Au-Cu-Mo-Ag mineralizing systems of the copper–porphyry type in the ore occurrence related to rocks of the Billyakh massif [3,14]. Kravchenko et al. established that the halos of gold-bearing rocks spatially overlap with the Billyakh massif of porphyroblastic granites, and the granodiorite dated to 1983 ± 3 Ma and the alaskite granite dykes dated to 1971 ± 4 Ma [14]. The S/I = Al2O3/(CaO + Na2O + K2O) index is 1.1 to 1.5, and the K2O/Na2O ratio is 0.9 to 1.2 [3,14], which is typical for granitoids related to copper–molybdenum–porphyry deposits [15]. Complex geochemical Au, Cu, Zn, Mo, Ag, Sn, and Pb anomalies are found. It has been established that metal associations with anomalous content and their distribution correspond with the zoning of copper–porphyry systems, which includes a pre-ore zone with ferrous mineralization and copper–molybdenum, lead–zinc, and gold–silver ore zones [14]. This follows the general trend for gold–copper–porphyry deposits: Inner zones are enriched by primary minerals and elements, and outer zones are enriched by secondary ones [16,17]. As in [15,16,17], the general sequence of mineral associations in Cu–Mo–porphyry deposits is as follows: pyrite, chalcopyrite, molybdenite, magnetite, hematite, scheelite, and wolframite → galena, sphalerite, tetradymite, bornite, chalcocite, and enargite → cinnabar, fluorite, barite, and bismuth minerals. Geochemically, the process trend is represented in the following element sequence: Fe, Cu, Mo, S, (W, Au) → Zn, Pb, S, (Fe, Cu, Au, Ag) → Bi, Hg, S, Te, (Cu, Ba, Au, Ag) [16,17]. In general, the formation sequence of the ore mineral associations of the Khaptasynnakh zone that we have identified (pyrite and pyrrhotite → gersdorffite and molybdenite → chalcopyrite, sphalerite, and galena → bornite and chalcocite → tellurides, native gold, stibnite, cinnabar, and native bismuth) is consistent with the provided data.
In natural systems, gold and silver tellurides are usually formed in the late stages of the paragenetic sequence between 100 and 300 °C from hydrothermal fluids of variable salinity [18]. According to Cabri [19], calaverite is stable at a temperature of 300 °C. According to Zhang [18], at 300 °C, calaverite has a very limited stability field. However, at lower temperatures, the stability field of calaverite expands significantly. The highest Ag content obtained for sylvanite (12.0 wt.%) was synthesized at 270 °C. Moreover, the range of Ag compositions in natural sylvanites is between 9.18 and 13.05 wt.% [19]. Thus, the formation temperature of sylvanite can probably be taken as 270 °C.
According to Bortnikov et al. [20], parageneses petzite–hessite–native gold and calaverite–native gold are stable at 150–280 °C and lg fTe = –10...–19.
S2 and Te2 fugacity and temperature are important variables controlling the formation of telluride mineral assemblages [18,19,21,22,23]. According to [21], the structure of the fugacity diagram (fS2-fTe2) between 100 °C and 300 °C is essentially constant with temperature changes, except for the appearance or disappearance of some phases and shifts in absolute values of fs2 and fTe2, which makes these diagrams universal for comparing telluride assemblages in low-temperature (<350 °C) hydrothermal systems (Figure 9). In general, fluids that deposit tellurides upon cooling should fall within the area above the stability of hessite (Figure 10), whereas fluids that do not deposit tellurides are limited to fTe2 values below hessite’s stability [21].
It has been suggested that early sulfides were deposited under fS2 conditions in the equilibrium area of pyrrhotite/pyrite and chalcopyrite/bornite + pyrite and at relatively low fTe2 values. Then, they were replaced by tellurides and gold. The appearance of tellurides indicates an increase in fTe2 values to the tellurium saturation point, and fTe2 levels remained above the Au–calaverite reaction (cv-Au). Native gold deposition occurred as fTe2 values decreased to conditions below the Au–calaverite reaction (Figure 9). Thus, the general trend during the deposition of tellurides and native gold in the studied ores was a gradual decrease in fTe2 values after initial saturation with tellurium. According to Afifi, the initial tellurium saturation reflects a shift in the cooling path from the telluride undersaturation area to tellurium saturation (Figure 10). Assuming an initial source (S) at high temperature in the telluride undersaturation area and precipitation in the range between 100 and 350 °C, such a path requires an increase in fTe2 either at the source (e.g., the S-A-T path) or at the deposition site (for example, the path S-B-T) (Figure 10).
A low-temperature gold–telluride association in the mineral paragenesis of metasomatically altered rocks and as inclusions in native gold may indicate late epithermal gold–copper–porphyry systems since the literature suggests that they are a common feature of porphyry systems [24,25,26,27,28,29]. For instance, the data by Bukhanova [27] show that the final ore stage in the Malmyzh gold–copper–porphyry deposit (Khabarovsk Krai, Russia) is an overlay of the minerals of epithermal genesis on the previously formed pyrite–chalkopyrite mineralization and is related to the quartz–sericite metasomatism and accumulation of precious metal minerals, sulfosalts, tellurides, selenides, and late generations of pyrite, chalcopyrite, bornite, and chalcocite. According to Gaskov, many copper–porphyry deposits show extensive late low-temperature mineral associations. A specific feature of these associations is the presence of Ag, Pb, and Au tellurides and the formation of Bi minerals and native Bi, as well as Hg minerals [24]. Chapman et al. [26] performed a comparative analysis of gold inclusions from various deposits and concluded that Bi-Pb-Te-S minerals are indicative of gold from porphyry occurrences. On the contrary, these minerals are absent or rare in gold-bearing orogenic deposits, although galenite or hessite can occur locally [26].
Previously, besides gold–copper–porphyry deposits, an iron–oxide–gold–copper (IOCG) type was predicted for the studied area. Kuznetsov analyzed the geological and minerogenic conditions of the Anabar Shield, its facies formation, and the presence of foredips and outlier grabens, as well as geochemical data, and suggested probable iron–oxide–gold–copper (IOCG) mineralization [30]. IOCG and porphyry deposits share many similarities in terms of hydrothermal mineral sequences, spatial relationships with same-age intrusions, and geochemistry [31]. Skirrow [32] subdivides IOCG deposits into Cu-Au-Fe (CGI) with higher magnetite content and Fe-Sulphide-Cu-Au (ISCG) characterized by higher iron sulphide content (15–60 wt.%). The key differences according to [32] are the higher quartz content but lower magnetite content and lower hydrothermal carbonate and apatite content in porphyry deposits compared to IOCG deposits. In our case, magnetite is extremely rare, at least at this stage of research. In addition, the content of sulfides in ore-bearing rocks does not exceed 5%.
Thus, a brief analysis of the probable genetic types of the ore formations of the Khaptasynnakh zone allows us to assume that they are related to the gold–copper–porphyry system. However, considering the controversial nature of some assumptions regarding the genetic type of ore formations, as well as the very early stage of research, we leave this question open.

4.2. Stages of Native Gold Formation in Ore Occurrences and Genesis of Multiphase Particles with Composition Ag—Au—Cu

The fineness of native gold in metasomatites from the trenches varies between 550‰ and 613‰. It is represented by very small sizes and is associated mainly with hessite. No admixtures were identified. Native gold in quartz metasomatites from eluvial rocks is characterized by a fineness variation between 794‰ and 926‰. At the same time, relatively low fineness (<800‰) was detected in single particles, while medium-grade (800‰–900‰) and high-grade (>900‰) gold constituted 49% and 51%, respectively. They contain Cu impurities ranging from 0.85 to 7.87%. This gold is associated with tellurides of the Au, Pb, Bi, and chalcocite–bornite complex (Figure 11).
On the binary (Au and Ag) and ternary diagrams (Ag-Au-Cu), as well as the cumulative graph of Ag contents, two clusters are recognized, apparently indicating the deposition of native gold occurring at different times during the formation of ores (Figure 12). It is suggested that some of the gold (low grade) entered the system during early potassic metasomatism. Higher-grade gold associated with siliceous metasomatism is the result of its additional mobilization by fluid of the late stages of ore formation. At the same time, processes of remobilization of low-grade gold took place, which led to the removal of Ag. Such dependence of gold fineness on the stage at which it was formed is observed at the Biely Vrch gold–copper–porphyry deposit in the Slovak Republic [33]. Cu impurity is probably related to its capture from copper-bearing sulfides—chalcocite and bornite—which in turn were formed by the replacement of chalcopyrite. This is evidenced by a noticeable decrease in the content of chalcopyrite in the siliceous metasamotites of eluvial rocks compared to metasomatites exposed by trenches.
Naturally occurring particles of high copper gold, as a rule, are multiphase and are represented by regular intergrowths of decomposition products of a solid solution, granular intergrowths of homogeneous phases, or their combinations [34,35,36,37,38]. In our case, high-copper gold occurs in the form of veinlets in the intergranular spaces of gold with fineness 909‰ or along its peripheral part (Figure 7h,i), as well as in the form of intergrowths of homogeneous phases (Figure 13).
Analyses of literary data showed that there are several options for the formation of high-copper gold. According to Spiridonov and Pletnev [34], Cu-Au systems are developed in the weathering zone of hydrothermal gold–telluride deposits as oxidation products of plumbotellurides Au-Cu-Fe. Murzin and Varlamov [38] studied an aggregate of Cu-Au phases formed during the decomposition of fahlore under hypergenesis conditions. According to Onishchenko and Kuznetsov [36], native gold, represented by Au-Ag-Cu solid solutions, at temperatures below 220 °C, depending on its initial composition, remains homogeneous or disintegrates into two or three phases. The equilibrium phases during decomposition into two phases are Au3Cu and Au-Ag solid solutions or AuCu and Au-Ag solid solutions, when decomposed into three phases—Au3Cu, AuCu and Au-Ag solid solutions. It is likely that, in our case, this is precisely the method of formation of high-copper gold, since its two- and three-phase structure is revealed (Figure 13 and Figure 14). In addition, neither fahlore nor Au-Cu-Fe plumbotellurides were identified at the ore occurrences of the Khaptasynnakh zone to date.

4.3. The Ore Body–Placer System

It has been mentioned above that the area of interest hosts gold placer deposits. Earlier, we studied the typomorphic features of placer gold from the Borosku Unguokhtaakh and Ulakhan Khaptasynnakh [1]; the main characteristics are provided in Figure 15 and Figure 16.
Additionally, native gold from the Levy Ulakhan Khaptasynnakh River was examined (Figure 1 and Figure 17). Grain size distribution of the placer gold is as follows: 1–2 mm—2%; 0.5–1 mm—38%; 0.25–0.5 mm—38%; 0.25 mm—22%. The shapes are cloddy (30%), lamellar (10%), rod-like (first%), and poorly rounded angular–cloddy (60%). The surface of well-rounded gold is fine–shagreen, and the surface of poorly rounded gold is poorly smoothed and pitted–knobby. Fineness ranges quite widely: extremely high (999‰–951‰)—63%; high (950‰–900‰)—10%; medium (899‰–800‰)—7%; relatively low (799‰–700‰)—10%; and low (699‰–400‰)—10%. Also, a Cu impurity value of up to 2% was identified. Mineral inclusions (pyrrhotite, hessite, tellurobismuthite, and galena) in poorly rounded particles of the >0.5 mm fraction were found (Figure 17).
Most of the studied gold from these three placers has virtually no high-grade rim, except for individual particles (Figure 18). Such a high-grade rim is easily identified by etching with a chemical agent based on aqua regia.
A comparative analysis of mineral inclusions in the investigated gold placers and ore mineral paragenesis suggests that the gold–sulphide occurrences of the Khaptasynnakh zone are gold-bearing sources of the placers.

5. Conclusions

  • For the first time, the results of our study on the mineralogical and geochemical features of ore gold and mineral parageneses at the Khaptasynnakh ore occurrences, located in the central part of the Billyakh zone of tectonic melange in the Anabar Shield, provide grounds for identifying an epithermal gold–telluride type of mineralization on the Anabar Shield. The estimated temperature of the formation of gold–telluride minerals is preliminarily estimated to be in the range of 150–280° C. The general trend during the deposition of tellurides and native gold in the studied ores was a gradual decrease in fTe2 values after initial saturation with tellurium.
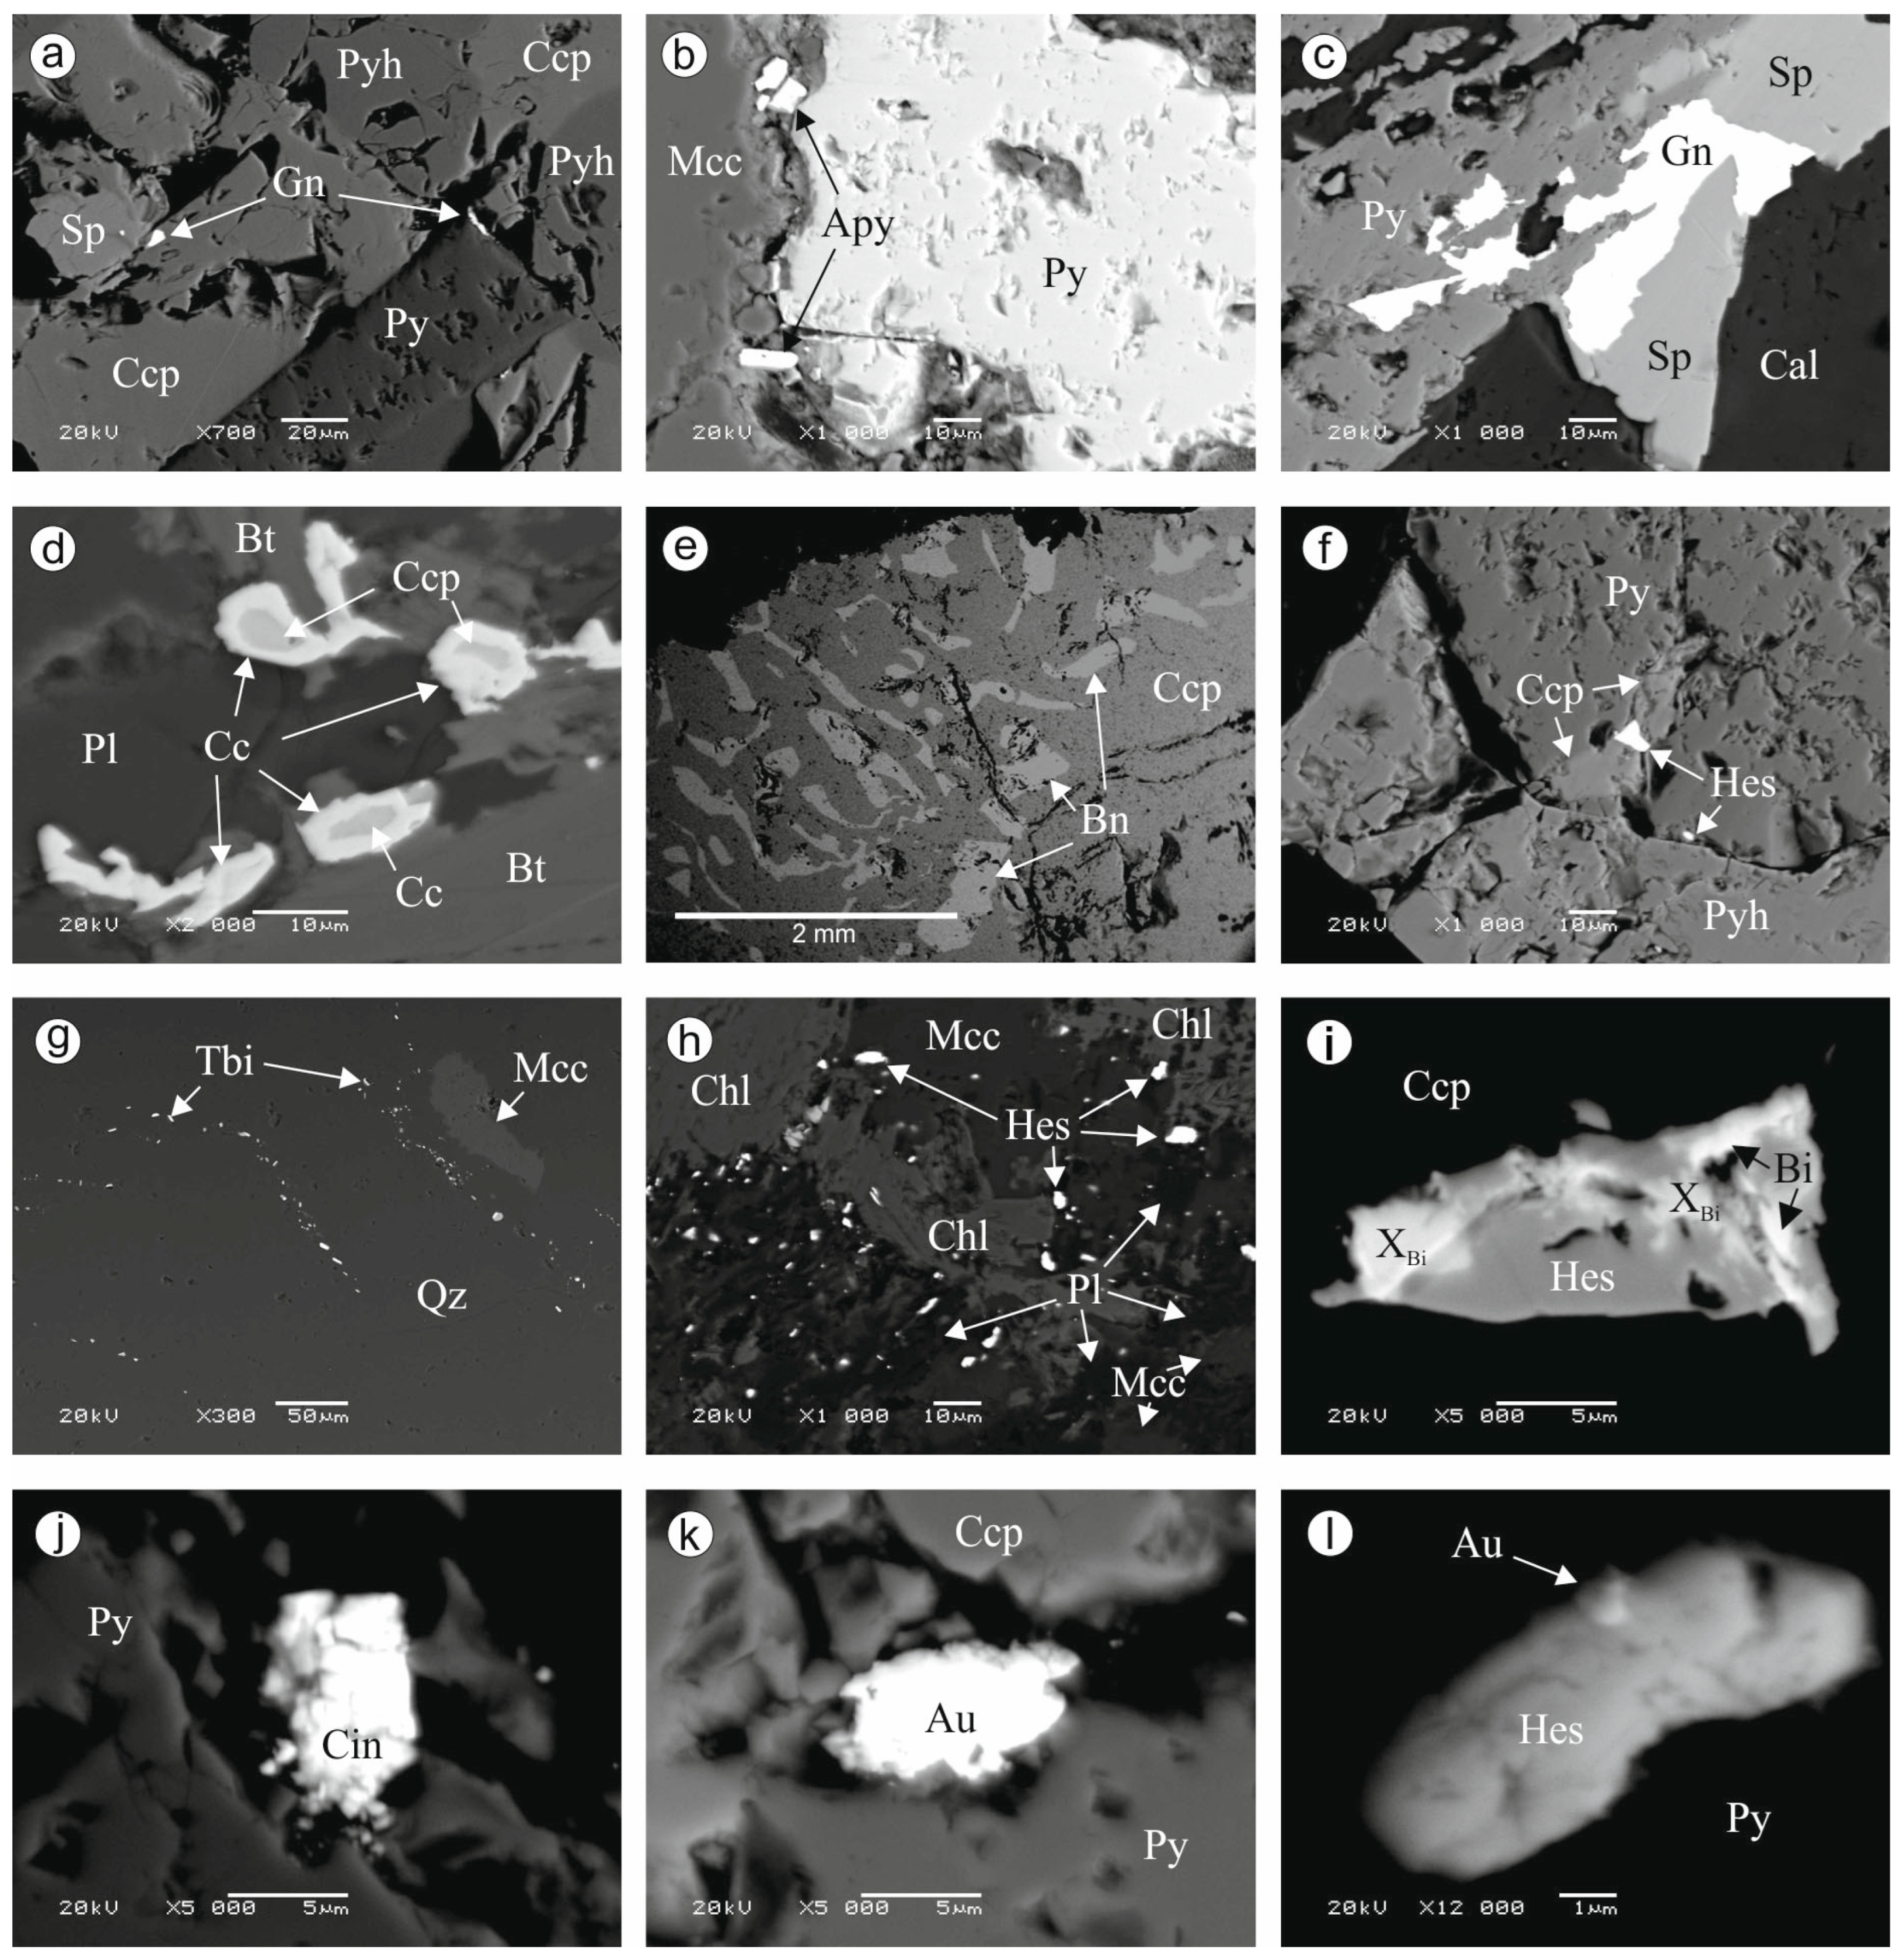
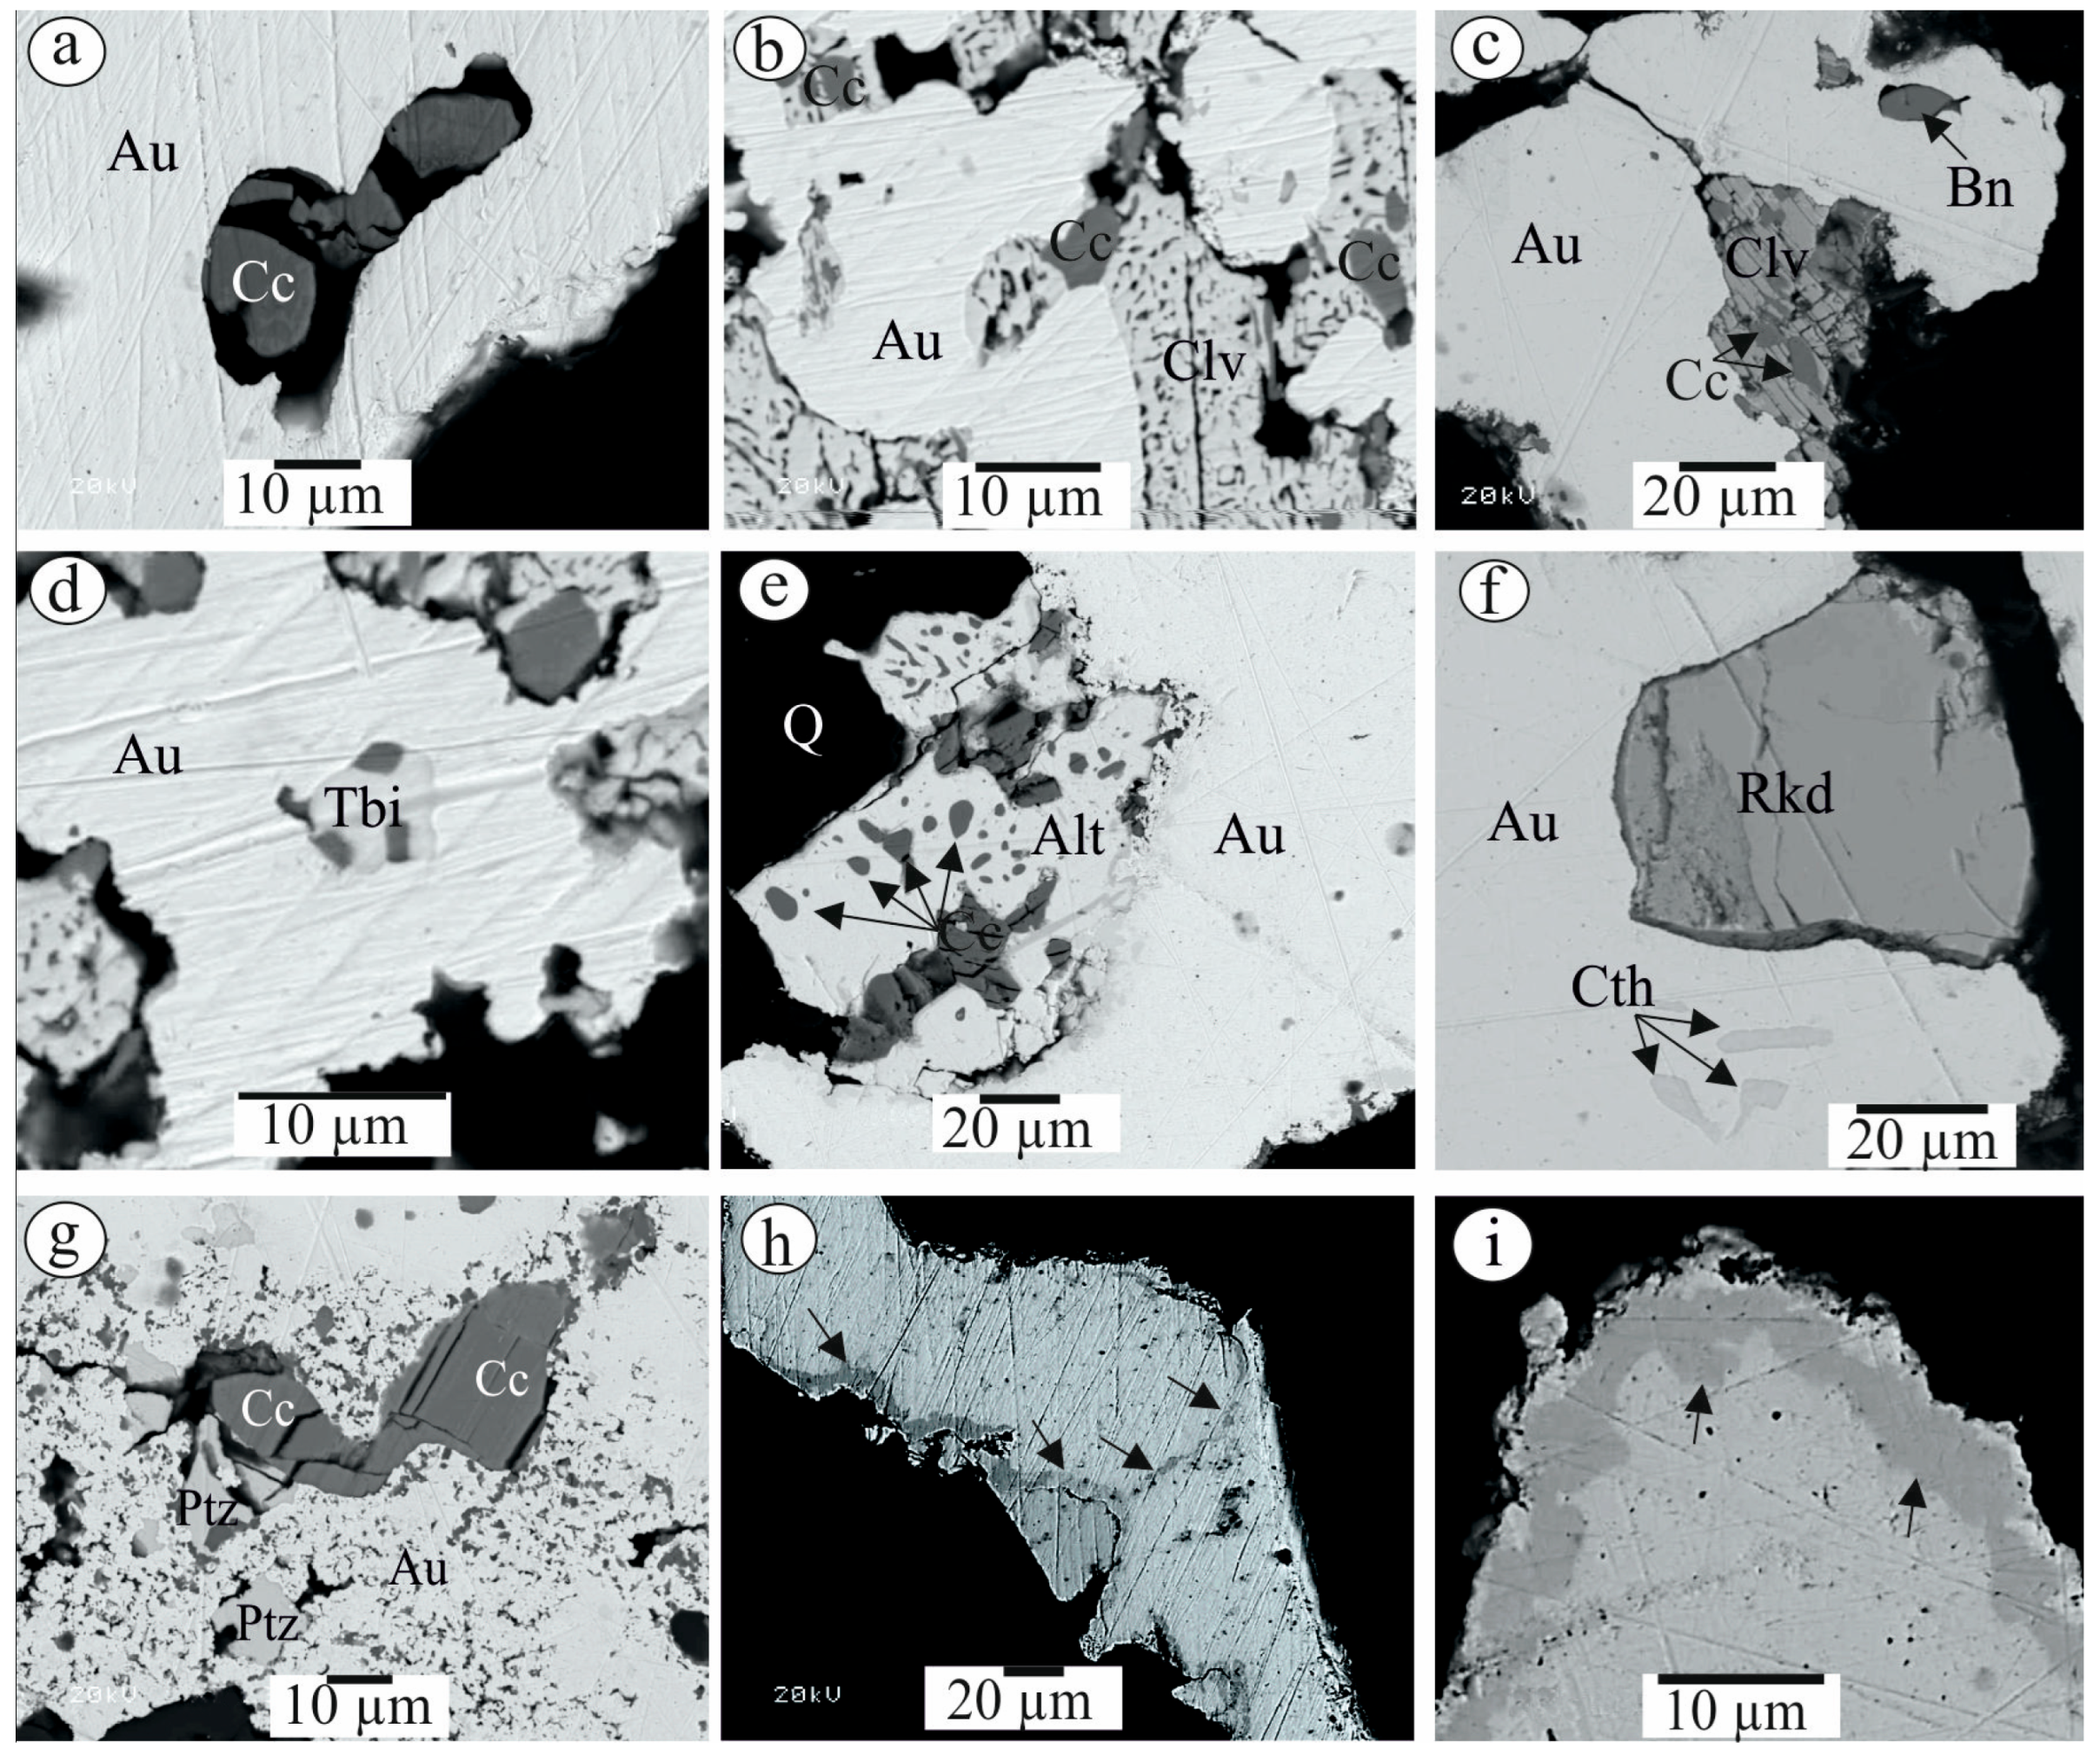
  • The sequential formation of early sulfides—pyrite, pyrrhotite, and arsenopyrite—and late sulfides—chalcopyrite, sphalerite, galena, bornite, and chalcocite—and the formation at the final stage of gold–telluride mineralization was determined. Gold occurs in association with chalcocite and tellurides, and it is also a component of calaverite and sylvanite.
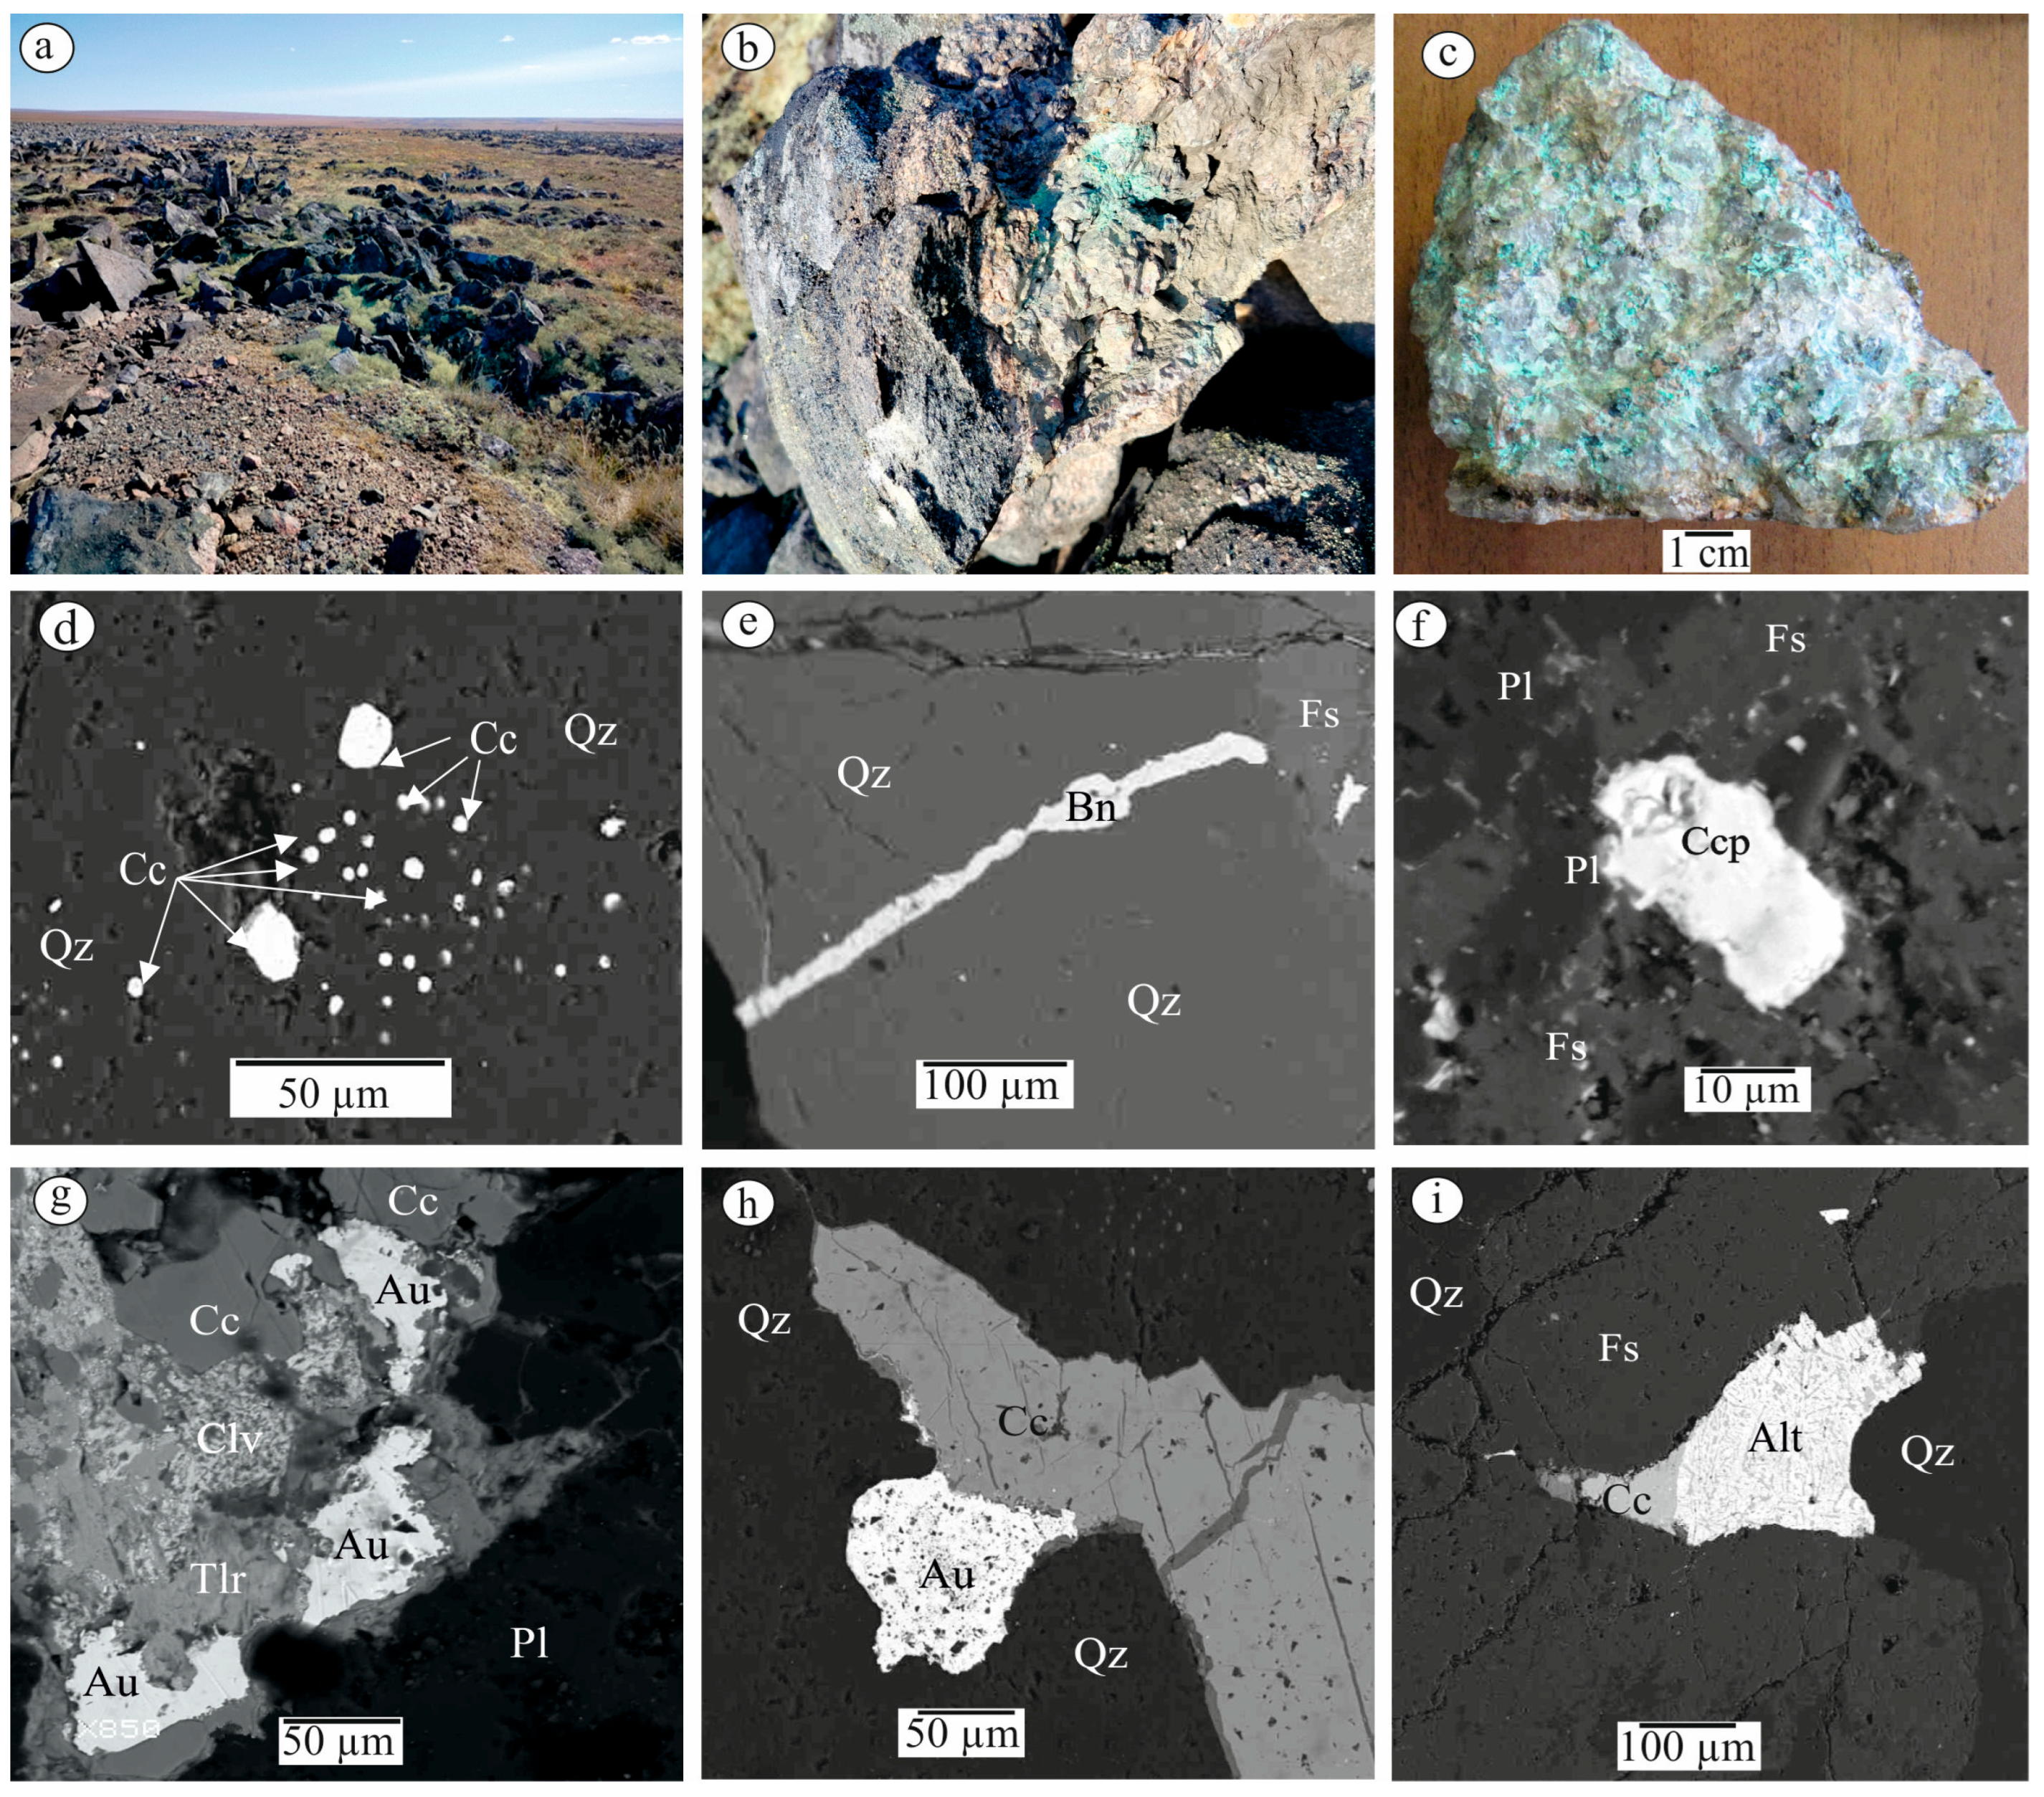
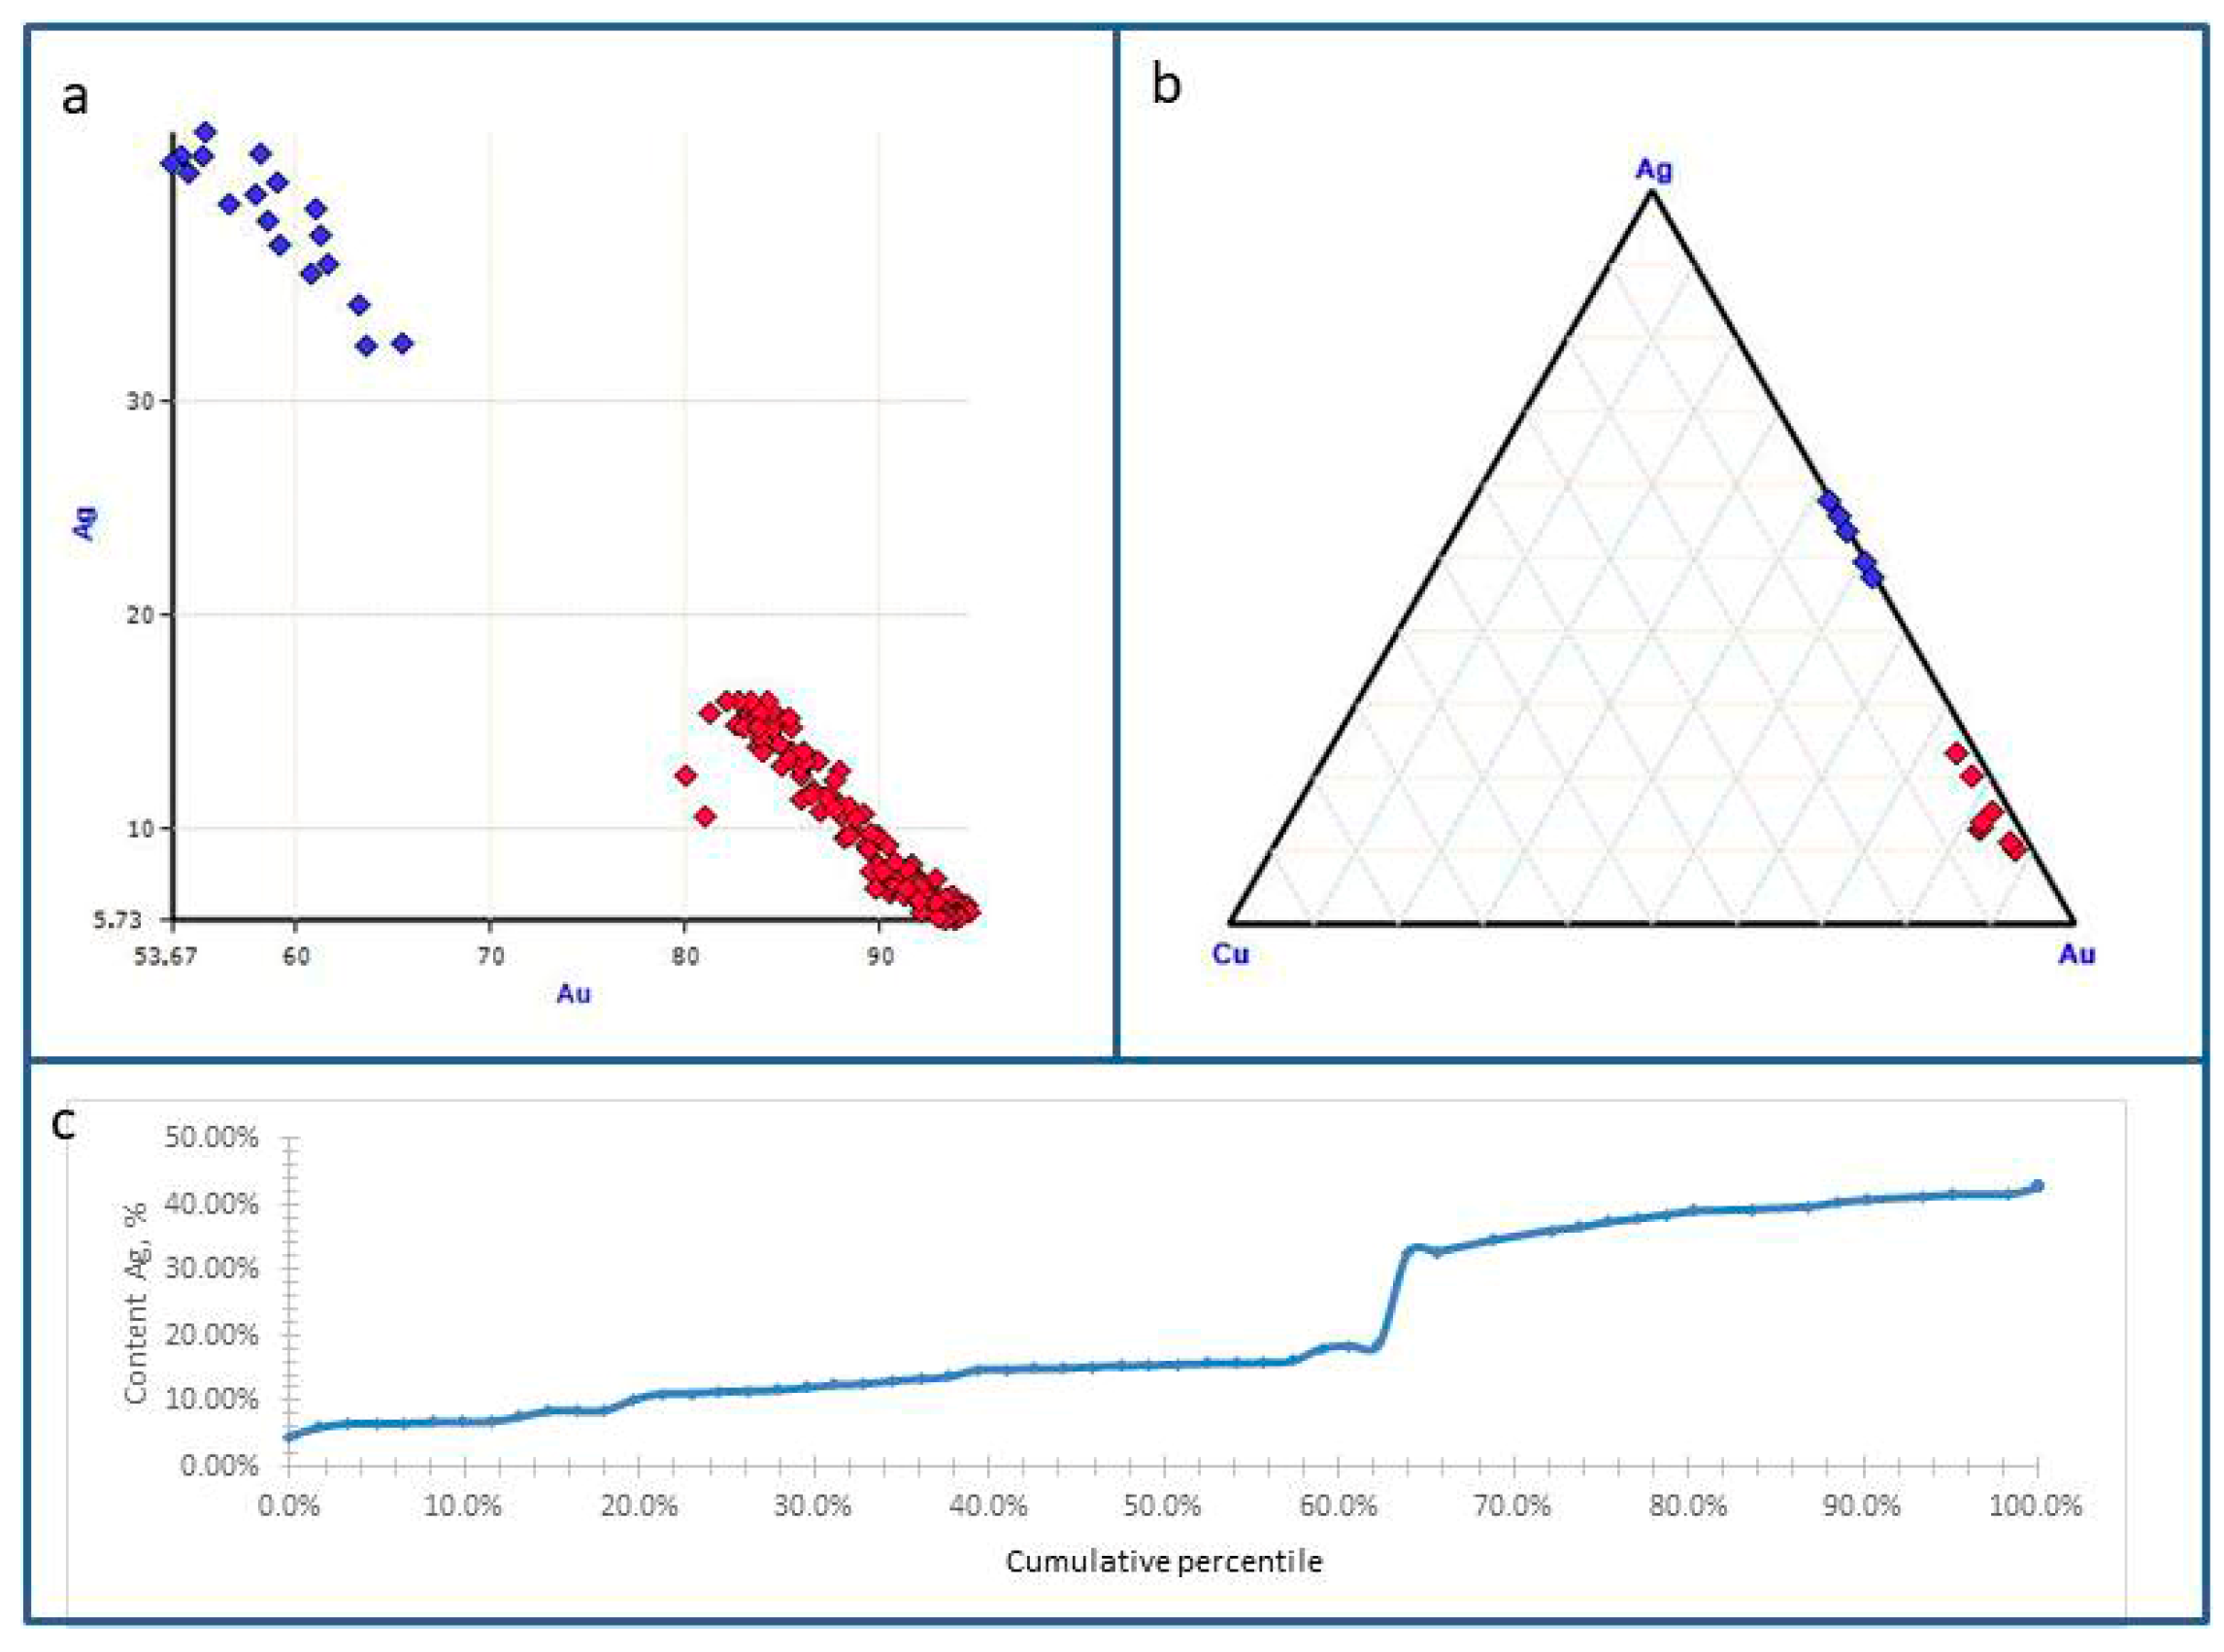
  • The chemical and petrographic sequence of ore gold suggests the two-stage formation of the studied gold mineralization. It is suggested that part of the gold (low grade) entered the system during early potassic metasomatism. Higher-grade gold related to siliceous metasomatism is the result of its additional mobilization by fluids during the late stages of ore formation. At the same time, processes of low-grade gold remobilization took place, which led to the removal of Ag.
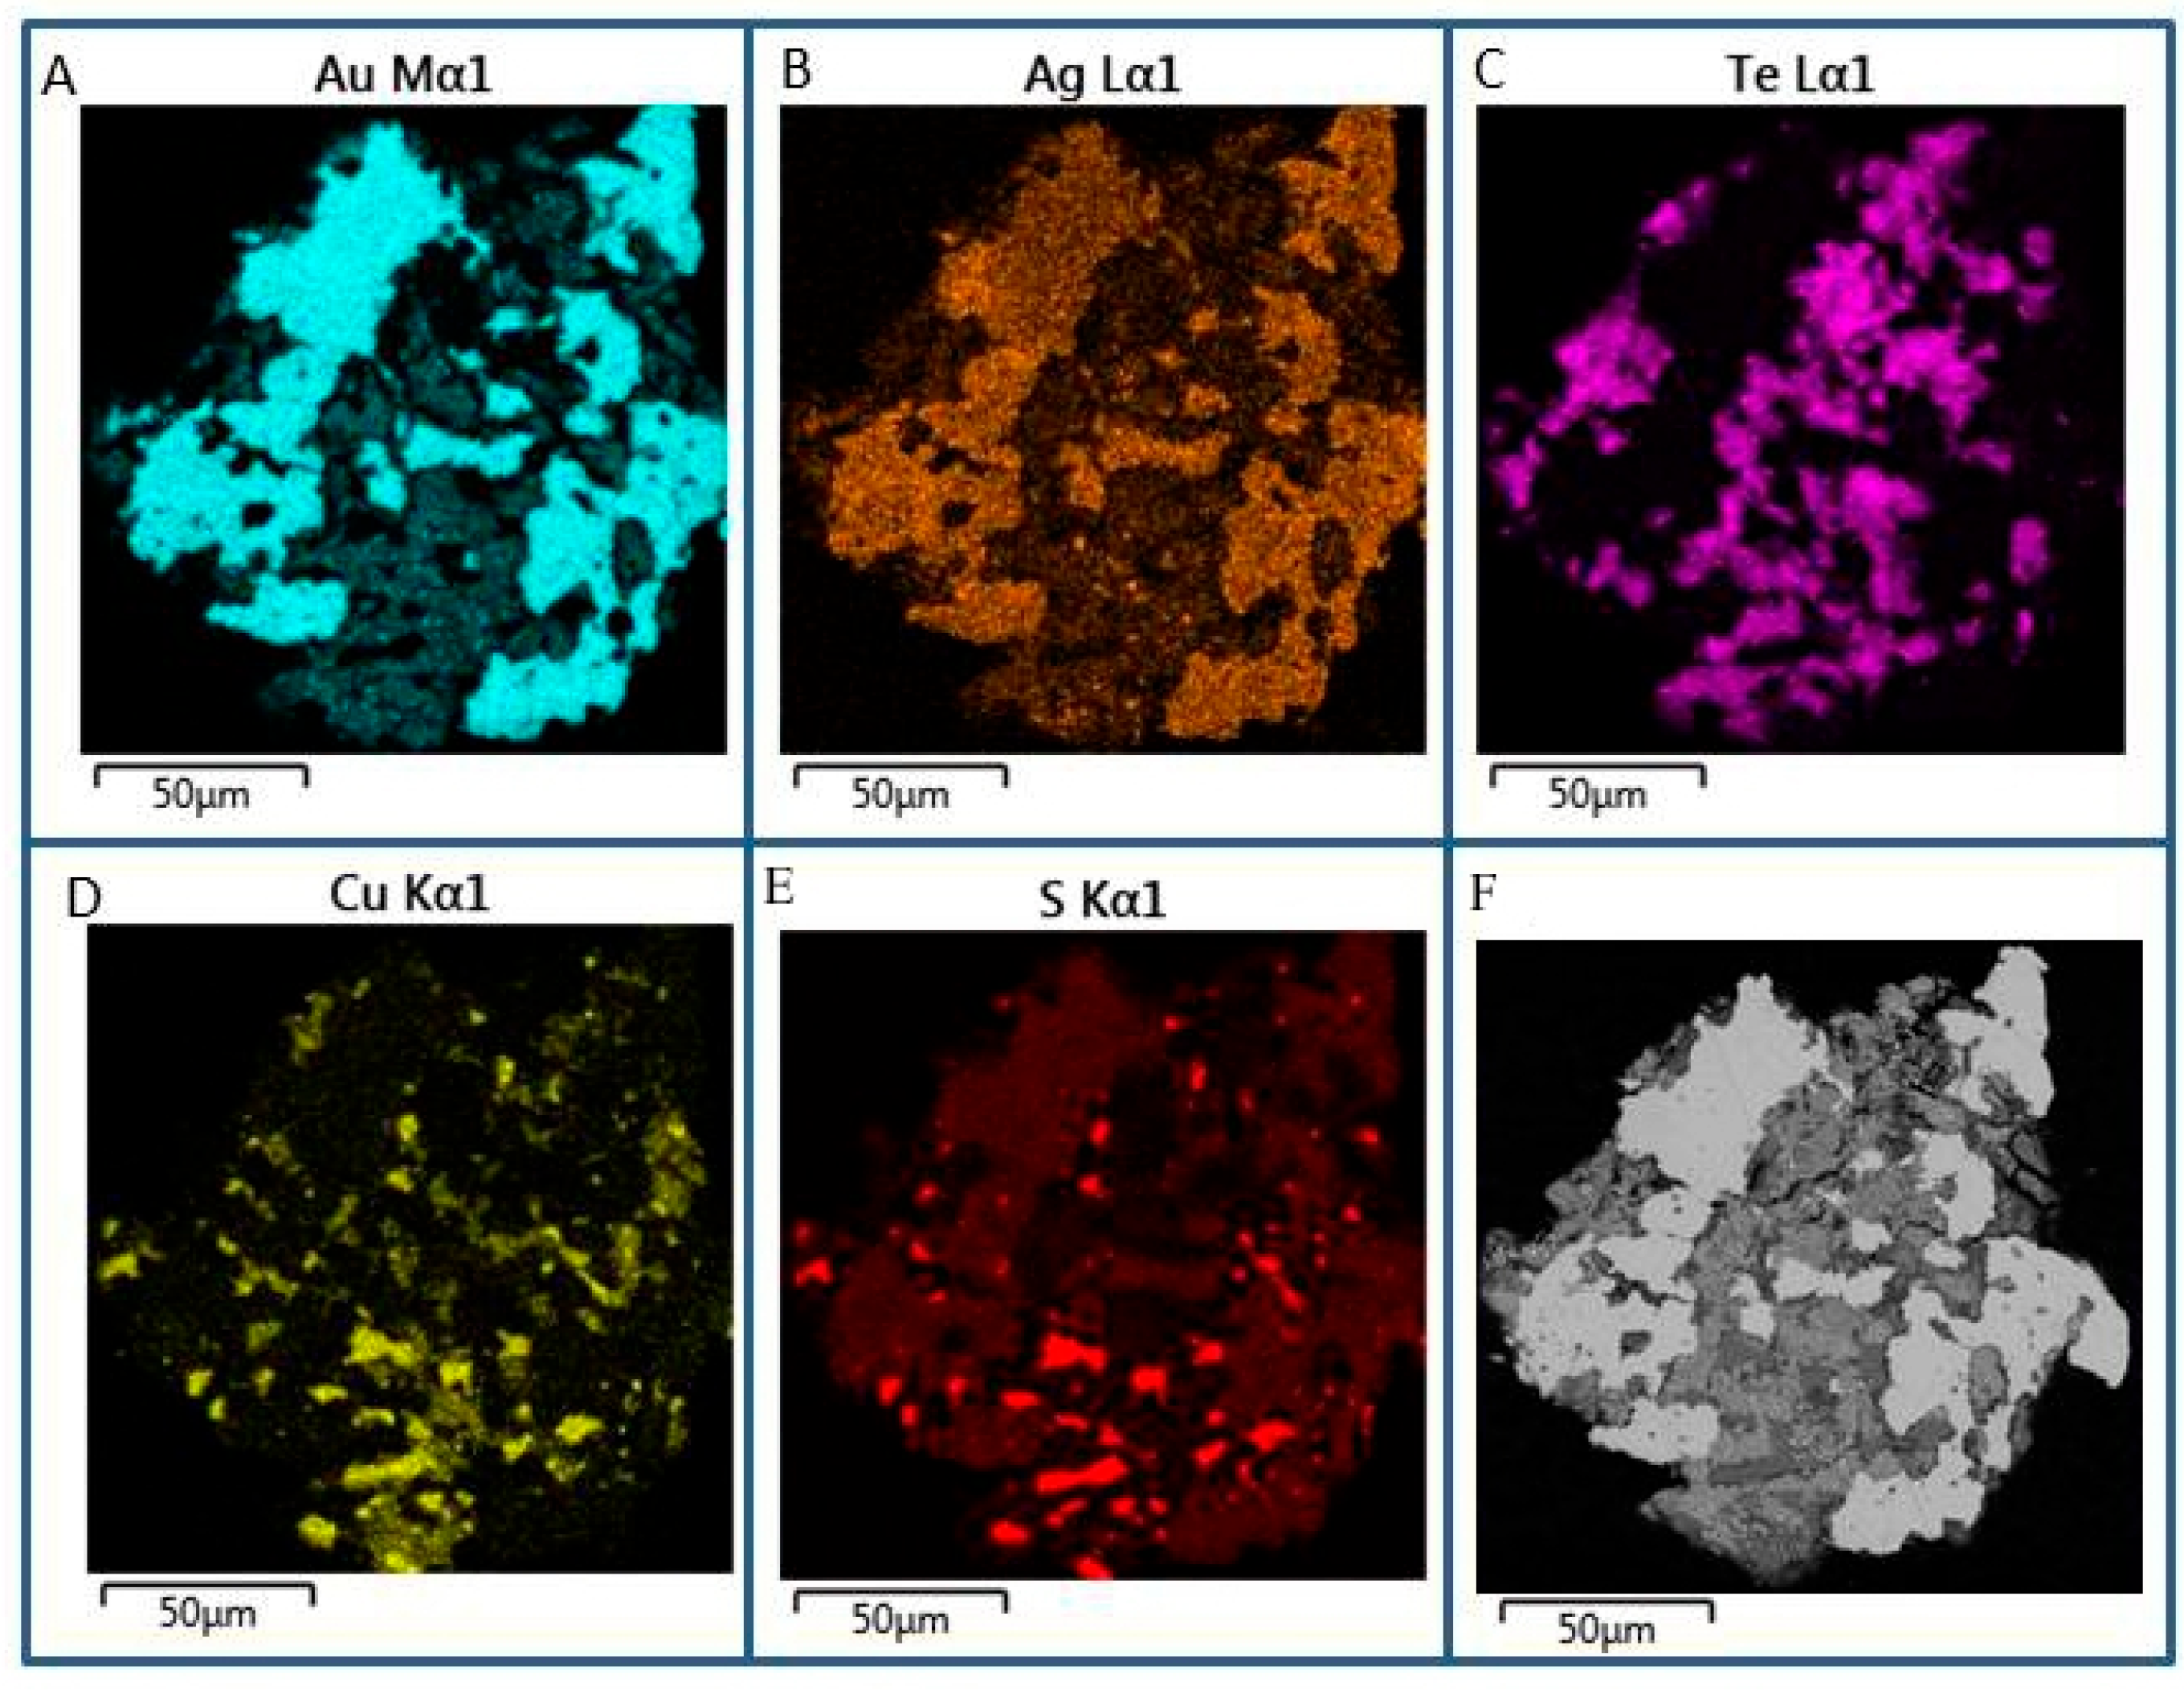
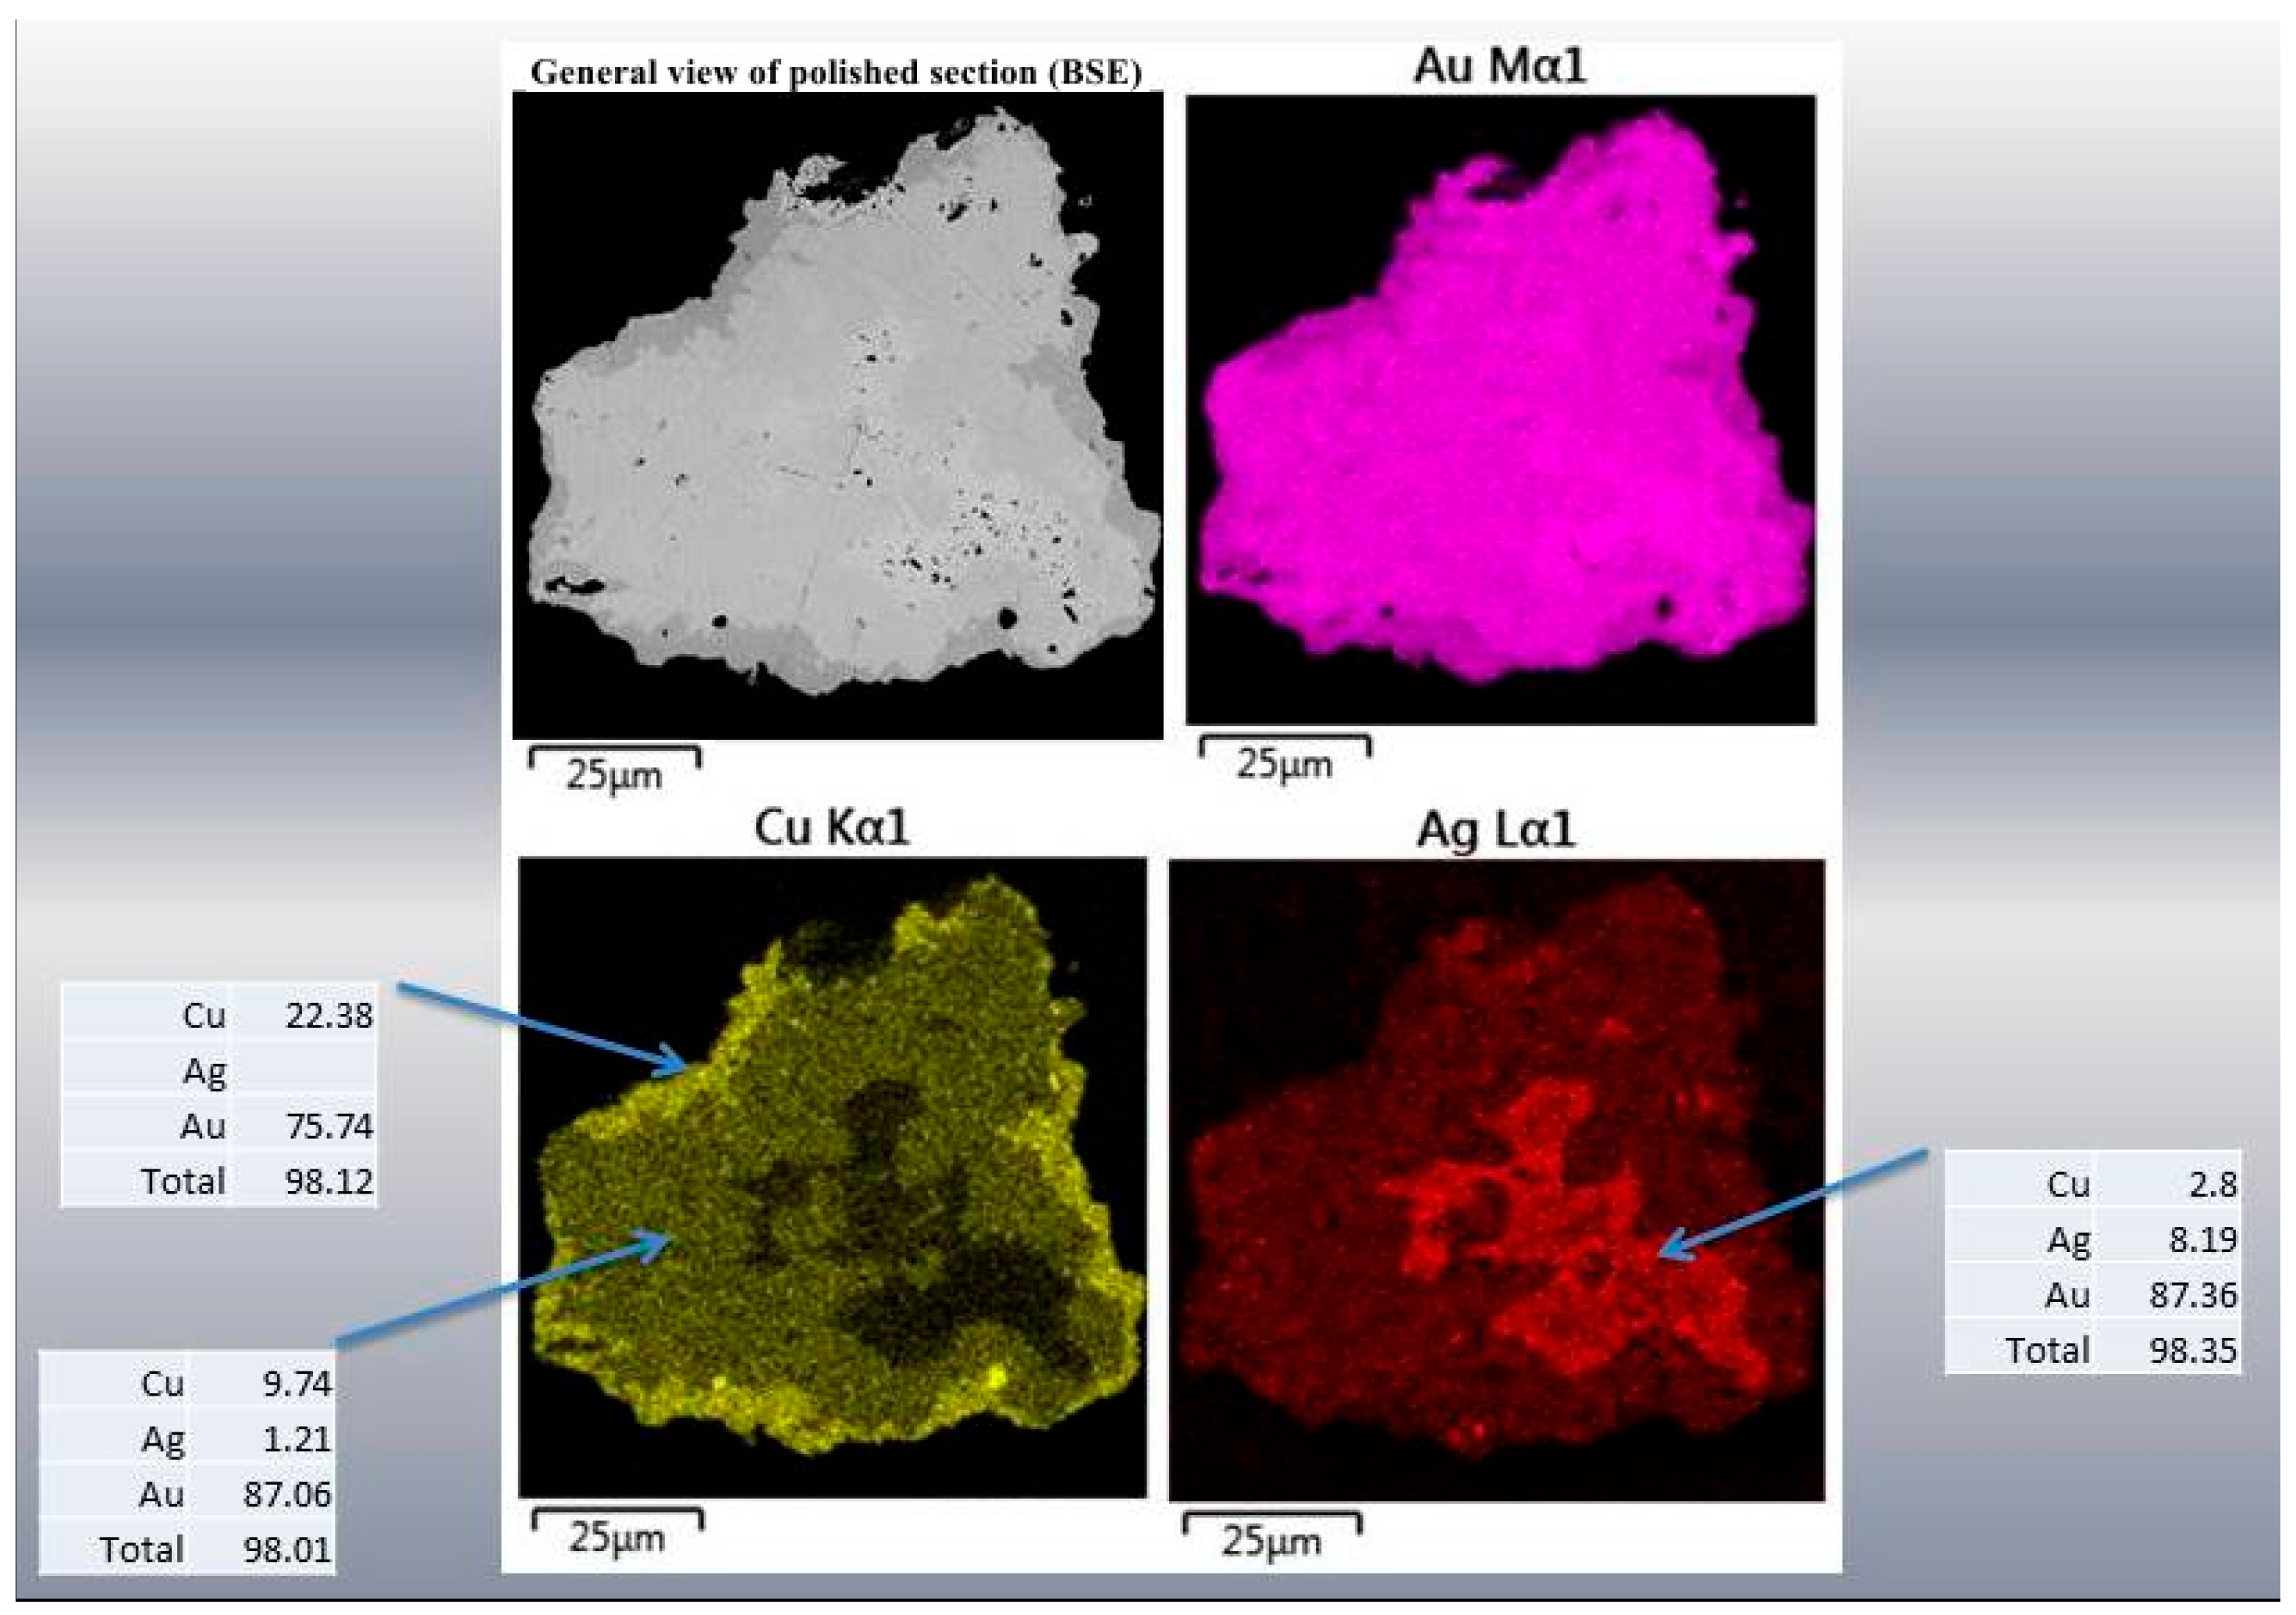
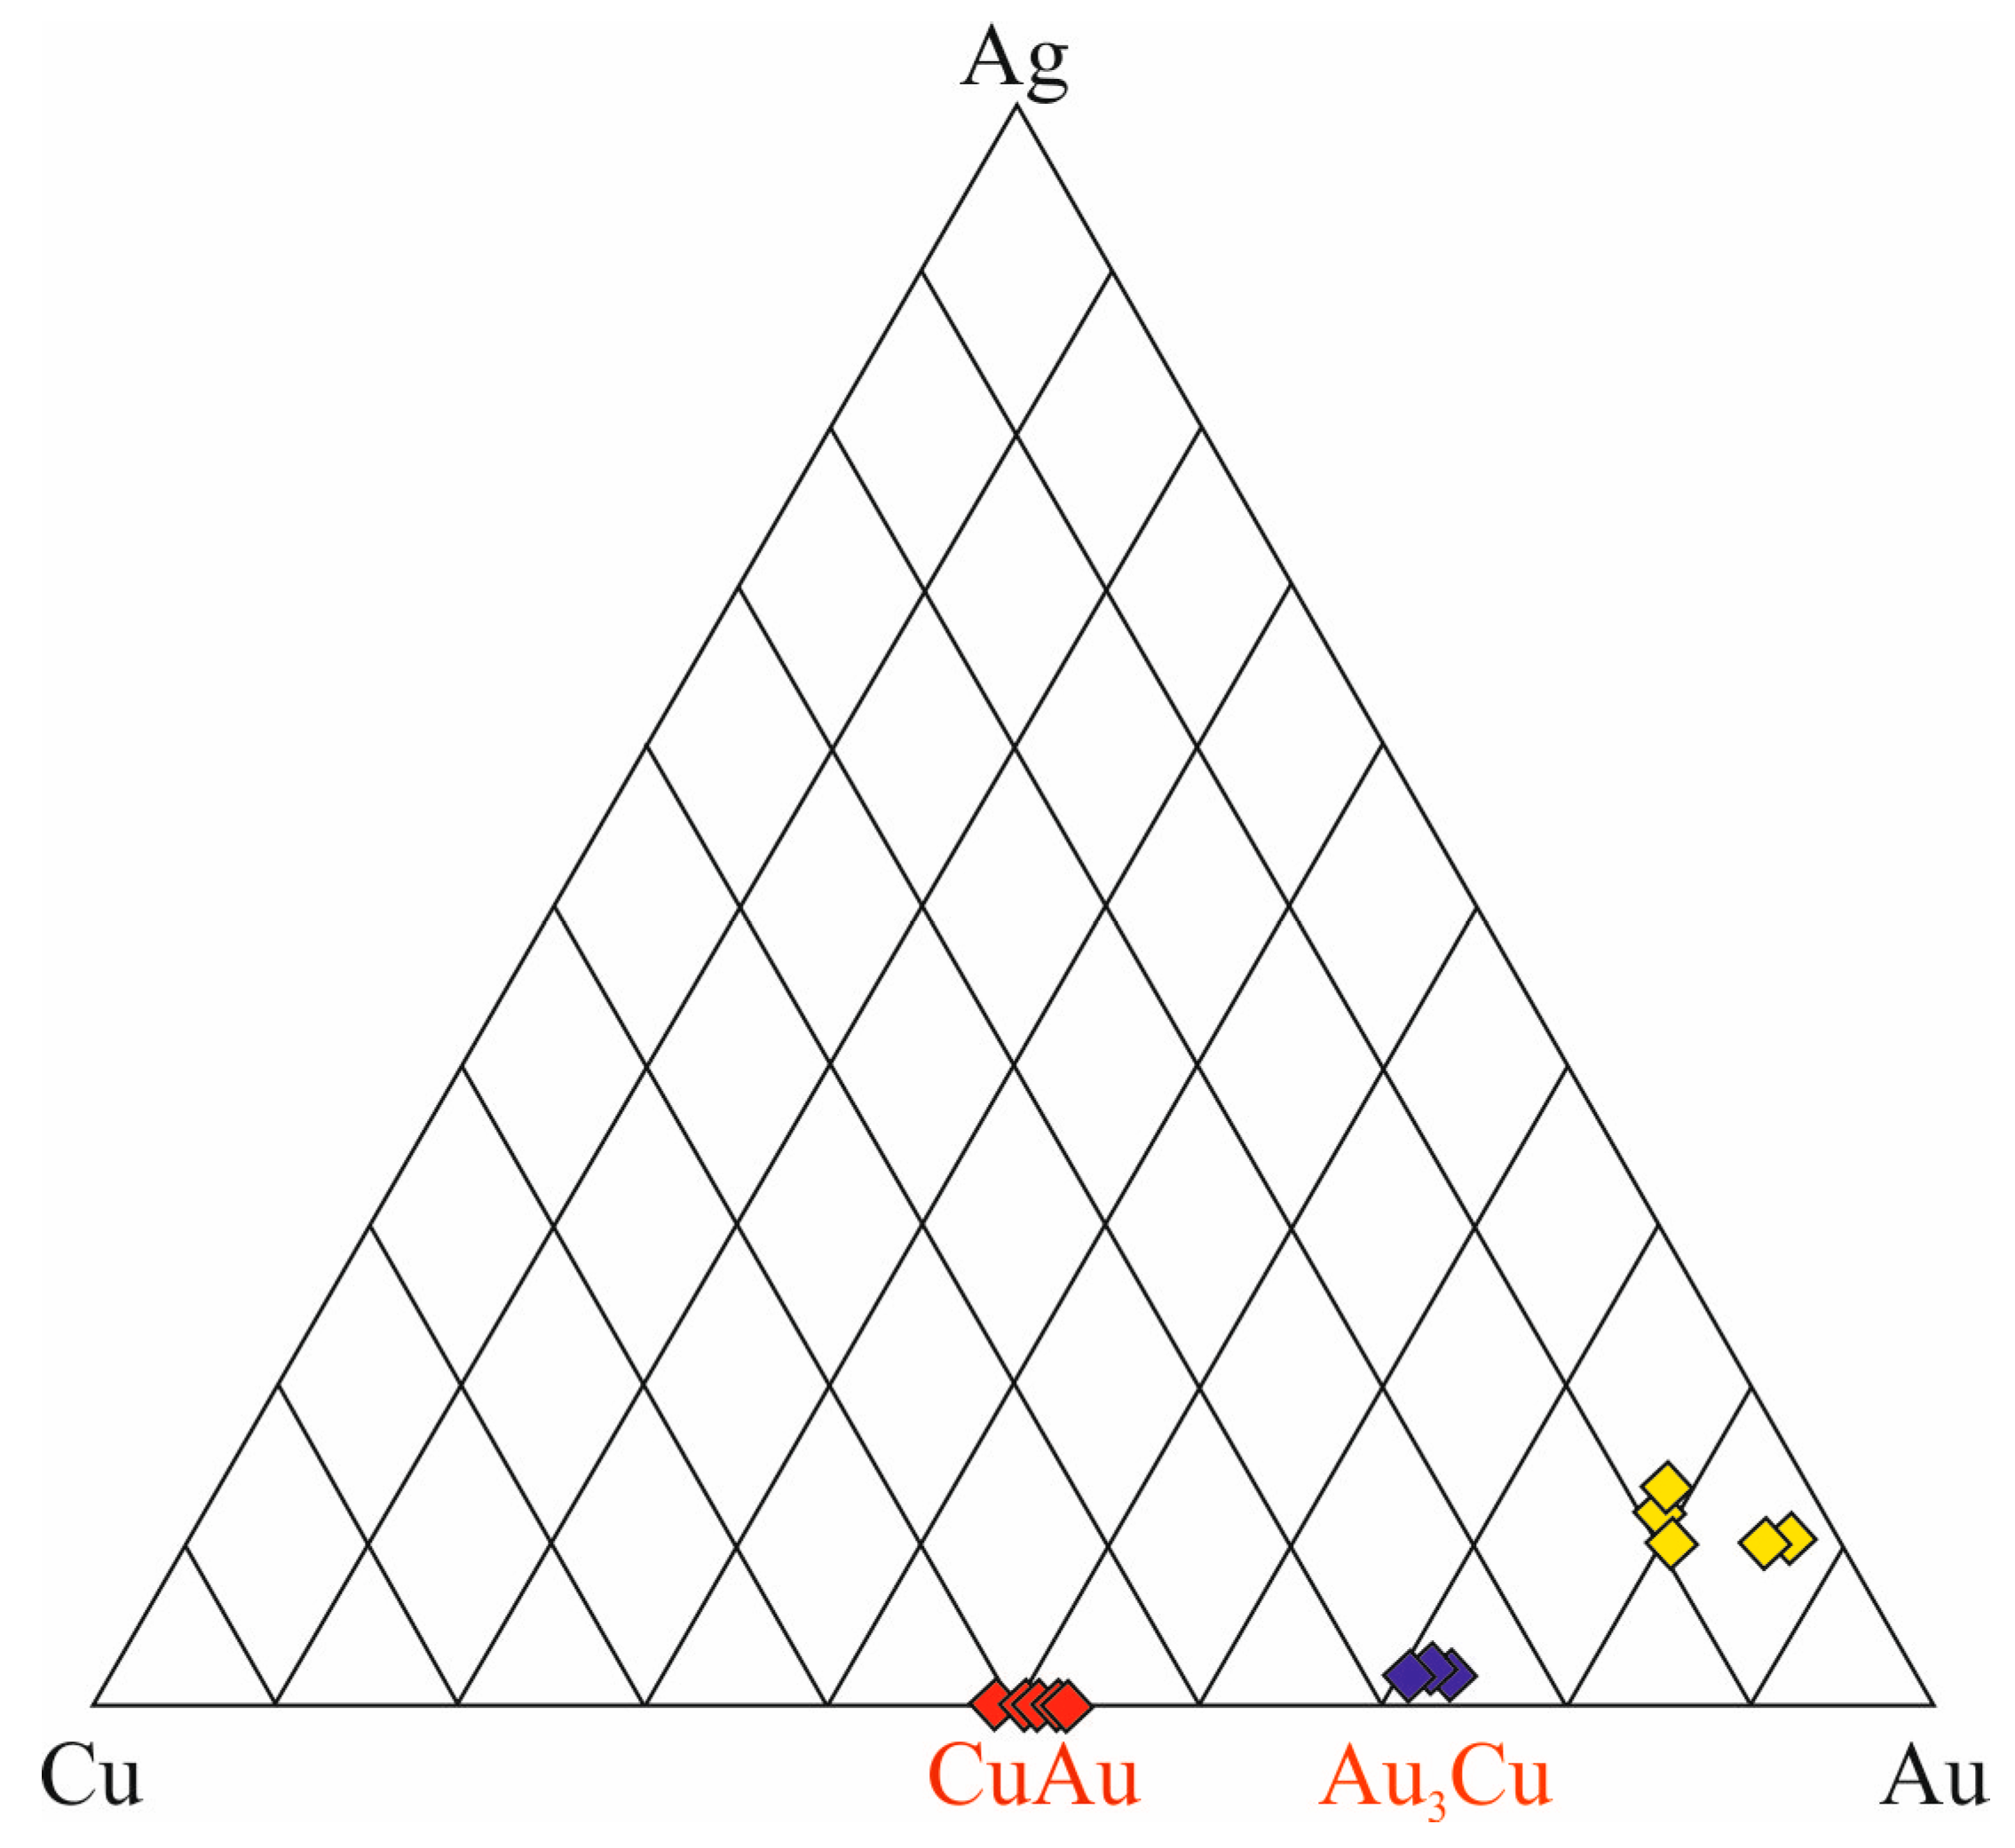
  • The detected particles consisting of three phases, Au3Cu, AuCu, and Au-Ag solid solutions, were presumably formed by the decomposition of a homogeneous Au-Ag-Cu solid solution at temperatures below 220° C.
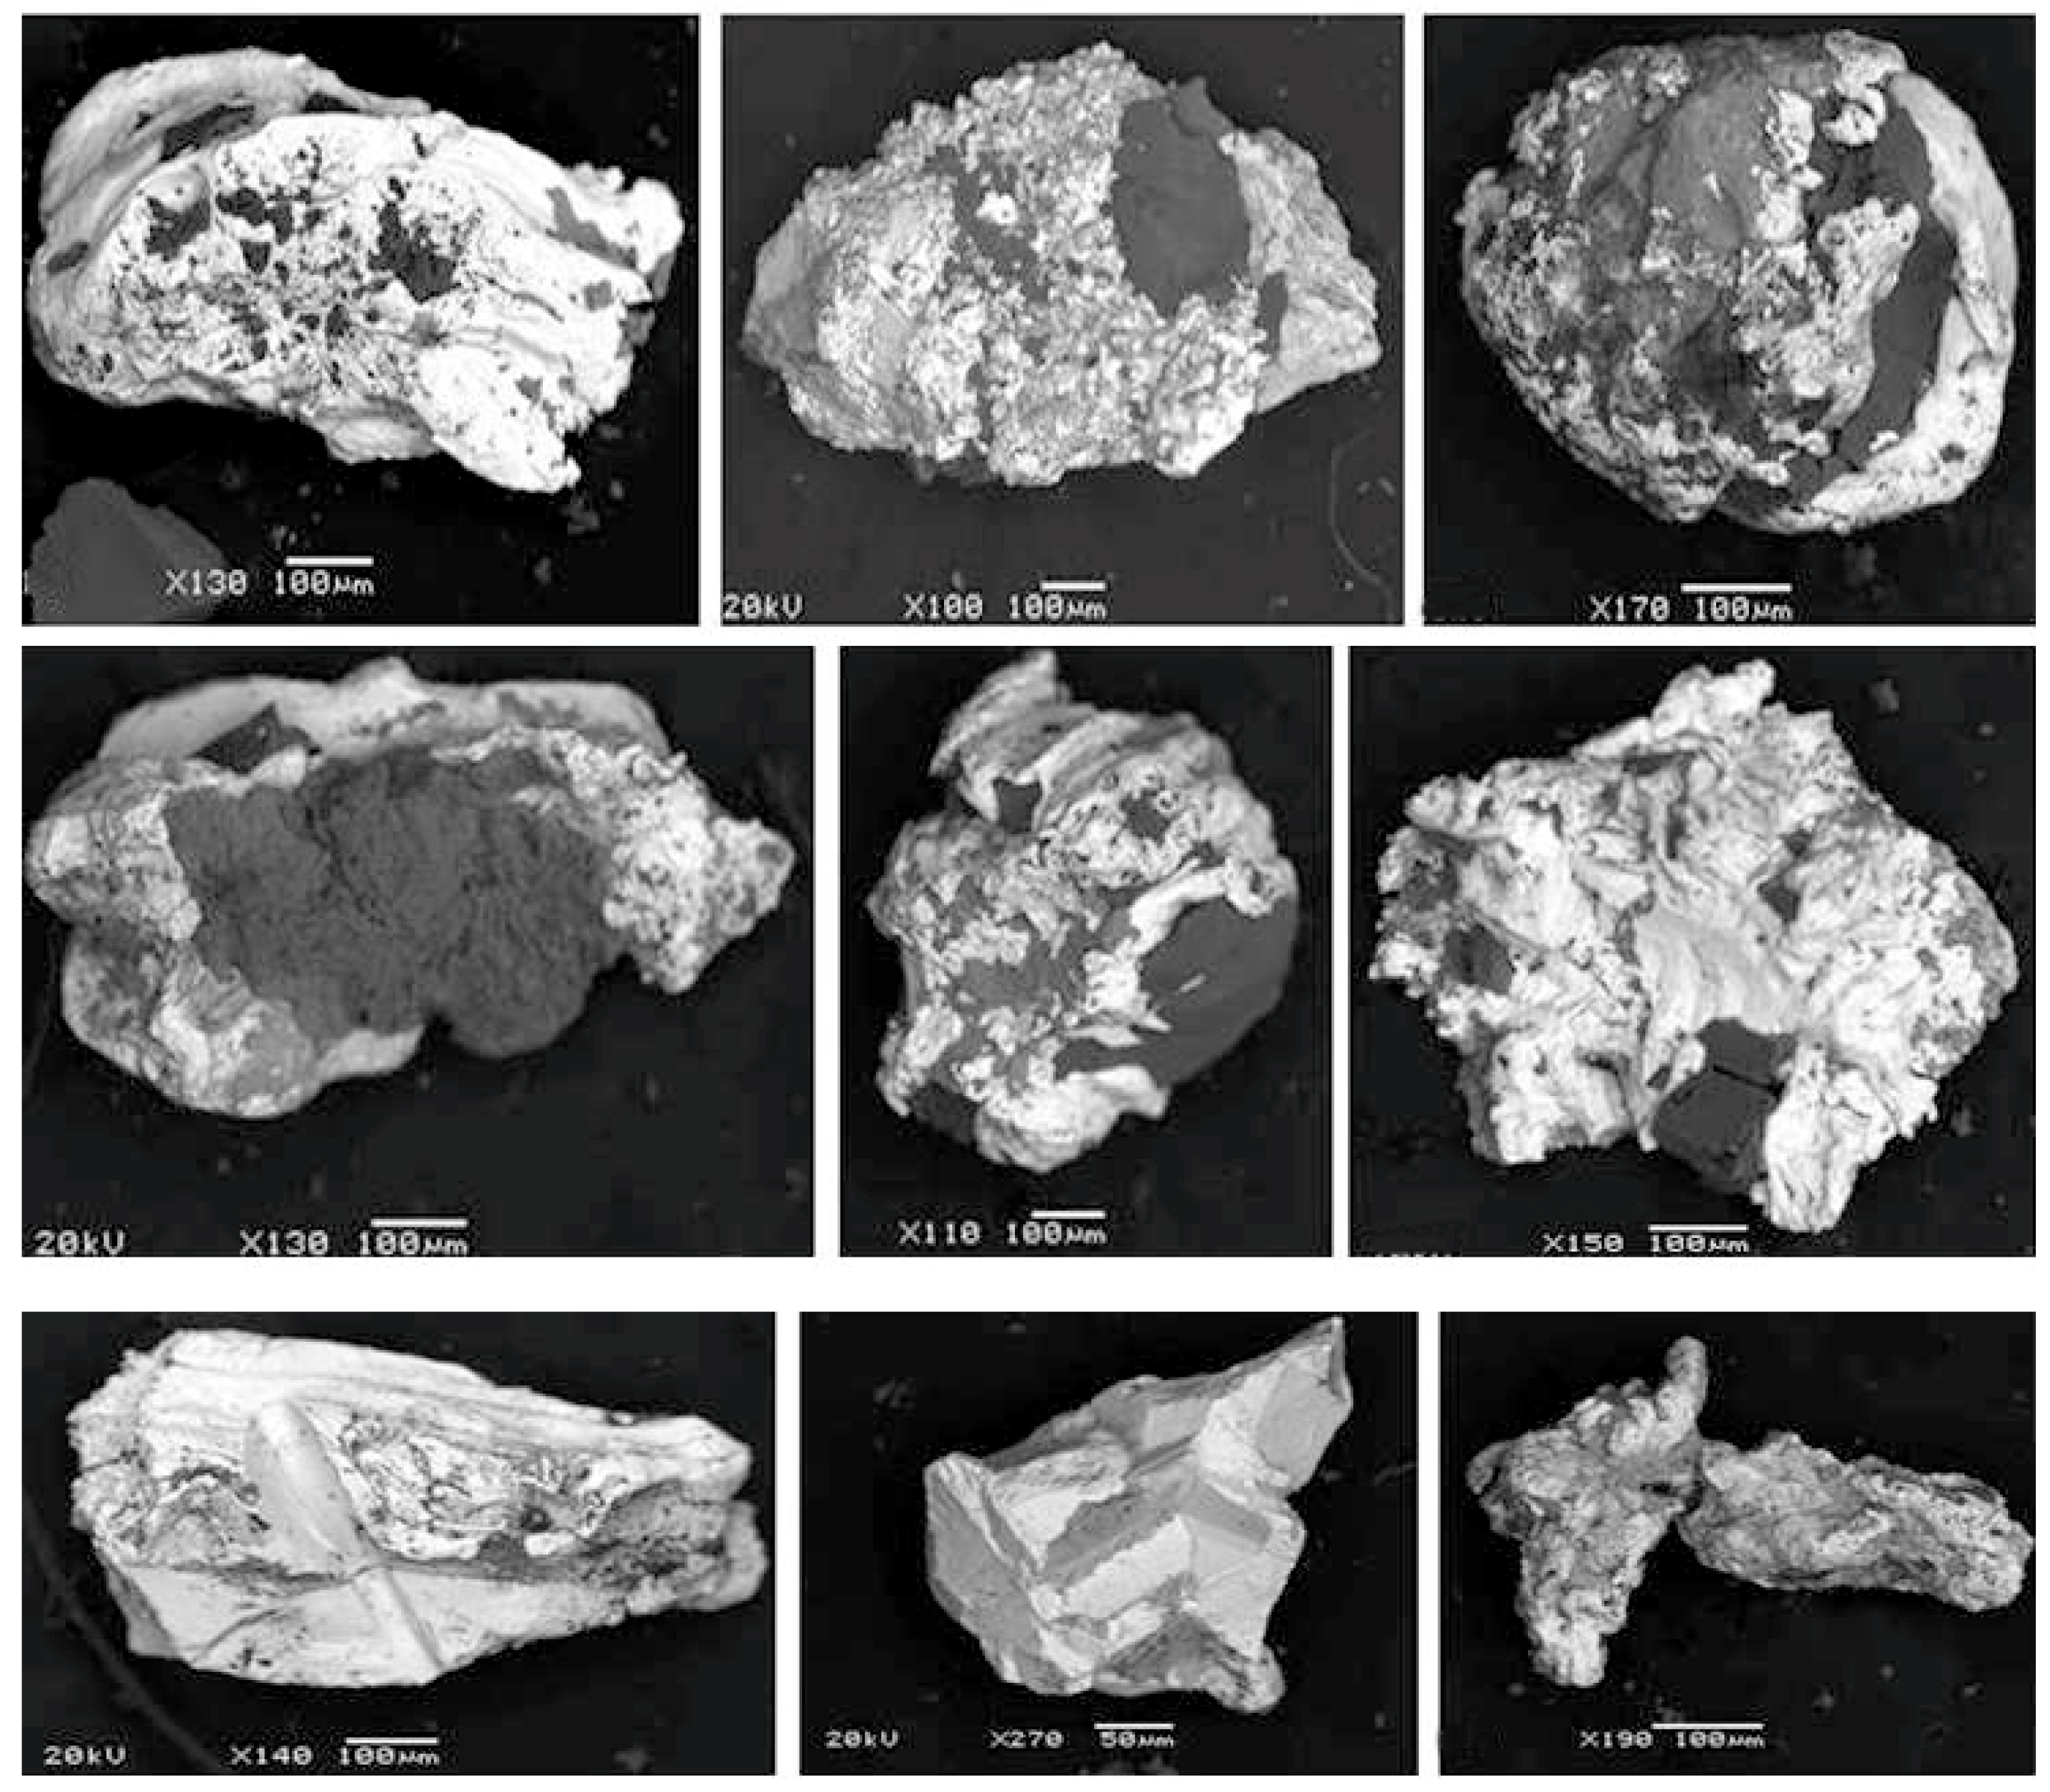
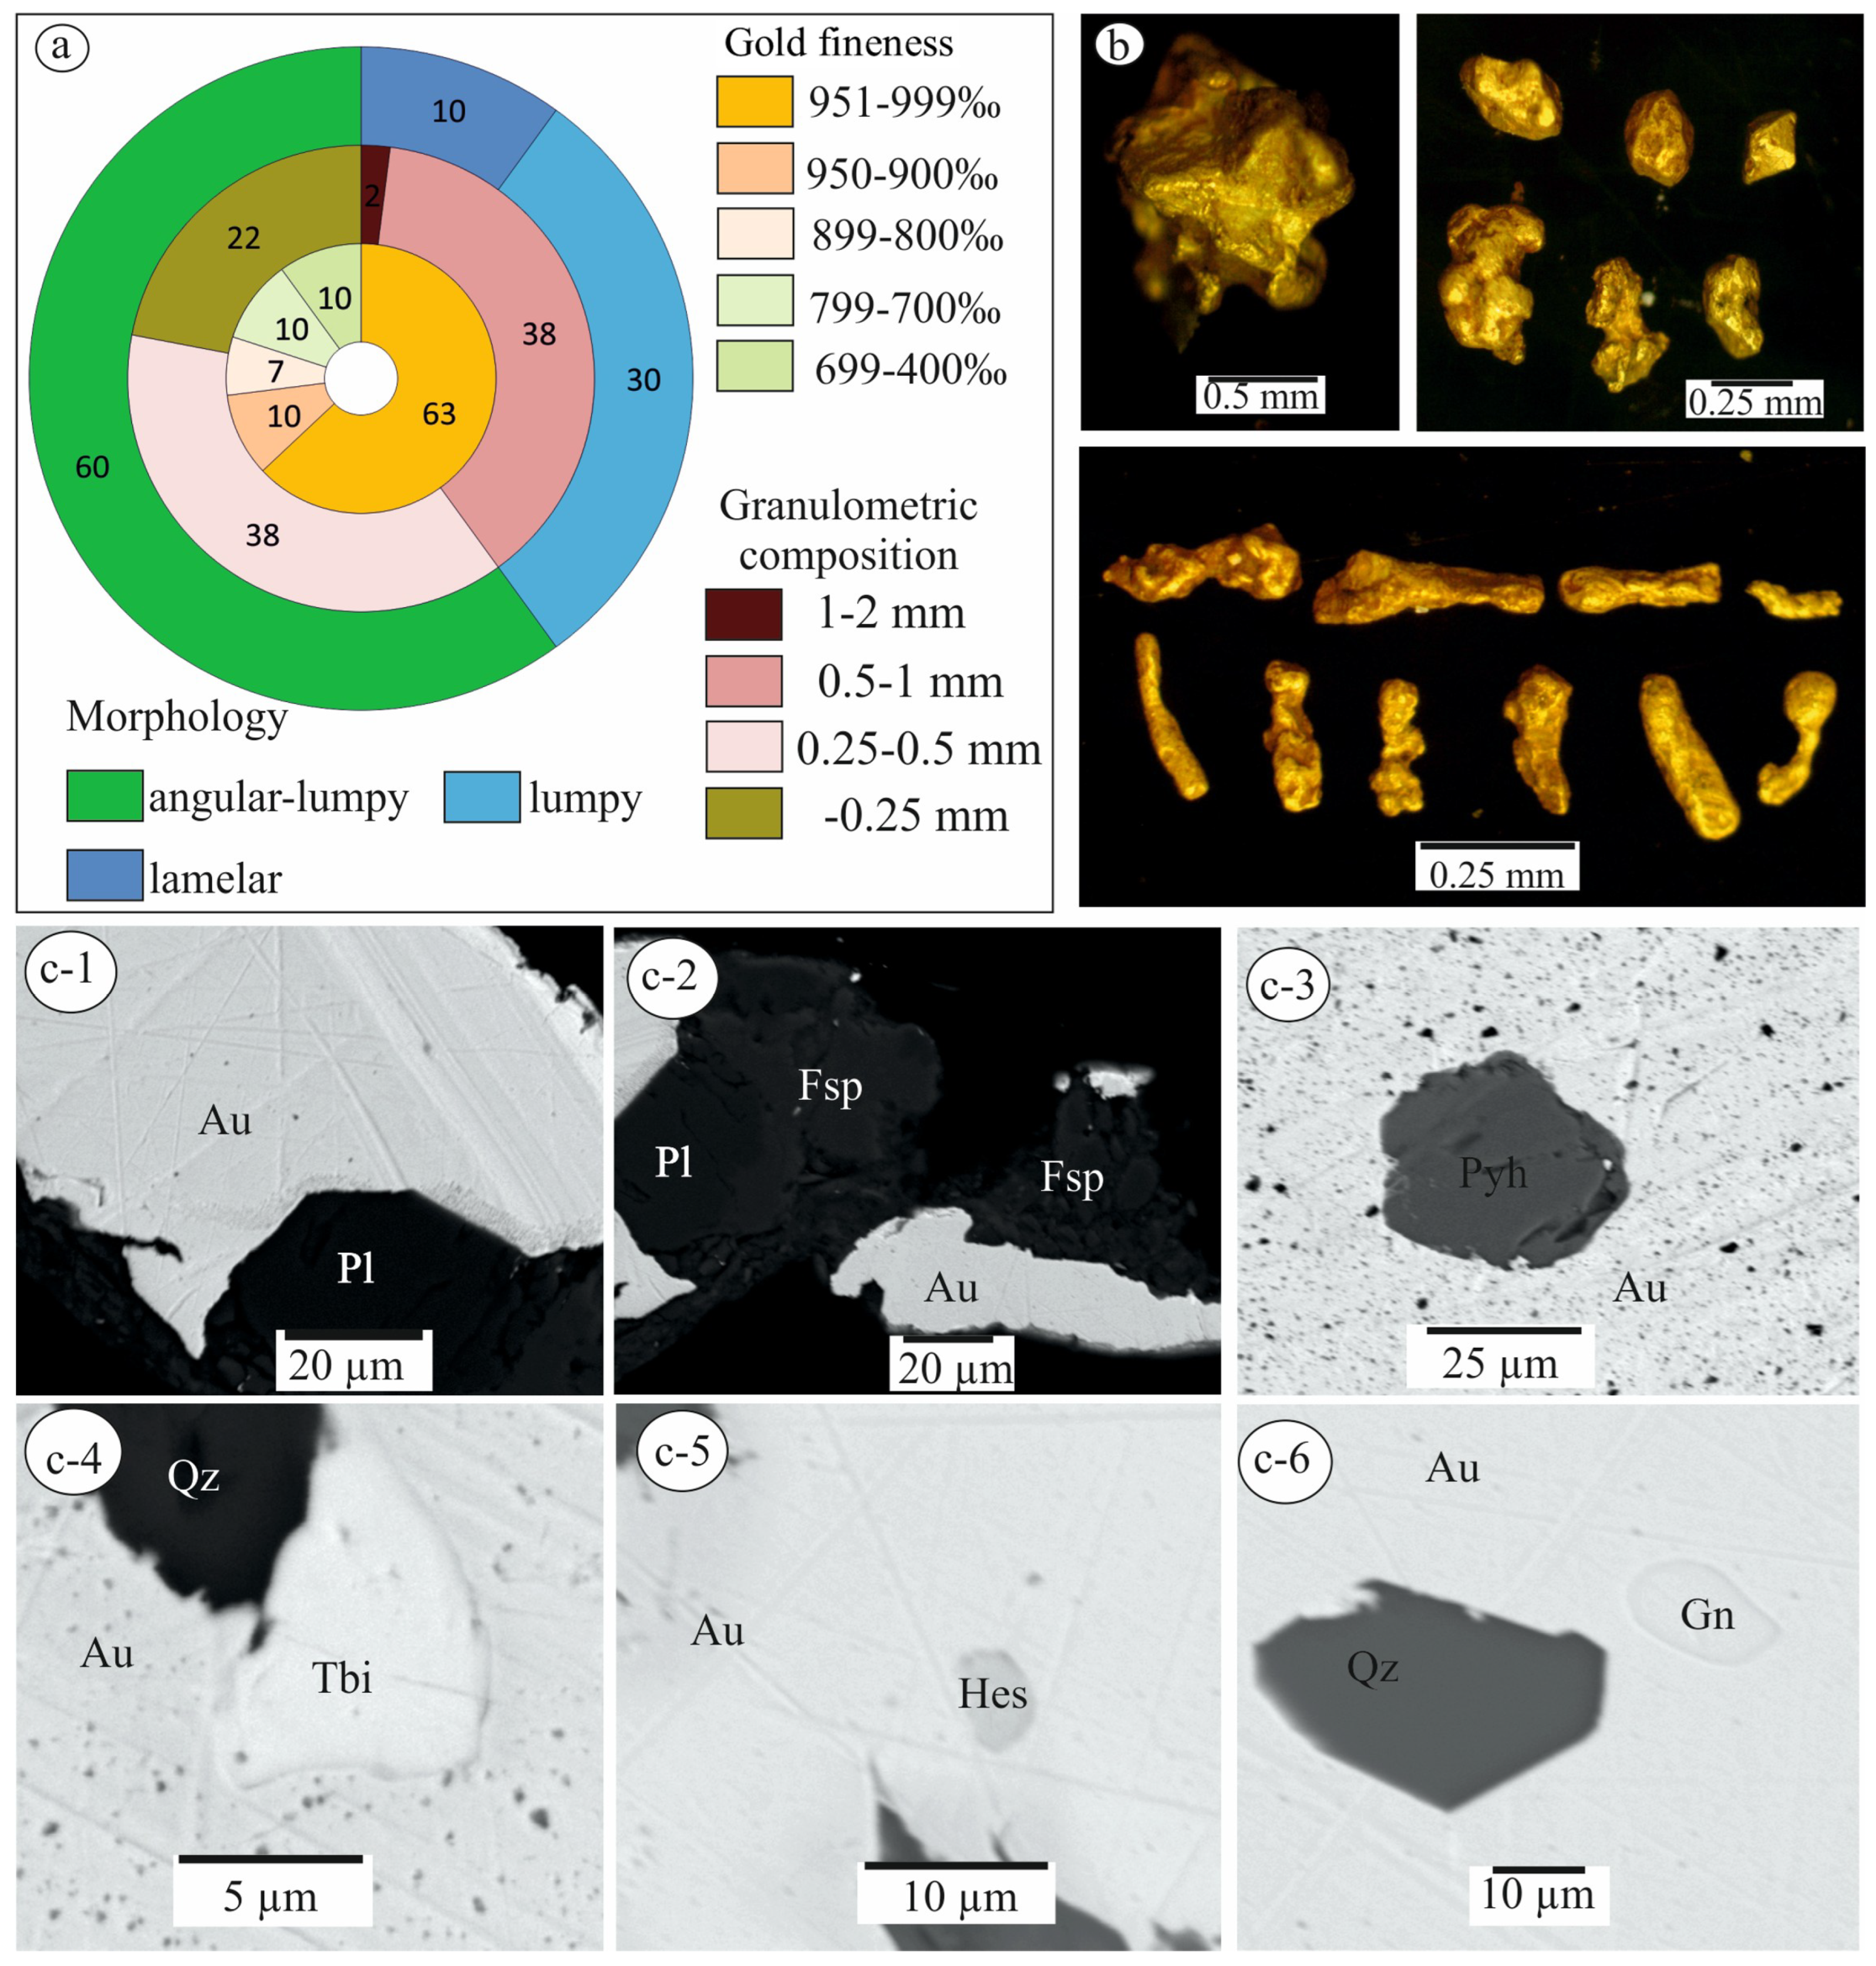
  • Using mineral inclusion analysis in placer gold, we prove that there is a genetic relation between the gold placers of recent sources identified in the study area and the examined ores. Occurrence of up to 48% of poorly rounded particles of the > 0.5 mm fraction in placers suggests the formation of larger native gold in the ores than that found in the course of this study.
  • Overall, considering the potential to discover new placers along with recently discovered ones, as well as the presence of gold-bearing ore occurrences, we can report a new Khaptasynnakh ore placer cluster in the North–East Siberian Platform.

Author Contributions

Conceptualization, B.G. and L.K.; methodology, B.G. and L.K.; software, B.G. and L.K.; validation, B.G. and L.K.; formal analysis, B.G. and L.K.; investigation, B.G. and L.K.; resources, B.G.; data curation, B.G.; writing—original draft preparation, B.G.; writing—review and editing, B.G. and L.K.; visualization, B.G. and L.K.; supervision, B.G.; project administration, B.G.; funding acquisition, B.G. All authors have read and agreed to the published version of the manuscript.

Funding

This study was carried out as part of the research project of DPMGI SB RAS of Sciences funded by the Ministry of Science and Education of the Russian Federation, FUFG-2024-0006, and partially under the contract with Almazy Anabara JSC.

Data Availability Statement

The original contributions presented in this study are included in the article. Further inquiries can be directed to the corresponding author.

Conflicts of Interest

The authors declare no conflicts of interest.

References

  1. Gerasimov, B.; Beryozkin, V.; Kravchenko, A. Typomorphic Features of Placer Gold from the Billyakh Tectonic Melange Zone of the Anabar Shield and Its Potential Ore Sources (Northeastern Siberian Platform). Minerals 2020, 10, 281. [Google Scholar] [CrossRef]
  2. Smelov, A.P.; Kotov, A.B.; Sal’nikova, E.B.; Kovach, V.P.; Beryozkin, V.I.; Kravchenko, A.A.; Dobretsov, V.N.; Velikoslavinskii, S.D.; Yakovleva, S.Z. Age and duration of the formation of the Billyakh tectonic melange zone, Anabar Shield. Petrology 2012, 20, 286–300. (In Russian) [Google Scholar] [CrossRef]
  3. Smelov, A.P.; Amuzinsky, V.A.; Zedgenizov, A.N.; Berezkin, V.I.; Koval, S.G. Prospects for the Primary Gold Content of Metamorphic and Igneous Complexes of the Anabar Shield. Gold of Siberia and the Far East; Publishing House of the BSC SB RAS: Ulan-Ude, Russia, 2004; pp. 279–281. (In Russian) [Google Scholar]
  4. Petrovskaya, N.V.; Novgorodova, M.I.; Frolova, K.E. The nature of structures and substructures of endogenous native gold particles. In Mineralogy of Native Elements; Petrovskaya, N., Fatyanov, I., Eds.; FESC AC USSR: Vladivostok, Russia, 1980; pp. 10–20. (In Russian) [Google Scholar]
  5. Chudnenko, K.V.; Pal’yanova, G.A. Thermodynamic properties of solid solutions in the Ag–Au–Cu system. Russ. Geol. Geophys. 2014, 55, 349–360. (In Russian) [Google Scholar] [CrossRef]
  6. Petrovskaya, N.V. Native Gold; Nauka: Moscow, Russia, 1973; 347p. (In Russian) [Google Scholar]
  7. Nikolaeva, L.A.; Gavrilov, A.M.; Nekrasova, A.N.; Yablokova, S.V.; Shatilova, L.V. Atlas of Native Gold of Ore and Placer Deposits in Russia; Tsnigri: Moscow, Russia, 2003; 184p. (In Russian) [Google Scholar]
  8. Hart, C.J.R. Reduced Intrusion-Related Gold Systems. Mineral Deposits of Canada: A Synthesis of Major Deposit Types, District Metallogeny, the Evolution of Geological Provinces, and Exploration Methods; Goodfellow, W.D., Ed.; Geological Association of Canada, Mineral Deposits Division: St. John’s, NL, Canada, 2007; Volume 5, pp. 95–112. [Google Scholar]
  9. Robb, L. Introduction to Ore-Forming Processes; Blackwell Publishing: Oxford, UK, 2004; 373p. [Google Scholar]
  10. Ishihara, S. The magnetite-series and ilmenite-series granitic rocks. Min. Geol. 1977, 26, 293–305. [Google Scholar]
  11. Gaskov, I.V. The main impurity elements of native gold and their relationship with the conditions of its formation using the example of deposits in the folded belts of Asia. Geol. Geophys. 2017, 58, 1359–1376. (In Russian) [Google Scholar]
  12. Morrison, G.W.; Rose, W.J.; Jaireth, S. Geological and geochemical controls on the silver content (fineness) of gold in gold-silver deposits. Ore Geol. Rev. 1991, 6, 333–364. [Google Scholar] [CrossRef]
  13. Townley, B.; Hérail, G.; Maksaev, V.; Palacios, C.; de Parseval, P.; Sepulveda, F.; Orellana, R.; Rivas, P.; Ulloa, C. Gold grain morphology and composition as an exploration tool: Application to gold exploration in covered areas. Geochem. Explor. Environ. Anal. 2003, 3, 29–38. [Google Scholar] [CrossRef]
  14. Kravchenko, A.A.; Smelov, A.P.; Berezkin, V.I.; Zedgenizov, A.N.; Dobretsov, V.N. Nature of gold mineralization of the early Proterozoic Billyakh granitoid complex according to geochemical data (Anabar shield). Russ. Geol. 2010, 5, 23–29. (In Russian) [Google Scholar]
  15. Krivtsov, A.I.; Zvezdov, V.S.; Migachev, I.F. Copper-Porphyry Deposits of the World; TsNIGRI: Moscow, Russia, 2001; 236p. (In Russian) [Google Scholar]
  16. Pavlova, I.G. Geological and genetic models of molybdenum-copper porphyry deposits. In Genetic Models of Endogenous Ore Formations; Nauka: Moscow, Russia, 1983; pp. 127–134. (In Russian) [Google Scholar]
  17. Popov, V.S. Geology and Genesis of Copper-Molybdenum-Porphyry Deposits; Nauka: Moscow, Russia, 1977; 203p. (In Russian) [Google Scholar]
  18. Zhang, X.; Spry, P.G. Calculated stability of aqueous tellurium species, calaverite, and hessite at elevated temperatures. Econ. Geol. 1994, 89, 1152–1166. [Google Scholar] [CrossRef]
  19. Cabri, L.J. Phase relations in the Au-Ag-Te system and theirmineralogical significance. Econ. Geol. 1965, 60, 1569–1606. [Google Scholar] [CrossRef]
  20. Bortnikov, N.S.; Cramer, H.; Genkin, A.D.; Krapiva, L.Y.; Santa-Cruz, M. Parageneses of gold and silver tellurides at the Florencia gold deposit, Cuba. Geol. Ore Depos. 1988, 2, 49–61. [Google Scholar]
  21. Afifi, A.M.; Kelly, W.C.; Essene, E.J. Phase relations among tellurides, sulfides, and oxides: I. Thermochemical data and calculated equilibria. Econ. Geol. 1988, 83, 377–394. [Google Scholar] [CrossRef]
  22. Voudouris, P. A comparative mineralogical study ofTe-rich magmatic-hydrothermal systems in northeastern Greece. Mineral. Petrol. 2006, 87, 241–275. [Google Scholar] [CrossRef]
  23. Afifi, A.M.; Kelly, W.C.; Essene, E.J. Phase Relations among Tellurides, Sulfides, and Oxides: II. Applications to Telluride-Bearing Ore Deposits. Econ. Geol. 1988, 83, 395–404. [Google Scholar] [CrossRef]
  24. Gaskov, I.V.; Akimtsev, V.A.; Kovalev, K.R.; Sotnikov, V.I. Gold-bearing mineral associations of copper-ore deposits of the Altai-Sayan folded region. Geol. Geophys. 2006, 47, 996–1004. (In Russian) [Google Scholar]
  25. Sillitoe, R.H. Porphyry copper systems. Econ. Geol. 2010, 105, 3–41. [Google Scholar] [CrossRef]
  26. Chapman, R.J.; Allan, M.M.; Mortensen, J.K.; Wrighton, T.M.; Grimshaw, M.R. A new indicator mineral methodology based on a generic Bi-Pb-Te-S mineral inclusion signature in detrital gold from porphyry and low/intermediate sulfidation epithermal environments in Yukon Territory, Canada. Min. Depos. 2018, 53, 815–834. [Google Scholar] [CrossRef]
  27. Bukhanova, D.S. Mineralogical and Geochemical Features of the Malmyzh Gold-Copper-Porphyry Deposit, Khabarovsk Region. Ph.D. Thesis, Federal State Budgetary Scientific Institution Institute of Volcanology and Seismology of the Far Eastern Branch of the Russian Academy of Sciences, Petropavlovsk-Kamchatsky, Russia, 2020; 25p. (In Russian). [Google Scholar]
  28. Migachev, I.F.; Zvezdov, V.S.; Minina, O.V. Formational types of porphyry copper deposits and their ore-magmatic systems. Russ. Geol. 2022, 1, 26–48. (In Russian) [Google Scholar] [CrossRef]
  29. Plotinskaya, O.Y. Porphyry-Epithermal Systems of the Urals: Sources of Matter, Evolution, Zonality. Ph.D. Thesis, Federal State Budgetary Scientific Institution Institute of Geology of Ore Deposits, Petrography, Mineralogy and Geochemistry of the Russian Academy of Sciences, Moscow, Russia, 2023; p. 39. (In Russian). [Google Scholar]
  30. Kuznetsov, A.A. Geological-forecast-mineragenic model and prospects for commercial ore-bearing content of the Anabar Shield. Russ. Geol. 2008, 6, 22–34. (In Russian) [Google Scholar]
  31. Richards, J.P.; Mumin, A.H. Magmatic-hydrothermal processes within an evolving Earth: Iron oxide-copper-gold and porphyry Cu ± Mo ± Au deposits. Geology 2013, 41, 767–770. [Google Scholar] [CrossRef]
  32. Skirrow, R.G. Iron oxide copper-gold (IOCG) deposits—A review (part 1): Settings, mineralogy, ore geochemistry and classification. Ore Geol. Rev. 2022, 140, 104569. [Google Scholar] [CrossRef]
  33. Koděra, P.; Lexa, J.; Biroň, A.; Žitňan, J. Gold mineralization and associated alteration zones of the Biely vrch Au-porphyry deposit, Slovakia. Miner. Slovaca 2010, 42, 33–56. [Google Scholar]
  34. Spiridonov, E.M.; Pletnev, P.A. The Zolotaya Gora Copper Gold Deposit (About the “Gold-Rodingite” Formation); Scientific World: Moscow, Russia, 2002; 220p. (In Russian) [Google Scholar]
  35. Palyanova, G.A. Gold and silver minerals in sulfide ore. Geol. Ore Depos. 2020, 62, 383–406. [Google Scholar] [CrossRef]
  36. Onishchenko, S.A.; Kuznetsov, S.K. Exsolution in the Au–Ag–Cu system in a gold-rich area. Geochemistry 2022, 67, 639–654. (In Russian) [Google Scholar] [CrossRef]
  37. Palyanova, G.A.; Beliaeva, T.V.; Savelyev, D.P.; Seryotkin, Y.V. Minerals of the Au-Cu-Ag System in Grains from the Placers of the Olkhovaya-1 River (Eastern Kamchatka, Russia). Minerals 2024, 14, 448. [Google Scholar] [CrossRef]
  38. Murzin, V.V.; Varlamov, D.A. Diffusion Processes at Contacts of Native Gold and Copper in the Oxidation Zone of the Anninskoe Deposit in the Middle Urals. Zapiski RMO 2022, 6, 18–28. (In Russian) [Google Scholar] [CrossRef]
Figure 1. Scheme of the geological structure of the Billyakh zone of the Anabar Shield [2]. 1: Archean Upper Anabar series. 2: Undivided metamorphic complexes of the Daldyn and Khapchan terranes. 3: Proterozoic Khapchan series. 4: Paleoproterozoic alaskite and leucocratic granites (γPR1). 5: Paleoproterozoic porphyry biotite–hornblende granodiorites, monzonites, granites, and granosyenites (γ-ẟPR1). 6: Paleoproterozoic diorite–syenites, syenites, and granosyenites. 7: Meso- and Neoproterozoic diabases and gabbro-diabases (β-PR3). 8: Zones of migmatization and granitization. 9: Tectonic contacts. 10: Prospecting trenches. 11: Points of collection of crushed samples and their numbers. 12: Sampling sites from placers (v = 1–2 m3). 13–16: Tectonic structure of the Anabar Shield and Geoblocks. 13: Magan. 14: Daldyn. 15: Khapchan. 16: Tectonic mélange zones. 17: Magan. 18: Kotuykan. 19: Billyakh. 20: Study area.
Minerals 15 00774 g001
Figure 2. Sericitization of plagioclase (Pl) and replacement by microcline (Mcc), quartz grains (Qz) with ragged edges, and tabular biotite crystals (Bt). Image in transmitted light on a BS-5062TTR polarizing microscope (BestScope, Beijing, China).
Minerals 15 00774 g002
Figure 3. Ore mineralization in hydrothermally altered rocks: (a) idiomorphic pyrite (Py) crystal surrounded by pyrrhotite (Pyh) and chalcopyrite (Ccp) associated with sphalerite (Sp); galena (Gn) develops in the intergranular space. (b) Small elongated crystals of arsenopyrite near pyrite (Py). (c) Galena (Gn) veins in pyrite (Py) and sphalerite (Sp). (d) Chalcopyrite (Ccp) substitution with chalcocite (Cc). (e) Bornite (Bn) in chalcopyrite (Ccp). (f) Grains of hessite (Hes) into veins of chalcopyrite (Ccp) penetrated into pyrite (Py) and bordered with pyrrhotite (Pyh). (g) Dotted grains of tellurobismuthite (Tbi) in quartz (Qz) with microcline grains (Mcc). (h) Scattered grains of hessite (Hes) in plagioclase (Pl)–microcline (Mcc) matrix with chlorite (Chl). (i) Native bismuth (Bi) and unspecified minerals of bismuth (XBi) in coalescence with hessite (Hes). (j) Cinnabar (Cin) in pyrite (Py). (k) Native gold (Au) in the intergranular space of pyrite (Py) and chalcopyrite (Ccp). (l) Micron native gold (Au) in hessite (Hes).
Minerals 15 00774 g003
Figure 4. Mineral composition of ore of sample I-381-1. (a) Sampling location: eluvial rocks of the Anabar series; (b) quartz metasomatite block; (c) general view of the sample; (d) chalcocite (Cc) grains in quartz (Qz); (e) bornite (Bn) veinlets in quartz (Qz); (f) chalcopyrite (Ccp) in plagioclase (Pl)–potassium feldspar (Fs) matrix; (g) native gold (Au) intergrown with chalcocite (Cc); calaverite (Clv) and tellurite (Tlr); (h) intergrowth of native gold (Au) and chalcosite (Cc) in quartz (Qz); (i) intergrowth of chalcocite (Cc) with altaite (Alt) in a potassium feldspar (Fs)–quartz (Qz) matrix.
Minerals 15 00774 g004
Figure 5. Morphology of gold ore.
Minerals 15 00774 g005
Figure 6. Symplectite intergrowths of native gold (Au) and calaverite (Clv) (a) with chalcocite inclusions (Cc) (b). BSE mode.
Minerals 15 00774 g006
Figure 7. Mineral associations of ore minerals: (a) intergrowth of chalcocite (Cc) and native gold (Au); (b) intergrowth of gold (Au) and calaverite (Clv); (c) intergrowth of gold (Au) with bornite (Bn); (d) tellurobismuthite (Tb) inclusion in gold; (e) intergrowth of gold (Au) and altaite (Alt) in quartz (Q): altaite is partially replaced by chalcocite; (f) intergrowth of gold (Au) with clausthalite (Cth) and rickardite inclusions (Rkd); (g) complex intergrowth of gold (Au) with inclusions of petzite (Ptz) and chalcocite (Cc); (h,i) cuproauride, shown by arrows. BSE mode.
Minerals 15 00774 g007
Figure 8. Ternary diagram of the composition of Au–(Ag × 10)–(Cu × 100) native gold from crushed quartz metasomatites (wt.%). Fields of deposit types according to [13].
Minerals 15 00774 g008
Figure 9. Stability of some sulfides and tellurides depending on fugacity S2 and Te2 at 200 °C according to Afifi 1988 [23]. Abbreviations: Ag—silver; Au—gold–electrum; S—sulfur; Te—tellurium; cv—calaverite; fo—frobergite; hs—hessite; hm—hematite; bn—bornite; cp—chalcopyrite; po—pyrrhotite; py—pyrite; mt—magnetite.
Minerals 15 00774 g009
Figure 10. fTe2–temperature diagram, showing the location of some telluride reactions under different fS2 buffers [23]: (1) gold–calaverite; (2) galena–altaite in fS2 = magnetite–pyrite–hematite; (3) galena–altaite in fS2 = pyrrhotite–pyrite; (4) argentite–hessite in fS2 = chalcopyrite–bornite–pyrite; (5) argentite–hessite in fS2 = magnetite–pyrite–hematite; (6) argentite–hessite in fS2 = pyrrhotite–pyrite; (7) silver–hessite. The shaded area includes the minimum values. fTe2, necessary for the stabilization of telluride minerals. A—tellurium-enriched source; B—undersaturated with tellurides at the deposition site; C and D—saturated with some tellurides but undersaturated with native tellurium; S—telluride-undersaturated source; T—saturated with native tellurium.
Minerals 15 00774 g010
Figure 11. EDS mapping of symplectitic intergrowth of native gold and calaverite with chalcocite inclusions: (AF)—X-rays of elements: (A) Au, (B) Ag, (C) Te, (D) Cu, and (E) S; (F) general view of polished section (BSE).
Minerals 15 00774 g011
Figure 12. Composition of native gold from metasomatites of the Khaptasynnakh ore zone: (a) correlation diagram of Au and Ag contents in native gold (in wt.%) from crushed particles (red squares) and in polished sections from trenches (blue squares); (b) ternary diagram Ag-Au-Cu with compositions (at.%) of native gold from crushed samples (red squares) and in polished sections from trenches (blue squares); (c) cumulative graph of Ag content in native gold.
Minerals 15 00774 g012
Figure 13. EDS map of multiphase particles with compositions Ag-Au-Cu and chemical composition of phases.
Minerals 15 00774 g013
Figure 14. Ternary diagram of multiphase particles with composition Ag-Au-Cu (atomic%). Red squares—cuproauride phase; purple squares—Au3Cu phase; yellow squares—Au-Ag solid solution.
Minerals 15 00774 g014
Figure 15. Typomorphic features of native gold placer of the Borosku Unguohtaakh River.
Minerals 15 00774 g015
Figure 16. Typomorphic features of native gold from the Ulakhan Haptasynnakh River placer.
Minerals 15 00774 g016
Figure 17. Typomorphic features of native gold from the Left Ulakhan Haptasynnakh River: (a) fineness, morphology, and granulometry; (b) morphology; (c-1c-6) inclusions in native gold (Au): (c-1) plagioclase crystal (Pl), (c-2) intergrowths of plagioclase (Pl), potassium feldspar (Fsp) and low-grade gold (Au), (c-3) relatively large isometric grain of pyrrhotite (Pyh), (c-4) tellurobismuthite (Tbi) intergrown with quartz (Qz), (c-5) very small particle of hessite (Hes), and (c-6) galena (Gn) close to quartz (Qz).
Minerals 15 00774 g017
Figure 18. Internal structure of placer gold. (a) Low-grade gold with virtually no high-grade rim (very thin fragmentary rims are observed lighter); (b) gold with high-grade rim; (c) mini nugget of ore appearance (general view); (d) the same gold grain in a polished section: only an incipient high-grade rim is observed. Gold grains are etched with a reagent based on aqua regia (HCl + HNO3 + FeCl3⋅6H2O + CrO3 + thiourea + water). Except for b, photographed in BSE mode.
Minerals 15 00774 g018
Table 1. Geochemical composition of tellurides, wt.% (EDS).
Sample No.SFeSeAgTeAuPbBiTotalMineral
114-20-8-1---55.0234.229.36--98.61hessite
114-20-8-2---56.3336.488.18--100.99
114-13A12-5---55.636.017.92--99.54
114-20-13-4---62.8437.47---100.31
114-20-21-2-1.79-60.9138.04---100.75
114-20-21-5-1.33-61.7735.84---98.95
114-33-32-10.99--61.3537.94---100.27
114-16-1-7-4---64.2335.95---100.18
114-162-53.124.64-56.6535.84---100.25
114-13A13-6-2.12-61.5137.15---100.77
114-18a-22-2-1.14-62.6335.71---99.48
114-18a-22-8-0.54-61.0936.47---98.1
144-27-1.96-16.6742.28--37.0197.92volynskite
15-31-7.2-2-1-3.03--36.72-59.07-98.82altaite
15-31-7.2-2-3-3.44--35.09-60.9-99.43
15-31-7.2-4-2-2.47--34.58-62-99.05
114-18a-24-1----19.24--81.62100.86hedleyite
114-20-17-4-2.164.2-19.51--74.43100.29
Table 2. Geochemical composition of native gold of ore metasomatites excavated in trenches: EDS data (wt. %).
Sample No.AuAgFeTotalFineness, ‰
1114-33-9-256.639.182.8898.67574
2114-33-9-755.3742.572.82100.76550
3114-33-10-455.2941.443.1699.89554
4114-33-10-557.9939.612.85100.45577
5114-33-18-458.6438.392.4199.44590
6114-33-20-361.3537.742.41101.5604
7114-18a-16-261.6436.442.44100.52613
8114-18a-20-160.8235.992.6399.45612
9114-18a-20-259.2737.32.4599.01599
Table 3. Geochemical composition and calculation formulas of ore minerals (wt.%) (EDS).
MineralsSFeCuZnAsAgSbTeHgPbBiTotalFormula
Pyrite53.5646.95---------100.51Fe1.19S1.81
Pyrrhotite39.4661.39---------100.85Fe0.94S1.06
Arsenopyrite22.5833.3--44.72------100.6Fe0.94As0.94S1.11
Chalcopyrite35.2630.0434.73--------100.03Cu1.00Fe0.98S2.02
Sphalerite33.095.47-62.49-------101.05Zn0.92Fe0.09S0.99
Galena13.8 -------85.91-99.71Pb0.98S1.02
Chalcocite20.68 78.03--------98.71Cu1.97S1.03
Bornite24.3810.0964.72--------99.19Cu5.20Fe0.92S3.88
Hessite-----62.84-37.47---100.31Ag1.99Te1.01
Cinnabar14.6-------86.52--101.12Hg0.97S1.03
Stibnite27.24-----72.63----99.87Sb2.06S2.94
Tellurobismuthite-------47.95--53.53101.48Bi2.03Te2.97
Native Bi-------3.64--95.8299.46Bi0.94Te0.06
Table 4. Representative analysis of lode gold extracted from crushed samples of quartz metasomatites: WDS data (wt.%).
Sample No.CuAgAuTotalFineness, ‰
10.8512.7487.97101.56864
21.77.9991.17100.86902
30.806.5993.41100.8926
41.096.793.02100.81922
50.9514.7384.58100.25843
61.229.5588.2399.1890
71.4710.7487.0399.24875
81.277.8191.22100.29908
92.4214.2683.97100.7833
107.8712.5379.0499.44794
Table 5. Chemical composition of mineral intergrowths and inclusions in native gold: EDS data (wt.%).
Sample No.MineralSFeCuSeAsTePbBiAgAuTotalFormula
1Calaverite-----58.52---39.7598.27Au0.92Te2.08
2 -----59.35---39.999.25Au0.91Te2.09
5Sylvanite--1.91--62.89--12.923.63101.33(Au0.94Ag0.94
Cu0.24)2.12Te3.88
6 -----62.74--13.0524.0099.79(Au1.00Ag0.98)1.98Te4.02
7Chalcosite21.55-78.67-------100.22Cu1.94S1.06
8 20.08-80.72-------100.8Cu2.01S0.99
9Bornite25.9210.4762.29-------98.68Cu4.96Fe0.94S4.1
10 25.0510.3863.57-------99Cu5.08Fe0.94S3.98
11 25.1711.1262.46-------98.76Cu4.99Fe1.01S4
12Altaite -----35.3663.05---98.41Pb0.95Te1.05
13 -----37.4363.16---100.59Pb0.98Te1.02
14 ---2.8-35.0363.56---101.38Pb0.99(Te0.90Se0.11)1.01
15 ---3.42-36.5461.28---101.23Pb0.95(Te0.91Se0.14)1.05
16Tellurobismuthite ---8.9-38.27-54.07--101.24Bi1.93(Te2.23Se0.84)3.07
17 -----46.72-53.08--99.8Bi2.05Te2.95
18Rickardite --40.88--58.96----99.84Cu6.98Te5.02
19 --41.84--60.06----101.9Cu6.99Te5.01
20 --39.86--59.24----99.11Cu6.9Te5.1
21Petzite-----35.98--37.4126.1599.54Au1.05Ag2.73Te2.22
22Clausthalite---21.42--77.21---98.63Pb1.16Se0.84
23 ---20.651.153.7776---101.57(Pb1.08As0.05)1.13(Te0.09Se0.78)0.87
Table 6. Geochemical composition of cuproauride, wt.%.
Sample No.CuAuTotalCalculating Formula
125.2273.7698.98Au1.02Cu0.97
223.2775.7899.05Au1Cu0.99
324.7476.47101.22Au1Cu0.99
424.4975.3299.81Au1Cu0.99
524.6277.17101.79Au1Cu0.99
623.2677.34100.6Au1.03Cu0.96
724.3875.98100.36Au1Cu0.99
825.2976.1101.39Au1.01Cu0.98
Disclaimer/Publisher’s Note: The statements, opinions and data contained in all publications are solely those of the individual author(s) and contributor(s) and not of MDPI and/or the editor(s). MDPI and/or the editor(s) disclaim responsibility for any injury to people or property resulting from any ideas, methods, instructions or products referred to in the content.

