
Integrated Compositional Modeling and Machine Learning Analysis of REE-Bearing Coal Ash from a Weathered Dumpsite

 , , , ,
Abstract
1. Introduction
2. Materials and Methods
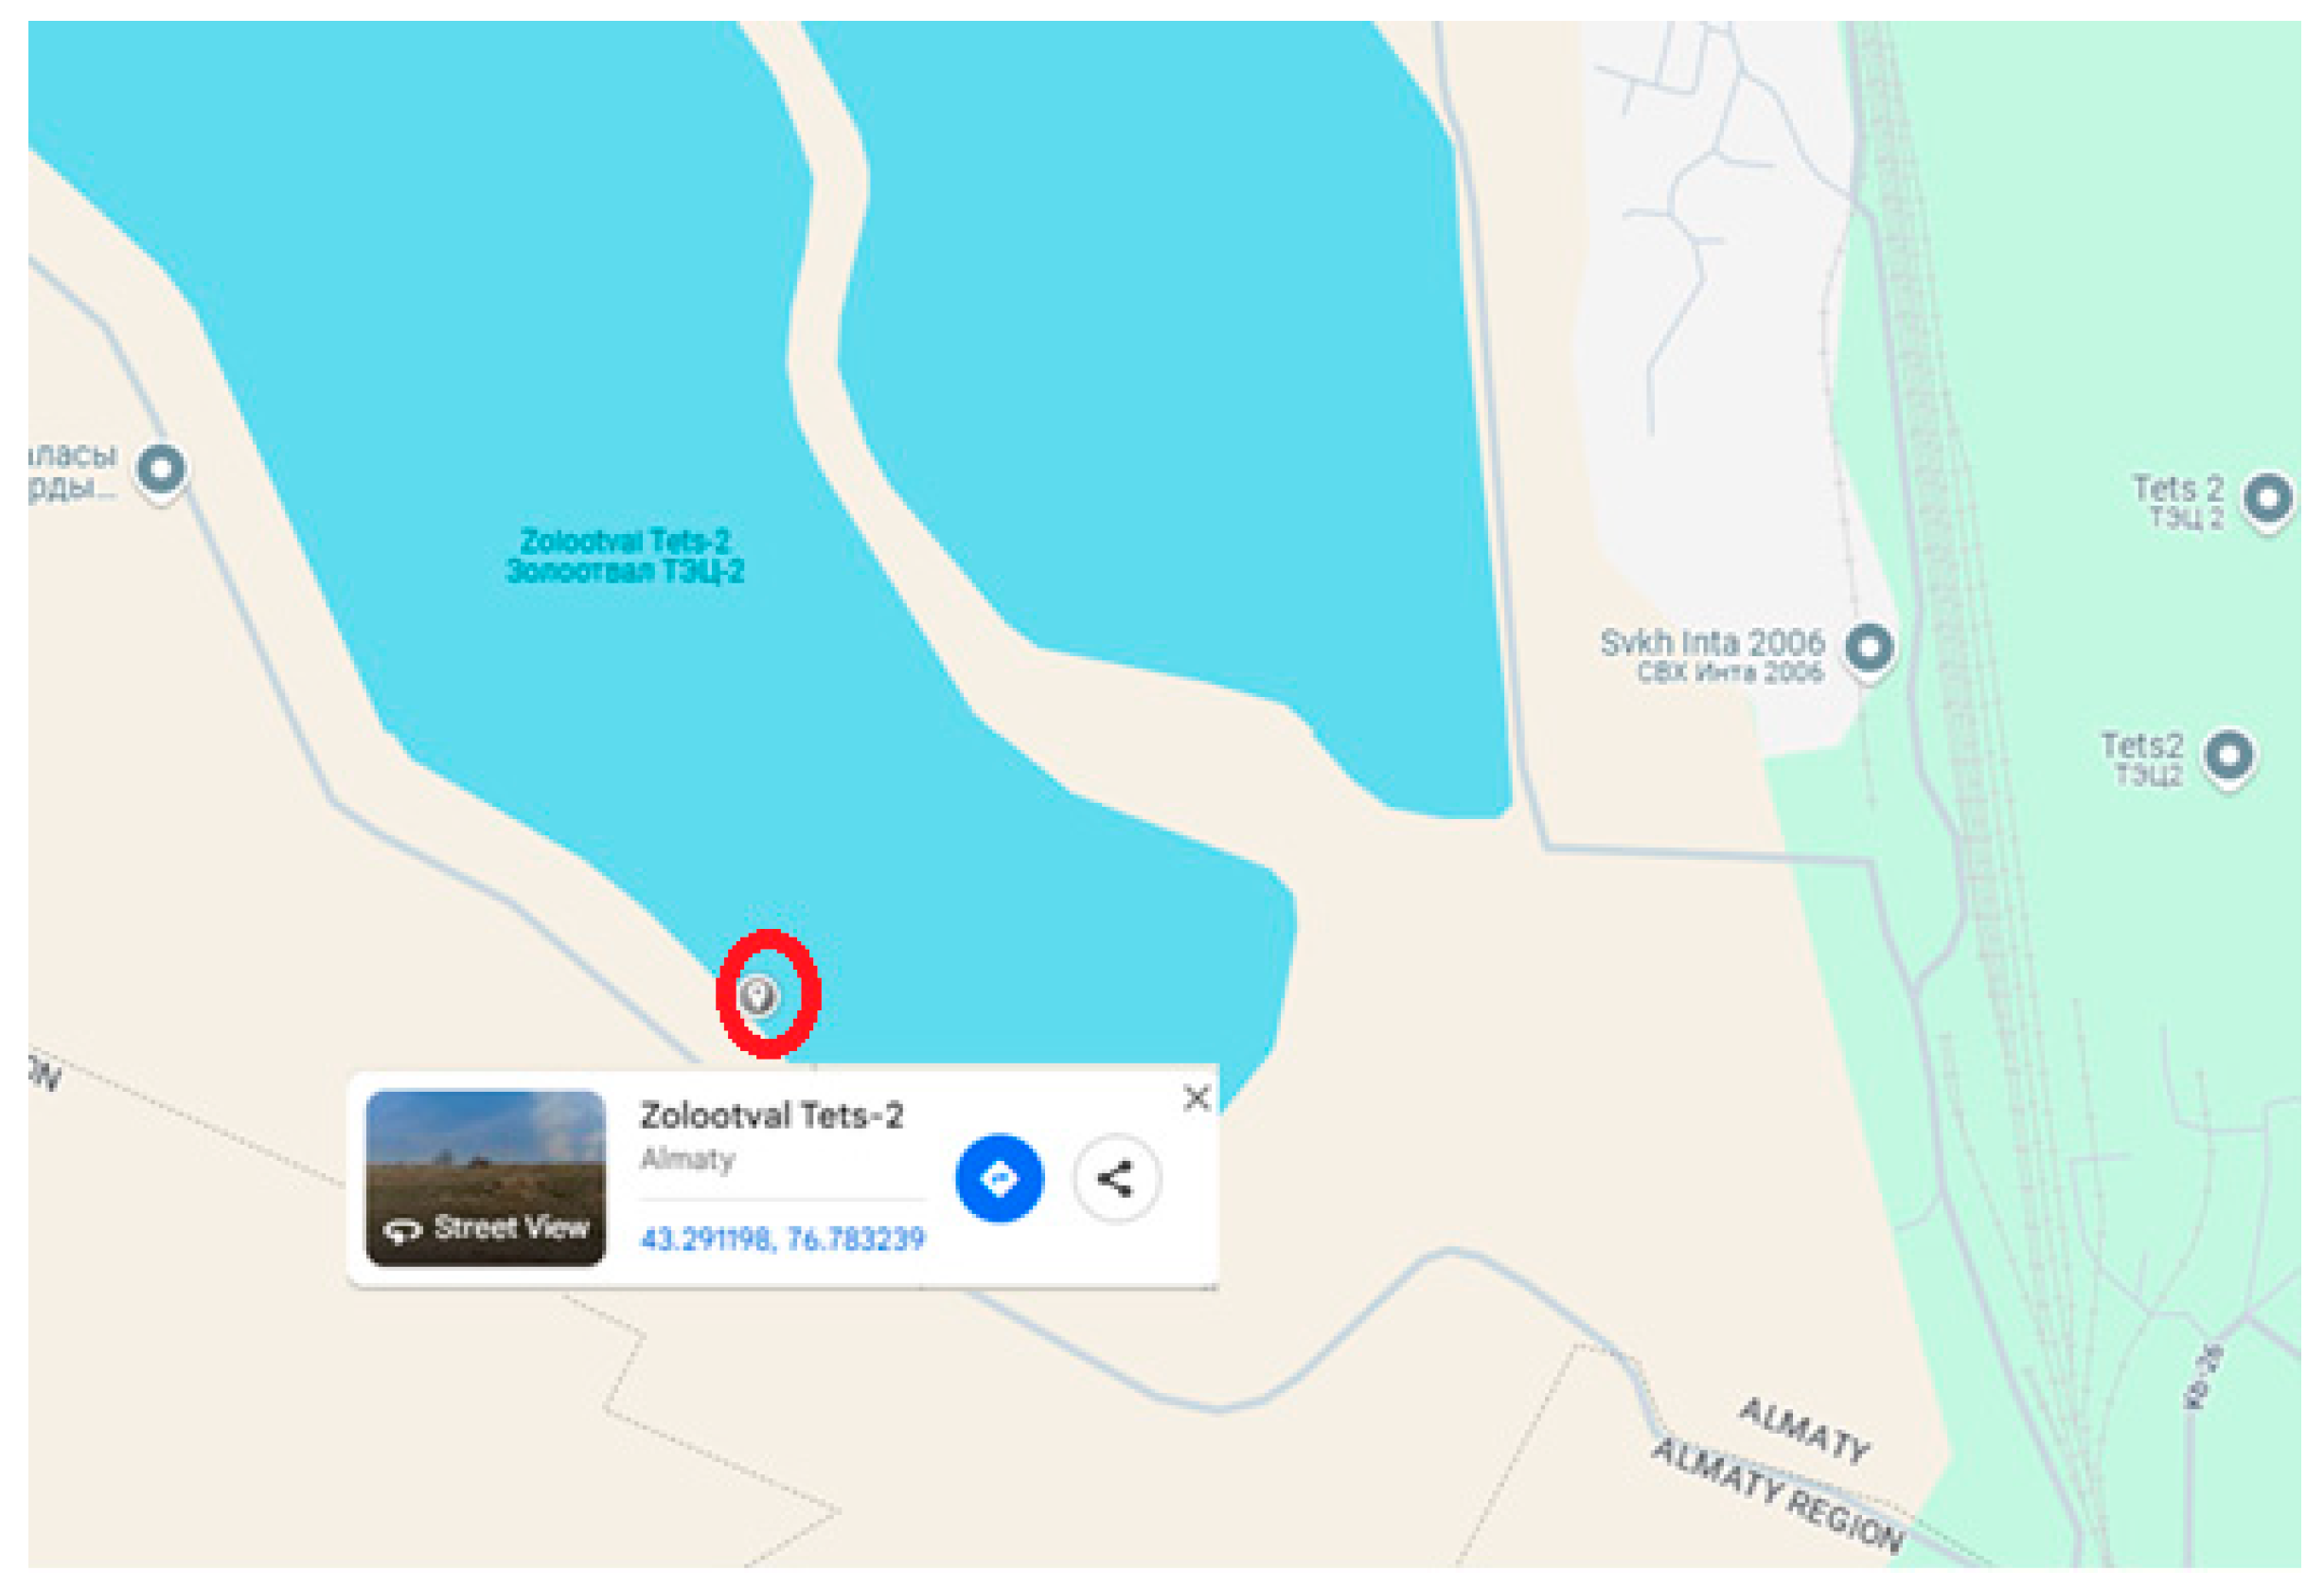
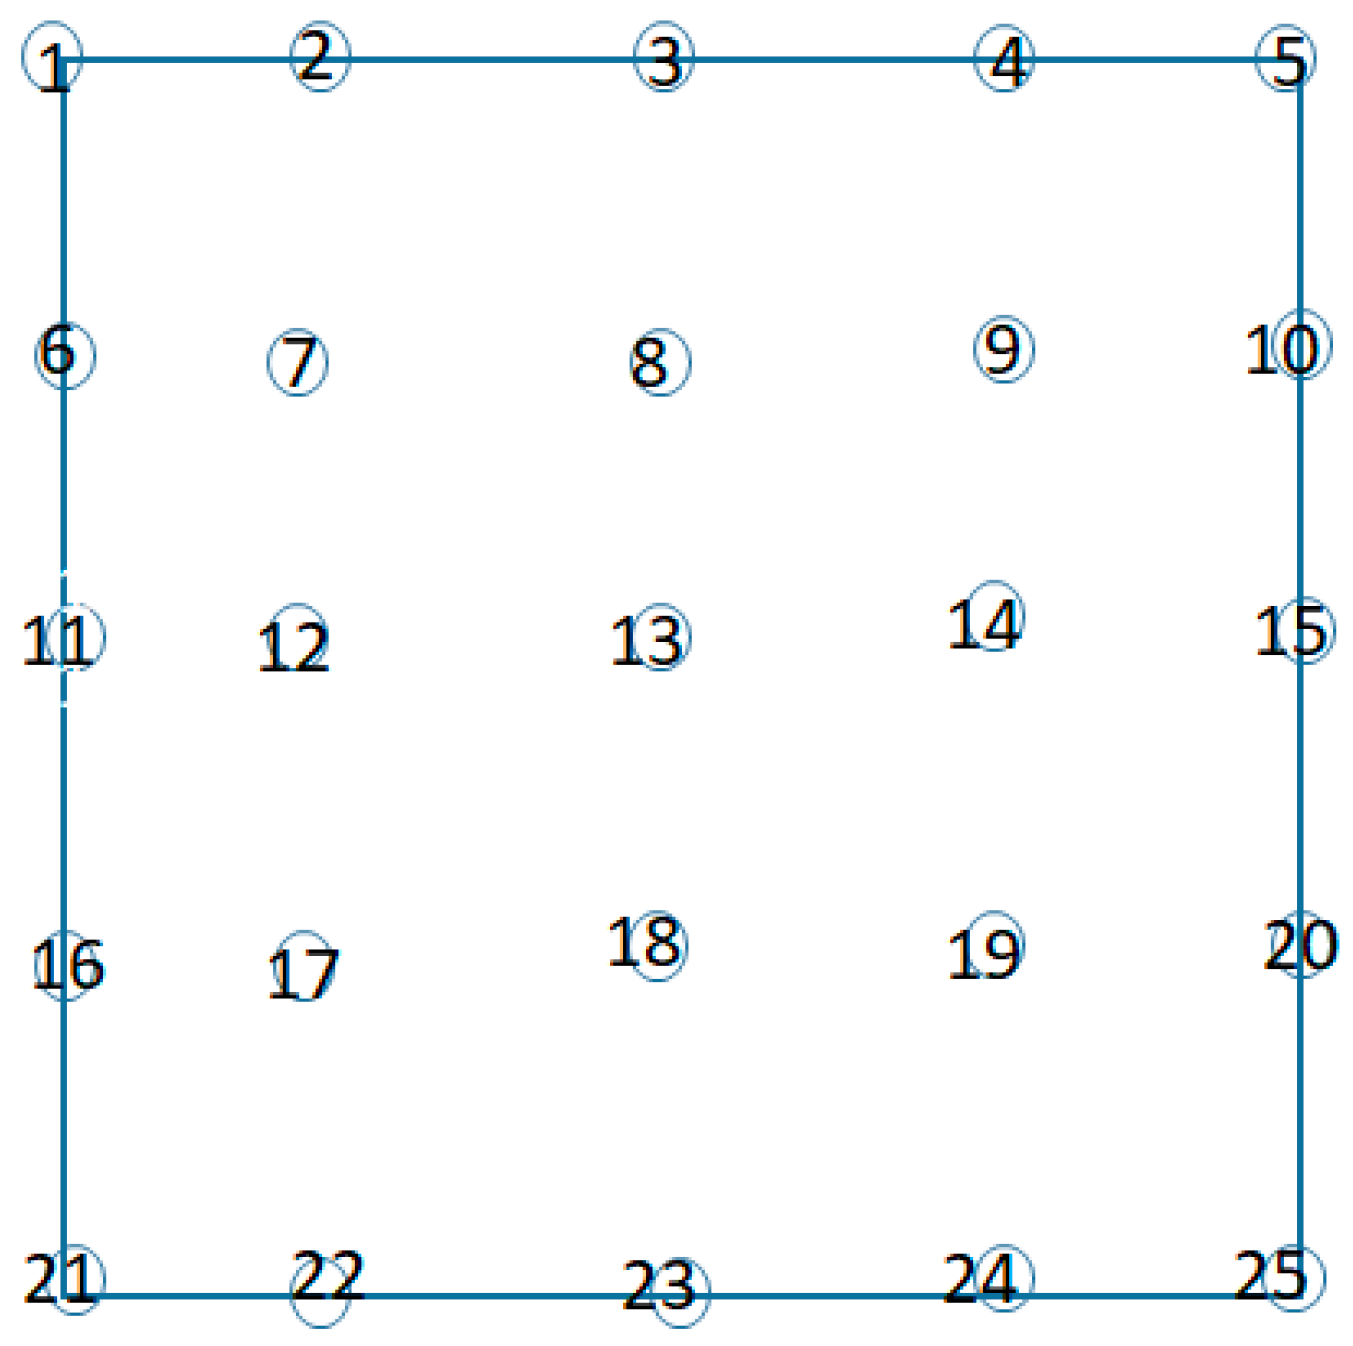
2.1. Coal Ash Sampling
2.2. Analytical Methods for Coal Ash Characterization
2.3. Data Processing and Analytical Workflow
3. Results and Discussion
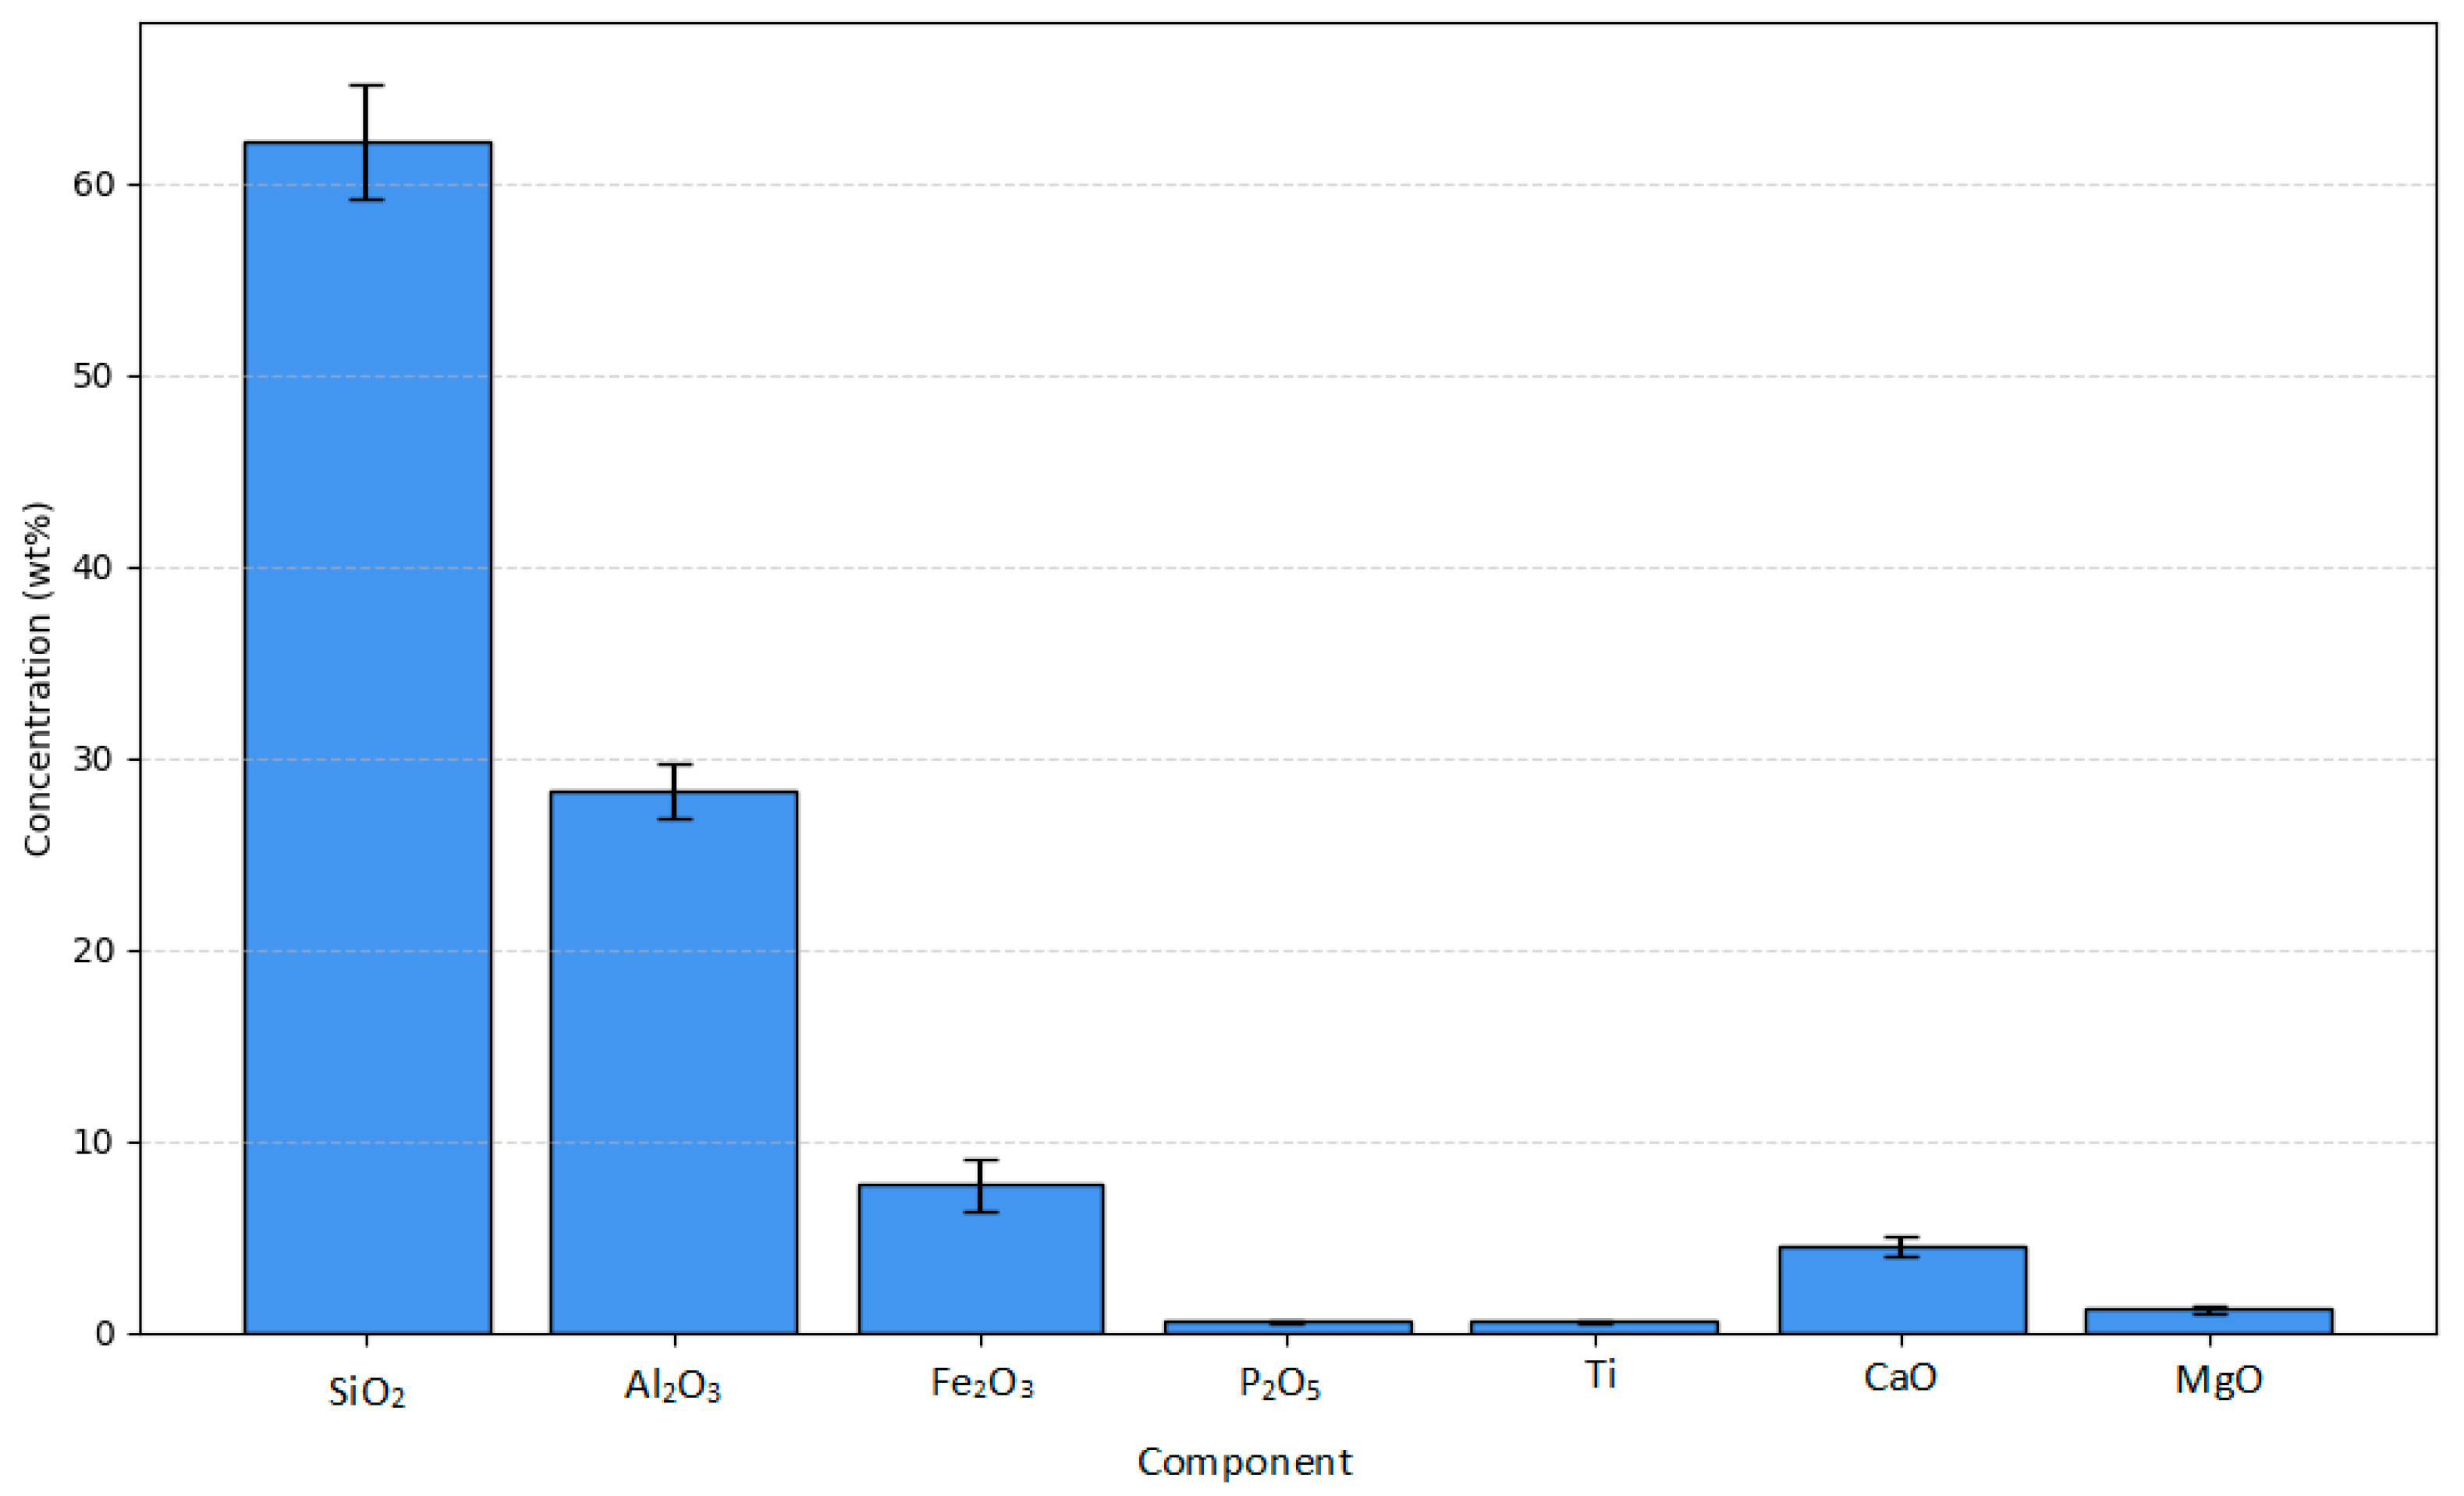
3.1. General Chemical Composition and Variability in REE Content in CA
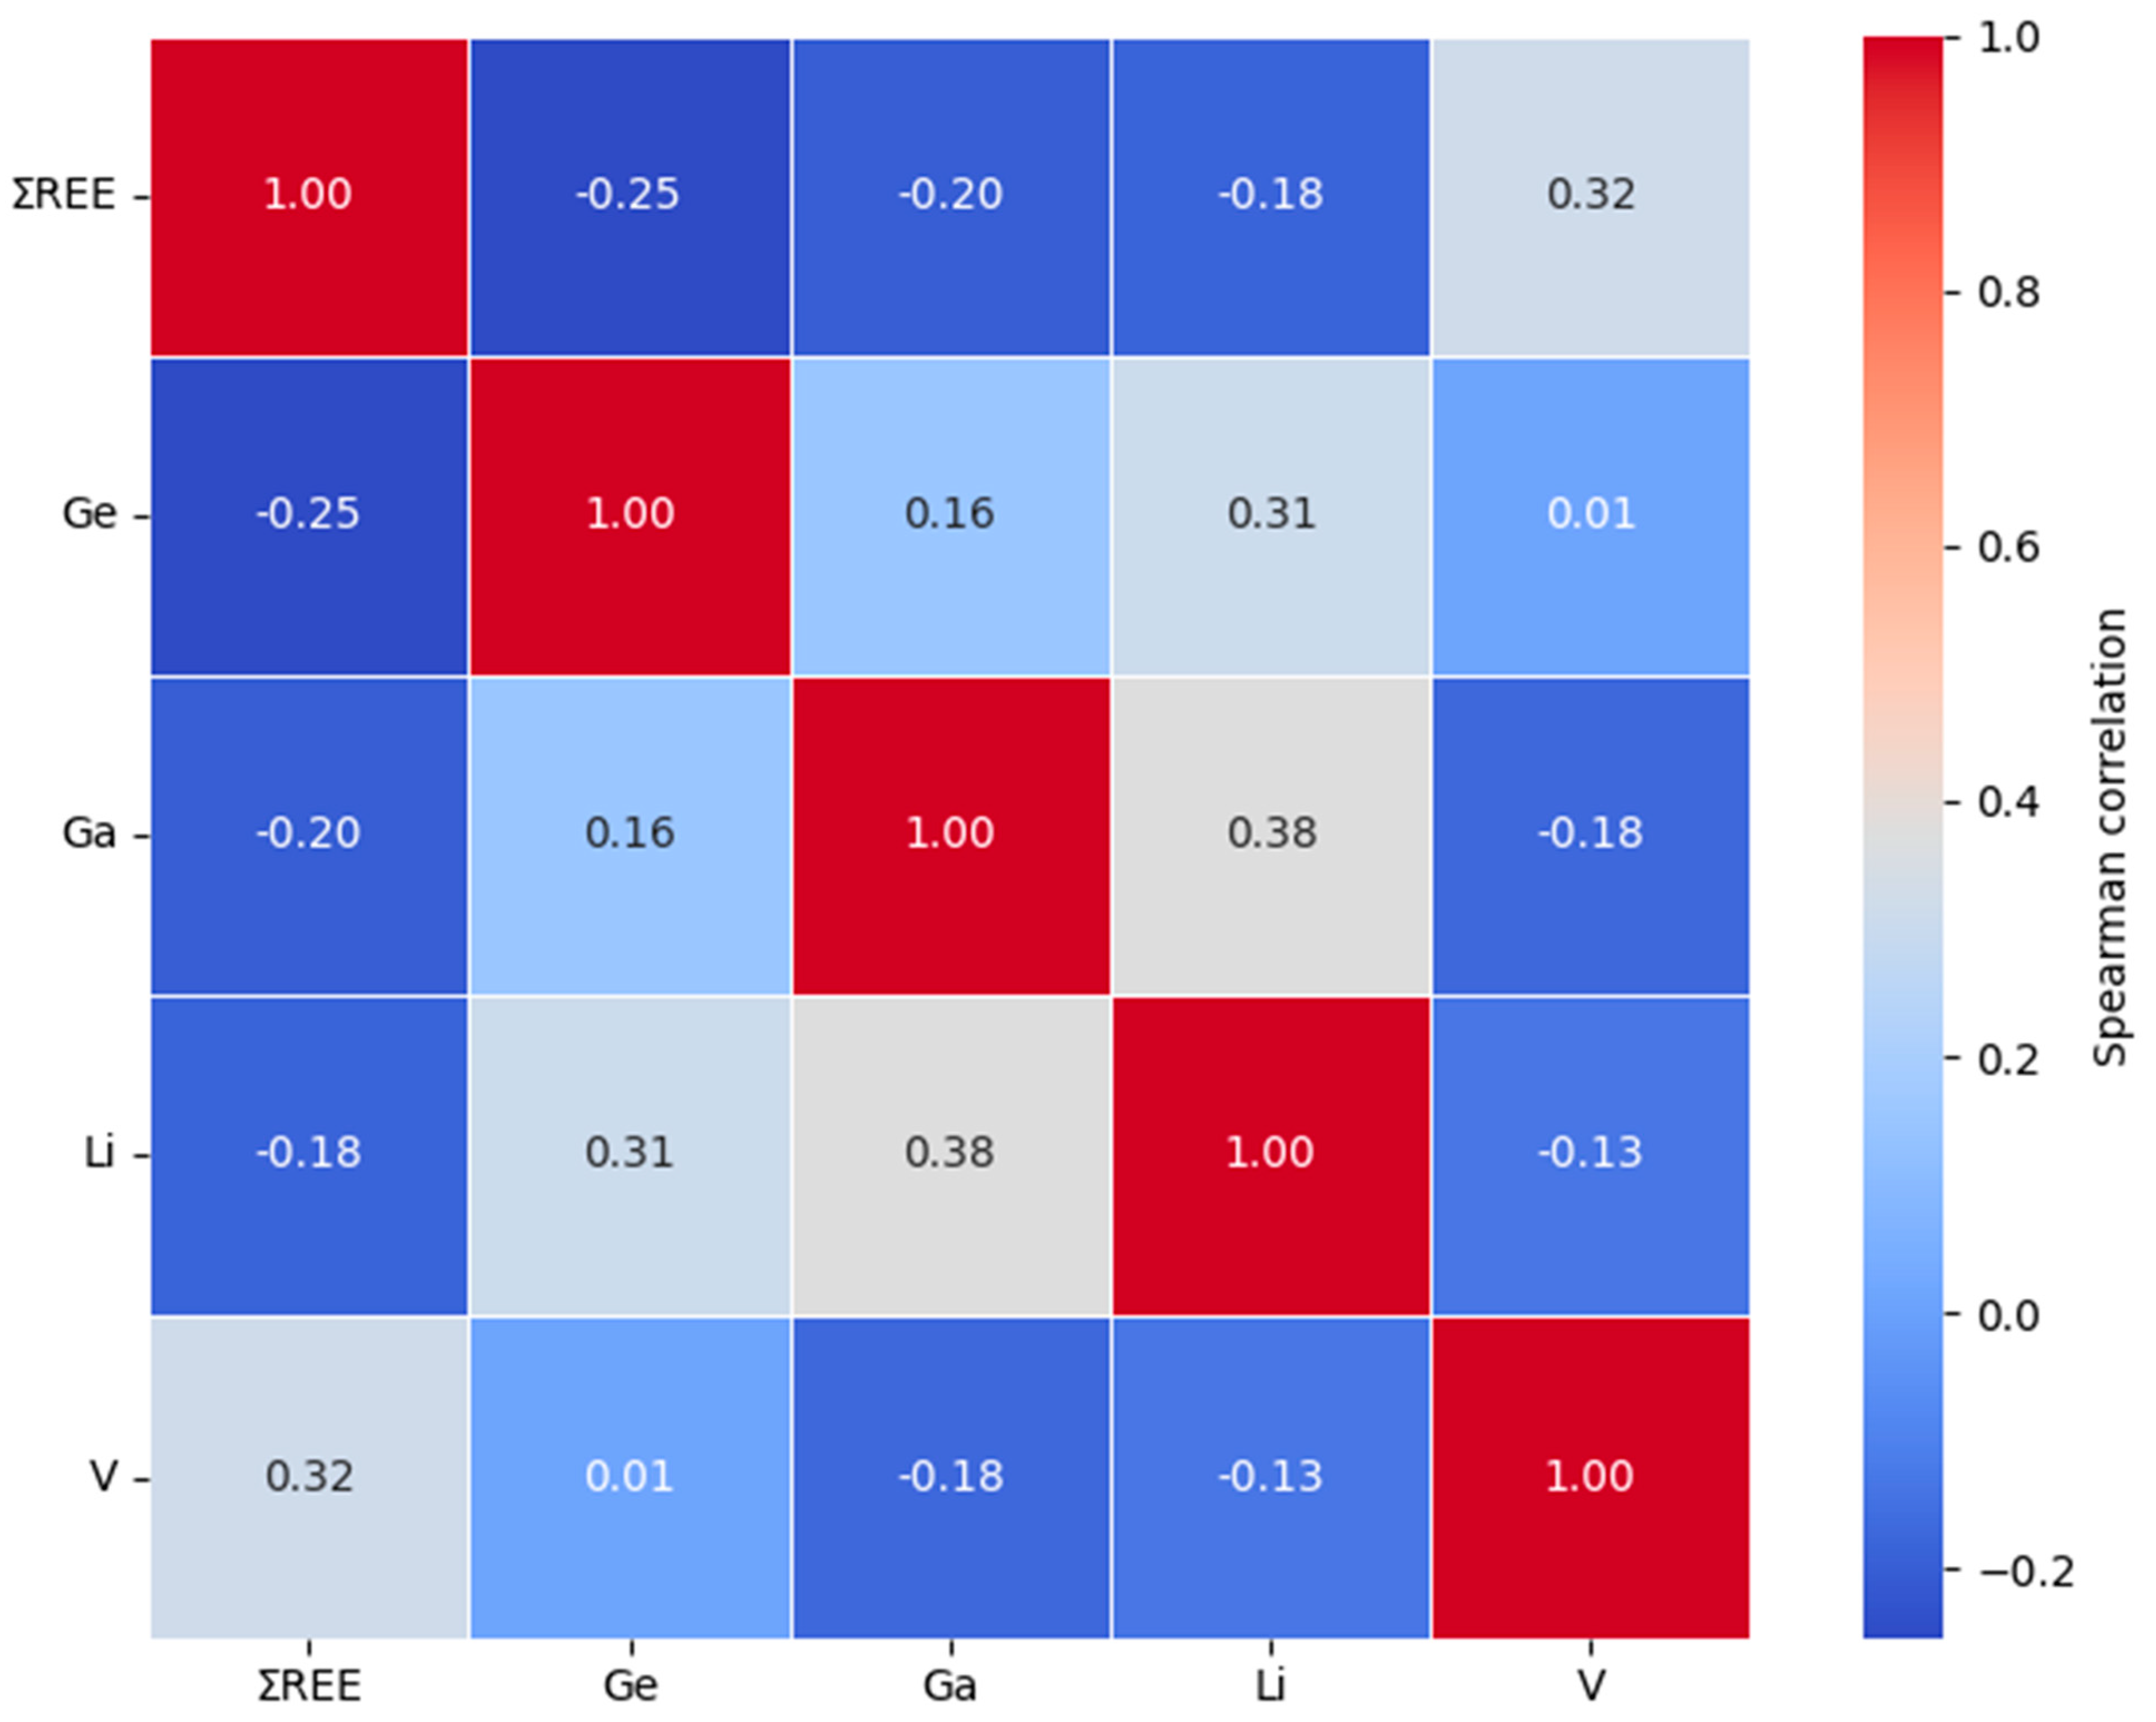
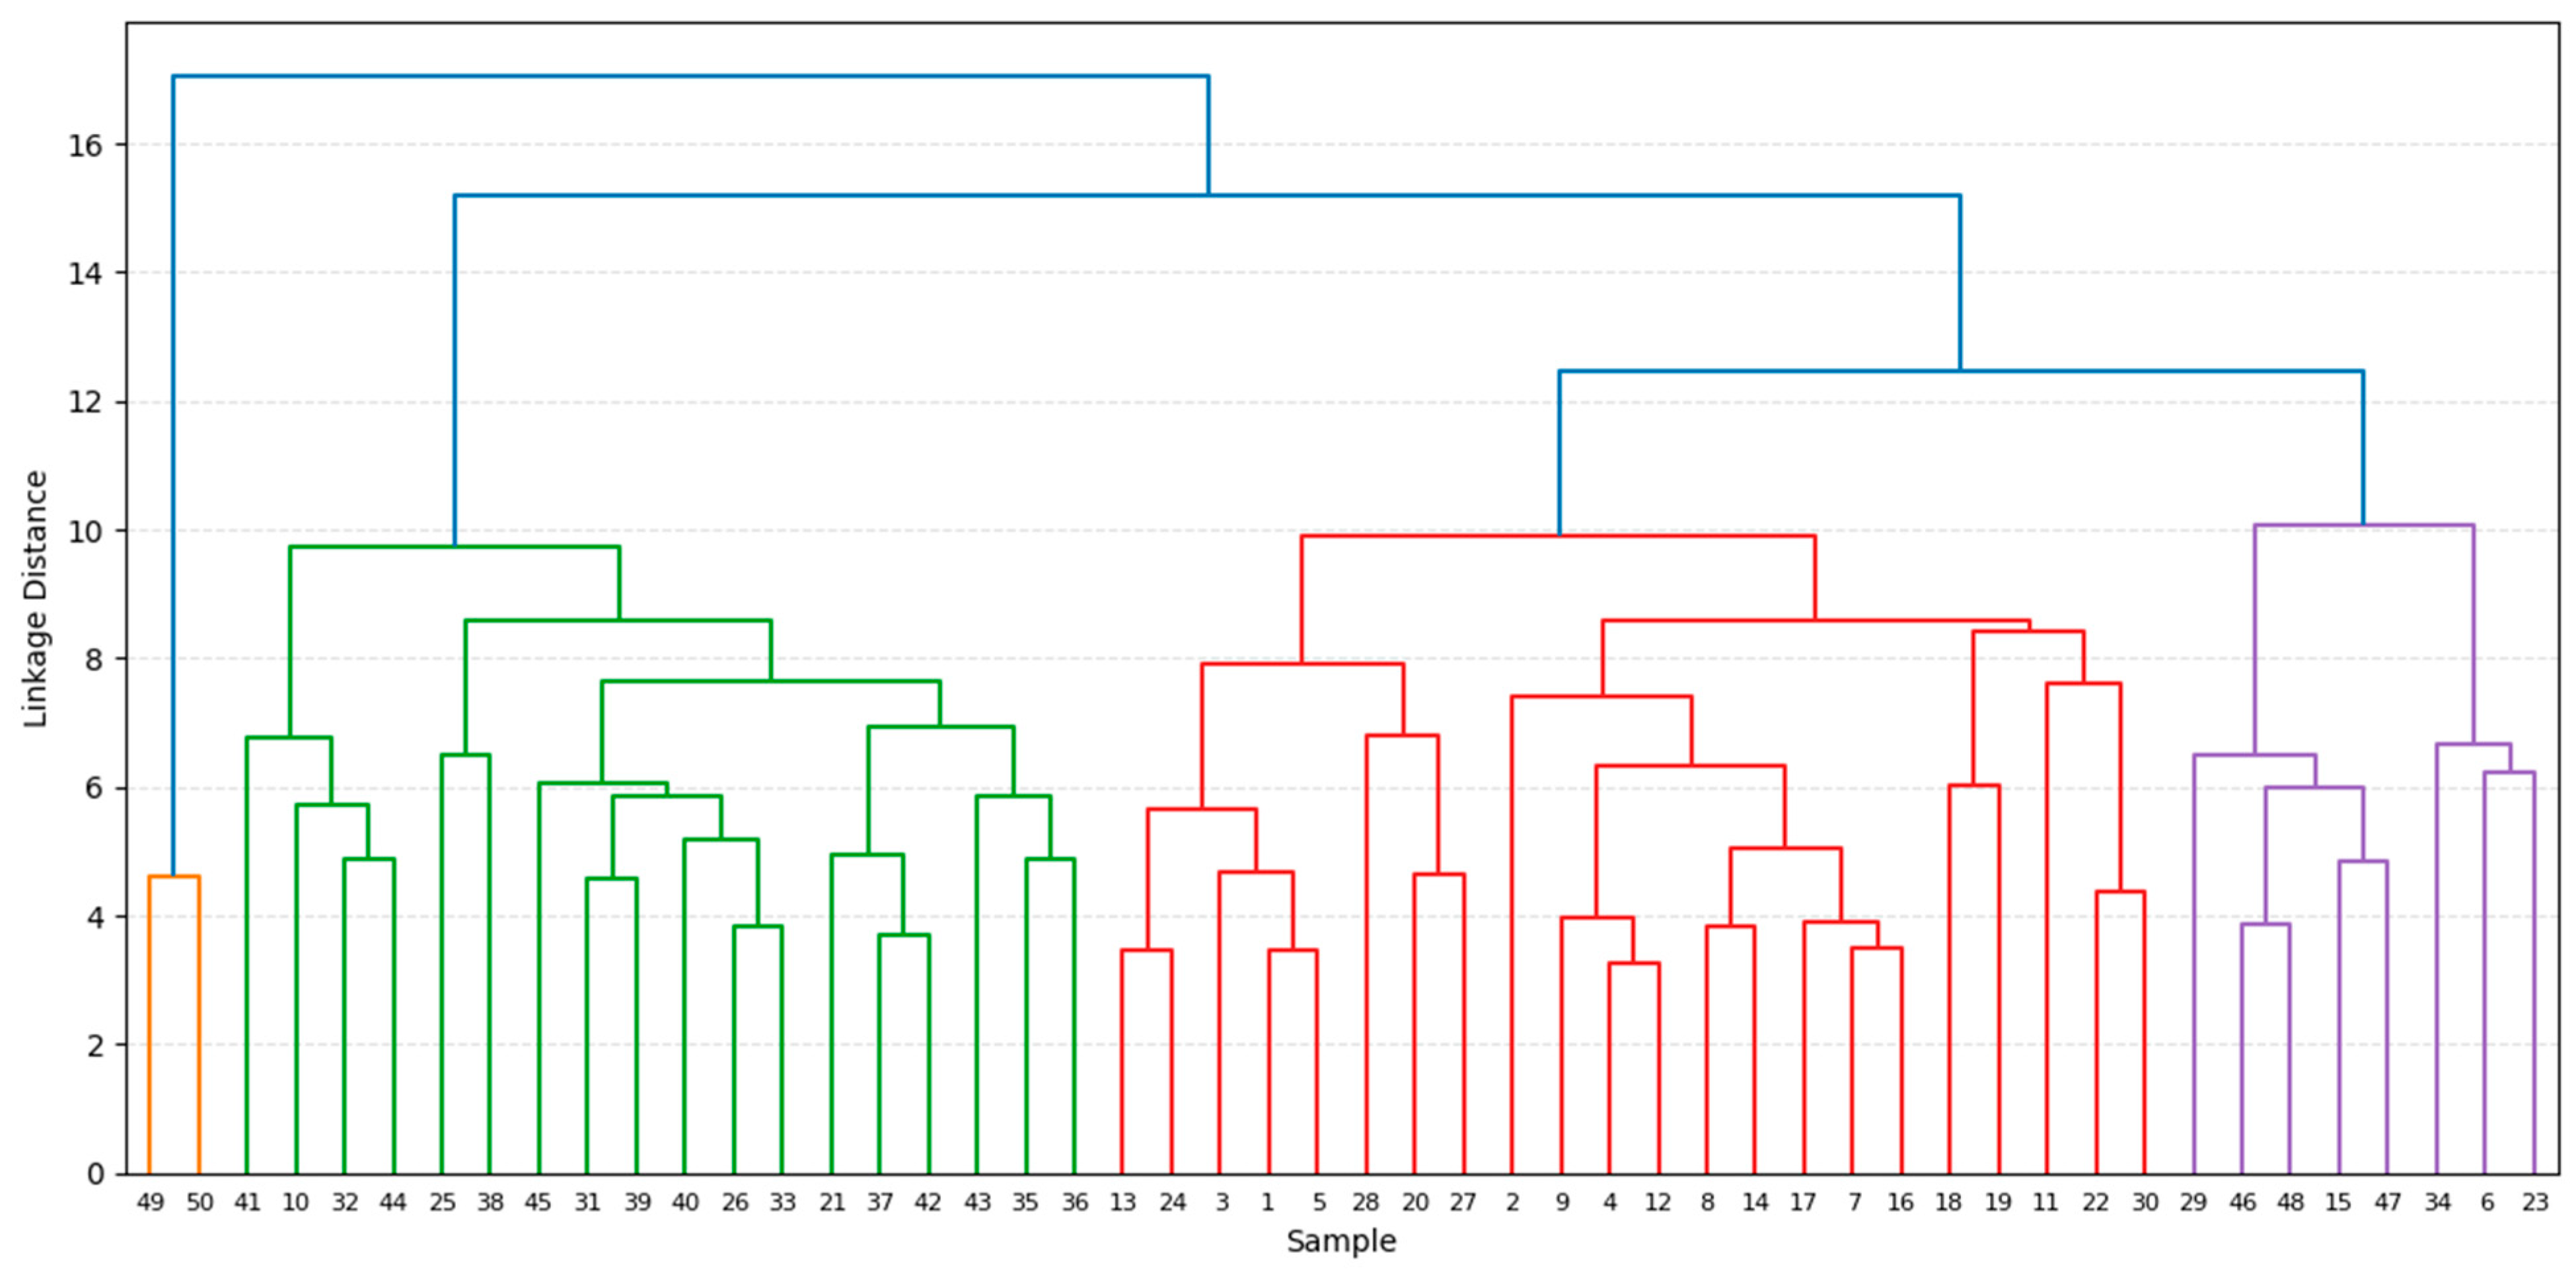
3.2. Pattern Recognition and Multivariate Analysis
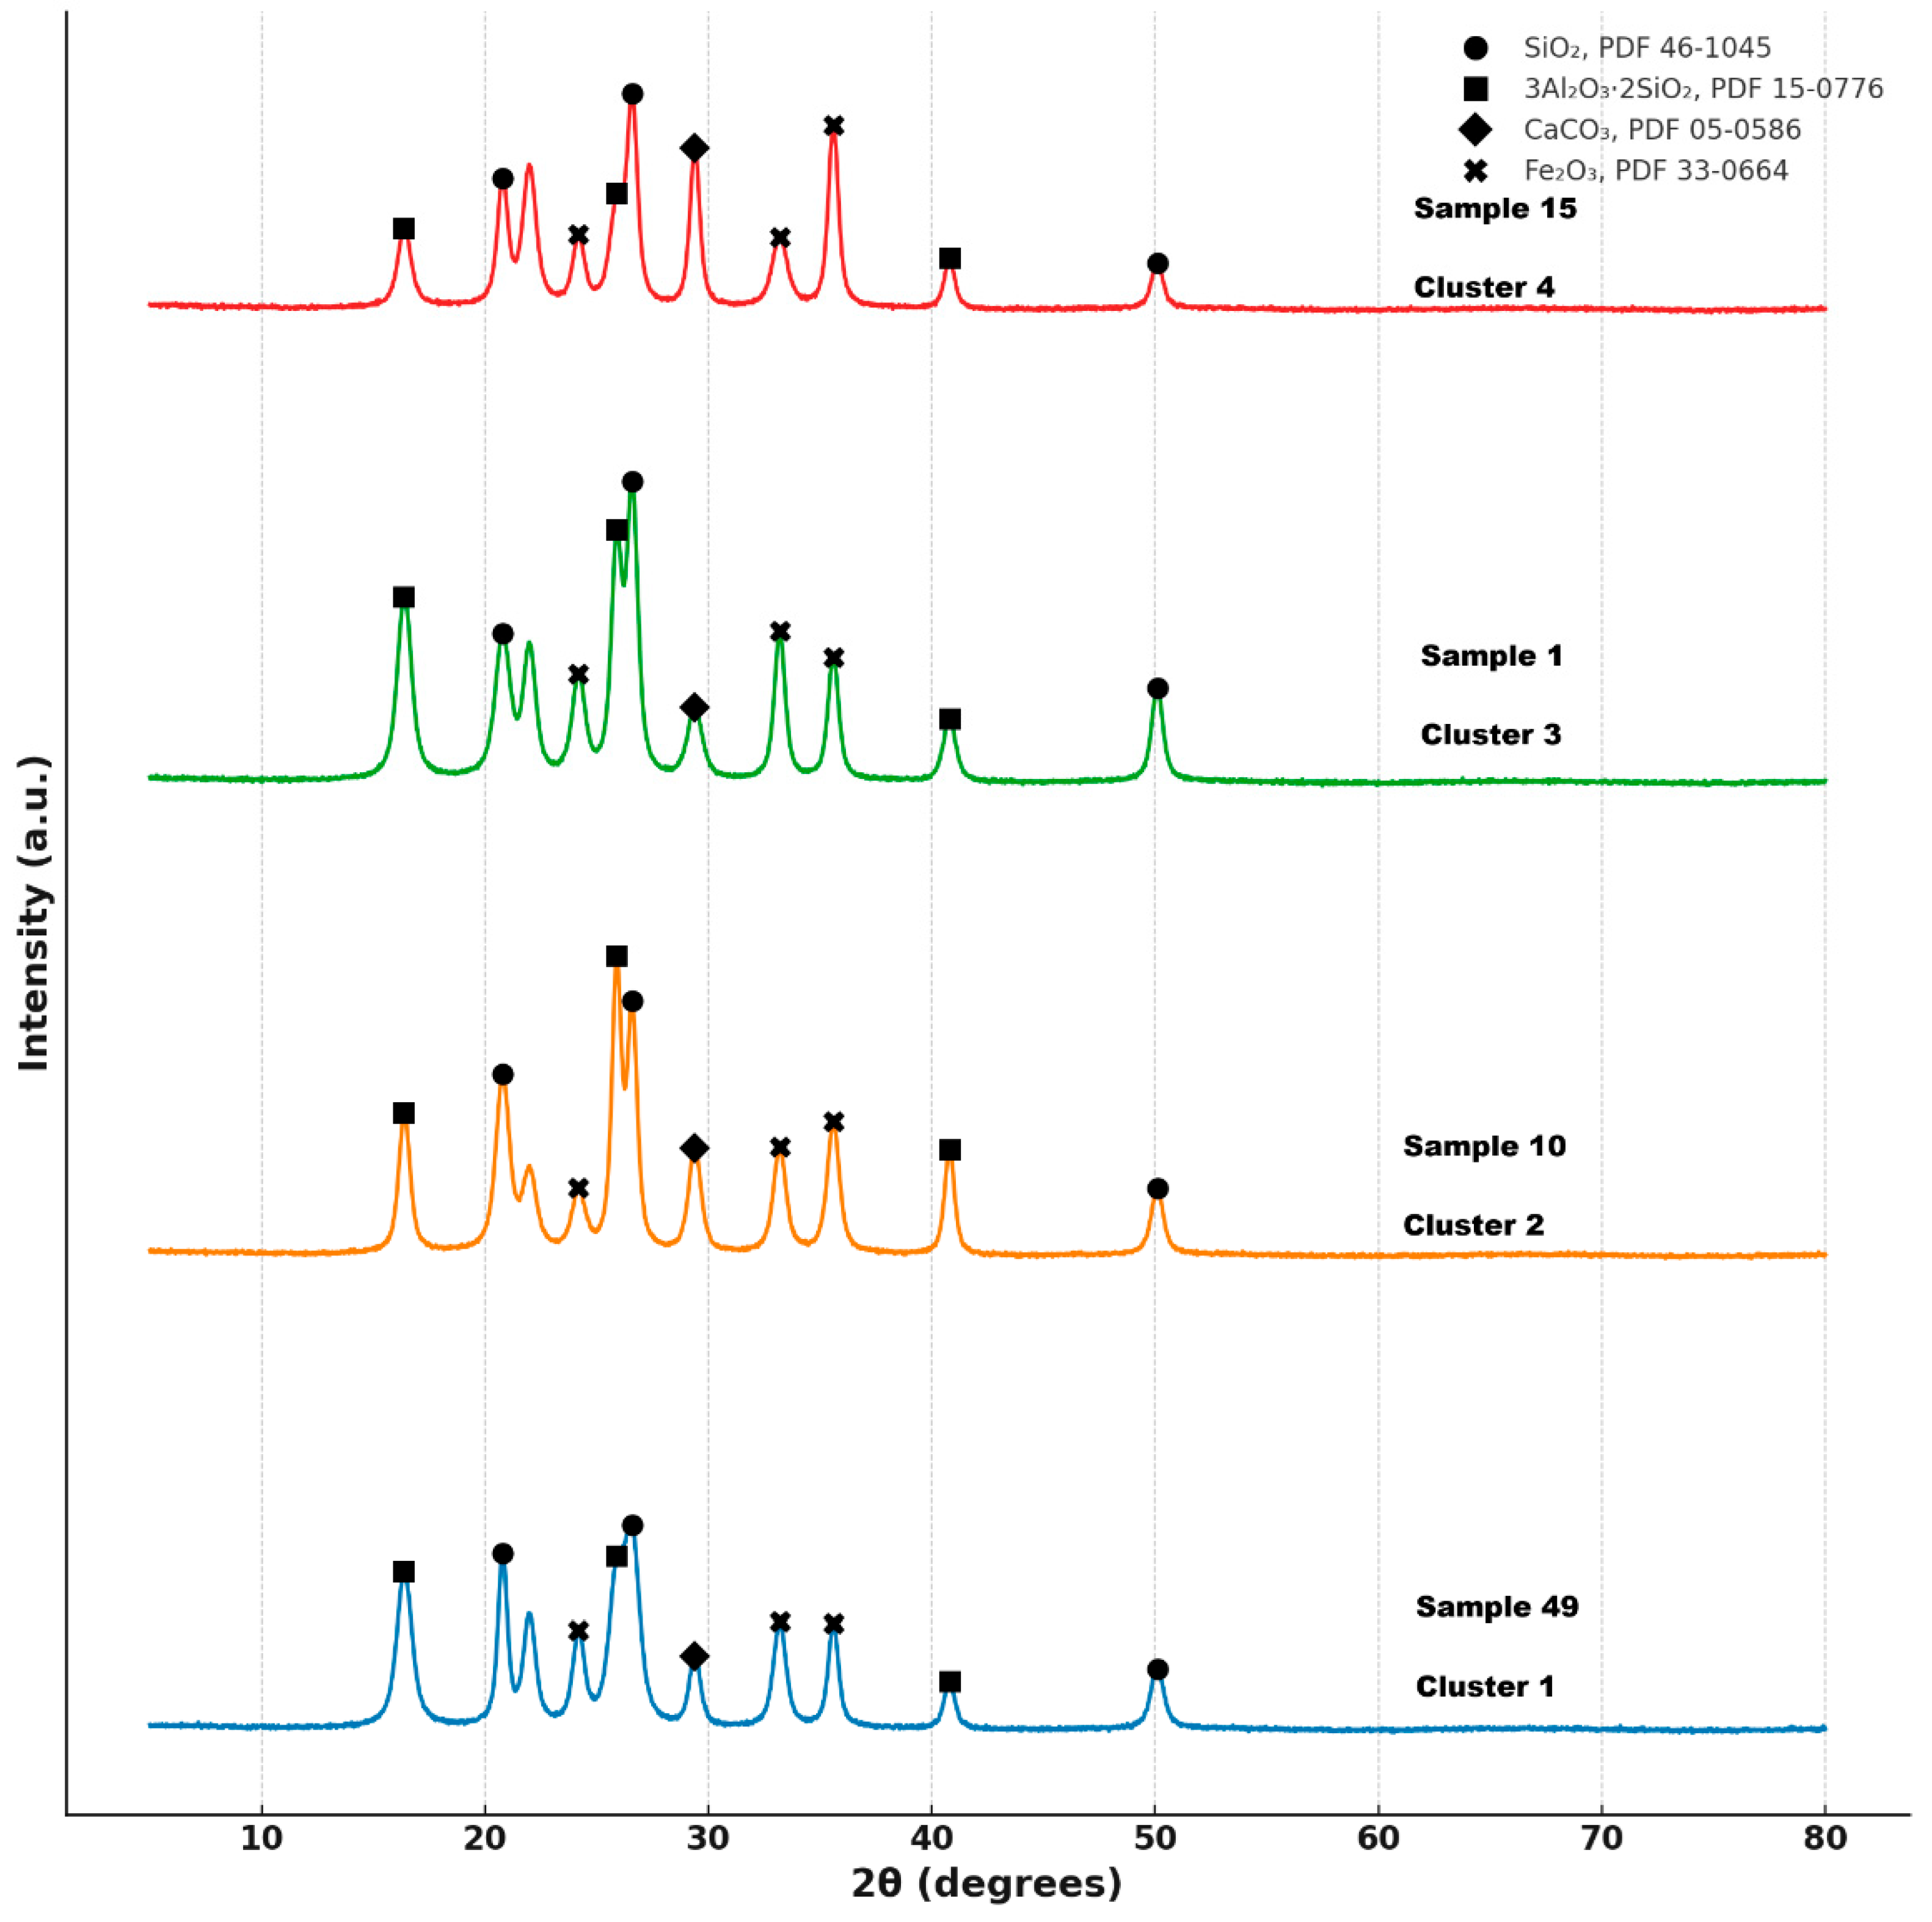
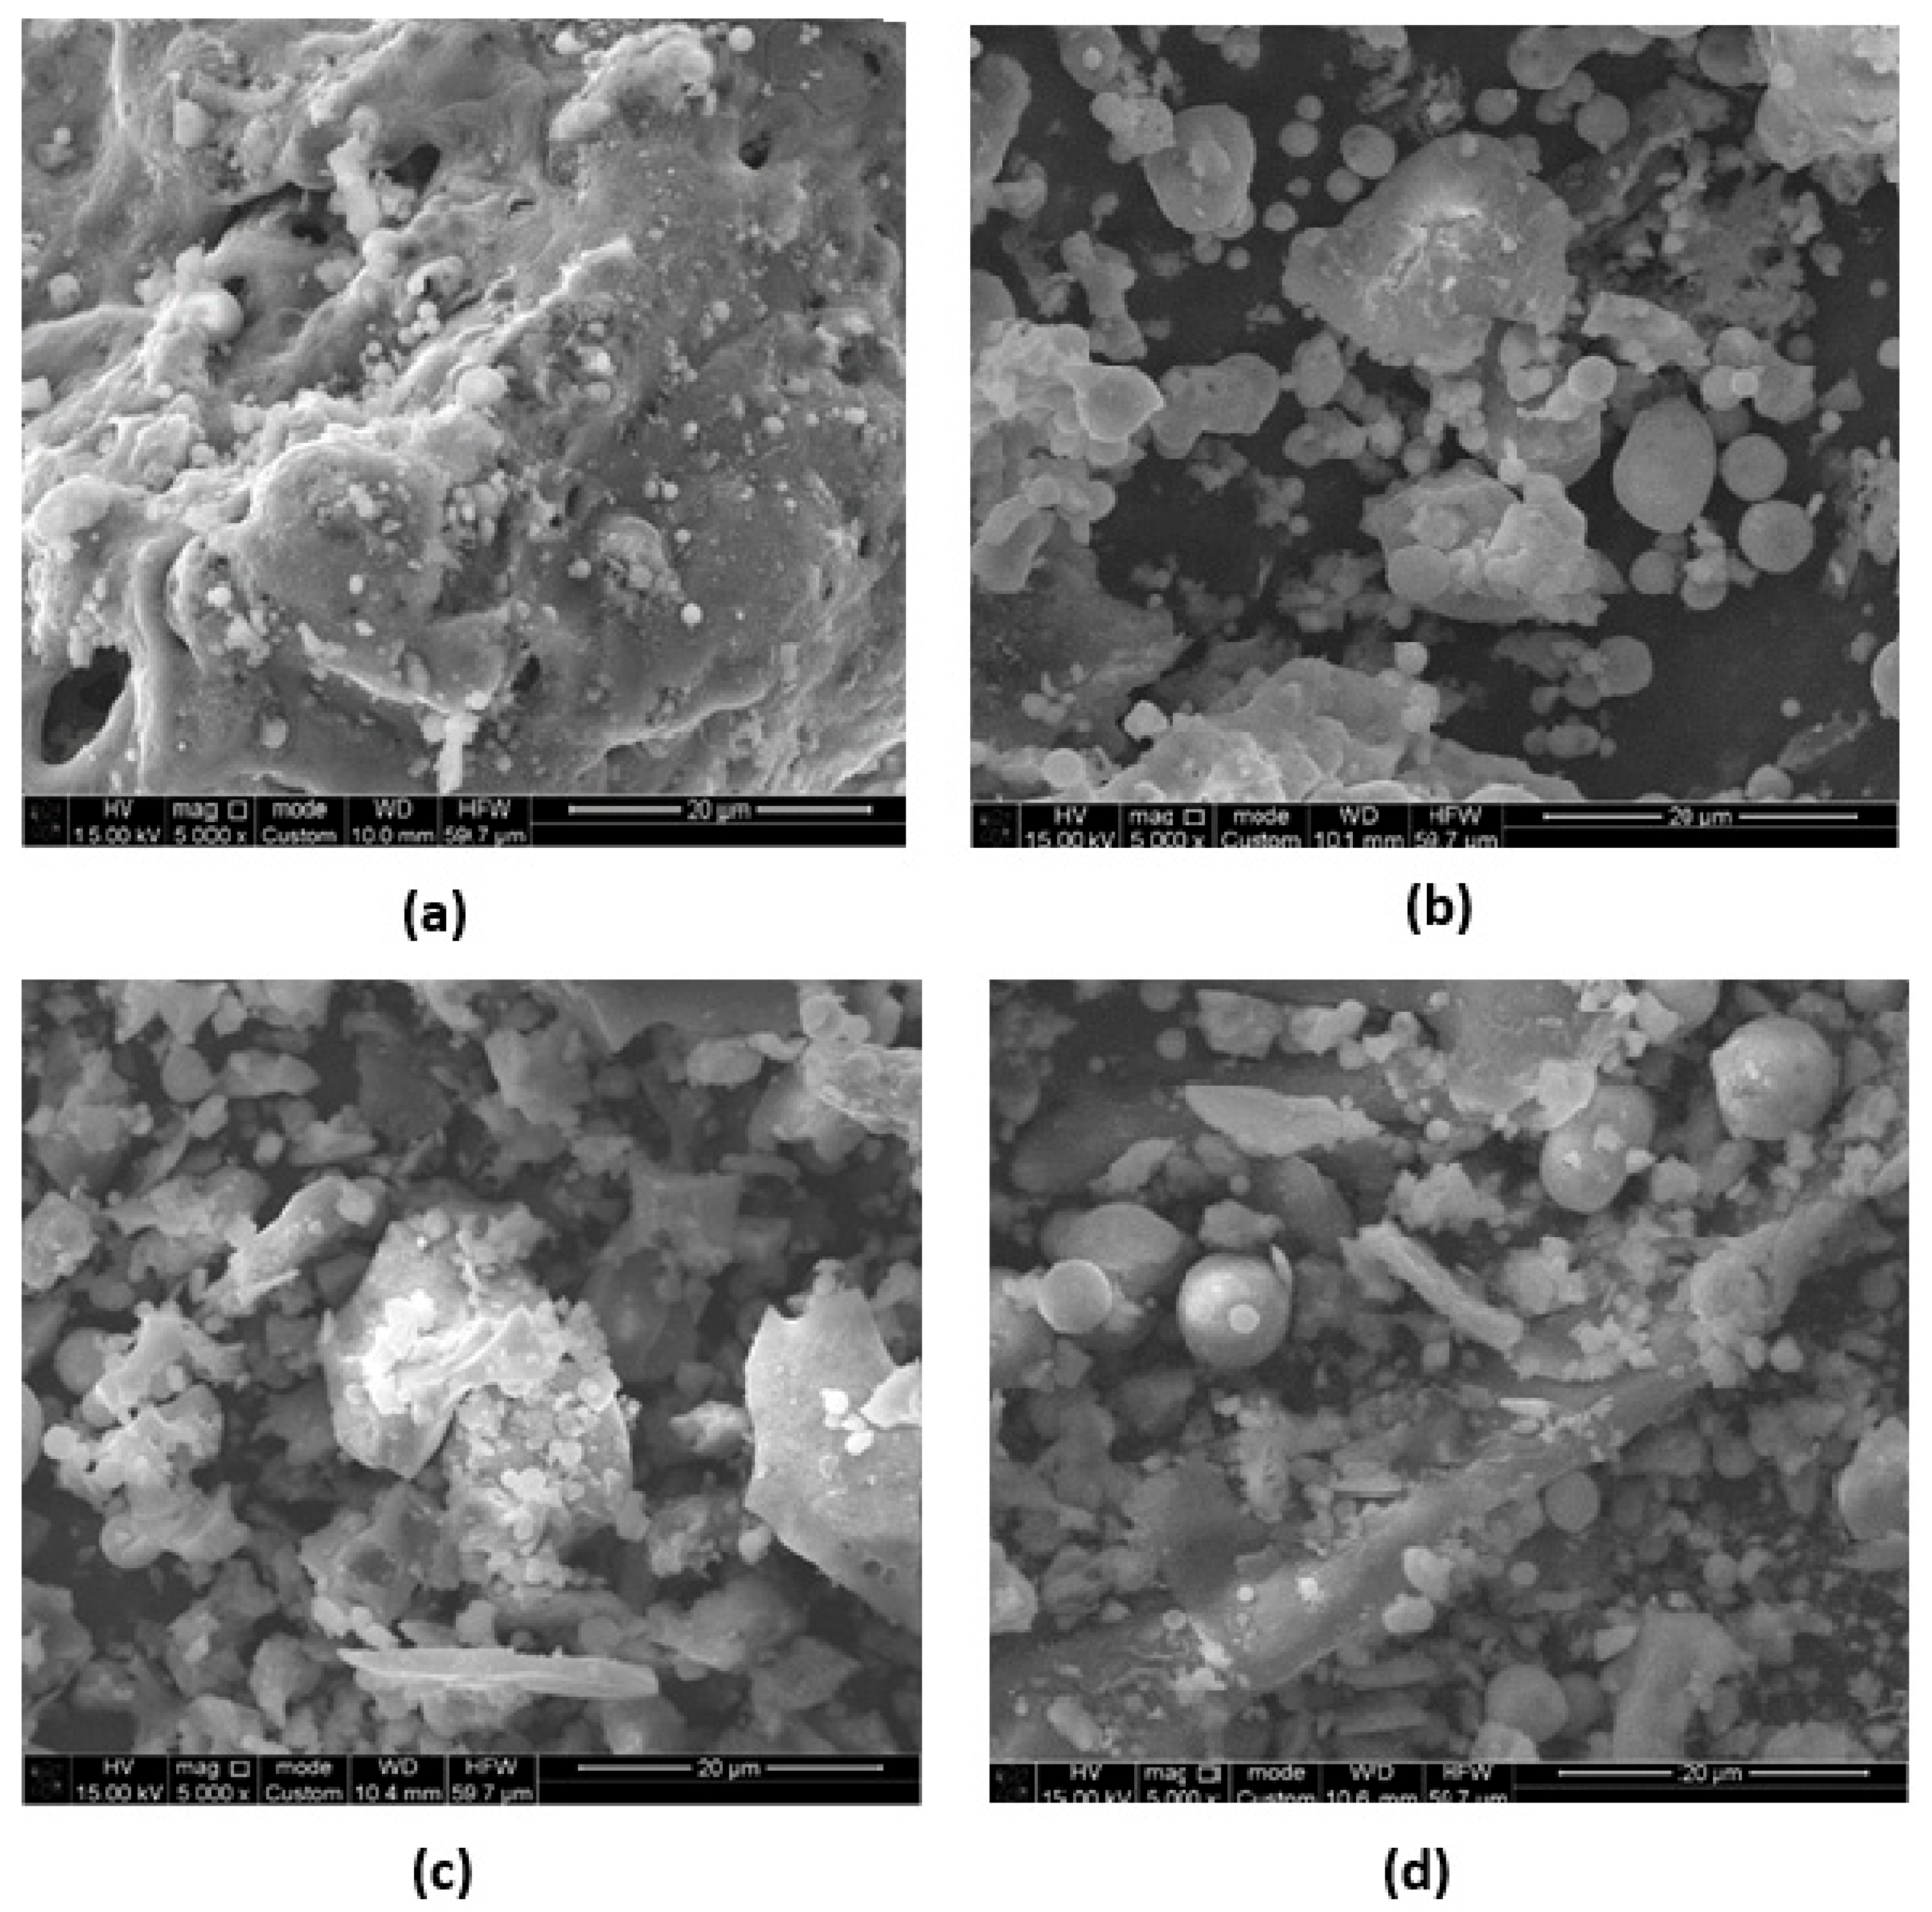
3.3. Mineralogical and Microstructural Characterization
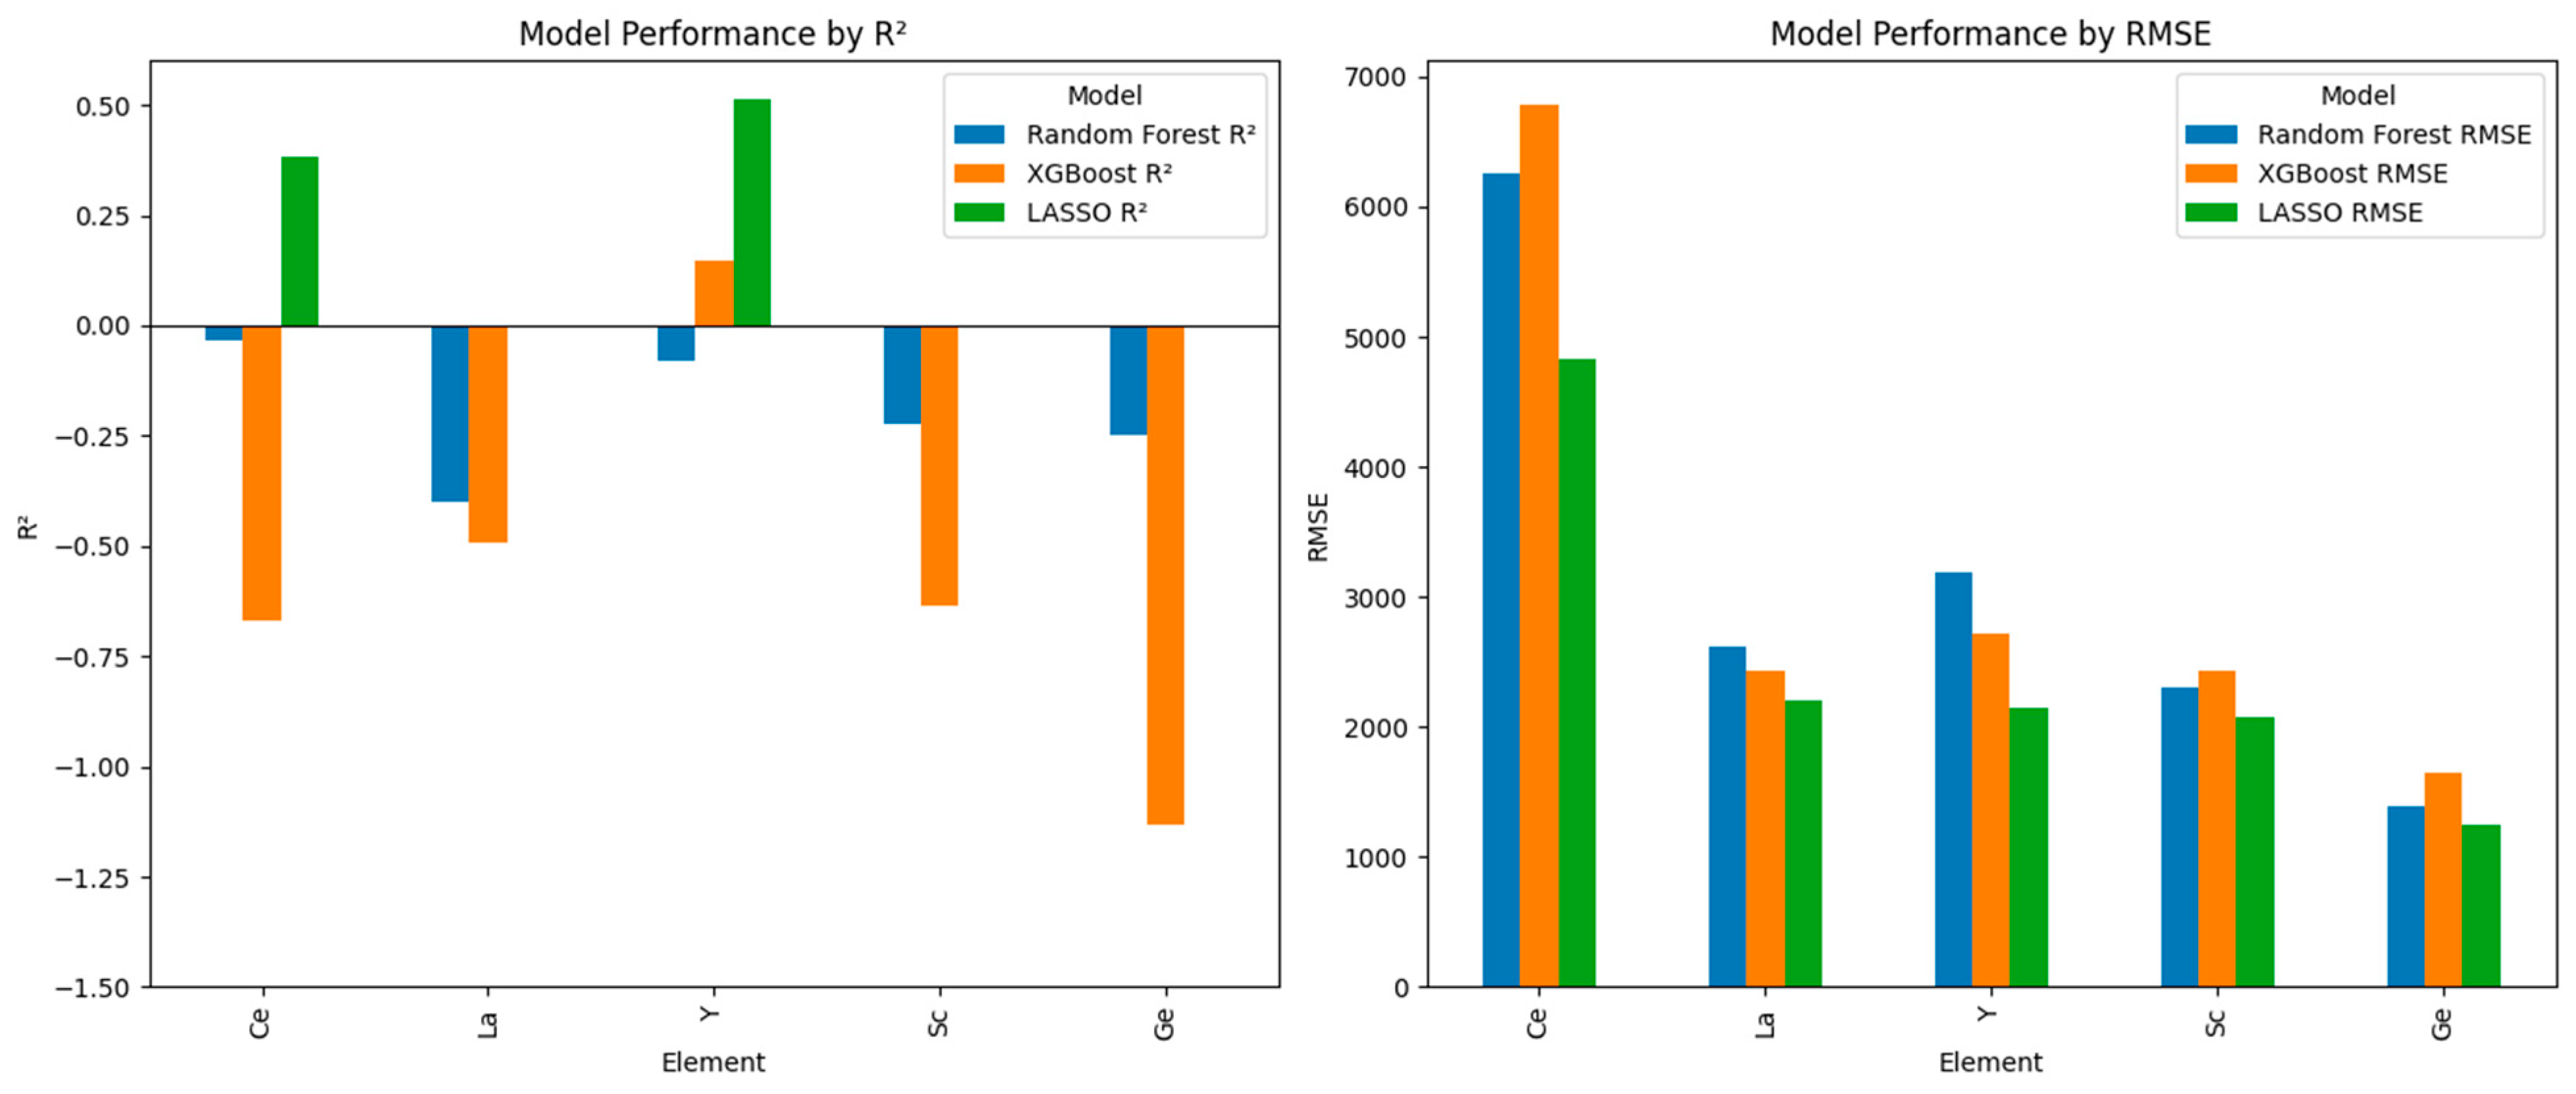
3.4. Machine-Learning-Based Prediction of REE and Ge Enrichment
4. Integrated Interpretation and Implications
5. Conclusions
Supplementary Materials
Author Contributions
Funding
Data Availability Statement
Conflicts of Interest
References
- Bhattacharya, S.S.; Kim, K.H. Utilization of coal ash: Is vermitechnology a sustainable avenue? Renew. Sustain. Energy Rev. 2016, 58, 1376–1386. [Google Scholar] [CrossRef]
- Shi, W.; Bai, J.; Kong, L.; Li, H.; Bai, Z.; Vassilev, S.V.; Li, W. An overview of the coal ash transition process from solid to slag. Fuel 2021, 287, 119537. [Google Scholar] [CrossRef]
- Petrović, M.; Fiket, Ž. Environmental damage caused by coal combustion residue disposal: A critical review of risk assessment methodologies. Chemosphere 2022, 299, 134410. [Google Scholar] [CrossRef]
- Thomas, B.S.; Dimitriadis, P.; Kundu, C.; Vuppaladadiyam, S.S.V.; Raman, R.S.; Bhattacharya, S. Extraction and separation of rare earth elements from coal and coal fly ash: A review on fundamental understanding and on-going engineering advancements. J. Environ. Chem. Eng. 2024, 12, 112769. [Google Scholar] [CrossRef]
- Dodbiba, G.; Fujita, T. Trends in extraction of rare earth elements from coal ashes: A review. Recycling 2023, 8, 17. [Google Scholar] [CrossRef]
- Fu, B.; Hower, J.C.; Zhang, W.; Luo, G.; Hu, H.; Yao, H. A review of rare earth elements and yttrium in coal ash: Content, modes of occurrences, combustion behavior, and extraction methods. Prog. Energy Combust. Sci. 2022, 88, 100954. [Google Scholar] [CrossRef]
- Rybak, A.; Rybak, A. Characteristics of some selected methods of rare earth elements recovery from coal fly ashes. Metals 2021, 11, 142. [Google Scholar] [CrossRef]
- Rudnik, E. Challenges and Opportunities in Hydrometallurgical Recovery of Germanium from Coal By-Products. Molecules 2025, 30, 1695. [Google Scholar] [CrossRef]
- Zhou, C.; Du, J.; Zhang, Y.; Sun, J.; Wu, W.; Liu, G. Redistribution and transformation mechanisms of gallium and germanium during coal combustion. Fuel 2021, 305, 121532. [Google Scholar] [CrossRef]
- Meshram, P.; Abhilash. Strategies for recycling of primary and secondary resources for germanium extraction. Min. Metall. Explor. 2022, 39, 689–707. [Google Scholar] [CrossRef]
- Balaram, V. Sources and applications of rare earth elements. Environ. Technol. Treat Rare Earth Elem. Pollut. Princ. Eng. 2022, 113, 75–113. [Google Scholar]
- Jiang, Y.; Fu, H.; Liang, Z.; Zhang, Q.; Du, Y. Rare earth oxide based electrocatalysts: Synthesis, properties and applications. Chem. Soc. Rev. 2024, 53, 714–763. [Google Scholar] [CrossRef]
- Chai, S.-S.; Zhang, W.-B.; Yang, J.-L.; Zhang, L.; Theint, M.M.; Zhang, X.-L.; Guo, S.-B.; Zhou, X.; Ma, X.-J. Sustainability applications of rare earths from metallurgy, magnetism, catalysis, luminescence to future electrochemical pseudocapacitance energy storage. RSC Sustain. 2023, 1, 38–71. [Google Scholar] [CrossRef]
- Malavekar, D.B.; Magdum, V.V.; Khot, S.D.; Kim, J.H.; Lokhande, C.D. Doping of rare earth elements: Towards enhancing the electrochemical performance of pseudocapacitive materials. J. Alloys Compd. 2023, 960, 170601. [Google Scholar] [CrossRef]
- Junior, A.B.; Espinosa, D.C.R.; Vaughan, J.; Tenório, J.A.S. Recovery of scandium from various sources: A critical review of the state of the art and future prospects. Miner. Eng. 2021, 172, 107148. [Google Scholar] [CrossRef]
- Røyset, J.; Ryum, N. Scandium in aluminium alloys. Int. Mater. Rev. 2005, 50, 19–44. [Google Scholar] [CrossRef]
- Yamada, Y.; Yoneda, M.; Fukuzumi, S. High and robust performance of H2O2 fuel cells in the presence of scandium ion. Energy Environ. Sci. 2015, 8, 1698–1701. [Google Scholar] [CrossRef]
- Phoung, S.; Williams, E.; Gaustad, G.; Gupta, A. Exploring global supply and demand of scandium oxide in 2030. J. Clean. Prod. 2023, 401, 136673. [Google Scholar] [CrossRef]
- Priyadarshini, P.; Sahoo, D.; Naik, R. A review on the optical properties of some germanium based chalcogenide thin films and their applications. Opt. Quantum Electron. 2022, 54, 166. [Google Scholar] [CrossRef]
- Osterthun, N.; Neugebohrn, N.; Gehrke, K.; Vehse, M.; Agert, C. Spectral engineering of ultrathin germanium solar cells for combined photovoltaic and photosynthesis. Opt. Express 2021, 29, 938–950. [Google Scholar] [CrossRef]
- Kamble, G.U.; Shin, S.W.; Park, S.W.; Gaikwad, M.A.; Karade, V.C.; Jang, J.S.; Park, Y.; Ghorpade, U.V.; Suryawanshi, M.P.; Kim, J.H. Germanium Selenide: A Critical Review on Recent Advances in Material Development for Photovoltaic and Photoelectrochemical Water-Splitting Applications. Sol. RRL 2023, 7, 2300502. [Google Scholar] [CrossRef]
- Chiara, R.; Morana, M.; Malavasi, L. Germanium-based halide perovskites: Materials, properties, and applications. ChemPlusChem 2021, 86, 879–888. [Google Scholar] [CrossRef]
- Ketegenov, T.; Kamunur, K.; Mussapyrova, L.; Batkal, A.; Nadirov, R. Enhancing Rare Earth Element Recovery from Coal Ash Using High-Voltage Electrical Pulses and Citric Acid Leaching. Minerals 2024, 14, 693. [Google Scholar] [CrossRef]
- Reedy, R.C.; Scanlon, B.R.; Bagdonas, D.A.; Hower, J.C.; James, D.; Kyle, J.R.; Uhlman, K. Coal ash resources and potential for rare earth element production in the United States. Int. J. Coal Sci. Technol. 2024, 11, 74. [Google Scholar] [CrossRef]
- Park, S.; Kim, M.; Lim, Y.; Yu, J.; Chen, S.; Woo, S.W.; Yoon, S.; Bae, S.; Kim, H.S. Characterization of rare earth elements present in coal ash by sequential extraction. J. Hazard. Mater. 2021, 402, 123760. [Google Scholar] [CrossRef]
- Banerjee, R.; Chakladar, S.; Mohanty, A.; Chattopadhyay, S.K.; Chakravarty, S. Leaching characteristics of rare earth elements from coal ash using organosulphonic acids. Miner. Eng. 2022, 185, 107664. [Google Scholar] [CrossRef]
- Berti, D.; Groppo, J.G.; Joshi, P.; Preda, D.V.; Gamliel, D.P.; Beers, T.; Schrock, M.; Hopps, S.D.; Morgan, T.D.; Hower, J.C.; et al. Electron microbeam investigations of the spent ash from the pilot-scale acid extraction of rare earth elements from a beneficiated Kentucky fly ash. Int. J. Coal Geol. 2025, 303, 104738. [Google Scholar] [CrossRef]
- Liu, C.; Yang, Y.; Chen, L.; Wu, J.; Sun, Y.; Han, M.; Guo, X.; He, M.; Jin, Z. Rare earth resource in fly ashes from coal power plants of China: Based on machine learning model and unit-based estimation. Int. J. Coal Geol. 2025, 303, 104743. [Google Scholar] [CrossRef]
- Zhou, C.; Li, C.; Li, W.; Sun, J.; Li, Q.; Wu, W.; Liu, G. Distribution and preconcentration of critical elements from coal fly ash by integrated physical separations. Int. J. Coal Geol. 2022, 261, 104095. [Google Scholar] [CrossRef]
- Wen, Z.; Liu, H.; Zhou, M.; Liu, C.; Zhou, C. Explainable machine learning rapid approach to evaluate coal ash content based on X-ray fluorescence. Fuel 2023, 332, 125991. [Google Scholar] [CrossRef]
- Qi, C.; Wu, M.; Zheng, J.; Chen, Q.; Chai, L. Rapid identification of reactivity for the efficient recycling of coal fly ash: Hybrid machine learning modeling and interpretation. J. Clean. Prod. 2022, 343, 130958. [Google Scholar] [CrossRef]
- Wu, M.; Qi, C.; Chen, Q.; Liu, H. Evaluating the metal recovery potential of coal fly ash based on sequential extraction and machine learning. Environ. Res. 2023, 224, 115546. [Google Scholar] [CrossRef]
- Ashraf, M.W.; Tu, Y.; Khan, A.; Siddiqui, A.S.; Mubarak, S.; Sufian, M.; Ullah, S.; Wang, C. Experimental and explainable machine learning based investigation of the coal bottom ash replacement in sustainable concrete production. J. Build. Eng. 2025, 104, 112367. [Google Scholar] [CrossRef]
- Dev, K.L.; Kumar, D.R.; Wipulanusat, W. Machine learning prediction of the unconfined compressive strength of controlled low strength material using fly ash and pond ash. Sci. Rep. 2024, 14, 27540. [Google Scholar] [CrossRef]
- Chatterjee, S.; Mastalerz, M.; Drobniak, A.; Karacan, C.Ö. Machine learning data augmentation approach for identification of rare earth element potential in Indiana Coals, USA. Int. J. Coal Geol. 2022, 259, 104054. [Google Scholar] [CrossRef]
- Chatterjee, S.; Karacan, C.Ö.; Mastalerz, M. Exploring the uncertainty of machine learning models and geostatistical mapping of rare earth element potential in Indiana coals, USA. Int. J. Coal Geol. 2024, 282, 104419. [Google Scholar] [CrossRef]
- Bhatt, C.R.; Jain, J.C.; Bol’shakov, A.A.; McIntyre, D.L. Chemistry imaging and distribution analysis of rare earth elements in coal using LIBS and LA-ICP-MS instruments. Int. J. Coal Geol. 2025, 301, 104710. [Google Scholar] [CrossRef]
- Song, Y.; Zhao, Y.; Ginella, A.; Gallagher, B.; Sant, G.; Bauchy, M. Predicting rare earth elements concentration in coal ashes with multi-task neural networks. Mater. Horiz. 2024, 11, 1448–1464. [Google Scholar] [CrossRef]
- Xu, N.; Li, Q. Threshold value determination using machine learning algorithms for Ba interference with Eu in coal and coal combustion products by ICP-MS. Minerals 2019, 9, 259. [Google Scholar] [CrossRef]
- Wang, P.; Liu, H.; Zheng, F.; Liu, Y.; Kuang, G.; Deng, R.; Li, H. Extraction of aluminum from coal fly ash using pressurized sulfuric acid leaching with emphasis on optimization and mechanism. Jom 2021, 73, 2643–2651. [Google Scholar] [CrossRef]
- Eminagaoglu, M.; Oskay, R.G.; Karayigit, A.I. Evaluation of elemental affinities in coal using agglomerative hierarchical clustering algorithm: A case study in a thick and mineable coal seam (kM2) from Soma Basin (W. Turkey). Int. J. Coal Geol. 2022, 259, 104045. [Google Scholar] [CrossRef]
- Xu, N.; Finkelman, R.B.; Dai, S.; Xu, C.; Peng, M. Average linkage hierarchical clustering algorithm for determining the relationships between elements in coal. ACS Omega 2021, 6, 6206–6217. [Google Scholar] [CrossRef] [PubMed]
- Xu, N.; Li, Q.; Zhu, W.; Finkelman, R.B.; Engle, M.A.; Wang, R.; Wang, Z. Advocating the Use of Bayesian Network in Analyzing the Modes of Occurrence of Elements in Coal. ACS Omega 2023, 8, 39096–39109. [Google Scholar] [CrossRef] [PubMed]
- Reimann, C.; Filzmoser, P.; Hron, K.; Kynčlová, P.; Garrett, R.G. A new method for correlation analysis of compositional (environmental) data–a worked example. Sci. Total Environ. 2017, 607, 965–971. [Google Scholar] [CrossRef]
- Bishop, B.A.; Shivakumar, K.R.; Alessi, D.S.; Robbins, L.J. Insights into the rare earth element potential of coal combustion by-products from western Canada. Environ. Sci. Adv. 2023, 2, 529–542. [Google Scholar] [CrossRef]
- Filzmoser, P.; Hron, K.; Reimann, C. Principal component analysis for compositional data with outliers. Environmetr. Off. J. Int. Environmetr. Soc. 2009, 20, 621–632. [Google Scholar] [CrossRef]
- Taggart, R.K.; Hower, J.C.; Dwyer, G.S.; Hsu-Kim, H. Trends in the rare earth element content of US-based coal combustion fly ashes. Environ. Sci. Technol. 2016, 50, 5919–5926. [Google Scholar] [CrossRef]
- Blissett, R.S.; Rowson, N.A. A review of the multi-component utilisation of coal fly ash. Fuel 2012, 97, 1–23. [Google Scholar] [CrossRef]


| Cluster ID | Sample IDs | SiO2, wt % | Al2O3, wt % | Fe2O3, wt % | CaO, wt % | P2O5, wt % | LOI, wt % | Ce, mg/kg | La, mg/kg | Y, mg/kg | Sc, mg/kg | Ge, mg/kg |
|---|---|---|---|---|---|---|---|---|---|---|---|---|
| 1 | 49, 50 | 53.6 | 26.6 | 6.8 | 3.8 | 0.5 | 10.2 | 38,676 | 15,006 | 20,008 | 13,586 | 11,174 |
| 2 | 6, 15, 23, 29, 34, 46, 47, 48 | 60.3 | 29.9 | 7.7 | 4.9 | 0.6 | 7.8 | 52,702 | 19,697 | 26,874 | 15,950 | 13,722 |
| 3 | 1, 2, 3, 4, 5, 7, 8, 9, 12, 13, 14, 16, 17, 20, 24, 27, 28, 43 | 63.4 | 27.9 | 8.2 | 4.4 | 0.6 | 10.3 | 52,207 | 18,876 | 24,449 | 17,258 | 13,047 |
| 4 | 10, 11, 18, 19, 21, 22, 25, 26, 30, 31, 32, 33, 35, 36, 37, 38, 39, 40, 41, 42, 44, 45 | 62.6 | 28.2 | 7.4 | 4.5 | 0.6 | 9.0 | 56,034 | 20,387 | 28,447 | 17,624 | 12,310 |
| Element | Random Forest | XGBoost | LASSO | |||
|---|---|---|---|---|---|---|
| R2 | RMSE | R2 | RMSE | R2 | RMSE | |
| Ce | −0.034 | 6249 | −0.671 | 6782 | 0.384 | 4823 |
| La | −0.398 | 2611 | −0.494 | 2439 | 0 | 2207 |
| Y | −0.079 | 3195 | 0.147 | 2714 | 0.513 | 2145 |
| Sc | −0.223 | 2299 | −0.636 | 2438 | 0 | 2079 |
| Ge | −0.25 | 1392 | −1.130 | 1647 | 0 | 1245 |
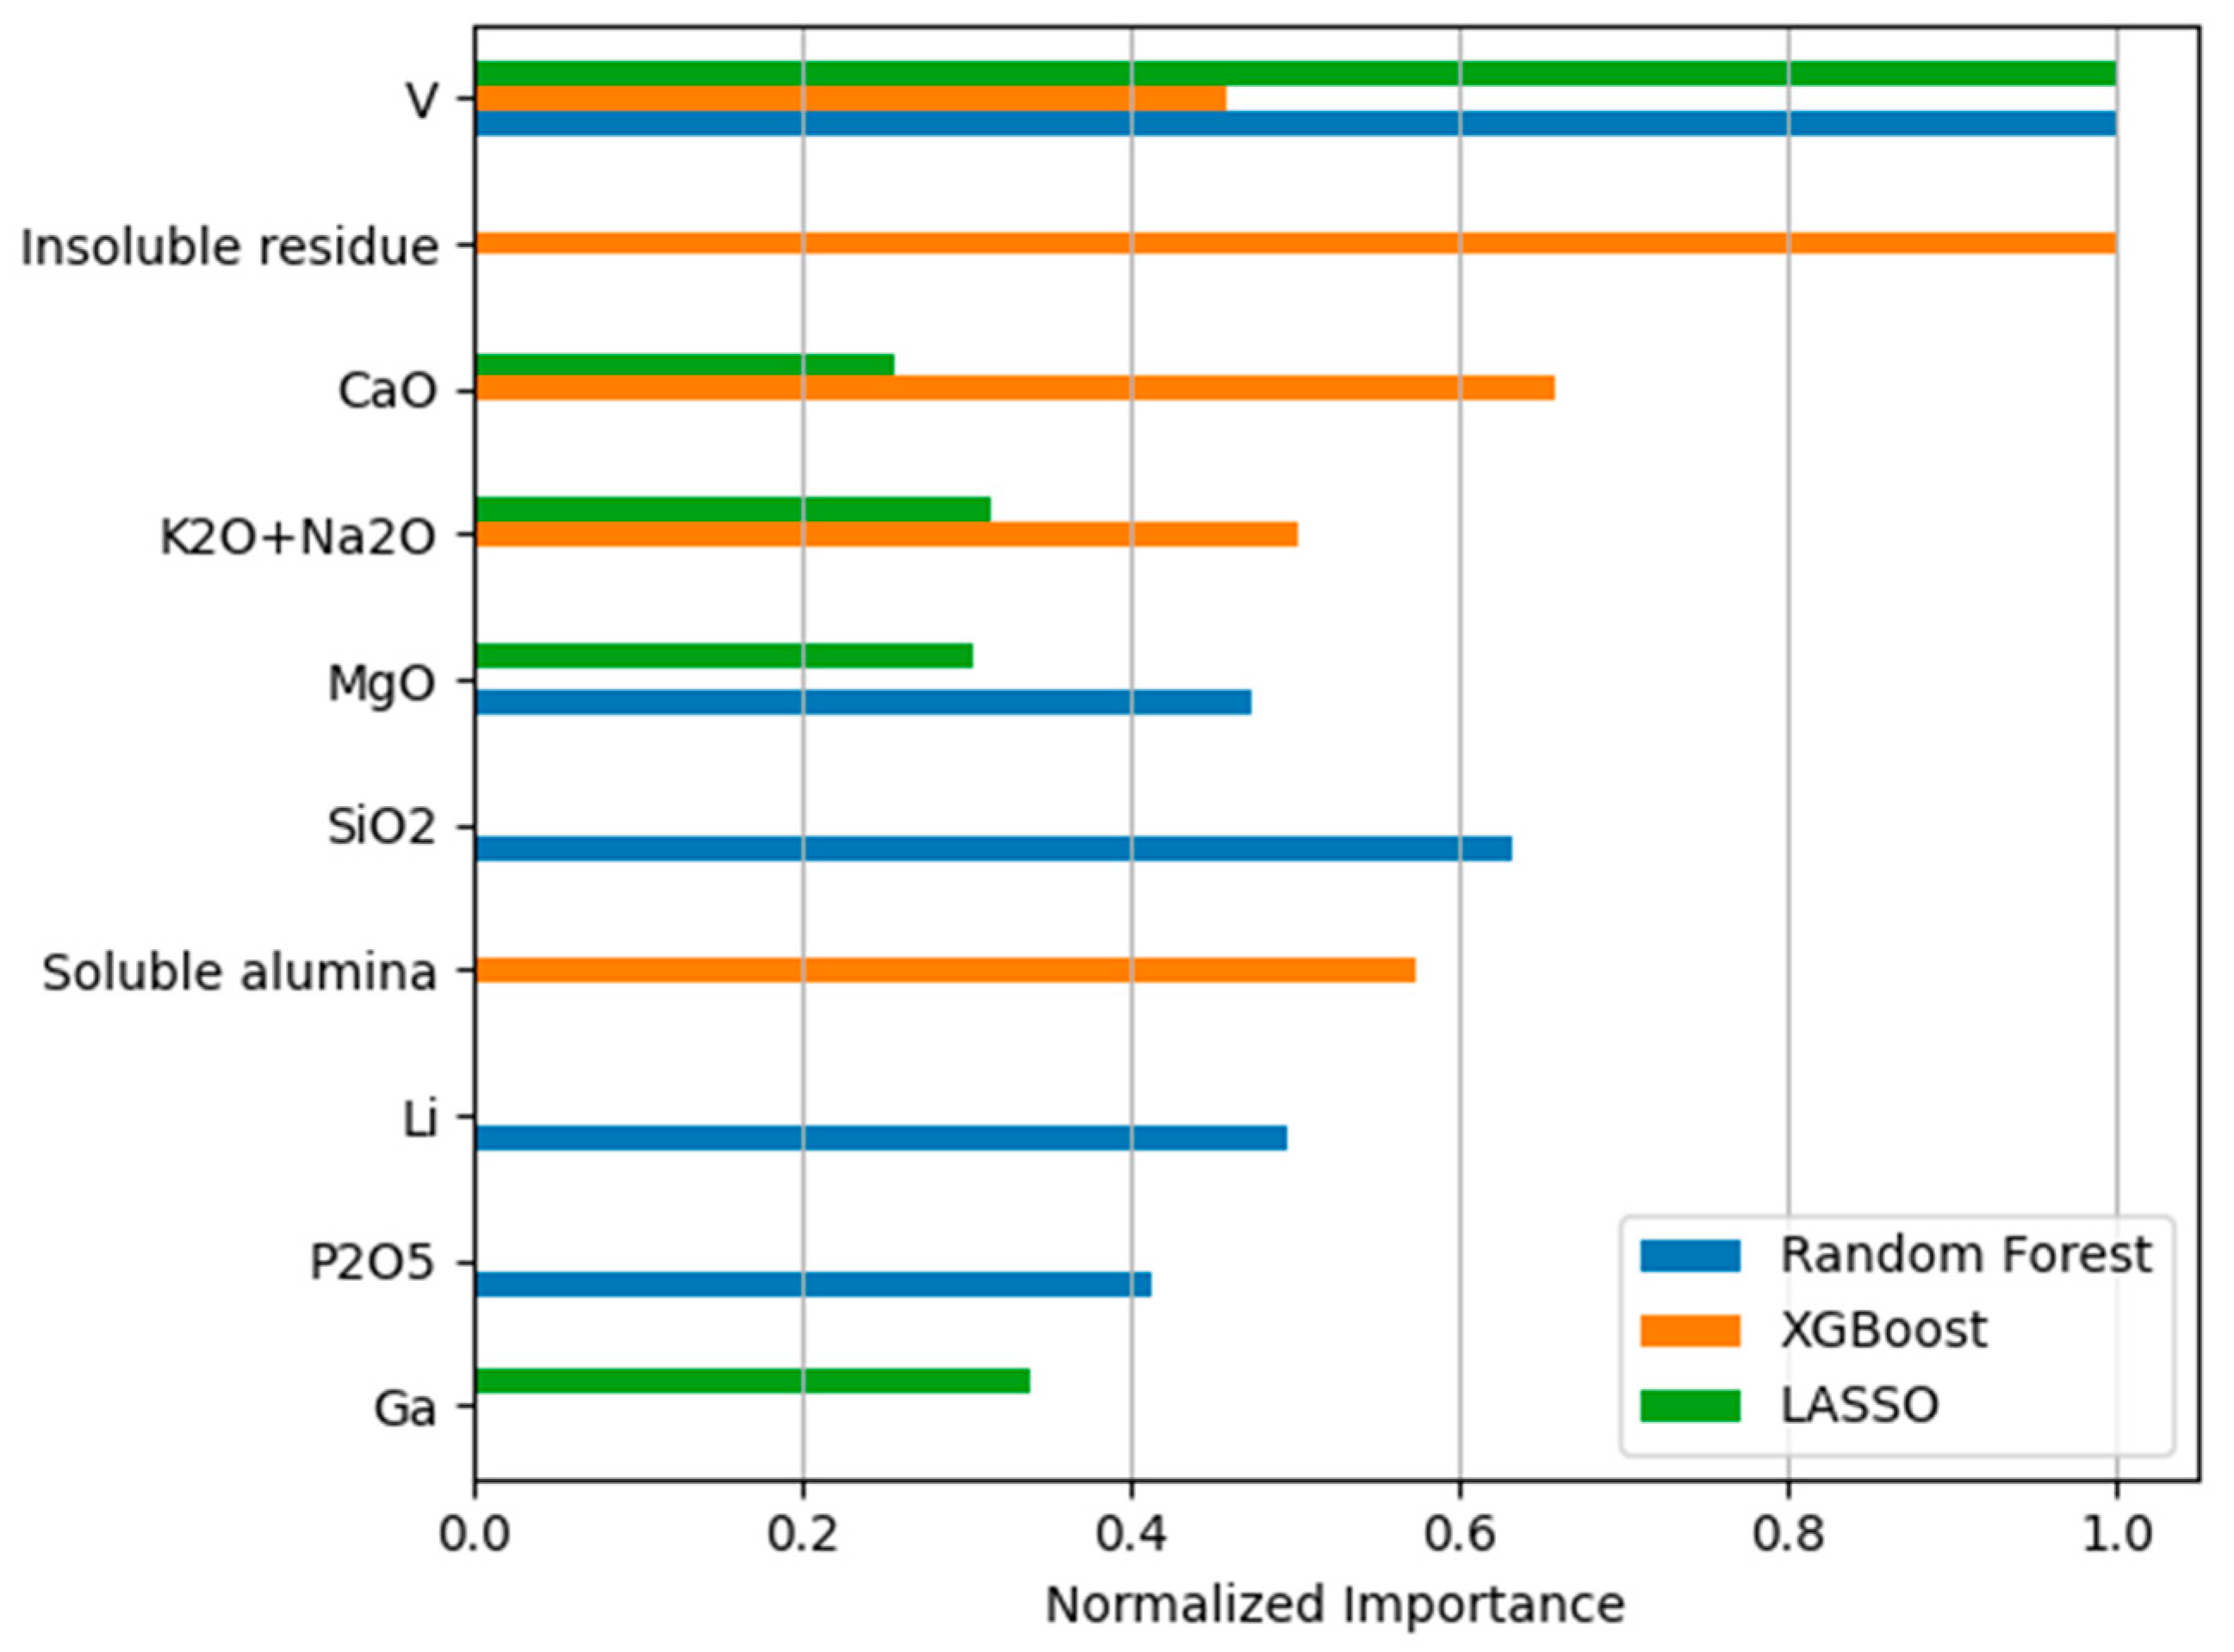
| Model | Feature | Normalized Score |
|---|---|---|
| Random Forest | V | 1.0000 |
| SiO2 | 0.6325 | |
| Li | 0.4943 | |
| MgO | 0.4741 | |
| P2O5 | 0.4126 | |
| XGBoost | Insoluble residue | 1.0000 |
| CaO | 0.6585 | |
| Soluble alumina | 0.5727 | |
| K2O + Na2O | 0.5015 | |
| V | 0.4589 | |
| LASSO | V | 1.0000 |
| Ga | 0.3389 | |
| K2O + Na2O | 0.3145 | |
| MgO | 0.3029 | |
| CaO | 0.2550 |
Disclaimer/Publisher’s Note: The statements, opinions and data contained in all publications are solely those of the individual author(s) and contributor(s) and not of MDPI and/or the editor(s). MDPI and/or the editor(s) disclaim responsibility for any injury to people or property resulting from any ideas, methods, instructions or products referred to in the content. |
© 2025 by the authors. Licensee MDPI, Basel, Switzerland. This article is an open access article distributed under the terms and conditions of the Creative Commons Attribution (CC BY) license (https://creativecommons.org/licenses/by/4.0/).
Share and Cite
Nadirov, R.; Kamunur, K.; Mussapyrova, L.; Batkal, A.; Tyumentseva, O.; Karagulanova, A. Integrated Compositional Modeling and Machine Learning Analysis of REE-Bearing Coal Ash from a Weathered Dumpsite. Minerals 2025, 15, 734. https://doi.org/10.3390/min15070734
Nadirov R, Kamunur K, Mussapyrova L, Batkal A, Tyumentseva O, Karagulanova A. Integrated Compositional Modeling and Machine Learning Analysis of REE-Bearing Coal Ash from a Weathered Dumpsite. Minerals. 2025; 15(7):734. https://doi.org/10.3390/min15070734
Chicago/Turabian StyleNadirov, Rashid, Kaster Kamunur, Lyazzat Mussapyrova, Aisulu Batkal, Olesya Tyumentseva, and Ardak Karagulanova. 2025. "Integrated Compositional Modeling and Machine Learning Analysis of REE-Bearing Coal Ash from a Weathered Dumpsite" Minerals 15, no. 7: 734. https://doi.org/10.3390/min15070734
APA StyleNadirov, R., Kamunur, K., Mussapyrova, L., Batkal, A., Tyumentseva, O., & Karagulanova, A. (2025). Integrated Compositional Modeling and Machine Learning Analysis of REE-Bearing Coal Ash from a Weathered Dumpsite. Minerals, 15(7), 734. https://doi.org/10.3390/min15070734