
Ore-Forming Fluid Evolution and Ore Genesis of the Cuyu Gold Deposit in Central Jilin Province, NE China: Constraints from Geology, Fluid Inclusions, and H–O–S–Pb Isotope Studies

Abstract
1. Introduction
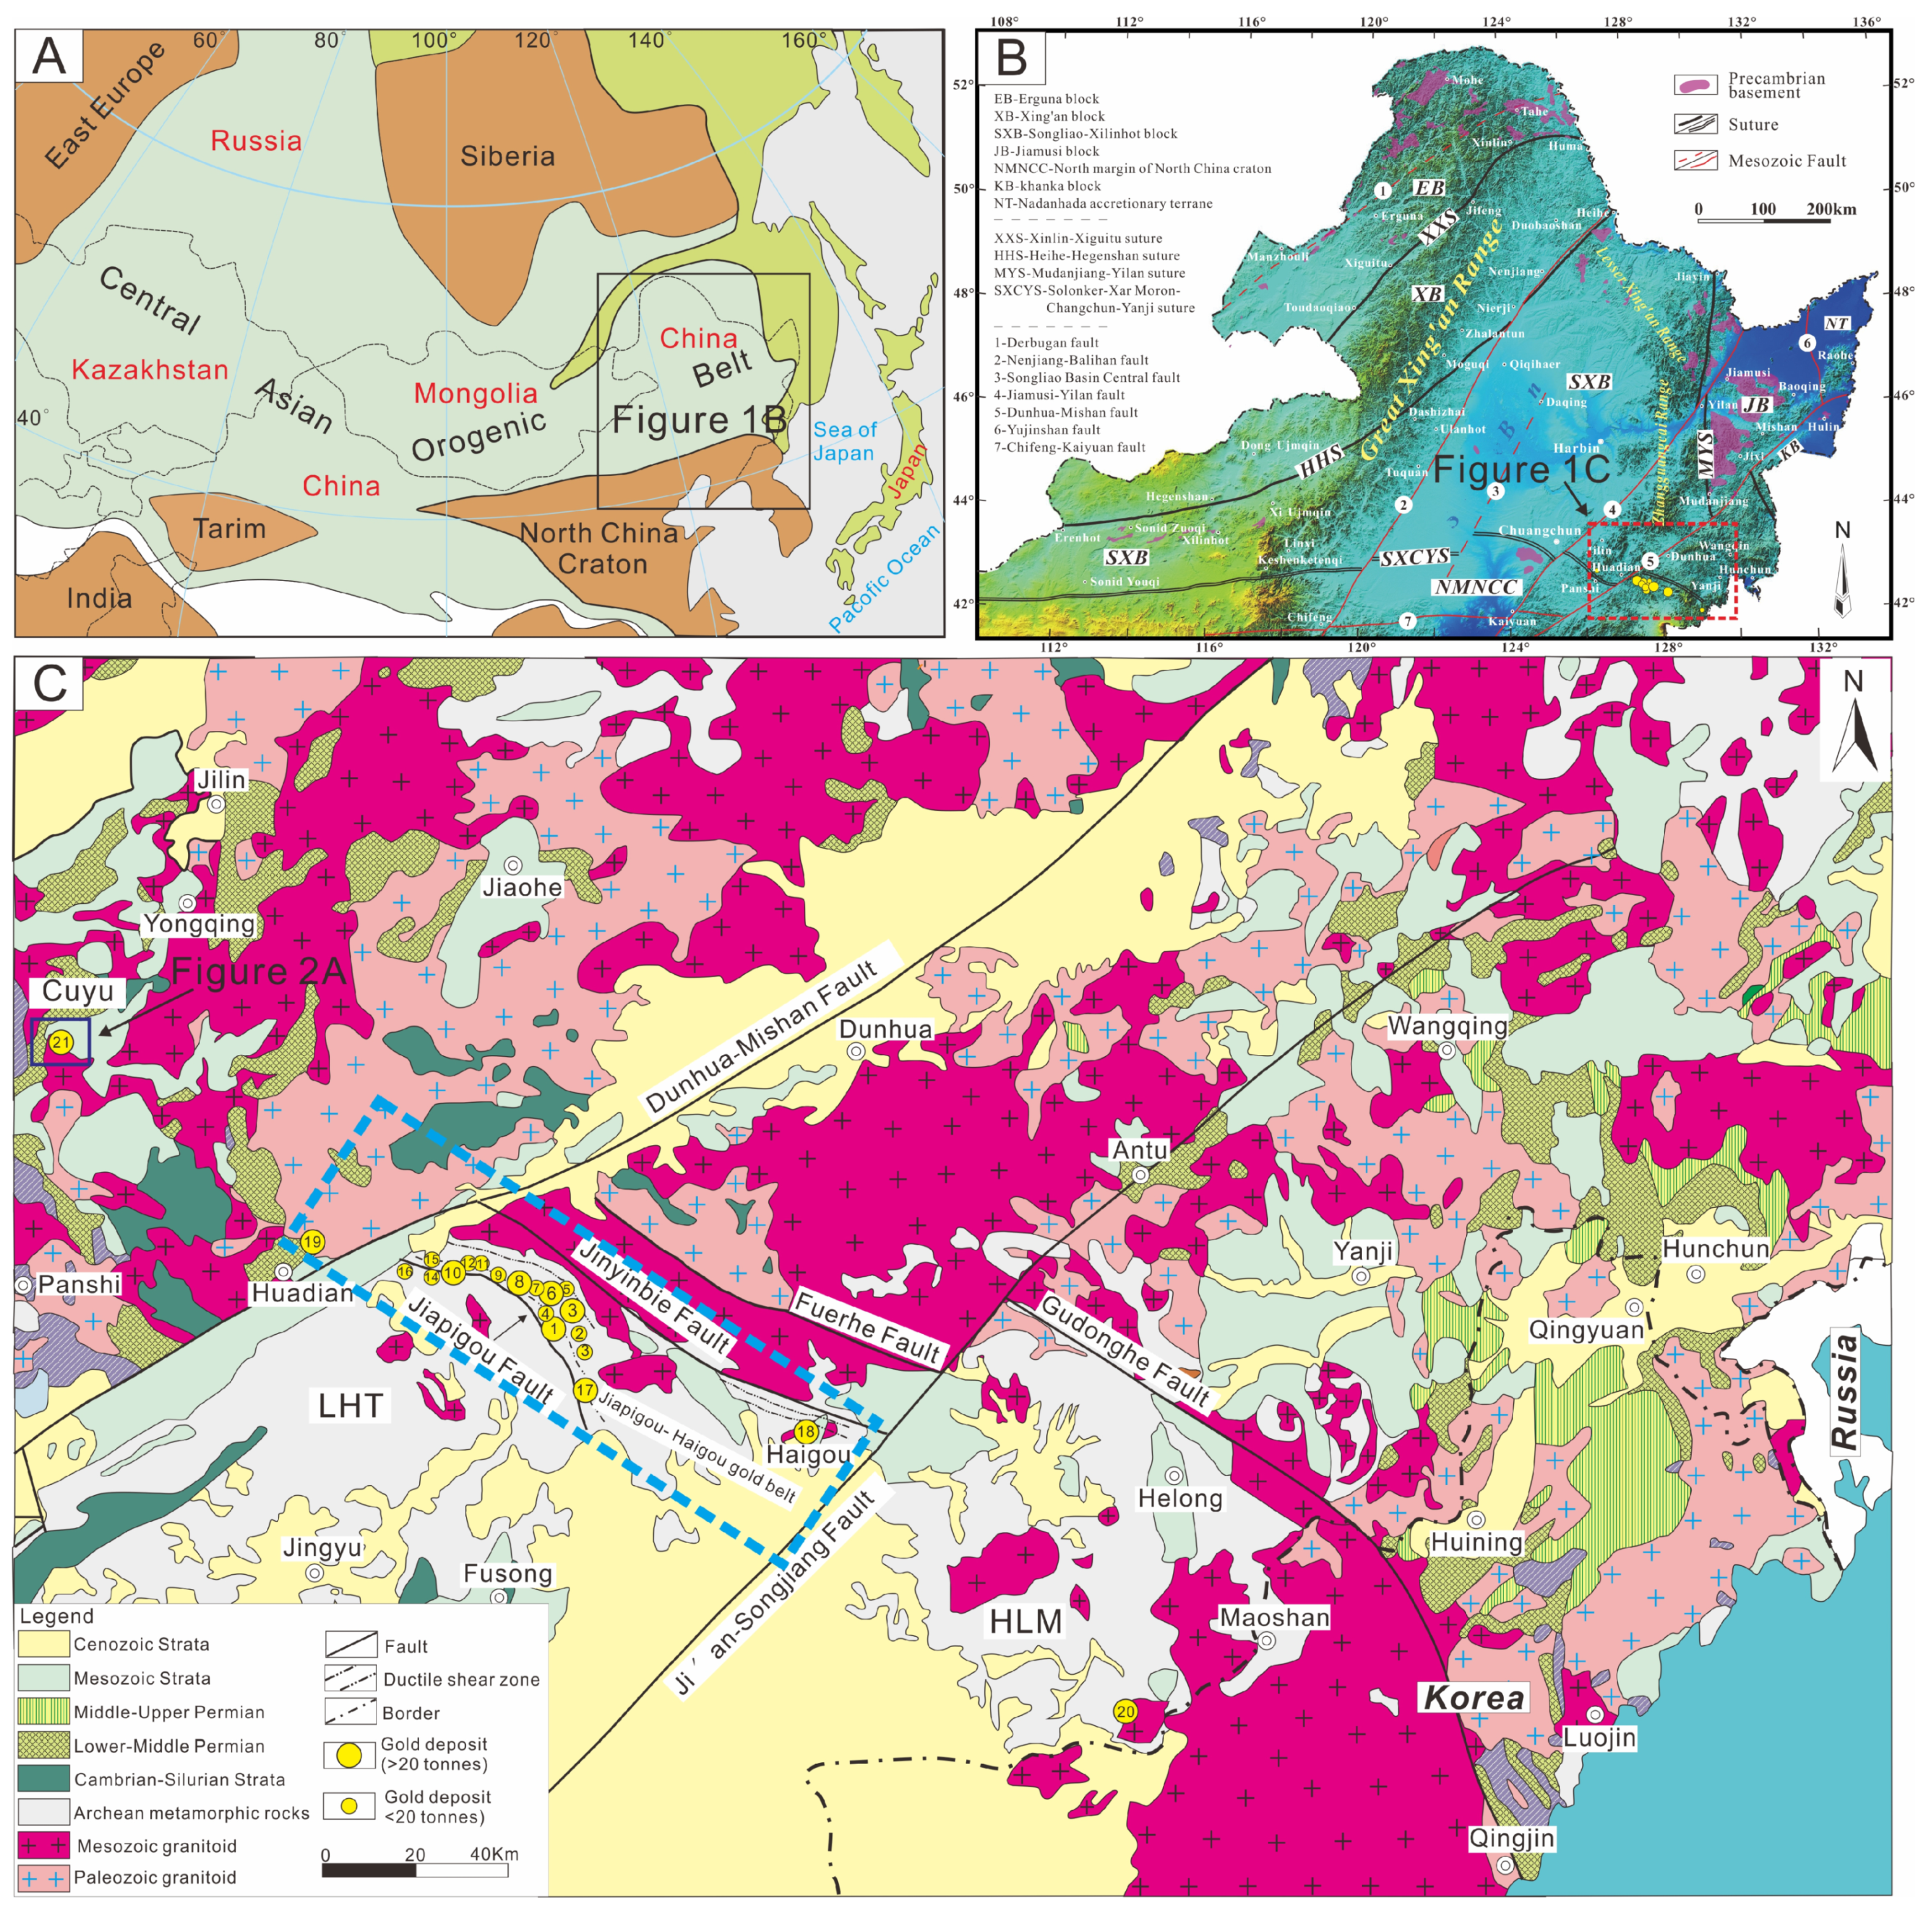
2. Geological Background
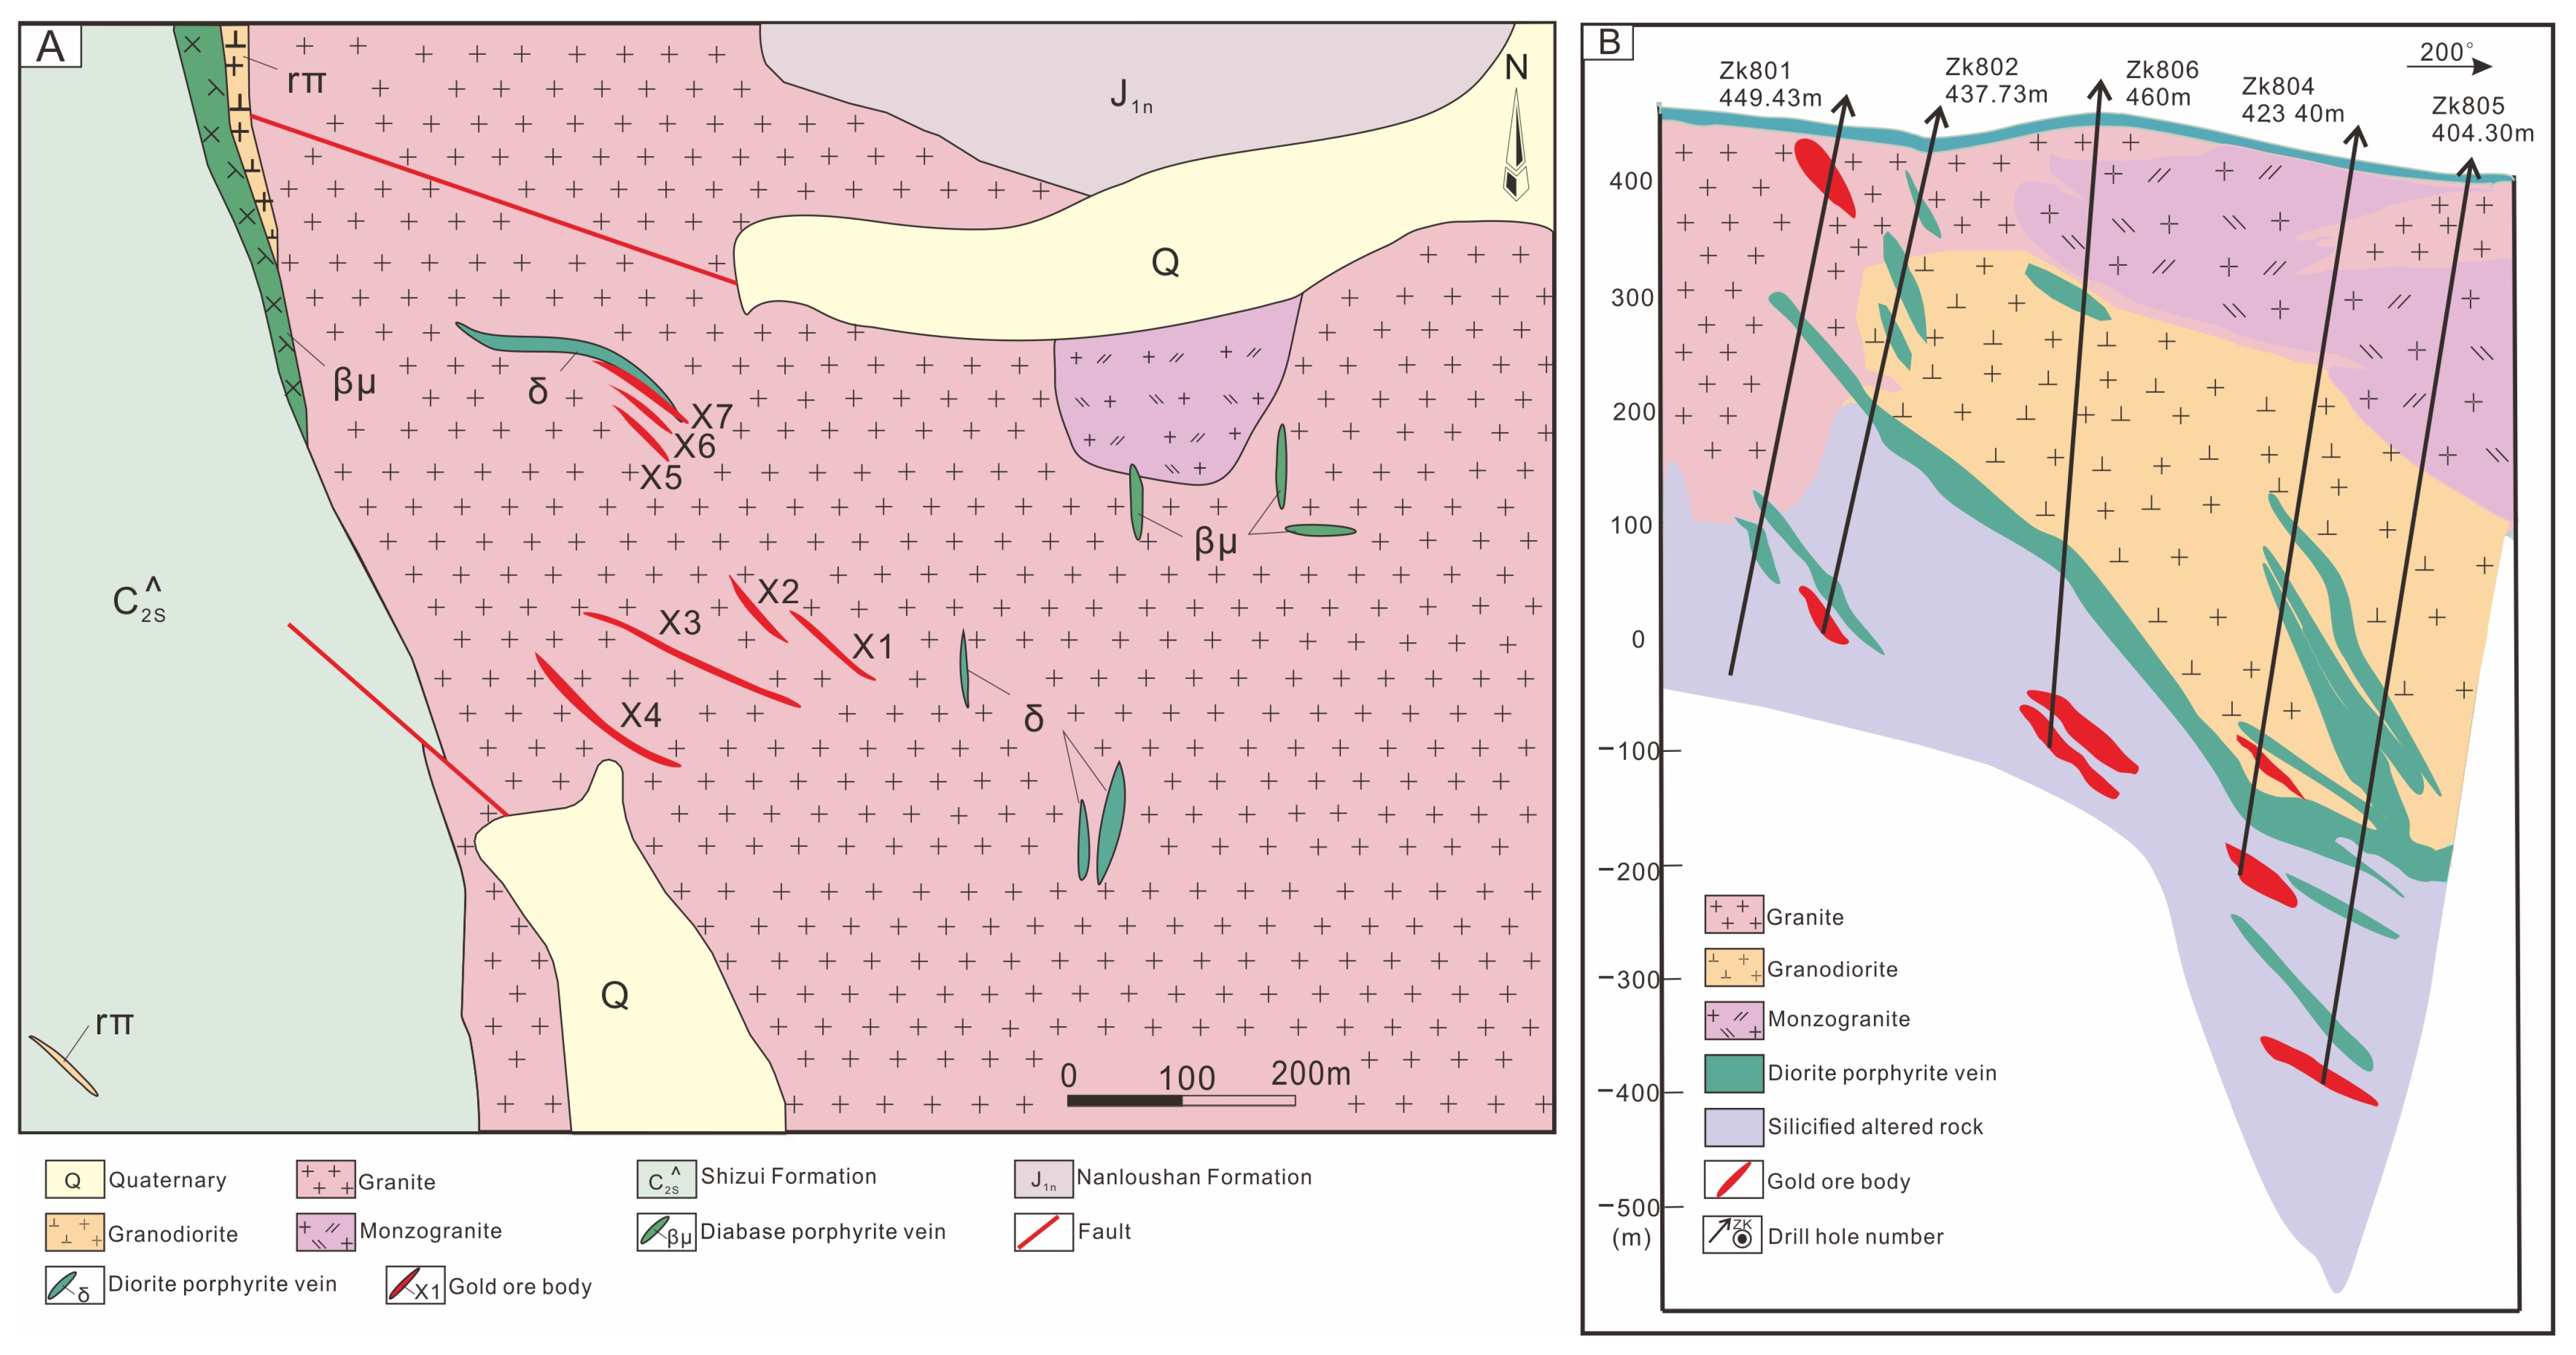
3. Deposit Geology
4. Sample and Analytical Methods
4.1. Fluid Inclusions
4.2. Hydrogen and Oxygen Isotopes
4.3. Sulfur Isotopes
4.4. Lead Isotopes
5. Analytical Results
5.1. Fluid Inclusions Characteristics
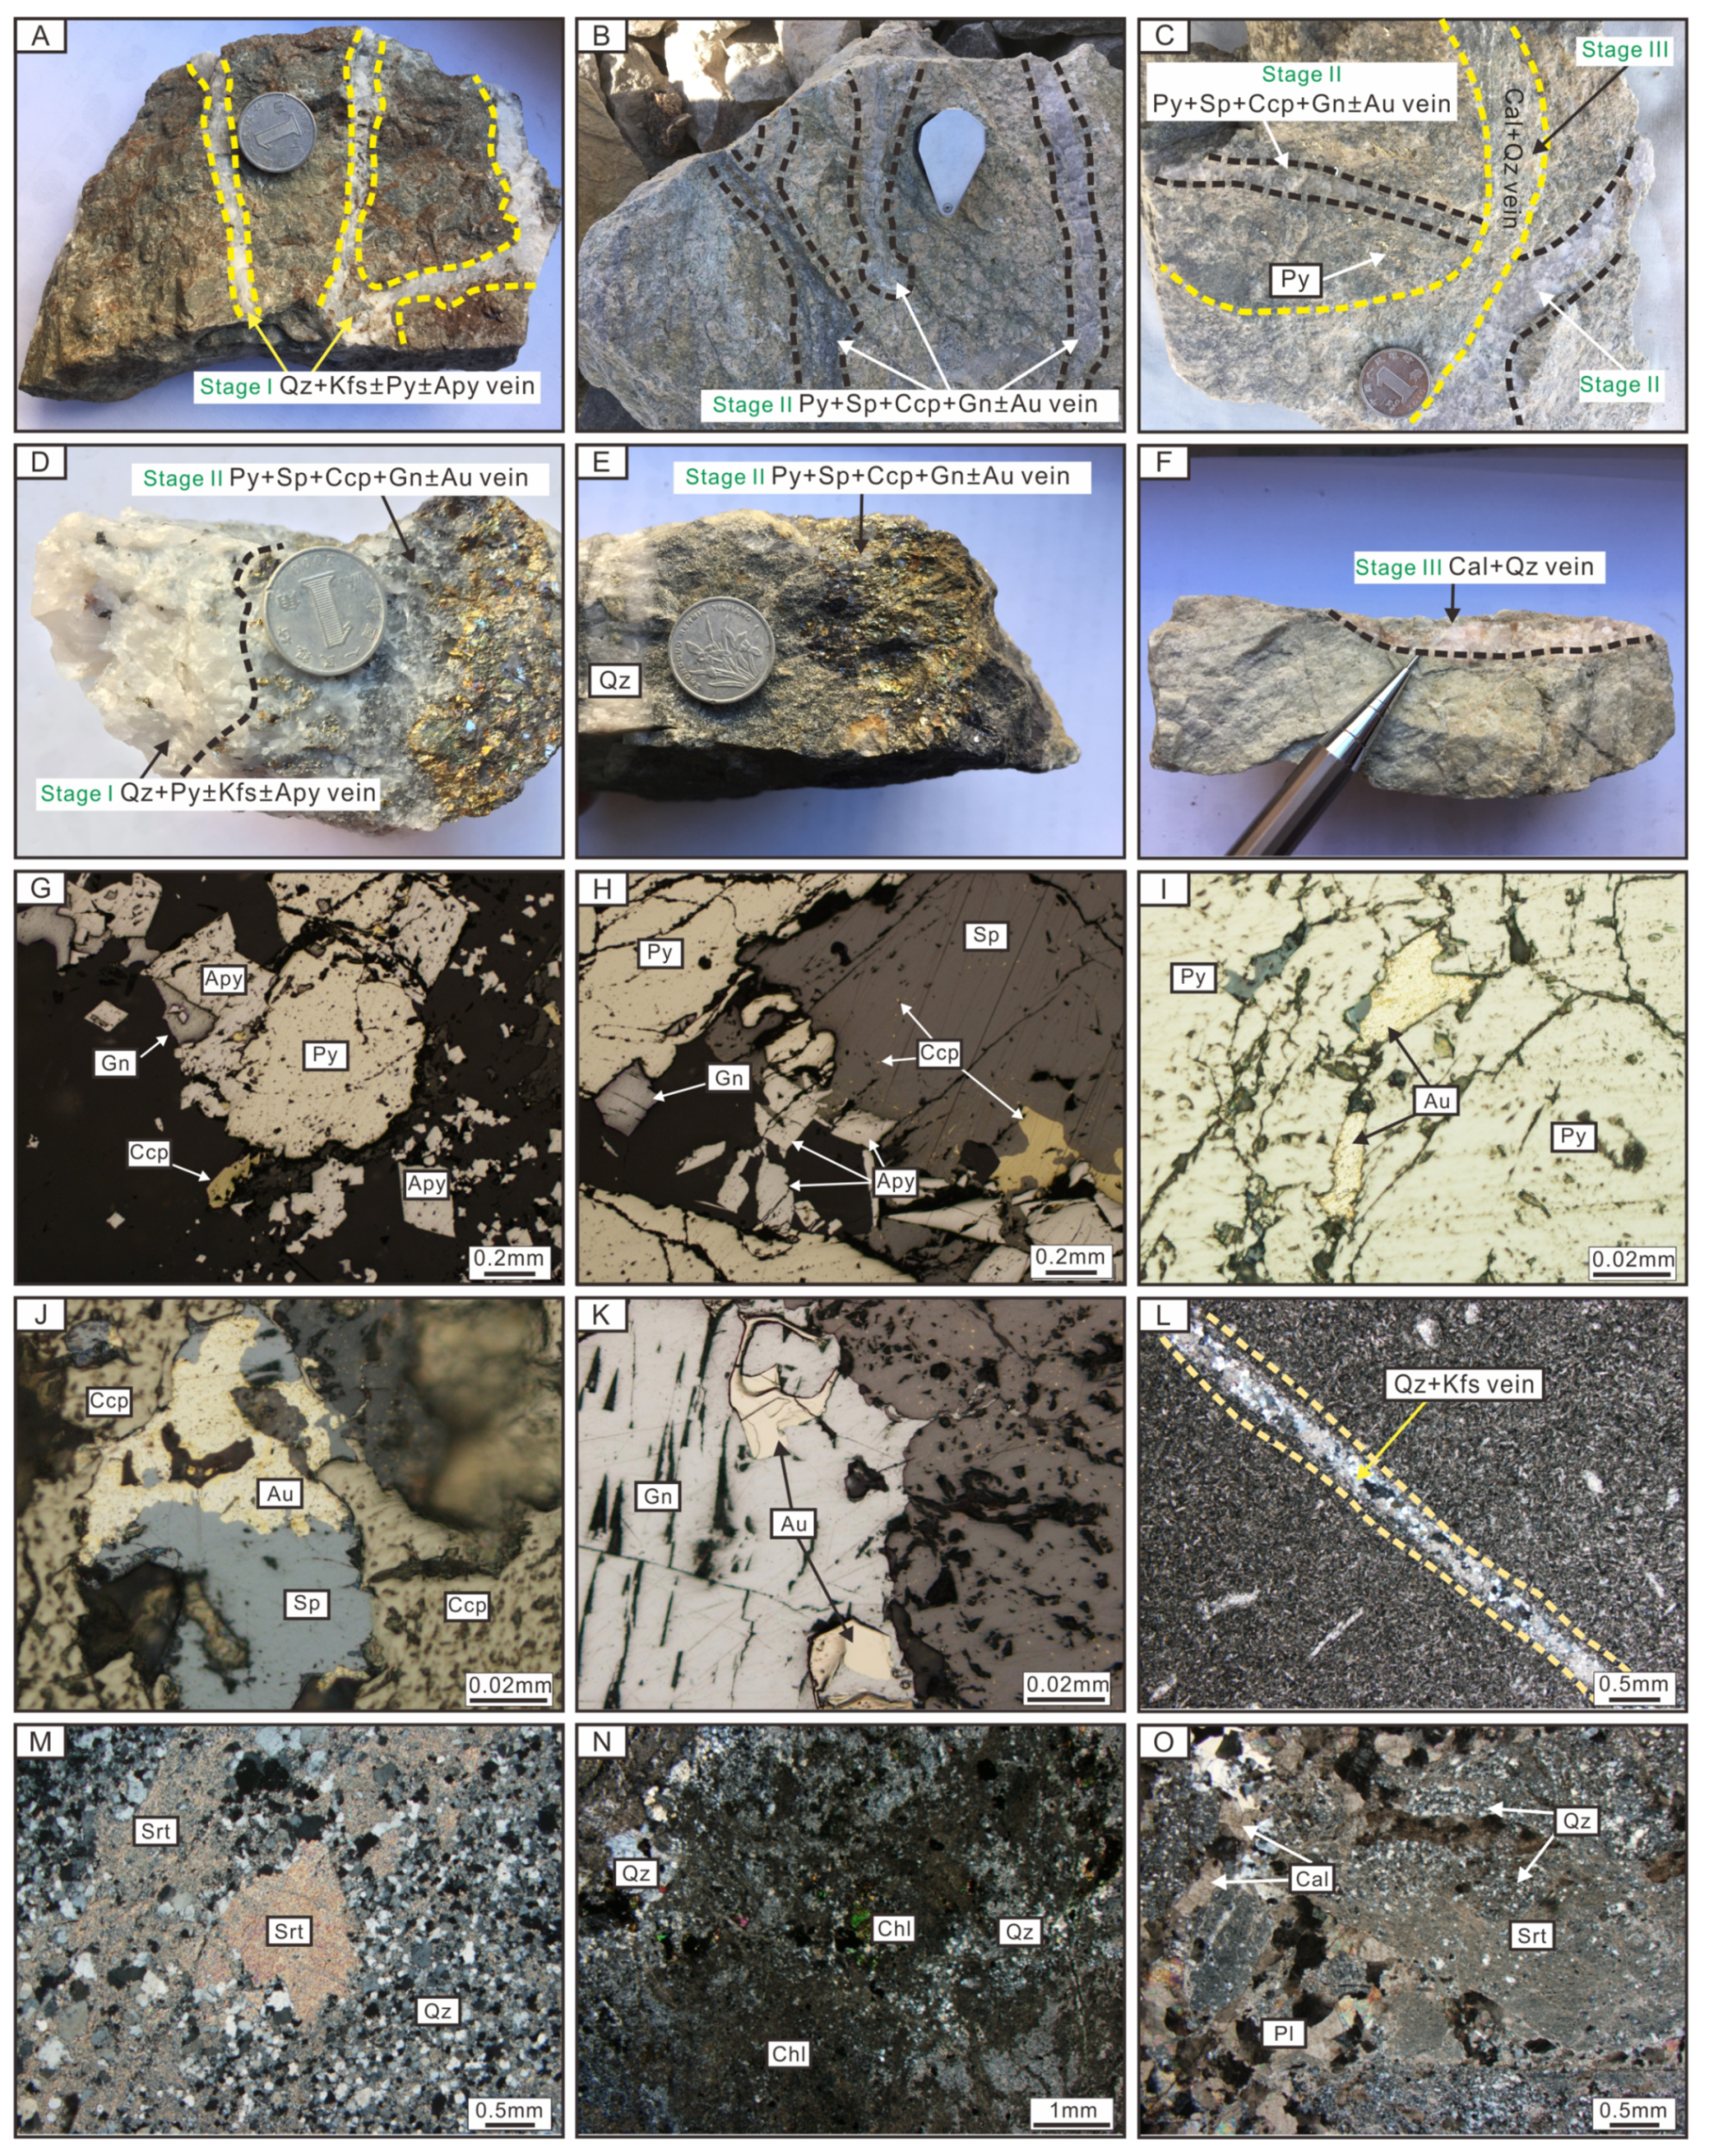
5.1.1. Petrography and Types of Fluid Inclusion
- (1)
- L-type: liquid-rich aqueous fluid inclusions
- (2)
- V-type: vapor-rich aqueous fluid inclusions
- (3)
- C-type: CO2 fluid inclusions
C1-Type: CO2-Bearing Fluid Inclusions
C2-Type: CO2-Rich Fluid Inclusions
C3-Type: CO2-Pure Fluid Inclusions
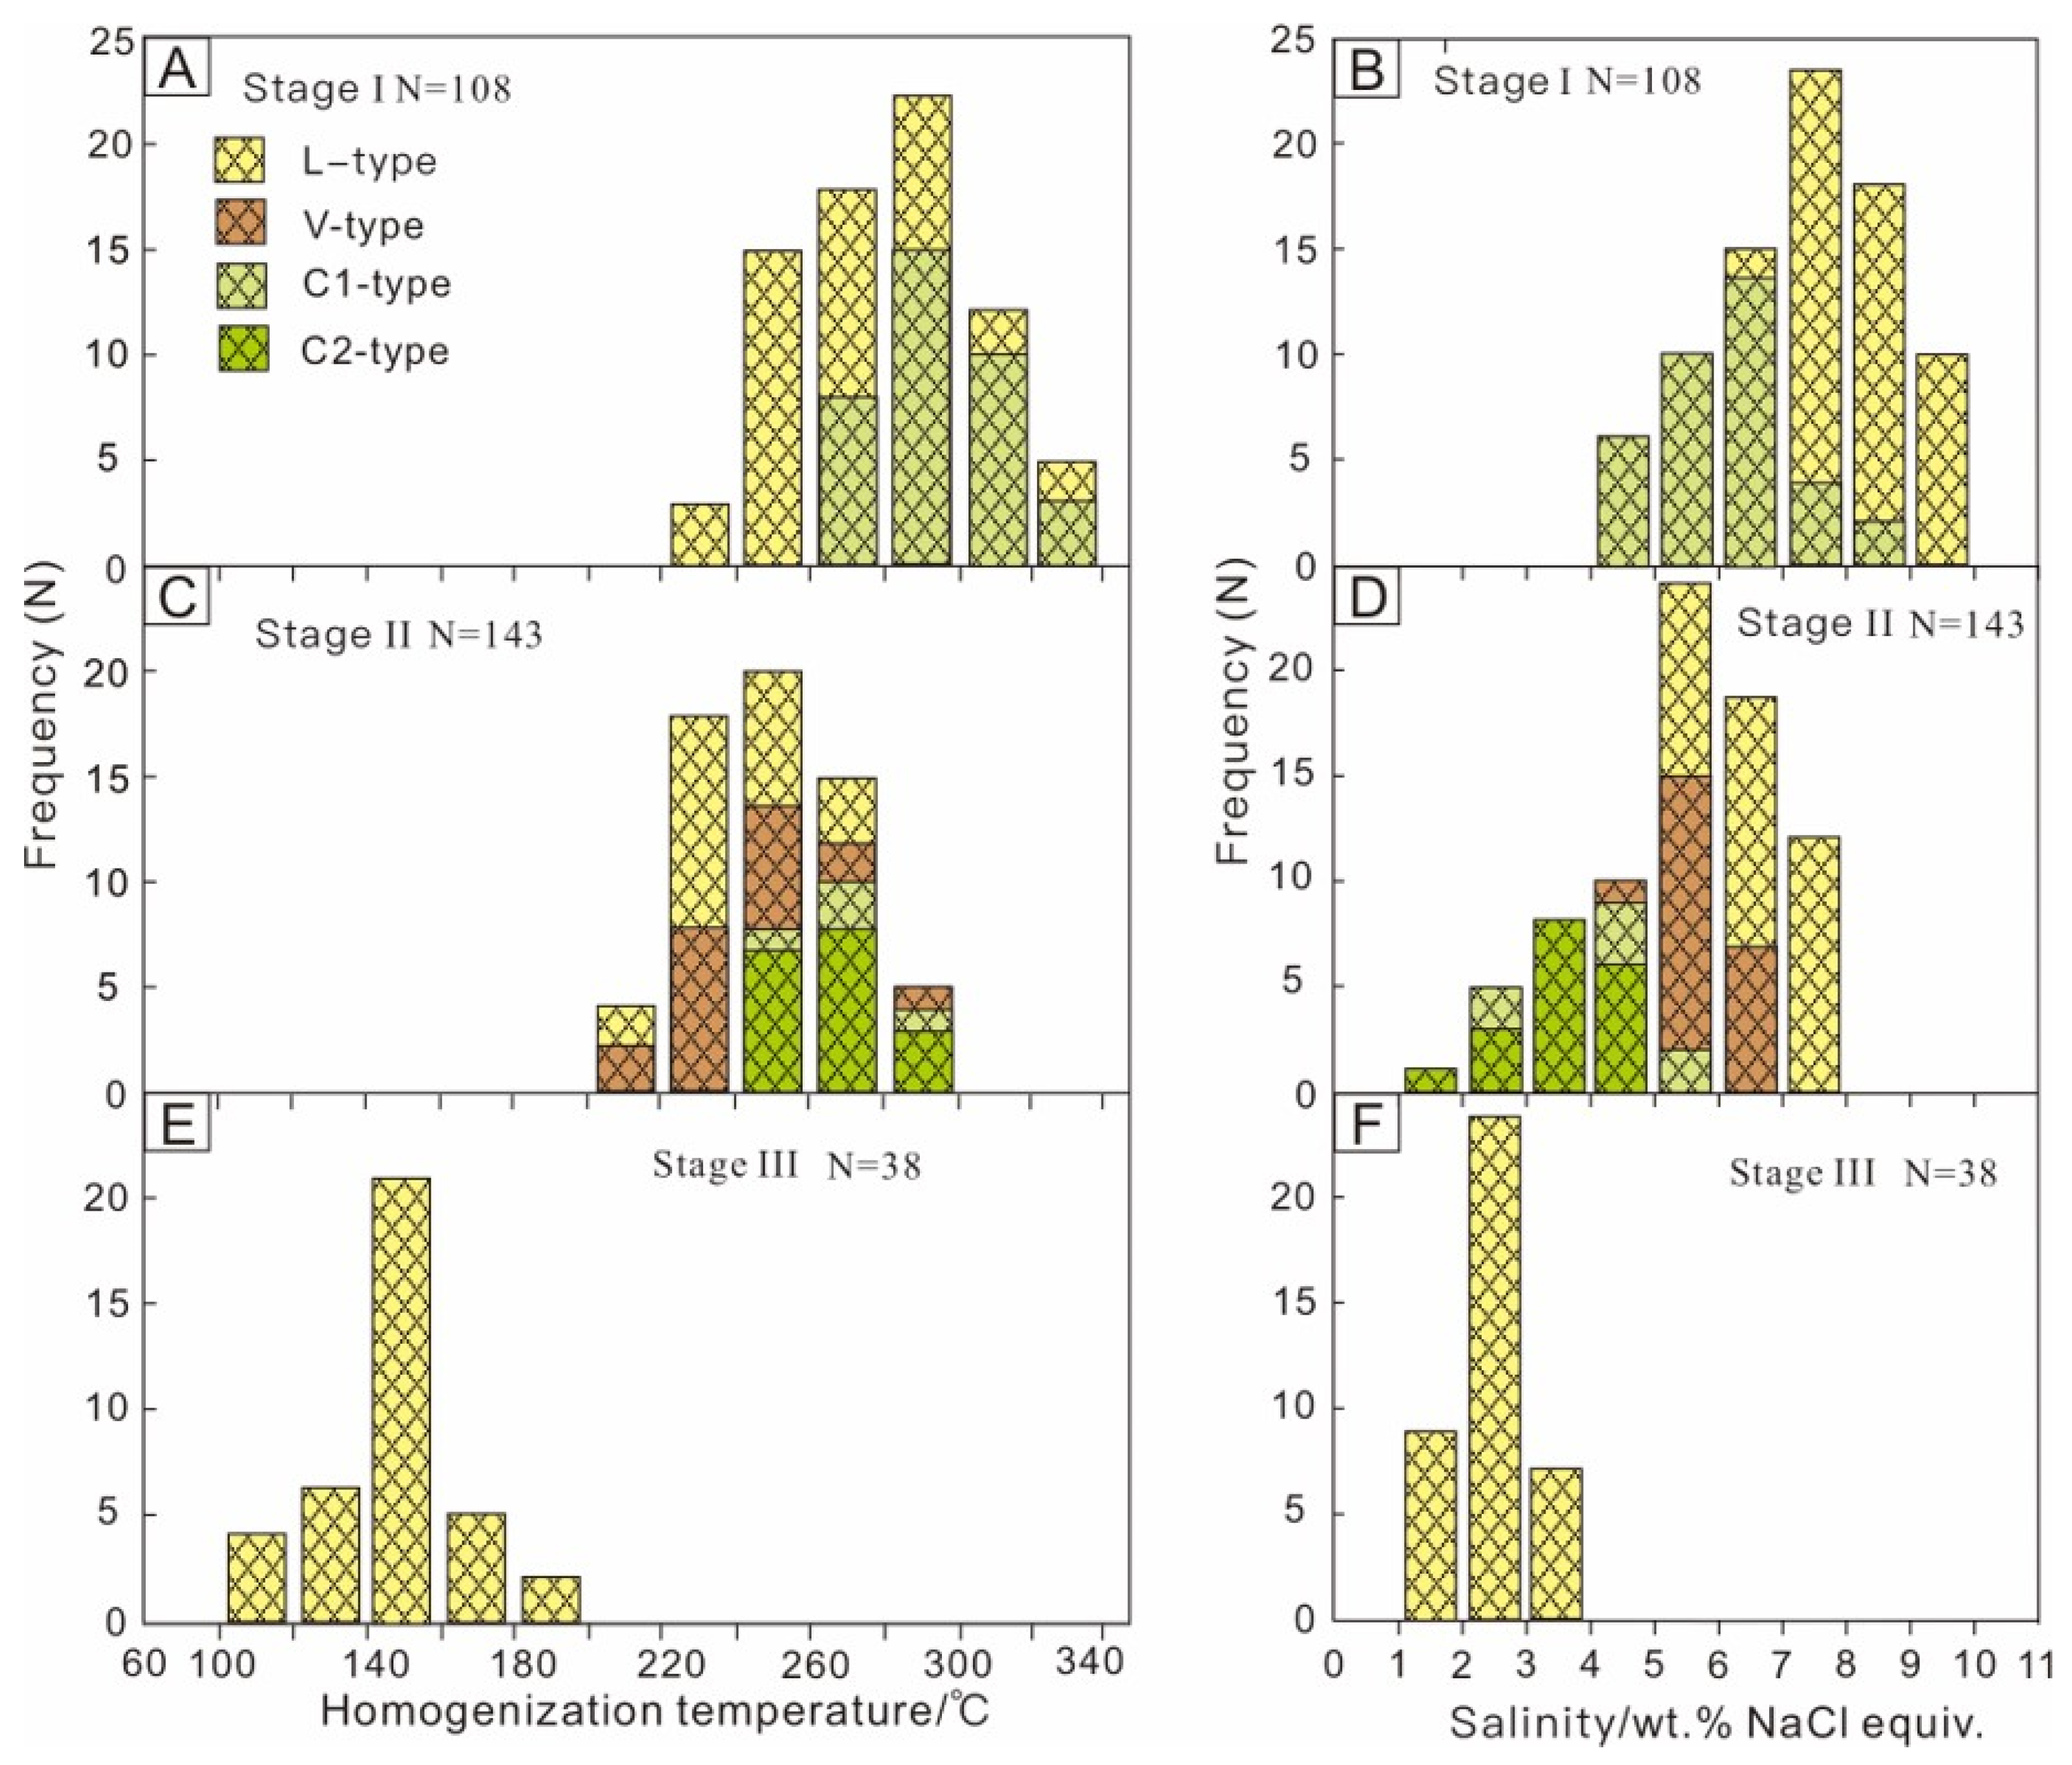
5.1.2. Microthermometry
5.1.3. Laser Raman Spectroscopy
5.2. H-O Isotopes
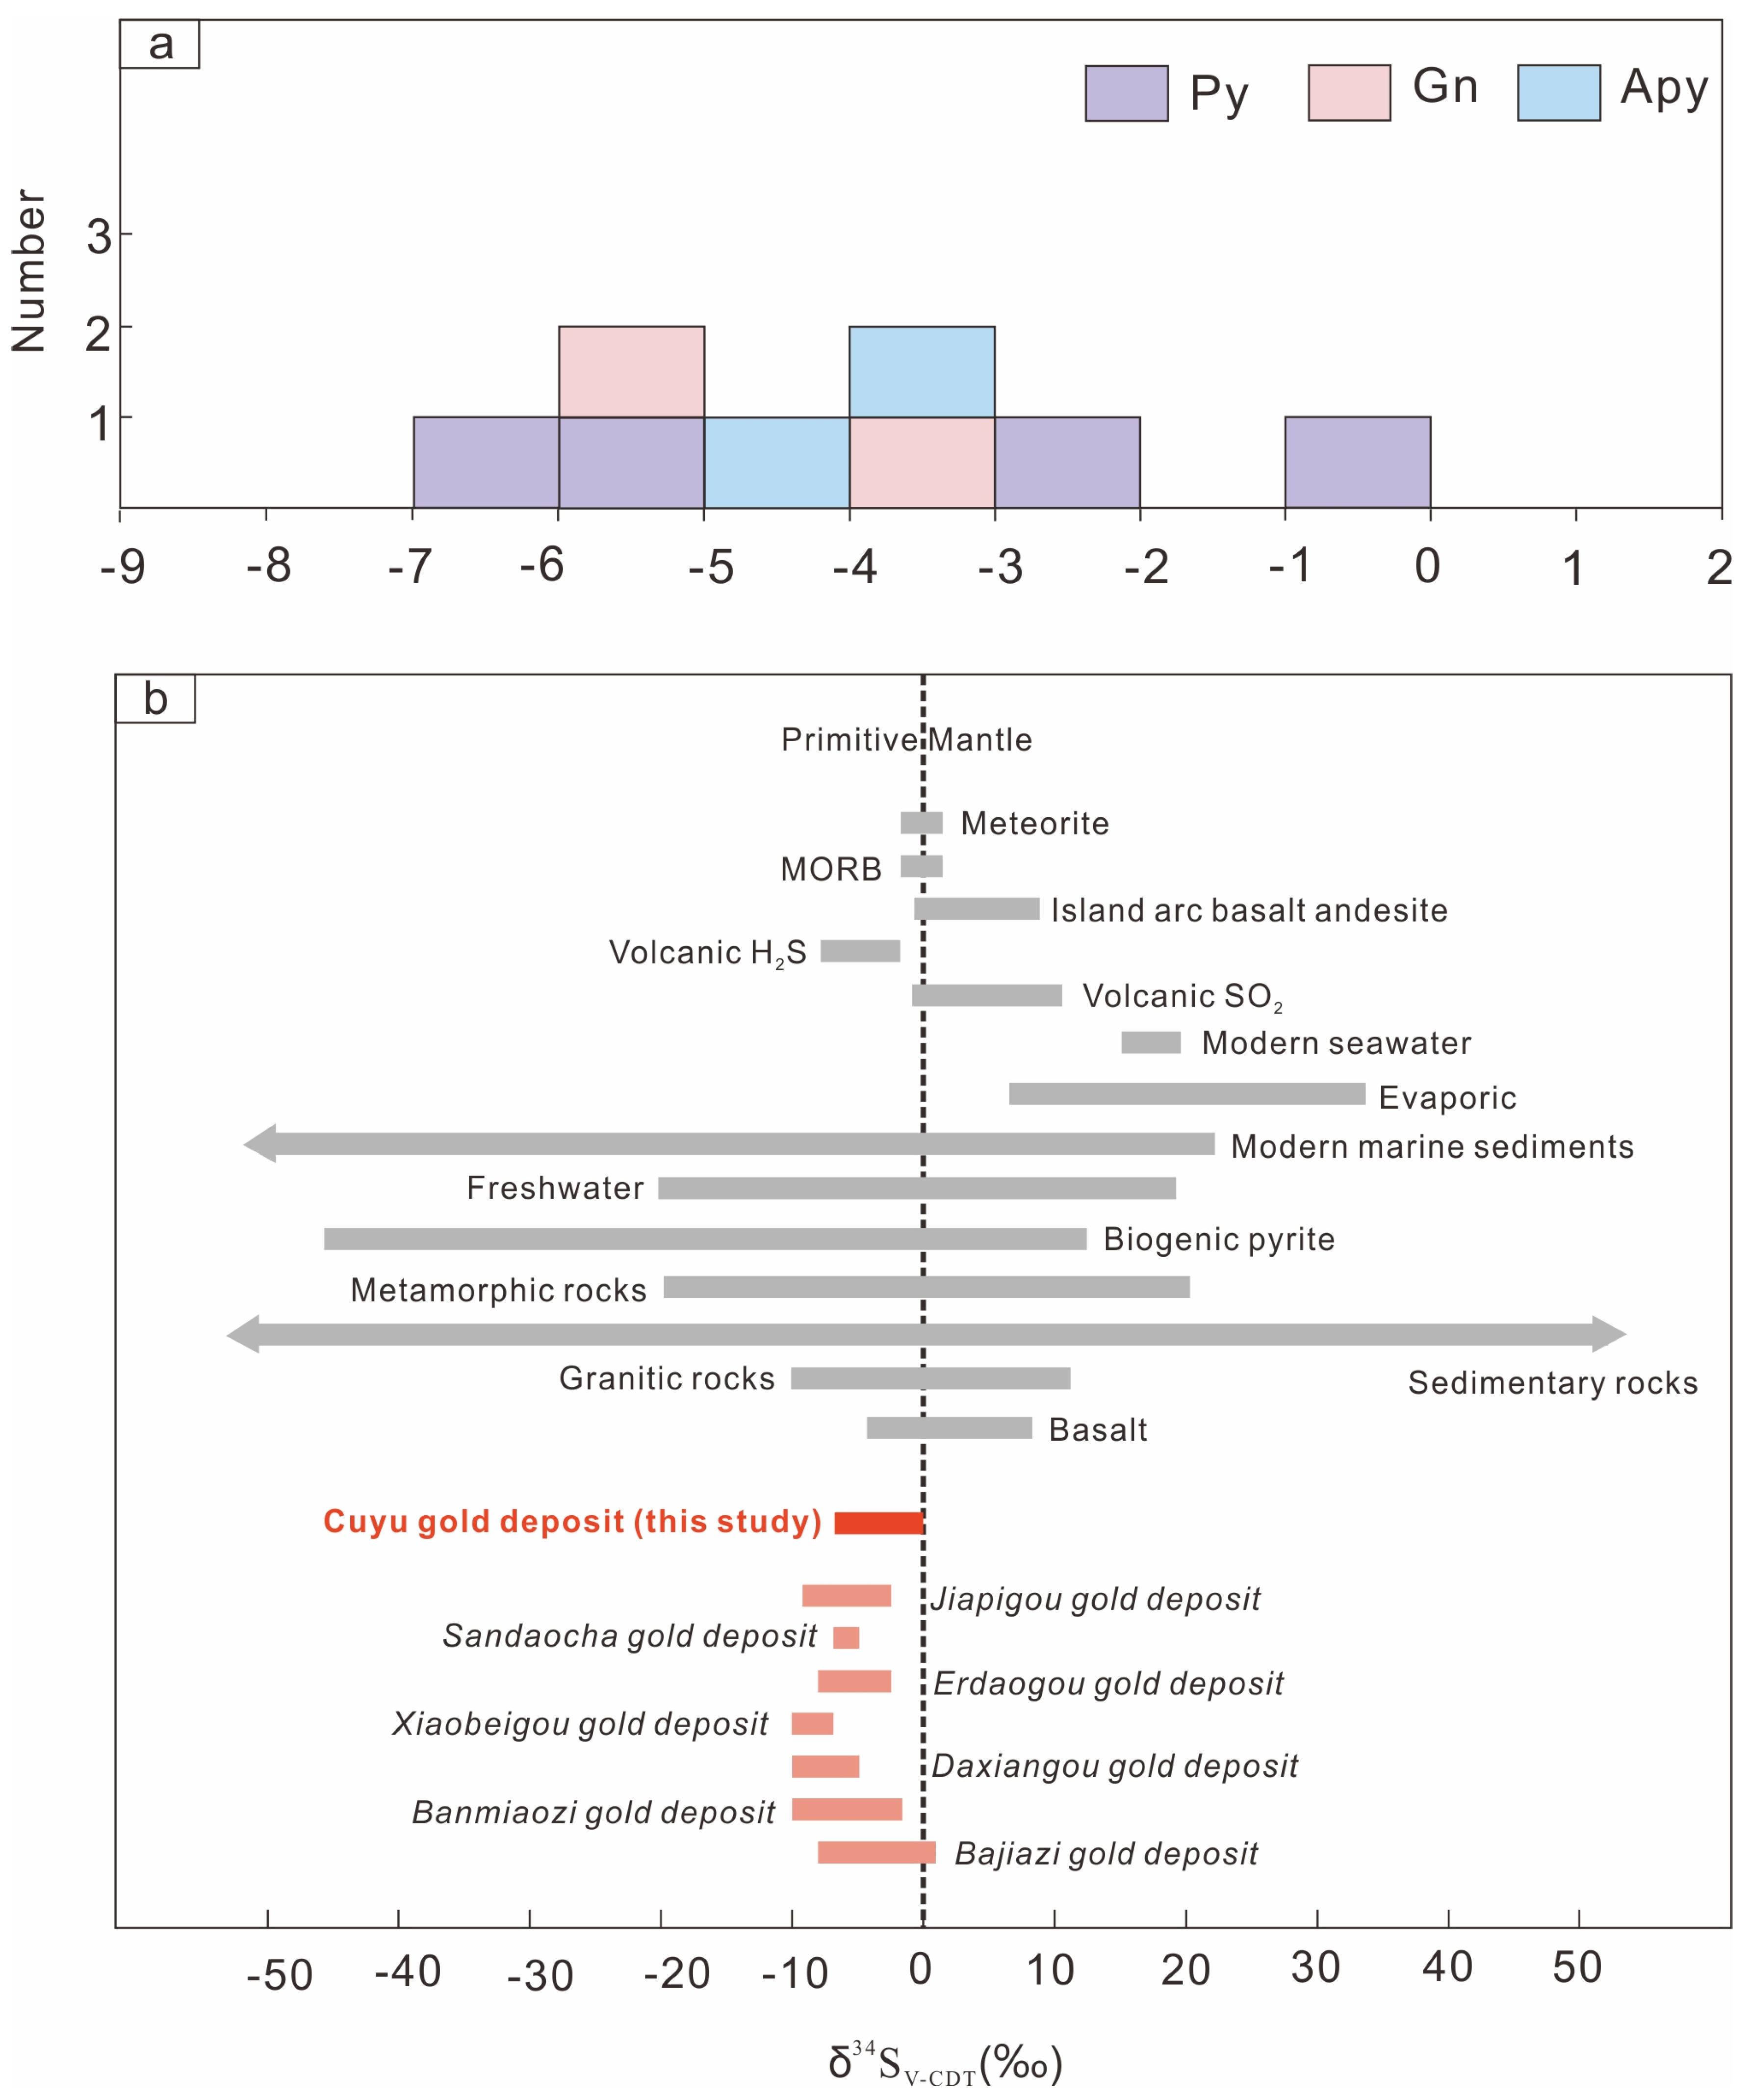
5.3. S Isotopes
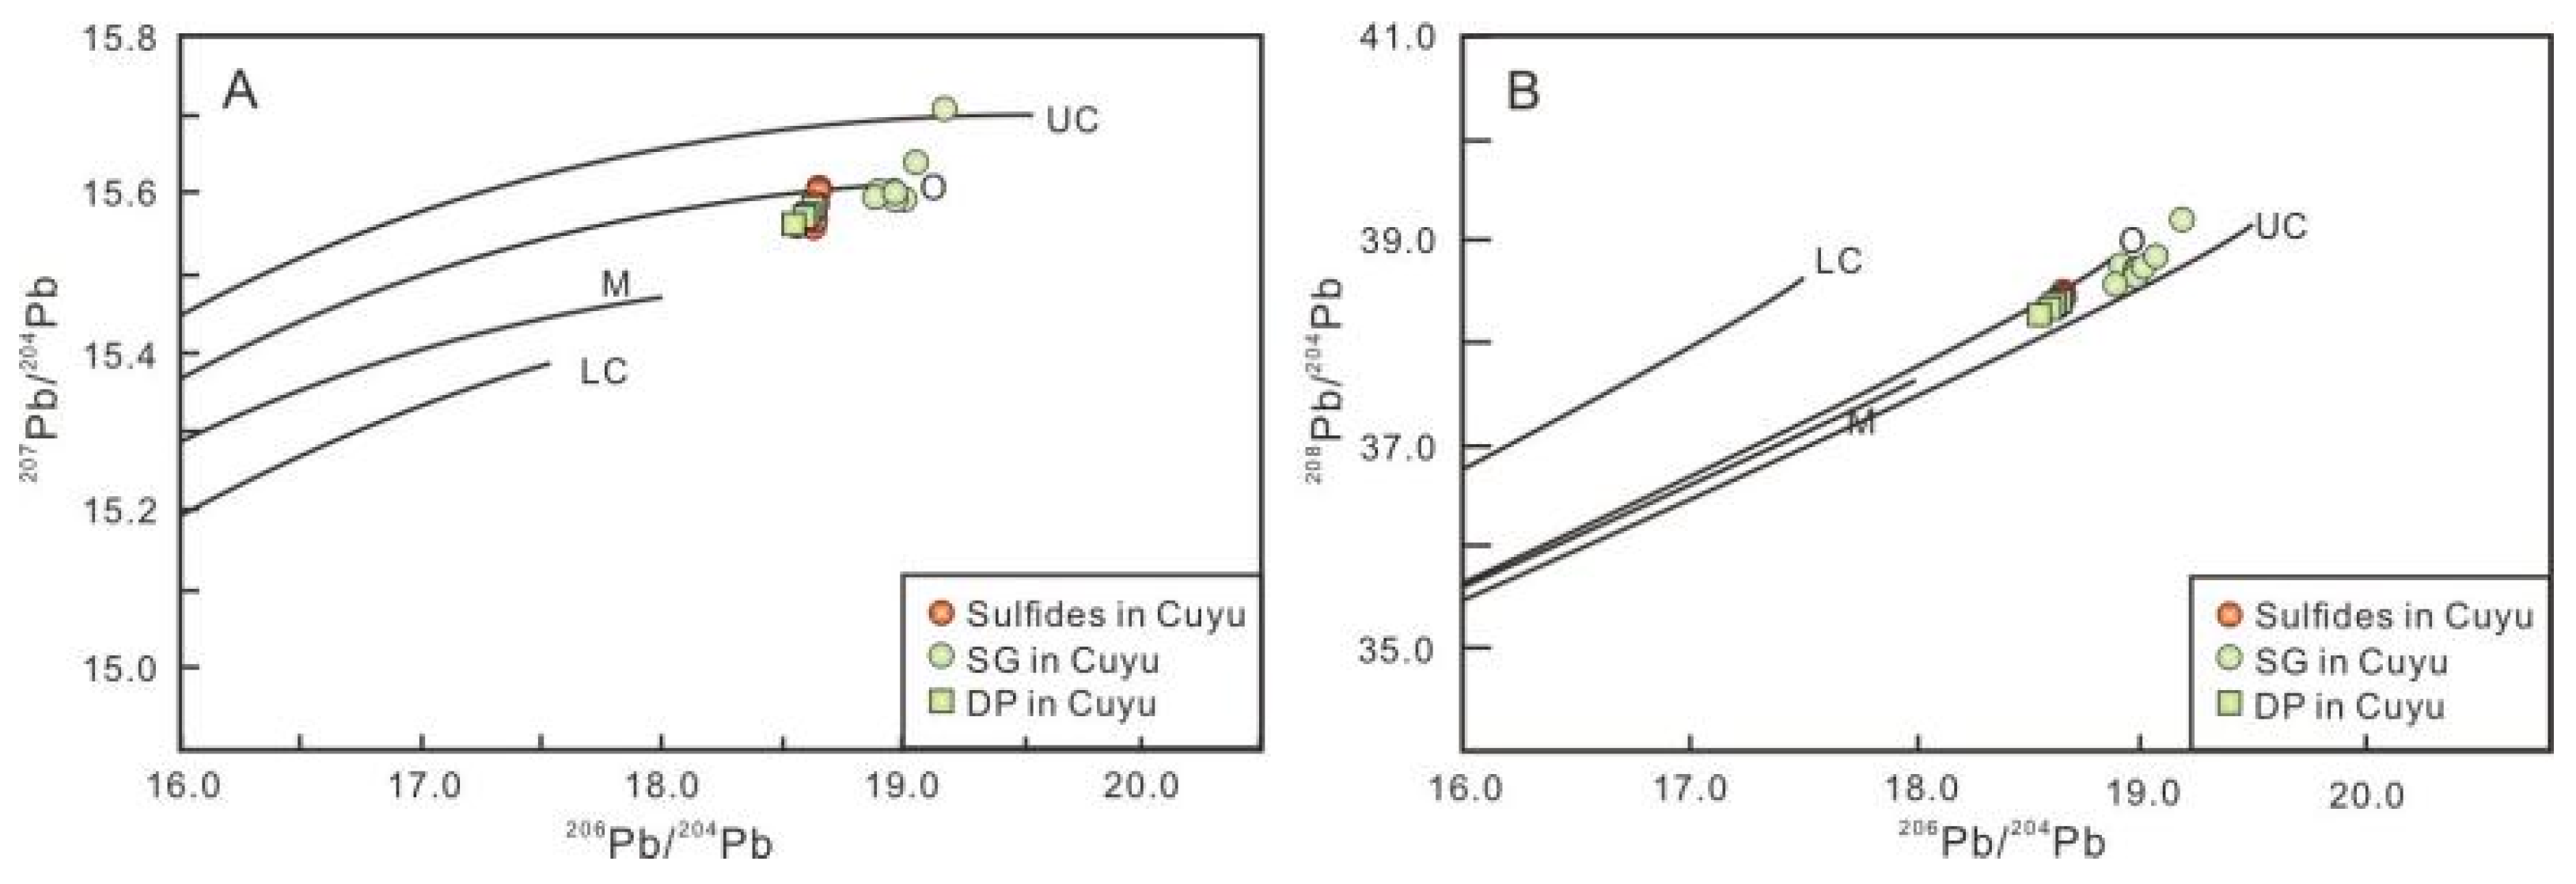
5.4. Lead Isotopes
6. Discussion
6.1. Origin of Ore-Forming Fluids and Material
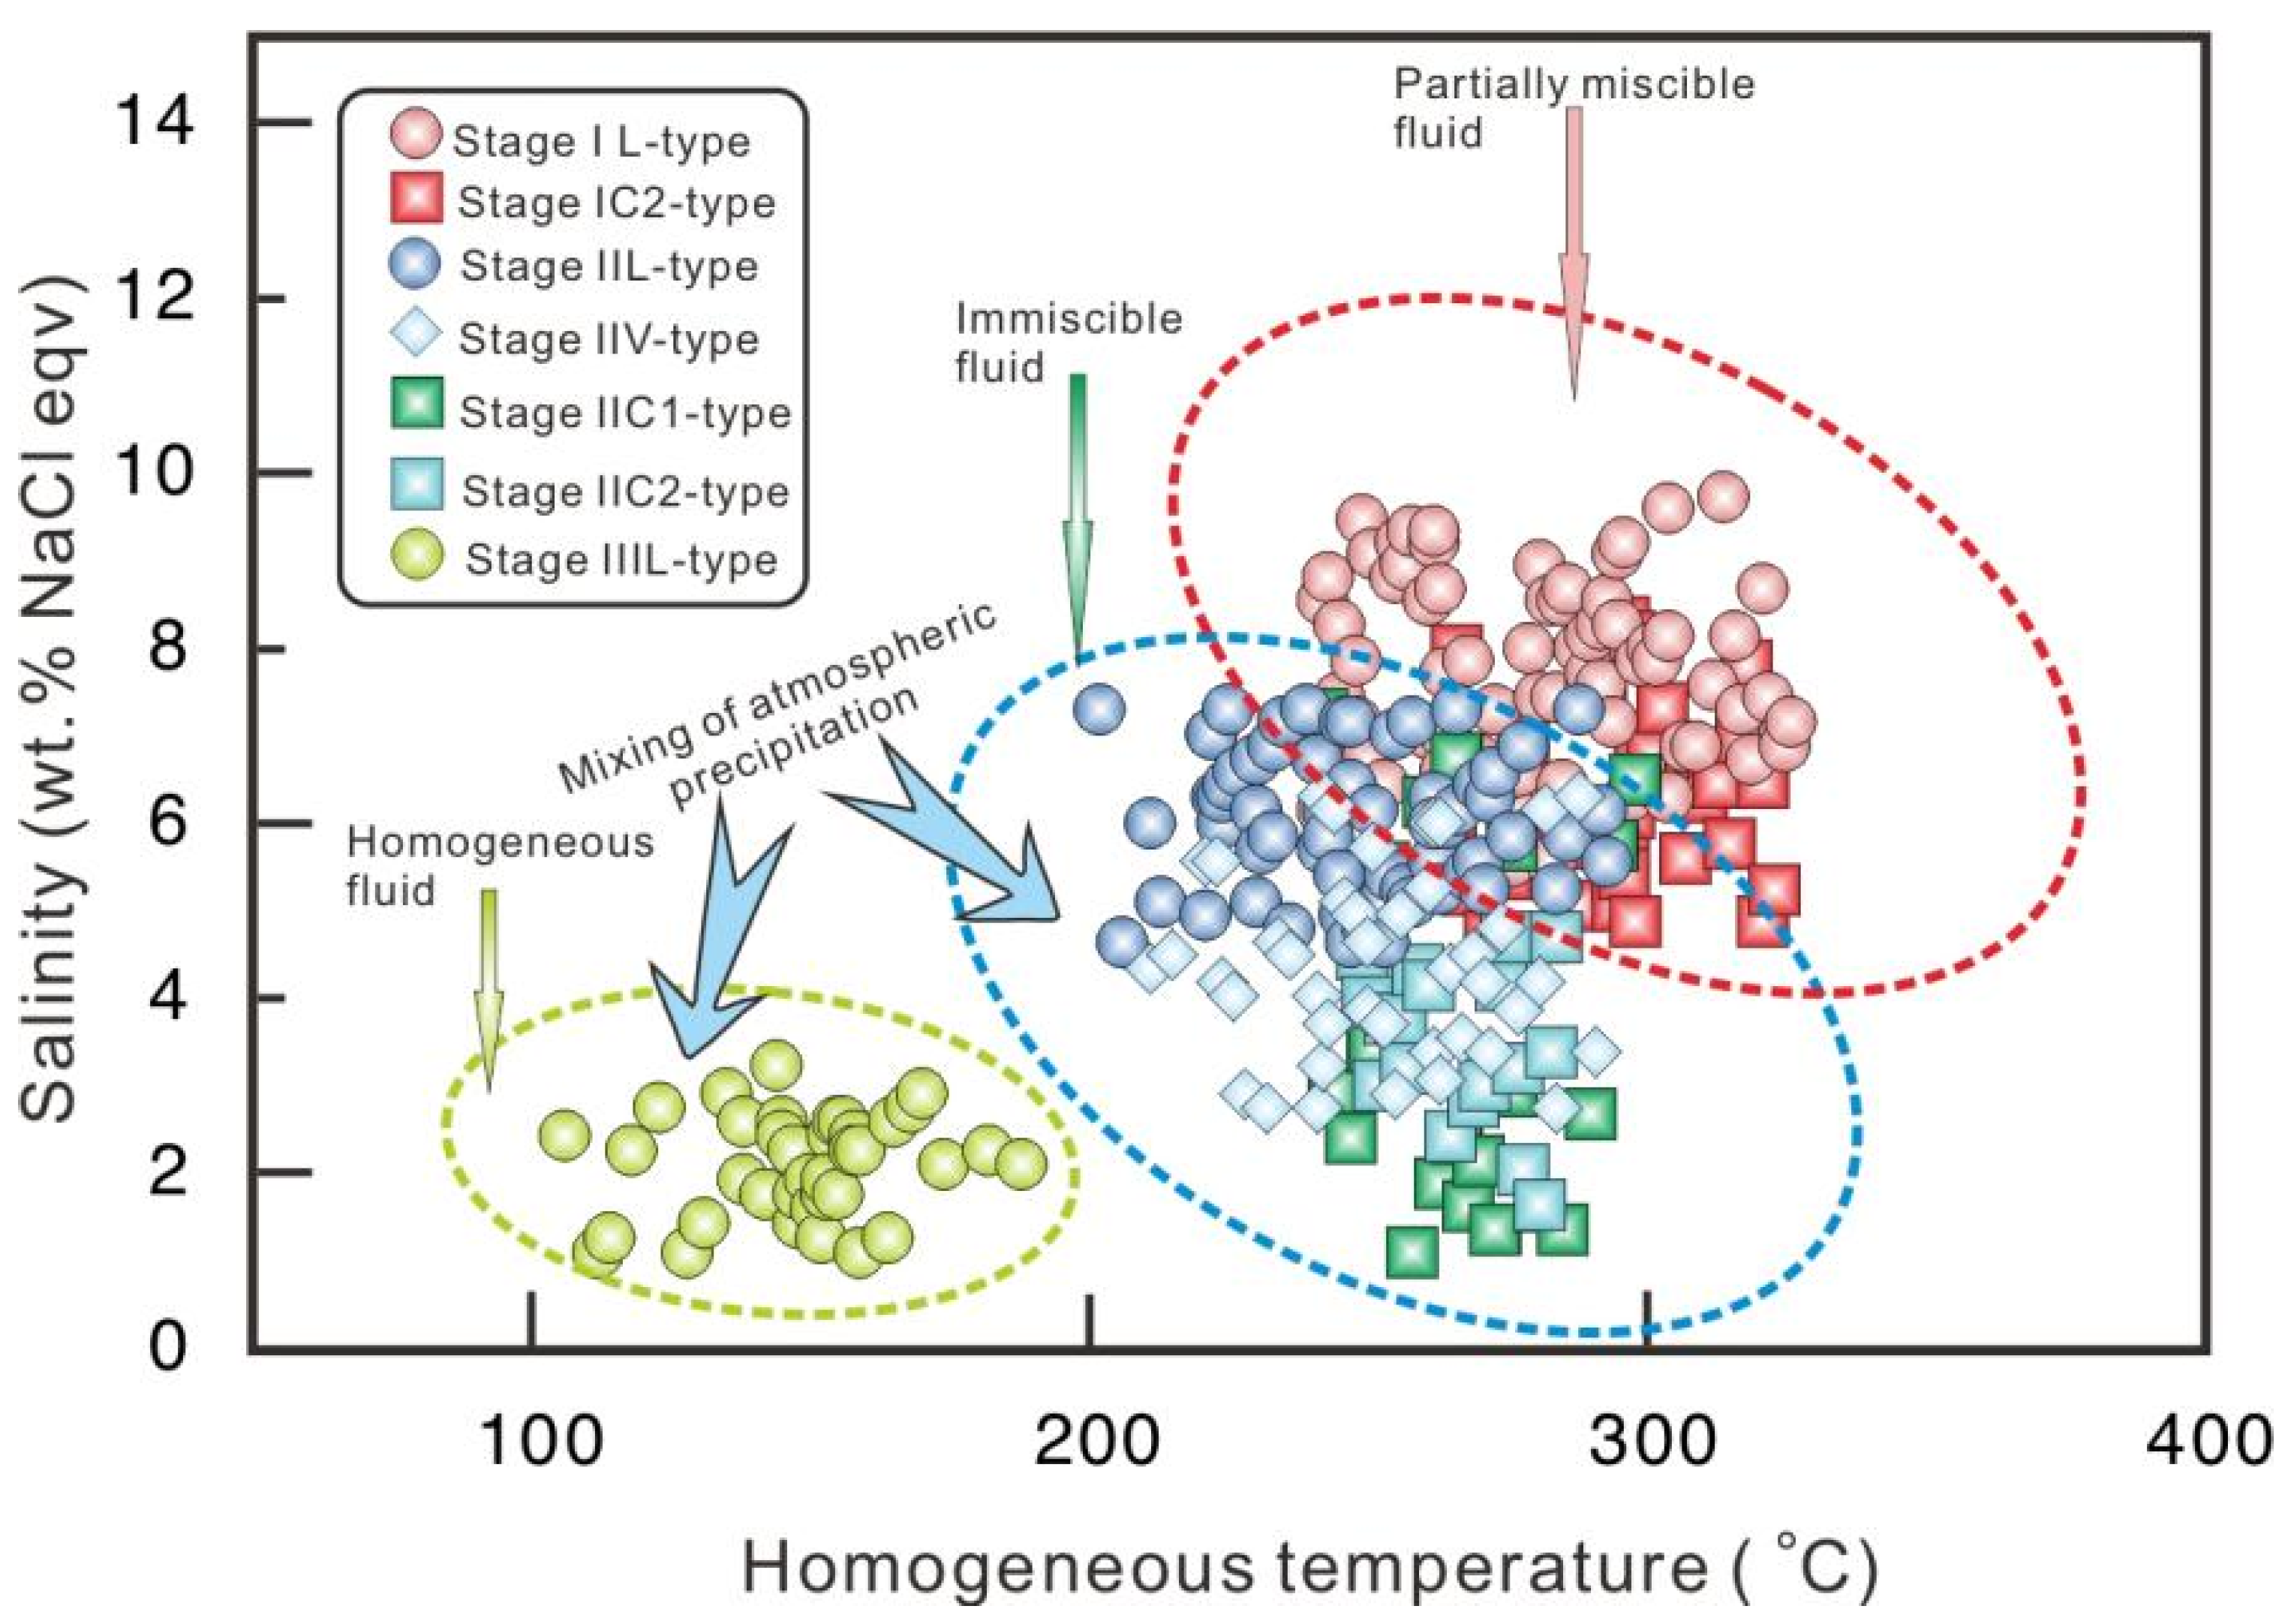
6.2. Nature and Evolution of Ore-Forming Fluids
6.3. Ore Genesis and Exploration Indicationse
7. Conclusions
Author Contributions
Funding
Data Availability Statement
Acknowledgments
Conflicts of Interest
References
- Sengör, A.M.C.; Natal’in, B.A.; Burtman, V.S. Evolution of the Altaid tectonic collage and Paleozoic crustal growth in Eurasia. Nature 1993, 364, 299–307. [Google Scholar] [CrossRef]
- Jahn, B.M.; Wu, F.Y.; Chen, B. Massive granitoid generation in Central Asia: Nd isotopic evidence and implication for continental growth in the Phanerozoic. Episodes 2000, 23, 82–92. [Google Scholar] [CrossRef]
- Wu, F.Y.; Sun, D.Y.; Li, H.M.; Jahn, B.M.; Wilde, S. A-type granites in northeastern China: Age and geochemical constraints on their petrogenesis. Chem. Geol. 2002, 187, 143–173. [Google Scholar] [CrossRef]
- Windley, B.F.; Alexeiev, D.; Xiao, W.J.; Kröner, A.; Badarch, G. Tectonic model for accretion of the Central Asian Orogenic Belt. J. Geol. Soc. 2007, 164, 31–47. [Google Scholar] [CrossRef]
- Guo, F.; Fan, W.M.; Gao, X.F.; Li, C.W.; Miao, L.C.; Zhao, L.; Li, H.X. Sr-Nd-Pb isotope mapping of Mesozoic igneous rocks in NE China: Constraints on tectonic framework and Phanerozoic crustal growth. Lithos 2010, 120, 563–578. [Google Scholar] [CrossRef]
- Kravchinsky, V.A.; Cogné, J.P.; Harbert, W.P.; Kuzmin, M.I. Evolution of the Mongol–Okhotsk Ocean as constrained by new palaeomagnetic data from the Mongol–Okhotsk suture zone, Siberia. Geophys. J. Int. 2002, 148, 34–57. [Google Scholar] [CrossRef]
- Zeng, Q.; Liu, J.; Chu, S.; Wang, Y.; Sun, Y.; Duan, X.; Zhou, L. Mesozoic molybdenum deposits in the East Xingmeng orogenic belt, Northeast China: Characteristics and tectonic setting. Int. Geol. Rev. 2012, 54, 1843–1869. [Google Scholar] [CrossRef]
- Zeng, Q.; Liu, J.; Qin, K.; Fan, H.; Chu, S.; Wang, Y.; Zhou, L. Types, characteristics, and time-space distribution of molybdenum deposits in China. Int. Geol. Rev. 2013, 55, 1311–1358. [Google Scholar] [CrossRef]
- Cao, H.H.; Xu, W.L.; Pei, F.P.; Wang, Z.W.; Wang, F.; Wang, Z.J. Zircon U-Pb geochronology and petrogenesis of the Late Paleozoic–Early Mesozoic intrusive rocks in the eastern segment of the northern margin of the North China Block. Lithos 2013, 170–171, 191–207. [Google Scholar] [CrossRef]
- Yu, J.J.; Wang, F.; Xu, W.L.; Gao, F.H.; Tang, J. Late Permian tectonic evolution at the southeastern margin of the Songnen-Zhangguangcai Range Massif, NE China: Constraints from geochronology and geochemistry of granitoids. Gondwana Res. 2013, 24, 635–647. [Google Scholar] [CrossRef]
- Wilde, S.A. Final amalgamation of the Central Asian Orogenic Belt in NE China: Paleo-Asian Ocean closure versus Paleo-Pacific plate subduction—A review of the evidence. Tectonophysics 2015, 662, 345–362. [Google Scholar] [CrossRef]
- Zhou, J.B.; Wilde, S.A.; Zhao, G.C.; Han, J. Nature and assembly of microcontinental blocks within the Paleo-Asian Ocean. Earth-Sci. Rev. 2018, 186, 76–93. [Google Scholar] [CrossRef]
- Liu, J.; Li, T.G.; Duan, C. Rb-Sr isochron dating and isotopic geochemistry characteristics of the Bajiazi large gold deposit, Jilin Province, China. Acta Geol. Sin. 2018, 92, 1432–1446, (In Chinese with English Abstract). [Google Scholar]
- Yang, Q. Late Paleozoic to Early Mesozoic Copper-Gold Polymetallic Metallogeny and Metallogenic Regularity in Central Jilin Province, Northeast China. Ph.D. Thesis, Jilin University, Changchun, China, 2020. (In Chinese with English Abstract). [Google Scholar]
- Wu, S.Q.; Zhang, W.Q.; Liu, S.Y.; Yang, Y. Geological characters and genesis of Erdaodianzi gold deposit, Jilin Province. Gold 1993, 14, 1–6, (In Chinese with English Abstract). [Google Scholar]
- Sun, Z.S. Geologic Setting, Ore-Controlling Structure and Metallogenic Mechanism of Jiapigou Gold Deposit, Jilin Province. Ph.D. Thesis, Jilin University, Changchun, China, 1995. (In Chinese). [Google Scholar]
- Deng, J.; Yuan, W.M.; Carranza, E.J.M.; Yang, L.Q.; Wang, C.M.; Yang, L.Y.; Hao, N.N. Geochronology and thermochronometry of the Jiapigou gold belt, northeastern China: New evidence for multiple episodes of mineralization. J. Asian Earth Sci. 2014, 89, 10–27. [Google Scholar] [CrossRef]
- Li, L. Research on Ore-Forming Fluids of Gold Deposits in Jiapigou-Haigou Gold Belt, Jilin Province and Deep-Seated Metallogenic Assessment. Ph.D. Thesis, Jilin University, Changchun, China, 2016. (In Chinese). [Google Scholar]
- Zhang, X.T. Research on Geology, Geochemistry and Metallogenesis of the Gold Deposits of the Jiapigou Ore Field in the Continental Margin of Northeast China. Ph.D. Thesis, Jilin University, Changchun, China, 2018. (In Chinese). [Google Scholar]
- Sun, Z.S.; Feng, Y.M. Main minerogenetic epoch, determination and exploratory direction of Jiapigou gold deposit, Jilin. Acta Geosci. Sin. 1997, 18, 367–372, (In Chinese with English Abstract). [Google Scholar]
- Zhang, S.; Zeng, Q.D.; Liu, J.M.; Wang, Z.C.; Gao, J.H. The characteristics and its geological significance of fluid inclusions in Haigou Lode gold deposit, Jilin Province. Acta Petrol. Sin. 2011, 27, 1287–1298. (In Chinese) [Google Scholar]
- Wang, J.B.; Wan, W.Z.; Liu, F.Z.; Chi, B. Geological features of Cuyu gold deposit and prospecting direction of Panshi, Jilin Provinc. Jilin Geol. 2010, 29, 54–57. [Google Scholar]
- Su, B. Study on Geological Characteristics and Genesis of Cuyu Gold Deposit, Panshi City, Jilin Province. Master’s Thesis, Jilin University, Changchun, China, 2014. (In Chinese with English Abstract). [Google Scholar]
- Su, B.; Li, B.L.; Wang, Z.G.; Li, W.Z. Characteristics of fluid inclusions and genesis of the Cuyu gold deposit in Jilin Province. Gold 2014, 35, 8–13, (In Chinese with English Abstract). [Google Scholar]
- Wu, F.Y.; Zhao, G.C.; Sun, D.Y.; Wilde, S.A.; Zhang, G.L. The Hulan Group: Its role in the evolution of the Central Asian Orogenic Belt of NE China. J. Asian Earth Sci. 2007, 30, 542–556. [Google Scholar] [CrossRef]
- Wu, F.Y.; Sun, D.Y.; Ge, W.C.; Zhang, Y.B.; Grant, M.L.; Wilde, S.A.; Jahn, B.M. Geochronology of the Phanerozoic granitoids in northeastern China. J. Asian Earth Sci. 2011, 41, 1–30. [Google Scholar] [CrossRef]
- Miao, L.C.; Qiu, Y.M.; Fan, W.M.; Zhang, F.Q.; Zhai, M.G. Geology, geochronology, and tectonic setting of the Jiapigou gold deposits, southern Jilin Province, China. Ore Geol. Rev. 2005, 26, 137–165. [Google Scholar] [CrossRef]
- Miao, L.C.; Fan, W.M.; Liu, D.Y.; Zhang, F.Q.; Shi, Y.; Guo, F. Geochronology and geochemistry of the Hegenshan ophiolitic complex: Implications for late-stage tectonic evolution of the Inner Mongolia-Daxinganling orogenic belt, China. J. Asian Earth Sci. 2008, 32, 348–370. [Google Scholar] [CrossRef]
- Liu, Y.J.; Li, W.M.; Feng, Z.Q.; Wen, Q.B.; Neubauer, F.; Liang, C.Y. A Review of the Paleozoic Tectonics in the Eastern Part of Central Asian Orogenic Belt. Gondwana Res. 2017, 43, 123–148. [Google Scholar] [CrossRef]
- Guo, F.; Li, H.X.; Fan, W.M.; Li, J.Y.; Zhao, L.; Huang, M.W.; Xu, W.L. Early Jurassic subduction of the Paleo-Pacific Ocean in NE China: Petrologic and geochemical evidence from the Tumen mafic intrusive complex. Lithos 2015, 224–225, 46–60. [Google Scholar] [CrossRef]
- Yang, Q.; Ren, Y.S.; Hao, Y.J.; Wang, B.; Sun, Z.M.; Li, J.M. Ore fluid, geochronology and tectonic setting of mesothermal gold metallogeny in southeastern Jilin Province, northeast China: A case study of the Shajingou gold deposit. Ore Geol. Rev. 2019, 109, 229–252. [Google Scholar] [CrossRef]
- Zhou, L.L.; Zeng, Q.D.; Liu, J.M.; Friis, H.; Zhang, Z.L.; Duan, X.X. Ore genesis and fluid evolution of the Daheishan giant porphyry molybdenum deposit, NE China. J. Asian Earth Sci. 2015, 97, 486–505. [Google Scholar] [CrossRef]
- Wang, Z.G.; Wang, K.Y.; Wan, D.; Yassa, K.; Yang, T.N.; Liang, Y.H. Metallogenic age and hydrothermal evolution of the Jidetun Mo deposit in central Jilin Province, northeast China: Evidence from fluid inclusions, isotope systematics, and geochronology. Ore Geol. Rev. 2017, 89, 731–751. [Google Scholar] [CrossRef]
- Clayton, R.N.; Mayeda, T.K. The use of bromine pentafluoride in the extraction of oxygen from oxides and silicates for isotopic analysis. Geochim. Cosmochim. Acta 1963, 27, 43–52. [Google Scholar] [CrossRef]
- Chen, Y.L.; Li, H.; Zheng, C.; Elatikpo, S.M.; Cheng, S.; Jiang, W. Ore-forming Process of the Haigou Gold Deposit in the Eastern Central Asian Orogenic Belt, NE China: Constrains from EPMA and LA-ICP-MS Analysis of Au-bearing Pyrite. Resour. Geol. 2022, 72, e12304. [Google Scholar] [CrossRef]
- Yang, Q.; Ren, Y.S.; Huizenga, J.-M.; Li, J.M.; Wang, E.D.; Wang, X.; Wang, B. Geological significance of Early Triassic porphyry Cu mineralization in the eastern Xar Moron–Changchun Metallogenic Belt, northeast China: A case study of the newly-discovered Guokuidingzi Cu deposit. Ore Geol. Rev. 2021, 133, 104092. [Google Scholar] [CrossRef]
- Yang, Q.; Ren, Y.S.; Hao, Y.J.; Li, J. Age and tectonic setting of vein-type Pb–Zn–(Ag) mineralization in the Xiaohongshilazi deposit, central Jilin Province, NE China. Resour. Geol. 2020, 70, 70–88. [Google Scholar] [CrossRef]
- Lu, H.Z.; Fan, H.R.; Ni, P.; Ou, G.X.; Shen, K.; Zhang, W.H. Fluid Inclusion; Science Press: Beijing, China, 2004; pp. 193–200. (In Chinese) [Google Scholar]
- Shen, B.F.; Luo, H.; Han, G.; Dai, X.; Jin, X.; Hu, X.; Li, S.; Bi, S. Archean Geology and Metallization in Northern Liaoning Province and Southern Jilin Province; Geological Publishing House: Beijing, China, 1994; pp. 1–225, (In Chinese with English Abstract). [Google Scholar]
- Zeng, Q.D.; Wang, Z.C.; He, H.Y. Multiple isotope composition (S, Pb, H, O, He, and Ar) and genetic implications for gold deposits in the Jiapigou gold belt, Northeast China. Miner. Depos. 2014, 49, 145–164. [Google Scholar] [CrossRef]
- Huang, Z.X. Tectonics–Fluids–Mineralization System of Jiapigou Gold Belt in Jilin Province, China. D.Sc. Thesis, China University of Geosciences, Beijing, China, 2012. (In Chinese with English Abstract). [Google Scholar]
- Yang, L.Y.; Yang, L.Q.; Yuan, W.M.; Zhang, C.; Zhao, K.; Yu, H.J. Origin and evolution of ore fluid for orogenic gold traced by D-O isotopes: A case from the Jiapigou gold belt. Acta Petrol. Sin. 2013, 29, 4025–4035, (In Chinese with English Abstract). [Google Scholar]
- Sun, Z.S.; Feng, B.Z.; Qing, X. The stable isotopic geology and exploration direction of the Jiapigou gold deposit, Jilin Province. J. Changchun Univ. Sci. Technol. 1998, 28, 142–147, (In Chinese with English Abstract). [Google Scholar]
- Li, B.L.; Chen, G.J.; Song, Z.W. Discussion on Minerogenetic Epoch of the Gold Deposit in Jiapigou of Jilin Province. Global Geol. 2004, 23, 354–359, (In Chinese with English Abstract). [Google Scholar]
- Chen, Y.J.; Zhang, C.; Li, N.; Yang, Y.F.; Deng, K. Geology of the Mo Deposits in Northeast China. J. Jilin Univ. (Earth Sci. Ed.) 2012, 42, 1223–1254, (In Chinese with English Abstract). [Google Scholar]
- Chen, Y.Q.; Zhao, P.D. Extraction and Integration of Comprehensive Metallogenic Geological Anomaly Information. Earth Sci. 2009, 34, 325–335, (In Chinese with English Abstract). [Google Scholar]
- Roedder, E. Fluid inclusions. Rev. Mineral. 1984, 12, 1–644. [Google Scholar]
- Zheng, Y.-F. Calculation of Oxygen Isotope Fractionation in Anhydrous Silicate Minerals. Chemical Geology 1993, 103, 239–246. [Google Scholar]
- Luo, H. Fluid inclusions in quartz of Jiapigou vein type gold deposit. Gold 1992, 10, 1–5. (In Chinese) [Google Scholar]
- Chen, X.J.; Ni, P.; Fan, H.R.; Pirajno, F.; Lai, Y.; Su, W.C.; Zhang, H. Diagnostic fluid inclusions of different types hydrothermal gold deposits. Acta Petrol. Sin. 2007, 23, 2085–2108, (In Chinese with English Abstract). [Google Scholar]
- Chai, P.; Sun, J.G.; Hou, Z.Q.; Xing, S.W.; Wang, Z.Y. Geological, Fluid Inclusion, H-O–S–Pb Isotope, and Ar–Ar Geochronology Constraints on the Genesis of the Nancha Gold Deposit, Southern Jilin Province, Northeast China. Ore Geol. Rev. 2016, 72, 1053–1071. [Google Scholar] [CrossRef]
- Goldfarb, R.J.; Baker, T.; Dube, B. Distribution, Character and Genesis of Gold Deposits in Metamorphic Terranes. In Economic Geology 100th Anniversary Volume; Society of Economic Geologists: Littleton, CO, USA, 2005; pp. 407–450. [Google Scholar]
- Goldfarb, R.J.; Newberry, R.J.; Pickthorn, W.J.; Gent, C.A. Oxygen, Hydrogen, and Sulfur Isotope Studies in the Juneau Gold Deposits, Southeastern Alaska: Constraints on the Origin of Hydrothermal Fluids. Econ. Geol. 1991, 86, 66–80. [Google Scholar] [CrossRef]
- Taylor, H.P. Oxygen and Hydrogen Isotope Relationships in Hydrothermal Mineral Deposits. In Geochemistry of Hydrothermal Ore Deposits; Wiley and Sons: New York, NY, USA, 1997; pp. 229–302. [Google Scholar]
- Alam, M.; Li, S.-R.; Santosh, M.; Zafar, T.; Hussain, Z.; Yuan, M.-W.; Khan, H. Characteristics, Provenance, Ore Genesis and Exploration of the Shimshal Valley Placer Gold Deposits in the Karakoram Block, North Pakistan. J. Geochem. Explor. 2023, 245, 107128. [Google Scholar] [CrossRef]
- Stoltnow, M.; Lüders, V.; De Graaf, S.; Niedermann, S. A Geochemical Study of the Sweet Home Mine, Colorado Mineral Belt, USA: Formation of Deep Hydrothermal Vein–Type Molybdenum Greisen and Base Metal Mineralization. Miner. Depos. 2022, 57, 801–825. [Google Scholar] [CrossRef]
- Zhang, Y.; Zhen, S.; Wang, D.; Liu, J.; Wang, J.; Zha, Z.; Bai, H. In Situ Trace Elements and Sulfur Isotopes of Sulfides in the Dabaiyang Te-Au Deposit, Hebei Province, China: Implications for Au Remobilization from Pyrite. Ore Geol. Rev. 2022, 140, 104626. [Google Scholar] [CrossRef]
- Hoefs, J. Geochemistry of Stable Isotopes. Angew. Chem. Int. Ed. Engl. 1975, 14, 75–79. [Google Scholar] [CrossRef]
- Zeng, Z.; Chen, Z.; Qi, H.; Zhu, B. Chemical and Isotopic Composition of Sulfide Minerals from the Noho Hydrothermal Field in the Okinawa Trough. J. Mar. Sci. Eng. 2022, 10, 678. [Google Scholar] [CrossRef]
- Zhang, S.; Wang, Y.B.; Chu, S.X. Zircon U-Pb ages and Sr-Nd-Hf isotopic composition of the Haigou granitoids at the northeastern margin of North China Craton: Implications for geodynamic setting. Acta Petrol. Sin. 2012, 28, 544–556, (In Chinese with English Abstract). [Google Scholar]
- Ohmoto, H.; Rye, R.O. Isotopes of sulphur and carbon. In Geochemistry of Hydrothermal Ore Deposits, 2nd ed.; Barnes, H.L., Ed.; John Wiley & Sons: New York, NY, USA, 1979; pp. 509–567. [Google Scholar]
- Ohmoto, H. Systematics of sulfur and carbon isotopes in hydrothermal ore deposits. Econ. Geol. 1972, 67, 551–578. [Google Scholar] [CrossRef]
- Jin, H.Y.; Yu, Z.T.; Wu, J.X. Fluid inclusion characteristics and genesis of Songjianghe gold deposit, Jilin Province. Glob. Geol. 2014, 33, 76–85. (In Chinese) [Google Scholar]
- Shan, L.; Zheng, Y.Y.; Xu, R.K. Review on sulfur isotopic tracing and hydrothermal metallogenesis. Geol. Resour. 2009, 18, 197–203, (In Chinese with English Abstract). [Google Scholar]
- Zartman, R.E.; Doe, B.R. Plumbotectonics—The model. Tectonophysics 1981, 75, 135–162. [Google Scholar] [CrossRef]
- Wang, X.; Wang, K.Y.; Fu, L.J.; Zhao, Q.Y.; Sun, Q.F.; Zhang, C. Fluid Evolution and Ore Genesis of the A’gui Cu Deposit in Southern Great Xing’an Range, Northeast China: Evidence from Fluid Inclusion and C-H-O-S-Pb Isotopes. Geochemistry 2023, 83, 125953. [Google Scholar] [CrossRef]
- Qiu, K.F.; Li, N.; Taylor, R.D.; Song, Y.H.; Song, K.R.; Han, W.Z.; Zhang, D.X. Timing and duration of metallogeny of the Wenquan deposit in the West Qinling, and its constraint on a proposed classification for porphyry molybdenum deposits. Acta Petrol. Sin. 2014, 30, 2631–2643, (In Chinese with English Abstract). [Google Scholar]
- Qiu, K.-F.; Taylor, R.D.; Song, Y.-H.; Yu, H.-C.; Song, K.-R.; Li, N. Geologic and geochemical insights into the formation of the Taiyangshan porphyry copper–molybdenum deposit, Western Qinling Orogenic Belt, China. Gondwana Res. 2016, 35, 40–58. [Google Scholar] [CrossRef]
- Shepherd, T.J.; RaKin, A.; Alderton, D.H.M. A Practical Guide to Fluid Inclusion Studies; Blackie and Son Limited: Glasgow, Scotland, 1985; pp. 1–154. [Google Scholar]
- Zhang, W.H.; Chen, Z.Y. Geology of Fluid Inclusions; China University of Geosciences Press: Wuhan, China, 1993. (In Chinese) [Google Scholar]
- Lu, H.Z.; Guo, D.J. Progress and Trends of Researches on Fluid Inclusions. Geol. Rev. 2000, 46, 385–392, (In Chinese with English Abstract). [Google Scholar]
- Lu, H.Z. Fluid immiscibility and fluid inclusions. Acta Petrol. Sin. 2011, 27, 1253–1261, (In Chinese with English Abstract). [Google Scholar]
- Wu, J.; Zeng, Q.; Santosh, M.; Fan, H.; Bai, R.; Li, X.; Zhang, Z.; Zhang, Y.; Huang, L. Deep ore-forming fluid characteristics of the Jiaodong gold province: Evidence from the Qianchen gold deposit in the Jiaojia gold belt. Ore Geol. Rev. 2022, 145, 104911. [Google Scholar] [CrossRef]
- Bowers, T.S.; Helgeson, H.C. Calculation of thermodynamic and geochemical consequences of nonideal mixing in the system H2O–NaCl–CO2 on phase relations in geologic system: Equation of state for H2O–NaCl–CO2 fluids at high pressure and temperatures. Geochim. Cosmochim. Acta 1983, 47, 1247–1275. [Google Scholar] [CrossRef]
- Dai, J.Z.; Wang, K.Y.; Cheng, X.M. Geochemical Features of Ore-Forming Fluids in the Jiapigou Gold Belt, Jilin Province. Acta Petrol. Sin. 2007, 23, 2198–2206, (In Chinese with English Abstract). [Google Scholar]
- Dai, J.Z.; Wang, K.Y.; Cheng, X.M.; Yang, Y.C. The Fluid Inclusion Features and Metallogenic Temperature of the Lishan Gold Deposit in Jiapigou, Jilin Province. Acta Geosci. Sin. 2005, 26, 21–24, (In Chinese with English Abstract). [Google Scholar]
- Li, L.; Sun, J.G.; Men, L.J.; Chai, P. Origin and Evolution of the Ore-Forming Fluids of the Erdaogou and Xiaobeigou Gold Deposits, Jiapigou Gold Province, NE China. J. Asian Earth Sci. 2016, 129, 170–190. [Google Scholar] [CrossRef]
- Liu, B.; Shen, K. The Thermodynamics of Fluid Inclusions; Geological Publishing House: Beijing, China, 1999; pp. 1–290, (In Chinese with English Abstract). [Google Scholar]
- Simeone, R.; Simmons, S.F. Mineralogical and Fluid Inclusion Studies of Low-Sulfidation Epithermal Veins at Osilo (Sardinia), Italy. Miner. Depos. 1999, 34, 705–717. [Google Scholar] [CrossRef]
- Ramboz, C.; Pichavant, M.; Weisbrod, A. Fluid immiscibility in natural processes: Use and misuse of fluid inclusion data: II. Interpretation of fluid inclusion data in terms of immiscibility. Chem. Geol. 1982, 37, 29–48. [Google Scholar] [CrossRef]
- Brown, P.E. Fluid inclusion modeling for hydrothermal systems. Rev. Econ. Geol. 1998, 10, 151–171. [Google Scholar]
- Anderson, M.R.; Rankin, A.H.; Spiro, B. Fluid Mixing in the Generation of Isothermal Gold Mineralization in the Transvaal Sequence, Transvaal, South Africa. Eur. J. Mineral. 1992, 4, 933–948. [Google Scholar] [CrossRef]
- Wang, Z.L.; Yang, L.Q.; Guo, L.N.; Marsh, E.; Wang, J.P.; Liu, Y.; Zhang, C.; Li, R.H.; Zhang, L.; Zheng, X.L.; et al. Fluid Immiscibility and Gold Deposition in the Xincheng Deposit, Jiaodong Peninsula, China: A Fluid Inclusion Study. Ore Geol. Rev. 2015, 66, 701–717. [Google Scholar] [CrossRef]
- Plessen, B.; Lüders, V. Simultaneous Measurements of Gas Isotopic Compositions of Fluid Inclusion Gases (N2, CH4, CO2) Using Continuous-Flow Isotope Ratio Mass Spectrometry. Rapid Commun. Mass Spectrom. 2012, 26, 1157–1161. [Google Scholar] [CrossRef]
- Xavier, R.P.; Foster, R.P. Fluid evolution and chemical controls in the Fazenda Maria Preta (FMP) gold deposit, Rio Itapicuru greenstone belt, Bahia, Brazil. Chem. Geol. 1999, 154, 133–154. [Google Scholar]
- Yu, Q.Y. On the Granite–Magmatic Hydrothermal Origin of Gold Deposits in Jiapigou Region, Jilin. J. Changchun Coll. Geol. 1987, 17, 55–64, (In Chinese with English Abstract). [Google Scholar]
- Yu, H.J. On the Geology, Geochemistry and Genesis Model Study of the Jiapigou Ore Deposit of Jilin Province. Master’s Thesis, China University of Geosciences Beijing, Beijing, China, 2009. (In Chinese with English Abstract). [Google Scholar]
- Wu, S.Q. 40Ar/39Ar Fast Neutron Activation Age Determination of Auriferous Quartz from the Jiapigou Gold Deposit, Jilin Province. Miner. Depos. 1991, 10, 349–358, (In Chinese with English Abstract). [Google Scholar]
- Zeng, Q.D.; Wang, Z.C.; Zhang, S.; Wang, Y.B.; Yang, Y.H.; Liu, J.M. The Ore-Forming Epoch of the Jiapigou Gold Belt, NE China: Evidences from the Zircon LA-ICP-MS U-Pb Dating of the Intrusive Rocks. Acta Geol. Sin. (Engl. Ed.) 2014, 88, 1029–1030. [Google Scholar] [CrossRef]
- Han, J.L.; Sun, J.G.; Liu, Y.; Zhang, X.T.; He, Y.P.; Yang, F.; Chu, X.L.; Wang, L.L.; Wang, S.; Zhang, X.W.; et al. Genesis and Age of the Toudaoliuhe Breccia-Type Gold Deposit in the Jiapigou Mining District of Jilin Province, China: Constraints from Fluid Inclusions, H–O–S–Pb Isotopes, and Sulfide Rb–Sr Dating. Ore Geol. Rev. 2020, 118, 103356. [Google Scholar] [CrossRef]
- McCuaig, T.C.; Kerrich, R. P-T–t–Deformation–Fluid Characteristics of Lode Gold Deposits: Evidence from Alteration Systematics. Ore Geol. Rev. 1998, 12, 381–453. [Google Scholar] [CrossRef]
- Phillips, G.N.; Powell, R. Formation of Gold Deposits: A Metamorphic Devolatilization Model. J. Metamorph. Geol. 2010, 28, 689–718. [Google Scholar] [CrossRef]
- Phillips, G.N.; Powell, R. A Practical Classification of Gold Deposits, with a Theoretical Basis. Ore Geol. Rev. 2015, 65, 568–573. [Google Scholar] [CrossRef]
- Goldfarb, R.J.; Groves, D.I. Orogenic gold: Common or evolving fluid and metal sources through time. Lithos 2015, 233, 2–26. [Google Scholar] [CrossRef]
- Groves, D.I.; Goldfarb, R.J.; Robert, F.; Hart, C.J. Gold deposits in metamorphic belts: Overview of current understanding, outstanding problems, future research, and exploration significance. Econ. Geol. 2003, 98, 1–29. [Google Scholar]
- Chen, Y.J. Orogenic type deposits and their metallogenic model and exploration potential. Geol. China 2006, 33, 1181–1196, (In Chinese with English Abstract). [Google Scholar]
- Sillitoe, R.H.; Thompson, J.F.H. Intrusion-related vein gold deposits: Types, tectono-magmatic settings and difficulties of distinction from orogenic gold deposits. Resour. Geol. 1998, 48, 237–250. [Google Scholar] [CrossRef]
- Fan, H.R.; Zhai, M.G.; Xie, Y.H.; Yang, J.H. Ore-forming fluids associated with granite-hosted gold mineralization at the Sanshandao deposit, Jiaodong gold province, China. Miner. Depos. 2003, 38, 739–750. [Google Scholar] [CrossRef]
- Groves, D.I.; Vielreicher, R.M.; Goldfarb, R.J.; Condie, K.C. Control on the heterogeneous distribution of mineral deposits through time. Miner. Depos. Earth Evol. 2005, 248, 71–101. [Google Scholar] [CrossRef]
- Chen, Y.J. The development of continental collision metallogeny and its application. Acta Petrol. Sin. 2013, 29, 1–17, (In Chinese with English Abstract). [Google Scholar]
- Lang, J.R.; Baker, T. Intrusion-related gold systems: The present level of understanding. Miner. Depos. 2001, 36, 477–489. [Google Scholar] [CrossRef]
- Zhang, X.-T.; Sun, J.-G.; Han, J.-L.; Feng, Y.-Y. Genesis and ore-forming process of the Benqu mesothermal gold deposit in the Jiapigou ore cluster, NE China: Constraints from geology, geochronology, fluid inclusions, and whole-rock and isotope geochemistry. Ore Geol. Rev. 2021, 130, 103956. [Google Scholar] [CrossRef]
- Zhang, X.-T.; Xu, X.-Y.; Sun, J.-G.; Han, J.-L.; Feng, Y.-Y.; Wang, S.; Liu, Y.; Chu, X.-L. Geological, fluid inclusion, and H-O-S-Pb isotopic constraints on the genesis of the Bajiazi mesothermal lode gold deposit in the Jiapigou ore cluster, northeast China. Ore Geol. Rev. 2023, 152, 105259. [Google Scholar] [CrossRef]
- Wutiepu, W.; Yang, Y.; Han, S.; Guo, Y.; Nie, S.; Liu, C.; Fan, W.; Liu, Y. Zircon U-Pb age, Hf isotope, and geochemistry of Late Permian to Triassic igneous rocks from the Jiapigou gold ore belt, NE China: Petrogenesis and tectonic implications. Geol. J. 2020, 55, 501–516. [Google Scholar] [CrossRef]
- Deng, J.; Yang, L.Q.; Gao, B.F.; Sun, Z.S.; Guo, C.Y.; Wang, Q.F.; Wang, J.P. Fluid Evolution and Metallogenic Dynamics during Tectonic Regime Transition: Example from the Jiapigou Gold Belt in Northeast China. Resour. Geol. 2009, 59, 140–152. [Google Scholar] [CrossRef]


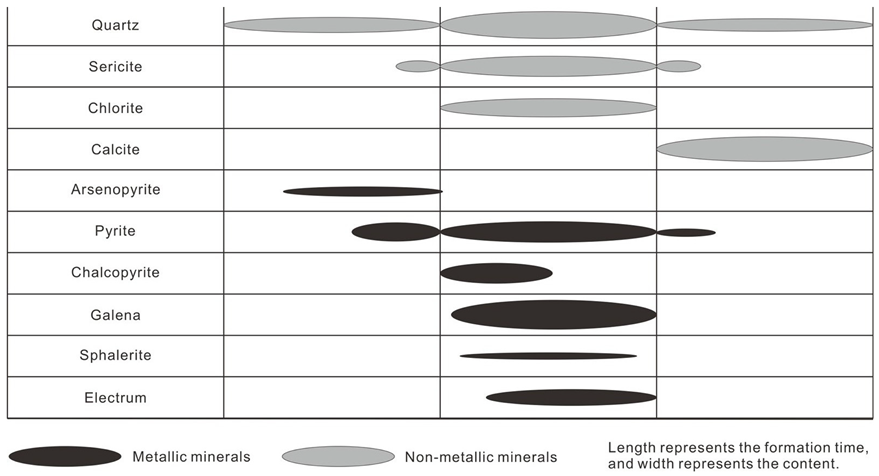
| Stage of Mineralization | Quartz-Arsenopyrite-Pyrite | Quartz-Sericite-Native Gold-Polymetallic Sulfide | Quartz-Carbonate ± Pyrite | ||
|---|---|---|---|---|---|
| Sequence | |||||
| Mineral | |||||
 | |||||
| Mineralized Stages | Host Minerals | Inclusion Types | Tm-CO2 (°C) | Tm-cla (°C) | Th-CO2 (°C) | Tm-ice (°C) | Concentrating T (°C) | Salinity (wt.% NaCl eq) |
|---|---|---|---|---|---|---|---|---|
| stage I | Qz | L-type | / | / | / | −6.4 to −3.4 | 242–326 | 5.50–9.73 |
| C2-type | −58.3 to −57.9 | 5.5–6.7 | 26.7–29.2 | / | 265–323 | 4.69–8.29 | ||
| C3-type | −58.4 to −57.6 | / | 26.4–29.5 | / | / | / | ||
| Stage II | Qz | L-type | / | / | / | −4.6 to −2.8 | 202–293 | 4.63–7.30 |
| V-type | / | / | / | −3.9 to −1.6 | 211–291 | 2.73–6.29 | ||
| C1-type | −59.2 to −58.1 | 7.3–8.8 | 26.6–29.8 | / | 242–298 | 2.42–5.23 | ||
| C2-type | −59.4 to −58.5 | 7.6–9.2 | 25.9–30.1 | / | 249–284 | 1.63–4.69 | ||
| C3-type | −59.0 to −58.2 | / | 26.9–28.9 | / | / | / | ||
| Stage IV | Qz, Cc | L-type | / | / | / | −2.1 to −0.8 | 106–188 | 1.39–3.53 |
| Ore Deposits | Sample No. | Stage | Mineral | δ18OV-SMOW (‰) | T (°C) | δ18OH2O (‰) | δD (‰) | Reference |
|---|---|---|---|---|---|---|---|---|
| Cuyu | 8CY-1 | Early stage of mineralization | Quartz | 11.4 | 292 | 4.21 | −83.9 | This paper |
| 8CY-2 | 10.4 | 292 | 3.21 | −82.2 | ||||
| 8CY-3 | Main stage of mineralization | 11.7 | 252 | 2.84 | −90.5 | |||
| 8CY-4 | 11.1 | 252 | 2.24 | −90.9 | ||||
| 8CY-5 | 9.5 | 252 | 0.64 | −89.9 | ||||
| 7CY-5 | 11.2 | 252 | 2.34 | −91.8 | ||||
| 7CY-6 | 11.5 | 252 | 2.64 | −91.1 | ||||
| 7CY-3 | Late stage of mineralization | 11.4 | 150 | −4.09 | −92.2 | |||
| 7CY-7 | 11.4 | 150 | −4.09 | −95.4 | ||||
| Erdaogou | Early stage of mineralization | Quartz | 9.1 | 330 | 3.2 | −92.4 | [39] | |
| 11.9 | 330 | 6 | −88.9 | |||||
| 11.8 | 320 | 5.6 | −92 | [40] | ||||
| 10.6 | 315 | 4.2 | −81 | |||||
| Main stage of mineralization | 11.9 | 230 | 1.9 | −95 | [41] | |||
| 11.2 | 230 | 1.2 | −94 | |||||
| 14.1 | 230 | 4.1 | −98 | |||||
| 11.2 | 200 | −0.5 | −94 | [42] | ||||
| Late stage of mineralization | 11.9 | 150 | −4.6 | −95 | ||||
| Haigou | Early stage of mineralization | Quartz | 12.6 | 370 | 6.7 | −80 | [18] | |
| 12.7 | 370 | 6.8 | −80 | |||||
| 13.2 | 370 | 8.4 | −74 | |||||
| Main stage of mineralization | 12 | 320 | 7 | −98 | ||||
| 12 | 310 | 7.5 | −105 | |||||
| Xiaobeigou | Early stage of mineralization | Quartz | 11.6 | 320 | 5.5 | −97 | [42] | |
| 4 | 425 | 0.5 | −92 | [43] | ||||
| 7.9 | 310 | 1.4 | −92 | [39] | ||||
| 6.6 | 310 | 0.1 | −88 | |||||
| 8 | 315 | 1.6 | −96 | |||||
| Main stage of mineralization | 11.6 | 200 | −0.1 | −97 | [40] | |||
| 8.3 | 240 | −1.1 | −102 | [18] | ||||
| 7.6 | 240 | −1.8 | −102 | |||||
| 9.1 | 190 | −3.3 | −92 | [41] | ||||
| 11.3 | 190 | −1.1 | −90 | |||||
| Late stage of mineralization | 4.8 | 165 | −9.4 | −78 | [18] | |||
| 4.4 | 165 | −9.2 | −78 | |||||
| 12.8 | 150 | −2.7 | −97 | [41] | ||||
| 9.1 | 167 | −5 | −92 | [40] | ||||
| 11.3 | 167 | −2.8 | −90 | |||||
| Bajiazi | 87C743 | Early stage of mineralization | Quartz | / | 305 | 4.4 | −93.9 | [49] |
| 87C770 | / | 305 | 4.4 | −89.1 | ||||
| Sandaogou | 87C827 | Early stage of mineralization | Quartz | / | 345 | 5 | −88.2 | [49] |
| 3-1 | 4.2 | −70 | [43] | |||||
| Shajingou | 17SJG-1 | Early stage of mineralization | Quartz | 10.8 | 360 | 5.8 | −83.7 | [31] |
| 17SJG-2 | 11 | 360 | 6 | −84.2 | ||||
| 17SJG-3 | Main stage of mineralization | 8.6 | 314 | 2.2 | −95.4 | |||
| 17SJG-4 | 8 | 314 | 1.6 | −94.2 | ||||
| 17SJG-5 | Late stage of mineralization | 2.8 | 230 | −7.1 | −89.6 | |||
| 17SJG-6 | 3.1 | 230 | −6.8 | −90.7 |
| Ore Deposits | Sample No. | Ore | Analytical Mineral | δ34S (‰) | Reference |
|---|---|---|---|---|---|
| Cuyu | 7CY-3-1 | Gold-bearing sulfide ore | Galena | −3.2 | This paper |
| 7CY-3-1 | Arsenopyrite | −3 | |||
| 7CY-3-1 | Pyrite | −5.6 | |||
| 7CY-3-2 | Arsenopyrite | −4.2 | |||
| 7CY-3-2 | Pyrite | −6.2 | |||
| 7CY-3-2 | Galena | −6.5 | |||
| 7CY-3-3 | Pyrite | −2.8 | |||
| 7CY-3-4 | Pyrite | −0.9 | |||
| Jiapigou | BQ0835-1 | Gold-bearing sulfide ore | Pyrite | 8.1 | [40] |
| LS6-1 | Pyrite | 7.8 | |||
| LS6-1 | Chalcopyrite | 7.6 | |||
| XT200-1 | Pyrite | 8.8 | |||
| XT200-1 | Galena | 3.7 | |||
| XT200-4 | Pyrite | 8.4 | |||
| XT200-4 | Chalcopyrite | 7.3 | |||
| XT200-4 | Galena | 5.4 | |||
| Sandaocha | Sd740119-2 | Gold-bearing sulfide ore | Pyrite | 6.1 | |
| SD150118-1 | Pyrite | 6.1 | |||
| SD150118-1 | Chalcopyrite | 5.6 | |||
| SD150126-1 | Pyrite | 10.9 | |||
| 290-162 | Pyrite | 5.7 | [39] | ||
| 290-142 | Pyrite | 5.4 | |||
| J21 | Pyrite | 5.2 | |||
| J23 | Pyrite | 5.3 | |||
| J24 | Pyrite | 6.3 | |||
| J17 | Pyrite | 6 | |||
| J18 | Pyrite | 6 | |||
| J20 | Pyrite | 5.5 | |||
| 380-102 | Pyrite | 7 | |||
| 335-8 | Pyrite | 5.5 | |||
| 335-12 | Pyrite | 6.4 | |||
| 335-9 | Pyrite | 6.8 | |||
| 380-7 | Pyrite | 7.1 | |||
| 380-118 | Pyrite | 5.9 | |||
| Erdaogou | ED1050128 | Gold-bearing sulfide ore | Pyrite | 6.3 | [40] |
| ED1050128 | Chalcopyrite | 5.7 | |||
| ED1050128 | Galena | 3.6 | |||
| ED1150119-1 | Pyrite | 7.4 | |||
| ED1140105-4 | Pyrite | 7.4 | |||
| ED1090 | Pyrite | 5.5 | |||
| ED1090 | Chalcopyrite | 5.7 | |||
| ED1090 | Galena | 4.1 | |||
| 87C794 | Pyrite | 6.2 | [39] | ||
| 87C794 | Galena | 4.2 | |||
| Xiaobeigou | BG890164 | Gold-bearing sulfide ore | Pyrite | 9.5 | [40] |
| BG890142 | Pyrite | 7.9 | |||
| BG650181-2 | Pyrite | 8.8 | |||
| BG890102-1 | Pyrite | 9.8 | |||
| Banmiaozi | 100-9 | Gold-bearing sulfide ore | Chalcopyrite | 9.9 | [15] |
| 160-2 | Pyrite | 2.7 | |||
| 180-9 | Pyrite | 7.9 | |||
| 140-3 | Pyrite | 9.9 | |||
| 6-17 | Pyrite | 9.9 | |||
| 190-1 | Pyrite | 5.8 | |||
| Bajiazi | BJZ280373-1 | Gold-bearing sulfide ore | Pyrite | 7.2 | [40] |
| BJZ560413-7 | Pyrite | 7.9 | |||
| Pyrite | 7 | [39] | |||
| Pyrite | 7.9 | ||||
| 87C743 | Pyrite | 6.8 | |||
| 87C743 | Pyrite | −0.2 |
| Sample No. | Sample Description | Analytical Object | 208Pb/204Pb | Error | 207Pb/204Pb | Error | 206Pb/204Pb | Error | Reference |
|---|---|---|---|---|---|---|---|---|---|
| 7CY-3-1 | Ore | Galena | 38.393 | 0.005 | 15.585 | 0.002 | 18.649 | 0.002 | This paper |
| 7CY-3-1 | Arsenopyrite | 38.313 | 0.004 | 15.558 | 0.002 | 18.628 | 0.002 | ||
| 7CY-3-1 | Pyrite | 38.328 | 0.005 | 15.567 | 0.002 | 18.632 | 0.003 | ||
| 7CY-3-2 | Arsenopyrite | 38.424 | 0.007 | 15.603 | 0.001 | 18.659 | 0.001 | ||
| 7CY-3-2 | Pyrite | 38.335 | 0.004 | 15.567 | 0.001 | 18.634 | 0.002 | ||
| 7CY-3-2 | Galena | 38.335 | 0.004 | 15.57 | 0.002 | 18.629 | 0.002 | ||
| 7CY-3-3 | Pyrite | 38.462 | 0.004 | 15.606 | 0.001 | 18.659 | 0.002 | ||
| 7CY-3-4 | Pyrite | 38.276 | 0.003 | 15.56 | 0.001 | 18.565 | 0.002 | ||
| 7CY-1-1 | SG | Whole rock | 38.643 | 0.004 | 15.594 | 0.002 | 18.974 | 0.002 | |
| 7CY-1-2 | Whole rock | 38.823 | 0.011 | 15.641 | 0.004 | 19.059 | 0.005 | ||
| 7CY-1-3 | Whole rock | 38.711 | 0.005 | 15.594 | 0.002 | 19.012 | 0.003 | ||
| 7CY-1-4 | Whole rock | 38.65 | 0.004 | 15.599 | 0.002 | 18.975 | 0.002 | ||
| 7CY-2-1 | Whole rock | 38.746 | 0.003 | 15.605 | 0.001 | 18.903 | 0.002 | ||
| 7CY-2-2 | Whole rock | 39.196 | 0.01 | 15.708 | 0.003 | 19.179 | 0.003 | ||
| 7CY-2-3 | Whole rock | 38.719 | 0.005 | 15.603 | 0.002 | 18.971 | 0.002 | ||
| 7CY-2-4 | Whole rock | 38.561 | 0.005 | 15.594 | 0.002 | 18.883 | 0.003 | ||
| 8CY-1-1 | DP | Whole rock | 38.332 | 0.004 | 15.574 | 0.002 | 18.621 | 0.0002 | |
| 8CY-1-2 | Whole rock | 38.329 | 0.004 | 15.569 | 0.001 | 18.594 | 0.0002 | ||
| 8CY-1-3 | Whole rock | 38.255 | 0.004 | 15.56 | 0.002 | 18.547 | 0.0003 | ||
| 8CY-1-4 | Whole rock | 38.361 | 0.004 | 15.582 | 0.002 | 18.638 | 0.0002 |
Disclaimer/Publisher’s Note: The statements, opinions and data contained in all publications are solely those of the individual author(s) and contributor(s) and not of MDPI and/or the editor(s). MDPI and/or the editor(s) disclaim responsibility for any injury to people or property resulting from any ideas, methods, instructions or products referred to in the content. |
© 2025 by the authors. Licensee MDPI, Basel, Switzerland. This article is an open access article distributed under the terms and conditions of the Creative Commons Attribution (CC BY) license (https://creativecommons.org/licenses/by/4.0/).
Share and Cite
Li, H.; Yang, Q.; Zhang, L.; Ren, Y.; Li, M.; Li, C.; Wang, B.; Chen, S.; Peng, X. Ore-Forming Fluid Evolution and Ore Genesis of the Cuyu Gold Deposit in Central Jilin Province, NE China: Constraints from Geology, Fluid Inclusions, and H–O–S–Pb Isotope Studies. Minerals 2025, 15, 535. https://doi.org/10.3390/min15050535
Li H, Yang Q, Zhang L, Ren Y, Li M, Li C, Wang B, Chen S, Peng X. Ore-Forming Fluid Evolution and Ore Genesis of the Cuyu Gold Deposit in Central Jilin Province, NE China: Constraints from Geology, Fluid Inclusions, and H–O–S–Pb Isotope Studies. Minerals. 2025; 15(5):535. https://doi.org/10.3390/min15050535
Chicago/Turabian StyleLi, Haozhe, Qun Yang, Leigang Zhang, Yunsheng Ren, Mingtao Li, Chan Li, Bin Wang, Sitong Chen, and Xiaolei Peng. 2025. "Ore-Forming Fluid Evolution and Ore Genesis of the Cuyu Gold Deposit in Central Jilin Province, NE China: Constraints from Geology, Fluid Inclusions, and H–O–S–Pb Isotope Studies" Minerals 15, no. 5: 535. https://doi.org/10.3390/min15050535
APA StyleLi, H., Yang, Q., Zhang, L., Ren, Y., Li, M., Li, C., Wang, B., Chen, S., & Peng, X. (2025). Ore-Forming Fluid Evolution and Ore Genesis of the Cuyu Gold Deposit in Central Jilin Province, NE China: Constraints from Geology, Fluid Inclusions, and H–O–S–Pb Isotope Studies. Minerals, 15(5), 535. https://doi.org/10.3390/min15050535