


The Mineralization Mechanism of the Axi Gold Deposit in West Tianshan, NW China: Insights from Fluid Inclusion and Multi-Isotope Analyses

Abstract
1. Introduction
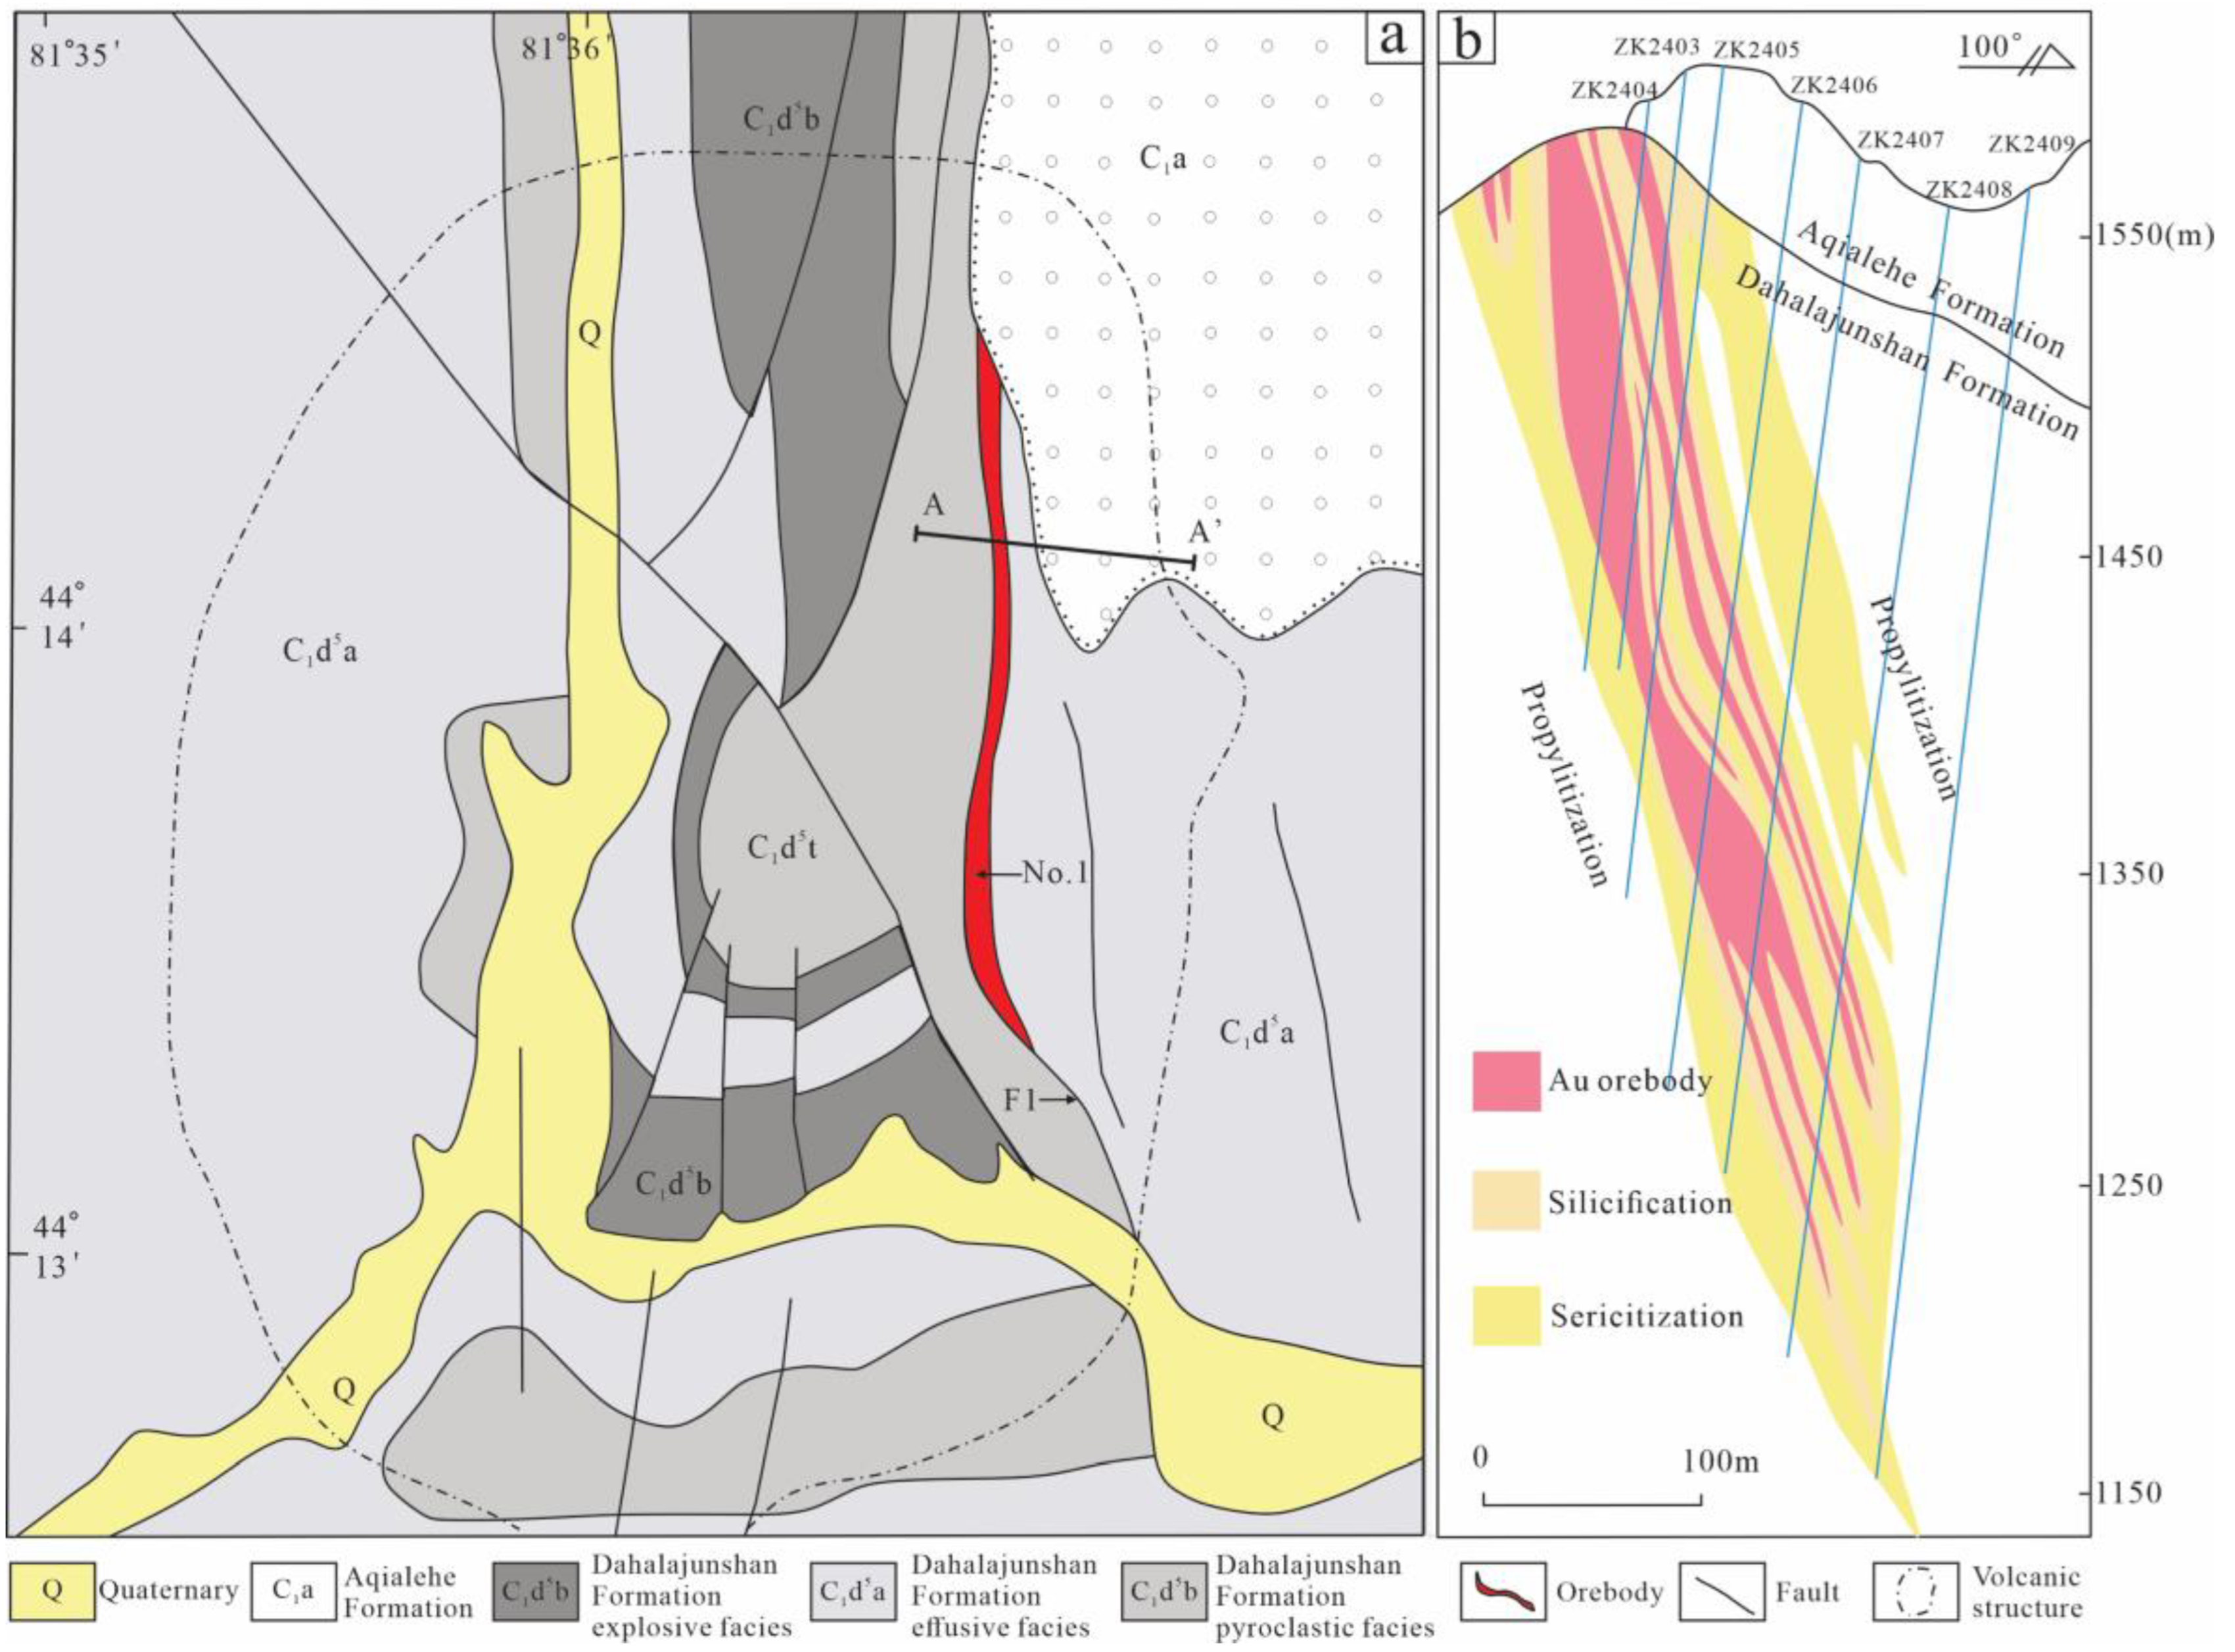
2. Regional Geology
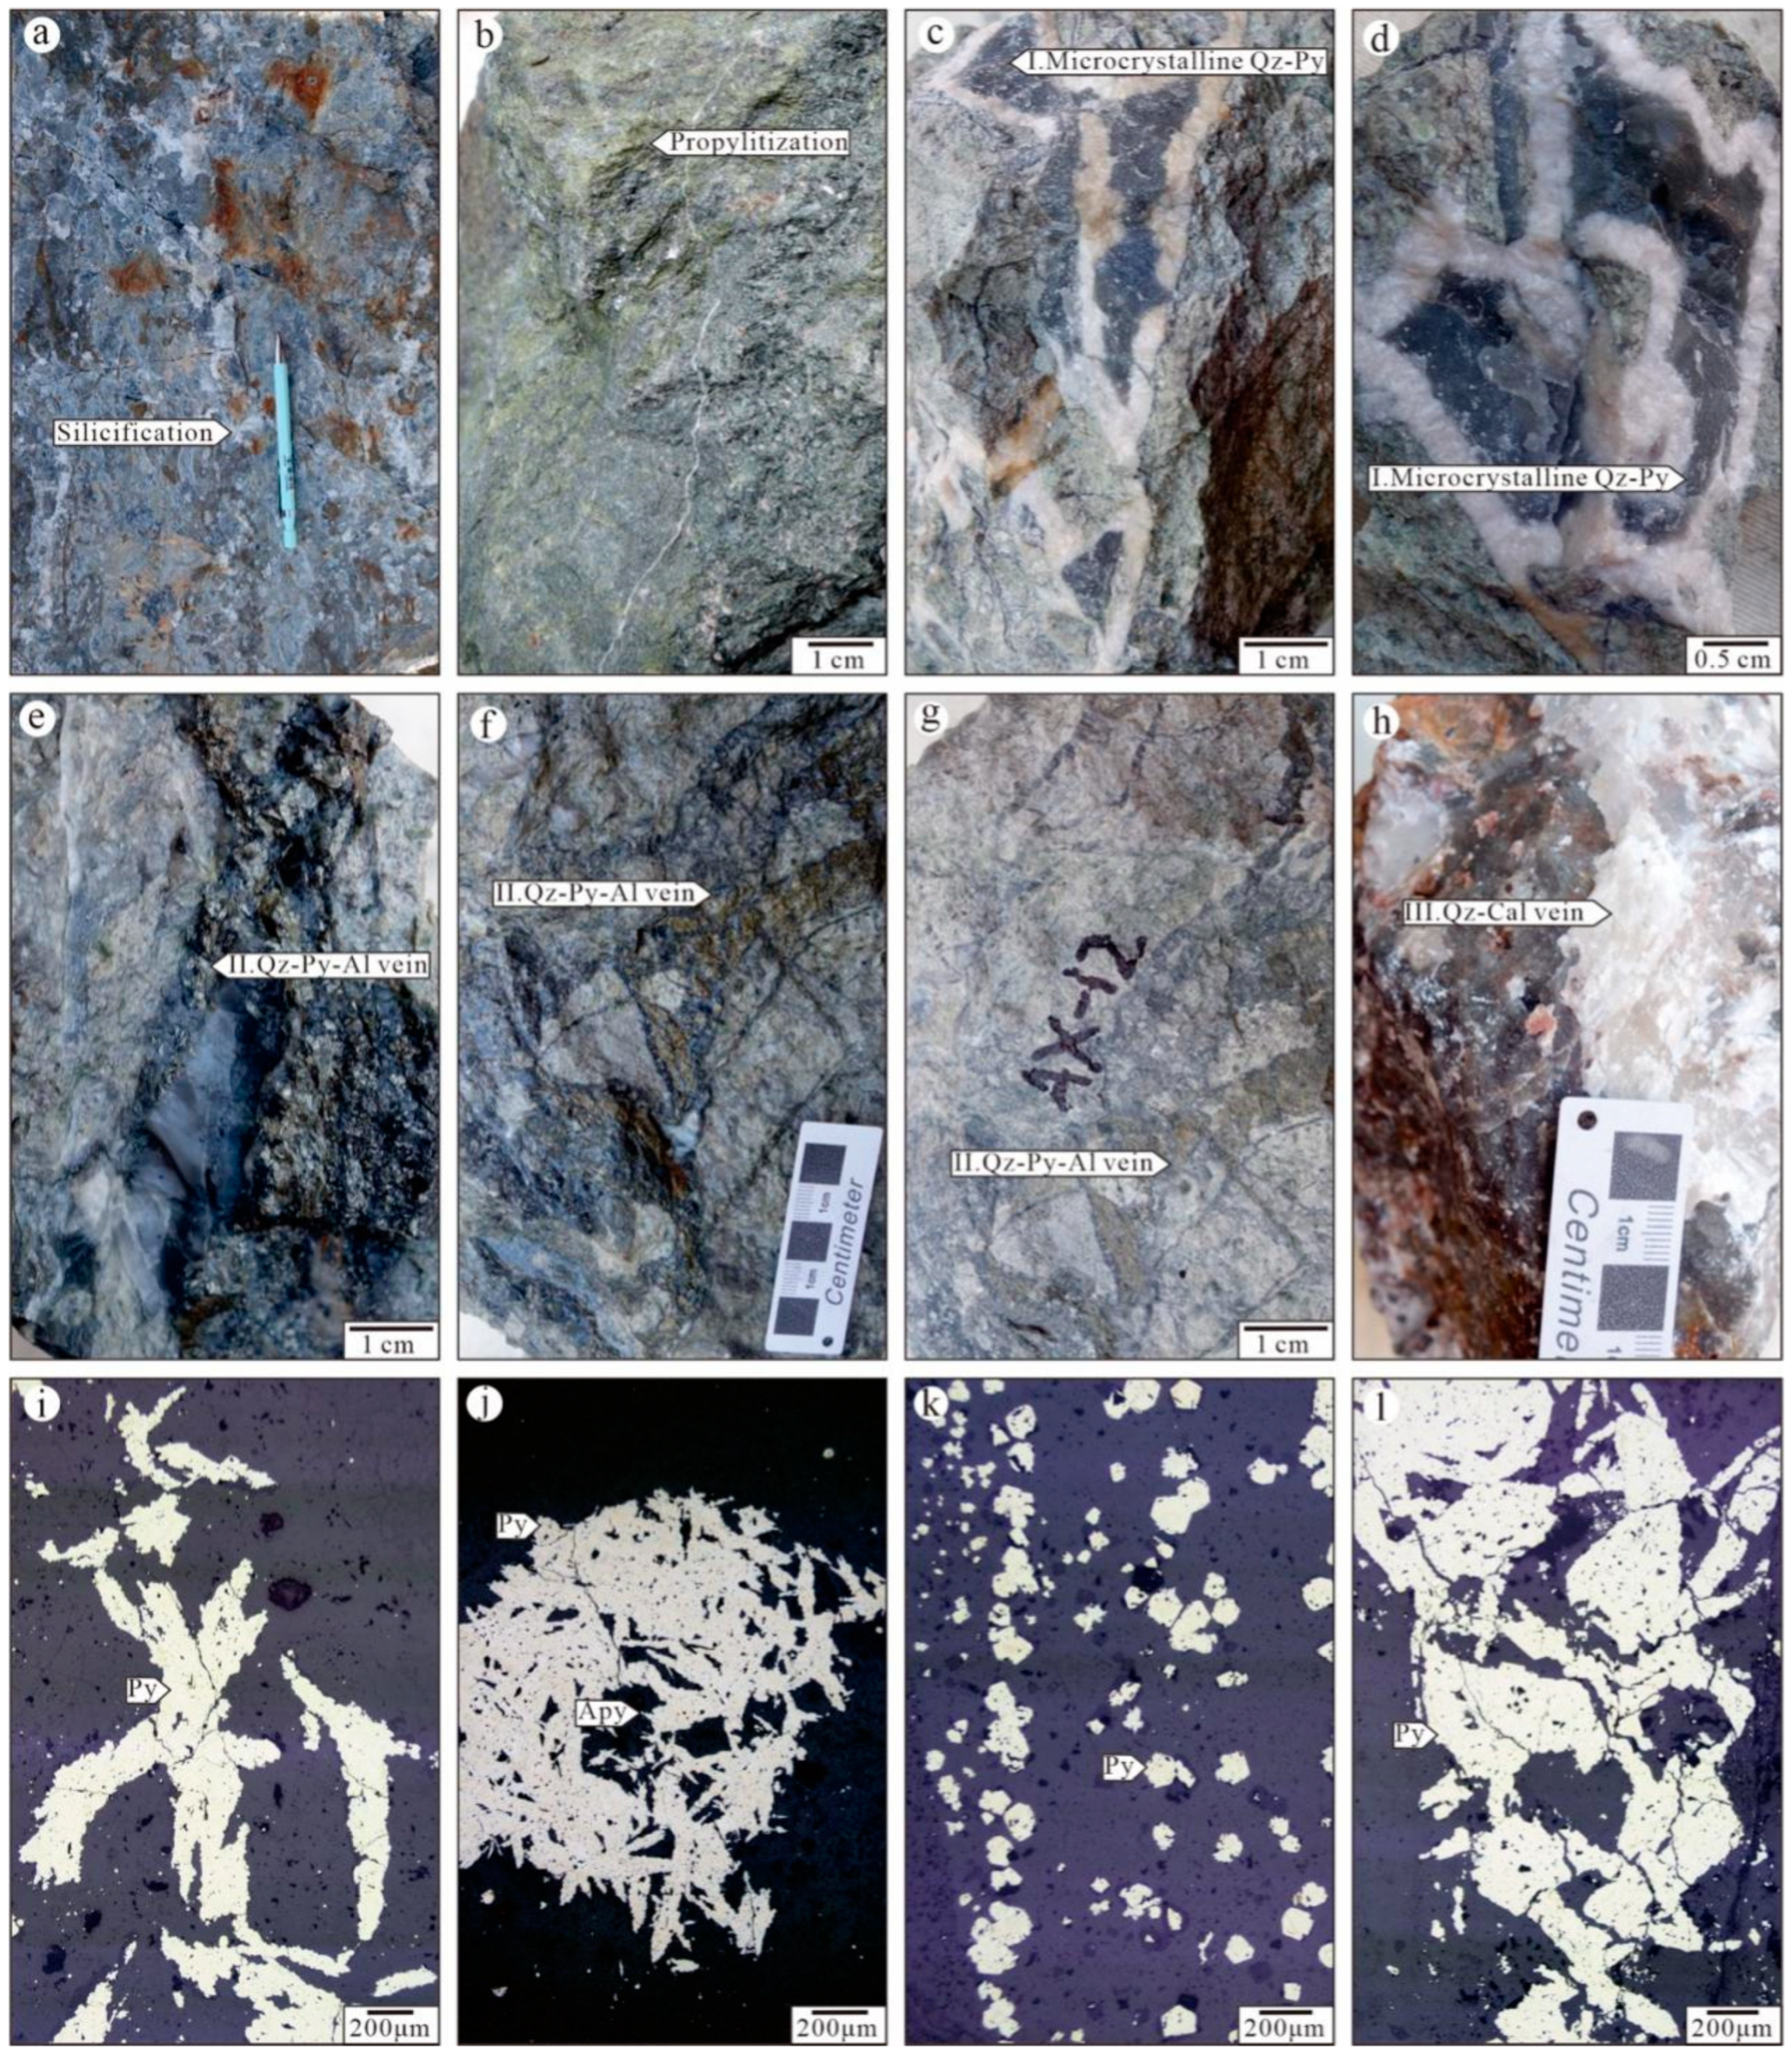
3. Ore Deposit Geology
4. Analytical Methods
4.1. Fluid Inclusion (FI)
4.2. H-O-C Isotopes
4.3. S-Pb Isotopes
5. Results
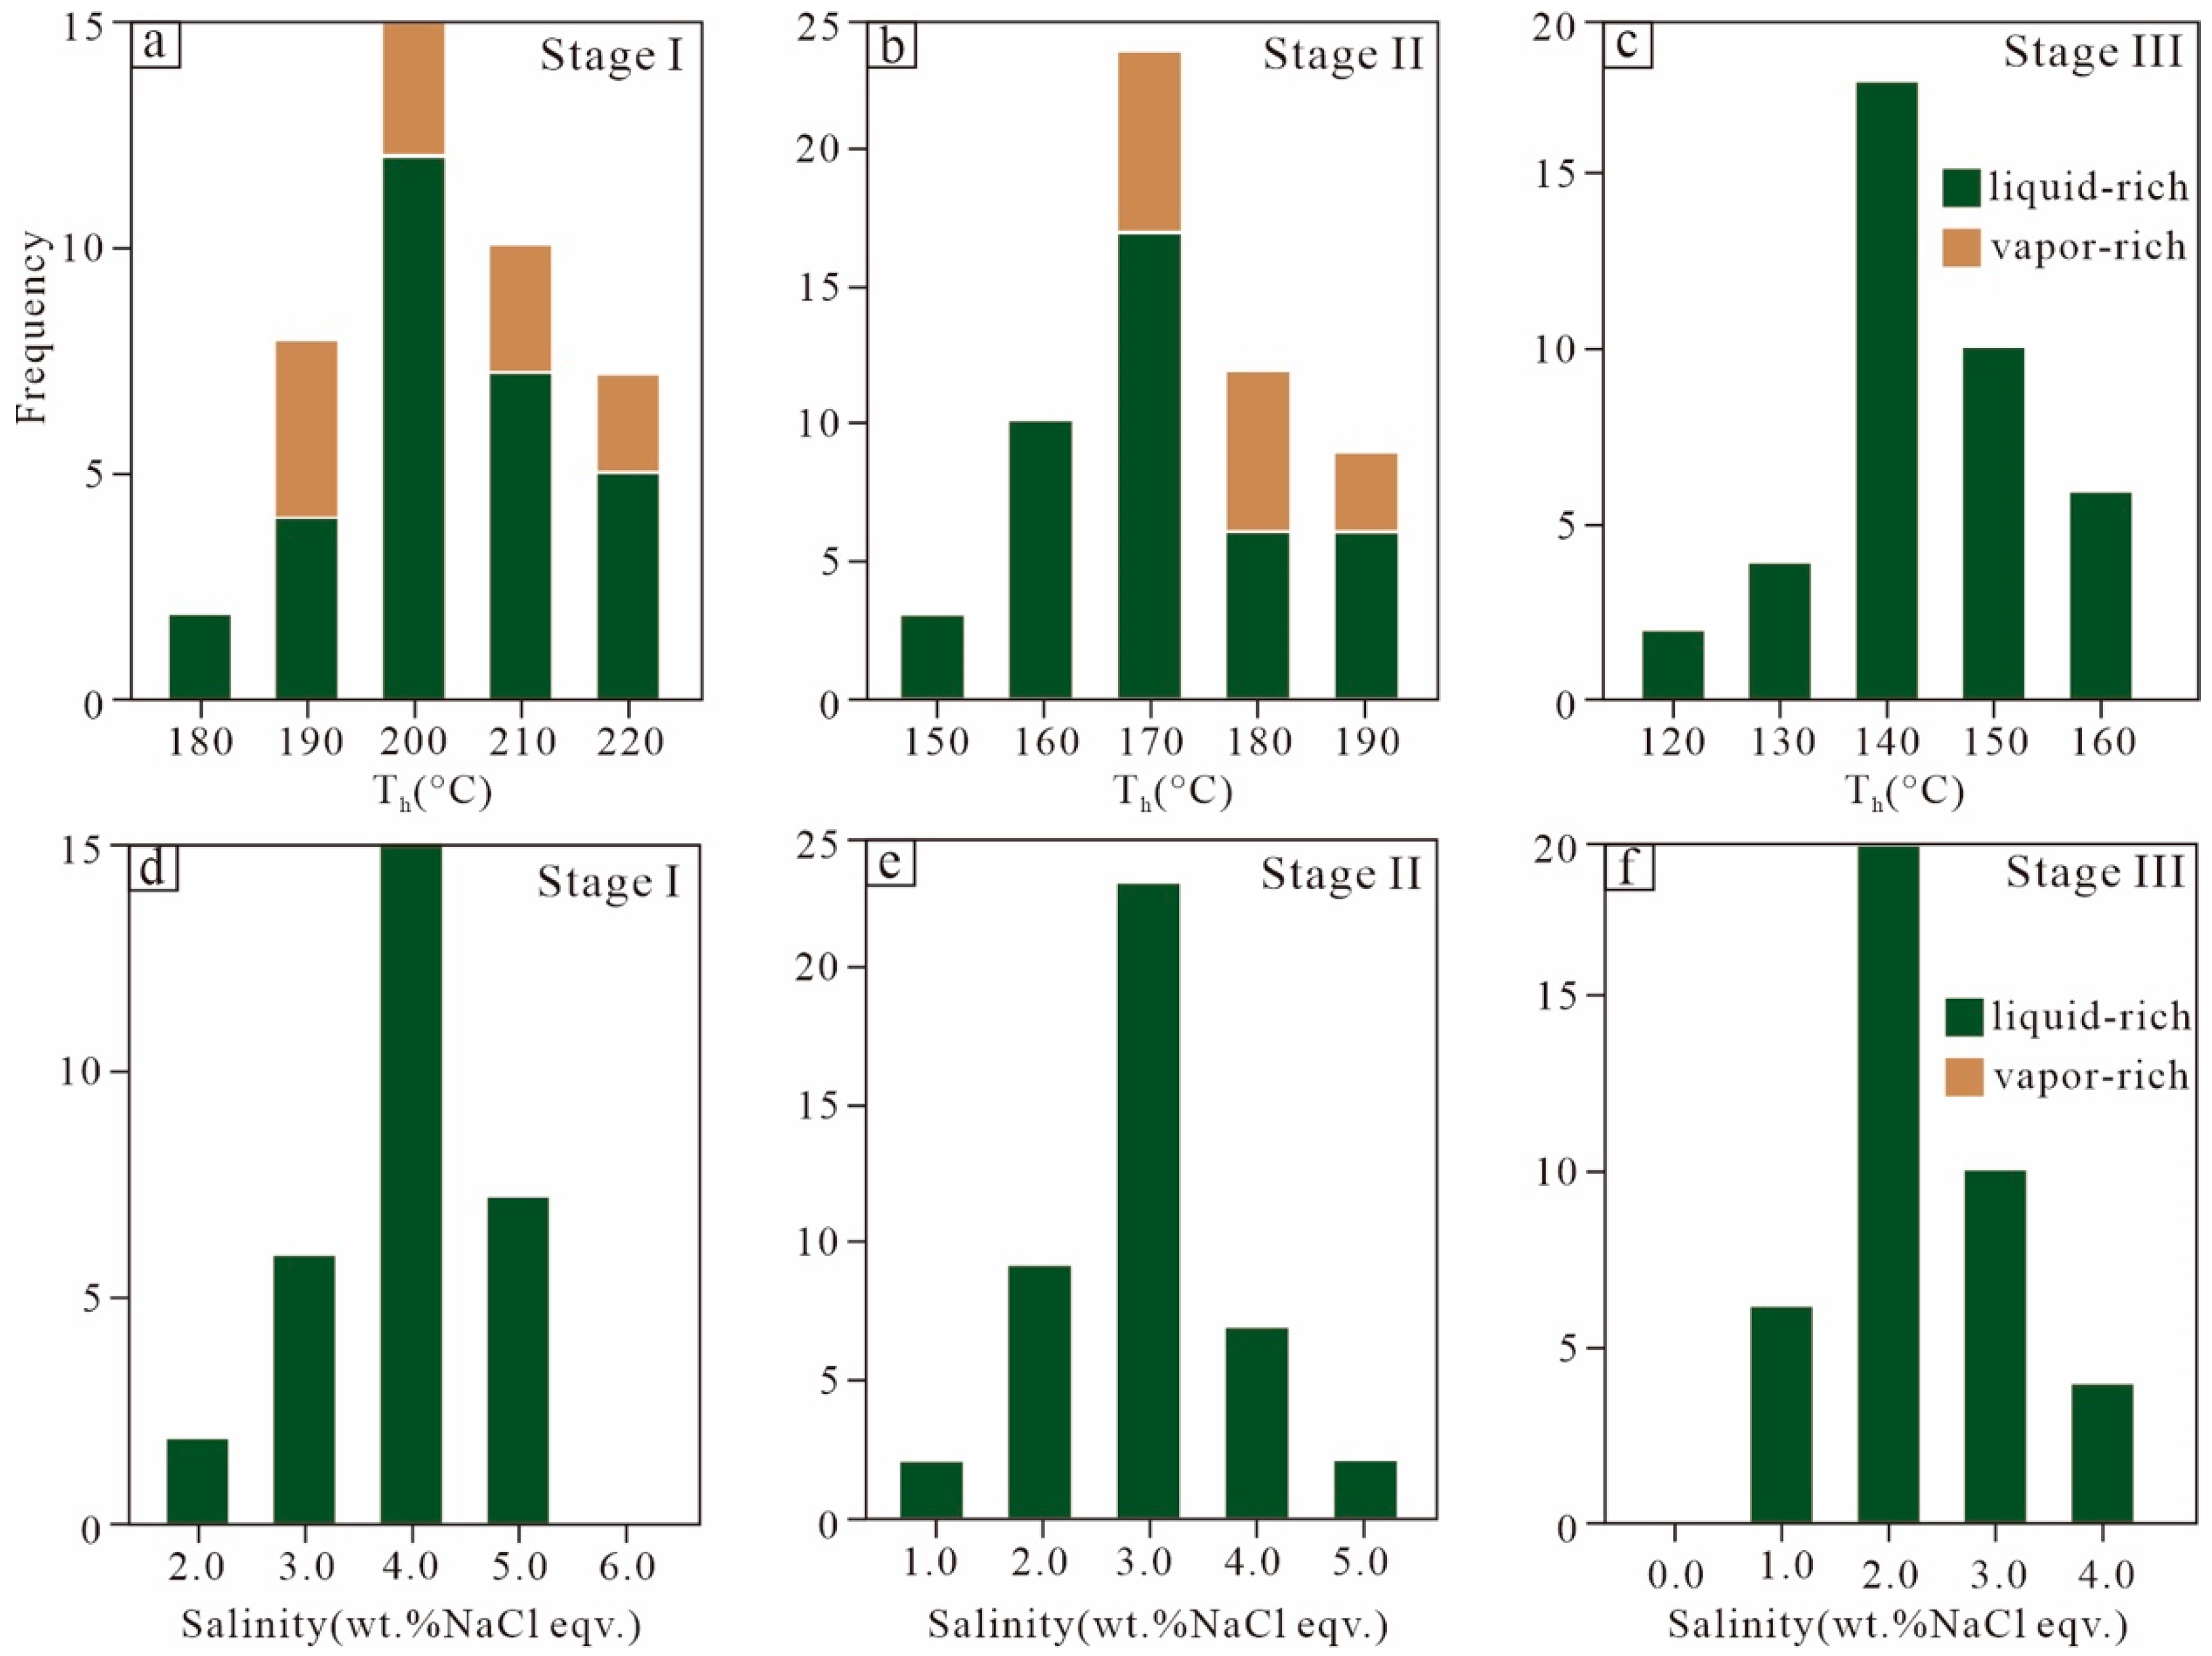
5.1. Fluid Inclusion and Microthermometry
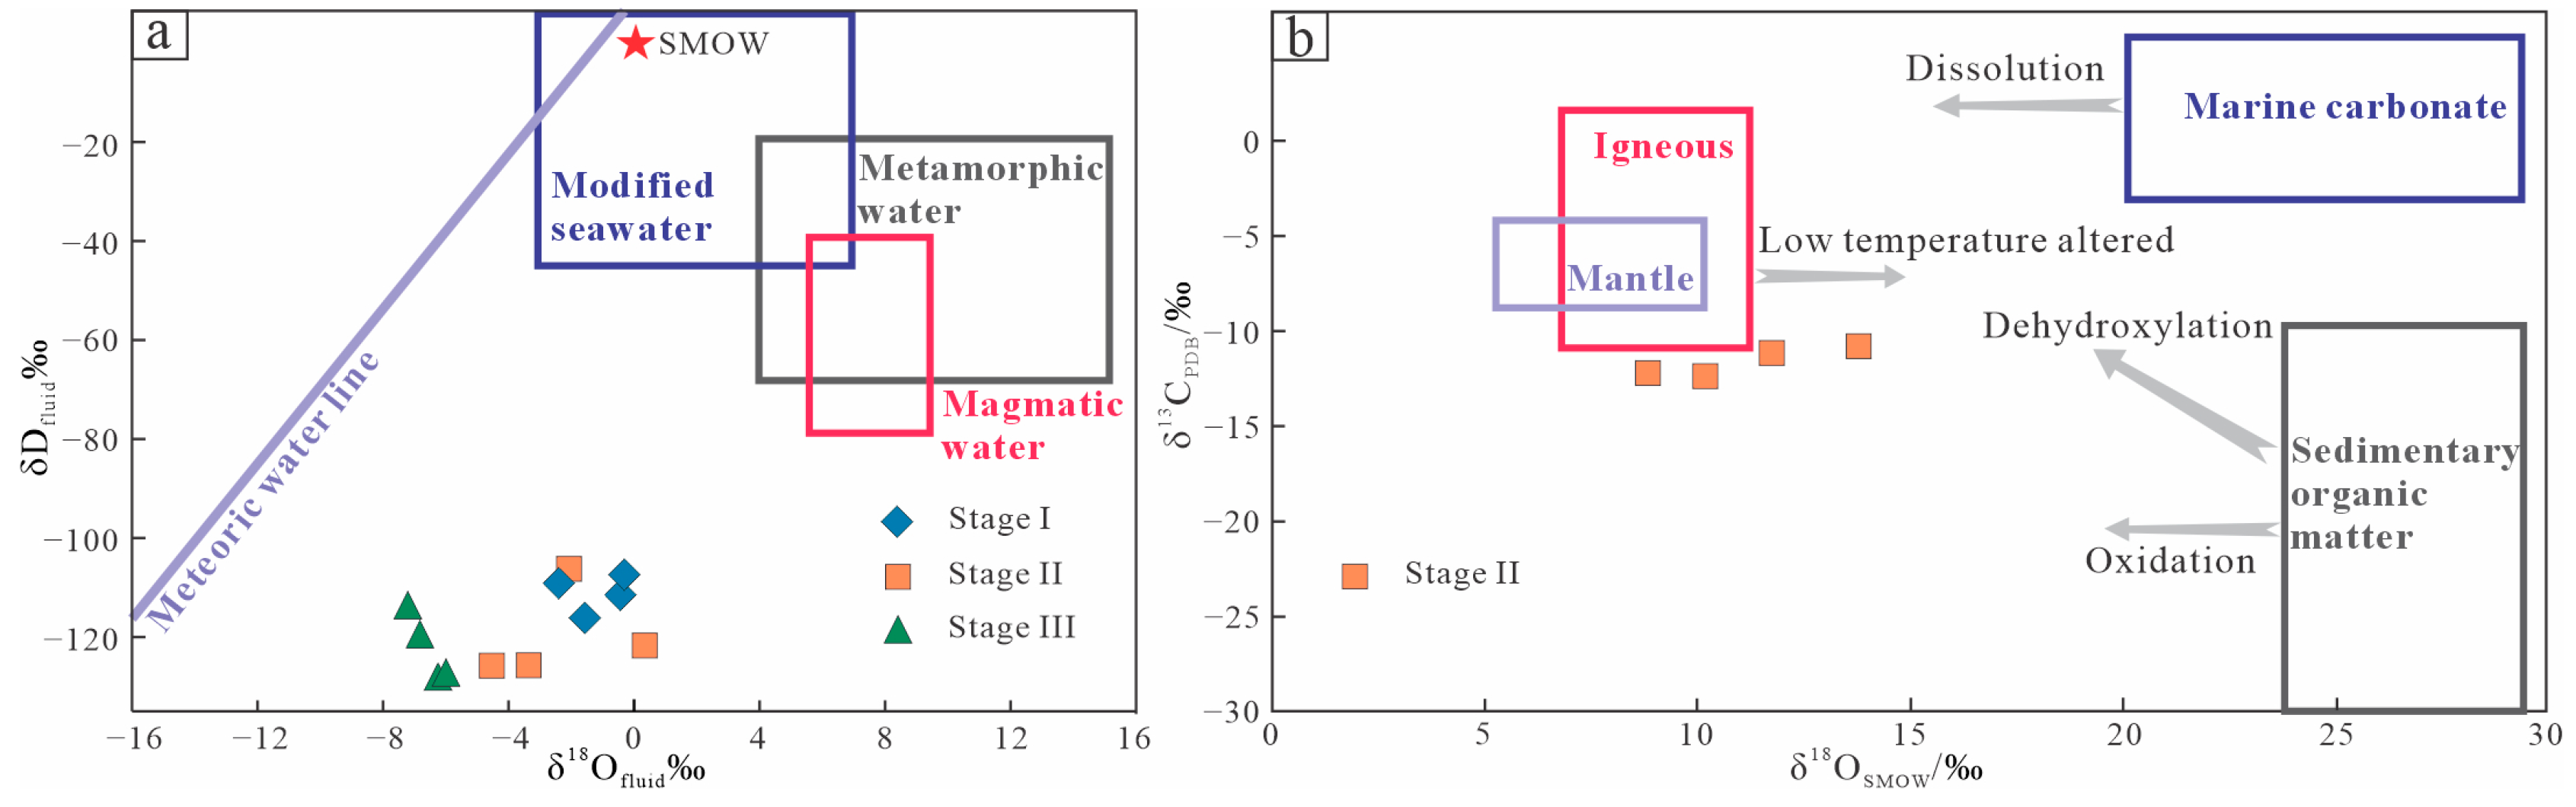
5.2. H-O-C-S-Pb Isotopic Composition
6. Discussion
6.1. Origin and Evolution of Ore-Forming Fluids
6.2. Sources of Ore-Forming Materials
6.3. Metallogenic Mechanism of the Axi Deposit
7. Conclusions
- (1)
- On the basis of FI studies and H-O isotope data, the ore-forming fluids are primarily derived from heated meteoric water, accompanied by fluid boiling.
- (2)
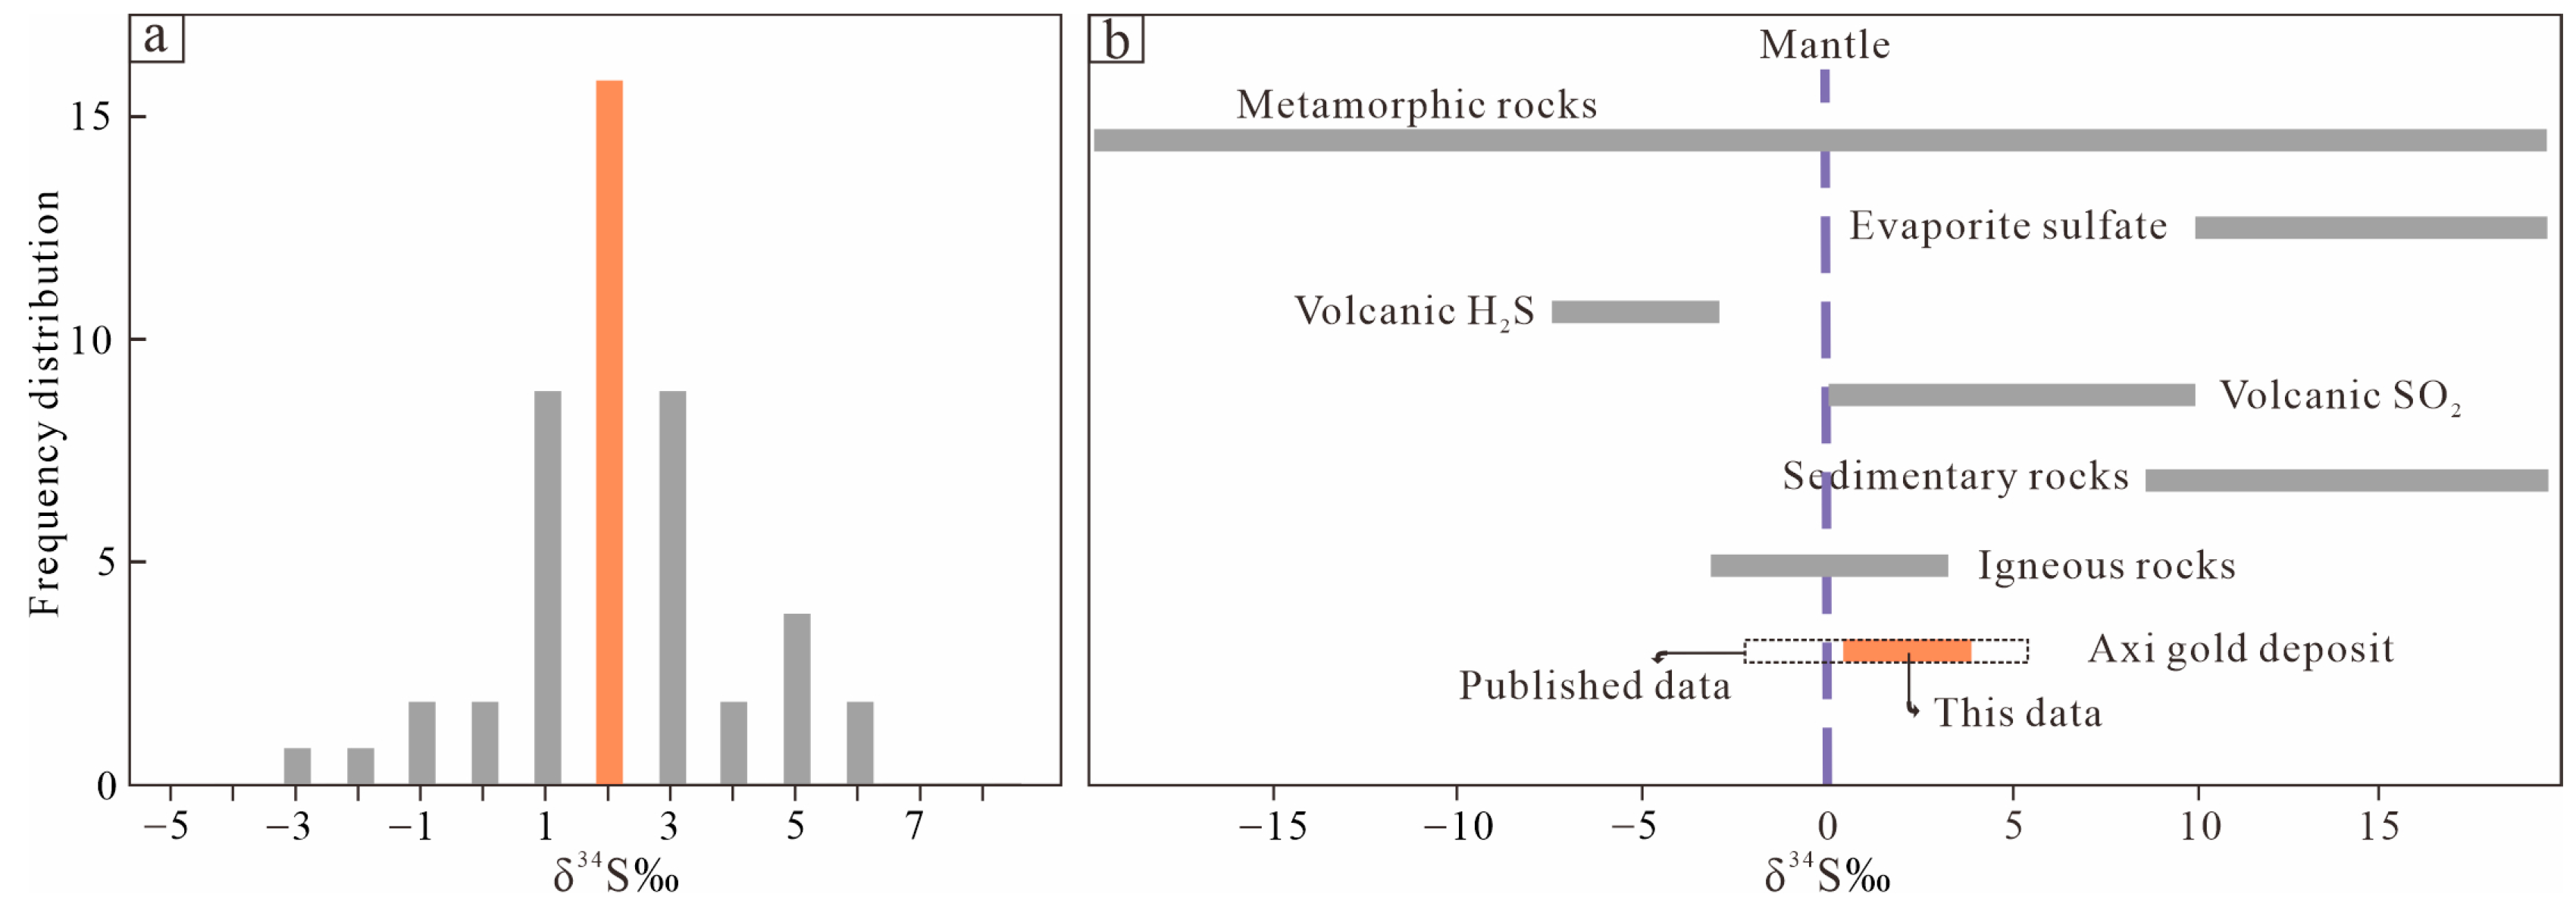
- Sulfur and lead isotope compositions indicate that the ore-forming materials have most likely originated from Dahalajunshan Formation volcanic rocks.
- (3)
- The Axi deposit is a representative epithermal gold deposit, in which water–rock interactions and fluid boiling are the primary mechanisms for metal precipitation.
Author Contributions
Funding
Data Availability Statement
Conflicts of Interest
References
- Mao, X.C.; Zhang, W.; Liu, Z.K.; Bayless, R.C.; Deng, H. 3D Mineral Prospectivity Modeling for Low-Sulfidation Epithermal Gold Deposits: A Case Study of the Axi Gold Deposit, Western Tianshan, NW China. Minerals 2020, 10, 233. [Google Scholar] [CrossRef]
- Zhao, X.B.; Xue, C.J.; Zhao, W.C.; Seltmann, R.; Symons, D.T.; Dolgopolova, A.; Zhang, Y. Cooling and exhumation of the Late Paleozoic Tulasu epithermal gold system, Western Tianshan, NW China: Implications for preservation of Pre-Mesozoic epithermal deposits. J. Geol. Soc. 2021, 178, jgs2020–jgs2099. [Google Scholar] [CrossRef]
- An, F.; Zhu, Y.F. Geology and geochemistry of the Early Permian Axi low-sulfidation epithermal gold deposit in North Tianshan (NW China). Ore Geol. Rev. 2018, 100, 12–30. [Google Scholar] [CrossRef]
- Liu, Z.K.; Mao, X.C.; Deng, B.; Li, B.; Zhang, S.; Lai, J.; Bayless, R.C.; Pan, M.; Li, L.; Shang, Q. Hydrothermal processes at the Axi epithermal Au deposit, western Tianshan: Insights from geochemical effects of alteration, mineralization and trace elements in pyrite. Ore Geol. Rev. 2018, 102, 368–385. [Google Scholar] [CrossRef]
- Wang, H.R.; Cai, K.D.; Sun, M.; Wang, Y.; Lai, C.-K.; Wan, B.; Zhang, Z. Magma evolution and Cu-Au mineralization potential of the Upper Devonian-Lower Carboniferous Tulasu basin, Western Tianshan Orogen (NW China): Apatite U-Pb dating and geochemical perspectives. Ore Geol. Rev. 2021, 139, 104526. [Google Scholar] [CrossRef]
- Zheng, J.H.; Shen, P.; Li, C.H. Ore genesis of Axi post-collisional epithermal gold deposit, western Tianshan, NW China: Constraints from U–Pb dating, Hf isotopes, and pyrite in situ sulfur isotopes. Ore Geol. Rev. 2020, 117, 103290. [Google Scholar] [CrossRef]
- Xue, C.J.; Duan, S.G.; Chai, F.M.; Maimaiti, M.; Tuleshiabekov, A.X.; Qu, W. Metallogenic epoch of the Almalyk porphyry copper ore field, Uzbekistan, and its geological significance. Earth Sci. Front. 2013, 20, 197–204, (In Chinese with English Abstract). [Google Scholar]
- Tang, G.J.; Wang, Q.; Wyman, D.A.; Sun, M.; Li, Z.-X.; Zhao, Z.-H.; Sun, W.-D.; Jia, X.-H.; Jiang, Z.-Q. Geochronology and geochemistry of Late Paleozoic magmatic rocks in the Lamasu-Dabate area, northwestern Tianshan (west China): Evidence for a tectonic transition from arc to post-collisional setting. Lithos 2010, 119, 393–411. [Google Scholar] [CrossRef]
- Zhai, W.; Sun, X.M.; Gao, J.; He, X.P.; Liang, J.L.; Miao, L.C.; Wu, Y.L. SHRIM dating of zircons from volcanic host rocks of Dahalajunshan Formation in Axi gold deposit, Xinjiang, China, and its geological implications. Acta Petrol. 2006, 22, 1399–1404, (In Chinese with English Abstract). [Google Scholar]
- Dong, L.L.; Wang, B.; Deng, C. An Early Permian epithermal gold system in the Tulasu Basin in North Xinjiang, NW China: Constraints from in situ oxygen-sulfur isotopes and geochronology. J. Asian Earth Sci. 2018, 153, 412–424. [Google Scholar] [CrossRef]
- Peng, Y.W.; Gu, X.X.; Zhang, Y.M. Genetic Link Between the Axi and the Tawuerbieke Gold Deposits, Xinjiang Province: Constraints from Fluid Inclusions, S-Pb Isotopes, and Thermoelectric Characteristics of Pyrite. Acta Geol. Sin. 2020, 94, 2919–2945, (In Chinese with English Abstract). [Google Scholar]
- Feng, J.P.; Wang, J.L.; Ouyang, Z.J. A Discussion on Gold Mineralization Styles of Axi, Jingxi-Yelmend Deposits in Western Tianshan, Xinjiang: Evidence from Fluid Inclusions. J. Northwest Univ. (Nat. Sci. Ed.) 2007, 37, 99–102, (In Chinese with English Abstract). [Google Scholar]
- Zhang, Z.H.; Mao, J.W.; Wang, Z.L. Geochemistry of ore forming fluid and metallogenic mechanism of Axi low-sulfidation gold deposit in Xinjiang, China. Acta Petrol. Sin. 2007, 23, 2403–2414, (In Chinese with English Abstract). [Google Scholar]
- Bodnar, R.J. Revised equation and table for determining the freezing point depression of H2O–NaCl solutions. Geochim. Cosmochim. Acta 1993, 57, 683–684. [Google Scholar] [CrossRef]
- Gong, B.; Zheng, Y.F.; Chen, R.X. An online method combining a thermal conversion elemental analyzer with isotope ratio mass spectrometry for the determination of hydrogen isotope composition and water concentration in geological samples. Rapid Commun. Mass Spectrom. 2007, 21, 1386–1392. [Google Scholar] [CrossRef]
- Clayton, R.N.; Mayeda, T.K. The use of bromine pentafluoride in the extraction of oxygen from oxides and silicates for isotopic analysis. Geochim. Cosmochim. Acta 1963, 27, 43–52. [Google Scholar] [CrossRef]
- Zhou, J.; Huang, Z.; Zhou, M.; Li, X.; Jin, Z. Constraints of C-O-S-Pb isotope compositions and Rb-Sr isotopic age on the origin of the Tianqiao carbonate-hosted Pb-Zn deposit, SW China. Ore Geol. Rev. 2013, 53, 77–92. [Google Scholar] [CrossRef]
- Robinson, B.W.; Kusakabe, M. Quantitative preparation of sulfur dioxide, for 34S/32S analyses, from sulfides by combustion with cuprous oxide. Anal. Chem. 1975, 47, 1179–1181. [Google Scholar] [CrossRef]
- White, W.M.; Albarède, F.; Télouk, P. High-precision analysis of Pb isotope ratios by multi-collector ICP-MS. Chem. Geol. 2000, 167, 257–270. [Google Scholar] [CrossRef]
- Goldstein, R.H.; Reynolds, T.J. Systematics of Fluid Inclusions in Diagenetic Minerals; SEPM Short Course; Society of Sedimentary Geology: Claremore, OK, USA, 1994; Volume 31, pp. 1–199. [Google Scholar]
- Goldstein, R.H. Petrographic analysis of fluid inclusions. In Fluid Inclusions: Analysis and Interpretation; Canada, Short Course; Samson, I., Anderson, A., Marshall, D., Eds.; Mineral Association: London, UK, 2003; Volume 32, pp. 9–53. [Google Scholar]
- Roedder, E. Fluid inclusions. Rev. Mineral. 1984, 12, 644. [Google Scholar]
- Chi, G.X.; Diamond, L.W.; Lu, H.Z.; Lai, J.; Chu, H. Common problems and pitfalls in fluid inclusion study: A review and discussion. Minerals 2021, 11, 7. [Google Scholar] [CrossRef]
- Clayton, R.N.; O’Neil, J.R.; Mayeda, T.K. Oxygen isotope exchange between quartz and water. J. Geophys. Res. 1972, 77, 3057–3067. [Google Scholar] [CrossRef]
- Li, S.D.; Wang, Y.C.; Gao, L.L.; Xia, F.; Chen, C.; Ruan, D. Magma-related origin for Pb–Zn–Ag vein formation at the Aerhada deposit, Inner Mongolia, NE China: Constraints from fluid inclusion, C–H–O–S–Pb isotopic compositions, and geochronological studies. Ore Geol. Rev. 2023, 163, 105793. [Google Scholar] [CrossRef]
- Li, S.D.; Gao, L.L.; Xia, F.; Chen, C.; Du, X.; Arkin, A. Genetic relationship between skarn and porphyry mineralization at the Saibo copper deposit, West Tianshan, NW China: Constraints from fluid inclusions, H–O–C–S–Pb isotopes, and geochronology. Ore Geol. Rev. 2023, 163, 105709. [Google Scholar] [CrossRef]
- Li, L.; Li, S.R.; Santosh, M.; Zhu, J.; Suo, X.-J. Early Jurassic decratonic gold metallogenesis in the eastern North China Craton: Constraints from S-Pb-C-D-O isotopic systematics and pyrite Rb-Sr geochronology of the Guilaizhuang Te-Au deposit. Ore Geol. Rev. 2018, 92, 558–568. [Google Scholar] [CrossRef]
- Taksavasu, T.; Monecke, T.; Reynolds, T.J. Textural Characteristics of Noncrystalline Silica in Sinters and Quartz Veins: Implications for the Formation of Bonanza Veins in Low-Sulfidation Epithermal Deposits. Minerals 2018, 8, 331. [Google Scholar] [CrossRef]
- Syafrizal Imai, A.; Watanabe, K. Origin of ore-forming fluids responsible for gold mineralization of the Pongkor Au-Ag deposit, west Java, Indonesia: Evidence from mineralogic, fluid inclusion microthermometry and stable isotope study of the Ciurug-Cikoret veins. Resour. Geol. 2007, 57, 146–148. [Google Scholar] [CrossRef]
- Taylor, H. The application of oxygen and hydrogen isotope studies to problems of hydrothermal alteration and ore deposition. Econ. Geol. 1974, 69, 843–883. [Google Scholar] [CrossRef]
- Liu, J.J.; He, M.Q.; Li, Z.M.; Liu, Y.P.; Li, C.Y.; Zhang, Q.; Yang, W.G.; Yang, A.P. Oxygen and carbon isotopic geochemistry to Baiyangping silver copper polymetallic ore concentration area in Lanping basin of Yunnan Province and its significance. Miner. Depos. 2004, 23, 1–10, (In Chinese with English Abstract). [Google Scholar]
- Li, S.D.; Xiao, W.J.; Chen, C.; Sang, M.; Mao, Q.; Gao, L.; Xia, F.; Li, X.; Du, X. Two-episode mineralization in the Haerdaban Pb–Zn deposit, NW China: Insights from sulfide trace elements, in situ S–Pb isotopes, and Rb–Sr geochronology. Precambrian Res. 2024, 412, 107550. [Google Scholar] [CrossRef]
- Li, S.D.; Chen, C.; Gao, L.L.; Xia, F.; Zhang, X.-B.; Wang, K.-Y. Fluid Inclusions and H–O–C–S–Pb Isotopic Systematics of the Jinba Gold Deposit, NW China: Implications for Ore Genesis. Front. Earth Sci. 2021, 9, 638375. [Google Scholar] [CrossRef]
- Li, S.D.; Chen, C.; Gao, L.L.; Xia, F.; Zhang, X.B.; Wang, K.Y.; Omar, G. Fluid evolution in the Beidabate porphyry Cu-Mo deposit, Xinjiang, Northwest China: Evidence from fluid inclusions and H-O-C-S isotopes. Ore Geol. Rev. 2021, 135, 104198. [Google Scholar] [CrossRef]
- Ohmoto, H. Systematics of sulfur and carbon isotopes in hydrothermal ore deposits. Econ. Geol. 1972, 67, 551–578. [Google Scholar] [CrossRef]
- Rye, R.O.; Ohmoto, H. Sulfur and carbon isotopes and ore genesis: A review. Econ. Geol. 1974, 69, 826–842. [Google Scholar] [CrossRef]
- Bastrakov, E.N.; Skirrow, R.G.; Davidson, G.J. Fluid evolution and origins of iron oxide Cu–Au prospects in the Olympic Dam district, Gawler craton, South Australia. Econ. Geol. 2007, 102, 1415–1440. [Google Scholar] [CrossRef]
- Zartman, R.E.; Doe, B.R. Plumbotectonics-The Model. Tectonophysics 1981, 75, 135–162. [Google Scholar] [CrossRef]
- Fan, X.L.; Huang, W.; Yuan, E.Q. Process of gold enrichment in Axi region of western Tianshan. Xinjiang Geol. 2002, 20, 224–228, (In Chinese with English Abstract). [Google Scholar]
- Chen, C.; Li, S.D.; Xia, F.; Gao, L.; Zhang, X. Insights into the Ore Genesis of the Harla Gold Deposit in Eastern Tianshan, NW China: Evidence from Geology, Fluid Inclusions, and H-O-C-S-Pb Isotopes. Minerals 2022, 12, 793. [Google Scholar] [CrossRef]
- Li, S.D.; Zhang, X.B.; Gao, L.L. Ore Genesis at the Jinchang Gold–Copper Deposit in Heilongjiang Province, Northeastern China: Evidence from Geology, Fluid Inclusions, and H–O–S Isotopes. Minerals 2019, 9, 99. [Google Scholar] [CrossRef]
- Yang, H.; Li, S.D.; Ye, B.Y.; Wang, K. The origin and role of CH4–N2 in the formation of Yantongqiaozi gold deposit, Jilin Province, NE China. Ore Geol. Rev. 2024, 176, 106434. [Google Scholar] [CrossRef]


| Stage | FI Type | Tmelt-ice (°C) | Salinity (NaCl wt.%) | Th (°C) | Peak Th (°C) |
|---|---|---|---|---|---|
| I | Liquid-rich | –3.1 to –1.2 | 2.1–5.1 | 178–218 | 200 |
| Vapor-rich | 192–225 | ||||
| II | Liquid-rich | –2.8 to –0.8 | 1.4–4.6 | 151–193 | 170 |
| Vapor-rich | 172–190 | ||||
| III | Liquid-rich | –2.2 to–0.3 | 0.5–3.7 | 123–161 | 140 |
| Stage | δ18Oquartz (‰) | δDfluid (‰) | Th (°C) | δ18Ofluid (‰) | δCfluid (‰) |
|---|---|---|---|---|---|
| I | 9.26 | −107.9 | 200 | −0.4 | — |
| 10.06 | −110.2 | −2.4 | |||
| 11.20 | −117.2 | −1.6 | |||
| 14.10 | −112.4 | −0.5 | |||
| II | 10.45 | −123.0 | 170 | 0.3 | −11.48 |
| 9.19 | −127.3 | −3.4 | −12.28 | ||
| 11.64 | −127.2 | −4.6 | −12.22 | ||
| 9.15 | −107.2 | −2.2 | −11.76 | ||
| III | 9.56 | −114.8 | 140 | −7.3 | — |
| 10.14 | −120.8 | −6.9 | |||
| 10.36 | −129.6 | −6.3 | |||
| 9.26 | −129.0 | −6.1 |
| Mineral | δ34Spyrite (‰) | 206Pb/204Pb | 207Pb/204Pb | 208Pb/204Pb |
|---|---|---|---|---|
| Pyrite | 2.43 | 18.404 | 15.632 | 38.409 |
| Pyrite | 2.49 | 18.558 | 15.640 | 38.544 |
| Pyrite | 4.06 | 18.338 | 15.617 | 38.284 |
| Pyrite | 2.89 | 18.353 | 15.617 | 38.325 |
| Pyrite | 1.63 | 18.373 | 15.617 | 38.356 |
| Pyrite | 2.05 | 18.332 | 15.617 | 38.293 |
| Pyrite | 0.50 | 18.454 | 15.617 | 38.482 |
| Pyrite | 2.34 | 18.477 | 15.617 | 38.504 |
Disclaimer/Publisher’s Note: The statements, opinions and data contained in all publications are solely those of the individual author(s) and contributor(s) and not of MDPI and/or the editor(s). MDPI and/or the editor(s) disclaim responsibility for any injury to people or property resulting from any ideas, methods, instructions or products referred to in the content. |
© 2025 by the authors. Licensee MDPI, Basel, Switzerland. This article is an open access article distributed under the terms and conditions of the Creative Commons Attribution (CC BY) license (https://creativecommons.org/licenses/by/4.0/).
Share and Cite
Xia, F.; Chen, C.; Sun, W. The Mineralization Mechanism of the Axi Gold Deposit in West Tianshan, NW China: Insights from Fluid Inclusion and Multi-Isotope Analyses. Minerals 2025, 15, 536. https://doi.org/10.3390/min15050536
Xia F, Chen C, Sun W. The Mineralization Mechanism of the Axi Gold Deposit in West Tianshan, NW China: Insights from Fluid Inclusion and Multi-Isotope Analyses. Minerals. 2025; 15(5):536. https://doi.org/10.3390/min15050536
Chicago/Turabian StyleXia, Fang, Chuan Chen, and Weidong Sun. 2025. "The Mineralization Mechanism of the Axi Gold Deposit in West Tianshan, NW China: Insights from Fluid Inclusion and Multi-Isotope Analyses" Minerals 15, no. 5: 536. https://doi.org/10.3390/min15050536
APA StyleXia, F., Chen, C., & Sun, W. (2025). The Mineralization Mechanism of the Axi Gold Deposit in West Tianshan, NW China: Insights from Fluid Inclusion and Multi-Isotope Analyses. Minerals, 15(5), 536. https://doi.org/10.3390/min15050536