Article

Testing Pyrrhotite Trace Element Chemistry as a Vector Towards the Mineralization in the Sullivan Deposit, B.C.

by
Naci Sertug Senol
1,
Daniel David Gregory
1,*,
Indrani Mukherjee
2,
Nelson Román
1,
Roisin Kyne
3 and
Kaleb S. Boucher
3
1
Department of Earth Sciences, Earth Sciences Centre, 22 Ursula Franklin Street, Toronto, ON M5S 3B1, Canada
2
School of Biological, Earth and Environmental Sciences (BEES), University of New South Wales, Kensington, Sydney 2052, Australia
3
Teck Resources Limited, Suite 3300, Bentall 5, 550 Burrard Street, Vancouver, BC V6C 0B3, Canada
*
Author to whom correspondence should be addressed.
Minerals 2025, 15(5), 534; https://doi.org/10.3390/min15050534
Submission received: 25 February 2025 / Revised: 9 April 2025 / Accepted: 27 April 2025 / Published: 17 May 2025
(This article belongs to the Special Issue Mineral Chemistry: Tool for Vectoring towards Mineral Deposits)

Abstract

:
Mineral exploration methods are expensive and time-consuming, especially in recent times, where many near-surface deposits have been found and exploited. To overcome these challenges, new strategies must be developed. Here, we test whether the trace element chemistry of pyrrhotite changes systematically with distance from mineralization at the Sullivan deposit, British Columbia. If so, this could provide an additional tool to search for new ore bodies. Forty samples of the hanging wall, footwall, and mineralization hosting stratigraphy (host horizon) were collected from seven drill holes, both proximal and distal to the Sullivan deposit. These samples were analyzed using reflected light microscopy, an electron microprobe, and LA-ICPMS (laser ablation, inductively coupled plasma mass spectrometry). A total of three hundred and ninety LA-ICPMS analyses were used to build machine learning classifiers (cluster analysis and random forests) to determine whether an unknown pyrrhotite sample was from the mineralized horizon and, if so, whether it was proximal or distal to the mineralization. Our study found that the trace element abundance in pyrrhotite was higher in the footwall and hanging wall compared to the host horizon, and within the host horizon, was higher distal to the mineralization.

1. Introduction

Mineral exploration has become progressively more challenging as many of the most readily accessible near-surface mineral deposits have already been discovered. As a result, future exploration activities are likely to focus increasingly on deeper mineral deposits. This will lead to higher costs because exploration for buried and concealed deposits is associated with higher exploration costs than near-surface deposits, relying heavily on geophysical surveys or blind drilling. Therefore, new strategies must be developed to extract as much information from these drill holes as possible. In the past two decades, advances in analytical technology have been leveraged to identify systematic relationships between mineral compositions and proximity to ore deposits. Some of these studies have utilized the mineral pyrite [1]. In this study we test whether the trace element concentration of pyrrhotite varies systematically with distance from mineralization at the world-class Sullivan Zn-Pb-Ag deposit, located within the Canadian side (British Columbia) of the Belt-Purcell basin. This may offer a possible way to vector to new ore bodies, especially in areas that require deeper drilling.
The main ore body of the Sullivan deposit consists primarily of pyrrhotite, sphalerite, galena, and pyrite [2]. Pyrrhotite is also common throughout other parts of the stratigraphy within the Belt-Purcell basin (Figure 1). Comparing the pyrrhotite trace element chemistry proximal, from the edge of the ore zone, and distal (up to 6 km away) may give insight into the extent to which the mineralizing fluids travelled from the deposit. In this study, we test the hypothesis that pyrrhotite trace element chemistry will vary systematically away from mineralization at the Sullivan deposit. To do this, samples of the hanging wall, footwall, and host horizon were collected from seven drill holes, both proximal (<1.3 km) and distal (>4 km) to the Sullivan deposit. These were then analyzed using reflected light microscopy, an electron microprobe, and laser ablation inductively coupled plasma mass spectrometry (LA-ICPMS). These data were interpreted by cluster analysis and were used to build machine learning classifiers (random forests) to determine whether an unknown pyrrhotite sample originated near mineralization.
Additionally, the genesis of pyrrhotite within the Sullivan deposit is widely debated. While some argue for its association with hydrothermal activity [4], the widespread presence of pyrrhotite regionally in the Lower and Middle Aldridge formations suggests an alternative origin (or multiple). Several researchers have studied the interrelation and formation of metamorphic and sedimentary pyrrhotite and pyrite across several diverse sedimentary basins [4,5,6,7,8]. One goal of this study is to clarify the genesis of pyrrhotite in and around the Sullivan deposit.

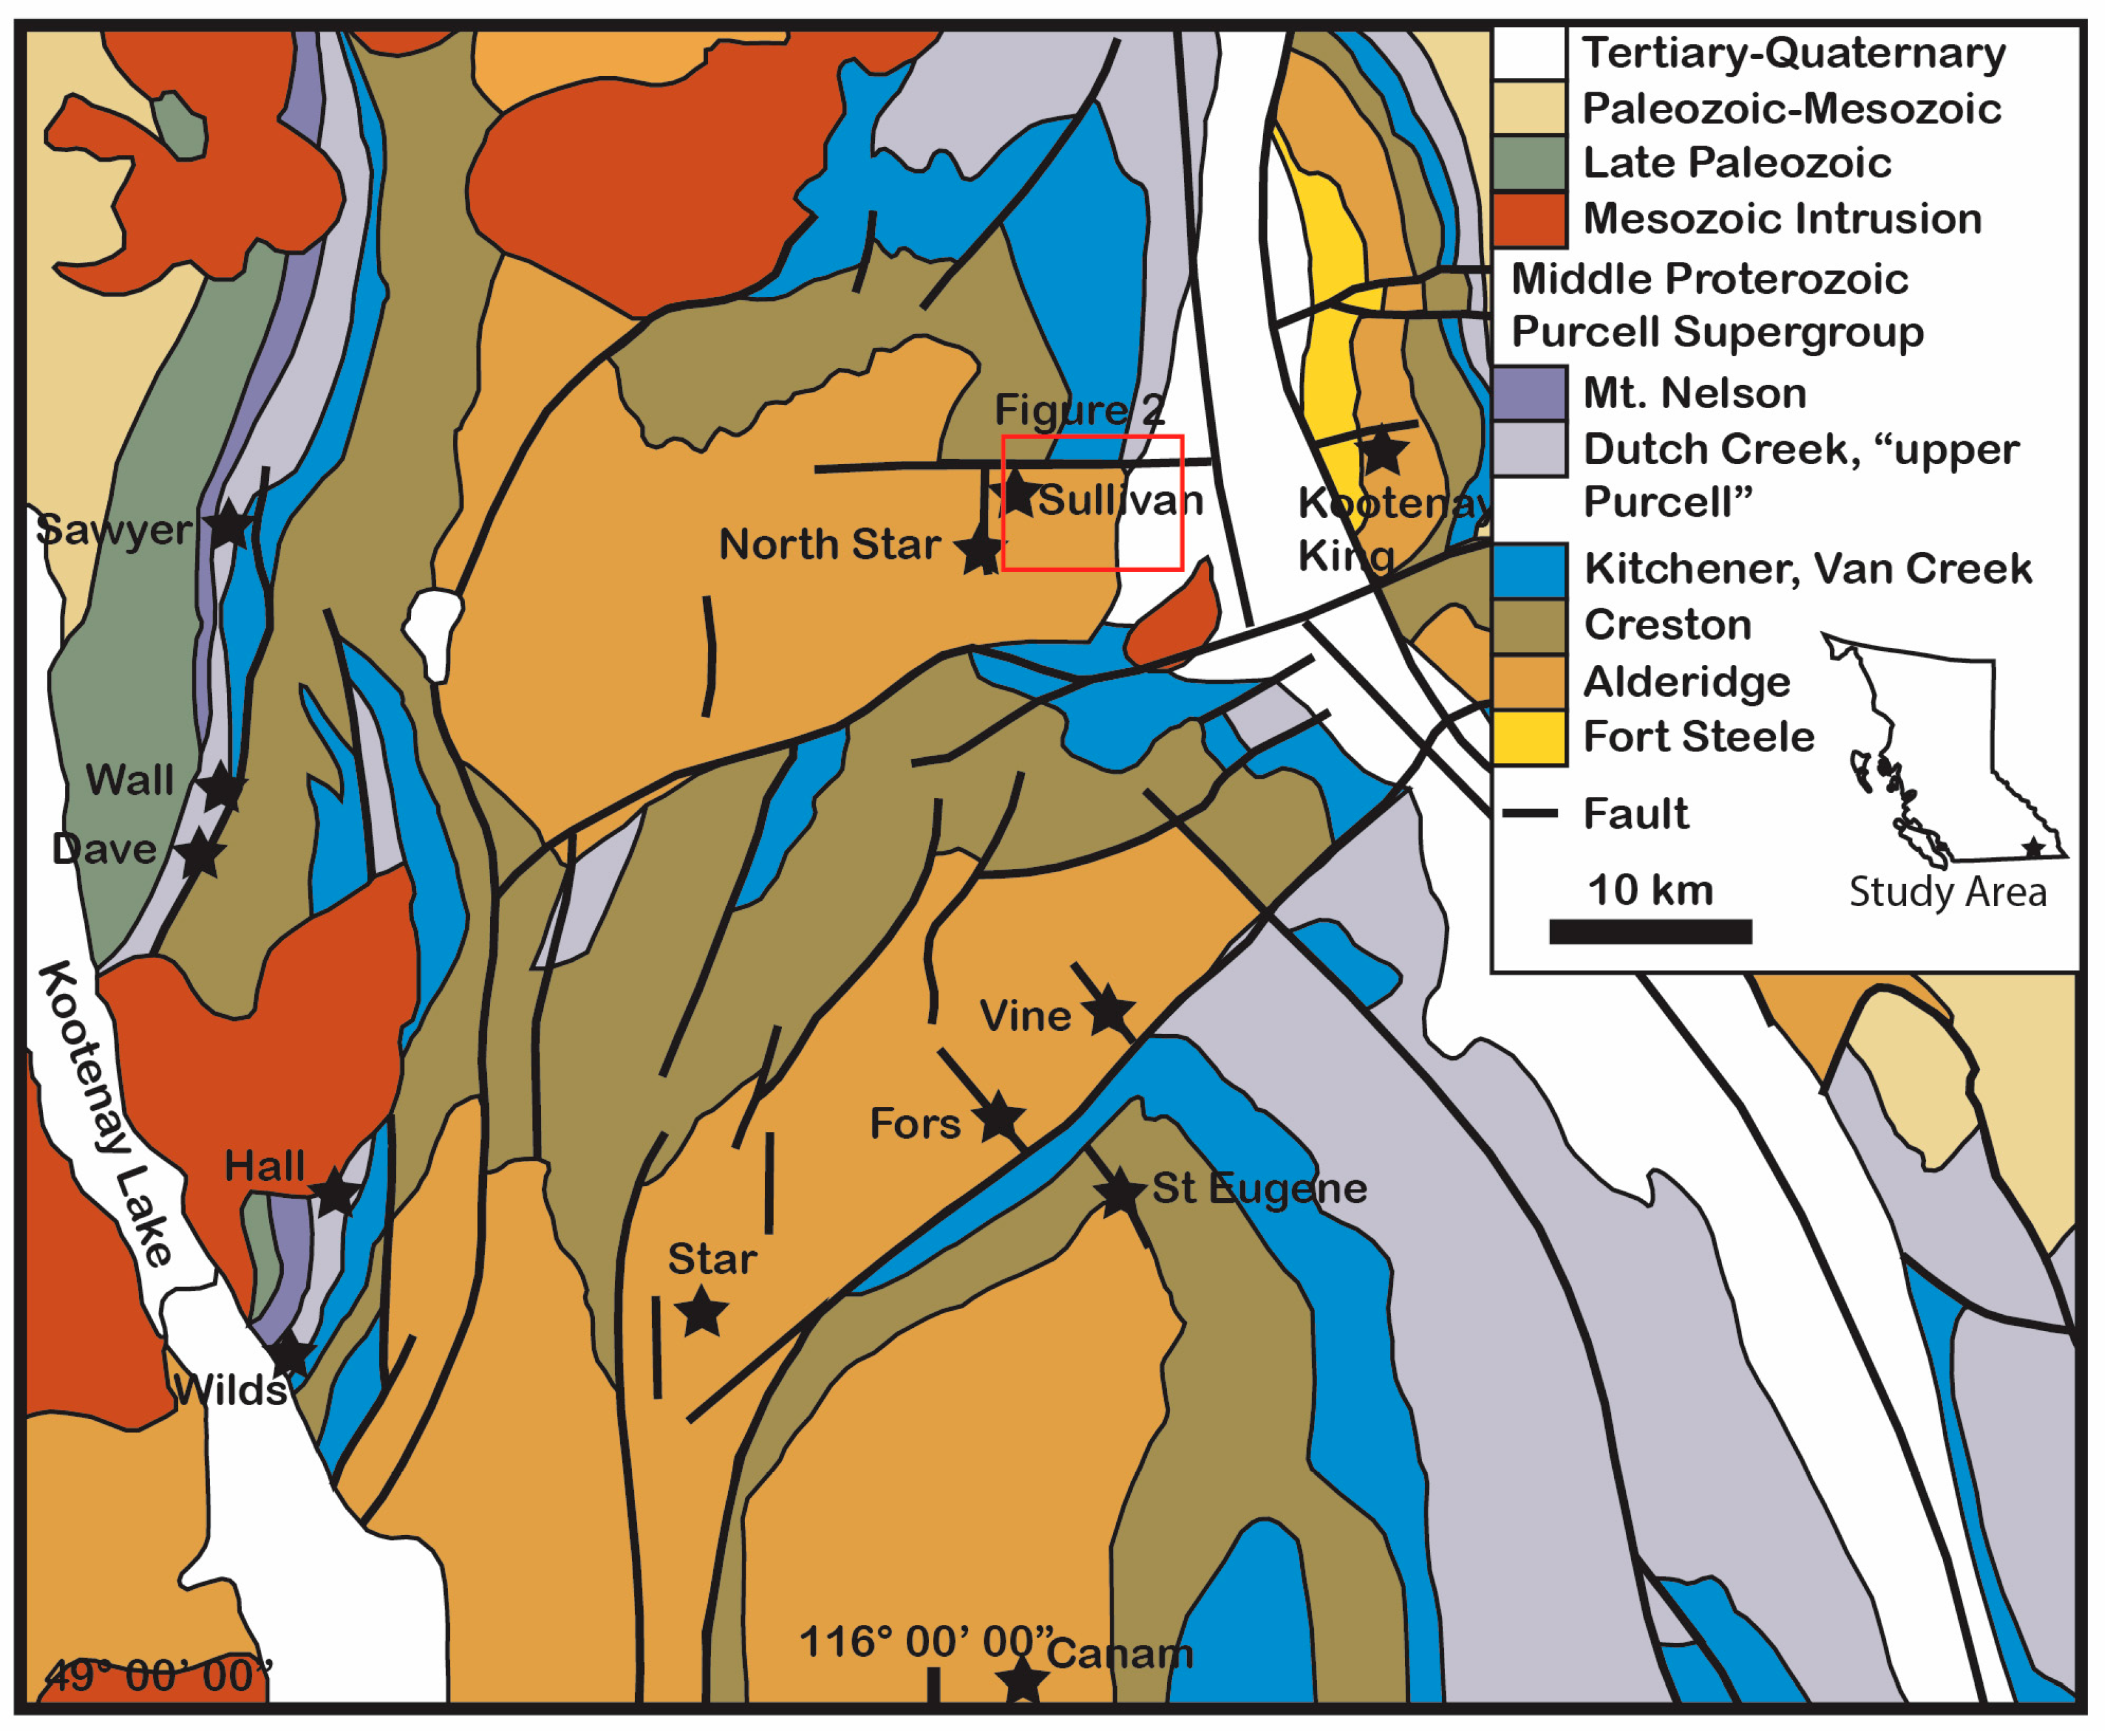
1.1. Regional Geology

1.1.1. The Belt-Purcell Basin

The Mesoproterozoic Belt-Purcell Basin is an intracontinental rift basin dominated by marine and fluvial sediments and early extension-related gabbroic intrusions, the Moyie sills [3]. Paleotectonic reconstructions position the basin between Laurentia and either East Antarctica [9], Siberia [10], or Australia [11]. Notably, the basin’s proximity to Laurentia’s continental edge and its similarities with the Australian Mesoproterozoic Basins (i.e., the McArthur basin) and sediment hosted base-metal deposits are significant [12]. At the time of formation, these fertile Mesoproterozoic sedimentary basins were located at low latitudes over the same geologic province. While not exposed at the surface, evidence for the continental basement beneath the Belt-Purcell rocks comes from major and trace element chemistry studies of the Moyie intrusions [13,14]. These intrusions, which were emplaced into the Aldridge Formation between 1470–1445 Ma [3,13], are contaminated by Paleoproterozoic or Archean continental crust. The gabbroic Moyie sills comprise roughly 40% by volume of the Lower Aldridge Formation [3], with mapped isoliths indicating over 1 km thickness from the Belt-Purcell rift axis (Figure 1; [15]).
Stratigraphy in the Belt-Purcell Supergroup can be subdivided into four main groups in ascending order [USA-name equivalents in brackets]: (1) the Aldridge Formation [Prichard Formation] and equivalents, comprising deep marine turbidites; (2) the Creston Group [Ravalli Group], comprising fine-grained clastic rocks; (3) the Kitchner Formation [Piegan Group], composed of siliciclastic and carbonate sequences; and (4) the Dutch Creek and Mt. Nelson Formations [Missoula Group], comprising fine-grained, dominantly fluviatile clastic rocks.
The Aldridge Formation is typically split into three separate units and represents an accumulation of >10 km of turbiditic sediments with intercalated mafic sills accompanying the onset of the basin development ca. 1470 Ma [12]. The Lower Aldridge (LA) Formation comprises thin- to medium-bedded argillaceous turbidites interbedded with prominent quartzite turbidites (often hundreds of meters thick). The Middle Aldridge Formation is up to 2.4 km thick and is dominated by medium- to thick-bedded quartz rich turbidites with prominent intervals of laminated “marker” siltstone [15]. The Upper Aldridge Formation is typically only 300 m thick, comprising thinly bedded laminated argillite and siltstone, deposited onto a shallowing basin plain. The Moyie sills are typically found in either the Lower Aldridge or Middle Aldridge Formations. Pyrrhotite is also common within argillaceous units in the Lower Aldridge Formation, gradually waning into the Middle Aldridge and Upper Aldridge Formations. Several sediment hosted massive sulfide (SHMS) Zn-Pb-Ag deposits are hosted primarily in the Lower Aldridge and Middle Aldridge Formations, including Sullivan, Kootenay King, and North Star (Figure 1).

1.1.2. Tectonics and Metamorphism

Three major metamorphic and deformation events affected the Belt-Purcell Supergroup rocks: the East Kootenay Orogeny (1350–1300 Ma), the Goat River Orogeny (900–800 Ma), and the Jurassic–Cretaceous (160–60 Ma) and Cretaceous–Paleogene Orogenies [16], although Lu-Hf age dating for garnets suggests the former two dates may extend earlier [17].
The East Kootenay Orogeny is characterized by extensional and transfer faults that controlled the Mesoproterozoic tectonics [3]. It involved burial metamorphism of the Belt-Purcell Supergroup sediments, as evidenced by the increasing regional metamorphic grade with stratigraphic depth in the Purcell anticlinorium [16,18,19,20]. Lu-Hf dating of garnets from the Priest River complex give an age for this event of 1379 ± 8 Ma [17]. Peak metamorphic conditions occurred during this time, yielding estimates of 680 °C at 450 MPa (14 km burial) and 690 °C at 650 MPa (20 km burial) [21]; however, peak metamorphic grade varies significantly across the Belt-Purcell rocks at surface.
The Goat River Orogeny marked the onset of the Windermere Supergroup deposition. It is characterized by block faulting, metamorphism, and uplift [16]. K-Ar and paleomagnetic data indicated that the regional metamorphism during this time was low-grade, possibly associated with Grenville-age metamorphism [16,22]. The age of the deformation ranges from 1018 ± 24 Ma to 1081 ± 20 Ma based on Lu-Hf dating of garnets [17].
The periods of Jurassic–Cretaceous and Cretaceous–Paleogene Orogenies saw the development of the Rocky Mountain fold and thrust belt as a result of tectonic collision between the Cordilleran accreted terranes and the North American craton (90–115 Ma) [12]. During this time, the Purcell anticlinorium saw major tectonic development, including reactivation of structural features, faults, and deformation that date back to Proterozoic and Archean times [12,15]. However, 40Ar/39Ar ages of micas (ranging as old as 1318 Ma) within the Purcell anticlinorium suggest that the structure was old and not buried deeply enough during the Mesozoic tectonism for the mica ages to be reset [23].

1.2. The Sullivan SHMS Zn-Pb-Ag Deposit

The Sullivan SHMS Zn-Pb-Ag deposit is situated in southeastern British Columbia, within the Canadian segment of the Belt-Purcell Basin. The world-class Sullivan deposit is thought to have contained at least 160 Mt of ore at 5.6 wt.% Zn, 6.4 wt.% Pb, and 67 g/t Ag (pre-mining endowment estimate; [15]). The deposit sits at the northern edge of the Sullivan sub-basin, a north-trending basin spanning approximately 13 km north-south, and 3–5 km east-west, defined by the Kimberley Fault in the north, and the Sullivan and East Faults to the west and east, respectively. Lower and Middle Aldridge stratigraphy is thickest in the west part of the basin (adjacent to the Sullivan Fault) and gradually thins to the east. Stratigraphically, the deposit is situated just below the contact between the Lower and Middle Aldridge Formations (Lower–,Middle Aldridge Contact). Here there is a laminated, black mudstone at the contact between the lower Aldridge Formation and the middle Aldridge Formation, termed the carbonaceous wacke laminate (also referred to as the Sullivan Horizon) [24,25]. Regionally, it is up to 20 m thick and records a period of sediment starvation in the basin. However, in the Sullivan area it can be up to 200 m thick, due to the presence of mud volcanoes in the area during the time of deposition [3]. The horizon is marked by a number of conformable and discordant coarse-clastic sediments, conglomerates and sedimentary breccias (“fragmental”), which are interpreted to be either the product of mud volcanism, or slump or scarp deposits related to movement along adjacent growth faults [3,15]. Beyond the limits of the Sullivan sub-basin, a pyrrhotite- and mica-rich laminated mudstone facies coined the Concentrator Hill Horizon is interpreted to be the distal stratigraphic equivalent to the Sullivan ore horizon [3].
In the Sullivan sub-basin, there is distinctive stratigraphy reflecting the role of mud volcanoes and abundant hydrothermal alteration. In the immediate footwall, there are extensive breccias due to the mudflows caused by the eruption of the mud volcanoes, referred to as the Footwall Conglomerate. Further, there is an extensive alteration pipe that is approximately 1 km in diameter, which is thought to have been the main conduit for the hydrothermal fluids that formed the deposit. This pipe contains abundant tourmaline and veins of pyrrhotite, quartz and calcite with lesser sphalerite, galena, chalcopyrite, and arsenopyrite [3]. There are two main types of ore within the Sullivan Ore Zone, the vent complex and the bedded ore. The former is the more abundant and comprises an approximately 100 m thick body of layered uneconomic pyrrhotite, pyrrhotite–galena–sphalerite, and galena–sphalerite–pyrrhotite [3]. The bedded ores occur further away from the vent complex and are composed of thick sulfide beds separated from each other by argillaceous mudflows. These sulfide beds decrease in thickness with distance from the vent complex. Additional massive sulfide bodies are found stratigraphically above the bedded ores and are known as the hanging wall ores [3].
At Sullivan, the peak regional metamorphic grade is Greenschist facies [3]. However, distinct hydrothermal alteration assemblages have also been identified in and around the Sullivan deposit. Tourmaline alteration is predominantly found in the footwall of the Sullivan deposit and interspersed with albite and chlorite in the hanging wall as discontinuous zones [3]. Chlorite–pyrrhotite alteration ranges from weak alteration of argillite and wacke to variably intense chloritization of argillite laminae within the Bedded Ores [3,26,27]. Chlorite–albite–pyrite alteration is evident predominantly in the hanging wall of Sullivan and often exhibits a pronounced zonal gradation from albite to chlorite–pyrite [28,29]. Chlorite–albite–pyrite alteration is often spatially associated with Moyie gabbro sills. Pyrite–carbonate–chlorite alteration often replaces the primary sulfide body, principally within the uneconomic pyrrhotite rich region in the lower part of the vent complex and the overlying ore bands [2,28,29]. Carbonate alteration is localized within the southern Transition Zone and Ore Bands and can be extensive [30]. Muscovite alteration envelopes most of the deposit, extending south along the Sullivan Corridor, although it is suggested to be a metamorphic product of sulfidizing biotite into muscovite and Fe-sulfide [3,29,30,31,32].

2. Materials and Methods

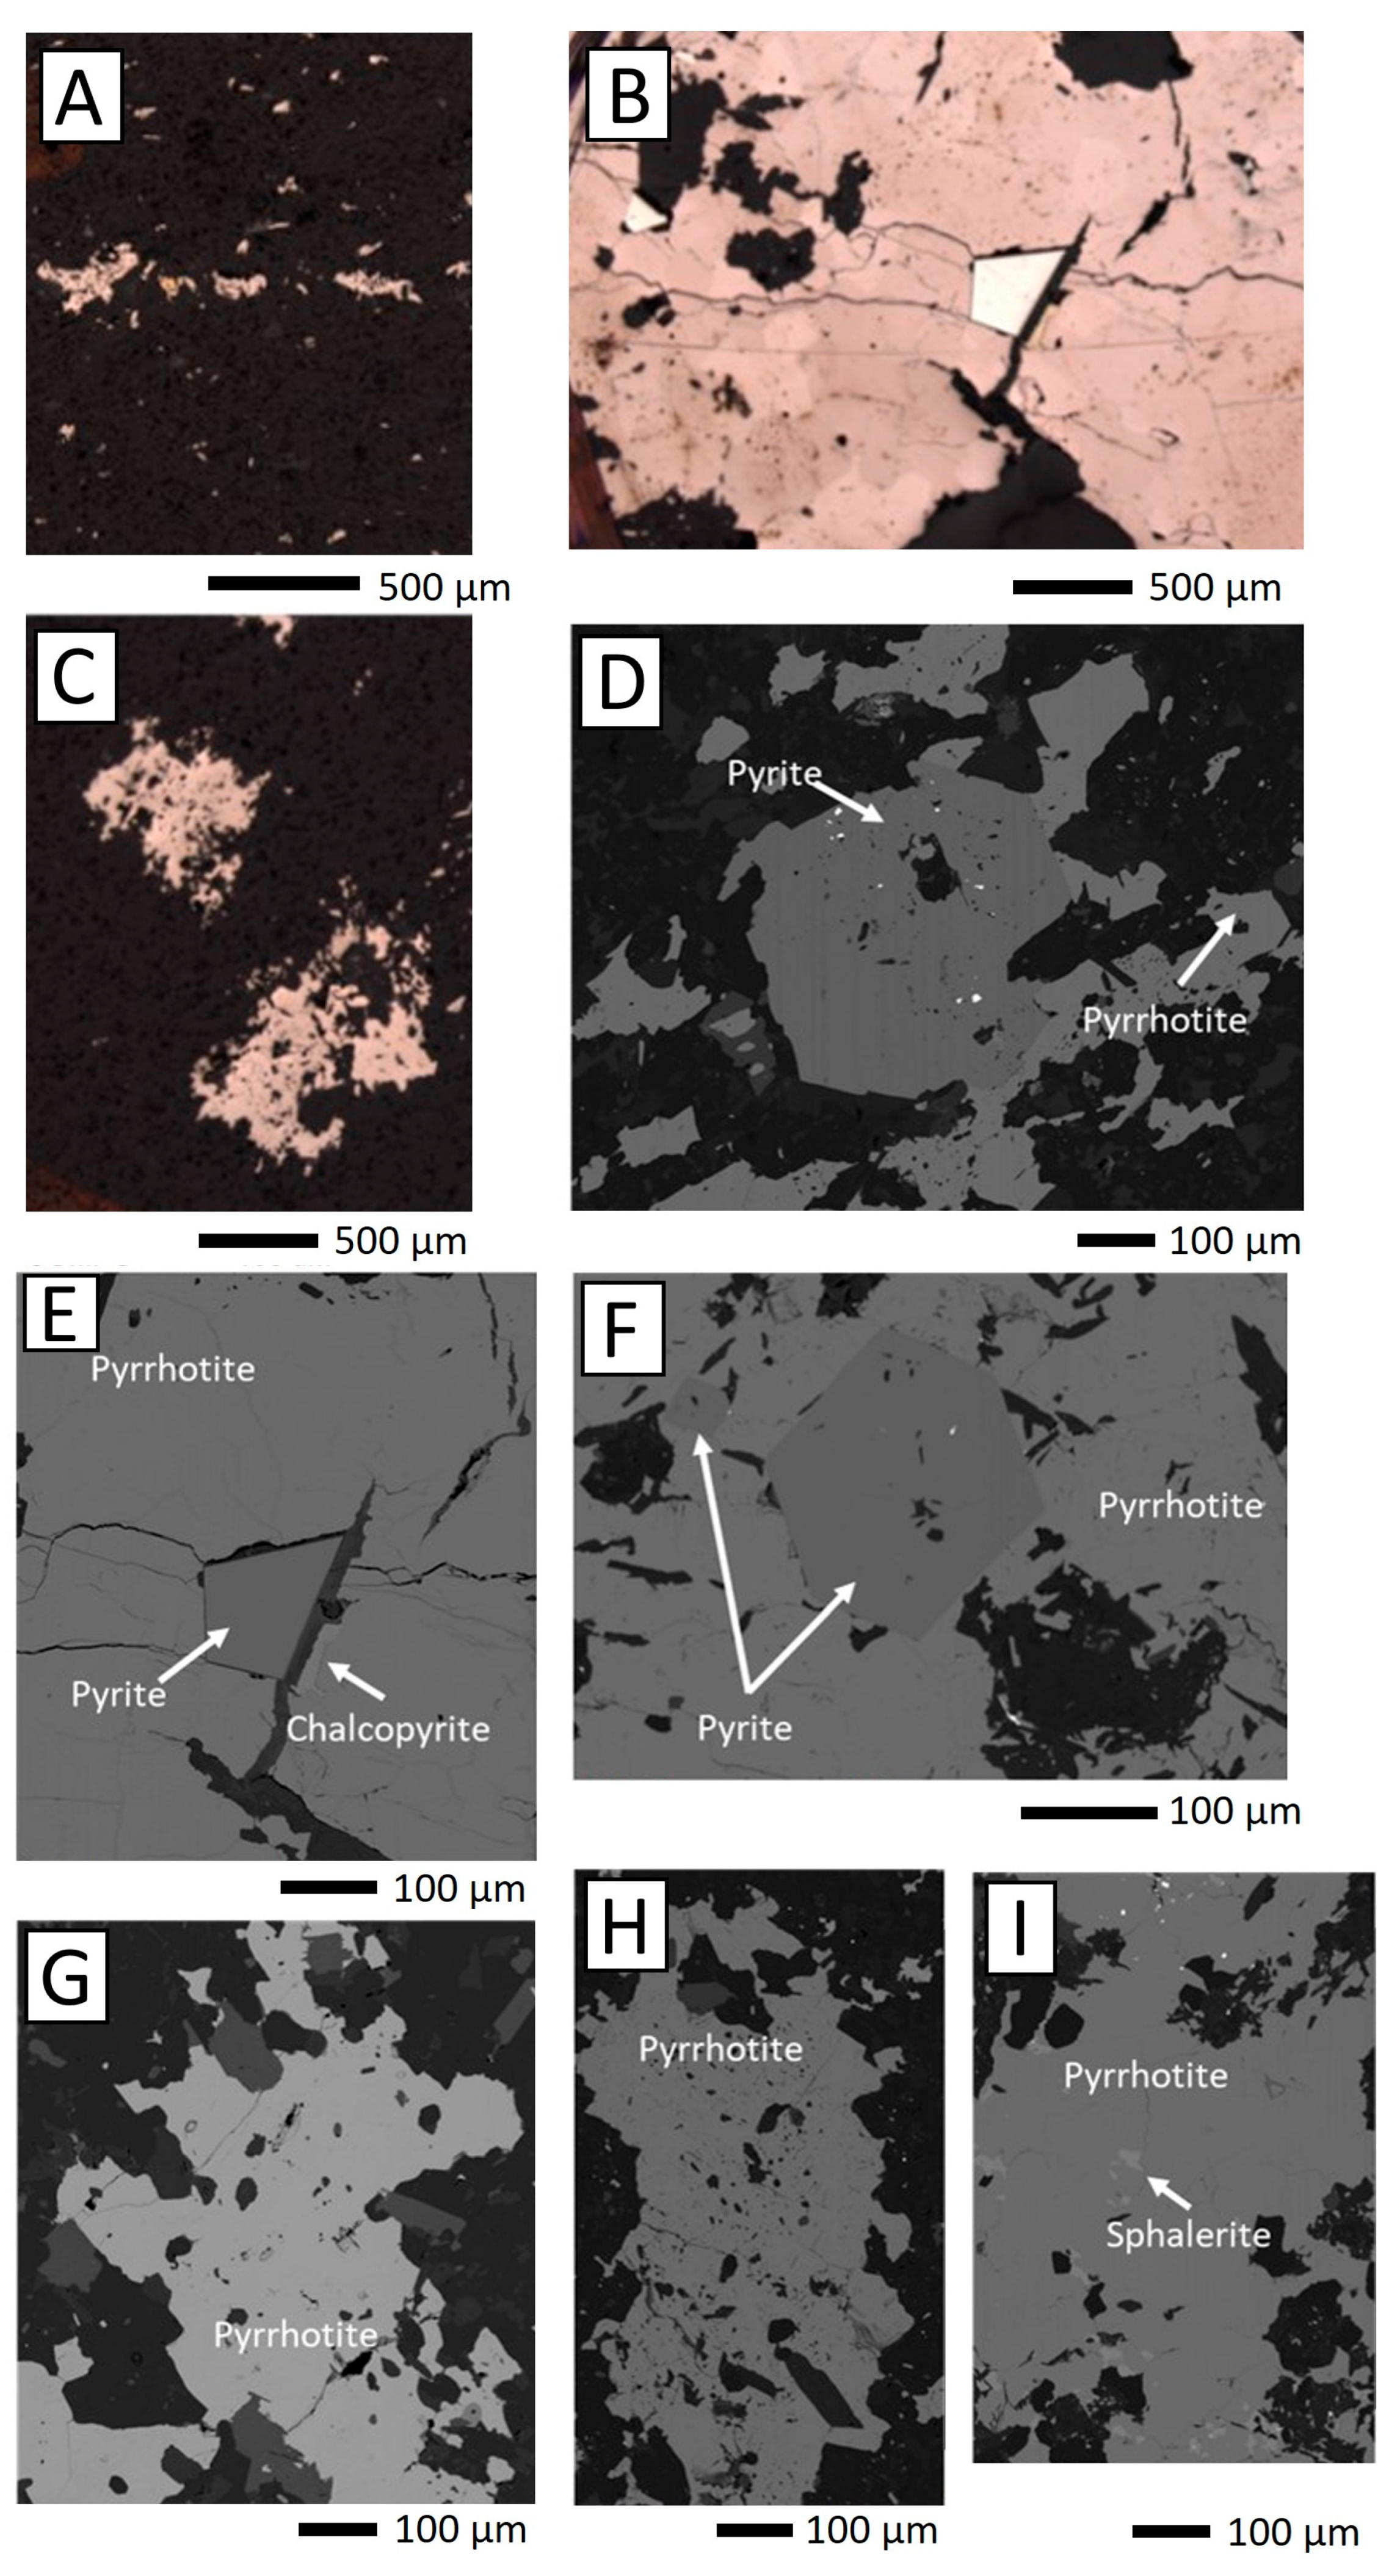
2.1. Drill Core Logging and Petrographic Analysis

Seven drill holes (DDH2231, DDH2827, DDH2828, DDH6422, DDH6423, DDH6456 and DDH71-1) were selected for the investigation of pyrrhotite trace element chemistry. DDH6456 was not analyzed by LA-ICPMS as it was not dissimilar to the other three distal drill holes. Three drill holes (DDH2231, DDH2828 and DDH2827) were chosen as representative drill holes proximal (<1.3 km from the ore) to mineralization, while the remaining four drill holes (DDH6423, DDH6422, DDH6456 and DDH71-1) were chosen to be representative of drill holes distal (>4 km) to the Sullivan Deposit (Figure 2). Three drill holes were logged in detail (DDH2231, DDH6422 and DDH6456) and four drill holes were sampled by a contractor on-site (DDH71-1, DDH2827, DDH2828 and DDH6422). To determine whether there is a systematic change in pyrrhotite trace element chemistry with distance to the deposit, we selected drill holes that intersect the edge of the mineralization and the mineralized horizon progressively further away. We also sampled above and below the known host horizon to determine whether the stratigraphic position can be differentiated using pyrrhotite trace element chemistry.
Thirty-eight samples were prepared at CODES, University of Tasmania, and fifteen samples were sent to Vancouver Petrographics Ltd., Vancouver, BC, Canada, to prepare 25-mm diameter polished laser mounts. Of the prepared samples, 40 were chosen for LA-ICPMS analysis based on the results of the reflected light microscopy.
Figure 2. Geological map of the Sullivan area that shows the location of drill holes used in the study. Drill hole 71-1 is 6.3 km from drill hole 6456 at a bearing of 210°. Datum and UTM Zone are NAD 83, Zone 11. Modified after [33,34].
Minerals 15 00534 g002
Reflected light microscopy was used to identify pyrrhotite and other associated sulfide minerals in all 53 samples. Areas of interest for LA-ICPMS spot analyses were selected based on the results of the reflected light microscopy and chosen to be representative of the pyrrhotite in the samples.
Selected samples were analyzed by scanning electron microscope (SEM), using a JEOL JSM-6610LV SEM (Japan Electron Optics Laboratory, Tokyo, Japan) at the department of Earth Sciences at the University of Toronto. A voltage of 15 kV and 9 mm working distance was utilized for these analyses. This was performed to help identify minerals that could not be identified in reflected light and to obtain high resolution backscatter electron images of the areas of interest prior to electron microprobe analysis.

2.2. Electron Microprobe Analysis

Representative samples from two proximal drill holes (DDH2827 and DDH2828) and one distal drill hole (DDH6422) were studied with a JXA 8230 electron microprobe analysis (EPMA) (Japan Electron Optics Laboratory, Tokyo, Japan). The main objective of these analyses was to quantify Fe and S concentrations of the areas of interest prior to laser ablation analysis, to determine whether there was significant variation in these elements, and importantly, to obtain accurate Fe concentrations, as Fe was the internal standard used for LA-ICPMS data reduction.
EPMA was performed at the Department of Earth Sciences, University of Toronto, using a JEOL JXA-8230 probe. Eight elements (Mn, Fe, Zn, As, Co, Ni, Cu, and S) were analyzed using a beam current of 30 nA, an accelerating voltage of 20 kV, and a spot size of 1 µm. Kα was used for all elements except for As, where the Lα was used. Standards used include bustamite for Mn, synthetic FeS for Fe and S, synthetic sphalerite (Fe15) for Zn, synthetic arsenopyrite for As, Co metal for Co, pentlandite for Ni, and chalcopyrite for Cu. Before the analysis, the samples were carbon coated to avoid charge build up. Approximately 3–4 spots were selected across the pyrrhotite grains to determine whether Fe content varied significantly. One hundred and twenty-six spot analyses met the required quality control threshold of total concentrations of 98–101.5 wt.%.
Six EPMA trace element maps were also conducted to determine whether any element pyrrhotite zonation is present at concentrations resolvable using EPMA. This was done using “Probe for EPMA” software from Probe Software.

2.3. Laser Ablation Inductively Coupled Plasma Mass Spectrometry

Approximately ten laser ablation spots were selected per polished mount. LA-ICPMS spots were placed to sample representative textures and to avoid any cracks or inclusions of other minerals. A total of 98 spot analyses were conducted on samples from the hanging wall, 184 analyses were conducted on samples from the host horizon, and 108 analyses were conducted on samples from the footwall. Pyrrhotite element contents were analyzed at CODES, University of Tasmania, using Applied Spectra/ASI RESOlution LR Laser Ablation System comprising of CompexPro 110 ArF Excimer laser (193 nm wavelength, 20 ns pulse width) equipped with S155 Laurin Technic cell (Canberra, Australia) coupled to an Agilent 7700 ICP-MS (Agilent Technologies, Santa Clara, CA, USA). The following isotopes were measured: 23Na, 24Mg, 27Al, 29Si, 34S, 39K, 43Ca, 49Ti, 51V, 53Cr, 55Mn, 57Fe, 59Co, 60Ni, 65Cu, 66Zn, 75As, 77Se, 85Rb, 88Sr, 90Zr, 95Mo, 107Ag, 111Cd, 118Sn, 121Sb, 125Te, 137Ba, 157Gd, 178Hf, 181Ta, 182W, 195Pt, 205Tl, 206Pb, 207Pb, 208Pb, 209Bi, 232Th, and 238U. We used three calibration reference materials: STDGL-3 [1] for chalcophile and siderophile elements, GSD-1G [35] for lithophile elements, and natural pyrite for the quantification of sulfur [36,37]. For those reference materials, beam sizes of 51 μm, 51 μm, and 29 μm in diameter were used, respectively. The calibration reference materials were analyzed twice between every 20 to 40 unknown analyses and at the start and end of every sample change. For the unknown pyrrhotite analyses, a 29 μm spot size was used. To avoid any surface contamination, each spot was pre-ablated with five laser pulses. After pre-ablation, background was measured for the 30 s before a 60 s period of laser ablation per spot analysis. Laser fluences varied between 2.7 J/cm2 and 3.5 J/cm2, and a laser pulse rate of 5 Hz was used. The analyses were executed in an atmosphere of pure He, which was injected into the cell at a rate of 0.35 L/min. To enhance aerosol transport, 1.05 L/min of Ar was combined with the He carrier gas. Double charged species and molecular oxide species were maintained at levels under 0.2%. Because these species were kept at such low levels, no correction was utilized for associated interferences. The mass spectrometer used dwell times between 5 to 20 ms for the different analyses and varied depending on the element analyzed.
Data reduction was conducted by following the steps suggested by Longerich et al. [38] using SILLS software [39]. During data reduction, integration intervals were selected for the background and laser ablation phase. Distinct, anomalous peaks were avoided, and relatively flat elemental profiles were preserved to avoid inclusions of non-pyrrhotite phases. Next, the data were corrected to 100 wt.% pyrrhotite by setting Fe and S to values obtained by EMPA and then normalizing all elements to 100 wt.%. Because the trace element concentrations were much lower in the matrix than in pyrrhotite, and because matrix was relatively rare (77% spot analyses with less than 1 wt.% lithophile elements, none over 5 wt.%), no matrix correction was applied. Detection limits were calculated based on the methods of Pettke et al. (2012) [40]. Detection limits for each analysis are in Supplementary S1 and median detection limits are 0.08 ppm (V), 0.32 ppm (Mn), 0.05 ppm (Co), 0.46 ppm (Ni), 0.67 ppm (Zn), 2.1 ppm (As), 4.1 ppm (Se), 0.08 ppm (Sb), 0.03 ppm (W), 0.03 ppm (Tl), 0.13 ppm (Pb), and 0.02 ppm (Bi).

2.4. Statistical Analysis of Pyrrhotite Trace Element Compositional Data

Prior to data analysis, the below detection limits analyses were replaced by half of the detection limits for the element [41]. Median and median absolute deviation values were then calculated to summarize the data. Prior to cluster analysis, a logarithmic transformation was applied, then the dataset was standardized (through Z-score calculation) using ioGAS software (version 7.0).

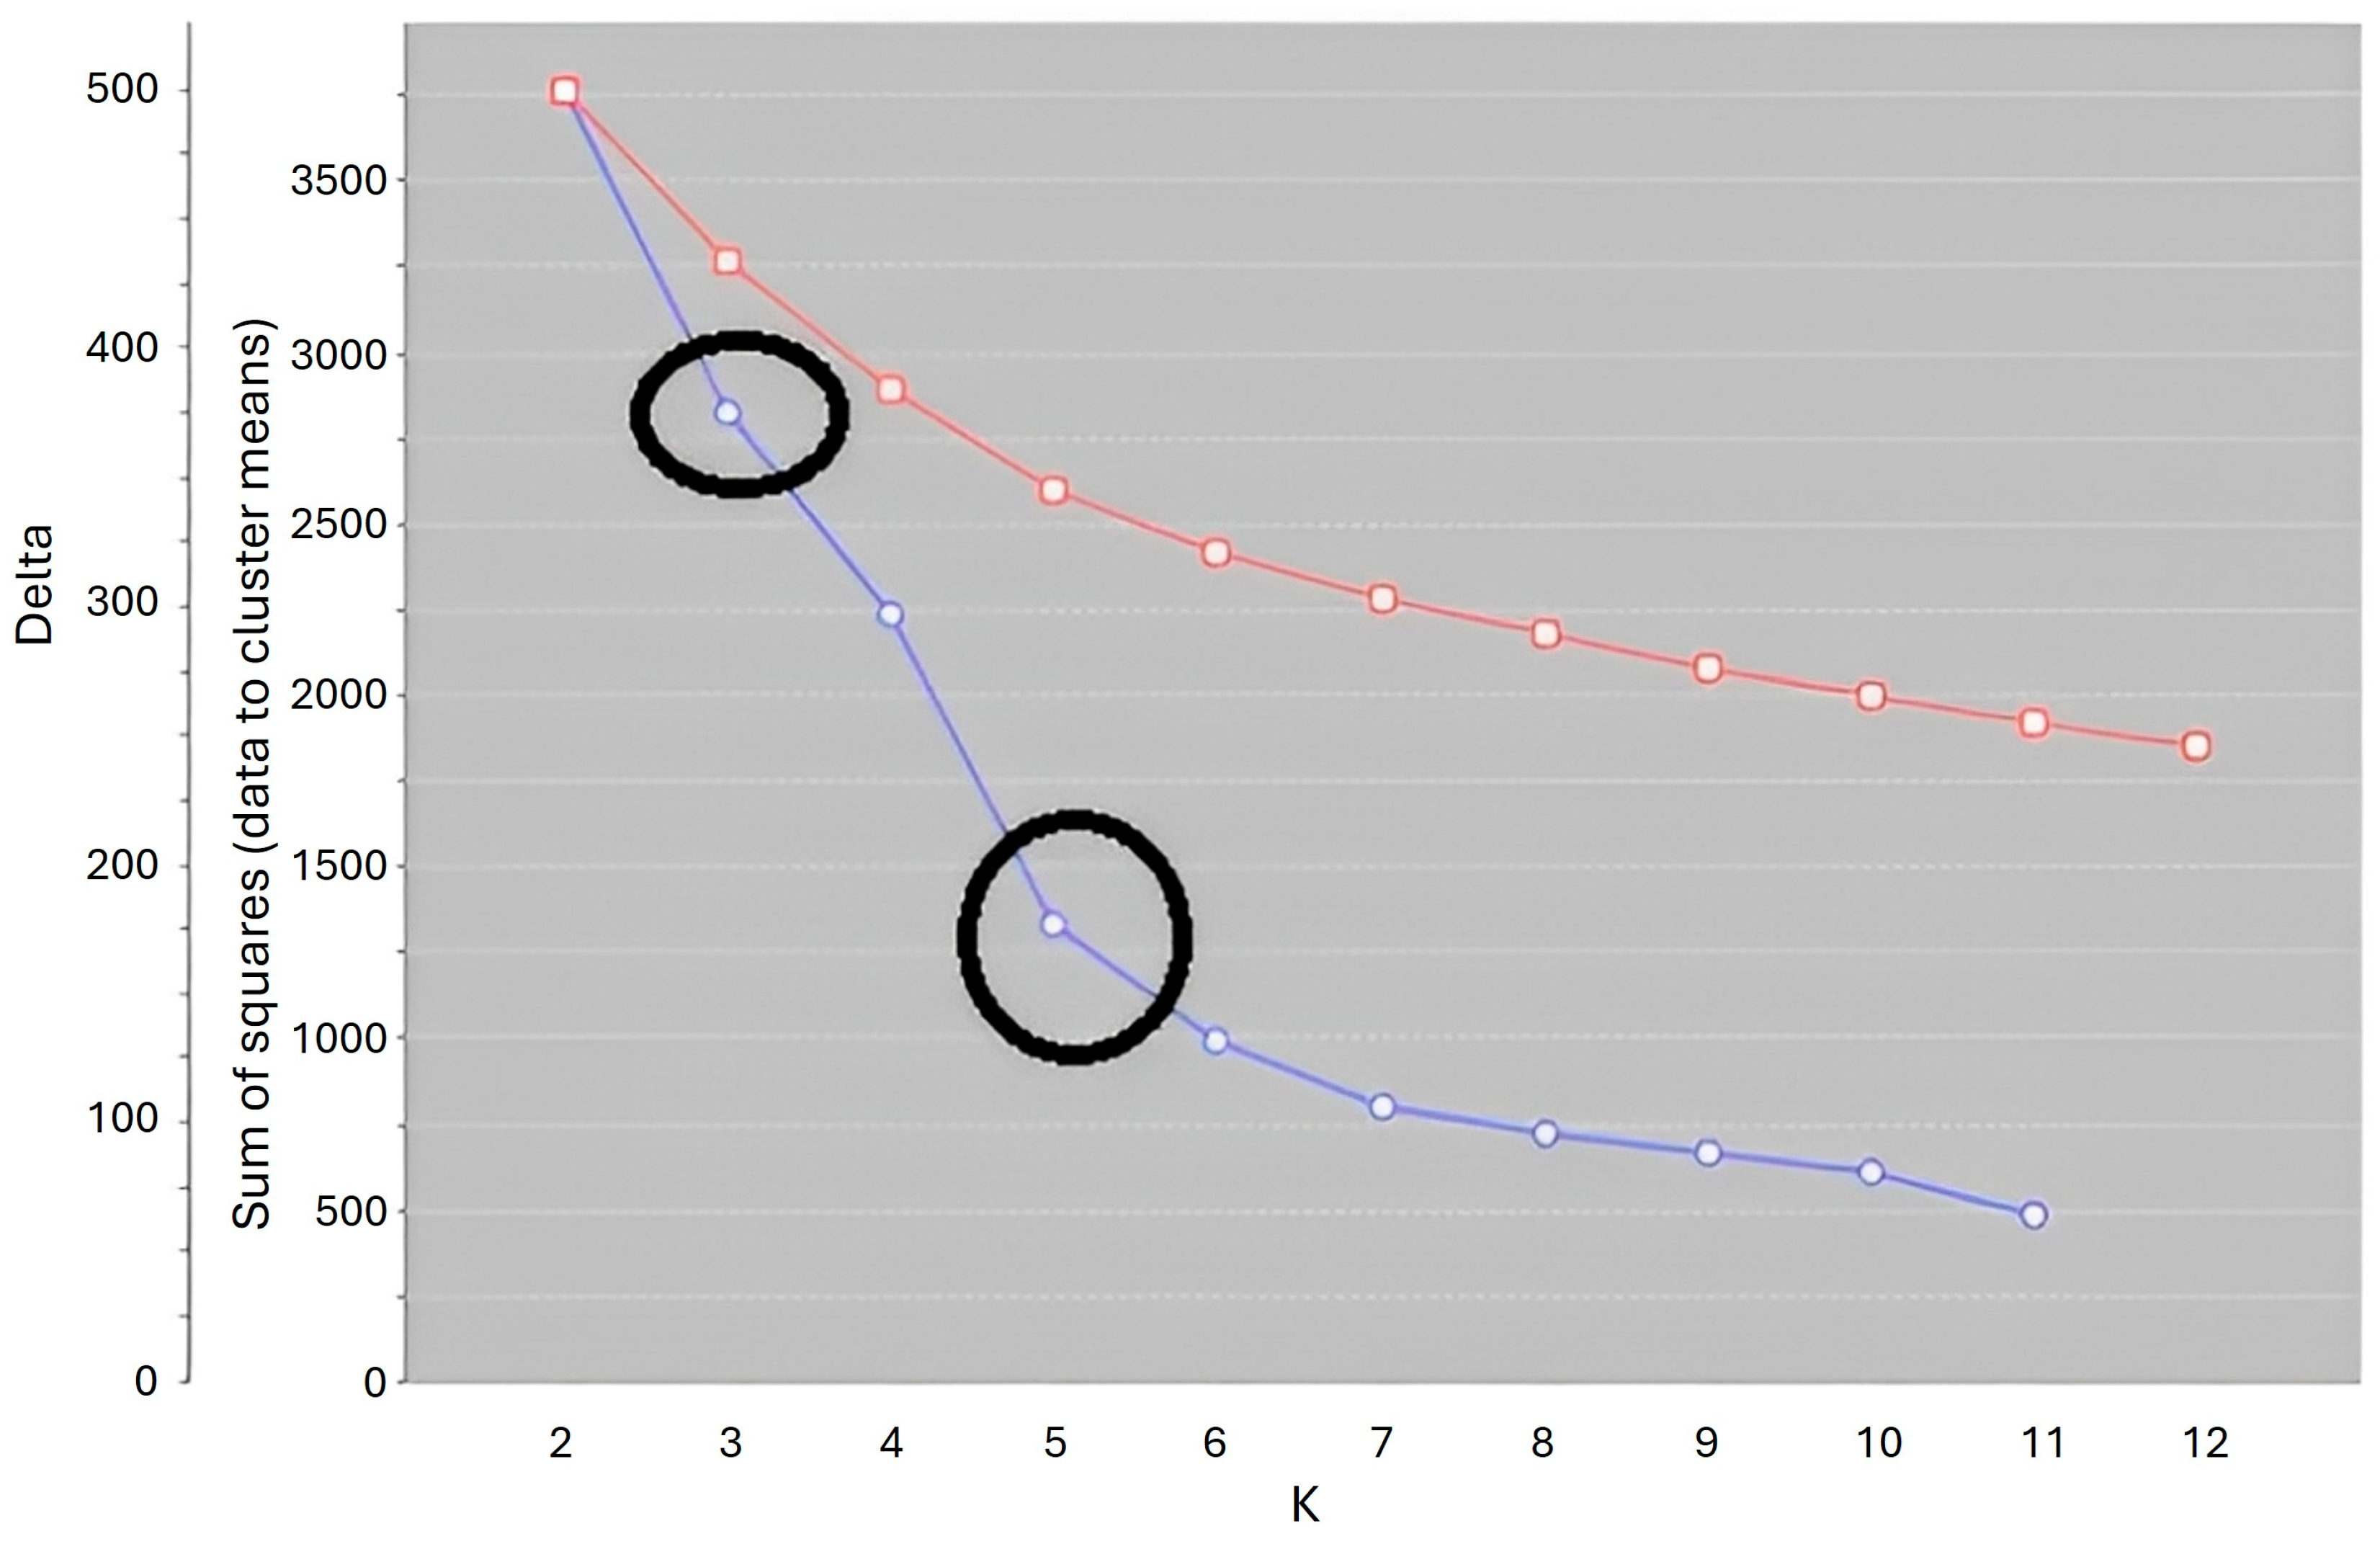
2.4.1. K-Means Clustering Analysis

Clustering analysis of pyrrhotite LA-ICP-MS compositional data was performed using K-means. To determine how many clusters were optimum for our data set, we utilized the elbow method [42]. The method employs the total within-cluster sum of squares, a measure of the total distance between data points and their cluster’s centroid, to identify the optimal number of clusters. An ideal number of clusters is indicated by a relatively low total within-cluster sum of squares, which does not increase substantially with the addition of an extra cluster. Three and five clusters were chosen using the elbow method, as these fit the natural tendency of the data (k = 3 and k = 5; Figure 3). The next step involves the initialization of ‘k’ centroids, placed randomly within the data space. Subsequently, every data point is allocated to the closest centroid. Once all points are grouped, the method recalculates each cluster’s centroid by averaging the coordinates of all points within that cluster. This procedure of allocating data points to the nearest centroid and updating the centroids is iteratively performed until the clusters become stable and do not change significantly with further iterations.

2.4.2. Random Forests

Supervised classification is a process where input features, denoted as vectors {x1,…, xm}, are connected to a set of class labels {y1,…,yc} through a function y = f(x). This method involves training a model f’ with a certain number of samples to accurately categorize data into classes [43,44,45]. The process comprises three main phases: data preprocessing, classifier training, and prediction evaluation [46]. Data preprocessing focuses on refining input data into a useful set of features for classification [44,47]. Classifier training involves optimizing parameters for better performance, emphasizing feature selection to enhance processing efficiency and interpretation [44,48]. Evaluation of predictions, which is crucial for verifying the classifier’s accuracy, uses metrics such as overall accuracy, recall, and precision on unseen test data [49]. Random forests is a type of supervised classifier that utilizes multiple decision trees to make predictions based on majority voting [50]. It incorporates randomness through feature sub setting and bagging. Bagging involves sampling training data for individual trees, and the Gini index is employed to determine optimal splits in the trees [51,52]. A total of 1000 trees were used for the random forest, with a minimum node size of 5.
Details of data distribution considered for random forests are provided in Table 1. Two hundred and fifty pyrrhotite LA-ICPMS spot data were selected to train and test the random forests algorithm, corresponding to data from four drill holes (DDH2827, DDH2231, DDH71-1 and DDH6422). The remainder of the 140 LA-ICPMS spot data, from other drill holes (DDH2827 and DDH6422), were later introduced as unknowns to see if the algorithm can correctly predict stratigraphic position. We randomly selected 50 analyses from the footwall, hanging wall and host horizon (150 analyses in total) to train the random forests model. The remaining 100 analyses (8 for footwall, 18 for hanging wall and 74 for host horizon) were then used to provide initial tests of the classifier. Next, this procedure was applied ten times, with different random seeds, to check the model’s reliability. Then 140 spot data (from drill holes DDH2827 and DDH6422) that had not been used in the initial training/test dataset were classified by the random forest model (50 for the footwall, 30 for the hanging wall and 60 for the host horizon) to test the efficacy of the classifier on data from drill holes that were not part of the original training data set.
A similar procedure was applied to investigate whether the random forests model can predict whether the samples are near or distal to the deposit, once it has been determined which samples are from the host horizon. Fifty analyses were selected randomly for the training set, and then seventy-four were selected to test the random forests algorithm from DDH2827, DDH2231, DDH71-1, DDH6422, DDH2828, and DDH6423.

3. Results

3.1. Summary of Drill Logs

Rock descriptions for drill holes DDH6466, DDH6422, DDH2828, DDH2231, DDH2827, and DDH71-1 are provided in Supplementary S1. The Lower Aldridge Formation sedimentary rocks are predominantly wacke to subwacke and are generally thin-bedded to laminated, light to medium grey, and very fine-grained. The hanging wall units mainly consist of carbonaceous wacke laminite, argillite, and argillaceous wacke laminite. These units are very-fine to fine-grained, medium to dark grey with a low to moderate (1%–5%) concentration of pyrrhotite-rich layers. The footwall units show a thin-bedded sequence of arenite, siltstone, and quartzites. These are light to medium grey, with minor pyrrhotite-rich layers and disseminations. Some turbidites are observed within the distal drill holes, such as DDH6422. The Sullivan deposit is hosted in the base of the Middle Aldridge Formation and the top of the Lower Aldridge Formation [53]. The sulfides observed vary and occur mainly as weak to moderate disseminations, layers, and in veinlets.

3.2. Pyrrhotite Textures

Three different pyrrhotite textures were identified in this study, classified primarily according to the size of the aggregate masses, as disseminated (less than 50 μm), blebby (50 μm to 500 μm), and massive (greater than 1000 μm) (Table 2). Proximal to the deposit, the hanging wall pyrrhotite is largely disseminated (67% disseminated, 33% blebby) and distal to the deposit it is predominantly blebby (blebby 59%, disseminated 26%, and massive 15%). In the footwall, blebby pyrrhotite is the most common texture, both proximal (blebby 61%, disseminated 24%, and massive 16%) and distal (blebby 73%, and massive 27%) to the deposit. In the mineralized horizon, massive pyrrhotite is the most common texture, both in proximal (disseminated 1%, and massive 99%) and distal (blebby 9%, and massive 91%) settings. No pyrite inclusions or partial alteration of pyrite to pyrrhotite was observed. When observed with pyrrhotite, pyrite occurs as euhedral crystals (Figure 4 and Supplementary S1), suggesting co-precipitation.
In addition to pyrrhotite, three other sulfide species were detected within the massive pyrrhotite: subhedral sphalerite, anhedral chalcopyrite and anhedral to euhedral pyrite (Figure 4). These minerals were primarily observed within the host horizon of the Sullivan deposit and were more common in the drill holes that were proximal to the mineralization.

3.3. EPMA Spot and Map Analyses
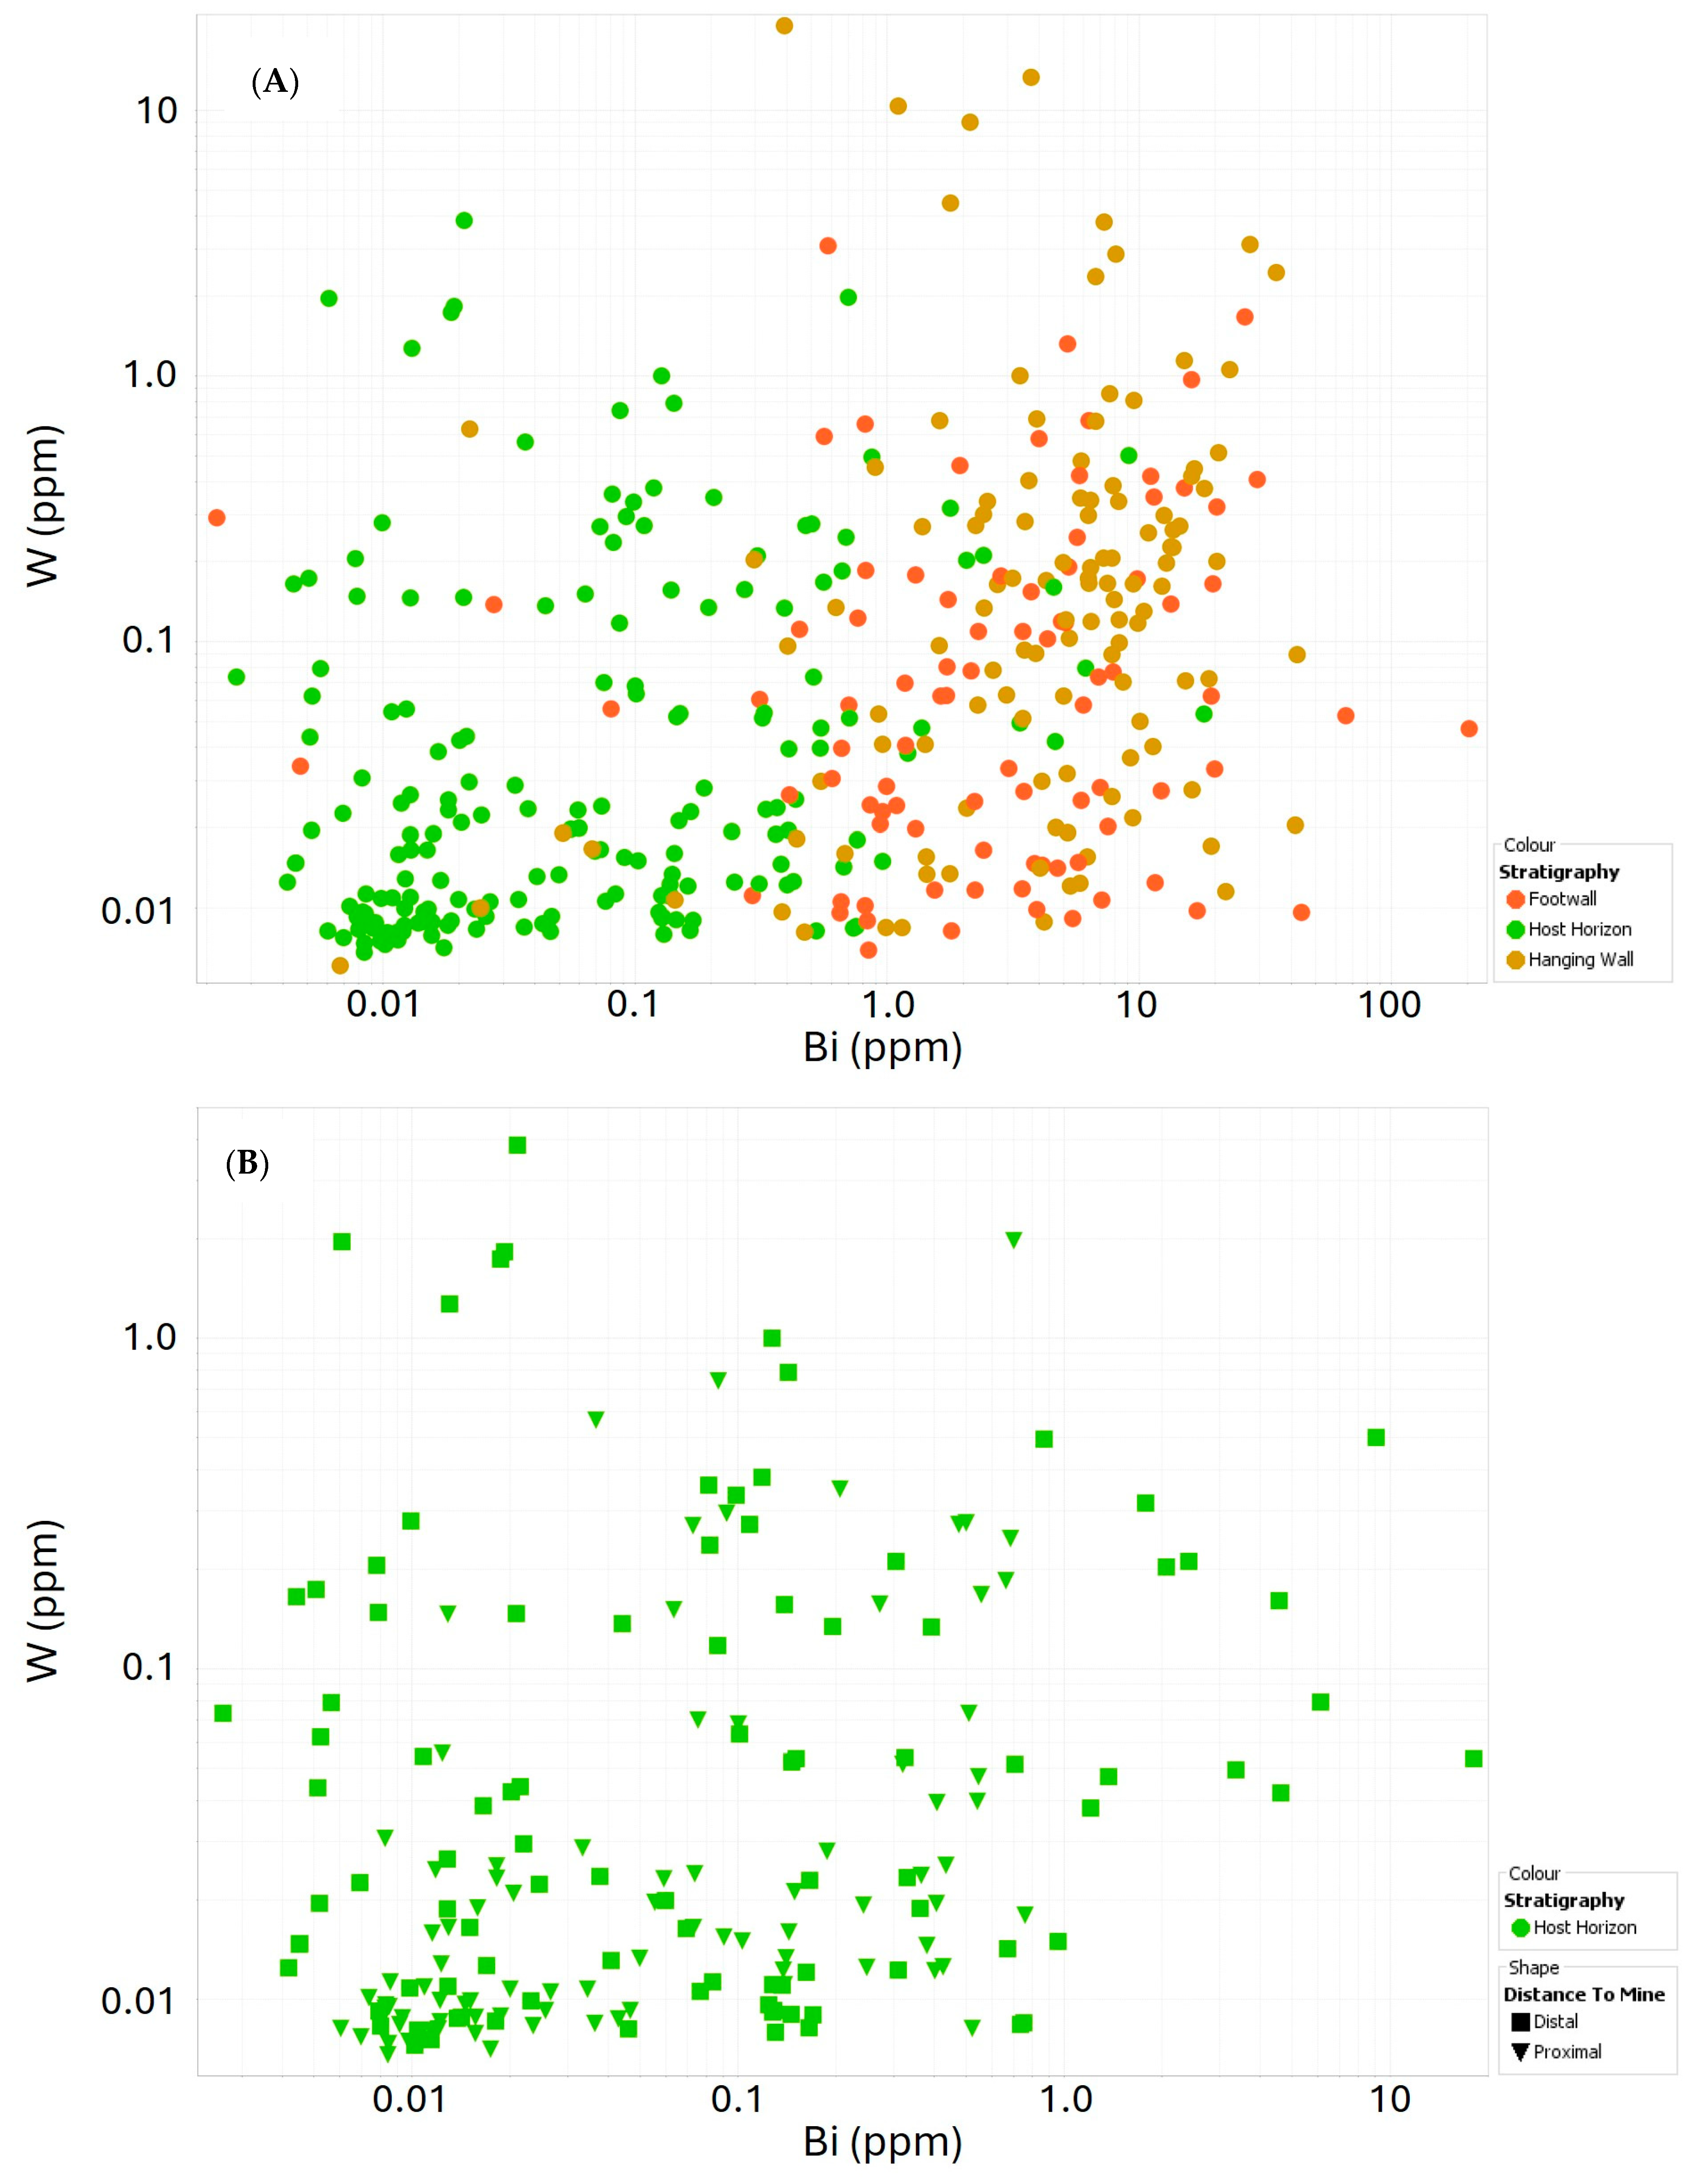
All Fe concentrations were found to be within 3% of one another, so it was determined that the average Fe concentration (60.6 ± 0.6 wt.%) could be used as the internal standard for LA-ICPMS analysis. No clear zoning was identified in the EPMA compositional maps.

3.4. LA-ICPMS

Pyrrhotite trace element concentrations are provided in Supplementary S2 and summaries are provided in Table 3 and Table 4. The pyrrhotite trace element chemistry varies both with the distance to the deposit and with stratigraphic position; however, no systematic change was noted with pyrrhotite texture (Table 5). The Sullivan Deposit’s host horizon generally has lower trace element concentrations (medians of 28.8 ppm Co and 130 ppm Ni), whereas Ni and Co are enriched in the footwall and hanging wall (medians of 338 ppm Co, 697 ppm Ni and 364 ppm Co, 739 ppm Ni, respectively) compared to the host horizon. However, trace elements do not vary systematically between hanging wall and footwall (Figure 5). Only Sb and Ag have slightly higher concentrations (3.7 ppm and 0.45 ppm, respectively) in the host horizon than the footwall (3.5 ppm and 0.34 ppm respectively) and hanging wall (3.1 ppm and 0.28 ppm respectively), although these differences are close to the standard error of the analyses.
Within the host horizon, Co and Ni concentrations in pyrrhotite are higher in distal drill holes (median of 67.1 ppm and 187 ppm, respectively) compared to the concentration of Co and Ni near the deposit (median of 1.1 ppm and 35 ppm, respectively). However, Ag and Pb concentrations are slightly higher closer to the deposit (median of 0.63 ppm, and 26.9 ppm, respectively). W-Bi distributions vary with stratigraphy, Figure 6 shows that there are higher concentrations in the footwall, hanging wall and distal to the deposit, while the host horizon proximal to the deposit has lower amounts of W and Bi.

3.5. Cluster Analysis

Cluster analysis was performed on 390 LA-ICPMS pyrrhotite analyses to determine whether the data, when separated into clusters, correlate with the different stratigraphical positions and different distances to mineralization.

3.5.1. Three Clusters

The data obtained from cluster analysis with three clusters show that clusters 1 and 2 incorporate the datapoints predominantly from the host horizon (56% and 95% respectively; Table 6). There is also a trend of more cluster 1 samples being distal to mineralization (79% of host horizon analyses distal; Table 6) and cluster 2 samples being proximal to mineralization (65% of host horizon analyses; Table 6). Cluster 3 represents almost exclusively (82%) hanging wall or footwall stratigraphy. However, none of the clusters were able to distinguish between footwall and hanging wall (Table 6).

3.5.2. Five Clusters

The first three clusters were predominantly made up of analyses from the host horizon, whereas the other two clusters selected hanging wall and footwall rocks (Table 7). Cluster 1 is predominantly from analyses in the host horizon proximal to mineralization (85% proximal vs. 15% distal). Clusters 1 and 2 are both predominantly from samples distal to mineralization in the host horizon (63% distal, 27% proximal, and 10% not host horizon; 63% distal, 19% proximal, and 19% not host horizon, respectively). Clusters 4 and 5 are predominantly not from the host horizon (90% and 84%, respectively). However, they are not able to distinguish between the footwall and hanging wall as both have similar numbers of analyses from both (56% and 33% for cluster 4 and 36% and 48% for cluster 5, respectively).

3.6. Random Forests

3.6.1. Identification of Stratigraphic Position Based on Trace Element Content

Random forests was applied to determine whether the random forests algorithm can predict stratigraphic position using the pyrrhotite trace element content. Following ten rounds of testing, the random forests algorithm demonstrated a recall of 96% ± 3% in identifying the host horizon (Table 8). It also achieved a recall of 75% ± 14% in predicting the footwall, and a recall of 65% ± 11% in predicting the hanging wall (Table 8). Next, blind testing was conducted on the analyses from drill holes not used in the training of the classifier. After ten iterations, the random forests model provided a recall of 87 ± 3% for the host horizon, and 57% ± 5% for the footwall and 18% ± 5% for the hanging wall (Table 9).

3.6.2. Trace Element vs. Distance

A separate random forest classifier was built to test whether it could be determined if unknown analyses from distal or proximal to mineralization in the host horizon could be distinguished. After ten iterations, the random forests model was shown to have a recall of 93% ± 5% for the distal holes; however, the model was not as effective at predicting the proximal holes, having a recall of 74% ± 12%. However, this may be biased by a lack of test data.

4. Discussion

4.1. Pyrrhotite Trace Elements

Pyrrhotite trace element content was found to be lower in the host horizon of the Sullivan deposit; further, the trace element concentrations are even lower near the zone of known mineralization. The reason for this may be that the other mineral phases co-precipitated with pyrrhotite in the host horizon and trace elements precipitated into other minerals such as galena, sphalerite, chalcopyrite, and pyrite, rather than pyrrhotite. Further, because these other mineral phases are more common in the mineralized zones, the pyrrhotite trace element content is also lower when proximal to mineralization. Cave et al. (2020) showed that chalcopyrite can be enriched in Ni, Ge and Sn, galena can be enriched in Ga, Se, Ag, Sb, Te, Tl and Bi, and sphalerite can be enriched in Mn, Co, Cd, and In; all minerals that are found in Sullivan mineralization [54]. Further, pyrite in SHMS deposits has been shown to be enriched in Ni, Cu, Zn, Mo, Ag, Sb, Tl, and Pb [55]. The potential for metal depletion in pyrrhotite to be due to trace elements being incorporated preferentially into co-precipitating mineral phases is also supported by trace element maps of pyrite in this study showing that Co concentrations are higher in euhedral pyrite than pyrrhotite (Supplementary S1).
It has been suggested that Se is a temperature-sensitive trace element, although there is some disagreement in the literature on how this manifests; for VMS systems, it has been suggested that Se is enriched in pyrite as the direct outcome of an increasing crystallization temperature [56]. However, in a study investigating a range of different ore deposits at different temperatures, the opposite observation was made, where pyrite formed at higher temperatures had lower Se content [57]. If the pyrrhotite investigated in this study is metamorphosed pyrite, it is possible that there would be a temperature dependent relationship with Se concentration in pyrrhotite. If the pyrite proximal to mineralization was more similar to VMS systems (that was later metamorphosed to pyrrhotite) and was affected by the hydrothermal system, it would be expected that the temperature of formation and thus Se content would be elevated compared to diagenetic/syngenetic source pyrite (that was later metamorphosed to pyrrhotite). However, this is contrary to our data, as the higher temperature pyrrhotite, found near mineralization, is also lower in Se, although it does agree with the observations of [57]. The Sb concentration in galena increases further away from the ore body in porphyry, skarn and replacement deposits [58,59,60]. Also, it has been suggested recently that Sb in sphalerite is higher in lower temperature deposits than in higher temperature Zn-Pb deposits [54,61]. Further from the deposit, where there is less galena and sphalerite present, the galena and sphalerite that does precipitate would have a higher Sb content, preventing it from being incorporated into pyrrhotite and resulting in a non-systematic variation in Sb concentration. This may be why Sb in pyrrhotite is not particularly useful in vectoring towards mineralization.
There are several hypothesized origins for the pyrrhotite in sedimentary rocks: metamorphic replacement of pyrite [62]; replacement of anhydrite [63]; direct pyrrhotite precipitation in an alkaline environment [64]; and hydrothermal fluid sources [4,65]. Direct pyrrhotite formation has been found to occur during mid to late diagenesis in areas of relatively low S content and high Fe content; one such diagenetic zone is gas hydrate zones [66]. In sediments where this occurs, the pyrrhotite tends to form in a “speckled pattern” that appears similar to the blebs observed in some of the Sullivan samples, although these tend to form in association with and after pyrite. It is possible that the massive to semi-massive pyrrhotite in the host horizon formed due to the large amounts of Fe released due to the hydrothermal activity [4,65] and the blebby to disseminated pyrrhotite formed due to ferruginous conditions in the basin, possibly due to relict Fe enrichment from the hydrothermal system, coupled with significant amounts of reactive carbon that enables pyrrhotite formation [66].
In the samples observed in this study, no conclusive relicts of pre-existing pyrite were observed, and these would have been expected for sedimentary rocks that originally contained primary pyrite and were metamorphosed to mid greenschist facies [67]. In addition to these textural features, pyrrhotite trace element chemistry may be able to help answer this conundrum, as trace elements content is thought to differ between metamorphosed sedimentary pyrite and direct precipitation of primary pyrrhotite. During metamorphism of pyrite to pyrrhotite, several trace elements (As, Cu, Zn, Sb, Au, Mn, and Te) are released to metamorphic fluids [68,69]. Further, other researchers have argued that pyrite loses all its trace elements during metamorphism to pyrrhotite, except Ni and Co, which may become enriched in pyrrhotite relative to pyrite [70]. Thus, if averages of syngenetic or diagenetic pyrite and metamorphic pyrrhotite in Large et al., 2011 [68] are used, one can approximate the decrease that can be expected in pyrrhotite trace element content compared to the original pyrite (Table 10). This yields hanging wall trace element ratios of Co/Ni = 3.8, Zn/Ni = 0.42, As/Ni = 29.7, and Cu/Ni = 0.07 and footwall trace element ratios of Co/Ni = 3.4, Zn/Ni = 0.05, As/Ni = 878, and Cu/Ni = 2.3. Of these Co/Ni is over the range expected for sedimentary pyrite (0.01–2; [71]); further, both Cu/Ni and As/Ni are very close to the lower boundary (0.01 and 0.1 respectively; [71]) expected for sedimentary pyrite. However, 95% of As analyses and for 83% of Cu analyses were below detection limits, so it is very possible that these two were below what might be expected for sedimentary pyrite. Further, Co/Ni is probably the most useful measure, as these elements are the most retained within pyrrhotite after conversion to pyrite [69]. This suggests that the results for the footwall and hanging wall are inconsistent with metamorphosed sedimentary pyrite, which may support the primary pyrrhotite model for the pyrrhotite in the Belt-Purcell basin. That said, this interpretation should be viewed as preliminary, as it relies on empirical data from a different sedimentary basin that underwent a different metamorphic history than the Belt-Purcell basin, so comparisons may not be valid and must wait for results of controlled experiments.

4.2. K-Means Clustering Analysis

To remove the subjective nature of visual inspection to identify trends in in situ, trace element data K-means clustering was performed on the dataset to determine if natural clustering of the data can identify trends without prior knowledge of where in the stratigraphy or how close to the deposit an analysis originated. Three clusters were able to show that trace element concentrations change based on stratigraphic position and proximity to mineralization. Of the three clusters, one was predominantly from the footwall and hanging wall while the remaining two clusters were from the host horizon, with one being predominantly composed of analyses from samples proximal to the mineralization and the other of analyses distal to the mineralization. Cluster 2 (predominantly host horizon proximal to mineralization) was dominated by samples low in trace elements, especially Co. This suggests that pyrrhotite trace element composition varies between the host horizon compared to the rest of the stratigraphy enough to be used as a vectoring tool or indicator of host rock.
The 5-cluster experiment was able to similarly identify analyses distal to mineralization in the host horizon (2 clusters), proximal to mineralization in the host horizon (1 cluster) and analyses from the non-prospective stratigraphy (2 clusters). Again, this suggests that pyrrhotite composition may be used as an effective way to identify the host horizon stratigraphy and whether a sample from the host horizon is near the mineralization.
One drawback was that neither the 3 nor 5 cluster analyses were able to distinguish the hanging wall from the footwall analyses. This is likely because pyrrhotite trace element content tends to be similar in both the footwall and hanging wall samples. This is not a surprising result because, if formation of this pyrrhotite is due to background sedimentary sulfide formation, it would not be expected that there would be large variations in the pyrrhotite trace element data between the footwall and hanging wall. However, despite this limitation, the fact that cluster analysis of pyrrhotite trace element content provided distinct clusters that are from the unmineralized metasediments, the host horizon distal to mineralization and the host horizon proximal to mineralization suggests pyrrhotite trace element abundance has significant potential for studies into ore deposit vectoring beyond just the Sullivan Deposit.

4.3. Random Forests

The results showed that the random forests algorithm could predict the host horizon of the Sullivan deposit with a high recall (87% ± 3%). However, the algorithm did not perform well at distinguishing between the footwall and the hanging wall because of the similar concentrations of trace elements in pyrrhotite in these units. Additionally, the algorithm was able to predict moderately well (recall of 74% ± 12%) whether unknown analyses were from distal or proximal to mineralization in the host horizon. Although more data are required to construct a robust classifier, these preliminary results suggest that the technique is promising.

4.4. Caveats and Future Work

The pyrrhotite trace element data obtained from six different drill holes are a relatively small dataset for machine learning techniques. As such, the results presented here should be viewed as a proof of concept rather than a fully functional vectoring tool. However, the results outlined here do show promise and should be followed up on. More drill holes should be investigated to expand the number of analyses and test whether the trends identified here continue to other drill holes. Additionally, more drill holes between the current “proximal” and “distal” drill holes should be sampled to see whether there is a progressive increase in trace element content away from mineralization or whether this change in pyrrhotite trace element chemistry is abrupt. There is a suggestion that there may indeed be a transition from proximal to distal. The proximal sample furthest from the known mineralization was 1.3 km from the outline of the ore body. This sample had relatively high Co in the massive pyrrhotite from the host horizon (median of 66.9 ppm in sample from 1.3 km compared to 1.3 ppm in total proximal massive), which is more like that of the >4 km samples (median of mass pyrrhotite of 55.0 ppm). Conversely the Ni in the massive pyrrhotite from the 1.3 km samples are closer to that of the median of massive pyrrhotite for all massive proximal pyrrhotite (73.4 ppm and 35.1 ppm, respectively) whereas the distal massive pyrrhotite has a median of 176 ppm. Further, analysis of other Aldridge sulfidic formation rocks even further away from Sullivan would be useful to determine whether the distal drill holes still are influenced by the Sullivan mineralization. Thus, we can determine whether this could be a true vectoring tool or whether it is a tool more useful in identifying near misses. Future studies should also collect more data from different holes for the random forests algorithm to check if the unknown samples from different stratigraphical positions could be identified. Lastly, a future study should examine a less metamorphosed pyrrhotite dominated deposit to determine whether the same results are observed or whether what is observed at Sullivan is more a function of metamorphism.

5. Conclusions

In this study, we investigated pyrrhotite trace element chemistry by using LA-ICPMS. Trace element concentration was collected from 390 spot analyses on different pyrrhotite samples from the footwall, hanging wall and host horizon, both distal and proximal to mineralization. The results show a change in pyrrhotite trace element concentrations depending on stratigraphic position and the distance from the deposit. This study suggests pyrrhotite trace element chemistry can be used as a vector towards the mineralization in the Belt-Purcell Basin, and potentially other SHMS deposits globally. Ni and Se have the most significant variation with distance to mineralization and stratigraphy, although Co, Ag, W, Bi are also useful. However, it was not possible to distinguish footwall from hanging wall units, since the trace element data were similar, whereas the host horizon shows a significant difference. Further, in this study we show that coupling machine learning techniques with pyrrhotite trace element analyses can be a useful tool for mineral exploration.

Supplementary Materials

The following supporting information can be downloaded at: https://www.mdpi.com/article/10.3390/min15050534/s1, Supplementary S1: Drill logs, rock descriptions and photos for samples used in the study; Supplementary S2: Data file containing LA-ICPMS data and microprobe data of pyrrhotite.

Author Contributions

Conceptualization, D.D.G.; Methodology, N.S.S. and D.D.G.; Validation, N.S.S. and D.D.G.; Formal analysis, N.S.S. and I.M.; Investigation, N.S.S.; Resources, N.S.S., R.K. and K.S.B.; Data curation, N.S.S. and I.M.; Writing—original draft, N.S.S.; Writing—review & editing, N.S.S., D.D.G., I.M., N.R., R.K. and K.S.B.; Visualization, N.S.S.; Supervision, D.D.G.; Project administration, D.D.G.; Funding acquisition, D.D.G. and I.M. All authors have read and agreed to the published version of the manuscript.

Funding

This research was funded by the NSERC discovery grant to Daniel Gregory and the CODES-PY005 pyrite project (I.M.).

Data Availability Statement

All data used in this article are available in the Supplementary Materials.

Acknowledgments

We would like to thank Teck Resources Limited (“Teck”) for providing samples, including shipping some entire drill holes to the University of Toronto for logging. We would like to thank Ayesha Ahmed and Paul Ransom for sending the rock samples and drill cores to the University of Toronto. We would like to thank the sponsors of the CODES-PY005 Pyrite project (2019–2021) that provided the funding for the LA-ICP-MS analyses. We would also like to thank Yanan Liu for helping to carry out electron microprobe analyses. Thanks also to Hehe Jiang for instruction on how to use SILLS software for data reduction. We also thank Murray Allan and Lucas Marshall for valuable suggestions to improve the manuscript.

Conflicts of Interest

Authors Roisin Kyne and Kaleb S. Boucher were employed by Teck Resources Limited while the study was conducted. The remaining authors declare that the research was conducted in the absence of any commercial or financial relationships that could be construed as a potential conflict of interest.

Abbreviations

The following abbreviations are used in this manuscript:
EPMAElectron Probe Microanalyzer
LA-ICPMSLaser Ablation Inductively Coupled Mass Spectrometry
MADMedian Absolute Deviation

References

  1. Belousov, I.; Danyushevsky, L.; Goemann, K.; Gilbert, S.; Olin, P.; Thompson, J.; Lounejeva, E.; Garbe-Schönberg, D. STDGL3, a reference material for analysis of sulfide minerals by laser ablation ICP-MS: An assessment of matrix effects and the impact of laser wavelengths and pulse widths. Geostand. Geoanalytical Res. 2023, 47, 493–508. [Google Scholar] [CrossRef]
  2. Owens, O.E. Sullivan Ore Mineralization. In The Geological Environment of the Sullivan Deposit, British Columbia; Geological Association of Canada, Mineral Deposits Division: St. John’s, NL, Canada, 2000; pp. 523–533. [Google Scholar]
  3. Lydon, J.W. Geology and metallogeny of the Belt-Purcell basin. In Mineral Deposits of Canada: A Synthesis of Major Deposit-Types, District Metallogeny, the Evolution of Geological Provinces, and Exploration Methods; Geological Association of Canada, Mineral Deposits Division: St. John’s, NL, Canada, 2007; Volume 5, pp. 581–607. [Google Scholar]
  4. Goodfellow, W.D. Anoxic Conditions in the Aldridge Basin During Formation of the Sullivan Zn-Pb Deposit: Implications for the Genesis of Massive Sulphides and Distal Hydrothermal Sediments; Geological Association of Canada, Mineral Deposits Division: St. John’s, NL, Canada, 2000; Special Publication 1; Volume 1, pp. 218–250. [Google Scholar]
  5. Campbell, F.A.; Ethier, V.G. Environment of deposition of the Sullivan orebody. Miner. Depos. 1983, 18, 39–55. [Google Scholar] [CrossRef]
  6. Leitch, C.H.B. Preliminary Fluid Inclusions in Barite from the Middle Valley Sulphide Mounds, Northern Juan de Fuca Ridge; Geological Survey of Canada: Ottawa, ON, Canada, 1991; Volume Paper 91-1, pp. 27–30.
  7. Stanton, R.L. Ore Petrology; McGraw Hill: New York, NY, USA, 1972; 713p. [Google Scholar]
  8. De Paoli, G.R.; Pattison, D.R.M. Constraints on temperature-pressure conditions and fluid composition during metamorphism of the Sullivan orebody, Kimberley, British Columbia, from silicate-carbonate equilibria. Can. J. Earth Sci. 1995, 32, 1937–1949. [Google Scholar] [CrossRef]
  9. Hoffman, P.F. Did the breakout of Laurentia turn Gondwanaland inside-out? Science 1991, 252, 1409–1412. [Google Scholar] [CrossRef]
  10. Sears, J.; Alt, D. Impact origin of the Belt sedimentary basin. Geol. Soc. Am. Abstr. Programs 1989, 21, 142. [Google Scholar]
  11. Ross, G.M.; Parrish, R.R.; Winston, D. Provenance and UPb geochronology of the Mesoproterozoic Belt Supergroup (northwestern United States): Implications for age of deposition and pre-Panthalassa plate reconstructions. Earth Planet. Sci. Lett. 1992, 113, 57–76. [Google Scholar] [CrossRef]
  12. Price, R.A.; Sears, J.W. A Preliminary Palinspastic Map of the Mesoproterozoic Belt-Purcell Supergroup, Canada and USA: Implications for the Tectonic Setting and Structural Evolution of the Purcell Anticlinorium and the Sullivan Deposit. In The Geological Environment of the Sullivan Deposit, British Columbia; Geological Association of Canada, Mineral Deposits Division: St. John’s, NL, Canada, 2000; pp. 61–81. [Google Scholar]
  13. Hoy, T. The age, chemistry, and tectonic setting of the Middle Proterozoic Moyie sills, Purcell Supergroup, southeastern British Columbia. Can. J. Earth Sci. 1989, 26, 2305–2317. [Google Scholar] [CrossRef]
  14. Anderson, H.E.; Goodfellow, W.D. Geochemistry and Isotope Chemistry of the Moyie Sills: Implications for the Early Tectonic Setting of the Mesoproterozoic Purcell Basin. In The Geological Environment of the Sullivan Deposit, British Columbia; Geological Association of Canada, Mineral Deposits Division: St. John’s, NL, Canada, 2000; pp. 302–321. [Google Scholar]
  15. Höy, T.; Anderson, D.; Turner, R.J.W.; Leitch, C.H.B.; Lydon, J.W.; Slack, J.F.; Knapp, M.E. Tectonic, Magmatic, and Metallogenic History of the Early Synrift Phase of the Purcell Basin, Southeastern British Columbia; Geological Association of Canada, Mineral Deposits Division: St. John’s, NL, Canada, 2000; pp. 32–60. [Google Scholar]
  16. McMechan, M.E.; Price, R.A. Superimposed low-grade metamorphism in the Mount Fisher area, southeastern British Columbia—implications for the East Kootenay orogeny. Can. J. Earth Sci. 1982, 19, 476–489. [Google Scholar] [CrossRef]
  17. Zirakparvar, N.; Vervoort, J.; McClelland, W.; Lewis, R. Insights into the metamorphic evolution of the Belt–Purcell basin; evidence from Lu–Hf garnet geochronology. Can. J. Earth Sci. 2010, 47, 161–179. [Google Scholar] [CrossRef]
  18. Maxwell, D.T.; Hower, J. High-grade diagenesis and low-grade metamor-phism of illite in the precambrian belt series. Am. Mineral. 1967, 52, 843–857. [Google Scholar]
  19. Reesor, J. Geology of the Lardeau Map-Area, East-Half, British Columbia; Department of Energy, Mines and Resources: East Perth, Australia, 1973; Volume Memoir 369.
  20. Eslinger, E.; Sellars, B. Evidence for the formation of illite from smectite during burial metamorphism in the Belt Supergroup, Clark Fork, Idaho. J. Sediment. Petrol. 1981, 51, 203–216. [Google Scholar]
  21. Doughty, P.T.; Chamberlain, K.R. Salmon River Arch revisited: New evidence for 1370 Ma rifting near the end of deposition in the Middle Proterozoic Belt basin. Can. J. Earth Sci. 1996, 33, 1037–1052. [Google Scholar] [CrossRef]
  22. Anderson, H.E.; Davis, D.W. U–Pb geochronology of the Moyie sills, Purcell Supergroup, southeastern British Columbia: Implications for the Mesoproterozoic geological history of the Purcell (Belt) basin. Can. J. Earth Sci. 1995, 32, 1180–1193. [Google Scholar] [CrossRef]
  23. Rioseco, N.A.; Pattison, D.R.; Camacho, A. Structure, metamorphism, and mica 40Ar/39Ar thermochronology of the southern Purcell anticlinorium and its transition into the central Kootenay arc, Omineca belt, southeastern British Columbia. Can. J. Earth Sci. 2022, 59, 660–707. [Google Scholar] [CrossRef]
  24. Ransom, P.; Lydon, J.W.; Höy, T.; Slack, J.; Knapp, M. Geology, sedimentology and evolution of the Sullivan sub-basin. In The Geological Environment of the Sullivan Deposit, British Columbia; Geological Association of Canada, Mineral Deposits Division Special Publication: St. John’s, NL, Canada, 2000; Volume 1, pp. 440–469. [Google Scholar]
  25. Ransom, P.W.; Merber, D. Low-angle thrusts in the southeast fringe of the Sullivan mine. In The Geological Environment of the Sullivan Pb-Zn-Ag Deposit, British Columbia; Mineral Deposits Division of the Geological Association of Canada: St. John’s, NL, Canada, 2000; Special Publication 1; pp. 534–540. [Google Scholar]
  26. Shaw, D.R.; Hodgson, C.J. Wall-rock alteration at the Sullivan mine, Kimberley, British Columbia. In The Genesis of Stratiform Sediment-Hosted Lead and Zinc Deposits; Turner, R.J.W., Einaudi, M.T., Eds.; Stanford University Publications, School of Earth Sciences: Redwood City, CA, USA, 1986; pp. 13–21. [Google Scholar]
  27. Shaw, D.R.; Hodgson, C.J.; Leitch, C.H.B.; Turner, R.J.W. Geochemistry of albite-chlorite-pyrite and chlorite-pyrrhotite alteration, Sullivan Zn-Pb deposit, British Columbia. Curr. Res. Part A 1993, 93-1A, 109–118. [Google Scholar]
  28. Shaw, D.R.; Hodgson, C.J.; Leitch, C.H.B.; Turner, R.J.W. Geochemistry of tourmaline, muscovite, and chlorite-garnet-biotite alteration, Sullivan Zn-Pb deposit, British Columbia. Curr. Res. Part A: Geol. Surv. Can. 1993, 93-1, 97–107. [Google Scholar]
  29. Turner, R.J.W.; Leitch, C.H.B.; Ross, K.V.; Hoy, T. District-scale alteration associated with the Sullivan deposit, British Columbia, Canada. In The geological Environment of the Sullivan Deposit, British Columbia; Geological Association of Canada, Mineral Deposits Division: St. John’s, NL, Canada, 2000; pp. 408–439. [Google Scholar]
  30. Leitch, C.H.B.; Turner, R.J.W.; Ross, K.V.; Shaw, D.R. Wallrock alteration at the Sullivan deposit, British Columbia, Canada. In The Geological Environment of the Sullivan Deposit, British Columbia; Lydon, J.W., Ed.; Geological Association of Canada, Mineral Deposits Division: St. John’s, NL, Canada, 2000; pp. 633–652. [Google Scholar]
  31. Gregory, D.; Mukherjee, I.; Olson, S.L.; Large, R.R.; Danyushevsky, L.V.; Stepanov, A.S.; Avila, J.N.; Cliff, J.; Ireland, T.R.; Raiswell, R. The formation mechanisms of sedimentary pyrite nodules determined by trace element and sulfur isotope microanalysis. Geochimica et Cosmochimica Acta. 2019, 259, 53–68. [Google Scholar] [CrossRef]
  32. Turner, R.J.W.; Leitch; Delaney, G.D. Syn-rift structural controls on the paleoenvironmental setting and evolution of the Sullivan orebody. In The Geological Environment of the Sullivan Pb-Zn-Ag Deposit, British ColumbiaLydon; Lydon, J.W., Hoy, T., Slack, J.F., Knapp, M.E., Eds.; Mineral Deposits Division of the Geological Association of Canada: St. John’s, NL, Canada, 2000; pp. 582–616. [Google Scholar]
  33. Höy, T.; Jackaman, W. Geology of the St. Mary map sheet (NTS 82F/09), B.C. Ministry of Energy and Mines, Geoscience Map 2004-1. 2004. Available online: https://cmscontent.nrs.gov.bc.ca/geoscience/publicationcatalogue/GeoscienceMap/BCGS_GM2004-01.pdf (accessed on 24 February 2025).
  34. Hoy, T.; Price, R.A.; Legun, A.S.; Grant, B.; Brown, D. Purcell Supergroup, Southeastern British Columbia, Geological Compilation Map (NTS 82G, F, E, 82J/SW, 82K/SE). 1995. Available online: http://webmap.em.gov.bc.ca/mapplace/minpot/bedrock_publications.asp?NTS=082G (accessed on 24 February 2025).
  35. Guillong, M.; Hametner, K.; Reusser, E.; Wilson, S.A.; Günther, D. Preliminary characterisation of new glass reference materials (GSA-1G, GSC-1G, GSD-1G and GSE-1G) by laser ablation-inductively coupled plasma-mass spectrometry using 193 nm, 213 nm and 266 nm wavelengths. Geostand. Geoanalytical Res. 2005, 29, 315–331. [Google Scholar] [CrossRef]
  36. Gilbert, S.E.; Danyushevsky, L.V.; Goemann, K.; Death, D. Fractionation of sulphur relative to iron during laser ablation-ICP-MS analyses of sulphide minerals: Implications for quantification. J. Anal. At. Spectrom. 2014, 29, 1024–1033. [Google Scholar] [CrossRef]
  37. Gilbert, S.E.; Danyushevsky, L.V.; Rodemann, T.; Shimizu, N.; Gurenko, A.; Meffre, S.; Thomas, H.; Large, R.R.; Death, D. Optimisation of laser parameters for the analysis of sulphur isotopes in sulphide minerals by laser ablation ICP-MS. J. Anal. At. Spectrom. 2014, 29, 1042–1051. [Google Scholar] [CrossRef]
  38. Longerich, H.P.; Jackson, S.E.; Günther, D. Laser ablation inductively coupled plasma mass spectrometric transient signal data acquisition and analyte concentration calculation. J. Anal. At. Spectrom. 1996, 11, 899–904. [Google Scholar] [CrossRef]
  39. Guillong, M.; Meier, D.L.; Allan, M.M.; Heinrich, C.A.; Yardley, B.W. Appendix A6: SILLS: A MATLAB-based program for the reduction of laser ablation ICP-MS data of homogeneous materials and inclusions. Mineral. Assoc. Can. Short Course 2008, 40, 328–333. [Google Scholar]
  40. Pettke, T.; Oberli, F.; Audétat, A.; Guillong, M.; Simon, A.C.; Hanley, J.J.; Klemm, L.M. Recent developments in element concentration and isotope ratio analysis of individual fluid inclusions by laser ablation single and multiple collector ICP-MS. Ore Geol. Rev. 2012, 44, 10–38. [Google Scholar]
  41. Lubbe, S.; Filzmoser, P.; Templ, M. Comparison of Zero Replacement Strategies for Compositional Data with Large Numbers of Zeros. Chemom. Intell. Lab. Syst. 2021, 210, 104248. [Google Scholar] [CrossRef]
  42. Thorndike, R.L. Who belongs in the family? Psychometrika 1953, 18, 267–276. [Google Scholar] [CrossRef]
  43. Gahegan, M. On the application of inductive machine learning tools to geographical analysis. Geogr. Anal. 2000, 32, 113–139. [Google Scholar] [CrossRef]
  44. Hastie, T.; Tibshirani, R.; Friedman, J.H. The elements of statistical learning. In Data Mining, Inference and Prediction, 2nd ed.; Springer series in statistics; Springer: New York, NY, USA, 2009; 745p. [Google Scholar]
  45. Kovacevic, M.; Bajat, B.; Trivic, B.; Pavlovic, R. Geological units classification of multispectral images by using support vector machines. In Proceedings of the International Conference on Intelligent Networking and Collaborative Systems, Institute of Electrical and Electronics Engineers (IEEE), Barcelona, Spain, 4–6 November 2009; pp. 267–272. [Google Scholar]
  46. Cracknell, M.J.; Reading, A.M.; McNeill, A.W. Mapping geology and volcanic-hosted massive sulfide alteration in the Hellyer-Mt. Charter region, Tasmania, using Random ForestsTM and self-organising maps. Aust. J. Earth Sci. 2014, 61, 287–304. [Google Scholar] [CrossRef]
  47. Guyon, I. Practical feature selection: From correlation to causality. In Mining Massive Data Sets for Security—Advances in Data Mining, Search, Social Networks and Text Mining, and Their Applications to Security: NATO Science for Peace and Security Series—D: Information and Communication Security; Fogelman-Soulié, F., Perrotta, D., Piskorski, J., Steinberger, R., Eds.; IOS Press: Amsterdam, The Netherlands, 2008; pp. 27–43. [Google Scholar]
  48. Guyon, I. A practical guide to model selection. In Proceedings of the Machine Learning Summer School, Canberra, Australia, 26 January–6 February 2009; p. 37. [Google Scholar]
  49. Congalton, R.G.; Green, K. Assessing the accuracy of remotely sensed data. In Principles and Practices, 1st ed.; Lewis Publications: Boca Raton, FL, USA, 1998; 179p. [Google Scholar]
  50. Breiman, L. Random Forests. Mach. Learn. 2001, 45, 5–32. [Google Scholar] [CrossRef]
  51. Breiman, L. Classification and Regression Trees; Routledge: New York, NY, USA, 1984; 368p. [Google Scholar]
  52. Waske, B.; Benediktsson, J.A.; Árnason, K.; Sveinsson, J.R. Mapping of hyperspectral AVIRIS data using machine-learning algorithms. Can. J. Remote Sens. 2009, 35, 106–116. [Google Scholar] [CrossRef]
  53. Lydon, J.W. A synopsis of the current understanding of the geological environment of the Sullivan deposit. In The Geological Environment of the Sullivan Pb-Zn-Ag Deposit, British Columbia; Lydon, J.W., Höy, T., Slack, J.F., Knapp, M.E., Eds.; Mineral Deposits Division of the Geological Association of Canada: St. John’s, NL, Canada, 2000; pp. 12–31. [Google Scholar]
  54. Cave, B.; Lilly, R.; Barovich, K. Textural and geochemical analysis of chalcopyrite, galena and sphalerite across the Mount Isa Cu to Pb-Zn transition: Implications for a zoned Cu-Pb-Zn system. Ore Geol. Rev. 2020, 124, 103647. [Google Scholar] [CrossRef]
  55. Gregory, D.D.; Cracknell, M.J.; Large, R.R.; McGoldrick, P.; Kuhn, S.; Maslennikov, V.V.; Baker, M.J.; Fox, N.; Belousov, I.; Figueroa, M.C.; et al. Distinguishing ore deposit type and barren sedimentary pyrite using laser ablation-inductively coupled plasma-mass spectrometry trace element data and statistical analysis of large data sets. Econ. Geol. 2019, 114, 771–786. [Google Scholar] [CrossRef]
  56. Grant, H.L.; Hannington, M.D.; Petersen, S.; Frische, M.; Fuchs, S.H. Constraints on the behavior of trace elements in the actively-forming TAG deposit, Mid-Atlantic Ridge, based on LA-ICP-MS analyses of pyrite. Chem. Geol. 2018, 498, 45–71. [Google Scholar] [CrossRef]
  57. Keith, M.; Smith, D.J.; Jenkin, G.R.; Holwell, D.A.; Dye, M.D. A review of Te and Se systematics in hydrothermal pyrite from precious metal deposits: Insights into ore-forming processes. Ore Geol. Rev. 2018, 96, 269–282. [Google Scholar] [CrossRef]
  58. Amcoff, Ö. Distribution of silver in massive sulfide ores. Miner. Depos. 1984, 19, 63–69. [Google Scholar] [CrossRef]
  59. Lueth, V.W.; Megaw, P.K.M.; Pingitore, N.; Goodell, P. Systematic Variation in Galena Solid-Solution Compositions at santa Eulalia, Chihuahua, Mexico. Econ. Geol. 2000, 95, 1673–1688. [Google Scholar] [CrossRef]
  60. George, L.; Cook, N.J.; Cristiana, C.; Wade, B.P. Trace and minor elements in galena: A reconnaissance LA-ICP-MS study. Am. Mineral. 2015, 100, 548–569. [Google Scholar] [CrossRef]
  61. Lee, J.H.; Yoo, B.C.; Yang, Y.S.; Lee, T.H.; Seo, J.H. Sphalerite geochemistry of the Zn-Pb orebodies in the Taebaeksan metallogenic province, Korea. Ore Geol. Rev. 2019, 107, 1046–1067. [Google Scholar] [CrossRef]
  62. Slotznick, S.P.; Winston, D.; Webb, S.M.; Kirschvink, J.L.; Fischer, W.W. Iron mineralogy and redox conditions during deposition of the mid-Proterozoic Appekunny Formation, Belt Supergroup, Glacier National Park. In Belt Basin: Window to Mesoproterozoic Earth; MacLean, J.S., Sears, J.W., Eds.; The Geological Society of America: Boulder, CO, USA, 2016. [Google Scholar]
  63. Hall, A.J. Gypsum as a precursor to pyrrhotite in metamorphic rocks—Evidence from the Ballachulish State, Scotland. Miner. Depos. 1982, 17, 401–409. [Google Scholar] [CrossRef]
  64. Hall, A.J. Pyrite-pyrrhotine redox reactions in nature. Mineral. Mag. 1986, 50, 223–229. [Google Scholar] [CrossRef]
  65. Finlow-Bates, T.; Croxford, N.; Allan, J. Evidence for, and implications of, a primary FeS phase in the lead-zinc bearing sediments at Mount Isa. Miner. Depos. 1977, 12, 143–149. [Google Scholar] [CrossRef]
  66. Larrasoaña, J.C.; Roberts, A.P.; Musgrave, R.J.; Gràcia, E.; Piñero, E.; Vega, M.; Martínez-Ruiz, F. Diagenetic formation of greigite and pyrrhotite in gas hydrate marine sedimentary systems. Earth Planet. Sci. Lett. 2007, 261, 350–366. [Google Scholar] [CrossRef]
  67. Tomkins, A.G. Windows of metamorphic sulfur liberation in the crust: Implications for gold deposit genesis. Geochim. Cosmochim. Acta 2010, 74, 3246–3259. [Google Scholar] [CrossRef]
  68. Large, R.R.; Bull, S.W.; Maslennikov, V.V. A carbonaceous sedimentary source-rock model for Carlin-type and orogenic gold deposits. Econ. Geol. 2011, 106, 331–358. [Google Scholar] [CrossRef]
  69. Thomas, H.V.; Large, R.R.; Bull, S.W.; Maslennikov, V.; Berry, R.F.; Fraser, R.; Froud, S.; Moye, R. Pyrite and pyrrhotite textures and composition in sediments, laminated quartz veins, and reefs at Bendigo gold mine, Australia: Insights for ore genesis. Econ. Geol. 2011, 106, 1–31. [Google Scholar] [CrossRef]
  70. Conn, C.D.; Spry, P.G.; Layton-Matthews, D.; Voinot, A.; Koenig, A. The effects of amphibolite facies metamorphism on the trace element composition of pyrite and pyrrhotite in the Cambrian Nairne Pyrite Member, Kanmantoo Group, South Australia. Ore Geol. 2019, 114, 103128. [Google Scholar] [CrossRef]
  71. Gregory, D.D.; Large, R.R.; Halpin, J.A.; Baturina, E.L.; Lyons, T.W.; Wu, S.; Danyushevsky, L.; Sack, P.J.; Chappaz, A.; Maslennikov, V.V. Trace Element Content of Sedimentary Pyrite in Black Shales. Econ. Geol. 2015, 110, 1389–1410. [Google Scholar] [CrossRef]
Figure 1. Regional geology map of the Belt-Purcell Basin showing known mineral deposits (indicated by star symbols), after [3]. Red rectangle indicates the location of Figure 2.
Minerals 15 00534 g001
Figure 3. Total within-cluster sum of squares versus number of clusters, K. Plot used to determine the optimal number of clusters to use for K-means cluster analysis via the elbow method. Black circles indicate the greatest change in the slow indicating the best cluster to use.
Minerals 15 00534 g003
Figure 4. Different types of sulfide minerals and pyrrhotite textures found in the studied Sullivan samples. (AC), reflected light microscopy; (DI), backscattered electron SEM images. (A) disseminated pyrrhotite; (B) massive pyrrhotite; (C) blebby pyrrhotite; (D) euhedral pyrite in pyrrhotite mass from proximal hole DDH2231, 40 m depth; (E) euhedral pyrite, chalcopyrite in massive pyrrhotite from distal hole DDH6422, 554.2 m depth; (F) euhedral pyrite grains in pyrrhotite mass from proximal hole DDH2827, 308.61 m depth; (G) massive pyrrhotite from distal hole DDH6422, 371 m depth; (H) massive pyrrhotite from proximal hole DDH2827 315.5 m depth; (I) disseminated sphalerite in pyrrhotite mass from proximal hole DDH2827, 310.2 m depth.
Minerals 15 00534 g004
Figure 5. Concentrations of Ni and Co in pyrrhotite with (A) different stratigraphy and (B) distance to the deposit in the Sullivan host horizon. Note co-median detection limits are 0.5 ppm, so analyses below 0.1 ppm are near or below detection limits.
Minerals 15 00534 g005
Figure 6. Concentrations of W and Bi in pyrrhotite with (A) different stratigraphy and (B) distance in the Sullivan host horizon. Note medians of detection limits for W is 0.03 ppm and for Bi is 0.02 ppm so much of the data are below or near the detection limits.
Minerals 15 00534 g006
Table 1. Data used for random forests model.
Number of Analyses
Random forest training (total)250
Random forest training (hanging wall)68
Random forest training (host horizon)124
Random forest training (footwall)58
Number of analyses for training from each horizon50
Number of analyses for blind test140
Table 2. Summary of number of analyses of different pyrrhotite textures from different stratigraphic positions and distance to mineralization.
Stratigraphic PositionProximity to MineralizationDisseminatedBlebbyMassive
Hanging wallProximal2010
Distal184010
Host horizonProximal1 76
Distal 1097
FootwallProximal9236
Distal 5119
Table 3. Median concentrations and median absolute deviation (MAD) of the trace elements in pyrrhotite from different stratigraphical positions.
Stratigraphic HorizonVMnFeCoNiZnSe
(ppm)(ppm)(ppm)(ppm)(ppm)(ppm)(ppm)
Hanging wall (median)0.56.8602,0003386971.28.7
Host horizon (median)0.15.2607,00028.81301.14.4
Footwall (median)1.76.7603,0003647391.19.2
AgSnSbWTlPbBi
(ppm)(ppm)(ppm)(ppm)(ppm)(ppm)(ppm)
Hanging wall (median)0.280.643.10.050.114.72.2
Host horizon (median)0.450.593.70.020.115.80.1
Footwall (median)0.340.793.50.130.121.46.2
VMnFeCoNiZnSe
(ppm)(ppm)(ppm)(ppm)(ppm)(ppm)(ppm)
Hanging wall (MAD)0.46.335001282580.82.7
Host horizon (MAD)0.035.0320029.193.50.72.0
Footwall (MAD)1.65.1520043.61800.81.8
AgSnSbWTlPbBi
(ppm)(ppm)(ppm)(ppm)(ppm)(ppm)(ppm)
Hanging wall (MAD)0.150.192.40.040.0710.22.1
Host horizon (MAD)0.320.133.40.010.0614.90.1
Footwall (MAD)0.210.232.30.120.1012.93.7
Table 4. Median concentrations and median absolute deviation (MAD) of trace elements in pyrrhotite, in the Sullivan host horizon. The data show the proximal and distal drill holes.
Stratigraphic HorizonVMnFeCoNiZnSe
(ppm)(ppm)(ppm)(ppm)(ppm)(ppm)(ppm)
Proximal (median)0.054.7604,0001.1351.22.4
Distal (median)0.095.6609,00067.11871.15.6
AgSnSbWTlPbBi
(ppm)(ppm)(ppm)(ppm)(ppm)(ppm)(ppm)
Proximal (median)0.630.584.30.020.0626.90.06
Distal (median)0.380.603.30.040.0810.50.08
VMnFeCoNiZnSe
(ppm)(ppm)(ppm)(ppm)(ppm)(ppm)(ppm)
Proximal (MAD)0.024.227201.0210.90.5
Distal (MAD)0.065.5275043690.51.8
AgSnSbWTlPbBi
(ppm)(ppm)(ppm)(ppm)(ppm)(ppm)(ppm)
Proximal (MAD)0.410.103.90.010.0427.30.05
Distal (MAD)0.260.233.20.030.0610.50.07
Table 5. Medians of pyrrhotite trace element content from different stratigraphic position pyrrhotite texture and distance to mineralization.
Stratigraphic PositionDistance to MineralizationTextureV (ppm)Mn (ppm)Co (ppm)Ni (ppm)Zn (ppm)Se (ppm)
FootwallDistalBlebby0.829.123637411.228.70
Massive2.394.943618102.358.62
ProximalBlebby3.238.603807482.169.55
Disseminated2.503.523734821.079.29
Massive1.782.073727340.9410.1
Hanging wallDistalBlebby1.2810.74357361.109.66
Disseminated0.584.454306060.8510.4
Massive0.0321.834810704.074.34
ProximalBlebby0.203.3362.276.60.704.99
Disseminated0.591.144056740.708.34
Host horizonDistalBlebby0.0378.298.62600.635.01
Massive0.114.6855.01761.155.71
ProximalDisseminated0.040.120.0210.10.472.06
Massive0.054.881.1335.11.302.40
Ag (ppm)Sb (ppm)W (ppm)Tl (ppm)Pb (ppm)Bi (ppm)
FootwallDistalBlebby0.302.370.090.0617.55.31
Massive0.373.520.210.1221.37.79
ProximalBlebby0.324.220.300.4231.24.19
Disseminated0.664.480.130.3224.16.71
Massive0.353.950.090.1724.45.14
Hanging wallDistalblebby0.282.560.080.0813.51.77
Disseminated0.183.970.060.0723.05.26
Massive0.214.820.040.3234.20.84
ProximalBlebby0.211.420.020.0510.10.01
Disseminated0.453.010.040.0815.04.37
Host horizonDistalBlebby0.590.400.020.026.040.01
Massive0.363.650.040.0913.50.12
ProximalDisseminated0.110.240.010.011.080.01
Massive0.644.320.020.0627.40.06
Table 6. Datapoint distribution of cluster analysis based on pyrrhotite trace element composition. Three clusters scenario. All pyrrhotite LA-ICPMS spot data (n = 390).
Cluster 1Distal (% of Total Analyses in Cluster)Proximal (% of Total Analyses in Cluster)
Hanging wall20 (17%)13 (11%)
Host horizon53 (45%)14 (12%)
Footwall15 (13%)4 (3%)
Cluster 2
Hanging wall04 (5%)
Host horizon29 (33%)55 (63%)
Footwall00
Cluster 3
Hanging wall48 (26%)13 (7%)
Host horizon25 (14%)8 (4%)
Footwall55 (30%)34 (19%)
Table 7. Datapoint distribution of cluster analysis based on pyrrhotite trace element composition. Five clusters scenario. All pyrrhotite LA-ICPMS spot data (n = 390).
Cluster 1Distal (% of Total Analyses in Cluster)Proximal (% of Total Analyses in Cluster)
Hanging wall00
Host horizon7 (15%)39 (85%)
Footwall00
Cluster 2
Hanging wall1 (1%)3 (4%)
Host horizon42 (63%)18 (27%)
Footwall2 (3%)1 (1%)
Cluster 3
Hanging wall2 (3%)7 (11%)
Host horizon39 (63%)12 (19%)
Footwall1 (2%)1 (2%)
Cluster 4
Hanging wall32 (25%)10 (8%)
Host horizon8 (6%)5 (4%)
Footwall40 (32%)31 (25%)
Cluster 5
Hanging wall33 (37%)10 (11%)
Host horizon11 (12%)3 (3%)
Footwall27 (30%)5 (6%)
Table 8. Example of one of the confusion matrices for test data, identifying stratigraphic position.
PredictedTotalRecall
Hanging WallHost HorizonFootwall
ActualHanging wall12241866.7%
Host horizon07317498.6%
Footwall215862.5%
Total 147610100
Precision 85.7%96.1%50%
Table 9. Example of one of the confusion matrices for blind test, identifying stratigraphic position.
PredictedTotalRecall
Hanging WallHost HorizonFootwall
ActualHanging wall60243020.0%
Host horizon25446090.0%
Footwall153325064.0%
Total 235760140
Precision 65.2%94.7%53.3%
Table 10. Potential pyrite trace element content if pyrrhotite was from metamorphic recrystallization of sedimentary pyrite.
Large et al., 2011 Averages [68]Co (ppm)Ni (ppm)Zn (ppm)As (ppm)Cu (ppm)
Sedimentary pyrite22343157.41900155
Pyrrhotite41.35931.280.184.64
Pyrite/pyrrhotite5.400.7344.910,60033.5
Sullivan mean hanging wall pyrrhotite trace element content4298325.71.71.2
Sullivan mean footwall pyrrhotite trace element content3717942.44841
Calculated potential hanging wall pyrite trace element content prior to metamorphism232060725618,00040.2
Calculated potential footwall pyrite trace element content prior to metamorphism2000580108509,0001350
Disclaimer/Publisher’s Note: The statements, opinions and data contained in all publications are solely those of the individual author(s) and contributor(s) and not of MDPI and/or the editor(s). MDPI and/or the editor(s) disclaim responsibility for any injury to people or property resulting from any ideas, methods, instructions or products referred to in the content.

