Article

Multiscale Characterization of Pore Structure and Heterogeneity in Deep Marine Qiongzhusi Shales from Southern Basin, China

1
PetroChina Research Institute of Petroleum Exploration & Development, Beijing 100083, China
2
PetroChina Southwest Oil & Gas Field Company, Chengdu 610051, China
3
School of Resource and Environment, Yangtze University, Wuhan 430100, China
*
Authors to whom correspondence should be addressed.
Minerals 2025, 15(5), 515; https://doi.org/10.3390/min15050515
Submission received: 30 March 2025 / Revised: 21 April 2025 / Accepted: 10 May 2025 / Published: 14 May 2025
(This article belongs to the Section Mineral Exploration Methods and Applications)

Abstract

:
The pore structure of shale is a critical factor influencing the occurrence and flow of shale gas. Characterizing the pore structure and studying its heterogeneity are of paramount importance for a deeper understanding of the laws governing hydrocarbon occurrence, as well as for enhancing the efficiency of exploration and development. This work addresses the complex characteristics of multiscale coupling in the pore systems of shale reservoirs, focusing on the ultra-deep Qiongzhusi Formation shale in the southern region. Through the integrated application of cross-scale observation techniques and physicochemical analysis methods, a refined analysis of the pore structure is achieved. Utilizing field emission scanning electron microscopy imaging technology, the types and morphological characteristics of pores are identified. Additionally, a fluid–solid coupling analysis method employing high-pressure mercury intrusion and low-temperature gas adsorption (CO2/N2) is utilized to elucidate the characteristics of pore structure and heterogeneity while also analyzing the influence of matrix components on these features. The results indicate that the shale of the Qiongzhusi Formation is rich in feldspar minerals, facilitating the development of numerous dissolution pores, with the pore system predominantly consisting of inorganic mineral pores. The full pore size curve of the shale generally exhibits a bimodal characteristic, with a high proportion of mesopores. A strong positive linear relationship is observed between pore volume and specific surface area, whereby larger pore spaces reduce pore heterogeneity, with mesopore volume playing a decisive role. This study provides scientific support for the evaluation and strategic deployment of exploration and development in ultra-deep shale reservoirs of the Qiongzhusi Formation.

Graphical Abstract

1. Introduction

Shale gas is one of the most critical areas in current natural gas exploration and development, playing a significant role in ensuring energy security and promoting economic growth [1,2]. As global shale gas exploration extends into ultra-deep layers (greater than 4500 m), the characterization of marine shale reservoirs has become a central issue in unconventional oil and gas geology research [3,4]. In recent years, China has achieved major breakthroughs in shale gas exploration within the marine deep Ordovician Wufeng Formation and Early Silurian Longmaxi Formation in the Sichuan Basin, marking a new phase in the development of deep shale gas (with burial depths exceeding 3500 m) [5,6]. Although previous studies have explored the pore characteristics of Chinese marine shales such as the Longmaxi Formation, limited work has focused on the multiscale pore heterogeneity of the older Qiongzhusi shale. Moreover, comparing these pore systems with global analogs—such as the organic-rich shales of the Niger Delta—can provide insights into depositional control and diagenetic evolution under different paleoenvironments [7,8]. The Qiongzhusi shale gas represents the oldest stratigraphic layer discovered in global shale gas exploration to date and has demonstrated relatively high test production rates among shale reservoirs [9]. In 2022, the JS103HF well underwent fracturing tests in the silty shale reservoir of the Qiongzhusi Formation in the Cambrian system, yielding a daily shale gas production of 25.86 × 10⁴ m3 [10]. In 2023, the Z201 well, targeting the interior of the Deyang–Anyue rift trough, achieved a gas production of 73.88 × 10⁴ m3 from shale reservoir tests in the Qiongzhusi Formation [11]. This advancement not only expands the scale of shale gas resources in the Sichuan Basin (with preliminary proven reserves exceeding 100 billion cubic meters), marking a rapid progression from the current single shale layer development in the Longmaxi Formation to new layer systems, but also provides significant support for China’s energy security and its ‘dual carbon’ goals [12]. Currently, it is preliminarily considered that the Qiongzhusi Formation shale in the Sichuan Basin has a large continuous reservoir thickness, as well as high total organic carbon content (TOC), porosity, and total gas content, with predicted shale gas resources ranging from 5.69 × 10¹² to 12.71 × 10¹² m3 [13].
Microscopic reservoir spaces, including organic matter pores and microfractures, as well as the connectivity of pore structures and the distribution of pore sizes, directly influence gas storage and seepage capacity, thereby playing a decisive role in the efficiency of shale gas development [14,15,16,17]. Deep shale exhibits significant differences in the evolution mechanisms of pore structures compared to shallow shale due to high temperature, high pressure, and complex diagenetic processes [18]. In high-maturity shale, the transformation of clay minerals results in the formation of nanoscale dissolution pores; however, over-compaction can compress these pore spaces [19,20]. As a typical organic-rich shale formation from the Paleozoic era in South China, the Qiongzhusi Formation’s reservoir space development characteristics directly constrain the mechanisms of shale gas storage and migration [20,21]. Nevertheless, the fine characterization of its microscopic reservoir spaces and the study of its heterogeneity remain relatively weak [22]. Therefore, it is imperative to conduct a detailed quantitative characterization of the reservoir space characteristics of the ultra-deep Qiongzhusi shale formation.
The complexity of the pore structure in shale reservoirs presents significant challenges for their exploration and development [23,24,25]. Due to the diversity of pore types and the wide range of scale distributions, a single characterization technique is inadequate for comprehensively analyzing the multidimensional features of the pore system [26]. Current research, both domestically and internationally, has established a technical system for multitechnique collaborative characterization, enabling refined and quantitative studies of the pore system through multidimensional joint analysis. This includes a range of microscopic imaging technologies that integrate field emission scanning electron microscopy (FE-SEM), transmission electron microscopy (TEM), and polarized light microscopy to construct a cross-scale observation system, encompassing macroscopic pore morphology and microscopic pore wall features [27,28,29]. Additionally, nanoscale three-dimensional reconstruction technology employs nano-CT and atomic force microscopy (AFM) to achieve three-dimensional visualization of the nanoscale pore network and atomic-level resolution characterization of surface topography [30,31,32,33]. Furthermore, fluid intrusion method analysis combines high-pressure mercury intrusion porosimetry to obtain the distribution characteristics of macropores, utilizes low-temperature CO2/N2 adsorption experiments to analyze the adsorption properties of the microporous–mesoporous system, and establishes a comprehensive pore size distribution spectrum [34]. Additionally, fractal theory serves as an effective tool for quantitatively describing and analyzing the heterogeneity of pore structures in shale reservoirs [35]. It is adept at capturing the irregularity and scale invariance of complex pore structures, thereby enabling a more accurate assessment of the heterogeneity differences among shale gas reservoirs [36]. Researchers have introduced the fractal dimension to characterize the roughness of shale pore surfaces, with values ranging from 2 to 3, indicating the transition from smooth to rough pore surfaces and from simple to complex pore structures [37,38]. The Frenkel–Halsey–Hill (FHH) model, which is based on gas adsorption, is currently widely utilized in the study of the fractal characteristics of pore structures in unconventional reservoirs, such as shale and tight sandstone [24,39,40].
This work addresses the complex characteristics of multiscale coupling in the pore systems of shale reservoirs, focusing on the ultra-deep Qiongzhusi Formation shale in the southern region as the research subject. By integrating cross-scale observation methods with physicochemical analysis techniques, it achieves a refined analysis of the pore structure. Based on field emission scanning electron microscopy imaging technology, the types and morphological characteristics of pores are identified. Simultaneously, by employing a fluid–solid coupling analysis method that combines high-pressure mercury intrusion and low-temperature gas adsorption (CO2/N2), it overcomes the scale limitations of traditional single techniques, thereby forming a comprehensive characterization capability that covers the full pore size distribution from micropores to mesopores and macropores. This multidimensional technology integration not only enables precise quantification of pore structure characteristics but also reveals the heterogeneity of pores and the topological connectivity of pore networks, providing a critical scientific theoretical basis for the evaluation and exploration of shale gas reservoirs in the Qiongzhusi Formation.

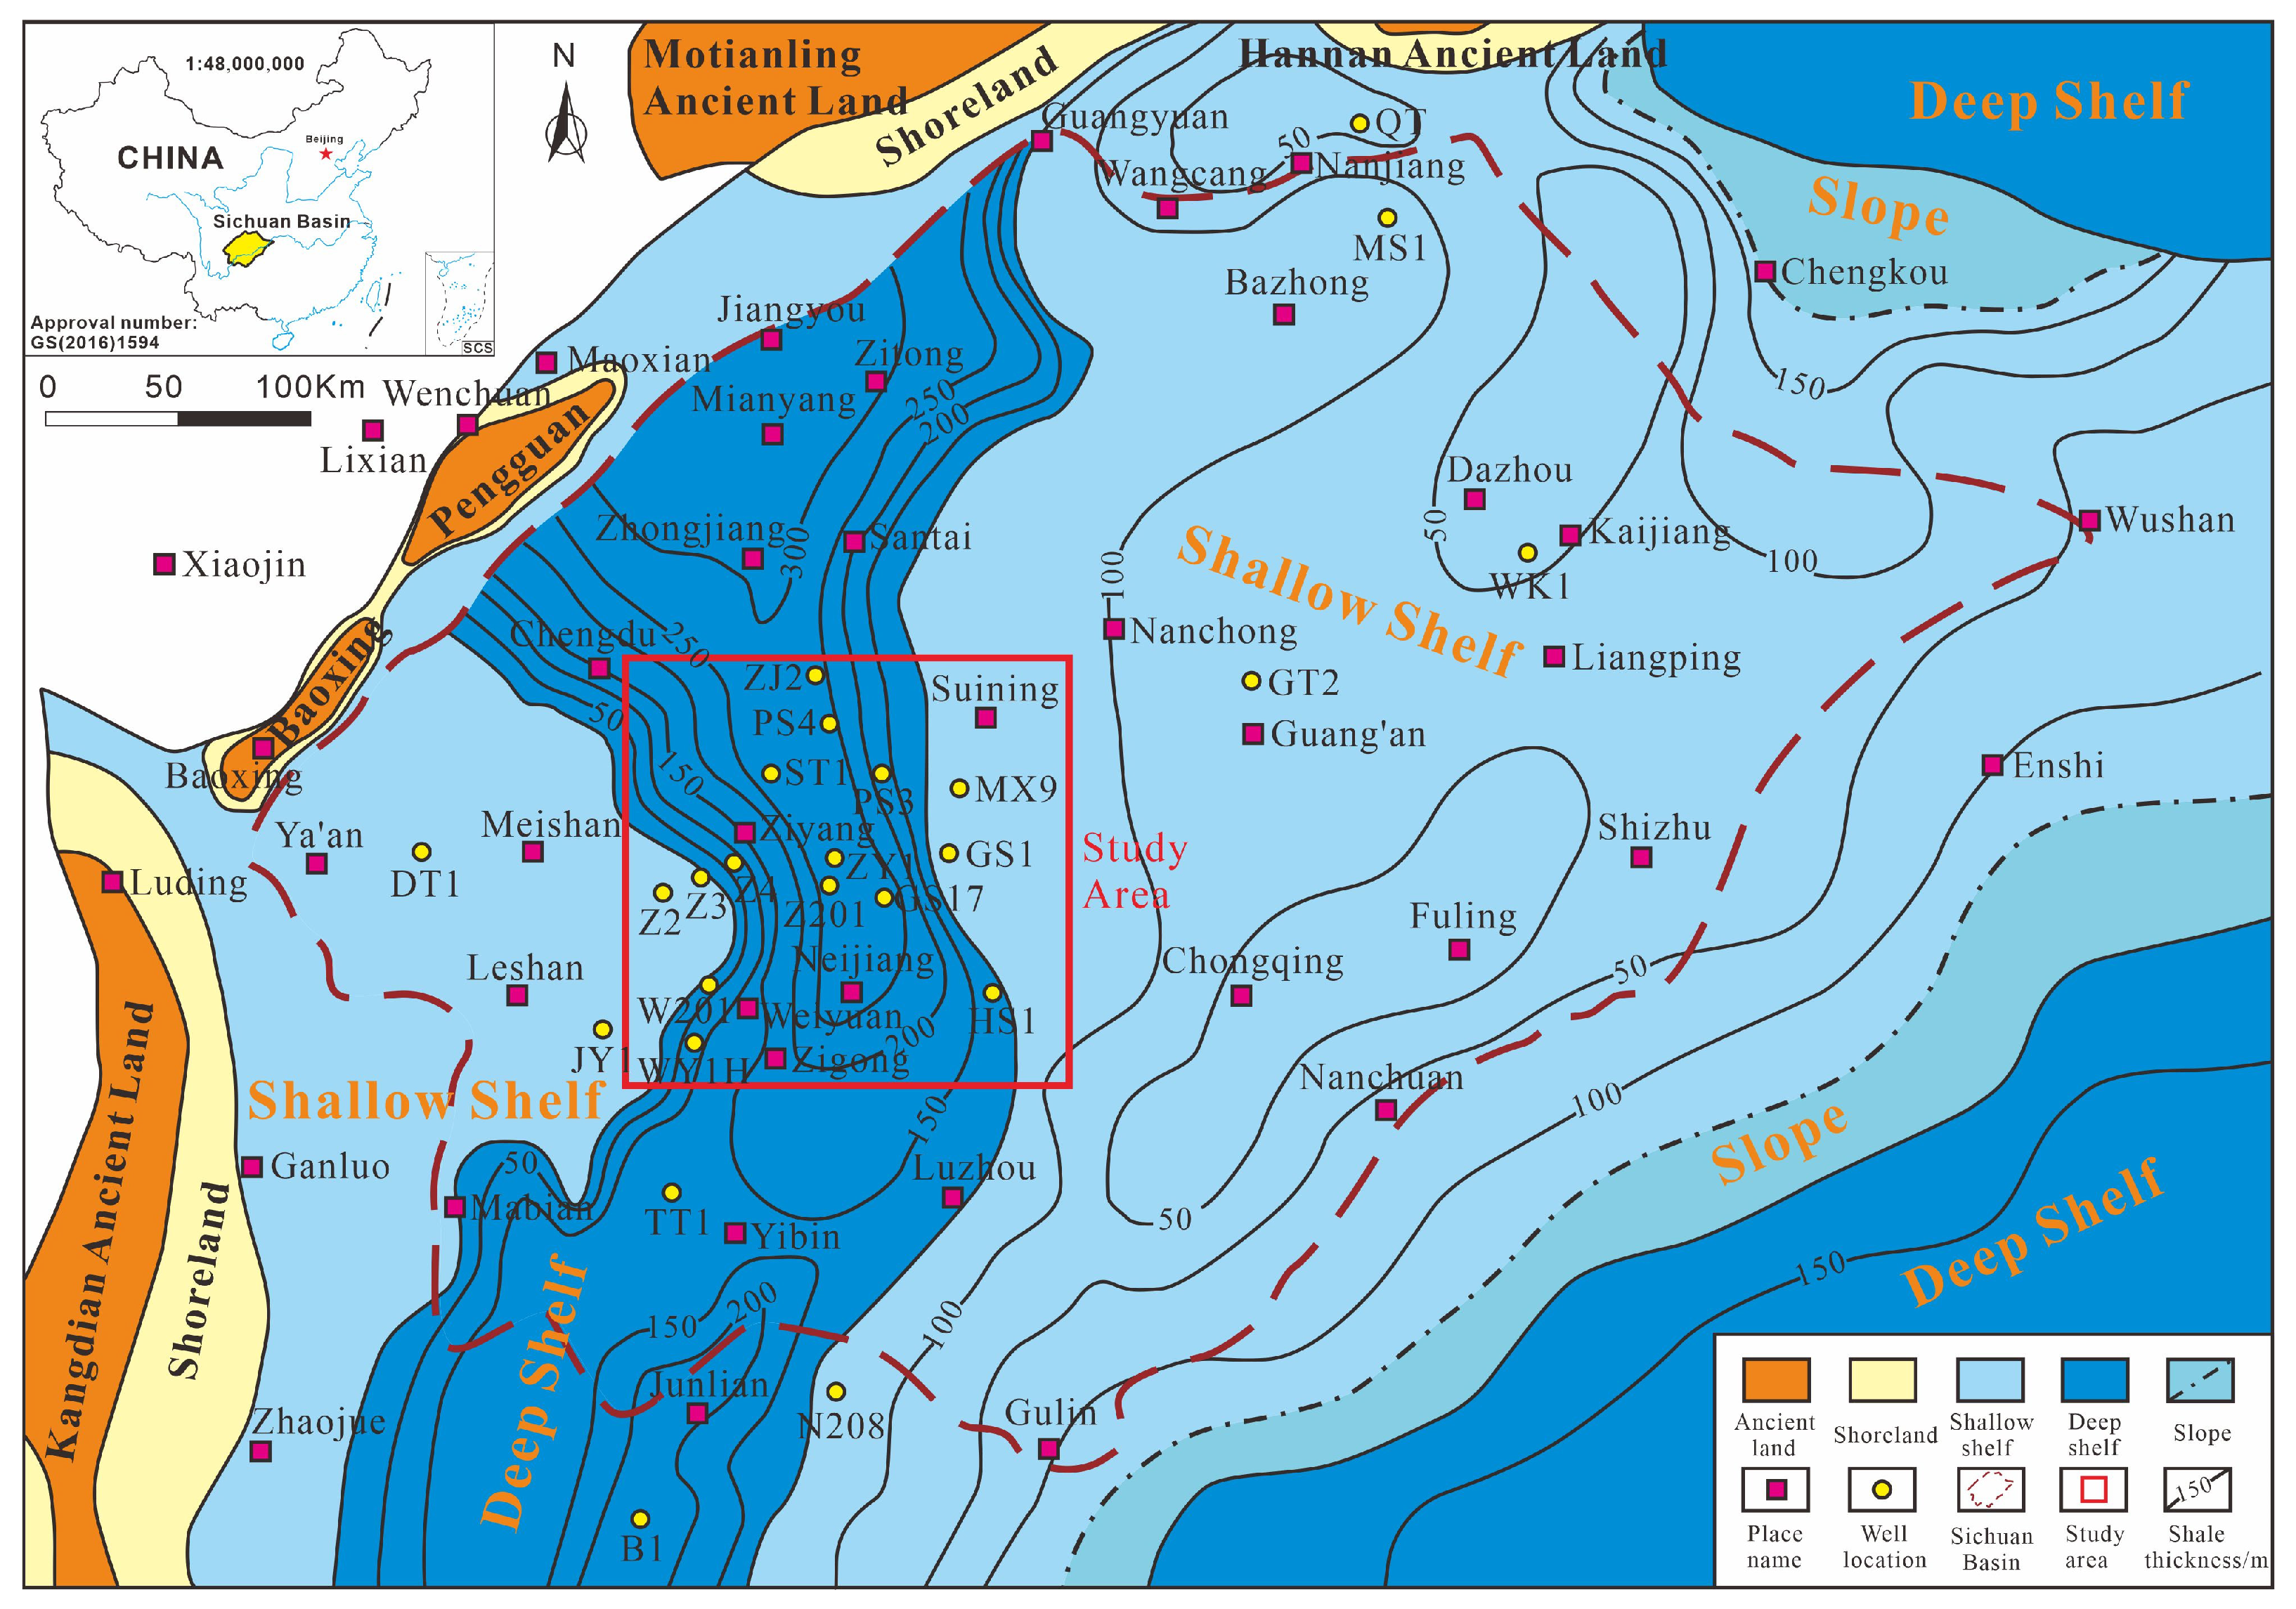
2. Geological Setting

The Sichuan Basin is situated on the eastern periphery of the Qinghai–Tibet Plateau and is geotectonically positioned at the northwestern edge of the Yangtze Plate (Figure 1), encompassing an area of approximately 18 × 104 km² [41,42,43]. This basin is characterized as a superimposed basin that has experienced a complex tectonic evolution. Structurally, it exhibits a rhombic distribution, with its characteristics being governed by numerous deep and extensive faults, resulting in multiple tectonic boundaries and systems [42,43,44,45]. In the context of the Rodinia supercontinent’s breakup during the Neoproterozoic era, the Sichuan Basin was subjected to an extensional tectonic regime [43,44,45,46].
From the late Sinian to the early Cambrian period, the development of the ancient rift trough was influenced by syndepositional faults, persisting until the cessation of extensional activity in the middle Cambrian. During this time, a significant intra-cratonic rift, extending through the central and western regions of the basin with a predominantly north–south orientation and characterized by a “gentle-west and steep-east” profile, was formed [44,45,46]. This rift is referred to as the Mianyang–Changning rift or the Deyang–Anyue rift trough. Within this rift trough, the Qiongzhusi Formation comprises a series of shale deposits.

3. Materials and Methods

3.1. Materials

The samples for this study were procured from the Qiongzhusi shale formation located in the Ziyang region in the south (Figure 1). Within the core area of the Ziyang tectonic belt, part of the southern uplift, a systematic collection of 12 fresh core samples was conducted. These samples were extracted from continuous stratigraphic layers at depths ranging from 4573.41 to 4810.94 m. The samples exhibit a dark gray-black coloration and possess horizontal stratification with occasional pyrite nodules (Figure 2). They were categorized into three distinct types based on their siliceous content: siliceous shale, calcareous shale, and transitional shale. Upon extraction from the core barrel, the samples were sealed with wax and stored under controlled conditions of temperature, humidity, and darkness. Using a QKZ-2000 full-diameter core drilling machine, samples were extracted vertically relative to the bedding plane. Subsequent to pretreatment processes, including cutting, crushing, and acid treatment, various analytical sub-samples were prepared and promptly dispatched to the laboratory for experimental analysis.

3.2. TOC and Mineralogical Experiments

The determination of total organic carbon (TOC) content was conducted using the high-temperature catalytic oxidation–infrared detection method. The samples were ground to 200 mesh and sequentially treated with 10% hydrochloric acid for 48 h to eliminate inorganic carbon interference. Following this, they were rinsed with deionized water until neutral and then dried. A LECO CS844 carbon–sulfur analyzer (LECO, St. Joseph, MI, USA) was employed, with a 1.5 g sample combusted in an oxygen-rich environment at 1350 °C, and the released CO2 gas was quantified using an infrared detector. Calibration was based on the GB/T 19145-2022 standard, utilizing graphite reference material (carbon content 99.95%) for three-point calibration, with the experimental repeatability error controlled within ±0.2 wt.%.
Quantitative analysis of mineral composition was performed using a Rigaku SmartLab X-ray diffractometer (Rigaku Smartlab, Tokyo, Japan) under the Chinese Petroleum and Natural Gas Industry Standard SY/T 5163-2018 “Analysis method for clay minerals and ordinary non-clay mineralsin sedimentary rocks by the X-ray diffraction” [26,27,28]. The sample was ground to 300 mesh and pressed into a pellet for analysis. Cu-Kα radiation (λ = 1.5418 Å) was employed, with a scanning range of 5° to 70° (2θ), a step size of 0.02°, and a scanning rate of 2°/min. Mineral phase identification was based on the ICDD PDF-4+ database, and the relative contents of clay minerals (such as illite and chlorite), quartz, feldspar, and carbonate minerals were calculated using the Rietveld whole-pattern fitting method. To enhance the resolution of clay minerals, oriented sample mounts were subjected to a second scan in an ethylene glycol-saturated environment.

3.3. Scanning Electron Microscopy (SEM)

Sample preparation for argon ion polishing was performed using the Gatan PECS II system, where the sample surface was bombarded with a 5 keV ion beam at an incident angle of 4° for 4 h to achieve an atomically flat cross-section. FE-SEM observations were conducted using a Hitachi SU5000 microscope (Hitachi High-Technologies, Hitachinaka, Japan) equipped with secondary electron (SE) and backscattered electron (BSE) detectors, operating at 5 kV with a beam current of 10 μA, following the Chinese national oil and gas industry standard SY/T 5162-2014 “Analytical method of rock sample by scanning electron microscope” [26,27,28]. The morphology of nanopores (<100 nm) was captured using the Inlens detector (Hitachi High-Technologies, Japan), and the geometric parameters of the pores were analyzed through binarization segmentation and statistical analysis using ImageJ 2.0 software, achieving a spatial resolution of 1.2 nm.

3.4. CO2 Adsorption–Desorption Experiments

Micropore structure analysis was performed using a Micromeritics ASAP 2460 adsorption instrument (Micromeritics, Norcross, GA, USA) at 273 K in accordance with the Chinese national standard GB/T19587-2017 “ Determination of the specific surface area of solids by gas adsorption using the BET method” [26,27,28]. Sample pretreatment involved vacuum degassing at 110 °C for 12 h, with the relative pressure of CO2 (P/P₀) set within the range of 10−5–0.03. The microporous specific surface area and pore size distribution were calculated based on the non-local density functional theory (NLDFT) model, assuming a slit-pore geometry, with a focus on resolving the characteristics of ultra-micropores in the 0.3–1.5 nm range. Experimental data were corrected using the Dubinin–Radushkevich equation to eliminate the effects of surface heterogeneity.

3.5. N2 Adsorption–Desorption Experiments

The mesopore structure was characterized at 77 K using liquid nitrogen temperature with an ASAP 2460 fully automatic specific surface area analyzer, in accordance with the Chinese national standard GB/T19587-2017 [26,27,28]. The relative pressure range was 0.05–0.99, and the BJH (Barrett–Joyner–Halenda) model was employed to calculate the mesopore size distribution in the 2–50 nm range. The BET specific surface area was obtained through linear regression in the 0.05–0.30 P/P₀ interval. First, the shale sample was crushed and sieved to 200 mesh to ensure the uniformity and representativeness of the experiment. Subsequently, the sample was placed in an oven and dried at a specific temperature for a designated period to remove surface-adsorbed moisture and other impurities. Next, the treated sample was positioned in the sample tube of the adsorption instrument, where it underwent vacuum treatment to create a high-vacuum environment, eliminating interference from residual gases. Following this, the adsorption instrument was cooled to liquid nitrogen temperature (77.2 K), and the nitrogen adsorption–desorption experiment was initiated. During the experiment, the nitrogen pressure was gradually increased, and the adsorption amounts at various pressures were recorded until adsorption equilibrium was reached. Subsequently, the pressure was gradually reduced, and the changes in adsorption capacity during the desorption process were recorded.

3.6. High-Pressure Mercury Injection Experiments

Following the Chinese national standard GB/T 29171-2023 “Rock capillary pressure measurement” [26,27,28], a high-pressure mercury intrusion experiment was conducted using the Micromeritics AutoPore IV 9500 system, with a pressure range of 0.1–33,000 psi corresponding to pore sizes of 0.0036–360 μm. Sample pretreatment included drying at 105 °C for 24 h, and the mercury intrusion curve was calculated based on the Washburn equation, assuming a cylindrical pore model, with a contact angle of 140° and a mercury surface tension of 485 mN/m. In high-pressure mercury intrusion experiments, the cylindrical pore model was assumed for calculating the mercury intrusion curve based on the Washburn equation. This assumption simplifies mathematical calculations and is suitable for the statistical analysis of pore size distribution in most macro- and mesoporous materials. A contact angle of 140° was selected, considering that mercury is non-wetting on most solid surfaces; this value falls within the common range and allows for standardized reduction of errors. The surface tension of mercury was taken as 485 mN/m, as this value corresponds to room temperature and helps ensure the stability of the formula. To avoid interference from compression effects, the Liu–Winslow correction model was applied to data at pressures exceeding 10,000 psi.

3.7. Fractal Dimension Calculation

Pfeifer and Avnir introduced a theory of fractal dimensions grounded in the FHH model [47]. This theoretical framework facilitates the organization of data derived from nitrogen adsorption experiments and enables the calculation of fractal dimensions using specific fractal equations, namely, Equations (1) and (2). By plotting ln [ln (P0/P)] against ln(V/V0) and determining the slope, denoted as K, one can employ Equation (2) to ascertain the fractal dimension. Currently, this methodology is extensively utilized for the quantitative characterization of heterogeneity within shale reservoir pore systems [37,38,39,40,48,49].
ln(V/V0) = K ln(ln(P0/P) + C
D = K + 3
In this context, V represents the volume of adsorbed gas at equilibrium pressure P (m3), P0 denotes the saturated vapor pressure (MPa), D is the fractal dimension, and C is a constant.

4. Results

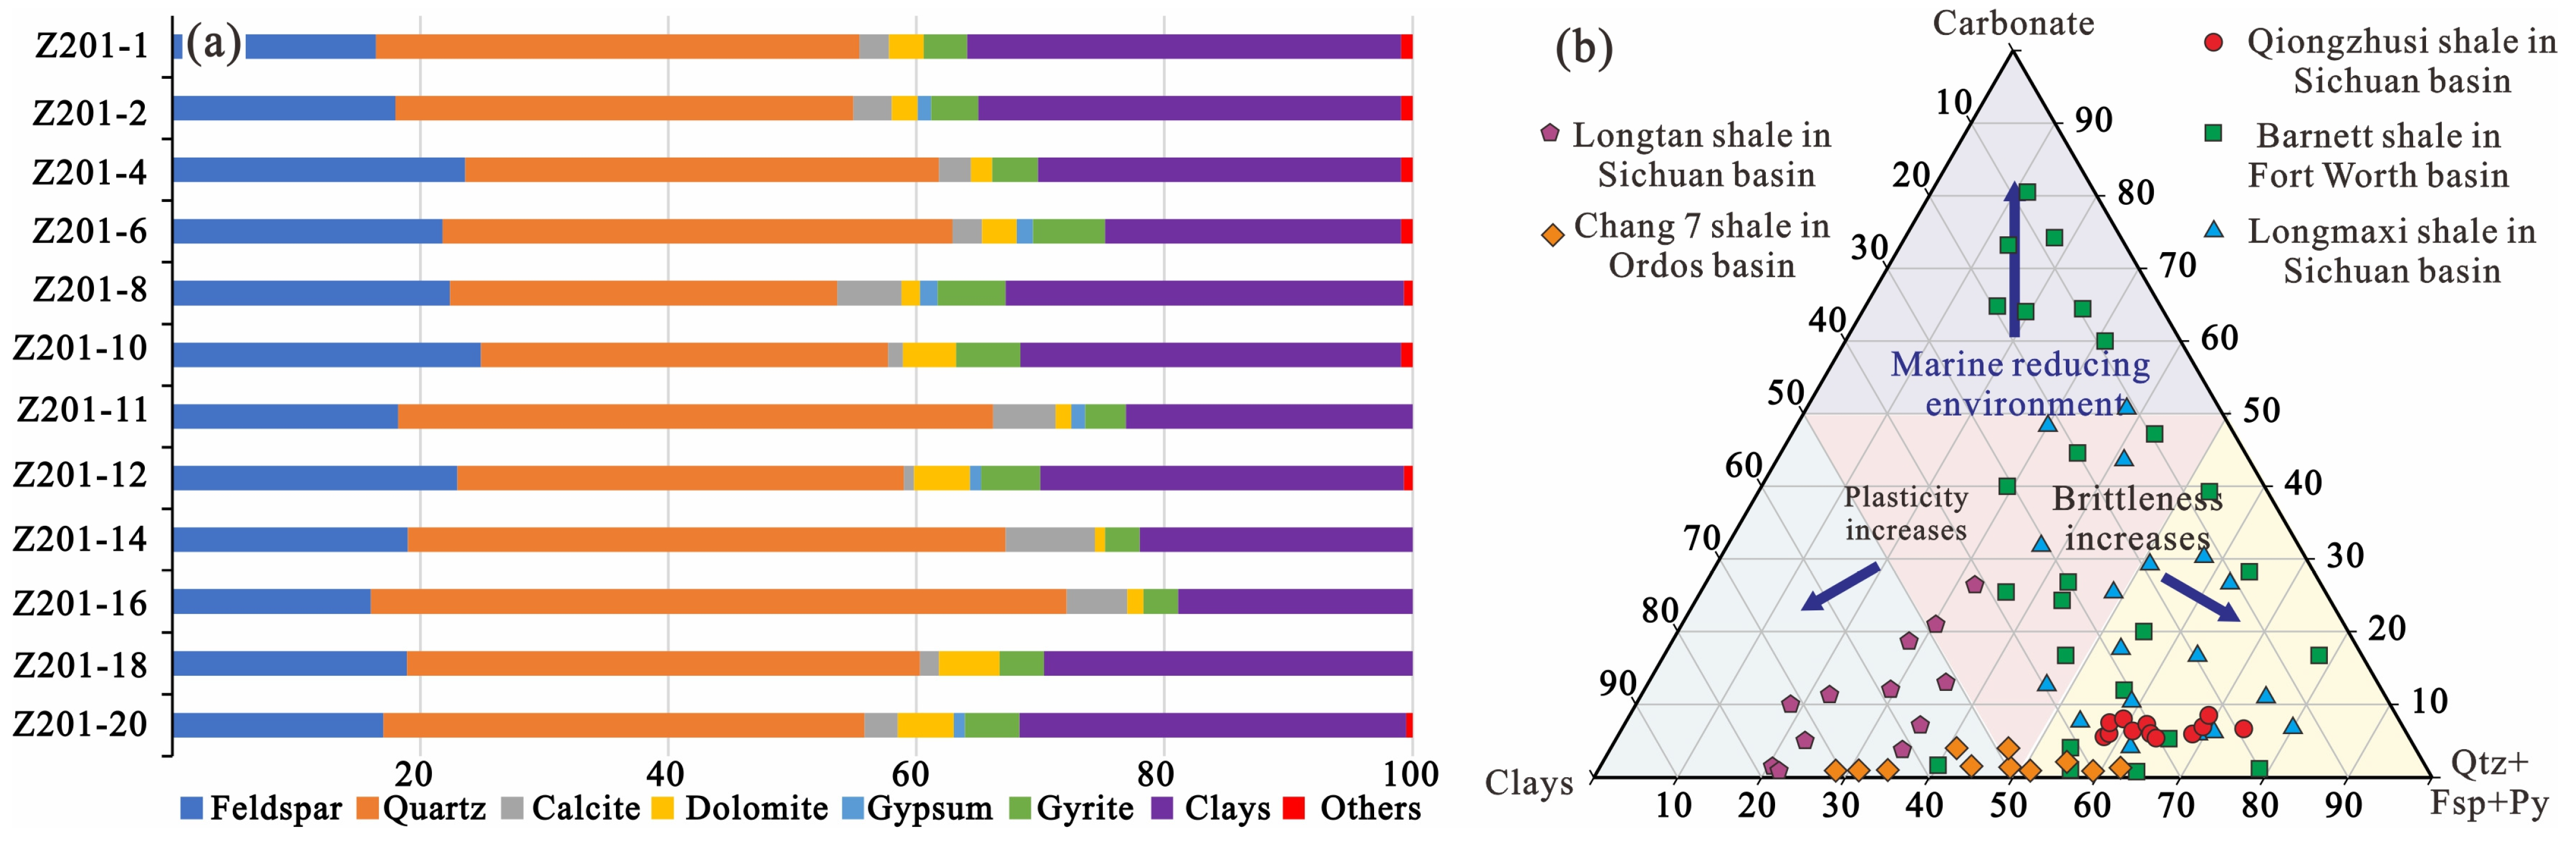
4.1. TOC and Mineralogy

The Qiongzhusi Shales within the Southern Basin is distinguished by its unique organic and mineralogical properties, which are indicative of its depositional and diagenetic history. The TOC content ranges from 1.8 to 5.6 wt.% (mean: 3.9 wt.%), with approximately 65% of samples surpassing the effective threshold for shale gas reservoirs (>2.0 wt.%) (Table 1). This organic enrichment is associated with deep-water anoxic conditions prevalent during the Early Cambrian, where limited bioturbation facilitated exceptional preservation of organic matter, aligning with global models of marine shale deposition. In comparison, the TOC values of the Qiongzhusi Shale exceed those of the Haynesville Shale (1.0–4.5 wt.%) but are lower than those of the Longmaxi Formation (2.5–8.0 wt.%), and this variation is attributed to regional disparities in primary productivity and redox conditions. Mineralogically, the formation is predominantly composed of quartz (38–62 wt.%, average 52 wt.%), with lesser contributions from clay minerals (15–28%, average 21 wt.%) and carbonates (8–24%, average 15 wt.%), while feldspar content is minimal (2–7 wt.%).
The high quartz content, predominantly of biogenic origin as evidenced by microcrystalline textures observed through SEM, enhances the brittleness of the reservoir, with a brittleness index exceeding 0.5, which is a critical factor for the efficacy of hydraulic fracturing. The clay mineral assemblages are primarily composed of illite–smectite mixed-layer varieties, constituting 60%–80% of the total clay content, indicative of moderate thermal maturity stages. In contrast, carbonate phases, such as dolomite and calcite, manifest as authigenic cements that are inversely correlated with TOC, suggesting that carbonate precipitation may dilute organic accumulation. The Qiongzhusi Shale exhibits a higher quartz content than both the Marcellus Shale (average 45%) and the Barnett Shale (average 40%), both of which are more strongly influenced by carbonate platforms, with the carbonate content ranging from 20% to 35%. Conversely, the Longmaxi Shale [46,47] is characterized by a higher clay content (average 30%) and a lower quartz proportion (average 40%, Figure 3), reflecting increased terrigenous input from the weathering of the Yangtze Block.
The analysis of vertical heterogeneity demonstrates a significant correlation between the TOC and quartz content, which supports a synergistic accumulation model. In this model, the production of biogenic silica and the deposition of organic matter were mutually enhanced under euxinic conditions. The regional variability in mineralogy, particularly regarding clay–carbonate ratios (Cov = 0.38), corresponds with paleo-water depth gradients and contrasts markedly with the mineralogical uniformity observed in the Barnett Shale. The heightened heterogeneity of the Qiongzhusi Formation (Shannon index H = 1.8) highlights the importance of employing multiscale reservoir modeling to optimize the identification of sweet spots, which is a challenge that is less significant in more homogeneous shale systems. Collectively, these findings enhance the understanding of deep-marine shale systems by establishing genetic links between depositional environments, diagenetic alterations, and reservoir heterogeneity while also providing a framework for the global comparative analysis of shale gas potential.

4.2. Pore Types and Morphological Characteristics

The shale of the Qiongzhusi Formation is predominantly characterized by inorganic mineral pores, which account for over 60% of its composition. A distinctive feature of this formation is the widespread development of feldspar dissolution pores. Influenced by hydrothermal activity, acidic pore water, and organic acids, potassium feldspar and plagioclase undergo selective dissolution, resulting in the formation of honeycomb-like or tubular secondary pores. The diameters of these dissolution pores predominantly range from 50 to 200 nm and exhibit irregular serrated edges, with dissolution pathways extending along mineral cleavages or fractures, thereby significantly enhancing reservoir permeability. Furthermore, carbonate minerals (such as calcite and dolomite) and siliceous minerals (like quartz) can also develop dissolution pores; however, their scale and degree of modification are less pronounced compared to those of feldspar dissolution pores. Pyrite is sporadically distributed throughout the Qiongzhusi shale, and intergranular pores are frequently formed between pyrite crystals. The content of clay minerals in this shale is relatively low, yet the plasticity of these minerals is stronger, rendering them more susceptible to deformation due to ultra-deep burial compaction. They are tightly bonded with surrounding minerals and organic matter, resulting in complex crumpling that forms interlayer pores and microfractures within the clay mineral layers. The Qiongzhusi shale in the study area has generally experienced ultra-deep burial exceeding 5000 m, with ancient burial depths surpassing 7000 m in certain locations [9,10,11,12]. The organic matter exhibits high maturity (Ro > 3.2%), and the residual pores resulting from hydrocarbon generation from organic matter are significantly influenced by compaction, leading to smaller pore sizes, predominantly less than 30 nm.
During the burial and compaction process, rigid minerals such as feldspar undergo pressure dissolution and fragmentation, resulting in the formation of microparticles with a diameter of less than 10 μm. These particles are in dispersed contact with organic matter, which inhibits the expansion of organic pores through physical compression and chemical adsorption, thereby further enhancing the characteristics of ‘small pore size and high density’ in organic pores. Moreover, the edges of matrix particles facilitate the development of microfractures. In contrast, the typical Longmaxi shale reservoir in the Sichuan Basin exhibits low feldspar content and weak dissolution alteration [46,47]. Its pore system relies more on the open pores formed by the thermal evolution of organic matter, where organic pores are dominant and have larger pore sizes.

4.3. Pore Structure and Pore Size Distribution

The pore structure of the Qiongzhusi shale samples of the Sichuan Basin exhibits a multiscale hierarchical arrangement predominantly characterized by micropores and mesopores (Table 2, Figure 2). CO2 and nitrogen adsorption–desorption experiments indicate that micropores (pore size 50 nm) contribute less to the total pore volume, ranging from 2.1% to 8.6% (average 5.1%). Interlayer pores of clay minerals and secondary dissolution pores contribute additional mesopores, while organic matter serves as the primary source of micropores (Figure 4). In contrast, the pore volume and specific surface area of macropores (>50 nm) are the smallest, measuring between 0.0003–0.0011 cm3/g (average 0.0006 cm3/g) and 0.23–1.75 m2/g (average 0.72%), respectively (Figure 5). The higher mechanical compaction strength (burial depth > 4500 m) and over-mature evolution degree of the Qiongzhusi Formation led to the collapse of macropores and the reduction in organic matter pores.
The pore size distribution curves of micropores, mesopores, and macropores, obtained from combined CO2 and N2 adsorption–desorption experiments and high-pressure mercury intrusion experiments were spliced together to create a comprehensive pore size distribution curve across the full pore size scale (Figure 6). As illustrated in Figure 6, the pore size distributions of different samples exhibit both similarities and differences. The pore size distribution curve for the micropores in the Qiongzhusi Shale predominantly displays a bimodal characteristic, with the portion greater than 10 μm primarily arising from microfractures. Overall, micropores make a significant contribution to the pore volume in the smaller pore size range (approximately 0.1–10 nm), and their pore volume curve is relatively steep within this range, indicating a higher concentration of micropores in the smaller pore size intervals. The pore volume of mesopores (10–100 nm) remains relatively stable, exhibiting minor fluctuations. In the case of macropores (>100 nm), there is a noticeable increase in pore volume at larger pore sizes; however, their overall contribution is not as prominent compared to micropores and mesopores in certain samples. Additionally, samples with varying TOC contents do not display a clear and consistent pattern in pore size distribution, suggesting that the influence of TOC content on the microscopic pore size distribution of the Qiongzhusi Formation shale may be complex and not merely linear.
Compared to the Longmaxi shale in the Sichuan Basin [46,47,50,51,52,53], the Qiongzhusi shale exhibits a reduction in the abundance of micropores and specific surface area due to excessive thermal evolution (over-maturity), which promotes the collapse of organic pores. In contrast, the Longmaxi shale maintains higher organic porosity and mesopore volume, which are associated with moderate maturity (Ro: 2.5%–3.0%) and favorable preservation conditions [46,47,51,52,53]. The pore system of the Qiongzhusi shale is predominantly influenced by inorganic pores (such as clay-related pores and intergranular pores), and despite comparable total porosity, it has lower gas storage potential. These differences highlight the critical role of thermal history and mineral composition in shaping the heterogeneity of shale reservoirs. In terms of micropore distribution, the Longmaxi Formation shale [46,51,52,53,54] may exhibit micropore concentration areas similar to those of the Qiongzhusi shale samples; however, the specific pore volume values may differ, which could be related to their distinct sedimentary environments and types of organic matter. Regarding the mesopore section, the variation trend of mesopore volume in the Longmaxi shale might differ somewhat from that of the Qiongzhusi shale, reflecting differences in the development degree and connectivity of medium-scale pores between the two shale formations. In the macropore region, the contribution ratio of macropores to the overall pore volume in the Longmaxi shale may vary from that of the Qiongzhusi shale, which could influence the shale’s permeability and fluid storage capacity.
The Longmaxi Formation, Barnett in North America, Woodford, Haynesville, and Marcellus Shale have many similarities in pore structure, with well-developed organic matter pores [14,15,16,17]. The Longmaxi Formation and Qiongzhusi Formation shales are both deposited in deep-sea environments; in contrast, the Niger Delta represents a deltaic offshore environment [7,8]. In the Niger Delta, shallow burial results in weaker diagenesis, with intergranular and moldic pores predominating [7,8]. Conversely, in the Longmaxi [46,51,52,53,54] and Qiongzhusi shales, deeper burial and thermal maturity led to a dominance of organic matter and microfracture systems. Additionally, although both the Longmaxi shale [46,51,52,53,54] and the Qiongzhusi shale are classified as deep-water deposits, significant differences exist in their mineral compositions. The Qiongzhusi shale contains a higher proportion of brittle minerals, such as feldspar, which results in a significantly greater presence of inorganic mineral pores compared to organic pores. Moreover, feldspar, which is susceptible to pressure dissolution, contributes to the formation of well-connected conductive fractures.

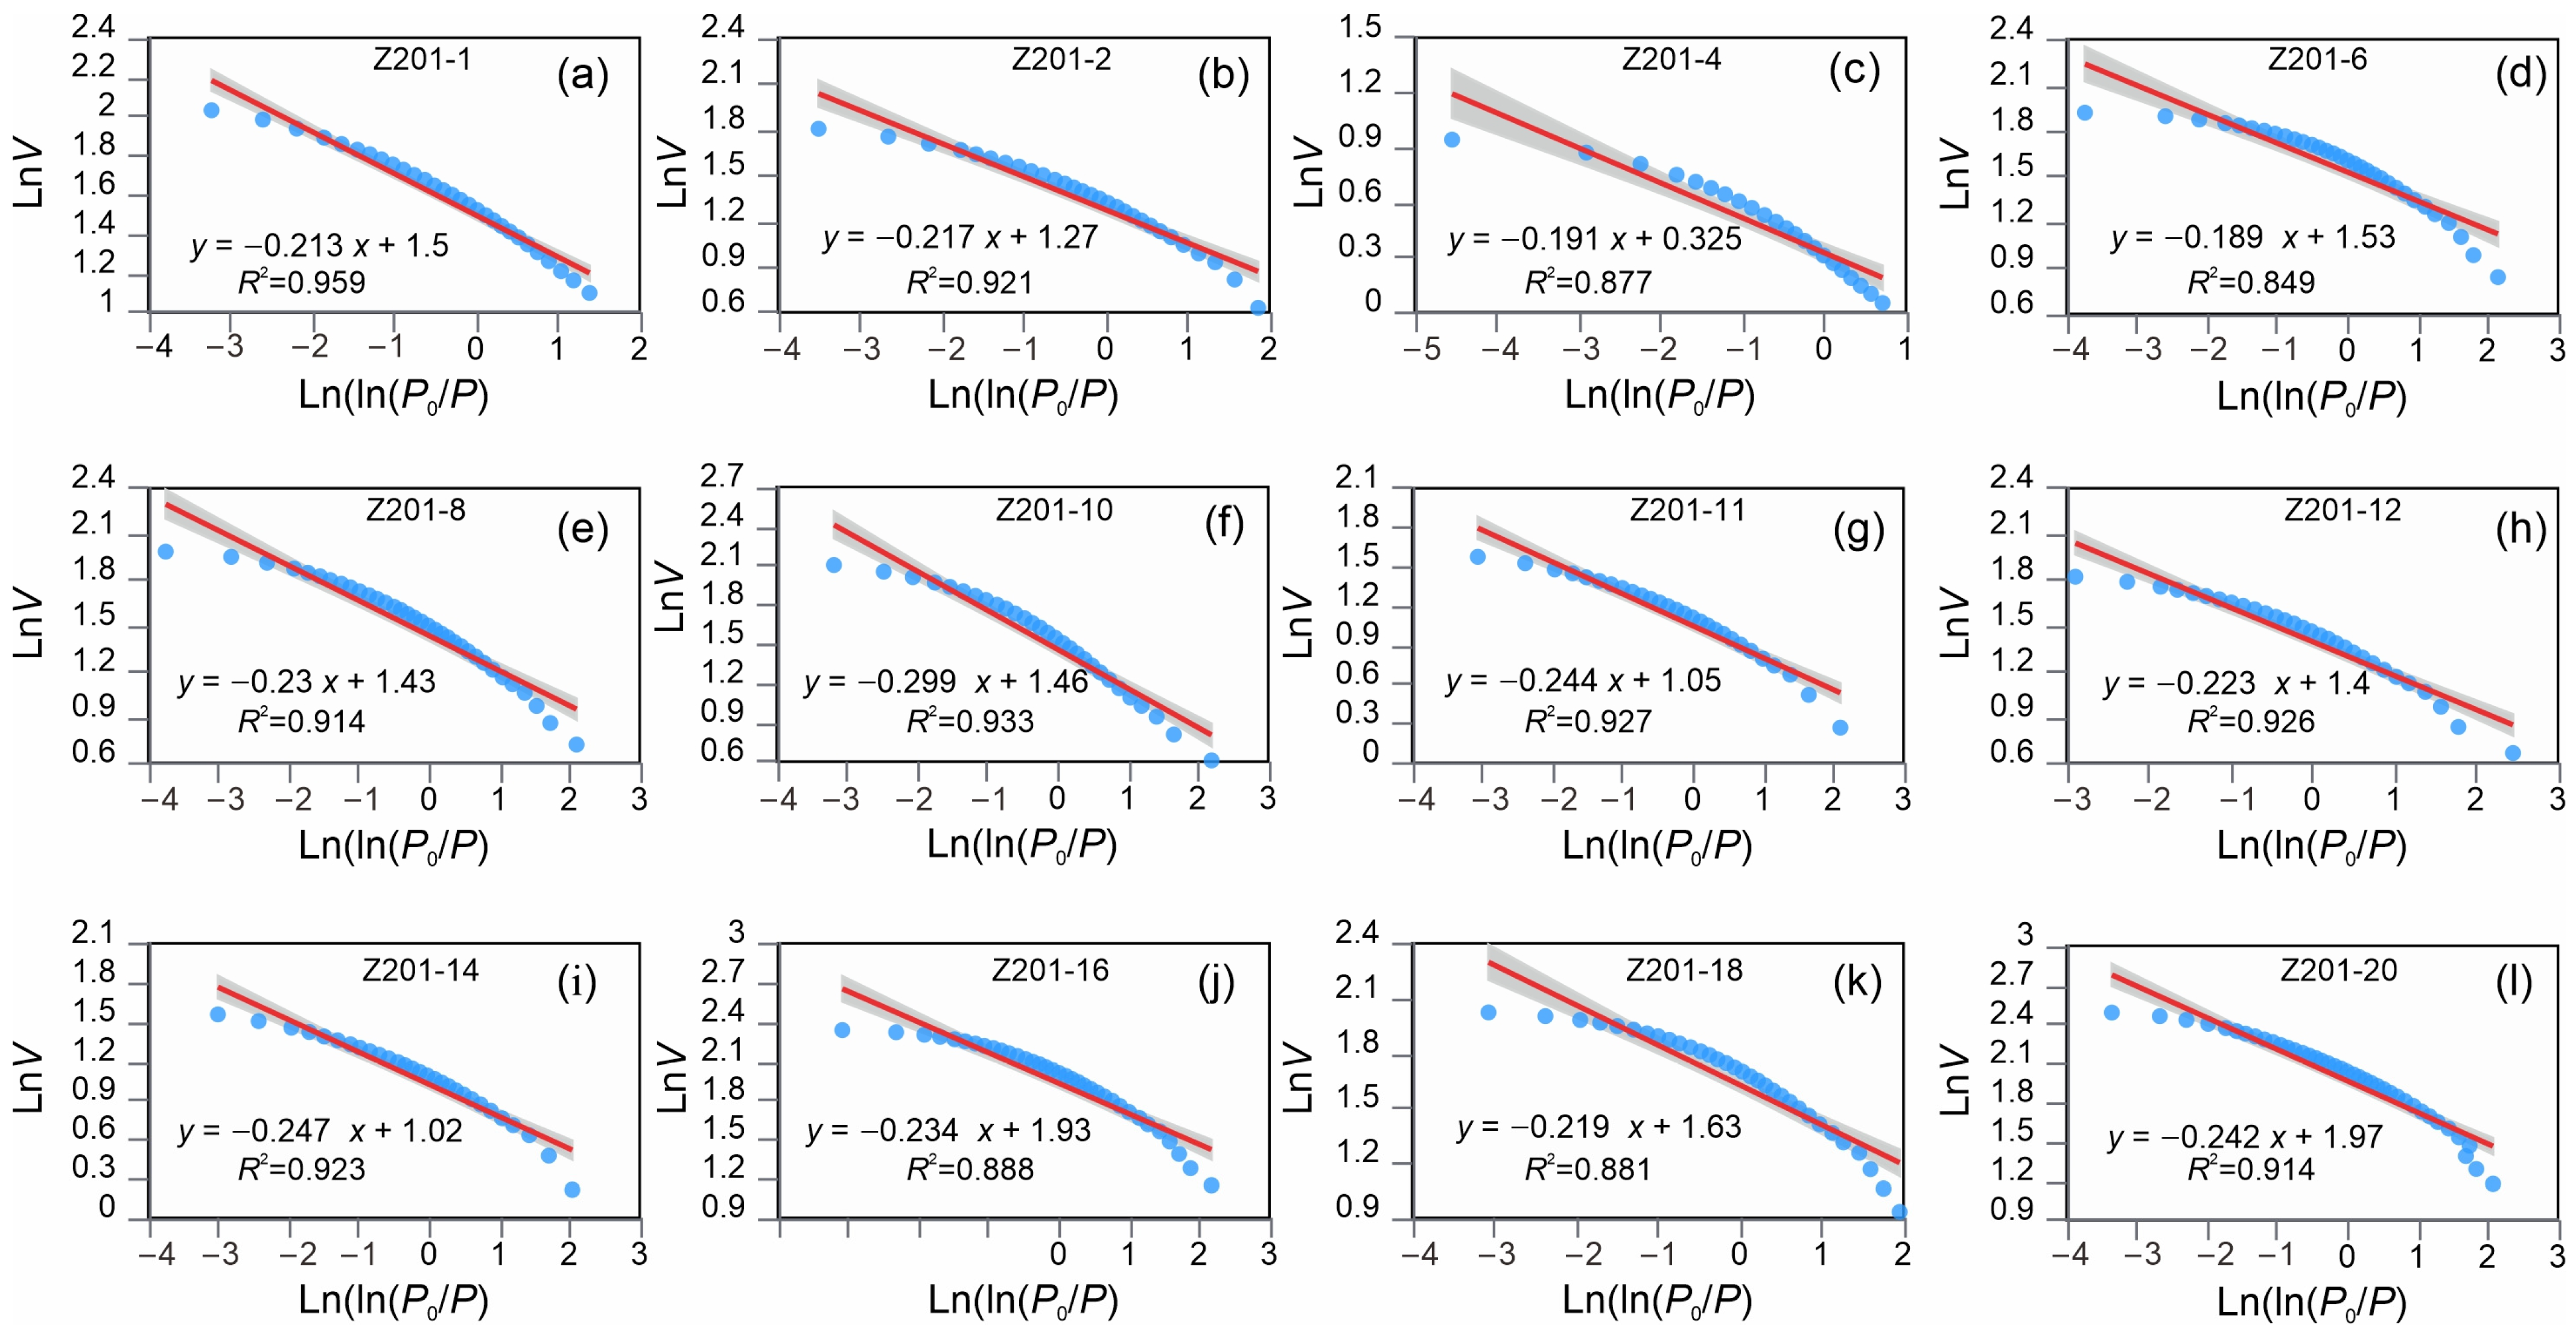
4.4. Fractal Dimensions

This study is based on the theoretical calculation method of the fractal dimension as applied to the FHH model. The relationship curve (Figure 7) was derived from the experimental data on nitrogen adsorption of shale samples, and the fractal dimension of these samples (Table 3) was obtained from the slope. The linear fitting of each curve in Figure 7 reveals that the correlation coefficient R2 for most samples exceeded 0.84. This indicates that, under the experimental conditions and analysis methods employed in this study, the nitrogen adsorption data align well with the FHH model, and the fractal dimensions calculated based on this model possess a certain degree of reliability. In this study, the fractal dimension values of the shale samples from the Qiongzhusi shale range from 2.701 to 2.811 (average 2.775), which are higher than those of the Longmaxi shale in southern Sichuan (average 2.65). This suggests that the pore structure of the Qiongzhusi shale is more complex and heterogeneous. As illustrated in Figure 4 and Figure 6, the Qiongzhusi shale displays a variety of pore types across a wide range of scales. Furthermore, the shale reservoir has undergone multiple stages of tectonic evolution, which has increased the heterogeneity of the pores and enhanced the fractal characteristics of the pore structure.

5. Discussion

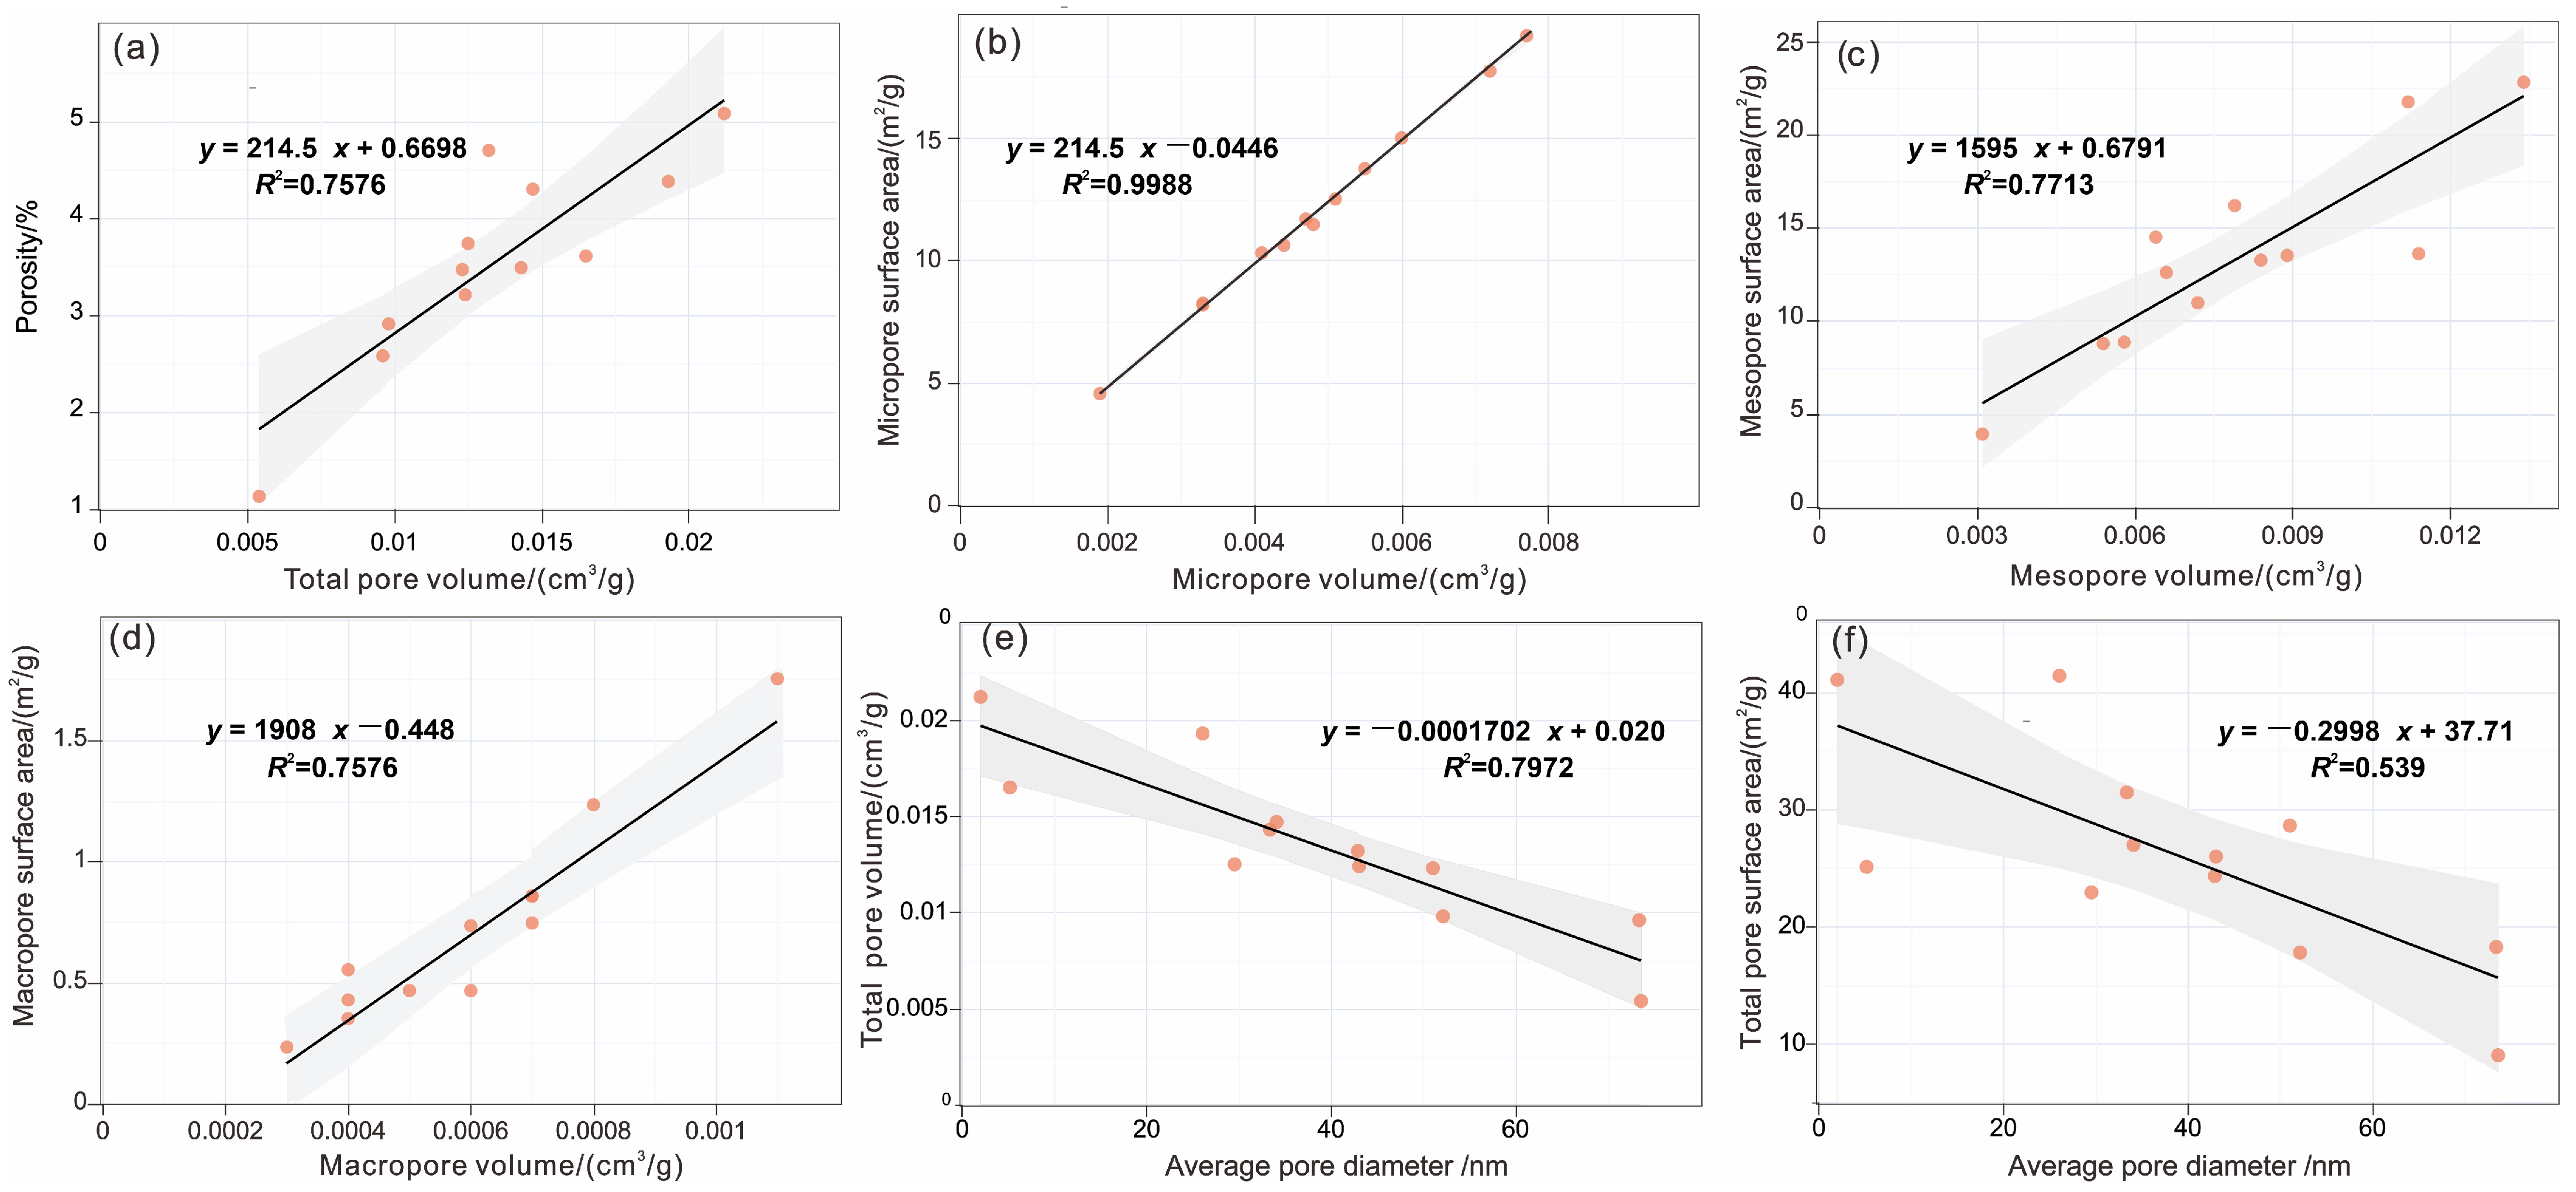
5.1. The Coupling Mechanism Between Pore Structure Parameters

Figure 8 illustrates the relationship between the pore structure parameters of shale samples from the Qiongzhusi Formation in the southern Sichuan Basin. The figure reveals a significant linear relationship between total porosity and total pore volume, with a fitting coefficient R2 of 0.757, an F-statistic of 31.15, and a p-value of 0.0002. This indicates that the total pore volume contributes significantly to total porosity; as the total pore volume increases, the total porosity also increases correspondingly. The linear relationship between micropore specific surface area and micropore volume is even more pronounced, with an R2 as high as 0.9988. This suggests that micropores of Qiongzhusi shale greatly contribute to the specific surface area, and variations in micropore volume can effectively explain the changes in micropore specific surface area. Additionally, the mesopore specific surface area exhibits a linear correlation with mesopore volume (R2 = 0.7713), indicating that mesopore volume is a key factor influencing mesopore specific surface area. Similarly, the macropore specific surface area demonstrates a linear relationship with macropore volume (R2 = 0.8616), highlighting the significant role of macropores in the pore structure of shale. As shown in Figure 8e,f, the increase in average pore size correlates with a linear decrease in both total pore volume and total specific surface area, with fitting coefficients of 0.797 and 0.539, respectively. This phenomenon indicates that larger diameter pores do not primarily contribute to pore volume; rather, smaller pores have a greater pore volume and specific surface area, which are advantageous for the storage and enrichment of shale gas.
The Longmaxi shale in the southern Sichuan region typically exhibits a high organic matter content, with its pore structure formation significantly influenced by the thermal evolution of organic matter [46,47,51,52,53]. The development of micropores and mesopores is closely linked to hydrocarbon generation from this organic matter. Although the shale of the Qiongzhusi Formation is also influenced by organic matter, it differs from the Longmaxi shale in terms of mineral composition and sedimentary environment [46,47,51,52,53]. Correlation analysis of pore structure parameters indicates that the slope and intercept of the relationship between porosity and pore volume in the Longmaxi shale may differ from those in the Qiongzhusi shale, reflecting variations in the mechanisms and controlling factors of pore formation. In terms of micropore structure, the specific type and maturity of organic matter in the Longmaxi shale may lead to differences in the degree of micropore development and the contribution ratio of specific surface area compared to the Qiongzhusi Formation. Furthermore, the development of mesopores and macropores in both shale formations, along with their contributions to the overall pore structure, may also vary. These differences could further influence the gas storage and migration properties of the two shale groups, highlighting the need for more in-depth comparative studies to accurately quantify these effects. Identifying the pore structure characteristics of pores at different scales is of great significance for fine reservoir evaluation, resource assessment, and optimal selection of favorable reservoirs.

5.2. The Influence of Heterogeneity on Pore Structure

Figure 9 illustrates the relationship between the fractal dimension D of the pores in the Qiongzhusi shale and various pore structure parameters. As shown in Figure 9a, the micropore volume exhibits a weak positive linear relationship with the fractal dimension D, with a fitting coefficient (R2) of 0.3818, a tau value of 0.3333, and a p-value of 0.1526. In contrast, the mesopore volume demonstrates a strong correlation with the fractal dimension D, with a fitting coefficient of 0.6899, a tau value of 0.7273, and a p-value of 0.0004989 (Figure 9b). The correlation coefficient between the macropore volume (Figure 9c) and the fractal dimension D is 0.06032, indicating a weak correlation, with a tau value of 0.03077 and a p-value of 0.8904. The fitting coefficient between the total pore volume (Figure 9d) and the fractal dimension D is 0.662, with a tau value of 0.7273 and a p-value of 0.0004989, indicating a strong correlation. These results suggest that the mesopore and total pore volume of the Qiongzhusi shale are significantly influenced by the fractal dimension D, while the microporosity and macropore volumes are relatively less affected.
Compared to the Longmaxi Formation shale in the Sichuan Basin, the Qiongzhusi Formation shale exhibits notable differences in the relationship between pore fractal dimensions and pore structure parameters. In the Longmaxi shale [46,52,53,54], the correlation between micropore volume and fractal dimension appears to be stronger, which may be attributed to the unique sedimentary environment and mineral composition of the Longmaxi shale, which facilitate the development of micropore structures with specific fractal characteristics. Although the Qiongzhusi shale also demonstrates a strong correlation between mesopore and total pore volumes and the fractal dimension, there are variations in the specific fitting parameters when compared to the Longmaxi Formation shale, highlighting differences in pore heterogeneity and structural characteristics between the two formations. The correlation between macropore volume and fractal dimension in the Longmaxi shale may be more pronounced than in the Qiongzhusi shale, potentially due to the different geological processes that the Longmaxi shale experienced during diagenesis, which led to distinct mechanisms of formation and evolution of macropores compared to those in the Qiongzhusi shale.

5.3. Compositional Controls on Pore Structure

As illustrated in Figure 10, the porosity of the Qiongzhusi Formation shale exhibits a weak positive correlation with the TOC (R2 = 0.4695). This suggests that the abundance of organic matter contributes minimally to pore development, potentially being influenced by variations in organic matter type and maturity. The high degree of thermal evolution (Ro > 3.0%) has led to the general underdevelopment of organic matter pores within the Qiongzhusi shales [9,10,11], which contrasts with the high TOC and abundant organic pores found in the Longmaxi Formation [46,51,52,53]. Regarding the mineral composition, the correlation between brittle minerals (such as quartz and feldspar) and porosity is weak (R2 = 0.098–0.012), indicating that their mechanical support is impeded by subsequent diagenetic transformations. Conversely, carbonate minerals (R2 = 0.2616) and clay minerals (R2 = 0.5786) demonstrate significant negative correlations with porosity, reflecting pore filling due to carbonate cementation and the damage to pores resulting from the plastic deformation of clay minerals under compaction [46,52,53,54,55]. The weak correlation between pyrite and porosity (R2 = 0.015) may be attributed to its dispersed occurrence and limited contribution to pore development.
Compared to the Qiongzhusi Formation, the Longmaxi Formation shale exhibits a stronger correlation between TOC and porosity. This correlation is primarily attributed to its moderate thermal maturity (Ro = 2.5–3.5%) and the closed shale system, which facilitates the preservation of organic matter pores [9,10,11]. In terms of mineral composition, the Longmaxi Formation is characterized by a high siliceous content, with quartz constituting more than 40% [46,51,52,53]. This high siliceous content enhances rock brittleness and promotes the development of fracture networks, thereby indirectly improving pore connectivity. Conversely, the Qiongzhusi Formation exhibits poor preservation of inorganic pores due to its low siliceous content and significant compaction [9,10,11]. Although both shale formations contain carbonate minerals that are negatively correlated with porosity, the cementation effect in the Qiongzhusi Formation is more pronounced. This may be related to fluid activity induced by unconformities during the Tongwan period [9,10,11]. Furthermore, the Qiongzhusi Formation has experienced multiple periods of tectonic uplift, resulting in a low formation pressure coefficient (1.5) of the Longmaxi shale that is more conducive to maintaining a dynamic balance within the pore gas system [46,52,53,54,55].
The maximum paleo-burial depths of the Qiongzhusi Formation and the Wufeng–Longmaxi Formation in the Sichuan Basin and its periphery exceed 8000 m and 6000 m, respectively, exhibiting extremely intense mechanical compaction [9,10,11,46,47]. The Qiongzhusi shale demonstrates a higher maturity (Ro > 3.2%). The high biogenic silica content, low clay mineral content, moderate thermal evolution degree (Ro between 2% and 3%), relatively closed shale system, and stable tectonic conditions of the Longmaxi Formation have contributed to the development and effective preservation of inorganic mineral pores and organic matter pores within the shale [46,47,51,52,53]. The Qiongzhusi shale, characterized by its high feldspar content, is susceptible to dissolution and pressure-solution fracturing, resulting in a greater development of inorganic pores with good connectivity, which provides favorable conditions for the micromigration of shale gas. However, the advanced thermal evolution stage leads to a reduction in organic pores. Fine analysis of complex multistage structural evolution processes and the synergistic evolution mechanisms of diagenesis, hydrocarbon generation, and pore formation is an important field for characterizing and analyzing deep ultra-deep shale gas reservoirs.

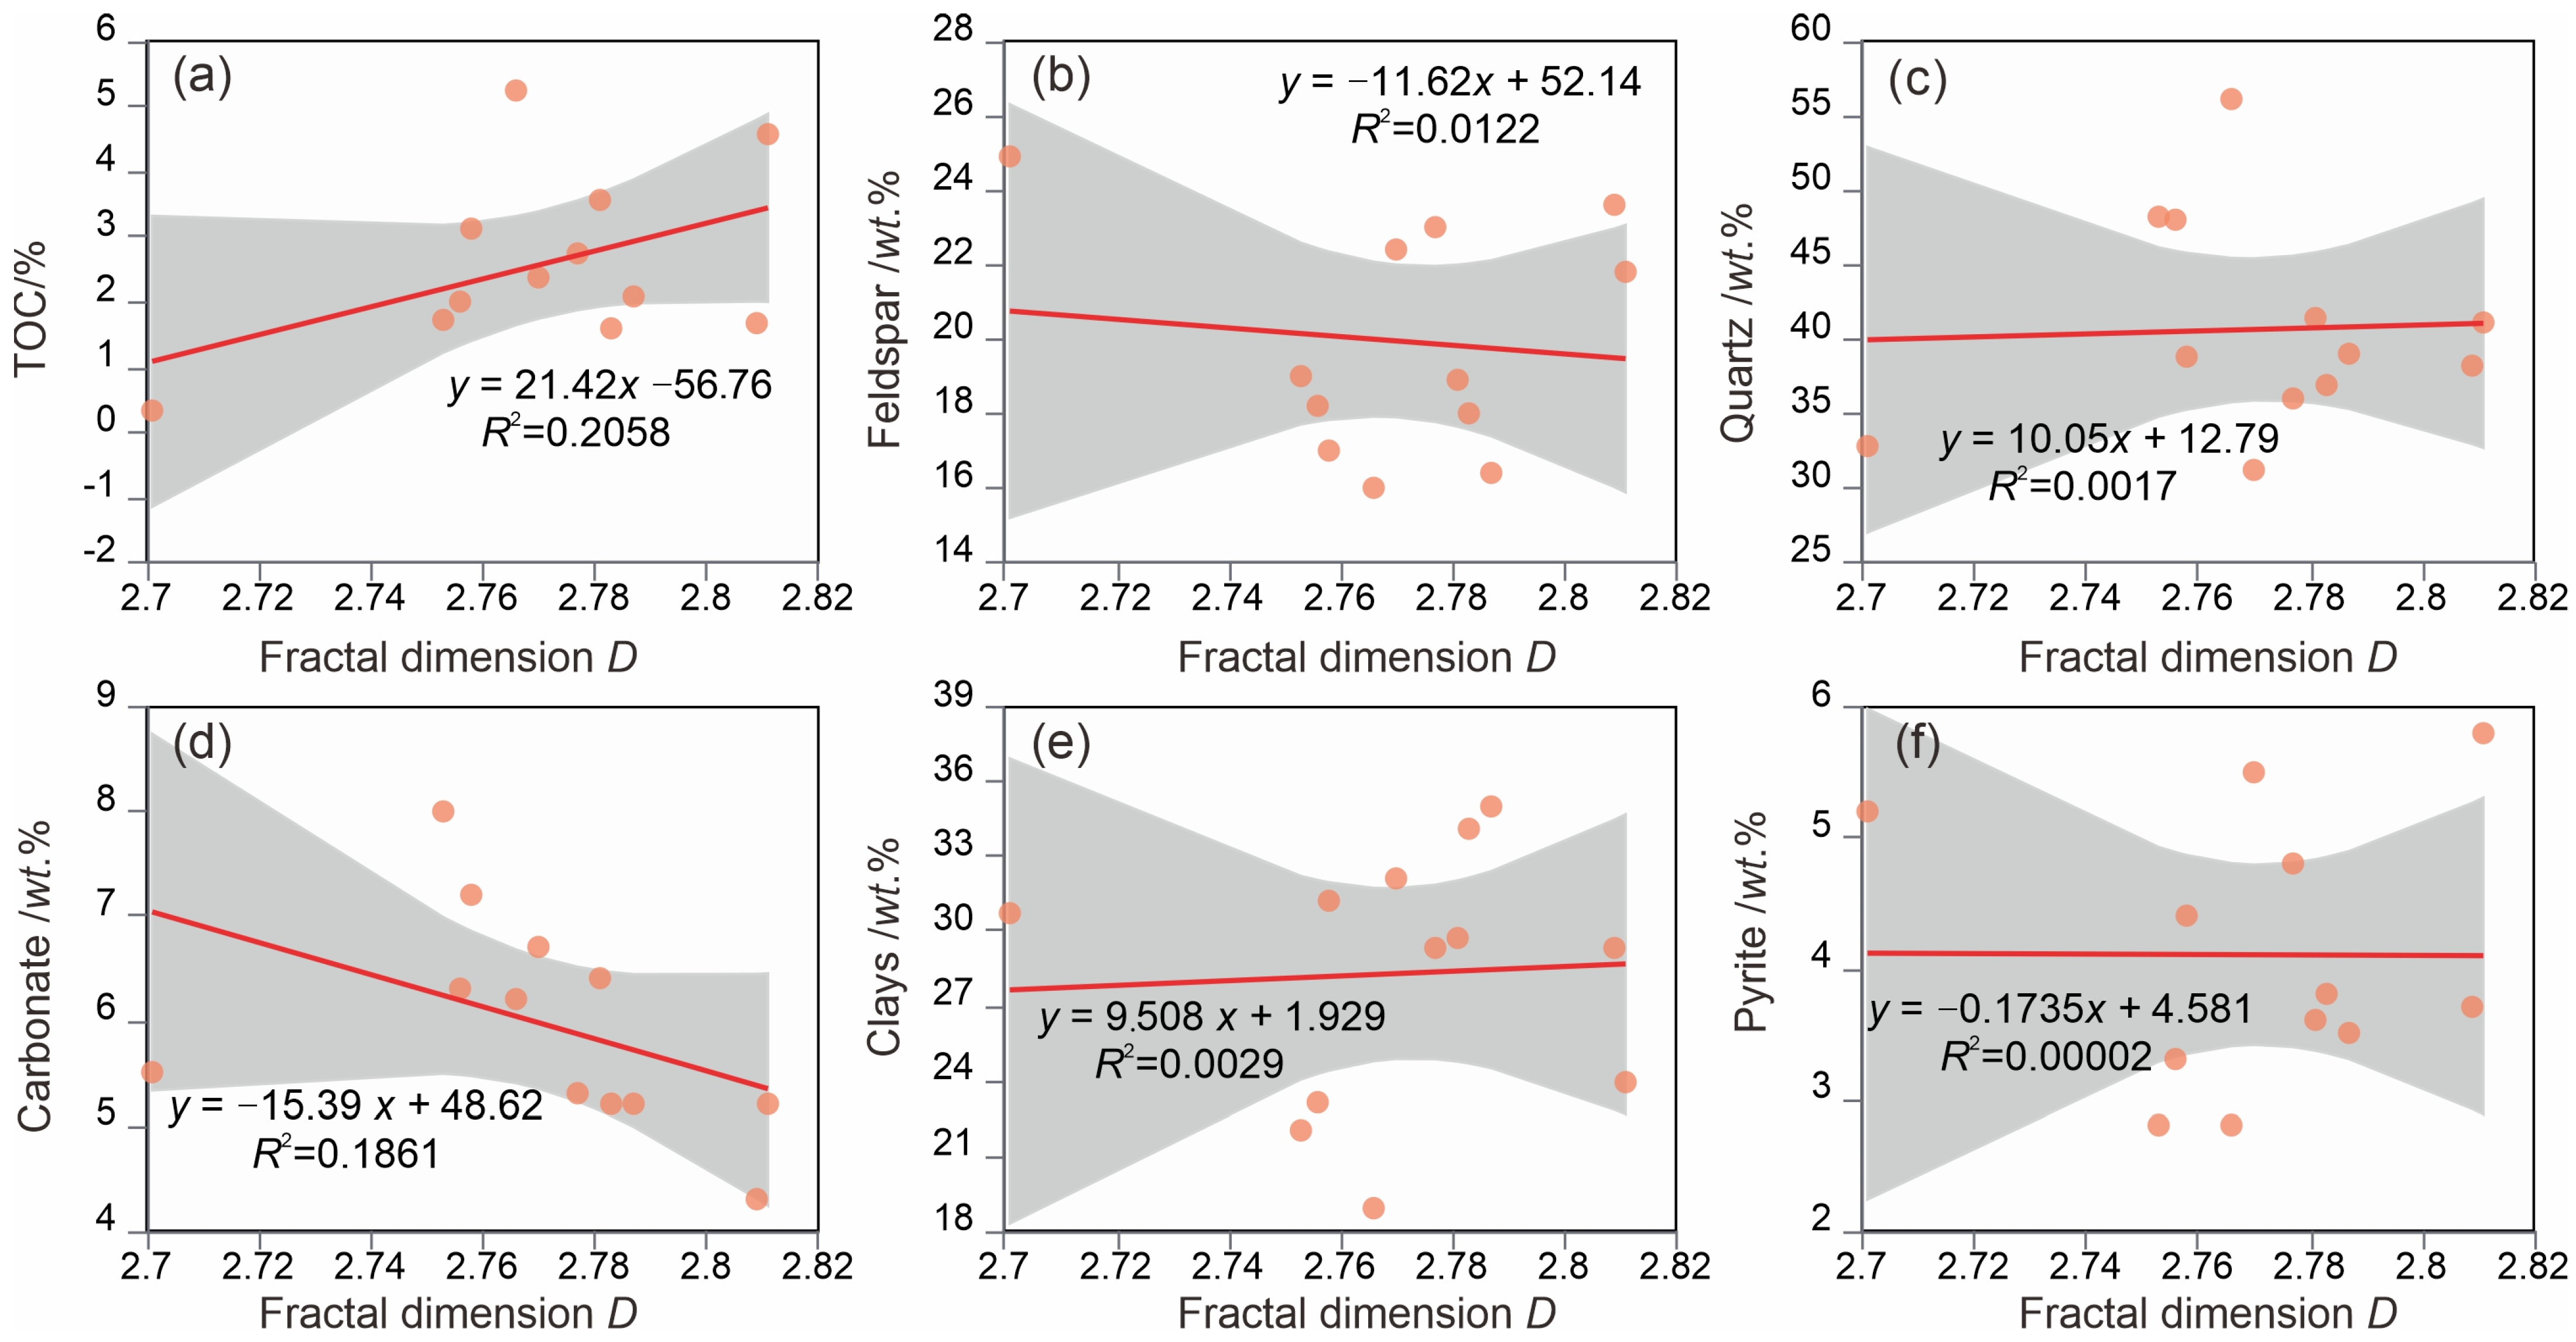
5.4. Compositional Controls on Heterogeneity

As shown in Figure 11, the fractal dimension D of the pores in Qiongzhusi shale exhibits a weak positive correlation with the TOC (R2 = 0.2058). This suggests that the abundance of organic matter contributes to the complexity of the pore structure to some extent; however, its controlling effect is limited. This limitation may be attributed to the graphitization of organic matter resulting from the high maturity (Ro > 3.5%) of the Qiongzhusi Formation, which is associated with a low degree of organic pore development [9,10,11]. The contribution of TOC is more evident in the rigid organic matter that supports microcracks rather than in the formation of pore networks. Among the mineral components, carbonate minerals exert the most significant positive influence on D (R2 = 0.1861), as their cementation readily forms heterogeneous pore boundaries. In contrast, quartz (R2 = 0.00196) and clay minerals (R2 = 0.00292) show positive correlations, but their contributions are minimal and likely constrained by the compaction deformation of clay minerals and the presence of quartz in fragmented forms. The negative correlation between pyrite and D (R2 = 0.0121) indicates that pyrite, which forms in a reducing environment, fills primary pores and thus reduces structural complexity [46,52,53,54,55].
In comparison to the Longmaxi Formation, the influence of TOC on pore structure in the Qiongzhusi Formation is significantly diminished (the R2 of the Longmaxi Formation is generally > 0.44). This reduction is primarily attributed to the uplift and erosion of the Qiongzhusi Formation during the Tongwan Movement, which facilitated the early generation of hydrocarbons that escaped through unconformities, while residual organic matter pores were compromised by subsequent diagenetic transformations [46,51,52,53]. The differences in mineral control are evident in several aspects: (1) The quartz in the Longmaxi Formation is predominantly biogenic silicon (R2 > 0.3), and its porous structure directly enhances the fractal dimension, whereas the detrital quartz in the Qiongzhusi Formation lacks this effect. (2) The clay minerals in the Longmaxi Formation were inhibited by early oil and gas injection, leading to a greater retention of interlayer pores (R2 = 0.15–0.25). In contrast, the clay in the Qiongzhusi Formation experienced significant compaction and cementation. (3) While both carbonate minerals contribute to pore complexity, the carbonate cement in the Qiongzhusi Formation predominantly forms during the burial diagenesis stage, resulting in poorer pore connectivity compared to the syngenetic carbonate found in the Longmaxi shale [46,51,52,53]. These differences are fundamentally governed by the dual geological effects of the extensive transformation of the Qiongzhusi Formation (the destruction of the storage system due to the Tongwan Movement) and the high maturity of the formation (which inhibits organic pore development through thermal evolution) [9,10,11]. The organic matter pores in the Qiongzhusi shale are relatively small, where shale gas molecules primarily experience surface diffusion and Knudsen diffusion within the organic micropores, with slip phenomena also potentially occurring [56,57,58]. The dissolution pores of feldspar and quartz predominantly develop mesopores, in which methane molecules primarily undergo Fick diffusion, while slip phenomena are less likely to occur [56,57,58]. The complexity of inorganic fractures enhances the fractal dimension and tortuosity of the pore system, facilitating gas adsorption and storage but hindering gas seepage [56,57,58]. Ultra-deep burial reduces shale pore size, enhances surface diffusion, and diminishes bulk diffusion [56]. Combining changes in temperature and pressure fields with multivariate environmental conditions, such as water content, conducting molecular seepage simulations of various pore types under complex matrix coupling, and integrating these findings with actual gas-bearing experiments represent crucial directions for future research on the seepage laws of deep and ultra-deep shale gas.

6. Conclusions

This study systematically investigated the pore structure characteristics of Qiongzhusi shale through an integrated approach that combines CO2 and N2 adsorption–desorption experiments with high-pressure mercury intrusion measurements. The findings offer new insights into the complexity and heterogeneity of pore networks in shale reservoirs, as well as the controlling factors of pore development. The main conclusions are as follows:
  • The pore size distribution of Qiongzhusi shale exhibits a complex, bimodal pattern in the <10 nm range, indicating that smaller pores significantly contribute to the total pore volume and specific surface area. The pore volume in the 10–100 nm range remained relatively stable, with minimal variation among samples.
  • In comparison to Longmaxi shale (moderate maturity, Ro: 2.5–3.0%), Qiongzhusi shale has experienced excessive thermal evolution, leading to the collapse of organic pores and a reduction in micropore abundance and specific surface area. The pore system of Qiongzhusi shale is predominantly composed of inorganic pores.
  • The fractal dimension of the Qiongzhusi shale samples is notably high (ranging from 2.701 to 2.811, with an average of 2.775), suggesting a highly complex and heterogeneous pore structure. This complexity may be attributed to multistage tectonic evolution, intricate mineral composition, diverse pore types, and a wide range of pore sizes, all of which enhance the heterogeneity and fractal characteristics of the pores.
  • A strong linear correlation was observed between total porosity and total pore volume, as well as between specific surface area and pore volume of micropores, mesopores, and macropores. These relationships underscore the critical role of pore volume in influencing porosity and specific surface area. Conversely, a weak positive correlation between porosity and TOC content indicates that the contribution of organic matter to pore development is limited. Additionally, carbonate and clay minerals exhibit a significant negative correlation with porosity, reflecting their detrimental effects on pore preservation through processes of cementation and compaction.

Author Contributions

Conceptualization, Y.C. (Yana Chen) and J.Z.; methodology, Y.C. (Yana Chen); software, J.C.; validation, M.Z. and T.T.; formal analysis, S.P.; investigation, Y.W.; resources, Y.W.; data curation, Y.C. (Ying Chen); writing—original draft preparation, Y.C. (Yana Chen) and M.Z.; writing—review and editing, Y.C. (Yana Chen) and J.Z.; visualization, T.T.; supervision, M.Z.; project administration, Y.C. (Yana Chen); funding acquisition, M.Z. All authors have read and agreed to the published version of the manuscript.

Funding

This research was funded by the Research Project of the PetroChina Southwest Oil and Gas Field Company (Grant No. XNS-YT2025-06 and No. XNS-JS2024-10) and in part by the National Natural Science Foundation of China (Grant No.42202141).

Data Availability Statement

The data that support the findings of this study are available from the corresponding author upon reasonable request.

Conflicts of Interest

Majia Zhengand Yana Chen are employees of PetroChina Research Institute of Petroleum Exploration & Development; Tingke Tang, Ya Wu, Ying Chen, Junyu Chen, Shixuan Peng are employees of PetroChina Southwest Oil & Gas Field Company. The paper reflects the views of the scientists and not the companies.

References

  1. Curtis, J.B. Fractured shale-gas systems. AAPG Bull. 2002, 86, 1921–1938. [Google Scholar]
  2. Selley, R.C. UK shale gas: The story so far. Mar. Pet. Geol. 2012, 31, 100–109. [Google Scholar] [CrossRef]
  3. Johnson, C.; Boersma, T. Energy (in) security in Poland the case of shale gas. Energy Policy 2013, 53, 389–399. [Google Scholar] [CrossRef]
  4. Sun, C.X.; Nie, H.K.; Dang, W. Shale gas exploration and development in China: Current status, geological challenges and future directions. Energy Fuels 2021, 35, 6359–6379. [Google Scholar] [CrossRef]
  5. Li, X.Z.; Guo, Z.H.; Hu, Y.; Liu, X.H.; Wan, Y.J.; Luo, R.L.; Sun, Y.P.; Che, M.G. High-quality development of ultra-deep large gas fields in China: Challenges, strategies and proposals. Nat. Gas Ind. 2020, 40, 75–82. [Google Scholar] [CrossRef]
  6. Feng, Y.; Xiao, X.; Gao, P.; Wang, E.; Hu, D.; Liu, R.; Li, G.; Lu, C. Restoration of sedimentary environment and geochemical features of deep marine Longmaxi shale and its significance for shale gas: A case study of the Dingshan area in the Sichuan Basin, South China. Mar. Pet. Geol. 2023, 151, 106186. [Google Scholar] [CrossRef]
  7. Guo, X.S.; Hu, D.F.; Huang, R.C.; Wei, Z.H.; Duan, J.B.; Wei, X.F.; Fan, X.J.; Miao, Z.W. Deep and ultra-deep natural gas exploration in the Sichuan Basin: Progress and prospect. Nat. Gas Ind. 2020, 40, 419–432. [Google Scholar] [CrossRef]
  8. Liu, R.; Wei, Z.; Jia, A.; He, S.; Hou, Y.; He, Q.; Wang, T.; Zeng, Y.; Yang, R. Fractal Characteristics of Pore Structure in Deep Overpressured Organic-Rich Shale in Wufeng-Longmaxi Formation in Southeast Sichuan and Its Geological Significance. Earth Sci. 2023, 48, 1496–1516. [Google Scholar]
  9. Yang, H.; Geng, C.; Zheng, M.; Zheng, Z.; Long, H.; Chang, Z.; Li, J.; Pang, H.; Yang, J. Application of the Hydrocarbon Generation Potential Method in Resource Potential Evaluation: A Case Study of the Qiongzhusi Formation in the Sichuan Basin, China. Processes 2024, 12, 2928. [Google Scholar] [CrossRef]
  10. Zou, C.E.; Zhao, Z.F.; Pan, S.Q.; Yin, J.; Lu, G.W.; Fu, F.L.; Yuan, M.; Liu, H.L.; Zhang, G.S.; Luo, C.; et al. Unveiling the Oldest Industrial Shale Gas Reservoir: Insights for the Enrichment Pattern and Exploration Direction of Lower Cambrian Shale Gas in the Sichuan Basin. Engineering 2024, 42, 278–294. [Google Scholar] [CrossRef]
  11. Yong, R.; Shi, X.W.; Luo, C.; Zhong, K.S.; Wu, W.; Zheng, M.J.; Yang, Y.R.; Li, Y.Y.; Xu, L.; Zhu, Y.Q.; et al. Aulacogen-uplift enrichment pattern and exploration prospect of Cambrian Qiongzhusi Formation shale gas in Sichuan Basin, SW China. Pet. Explor. Dev. 2024, 51, 1402–1420. [Google Scholar] [CrossRef]
  12. Wu, Q.L.; Pang, H.; Zhang, B.J.; Jiang, F.J.; Wu, L.Y.; Chen, J.Q.; Ma, K.Y.; Huo, X.G. Application of shale TOC prediction model using the XGBoost machine learning algorithm: A case study of the Qiongzhusi Formation in central Sichuan Basin. Carb. Evap. 2025, 40, 8. [Google Scholar] [CrossRef]
  13. Ye, C.L.; Shen, J.J.; Zhang, Y.H.; Xu, Y.; Zeng, D.M.; Tang, R.F.; Du, Y.; Liu, J.Y. Sedimentological and geochemical characteristics of lower Cambrian Qiongzhusi shale in the Sichuan Basin and its periphery, SW China: Implications for differences in organic matter enrichment. Pet. Sci. 2024, 21, 3774–3789. [Google Scholar] [CrossRef]
  14. Chalmers, G.R.; Bustin, R.M.; Power, I.M. Characterization of gas shale pore systems by porosimetry, pycnometry, surface area, and field emission scanning electron microscopy/transmission electron microscopy image analyses: Examples from the Barnett, Woodford, Haynesville, Marcellus, and Doig unit. AAPG Bull. 2012, 96, 1099–1119. [Google Scholar] [CrossRef]
  15. Chalmers, G.R.L.; Ross, D.J.K.; Bustin, R.M. Geological controls on matrix permeability of Devonian Gas Shales in the Horn River and Liard basins, northeastern British Columbia, Canada. Int. J. Coal Geol. 2012, 103, 120–131. [Google Scholar] [CrossRef]
  16. Fishman, N.S.; Hackley, P.C.; Lowers, H.A.; Hill, R.J.; Egenhoff, S.O.; Eberl, D.D.; Blum, A.E. The nature of porosity in organic-rich mudstones of the Upper Jurassic Kimmeridge Clay Formation, North Sea, offshore United Kingdom. Int. J. Coal Geol. 2012, 103, 32–50. [Google Scholar] [CrossRef]
  17. Loucks, R.G.; Reed, R.M.; Ruppel, S.C. Spectrum of pore types and networks in mudrocks and a descriptive classification for matrix-related mudrock pores. AAPG Bull. 2012, 96, 1071–1098. [Google Scholar] [CrossRef]
  18. Yang, Z.H.; Tao, G.L.; Bao, Y.J.; Lu, L.F.; Sun, Y.G.; Liu, W.X.; Shen, B.J.; Ne, H.K. Differential development and maintenance mechanismof reservoir space for marine shale gas in South China’s deep strata. Pet. Geol. Exp. 2022, 44, 845–865. [Google Scholar]
  19. Loucks, R.G.; Reed, R.M.; Ruppel, S.C.; Jarvie, D.M. Morphology, genesis, and distribution of nanometer-scale pores in siliceous mudstones of the Mississippian Barnett shale. J. Sedi. Res. 2009, 79, 848–861. [Google Scholar] [CrossRef]
  20. Wang, Y.; Qiu, N.S.; Tao, N.; Xie, X.M.; Cheng, H.F.; Zuo, Z.X.; Ma, Z.L.; Shen, B.J.; Borjigin, T. Thermal maturity calibration of extremely high-mature pre-Devonian strata: A case study from the Lower Cambrian Qiongzhusi Formation in the Sichuan Basin, South China. Geoenergy Sci. Eng. 2023, 222, 211411. [Google Scholar] [CrossRef]
  21. Zhang, J.Z.; Li, X.Q.; Wei, Q.; Sun, K.X.; Zhang, G.W.; Wang, F.Y. Characterization of full-sized pore structure and fractal characteristics of marine−continental transitional Longtan formation shale of Sichuan Basin, South China. Energy Fuels 2017, 31, 10490–10504. [Google Scholar] [CrossRef]
  22. Xie, G.L.; Jiao, K.; Deng, B.; Hao, W.D.; Liu, S.G. Pore characteristics and preservation mechanism of over-6000-m ultra-deep shale reservoir in the Sichuan Basin. Front. Earth Sci. 2023, 11, 1059869. [Google Scholar] [CrossRef]
  23. Krohn, C.E. Fractal measurements of sandstone, shales and carbonates. J. Geophys. Res. Solid Earth 1988, 93, 3297–3305. [Google Scholar] [CrossRef]
  24. Mandelbrot, B.B. The Fractal Geometry of Nature; Freeman: San Francisco, CA, USA, 1982; pp. 1–10. [Google Scholar]
  25. Mishra, S.; Mendhe, V.A.; Varma, A.K.; Kamble, A.D.; Sharma, S.; Bannerjee, M.; Kalpanad, M.S. Influence of organic and inorganic content on fractal dimensions of Barakar and Barren Measures shale gas reservoirs of Raniganj basin, India. J. Nat. Gas Sci. Eng. 2018, 49, 393–409. [Google Scholar] [CrossRef]
  26. Zhang, J.Z.; Li, X.Q.; Zhang, G.W.; Zou, X.Y.; Wang, F.Y.; Tang, Y.J. Microstructural investigation of different nanopore types in marine-continental transitional shales: Examples from the Longtan formation in Southern Sichuan Basin, South China. Mar. Pet. Geol. 2019, 110, 912–927. [Google Scholar] [CrossRef]
  27. Zhang, J.Z.; Tang, Y.J.; He, D.X.; Sun, P.; Zou, X.Y. Full-scale nanopore system and fractal characteristics of clay-rich lacustrine shale combining FE-SEM, nano-CT, gas adsorption and mercury intrusion porosimetry. Appl. Clay Sci. 2020, 196, 105758. [Google Scholar] [CrossRef]
  28. Zhang, J.Z.; Li, X.Q.; Wei, Q.; Gao, W.J.; Liang, W.L.; Wang, Z.; Wang, F.Y. Quantitative characterization of pore-fracture system of organic-rich marine-continental shale reservoirs: A case study of the Upper Permian Longtan Formation, Southern Sichuan Basin, China. Fuel 2017, 200, 272–281. [Google Scholar] [CrossRef]
  29. Li, A.; Ding, W.D.; He, J.H.; Dai, P.; Yin, S.; Xie, F. Investigation of pore structure and fractal characteristics of organic–rich shale reservoirs: A case study of Lower Cambrian Qiongzhusi formation in Malong block of eastern Yunnan Province, South China. Mar. Pet. Geol. 2016, 70, 46–57. [Google Scholar] [CrossRef]
  30. Pyun, S.I.; Rhee, C.K. An investigation of fractal characteristics of mesoporous carbon electrodes with various pore structures. Electrochim. Acta 2004, 49, 4171–4180. [Google Scholar] [CrossRef]
  31. Xu, L.L.; Huang, S.P.; Sun, M.D.; Wen, Y.R.; Chen, W.; Zhang, Y.L.; Luo, F.; Zhang, H. Palaeoenvironmental evolution based on elemental geochemistry of the Wufeng-Longmaxi Shales in Western Hubei, Middle Yangtze, China. Minerals 2023, 13, 502. [Google Scholar] [CrossRef]
  32. Klaver, J.; Hemes, S.; Houben, M.; Desbois, G.; Radi, Z.; Urai, J.L. The connectivity of pore space in mudstones: Insights from high-pressure Wood’s metal injection, BIB–SEM imaging, and mercury intrusion porosimetry. Geofluids 2015, 15, 577–591. [Google Scholar] [CrossRef]
  33. Aslannejad, H.; Hassanizadeh, S.M.; Raoof, A.; de Winter, D.A.M.; Tomozeiu, N.; van Genuchten, M.T. Characterizing the hydraulic properties of a porous coating of paper using FIB-SEM tomography and 3D pore-scale modeling. Chem. Eng. Sci. 2016, 160, 275–280. [Google Scholar] [CrossRef]
  34. Wang, T.; Deng, Z.; Hu, H.; Wang, H.; Jiang, Z.; Wang, D. Study on pore structure and multifractal characteristics of middle- and high-rank coals based on gas adsorption method: A case study of Benxi Formation in the eastern margin of Ordos Basin. Energy Fuels 2024, 38, 4102–4121. [Google Scholar] [CrossRef]
  35. Wang, T.; Deng, Z.; Hu, H.; Tian, F.; Ding, R.; Zhang, T.; Ma, Z.; Hou, S.; Li, X.; Dai, R. Pore structure and fractal characteristics oftransitional shales with different lithofacies from the eastern margin of the Ordos Basin. Energy Sci. Eng. 2023, 11, 3979–4000. [Google Scholar] [CrossRef]
  36. Wei, M.; Zhang, L.; Xiong, Y.; Li, J.; Peng, P. Nanopore structure characterization for organic-rich shale using the non-local-density functional theory by a combination of N2 and CO2 adsorption. Microporous Mesoporous Mater. 2016, 227, 88–94. [Google Scholar] [CrossRef]
  37. Jaroniec, M. Evaluation of the fractal dimension from a single adsorption isotherm. Langmuir 1995, 11, 2316–2317. [Google Scholar] [CrossRef]
  38. Ahmed, F.; Hisham, B.M.; Ziad, B.; Raoof, G.; Mofazzal, H. The impact of supercritical CO2 on the pore structure and storage capacity of shales. J. Nat. Gas Sci. Eng. 2022, 98, 104394. [Google Scholar]
  39. Wang, Z.; Fu, X.; Pan, J.; Deng, Z. Effect of N2/CO2 injection and alternate injection on volume swelling/shrinkage strain of coal. Energy 2023, 275, 127377. [Google Scholar] [CrossRef]
  40. Zhang, S.; Tang, S.; Tang, D.; Huang, W.; Pan, Z. Determining fractal dimensions of coal pores by FHH model: Problems and effects. J. Nat. Gas Sci. Eng. 2014, 21, 929–939. [Google Scholar] [CrossRef]
  41. Zhao, J.; Jin, Z.; Jin, Z.; Wen, X.; Geng, Y. Origin of authigenic quartz in organic-rich shales of the Wufeng and Longmaxi Formations in the Sichuan Basin, South China: Implications for pore evolution. J. Nat. Gas Sci. Eng. 2019, 68, 102914. [Google Scholar] [CrossRef]
  42. Feng, G.J.; Li, W.; Zhu, Y.M.; Wang, Y.; Song, Y.; Zheng, S.J.; Shang, F.H. Scale-Dependent Fractal Properties and Geological Factors for the Pore Structure in Shale: Insights from Field Emission Scanning Electron Microscopy and Fluid Intrusion. Energy Fuels 2023, 37, 16519–16535. [Google Scholar] [CrossRef]
  43. Li, X.Y.; Chen, S.B.; Wang, Y.W.; Zhang, Y.K.; Wang, Y.; Wu, J.F.; Zhang, J.J.; Khan, J. Influence of Pore Structure Particularity and Pore Water on the Occurrence of Deep Shale Gas: Wufeng-Longmaxi Formation, Luzhou Block, Sichuan Basin. Nat. Res. Res. 2022, 31, 1403–1423. [Google Scholar] [CrossRef]
  44. Li, C.R.; Pang, X.Q.; Ma, X.H.; Wang, E.Z.; Hu, T.; Wu, Z.Y. Hydrocarbon generation and expulsion characteristics of the Lower Cambrian Qiongzhusi shale in the Sichuan Basin, Central China: Implications for conventional and unconventional natural gas resource potential. J. Petrol. Sci. Eng. 2021, 204, 108610. [Google Scholar] [CrossRef]
  45. Xie, L.; Yang, X.F.; Li, S.S.; Wang, Y.M.; Tan, G.C.; Yan, J.K.; Zhou, L.; Wang, X.Z. Sedimentary characteristics and lithofacies paleogeography of the Cambrian in Sichuan basin, Southwest China. Petroleum 2024, 10, 224–242. [Google Scholar] [CrossRef]
  46. Zhang, Q.; Liang, F.; Zeng, J.B.; Qiu, Z.; Zhou, S.W.; Liu, W.; Kong, W.L. Paleoenvironment Comparison of the Longmaxi and Qiongzhusi Formations, Weiyuan Shale Gas Field, Sichuan Basin. Processes 2023, 11, 2153. [Google Scholar] [CrossRef]
  47. Li, Z.W.; Tang, Z.L.; Zheng, W.Q. Micropore Structural Heterogeneity of Siliceous Shale Reservoir of the Longmaxi Formation in the Southern Sichuan Basin, China. Minerals 2019, 9, 548. [Google Scholar] [CrossRef]
  48. Pfeifer, P.; Avnir, D. Chemistry in noninteger dimensions between two and three. I. Fractal theory of heterogeneous surfaces. J. Chem. Phys. 1983, 79, 3558–3565. [Google Scholar] [CrossRef]
  49. Yang, R.; He, S.; Yi, J.Z. Nano-scale pore structure and fractal dimension of organic-rich wufeng-longmaxi shale from Jiaoshiba area, Sichuan Basin: Investigations using FE-SEM, gas adsorption and helium pycnometry. Mar. Pet. Geol. 2016, 70, 27–45. [Google Scholar] [CrossRef]
  50. Zhang, J.Z.; Lin, W.; Li, M.T.; Wang, J.G.; Xiao, X.; Chen, Y.C. Pore Structure and Heterogeneity Characteristics of Coal-Bearing Marine–Continental Transitional Shales from the Longtan Formation in the South Sichuan Basin, China. Minerals 2024, 14, 588. [Google Scholar] [CrossRef]
  51. Hu, H.; Hao, F.; Lin, J.; Lu, Y.; Ma, Y.; Li, Q. Organic matter-hosted pore system in the Wufeng-Longmaxi (O3w-S11) shale, Jiaoshiba area, Eastern Sichuan Basin, China. Int. J. Coal Geol. 2017, 173, 40–50. [Google Scholar] [CrossRef]
  52. Guan, Q.Z.; Dong, D.Z.; Wang, S.F.; Huang, J.L.; Wang, Y.M.; Lu, H.; Zhang, C.C. Preliminary study on shale gas micro-reservoir characteristics of the lower silurian Longmaxi formation in the southern Sichuan basin, China. J. Nat. Gas Sci. Eng. 2016, 31, 382–395. [Google Scholar] [CrossRef]
  53. Wang, P.F.; Zhang, C.; Li, X.; Zhang, K.; Yuan, Y.; Zang, X.P.; Cui, W.J.; Liu, S.Y.; Jiang, Z.X. Organic matter pores structure and evolution in shales based on the he ion microscopy (HIM): A case study from the Triassic Yanchang, Lower Silurian Longmaxi and Lower Cambrian Niutitang shales in China. J. Nat. Gas Sci. Eng. 2020, 84, 103682. [Google Scholar] [CrossRef]
  54. Chen, S.B.; Zhu, Y.M.; Chen, S.; Han, Y.F.; Fu, C.Q.; Fang, J.H. Hydrocarbon generation and shale gas accumulation in the Longmaxi Formation, Southern Sichuan Basin, China. Mar. Petrol. Geol. 2017, 86, 248–258. [Google Scholar]
  55. Qiu, Z.; Zou, C.; Wang, H.; Dong, D.; Lu, B.; Chen, Z.; Liu, D.; Li, G.; Liu, H.; He, J.; et al. Discussion on the characteristics and controlling factors of differential enrichment of shale gas in the Wufeng-Longmaxi formations in south China. J. Nat. Gas Geosci. 2020, 5, 117–128. [Google Scholar] [CrossRef]
  56. Zhan, S.Y.; Su, Y.L.; Lu, M.J.; Cai, M.Y.; Fu, J.K.; Liu, Z.P.; Wang, K.Y.; Han, Q. Effect of surface type on the flow characteristics in shale nanopores. Geofluids 2021, 2021, 6641922. [Google Scholar] [CrossRef]
  57. Guan, Q.S.; Shan, B.C.; Wang, R.X.; Feng, G.; Guo, Z.L. Evaluation of different particle-actuation modes in molecular dynamics and their impact on nanoscale flow behaviors. Phys. Fluids 2022, 34, 072006. [Google Scholar] [CrossRef]
  58. Huang, P.Y.; Shen, L.M.; Maggi, F.; Chen, Z.W.; Pan, Z.J. Influence of surface roughness on methane flow in shale kerogen nano-slits. J. Nat. Gas Sci. Eng. 2022, 103, 104650. [Google Scholar] [CrossRef]
Figure 1. Location of Sichuan Basin and research area and distribution of ancient sedimentary facies belt of Qiongzhusi Formation (modified after [42,43,44,45,46]).
Minerals 15 00515 g001
Figure 2. Comprehensive column chart of the Qiongzhusi Formation strata in the typical well (Z201) of southern Sichuan Basin (modified after [44,45,46]).
Minerals 15 00515 g002
Figure 3. (a) Characteristics of mineral components in the Qiongzhusi shale samples in Southern Basin; (b) mineralogical comparison of Qiongzhusi shale samples with typical shale components in other regions (data from [26,27,28]).
Minerals 15 00515 g003
Figure 4. SEM images of the Qiongzushi shales from the Southern Basin. ((a) Z201-1, 4573.41 m, feldspar and dissolved pores; (b) Z201-2, 4579.1 m, OM pores, and clay mineral InterP pore; (c) Z201-4, 4604.00 m, pyrite and pyrite intercrystalline pores; (d) Z201-8, 4610.94 m, microfracture and InterP pores; (e) Z201-16, 4796 m, OM and OM pores; (f) Z201-20, 4810.94 m, dissolved pores, and microfracture).
Minerals 15 00515 g004
Figure 5. Characteristics of pore volume and specific surface area from the Qiongzushi Shales in the Southern Basin (the arrows in the figure indicate the rate of change compared to the previous sample data).
Minerals 15 00515 g005
Figure 6. Pore size distribution combining CO2, N2 adsorption–desorption, and high-pressure mercury injection data ((a), Z201-1; (b), Z201-6; (c), Z201-10; (d), Z201-12; (e), Z201-14; (f), Z201-18).
Minerals 15 00515 g006
Figure 7. Plots of ln(V) vs. ln(P0/P) reconstructed from N2 adsorption–desorption data of the Qiongzushi shale samples ((a), Z201-1; (b), Z201-1; (c), Z201-1; (d), Z201-1; (e), Z201-1; (f), Z201-1; (g), Z201-1; (h), Z201-1; (i), Z201-1; (j), Z201-1; (k), Z201-1; (l), Z201-20).
Minerals 15 00515 g007
Figure 8. The relationship between pore structure parameters of Qiongzhusi shale samples from the southern Sichuan Basin. (a), total pore volume vs. porosity; (b) micropore volume vs. micropore surface area; (c) mesopore volume vs. mesopore surface area; (d) macropore volume vs. macropore surface area; (e) average pore diameter vs. total pore volume; (f) average pore diameter vs. total pore surface area.
Minerals 15 00515 g008
Figure 9. The relationship between fractal dimension D and pore structure parameters of Qiongzhusi shale samples. (a) fractal dimension D vs. micropore volume; (b) fractal dimension D vs. mesropore volume; (c) fractal dimension D vs. macropore volume; (d) fractal dimension D vs. total pore volume. (the red line represents the linear fitting curve, and the gray band represents the confidence interval).
Minerals 15 00515 g009
Figure 10. The relationships between porosity with TOC and mineral composition in Qiongzhusi shale samples. (a) porosity vs. TOC; (b) porosity vs. feldspar; (c) porosity vs. quartz; (d) porosity vs. carbonate; (e) porosity vs. clays; (f) porosity vs. pyrite. (The red line represents the linear fitting curve, and the gray band represents the confidence interval).
Minerals 15 00515 g010
Figure 11. The relationships between fractal dimension D with TOC and mineral composition in Qiongzhusi shale samples. (a) fractal dimension D vs. TOC; (b) fractal dimension D vs. feldspar; (c) fractal dimension D vs. quartz; (d) fractal dimension D vs. carbonate; (e) fractal dimension D vs. clays; (f) fractal dimension D vs. pyrite. (the red line represents the linear fitting curve, and the gray band represents the confidence interval).
Minerals 15 00515 g011
Table 1. TOC and mineral composition (wt.%) of the Qiongzhusi shale samples in Southern Basin.
Sample IDDepth/mTOC/%FeldsparQuartzCalciteDolomiteGypsumPyriteClaysOthers
Z201-14573.412.0816.4 39.0 2.4 2.8/3.5 35.0 0.9
Z201-24579.101.5918.0 36.9 3.1 2.11.1 3.8 34.1 0.9
Z201-44589.701.6723.6 38.2 2.6 1.7/3.7 29.3 0.9
Z201-64604.004.5721.8 41.1 2.4 2.81.3 5.8 23.9 0.9
Z201-84610.942.3722.4 31.2 5.2 1.51.4 5.5 32.1 0.7
Z201-104620.540.32924.9 32.8 1.2 4.3/5.2 30.7 0.9
Z201-114745.322.0018.2 48.0 5.0 1.31.1 3.3 23.1 0.0
Z201-124750.052.7423.0 36.0 0.8 4.50.9 4.8 29.3 0.7
Z201-144774.361.7219.0 48.2 7.2 0.8/2.8 22.0 0.0
Z201-164796.005.2416.0 56.1 4.9 1.3/2.8 18.9 0.0
Z201-184805.093.5618.9 41.4 1.5 4.9/3.6 29.7 0.0
Z201-204810.943.1217.0 38.8 2.7 4.50.9 4.4 31.2 0.5
Table 2. Pore structure parameters combing CO2 and N2 adsorption–desorption isotherms and high-pressure mercury injection experiment.
Sample IDPorosityPore Volume (cm3/g)Specific Surface Area (m2/g)Total Pore Volume (cm3/g)Total Specific Surface Area (m2/g)Average Pore Diameter (nm)
MicroporeMesoporeMacroporeMicroporeMesoporeMacropore
Z201-14.300.00470.00890.001111.691313.51801.75450.014726.960.8116
Z201-23.740.00480.00720.000611.469210.98100.46640.012522.921.0265
Z201-43.610.00440.01140.000710.619413.61500.85800.016525.092.3071
Z201-65.080.00720.01340.000517.739422.81700.46700.021241.021.1853
Z201-84.700.00410.00840.000610.307113.26600.73460.013224.310.0004
Z201-101.130.00190.00310.00044.55323.92900.55300.00549.040.5953
Z201-112.910.00330.00580.00078.18048.86900.74600.009817.800.0003
Z201-123.210.00510.00660.000712.506312.60800.85600.012425.971.0301
Z201-142.580.00330.00540.00088.24478.78701.23400.009618.271.0886
Z201-164.380.00770.01120.000419.182921.75700.42860.019341.370.0004
Z201-183.490.00600.00790.000315.005616.19600.23400.014331.440.6588
Z201-203.470.00550.00640.000413.749114.50400.35200.012328.612.0018
Table 3. Fractal dimensions obtained from nitrogen adsorption–desorption experimental data and the FHH model.
Sample IDFractal Fitting Equation DR2Sample IDFractal Fitting Equation DR2
Z201-1y = −0.213x + 1.502.7870.959Z201-11y = −0.244x + 1.052.7560.927
Z201-2y = −0.217x + 1.272.7830.921Z201-12y = −0.223x + 1.402.7770.926
Z201-4y = −0.191x + 0.3252.8090.877Z201-14y = −0.247x + 1.022.7530.923
Z201-6y = −0.189x + 1.532.8110.849Z201-16y = −0.234x +1.932.7660.888
Z201-8y = −0.230x + 1.432.770.914Z201-18y = −0.219x + 1.632.7810.881
Z201-10y = −0.299x + 1.462.7010.933Z201-20y = −0.242x + 1.972.7580.914
Disclaimer/Publisher’s Note: The statements, opinions and data contained in all publications are solely those of the individual author(s) and contributor(s) and not of MDPI and/or the editor(s). MDPI and/or the editor(s) disclaim responsibility for any injury to people or property resulting from any ideas, methods, instructions or products referred to in the content.

