Article

Metal Fingerprints of Eocene Rhyolite Magmas Coincident with Carlin-Type Gold Deposition in Nevada USA

by
Celestine N. Mercer
1,*,
Hannah R. Babel
2,
Cameron M. Mercer
1 and
Albert H. Hofstra
1
1
Geology Geophysics & Geochemistry Science Center, U.S. Geological Survey, Denver, CO 80225, USA
2
Department of Earth Science, Center for Deep Sea Research, University of Bergen, Allégaten 41, 5020 Bergen, Norway
*
Author to whom correspondence should be addressed.
Minerals 2025, 15(5), 479; https://doi.org/10.3390/min15050479
Submission received: 1 February 2025 / Revised: 31 March 2025 / Accepted: 2 April 2025 / Published: 4 May 2025

Abstract

:
Eocene magmatic systems contemporaneous with world-class Carlin-type Au deposits in Nevada (USA) have been proposed by some researchers as a key ingredient for Au mineralization, though evidence conclusively demonstrating their genetic relationship remains tenuous. This study provides the first direct evidence of the pre-eruptive metal budget of volatile- and metal-charged silicic magmas coincident in time (~41 to 34 Ma) and space (within 5 km) with Carlin-type Au deposits. We characterize the pre-eruptive metal fingerprints of these diverse magmatic systems to assess their potential as sources of metals for Carlin-type Au mineralization. Metal abundances from quartz-hosted melt inclusions (Au, Te, Ag, Sb, Tl, Mo, W, Sn, As, Pb, Co, Cu, Ni, and Zn) characterized in situ by SHRIMP-RG and LA-ICP-MS represent our best (and only) estimates for the pre-eruptive metal budget in these systems. Median metal concentrations are generally within one order of magnitude of average upper crust and average continental rhyolite values. But there are two notable exceptions, with median Au contents extending >1 order of magnitude higher than average upper crust and median Cu contents ranging >1 order of magnitude lower than upper crust. Despite this, melts contain lower Au/Cu (<0.1), Au/Ag (<5), and Au/Tl (<0.3) than most ore-grade Carlin-type rock samples and quartz-hosted fluid inclusions, regardless of their age and timing relative to nearby Carlin-type Au mineralization. The metal fingerprints of these magmatic systems, defined both by traditional and multivariate compositional data analysis techniques, are distinct from one another. Yet none are particularly specialized, e.g., high Au/Cu, in terms of being ideal ingredients as postulated by magmatic models for Carlin-type Au mineralization. Magmatic Au contents do not appear to be correlated with rhyolite “flavors” in the way that Cu, Sn, and Nb contents are. Fluid/melt partitioning modeling and magma volume estimates support the idea that a diverse array of non-specialized silicic magmas could feasibly contribute some or potentially all of the Au, Ag, and Cu in Carlin-type systems. The compositional diversity among contemporaneous magmatic systems could possibly contribute to some of the diversity observed across Carlin-type Au districts in Nevada.

Graphical Abstract

1. Introduction

Nevada’s world-class Carlin-type Au deposits formed during a time of profuse subduction-related magmatism that swept across Nevada in response to late Eocene to early Oligocene arc migration and rollback of the Farallon slab. Together, the Carlin-type Au deposits compose one of the world’s largest goldfields. The mining of these deposits dominates current Au production in the United States and accounts for ~8% of world Au production. They are also targets for potential recovery of critical by-product minerals such as As, Sb, and Te [1]. Despite the fact that Carlin-type Au deposits share some features with better-understood Au deposits found peripherally about magmatic intrusions (i.e., distal disseminated Au ± Ag, epithermal Au ± Ag), they distinctly lack a clear connection to upper crustal intrusions (e.g., [2]). This has driven controversy over their origin, with evidence supporting many aspects of different geologic models including the recycling of Paleozoic basin-related mineralization (e.g., [3]), two-stage sedimentary-metamorphic models (e.g., [4]), and magmatic models (e.g., [5,6]). The current synthesis of models suggests that while Carlin-type Au deposits probably form by distinctive processes, there likely exists a spectrum of deposits with characteristics ranging between Carlin-type Au, distal disseminated deposits, and epithermal deposits [2]. Carlin-type Au deposits have been discovered in several places around the world outside of Nevada, including in southwestern China and the Yukon.
Carlin-type Au deposits are unique in that Au is found as auriferous arsenian pyrite formed by sulfidation during replacement of carbonate host rocks at relatively shallow levels and warm temperatures (<2 to 3 km, ~180° to 240 °C; [2]). While Carlin-type Au deposits show some metallogenic diversity, Au is typically associated with high concentrations of Tl, As, Hg, Sb, Te, and ±W, but is notably lacking in Ag (Au/Ag >1) and base metals such as Cu, Pb, Zn, Mo, Ni, and Co. Carlin-type Au mineralization is found along trends that are stratigraphically and structurally controlled. The ore lacks veins and alteration lacks classic intrusion-related mineralogical and elemental zonation haloes. Evidence for active magmatic systems overlapping with Carlin-type Au deposits is found at some but not all systems (e.g., [7,8,9]). Recently, the Cortez Hills Carlin-type Au deposit was shown to form simultaneously above deep-seated, polybaric magma reservoirs that were actively dewatering (~4 to 9 km depth, ~720 °C; [10]). While active magmatic–hydrothermal systems appear to be circulating and intertwined with some developing Carlin-type Au systems, the question remains whether they were relevant in deposit formation beyond acting as heat sources driving regional hydrothermal systems. One way to investigate this is to better characterize the associated magmatic systems and their metal budgets.
The deep magmatic model proposed by Muntean et al. [5] postulates that the fortuitous northern Nevada tectonic setting and deep crustal magmatic processes created fundamentally Au/Cu enriched felsic melts that resided in the upper crust and released fluids. This model is built on the idea that subcontinental lithospheric mantle was preconditioned to be Au/Cu-enriched due to previous oxidized mafic arc magmas that deposited high Au/Cu sulfides in lower crustal cumulates (e.g., intermediate solid solutions (ISS) or immiscible S liquid; [11,12]). Then, when the Farallon slab began rolling back beneath northern Nevada at ~45 Ma, the base of the fertile, metasomatized, subcontinental lithospheric mantle was exposed to upwelling asthenosphere. In theory, this could result in formation of large quantities of S- and Au-bearing hydrous, high-Al, basaltic magmas with moderate redox (~ΔNNO). These basalts then underwent MASH processes forming hydrous, S- and Au- bearing, high-K, calc-alkaline magmas of intermediate composition with high Au/Cu ratios. These intermediate magmas would ascend to the Conrad discontinuity (~20 km depth) and form transitory crustal magma chambers where magmas could become saturated with reduced sulfur. Here, monosulfide solid solutions (MSS) preferentially fractionated (rather than ISS due to the already low Cu contents; [13,14]), which incorporated Cu preferentially over Au, increasing the Au/Cu ratio of ascending felsic magmas even further. No saturation of sulfide phases occurred in the shallow crust owing to the now low Cu contents of the magma. Consequently, these felsic magmas were now primed to release magmatic–hydrothermal fluids with high Au/Cu upon final ascent and degassing at relatively deep levels (~10 to 12 km) relative to typical porphyry intrusions (~4 to 5 km).
Alternatively, it has been suggested that arc magmas with typical Au/Cu remained sulfur undersaturated during most of their ascent through the crust, carrying their Au and Cu load until coming into contact with carbonaceous, sulfide-bearing sedimentary host rocks at upper crustal levels (≤10 km; [15]). Upon the assimilation of such lithologies, magmas became reduced causing sulfur to saturate and promoting the release of fluids. Strong partitioning of Au over Cu (~100x) from silicate melt into reduced fluids (and/or vapor) could result, and the transport of such fluids could be enhanced due to buffering by reduced host rock [15,16].
Ongoing research efforts (e.g., mapping, petrography, geochemistry, thermochronology, aeromagnetic surveys) are helping to clarify the size, timing, and geochemical characteristics of relevant magmatic systems (e.g., [7,9,17,18,19]). Recent whole rock and mineral geochemistry analyses on the Emigrant Pass volcanics of [19], which are thought to be extrusive equivalents of intrusions underlying the Carlin trend, suggest that magmas concurrent with Carlin trend mineralization were hydrous (>4 wt% H2O), strongly oxidized (>ΔNNO+2), and Cu depleted. However, further work is required to understand whether Cu was depleted in pre-eruptive magmas due to deep- to mid-crustal sulfide sequestration or during shallow magma ascent processes [19].
In addition to whole rock records that typically reflect time-integrated, late-stage, degassed systems, where metal concentrations may have changed significantly from pre-eruptive conditions, it is informative to characterize pre-eruptive magma compositions via quartz-hosted melt inclusions. They provide snapshots of pre-eruptive, volatile-, and metal-charged magmatic systems. Mercer et al. [20] characterized traditional trace elements and volatile contents in melt inclusions from rhyolitic magmatic centers emplaced contemporaneously (~41 to 34 Ma) and nearby (within 5 km) Carlin-type Au deposits. They found that these systems encompass a remarkably broad compositional “flavor” spectrum. On one end of the spectrum are rhyolites with “I-type” affinity (a term they use for simplicity, primarily to describe an assortment of geochemical characteristics and not to imply specific tectonic interpretations). These rhyolites are generally characterized by calc-alkalic, hydrous, oxidized (>ΔNNO+1), metaluminous to peraluminous melts with small Eu anomalies and overall higher Sr/Y. These melts are best represented in this study by the Beast dike located in the Carlin trend. They are somewhat comparable to the Emigrant Pass volcanics studied by Johnson et al. [19]. On the other end of the spectrum are rhyolites with “A-type” affinity. They are typically high-K calc-alkaline to shoshonite series, less-hydrous (relative to their extent of evolution), more reduced (<ΔNNO+1), peraluminous to hyperaluminous melts that extend to more F-enriched, highly fractionated compositions with pronounced Eu anomalies. These are best represented in this study by the samples from the Caetano caldera suite, located in the Battle Mountain–Eureka trend. These geochemically varied rhyolites should express diversity in metallogenic potential as well [21]. Therefore, they provide an ideal suite to characterize the pre-eruptive metal fingerprint of Eocene magmas coincident with Carlin-type Au mineralization and to evaluate their potential to contribute metals to Carlin-type Au deposition.
Using new in situ, high-sensitivity microanalyses (laser ablation-inductively coupled plasma-mass spectrometry, LA-ICP-MS; sensitive high-resolution ion microprobe-reverse geometry, SHRIMP-RG) of quartz-hosted silicate melt inclusions, we provide the first direct evidence of the pre-eruptive metal budget of volatile-charged magmas coincident in time and space with Carlin-type Au deposits. To statistically characterize the metal fingerprint of these magmatic systems, we employ both traditional statistics and compositional data principal component analysis (CoDa-PCA). Finally, we carry out fluid/melt partitioning modeling to estimate the composition of hypothetical exsolved magmatic fluids from each magmatic center and consider magma volume estimates to discuss the feasibility of such fluids to contribute metal components to Carlin-type Au systems.

2. Materials and Methods

2.1. Sample Preparation and Microanalysis

Samples for this study represent several different volcanic centers (~41 to 34 Ma) that are contemporaneous with and nearby (within 5 km) Carlin-type Au deposits. Carlin-type systems characteristically lack clear field relationships to causative intrusions; therefore, we consider these samples “suspect” magmas. Samples include an assortment of rhyolite tuffs, porphyry rhyolite dikes, a large ignimbrite with its ring fracture porphyry dike, and a rhyolite dome, totaling 14 hand samples. They include (1) tuff samples of Nanny Creek (informally named “Nanny Creek tuff”), the type location for the Northeast Nevada volcanic field defined by [22] in the Long Canyon trend; (2) dike samples from the Beast and Genesis pits (informally named “Beast dike” and “K dike” [23], respectively), in the northern Carlin trend; (3) dike samples from the Cortez Hills pit (informally named “Cortez rhyolites” by [9], further informally broken into “Cortez Hills dikes” including the “Crusher dike”, “Middle dike”, “F-Canyon dike”, and “High Wall dike” (personal communication [24]), in the Battle Mountain–Eureka trend; (4) samples of the Caetano Tuff (upper and lower tuff units) and Fortress Fault dike (informal name of [25]), collectively informally referred to here as the “Caetano caldera suite” in the Battle Mountain–Eureka trend; (5) a dome sample (informally named “Eureka dome”) from the Target Hill rhyolite of [26] at the southern end of the Battle Mountain–Eureka trend; and (6) a dike sample (informally named “Mooney Basin dike”) near Bald Mountain in the informally named “Mooney Basin” of [27] at the northern end of the Alligator Ridge trend. A summary of samples and their relationship to nearby mineralization (e.g., pre-, syn-, and post-mineralization) is provided in Table 1 and detailed further in Supplementary Materials S1.1 and Mercer et al. [20].
Polished thick sections were prepared for petrographic and scanning electron microscope (SEM) analysis using a FEI Quanta 450 field emission gun SEM operating with a 15 kV and 0.1–0.5 nA beam at the USGS Denver Microbeam Laboratory. We crushed a portion of each sample and prepared mineral separates for melt inclusion selection. Quartz-hosted melt inclusions were prepared and analyzed following the recommended best practices of Esposito [37] and Rose-Koga et al. [38]. Some inclusions were analyzed directly by LA-ICP-MS, whereas a subset of inclusions was experimentally reheated and quenched to glass to facilitate analysis by SHRIMP-RG.
Batch reheating experiments were conducted using ZHM (zirconium-hafnium-molybdenum) cold-seal pressure vessels housed at the U.S. Geological Survey in Menlo Park, CA. Quartz crystals were loaded into Pt capsules that were crimped shut and open to the argon pressure medium. Experiments were run at 140–150 MPa (maintained within ±3 MPa) and a target temperature of 1010 °C (maintained within ±7 °C) for 30–40 min to maximize homogenization and minimize elemental diffusion, following the methods of [39]. The Mo-bearing pressure vessel buffers the fO2 at reducing conditions of <Mo-MoO2 (T. Sisson, personal communication), or ~FMQ-4.5 (FMQ = fayalite-magnetite-quartz). Experiments were quenched rapidly (≥200 °C/s) following the method of [40]. After quenching, the capsules were opened and quartz grains hosting glassy, fully enclosed silicate melt inclusions were selected for analysis. Additional experimental details are further detailed in Supplementary Materials S1.2 and Mercer et al. [20].
Due to the low expected concentrations of Au, we first analyzed 87 glassy melt inclusions by reverse geometry ion microprobe at Stanford University using the Australian Scientific Instruments SHRIMP-RG. Gold, as well as Co, Ni, As, Sb, and Te, was analyzed using with a 5 nA Cs+ primary beam focused to a 20 μm spot. Elemental concentrations were calculated by calibrating a York linear regression to the average standard data for the ATHO-G, NIST 611, NIST 613, and NIST 615 standard glasses. Relative precision is <10% for Co, Ni, and Au and <20% for As, Sb, and Te based on replicate analyses of glass standards. Additional analytical details including elemental calibrations and detection limits are reported in Supplementary Materials S1.3.
Other trace metals (Cu, Zn, Mo, Ag, Sn, W, Au, Tl, and Pb) were then analyzed in 161 melt inclusions (91 glassy and 70 crystalline) by LA-ICP-MS at the University of Toronto using a NWR 193 nm UC laser ablation system with an Agilent 7900 quadrupole mass spectrometer optimized with two setups: one for analysis of homogenous glass inclusions and the other for drilling through quartz and analyzing whole crystalline inclusions. The NIST 610 glass was used as the primary reference material for all analyses and GSD-1G was used as the secondary standard for all analyses. Based on replicate analyses of the standard glass, the relative precision for all measured elements is <10% except for Au, which is within ~20%. A total of 146 inclusions (out of 248 analyzed) resulted in successful metal data acquisition, although not all metals were measurable in all samples. The best Au analysis between the two methods for any given sample is reported. Additional analytical details, acquisition parameters, and detection limits are summarized in Supplementary Materials S1.4.

2.2. Assessment of Post-Entrapment Modifications

This study encompasses results from successful microanalysis of 146 melt inclusions, including 90 reheated glassy and 56 unheated crystalline inclusions. Post-entrapment modifications are known to occur and can alter original melt inclusion compositions (e.g., [38,41,42,43,44,45,46]). A detailed assessment of post-entrapment modifications for these samples is provided in Supplementary Materials S1.5 and a summary is provided here. A comparison of compositions of reheated (glassy) and unheated (crystalline) melt inclusions from each magmatic center shows that reheated inclusions are indistinguishable to within 1σ standard deviation from unheated inclusions for all elements, with the exception of a few samples in which univalent cations (Ag+ and Cu+) are within about 2σ standard deviations. (Figure S1.5.1). Therefore, we do not distinguish between them moving forward in the manuscript.
Both Ag+and Cu+ may be prone to potentially notable post-entrapment diffusion (e.g., [42]), so we evaluated these more carefully. Diffusion can be difficult to quantify because it may overprint the natural variability within samples and can occur naturally during post-entrapment processes (e.g., cooling of a tuff or dike) and/or during reheating experiments. A comparison of mean Ag contents measured in reheated and unheated inclusions shows that in five of the seven magmatic centers, Ag is indistinguishable to within 1σ standard deviation (Figure S1.5.1). However, in one magmatic center (K dike) Ag appears to be markedly depleted in reheated melt inclusions, whereas in another (Beast dike), Ag is notably enriched. Likewise, a comparison of mean Cu contents in reheated and unheated inclusions shows that while Cu generally displays more variability than other elements (presumably due to diffusion of some kind), Cu is indistinguishable to within 1σ standard deviation in four of the magmatic centers and is within or close to 2σ standard deviations in the remaining three magmatic centers (Figure S1.5.1). It is unclear why some reheated inclusions might experience Ag or Cu enrichment or depletion whereas others do not, and why this would be inconsistent among samples that all experienced the same reheating conditions. With no consistent pattern of enrichment or depletion in reheated samples, we, therefore, assume that any post-entrapment diffusion of Ag or Cu that may have taken place dominantly occurred naturally (i.e., in the ground) and any that occurred during reheating experiments was secondary. We conclude that these data remain reasonable best estimates of pre-eruptive Ag and Cu contents, and present Ag and Cu data from both reheated and unheated inclusions.
The majority of melt inclusions in this study are bubble-free; however, about one third of inclusions contain bubbles that represent either co-trapped supercritical fluid or post-entrapment leakage that could signal partitioning or loss of mobile elements into the bubble (e.g., [47,48]). Silver contents do not show a strong correlation with bubble size (Figure S1.5.2). Copper contents are generally low in bubble-bearing inclusions with ≥15 vol% bubbles. Copper loss to bubbles is not well-documented; however, a conservative approach would be to consider samples with larger bubbles to be minimum estimates for Cu, which only affects ~8% of the Cu data.

2.3. Compositional Data (CoDa) Approach

Classic 2- to 3-dimensional geochemical interrogation methods of absolute concentrations (e.g., scatterplots, ternary diagrams) provide useful but sometimes limited insights for systems where multiple processes may compete to control the variability of geochemical patterns we observe (e.g., different lithospheric source components, anatexis, crystallization, sulfide/sulfate saturation and/or dissolution, metal partitioning during magma ascent and degassing). Indeed, Mercer et al. [20] resorted to a radar spider diagram with 11 axes in an effort to summarize the key variance in geochemical characteristics among the magmatic centers studied herein. For such high-dimensional compositional data, it is often advantageous to employ multivariate data analysis techniques [49].
Principal component analysis (PCA) is a popular multivariate exploratory method used for dimension reduction. It enables mathematical transformation of high-dimensional data expressed in the appropriate orthonormal coordinate system into a lower (typically two-) dimensional projection that can better highlight the key structure and systematics of the data. Essentially, it emphasizes which components contribute most to the variability of a given dataset by expressing the data as a new set of mutually orthogonal variables, called principal components. Principal components are constructed as a linear combination of the original variables and are mutually uncorrelated. The construction of principal components aims at the maximization of variance: The first principal component maximizes the variance of the original data, and subsequently derived components maximize the remaining variance. To apply PCA on datasets that are compositional in nature, the data first need to be transformed and represented in an appropriate coordinate system.
To handle our data, we have followed the compositional data (CoDa) approach originated by J. Aitchison [50,51], further developed and summarized by many (e.g., [52,53,54,55]) and recently advocated by [49]. In this approach, geochemical data are explored as parts of a whole containing relative information. For this portion of the analysis, ratios of elemental components are the fundamental starting point for descriptions, rather than absolute concentrations. This CoDa approach allows us to explore metal “fingerprints”, or relationships between relative abundances of metals in samples from each magmatic center.
In CoDa-PCA analysis, the first step is to apply the centered logratio (clr) transformation to the data. This transformation yields scale invariant data, clr(X), where multivariate analysis can be applied. This is followed by an additional centering step, yielding the centered matrix cclr(X). Next, we performed the singular value decomposition (SVD) of cclr(X) (see Equation (3) of [49]):
c c l r X = U Λ V T ,   V T V = I D , U U T = I N ,
where Λ is a diagonal matrix containing the singular values ( λ 1 ,   λ 2 ,   ,   λ D ). The standardized coordinates of the data, commonly called scores, are contained in the matrix U. The columns of the orthogonal matrix V are commonly called the loadings. The values of the loadings may be normalized to range from −1 to +1 and are coefficients that describe the influence of the variables on the scores. The singular values, λ i , may be used to determine the proportion of the total variance that can be explained by each principal component (in percent): %   v a r i a n c e = 100 · λ i / i λ i .
Scores can then be visualized easily on a two-dimensional diagram, a CoDa-PCA biplot, and their loadings can be overlaid to facilitate discovery of key relationships among groups of samples and variables. Note that principal components (i.e., scores) are a transformation of the original compositional data and do not always represent a geochemical quantity or geologic process. Therefore, they should be interpreted with care, and we revisit this in the discussion.
Because CoDa analysis depends on log-transformations (clr, in this case) of continuous concentration data, missing data (NA) and data below detection limits (<DL) may cause difficulties. Since in situ microanalytical data commonly contain values below detection limits, we had to choose procedures that maximized what we could learn from the available data. First, we chose to eliminate any missing data. Then, because the concentrations of metals span many orders of magnitude, only a few elements range below detection limits, and those limits of detection are relatively small compared to the overall data range, we chose to use 1.0 × DL as the simplest approximation for the maximum estimate for values below detection. (Note: We did test using 0.5 × DL as the maximum estimate for these values; however, there was no significant change to the results. The sample space ordination and loadings were very similar.)
To perform CoDa-PCA, we first filtered the data to find all analyses with valid data (non-zero, above detection limit) for a desired set of metals (Nb, Cu, Zn, As, Mo, Ag, Sn, Sb, Te, W, Au, Tl, and Pb). The data were then loaded into R v4.2.2 and transformed. The function for the clr transformation, centering the data, and obtaining the SVD to perform the PCA was completed following the methods of Le Moine Bauer et al. [56]. The function was modified to extract tables containing clr values and centered clr values. In this function, we selected biscale = 1 to generate covariance biplots and show the standard deviations of the loadings. Scores and loadings were visualized in biplots created using ggplot2 v3.5.1. To show the scores and loadings clearly in the same biplot, score values were multiplied by a factor of 2.

2.4. Fluid/Melt Partitioning Model

Applying current best estimates for aqueous fluid/silicate melt partition coefficients, we used the individual melt inclusion compositions to calculate hypothetical exsolved magmatic fluids. Our model first applied the entrapment pressure, temperature, fO2, Cl/H2O, S, and alkali contents specific for each melt inclusion (reported in [20]) combined with granite-H2O-CO2-NaCl solubility models [57,58,59] to (1) predict whether the melts would be saturated with a magmatic hydrosaline fluid, (2) determine the stable phase of such a fluid (i.e., supercritical fluid, liquid, vapor, brine) and (3) determine the salinity of exsolved aqueous fluids. We then used this information to select the most appropriate experimentally derived aqueous fluid/silicate melt partition coefficients available in the literature, specific to each metal component (summarized in Supplementary Materials S1.6; [60,61,62,63,64]). Finally, we multiplied each melt inclusion metal concentration by the selected fluid/melt partition coefficient, returning the approximate metal concentration in exsolved aqueous fluids. This model assumes a simple single fluid-generating event. Applying our best estimates for these parameters facilitates a first-order approximation of the metal budget and metal ratios in exsolved fluids.

3. Results

3.1. Pre-Eruptive Metal Budgets of Magmas

Most metal contents were easily measured in melt inclusions (Se, Tl, Mo, W, Sn, As, Pb, Co, Ni, and Zn); however, Au and Te were particularly challenging (with 73% and 87% of analyses below detection limits, respectively). Antimony, Ag, and Cu were also challenging (37%, 27%, and 21% of analyses below detection limits, respectively). Thus, data for these metals are less robust than the others but certainly capture the upper end of pre-eruptive metal concentrations within uncertainties (Supplementary Materials S1 and S2).
Absolute metal concentrations in rhyolite melts that are typically enriched in Carlin-type Au mineralization range from <3–266 ppb Au (median = 16 ppb; ranging notably well above average upper crust and continental crustal rhyolite, Figure 1), <16–44 ppb Te (median = 29 ppb), <0.2–2.2 ppm Sb (median = 0.29 ppm), 0.2–6.3 ppm Tl (median = 1.2 ppm), 0.5–7.4 ppm W (median = 2.5 ppm), and 0.5–22 ppm As (median = 1.7 ppm). Silver and base metal concentrations typically depleted in Carlin-type mineralization range from <0.02–1.5 ppm Ag (median = 0.13 ppm), 0.1–9 ppm Mo (median = 2 ppm), 0.7–25 ppm Sn (median = 4.5 ppm), 1–82 ppm Pb (median = 31 ppm), 0.2–2.3 ppm Co (median = 0.5 ppm), <0.04–39 ppm Cu (median = 2 ppm), 4–18 ppm Ni (median = 7 ppm), and 10–153 ppm Zn (median = 42 ppm). Metal concentrations in melt inclusions range widely regardless of their age and timing relative to nearby Carlin-type Au mineralization (i.e., pre-, syn-, or post-ore; Figure 1 and Figure 2, Supplementary Materials S2.4). Nevertheless, median values of metal concentrations are generally within one order of magnitude of average upper crust and average continental crustal rhyolite values, with a few notable exceptions: (1) Median Au content extends >1 order of magnitude higher than upper crust, comparable to melt inclusions from magmatic systems parental to porphyry Cu–Mo–Au deposits; and (2) median Cu content ranges >1 order of magnitude lower than upper crust and ~2 orders of magnitude lower than melt inclusions from magmas parental to porphyry Cu–Mo–Au deposits. Concentrations of Co and Ni also range 1 to 2 orders of magnitude lower than upper crust. Note that the detection limitations for Au and Te, in particular, would have the effect of skewing their measured distributions somewhat higher, but it is difficult to estimate how much higher. In scatter plots displaying metals as a function of Nb (i.e., a proxy for extent of melt evolution; Figure 2), some metals show moderately incompatible behavior (e.g., W, Sn, Pb, Zn concentrations show a positive correlation with Nb). However, many metal concentrations scatter widely (e.g., Au, Ag, Cu) regardless of the extent of melt evolution and the timing of magmatism (i.e., pre-, syn-, or post-mineralization).
For reference, in intermediate composition Cu–Mo–Au mineralizing systems, parental magma metal budget estimates from melt inclusions range from 50–90 ppm Cu, 2–3 ppm Mo, and 0.8–2.0 ppb Au, whereas mafic magma components contain even higher Cu concentrations (150–360 ppm; Figure 1; [67]). In more high-Si (and bimodal) Climax-type Mo systems, felsic magmas contain only modest amounts of Mo (2–25 ppm; [68]). In comparison to intermediate and felsic melt inclusions in systems parental to porphyry Cu–Mo–Au deposits, rhyolite melts in this study reach to notably high levels of Au (some inclusions contain several orders of magnitude more Au), contain average to low levels of Mo (largely within one order of magnitude of porphyry Cu–Mo–Au forming systems), and include conspicuously low Cu contents (generally more than an order of magnitude low; Figure 1).
Magmatic–hydrothermal metal concentrations alone, however, cannot predict the mineralization potential of such systems (e.g., [71]). Indeed, in porphyry Cu–Mo–Au mineralizing systems, ore-forming magmas are not thought to contain extraordinary amounts of metals compared to barren magmas (e.g., [67,68]). Instead, they are thought to be productive mineralizing systems if magmas can contribute large quantities of metals by some combination of becoming long-lived magmatic systems (e.g., [72]), attaining large magma volumes [73], developing structures that promote focused fluid flow [71], and delivering efficient metal extraction [67,68].

3.2. Metal Fingerprints of Pre-Eruptive Magmas
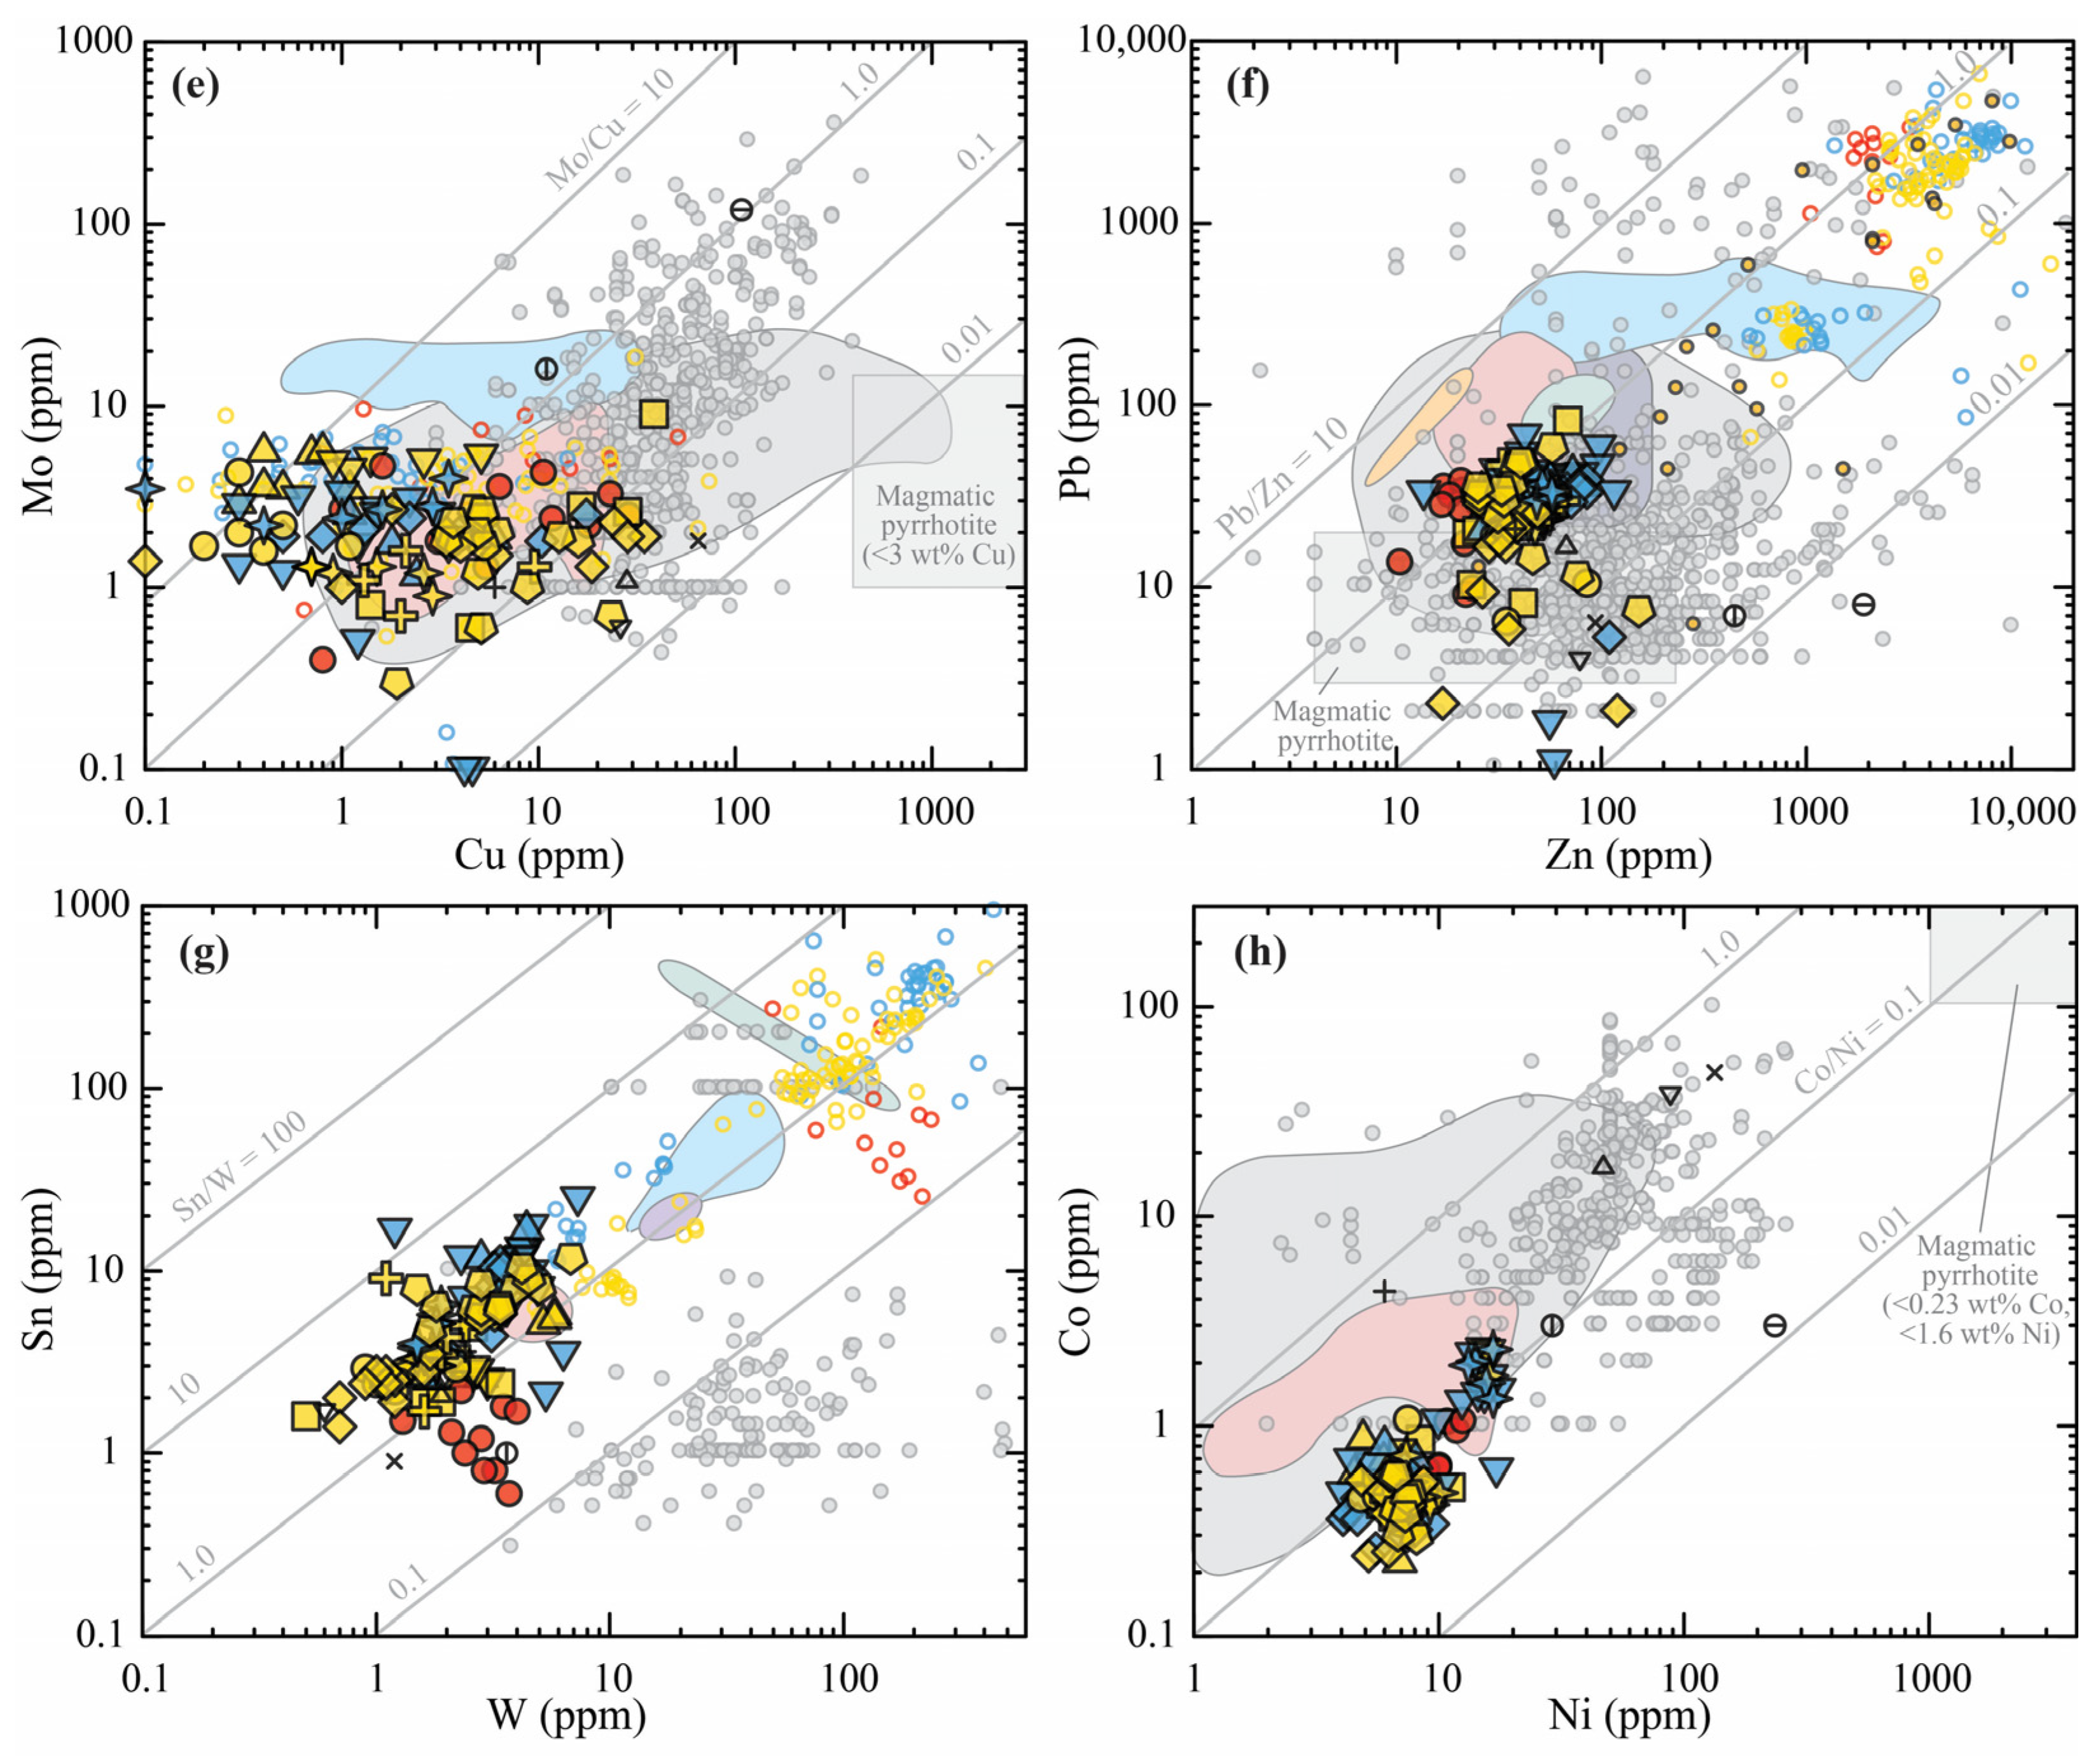
The specific metal fingerprints (i.e., relationships between relative abundances of metals) of magmatic systems are typically inherited by their various melt sources and evolutionary pathways through the crust in any given tectonic setting, which can exert a strong control on metal variety and endowment of resultant ore deposits (e.g., [21,74,75]). We explore the relative abundance of metals among these geochemically diverse rhyolite systems first with traditional analysis of elemental ratios and then applying a more rarely applied but powerful multivariate compositional data approach.

3.2.1. Metal Ratios

Scatterplots highlighting key metal ratios are shown in Figure 3 with Carlin-type ore, regional igneous whole rock data, and melt and sulfide inclusions from various mineralized igneous systems shown for reference. Melt inclusions have notably lower Au/Cu (~0.0005–0.1), Au/Ag (~0.05–5), and Au/Tl (~0.001–0.3) than do ore-grade Carlin-type rock samples and quartz-hosted fluid inclusions, the latter of which there are precious few data for due to the difficulty of finding fluid inclusions in fine grained ore samples. While a few syn- and post-ore melts attain Au/Cu ratios that overlap those of low-grade Carlin-type ore, most pre-, syn-, and post-ore melts overlap with ratios documented in ore and fluid inclusions from large porphyry Cu–Au ± Mo deposits (e.g., Au/Cu < 0.005; [76,77]). Similarly, a few syn- and post-ore melts have Au/Ag ratios that overlap with those of low-grade Carlin-type ore, but the majority of pre-, syn-, and post-ore melts have Au/Ag ratios closer to those recorded in distal disseminated Ag–Au ore (e.g., Au/Ag < 1.0; [78]). Ratios of As/Sb span a relatively narrow range (~2–80) but are largely indistinguishable from Carlin-type Au ore and melts parental to many different ore-forming systems (e.g., Climax-type porphyry Mo, epithermal Ag–Au, base metal-Ag mineralized granite) and barren granite. Absolute As and Sb concentrations and As/Sb are similar to those found in melts parental to Climax-type porphyry-Mo and epithermal Ag–Au mineralizing systems.
Mo/Cu ratios span a range similar to Carlin-type ore and overlap with S-saturated melts parental to porphyry Cu–Au systems, as well as epithermal Ag–Au systems (Figure 3). While no rhyolite melt inclusions attain the high Cu contents of intermediate composition melts parental to the Bajo de la Alumbrera porphyry Cu–Mo–Au deposit (>200 ppm), they do attain moderate Cu concentrations similar to the hybridized felsic melts at Bajo de la Alumbrera (~3–100 ppm) and overlap with sulfide-saturated parental melts from Bajo de la Alumbrera (2–3 ppm; [88]). Absolute Cu concentrations also extend to concentrations much lower than any mineralizing parental melts (<1 ppm). Ratios of Pb/Zn span a relatively narrow range and are similar to Carlin-type ore. However, concentrations and ratios of Pb/Zn overlap with melts parental to Climax-type porphyry-Mo systems (which are anomalously enriched in Pb and Zn, as well as W, Cu, and Ag; [89]) and also with porphyry Cu–Au and epithermal Ag–Au systems (which are also typically anomalously enriched in Pb and Zn). Ratios of Sn/W are generally higher than Carlin-type ore samples and span a range similar to melts from several other ore-forming systems, yet they do not attain the high concentrations of melts parental to Sn-W mineralizing granites. As with Pb/Zn, Co/Ni ratios span a narrow array overlapping with some Carlin-type ore and overlapping slightly with melts parental to epithermal Au–Ag deposits.

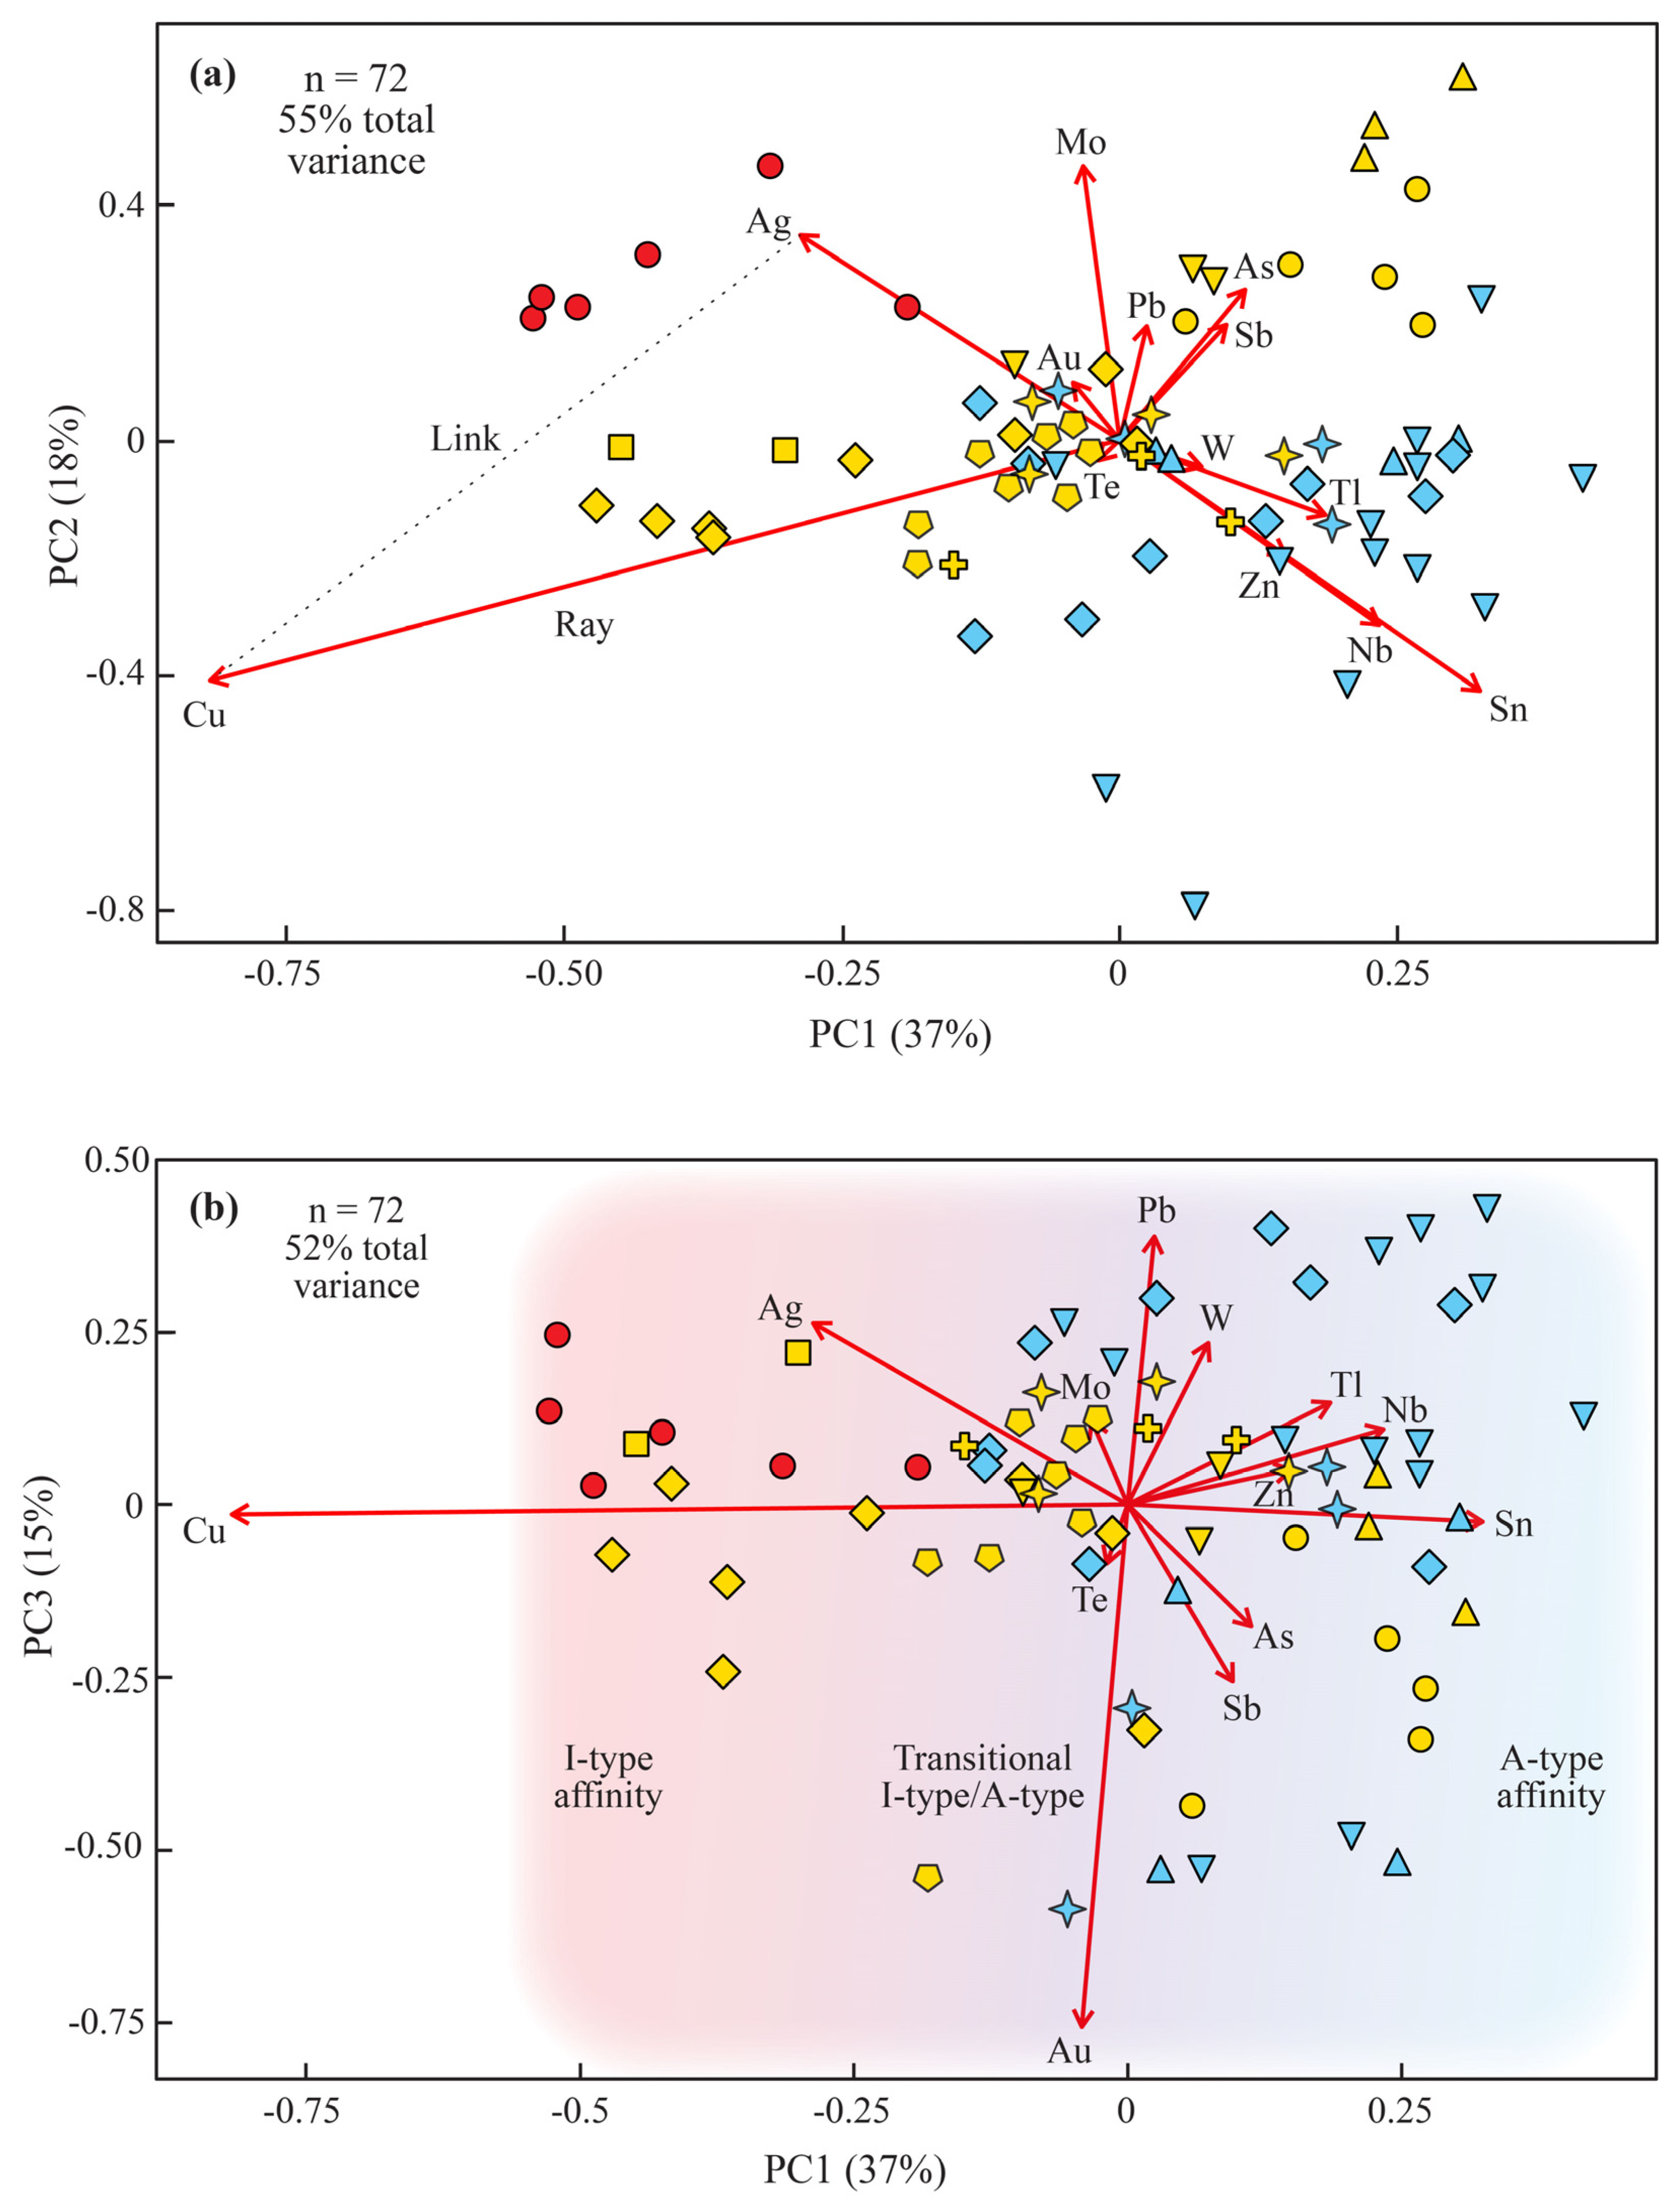
3.2.2. A Multivariate View: Compositional Data Principal Component Analysis (CoDa-PCA)

Although PCA was developed over a century ago and CoDa-PCA has been applied broadly in several fields of geoscience in the past few decades (e.g., [90,91,92,93,94,95,96]), it has seen little application for in situ microanalytical geochemical data. As of this writing, we are aware of only one other brief application to melt inclusion studies (melt inclusions from Mount Etna; [97]).
Due to the absence of PCA applications in the melt inclusion field, we first provide some basic guidelines to orient the reader on how to interpret the CoDa-PCA biplots that follow (e.g., [49,52,53,98]). The biplots below (Figure 4) depict scores (plotted as points) and loadings (plotted as vectors or “rays”) on two axes. The axes themselves represent the principal components. The scores represent the total composition of a given sample, whereas the loadings indicate how an input variable (e.g., Cu) contributes to the principal component. Differences between clusters of data along the first PC axis (PC1) are more important than differences between clusters along the second PC axis (PC2), as PC1 accounts for more variance in the data. Singular values associated with the PCs indicate the proportion of total variance in the data that is explained by a given principal component and is presented as either total % variance (for a single PC) or cumulative % variance (for combinations of PCs). The length of the loading vector is related to the standard deviation and indicates how an input variable (e.g., Cu) contributes to the principal component. The longer the ray (the larger the relative magnitude of the loading), the more important that variable is to the principal component. A positive loading (ranging to +1) indicates that a variable’s presence contributes to some degree to the principal component, whereas a negative loading (ranging to −1) indicates that its absence contributes to some degree to the principal component. Important information resides in these rays and in the links between them. Links connect two rays from tip to tip and are proportional to the standard deviation of the logratios of the two loadings (rays). When the rays are co-linear (i.e., the link between them is short), this suggests that the two variables are proportional, and their logratios are positively correlated. In contrast, when the rays point in opposite directions, the two variables are inversely proportional and their logratios are negatively correlated. When rays are roughly orthogonal, this indicates the two variables are uncorrelated, and their logratios are dispersed. Subcompositions (i.e., pairs of rays) can be analyzed in a similar way. For example, links among subcompositions that are co-linear mean that the subcompositions are proportional, whereas subcomposition links that are orthogonal suggest that the subcompositions are independent. While biplots are not specific tools for distinguishing clusters of data, distinct groupings of data suggest that their centers (geometric means) are distinct.
Below, we summarize the results of CoDa-PCA for melt inclusion data in a 13-component scenario including Cu, Zn, As, Mo, Ag, Sn, Sb, Te, W, Au, Tl, Pb, and Nb. In particular, Au, Tl, As, Sb, Te, and W are of interest because these elements are enriched in Carlin-type ores (Figure 3a–d). Base metals such as Cu, Pb, Zn, and Mo are also important because their absence is notable in Carlin-type ores (relative to other Au deposits e.g., porphyry Cu–Mo–Au; Figure 3e–h). Copper and Ag are particularly important to capture the characteristic deficiency of these elements relative to Au in Carlin-type deposits (e.g., Au/Ag >1 in Carlin ores; Figure 3a,b). Niobium was included as a direct link to a geologic process, magma evolution (as modeled by Rayleigh fractional crystallization in [20]). Tin also behaves incompatibly (Figure 2). For simplicity, we exclude Co and Ni from PCA because they are less relevant to Carlin-type systems and add little additional insight in this context (see Supplementary Materials S3 for biplots including Co and Ni). Excluding them has the advantage of including more continuous samples and reducing noise. CoDa-PCA analysis for this 13-component combination returned 72 continuous sample results. A summary of results from CoDa-PCA is given in Table 2. A complete list of principal component scores for each sample is given in Supplementary Materials S3.1.
Together, the first three principal components account for most of the data variability (71% cumulative variance) so we focus largely on these three in CoDa-biplots (Figure 4). The first principal component captures 37% of the variance and reveals that metal distributions are dominated by the contrasting variance of Cu and Sn (Figure 4a, Table 2), whose link is parallel to the first principal component. Samples that have high positive PC1 scores are relatively rich in Sn and poor in Cu, whereas those with high negative PC1 scores are the opposite; they are relatively rich in Cu and poor in Sn. Weaker positive loadings on PC1 include Nb, Zn, Tl, As, and Sb, and PC1 also displays a weak negative loading of Ag. The second principal component captures 18% of the variance (for a cumulative variance of 55% with PC1) and is dominated by a strong positive loading of Mo and Ag and negative loadings of Sn, Cu, and Nb (Figure 4a, Table 2). Loadings for Au, Te, and W are near the origin, and, thus, their variance does not contribute much to either PC1 or PC2. The links between Sn, Nb, Zn, and Tl are co-linear and short, suggesting these elements are highly proportional (i.e., their logratios are positively correlated, e.g., Nb-Sn, Supplementary Materials S3.2). There are relatively short links between Ag, Mo, and fluid-mobile chalcophile elements such as As, Pb, and Sb as well, suggesting some degree of proportionality. Silver is inversely proportional with Sn, Nb, and Zn (i.e., their rays point opposite of each other and their logratios are inversely correlated, e.g., Nb-Ag, Supplementary Materials S3.2). Copper is roughly orthogonal to Ag, as well as Sn, Nb, and Zn, suggesting these metal concentrations are largely independent from that of Cu (i.e., their logratios are poorly correlated, e.g., Nb-Cu, Supplementary Materials S3.2). Arsenic and Sb are co-linear and roughly inversely proportional to Cu. The third principal component accounts for 15% of the variance and is dominated by a strong negative loading of Au and positive loading of Pb, Ag, and W (Figure 4b, Table 2). Thus, samples that have high positive PC3 scores are relatively rich in Pb, Ag, and W and poor in Au, whereas those with high negative PC3 scores are the opposite; they are relatively rich in Au and poor in Pb, Ag, and W. Weaker negative loadings include Sb and As. In this PC1-PC3 projection, rays for Au and Cu (and PC1) are orthogonal, suggesting they are uncorrelated.
A glance at the loadings in Table 2 reveals further details in the data not seen on the biplots. Notably, the fourth principal component brings the cumulative variance to 80% and it is driven by the absence of Pb and Au and the presence of As and Sb, whereas the fifth principal component accounts for another 5% of the overall variance (85% total) and is dominated by the presence of Ag and absence of As and Mo.
Samples span a range of PC scores and generally spread out according to their overall compositional characteristics (I-type, transitional I-type/A-type, A-type; Figure 4; [20]). Samples with I-type affinity (e.g., pre-ore Beast dike and syn-ore K dike) generally cluster with the lowest PC1 scores and relatively high PC2 scores, indicating that they are relatively Cu–Ag–Mo-rich relative to the other 10 metals analyzed here. Transitional I-type/A-type samples (syn-ore Nanny Creek tuff and Cortez Hills dikes) display nearly the full range of PC1, PC2, and PC3 scores. In contrast, samples with A-type affinity (e.g., syn-ore Mooney Basin dike and post-ore Eureka dome and Caetano caldera suite) return the most positive PC1 and negative PC2 scores, signifying they are richer in elements such as Sn, Nb, and Zn relative to the other metals considered.

3.3. Modeled Magmatic Fluids

Fluid/melt partition coefficients applied range from ~0.8 to 100 depending on the specific metal in question and the physical entrapment conditions and chemical characteristics of each melt inclusion. Consequently, in most cases, the exsolved fluids contain a higher concentration of metals than the silicate melts. Calculated compositions of hypothetical exsolved magmatic fluids are summarized in Supplementary Materials S2.5 and plotted in Figure 3 (open-colored circles). Overall fluids have modest salinity (median = 17 wt% NaCl equiv.), but some are brines (up to 38 wt% NaCl equiv.). Like the silicate melt metal budget, the fluid metal budget varies up to several orders of magnitude. Exsolved fluids contain 0.1–73 ppm Cu (median = 3 ppm), 0.3–75 ppm Ag (median = 5 ppm), 520–15,300 ppm Zn (median = 3400 ppm), 66–6600 ppm Pb (median 1900 ppm Pb, 0.1–120 ppm Mo (median = 4 ppm), 5–440 pp, W (median = 100 ppm), 6–980 ppm Sn (median = 120 ppm), 1–175 ppm As (median = 4 ppm), 1–30 ppm Sb (median = 8 ppm), and 0.1–32 ppm Au (median = 1 ppm).

4. Discussion

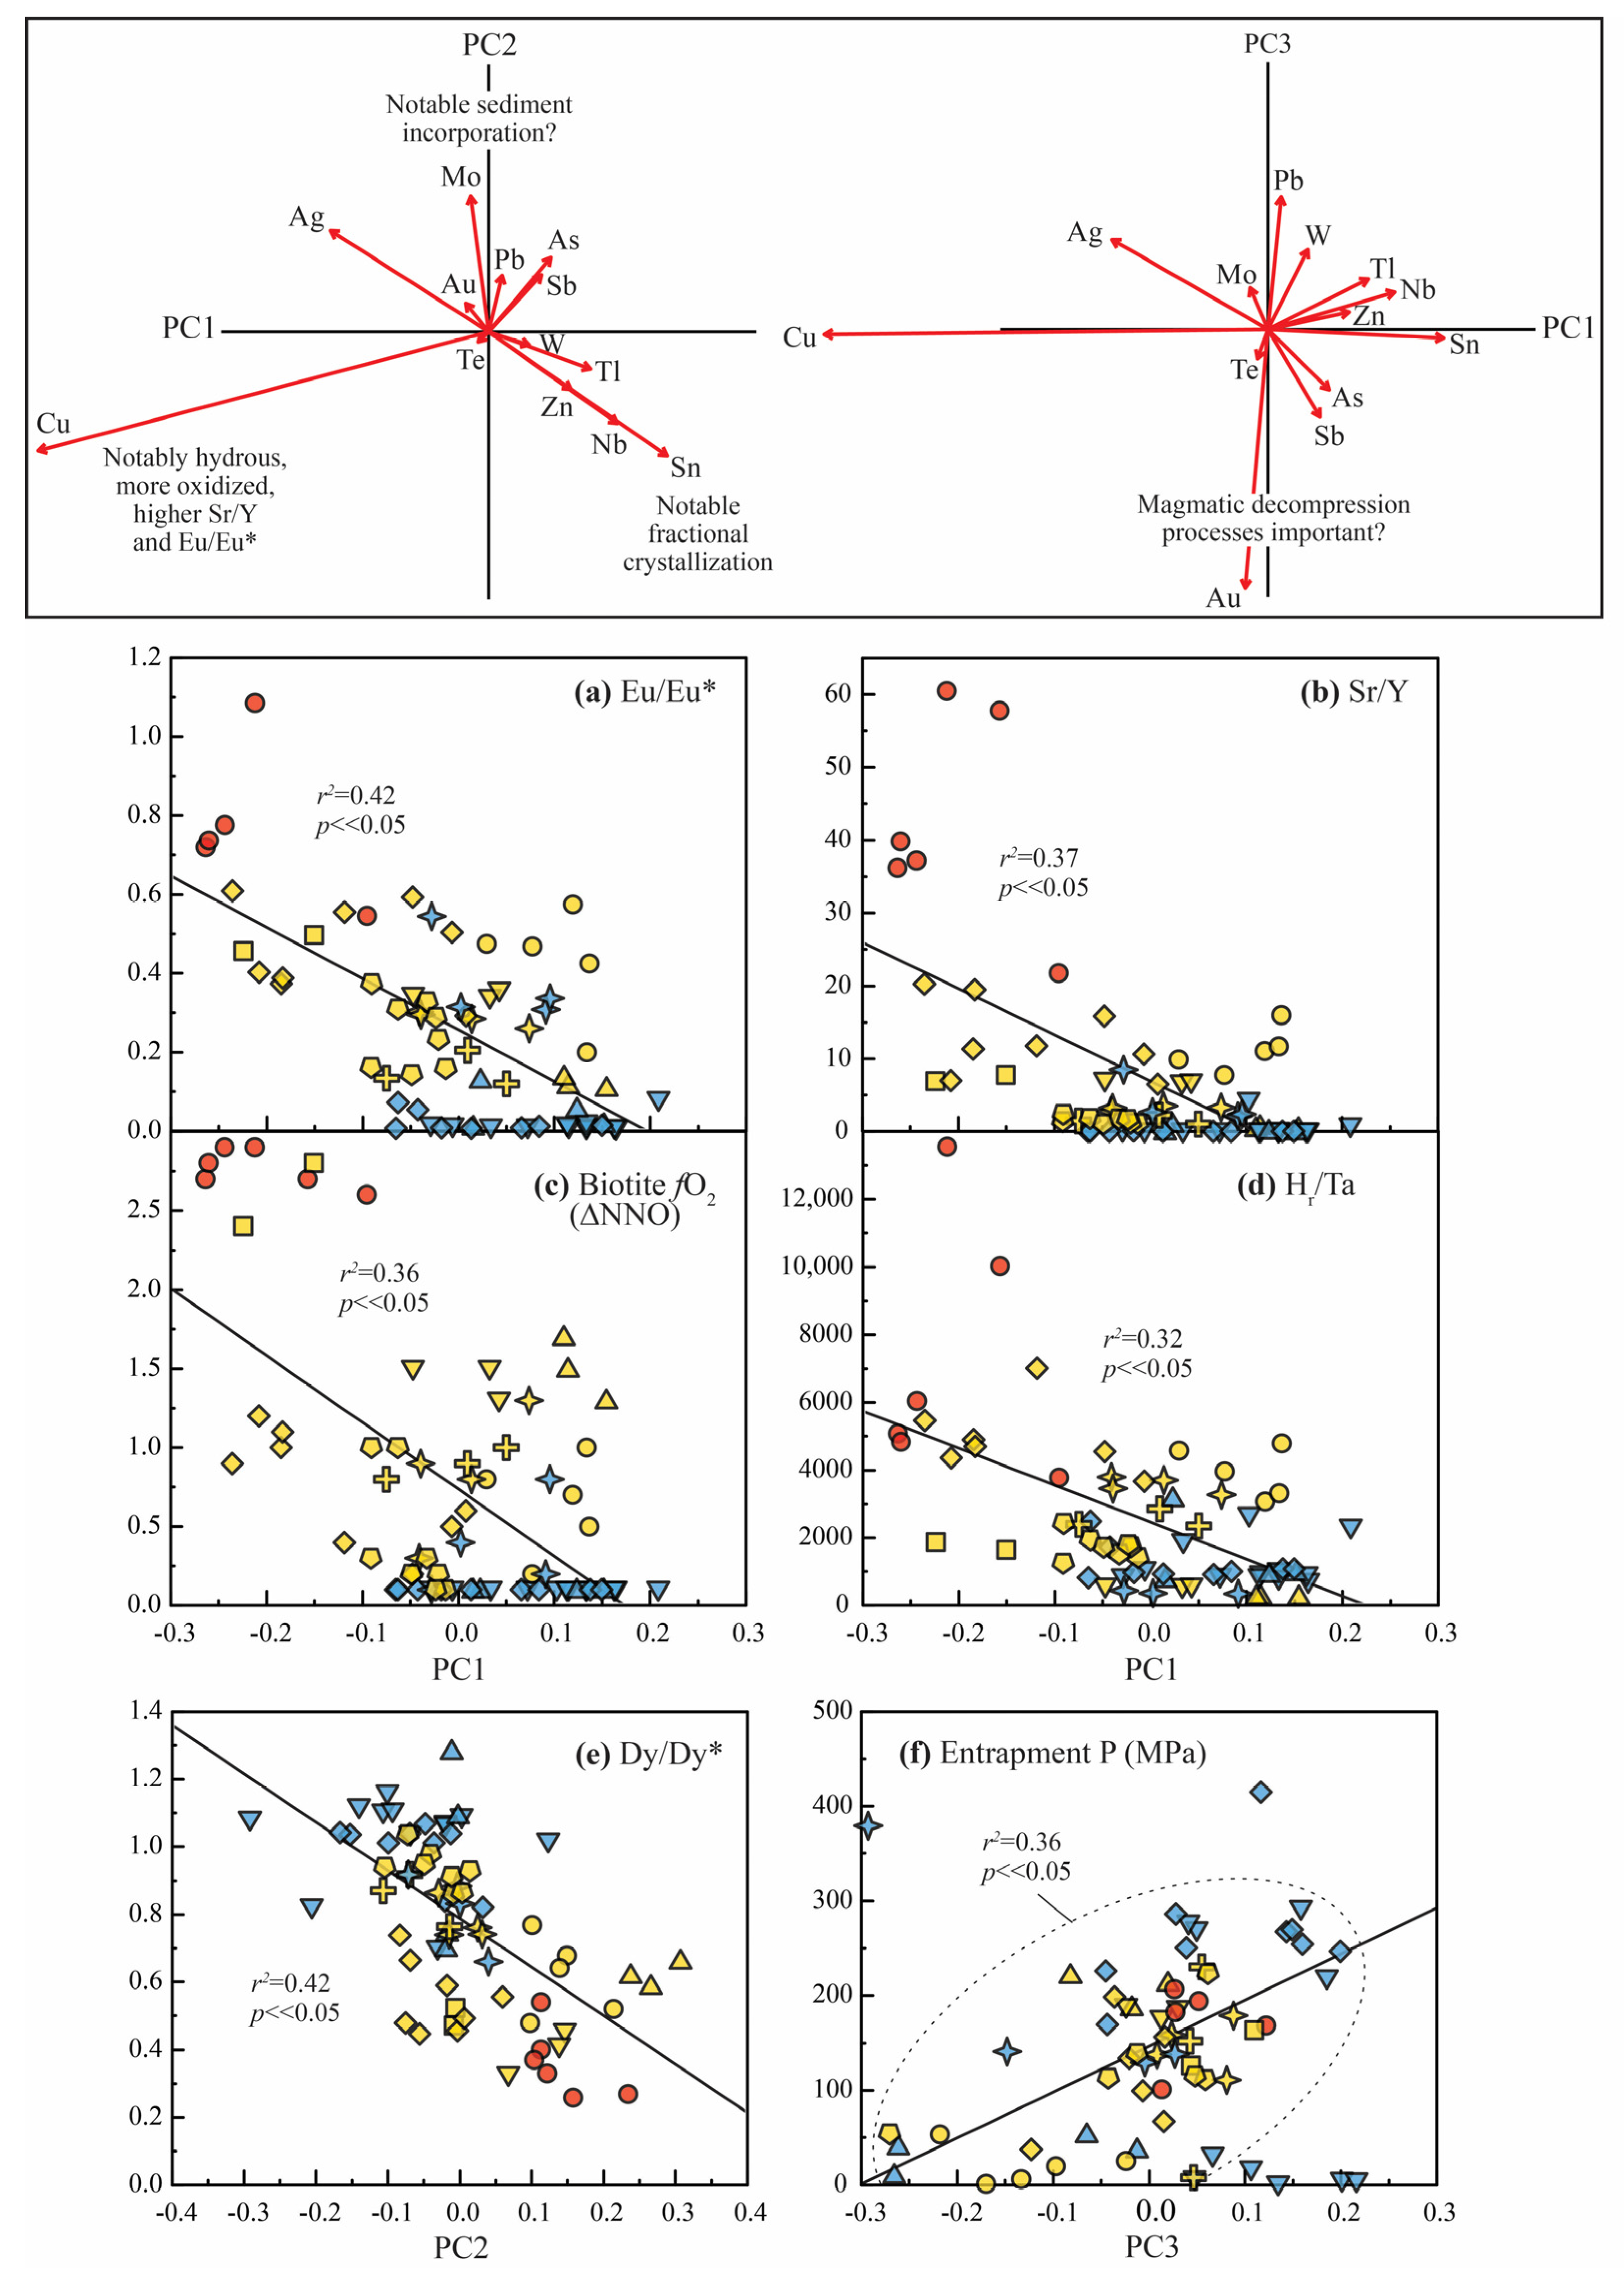
4.1. Relationships Between Principal Components and Geologic Processes

Mercer et al. [20] illustrated many rhyolite characteristics based on volatile and traditional trace element analyses of melt inclusions, host quartz, and biotite that help describe the compositional variety among the studied magmatic centers (e.g., extent of crystallization, melt H2O contents, oxidation state, melt entrapment pressure and temperature, etc.). A summary of these compositional characteristics along with their general geologic interpretation is given in Table 3. Their values for each melt inclusion are given in Supplementary Materials S2.3, alongside the new metal data. Following the example of [49], we examined any potential linear relationships between the principal components in this study (covariates) with those characteristics (response variables), which are associated with specific geologic processes [20]. Testing these variables as responses in regressions with the first three principal components, we found that a select few variables show moderate correlations (Figure 5; Pearson’s r2~0.32–0.42). While these r2 values are only moderate, perhaps due to the generally sparse nature of our continuous microanalytical data, they are highly significant as defined by F-tests that returned very low p-values (<<0.05). Hence, we deem this exercise worthwhile as a starting place for future studies that may approach this problem with more robust datasets. As we describe possible relationships to geologic processes, we keep in mind that correlations do not necessarily imply causation.
Principal component 1, which is parallel to the link between Cu and Sn, shows moderately negative correlations with europium anomalies (Eu/Eu*, r2 = 0.42, p << 0.05; Figure 5a), Sr/Y ratios (r2 = 0.37, p << 0.05; Figure 5b), oxidation state (ΔNNO, r2 = 0.36, p << 0.05; Figure 5c), and evolution-normalized melt water contents (Hr/Ta, r2 = 0.32, p << 0.05; Figure 5d; note: Ta is an incompatible element like Nb, and was used in place of Nb for this normalization to avoid unwanted spurious correlations with PC1). Large values of these variables are indicators of relatively wet, more oxidized, less plagioclase fractionated I-type magmas—traits that are well documented as being related to the petrogenesis of arc-related porphyry Cu deposits (e.g., [99,100,101]). Consequently, we interpret PC1 to portray the metallogenic diversity corresponding to the rhyolite compositional spectrum displayed by the magmatic centers (I-type to A-type) outlined in Mercer et al. [20].
PC2 reveals relatively short links among positive loadings of Ag, Mo, and fluid-mobile chalcophile elements such as As, Pb, and Sb. It also shows a moderately negative correlation with Dy/Dy* (r2 = 0.42, p << 0.05; Figure 5e), an indicator whereby small values suggest the possible incorporation of sediment into magmatic systems. These elements happen to be enriched in regional black shales [4]. While regional black shales are not the primary host rocks for Carlin-type Au deposits, they could be an important lithological component in the broader geological setting for magma evolution. We speculate the proportionality in these CoDa-PCA results could relate to incorporation of such sedimentary components into some magmas during ascent through the upper crust (particularly for the Beast magmatic center, Supplementary Materials S3.3), which may be important to consider given the metal-rich nature of this lithology. This hypothesis could be tested in the future using isotopic methods (e.g., Mo isotopes; [102]; see future research directions).
Gold variability dominates the third principal component and, along with the first principal component, suggests that Au distributions may be largely uncorrelated with the overall rhyolite compositional spectrum, unlike Cu, Sn, and Nb (Figure 5). PC3 shows no clear correlations with any petrogenetic characteristics; however, if one disregards a few potential outliers in calculated entrapment pressures (two high-p values and four low-p values), a moderate negative correlation is evident between PC3 and entrapment pressure (r2 = 0.36, p << 0.05; Figure 5f). While highly speculative, we mention this because there is potentially a geological basis for such a relationship that could merit further future investigation using CoDa methods with more robust Au datasets or other methods. Extensive experimental observations in simplified silicate melt–fluid–brine systems underscore the complex nature of Au solubility in shallow magmatic–hydrothermal systems, with solubility dependent upon many factors such as pressure, temperature, silicate melt alkali contents, and fluid salinity (e.g., [60,64,103,104]). It is notoriously difficult to pin down the many composition-, pressure-, temperature-, and redox-sensitive processes simultaneously at play during fluid-saturated magma ascent in natural systems (<200 MPa, <5 km; e.g., ascent-driven degassing, crystallization, oxidation, sulfide/sulfate resorption, fluid exsolution, steam flashing). But, perhaps, this observation provides a hint that the net effect of all these processes is that magmas may be more effective in delivering high Au melts at shallow crustal levels rather than deeper ones. This contradicts the magmatic model for Carlin-type ore deposits, which suggests magmas should release Au-bearing fluids deeply, at 10–12 km [5].

4.2. Metals on the Move: Magmatic Fluid Exsolution

The metal budget in natural magmatic–hydrothermal ore-forming fluids has long been a matter of debate. For example, whereas some studies suggest that fluid concentrations of merely ~15 ppb Au may be enough to form giant Au deposits (e.g., Ladolam epithermal Au, Papua New Guinea), other studies indicate that some fluids may contain 100 to 1000 times higher Au concentrations (e.g., [105,106]). Experimental studies constraining the fluid/melt partitioning of Au alone are conflicting and have independently concluded that hydrosulfide-, hydroxy-, or chloride- complexes are the dominant Au-bearing species under varying conditions, with resultant fluid/melt partition coefficients (DAuf/m) ranging over 4 orders of magnitude depending on physical and chemical variables of the system (e.g., [63,64,107,108,109,110]). This wide array of values is rooted in the fact that the partitioning of metals during magmatic volatile exsolution is linked to complicated magma composition and ascent processes, as mentioned earlier.
Given the relatively shallow entrapment depths of most of the melt inclusions in this study (≤~5 km; [20]), it is likely that many of the melts were saturated with S-O-H-C-Cl-bearing fluids [10]. Combining our best estimates for physical and chemical parameters in these magmatic systems with the best current experimental estimates for aqueous fluid/silicate melt partition coefficients (Supplemental Materials 1.6) results largely in partition coefficients that are >1. The most striking result of this modeling is that it is feasible to generate magmatic aqueous fluids with significantly higher Au/Cu and Au/Ag ratios than their parent magmas (Figure 3a,b), regardless of their age and timing relative to mineralization. Modeled fluids from these diverse melts encompass the entire range of Au/Cu ratios and much of the range of Au/Ag ratios as that found in ore-grade rocks, as well as absolute Au, Ag, and Cu concentrations. These fluids fall short of As/Sb ratios and absolute As and Sb concentrations, though (Figure 3d), suggesting these components must be sourced elsewhere. Ratios of metals such as Mo/Cu, Pb/Zn, and Sn/W in fluids are on par with those in ore rocks, but absolute concentrations of Cu are somewhat low, whereas those of Pb, Zn, Sn, and W are on the upper end of those of ore rocks. Overall, these modeling results suggest that exsolved magmatic fluids (regardless of rhyolite “flavor”) could be responsible, at least in part, for supplying some of the Au, Cu, Ag, and other metals in Carlin-type ore deposits. This finding potentially suggests that the specialized magmas called upon by the deep magmatic model proposed by Muntean et al. [5] are perhaps unnecessary, and any of the variety of contemporaneous Eocene rhyolites could contribute some or potentially all of the Au, Ag, and Cu in the mineralized systems.

4.3. Magma Volume Estimates

Given that magmas could theoretically deliver high Au/Cu fluids into mineralizing hydrothermal systems, we calculated the volume of magma required to generate Au ore in the Cortez Hills region. This area contains the second largest concentration of deposits after the Carlin trend. Pipeline and Cortez Hills are the main deposits, but other significant deposits are actively being discovered nearby. A ~36 Ma rhyolite dike swarm ~6–10 km wide and 40 km long is thought to be the structure that focused magmatic fluids and heat into the area from a deeper pluton [9]. The Pipeline and Cortez Hills deposits have produced or contain >32 Moz Au, collectively [111]. To date, the Cortez Hills deposit has the clearest demonstrated relationship to actively dewatering magmas at ~35.7 Ma [9,10].
Assuming Au-rich melts containing ~15 ppb Au (median value of Cortez Hills dikes, Supplementary Materials S2.4), an extraction rate of 65% (an estimate comparable to Mo removal efficiency [39]), and a magma density of 2.3 g/cm3 [20], an estimated ~45 km3 of rhyolite magma would be required, assuming all 32 Moz of Au in the deposits were derived magmatically. For perspective, this volume is on par with that estimated to generate the world-class Climax-type Henderson porphyry Mo deposit (~45 km3; [39]) and is only ~1/25th the erupted volume of the nearby Caetano Tuff, which was emplaced ~1.7 m.y. after the deposition of the Cortez Hills deposit (~1100 km3; [29]). This volume of magma could also deposit ~0.1 Mt Cu and ~0.01 Mt Ag assuming the same extraction rates, which is on the order of quite small porphyry Cu–Mo–Au deposits (e.g., [112,113,114]).
Considering more ordinary melts containing ~1.5 ppb Au (Figure 1)—which, considering our Au detection limits, could be more representative of median melts in the region—and the same extraction rate and magma density assumed above returns an estimated 450 km3 of required magma. This larger volume is plausible, considering the ~400 km2 footprint of the rhyolite dike swarm in the area. At the Cortez Hills deposit, most of the magma feeding the Cortez dikes is thought to have resided ~4- to ≥9-km deep in a polybaric magma reservoir, residing as an interconnected crystal mush with extractable magma pockets [10]. Metal extraction efficiency is largely unconstrained for these magmatic systems, however, due to the lack of fresh whole rock and matrix glass available. If the extraction efficiency was higher, e.g., ~100%, the required magma volume could be smaller, ~290 km3.
Regardless, the reasonable range of volumes estimated supports the idea that non-specialized magmas could possibly contribute Au supporting Carlin-type Au mineralization. Their compositional diversity could contribute to some of the diversity observed across Carlin districts.

4.4. Future Research Directions

Ore-forming magmatic–hydrothermal systems evolve by complex and dynamic geologic processes that are often difficult to unravel or predict. The Carlin-type Au systems are a particularly challenging example of such enigmatic systems. This study applies exploratory CoDa-PCA methods to a new melt inclusion dataset to highlight metallogenic fingerprints of Eocene magmatic systems. While our conclusions suggest this metallogenic diversity may not be a key factor controlling potential magmatic contributions to Carlin-type Au deposit mineralization, it provides a new angle with which to view magmatic–hydrothermal geochemical diversity and highlights new questions.
For example, in magmatic–hydrothermal ore-forming systems, Mo is usually associated with Cu mineralization (porphyry Cu–Mo–Au systems) and incompatible or lithophile element mineralization (i.e., Climax-type systems, rare metal granites). Why, then, does the variance of Mo result in a grouping with short links to metals such as Ag, Pb, As, and Sb, whereas it has long links with Cu, Sn, and Nb? Is Mo, perhaps, derived from a unique pathway compared to Cu and typical lithophile elements in magmatic systems? Based on Mo/Rb partitioning models, Mercer et al. [39] determined that Mo in the Henderson Climax-type porphyry Mo system, Colorado, USA, was likely derived from deep sources such as lower continental crust or metasomatized lithospheric mantle melts. Alternatively, molybdenum isotope work by Xue et al. [102] concluded that Mo in mineralized monzogranites of the Bangpu porphyry Mo(Cu) deposit in Tibet, China resulted from incorporation of black shales into the magmatic system. The application of Mo isotopes to the problem could be particularly interesting to help sort out whether the involvement of regional black shales is evident given their high concentration of a variety of other interesting metals. Perhaps a hybrid magmatic–sedimentary–metamorphic model best describes Carlin-type Au genesis? Such new CoDa insights may highlight new questions for igneous and economic geology processes that could further our understanding of these systems. CoDa techniques, while well developed in other geological fields, have seen little application to igneous petrology and economic geology [49]. The complexity and high-dimensional nature of geologic processes and geochemical compositional data suggests that future research further applying these techniques may provide additional new insights into perplexing geologic systems.

Supplementary Materials

The following supporting information can be downloaded at: https://www.mdpi.com/article/10.3390/min15050479/s1, Supplementary Materials S1: Methods; Supplementary Materials S2: Geochemical data; Supplementary Materials S3: CoDa-PCA results.

Author Contributions

C.N.M.: conceptualization, methodology, data curation, visualization, original draft preparation, review and editing, funding acquisition; H.R.B.: methodology, programming, visualization, review and editing, validation; C.M.M.: methodology, programming, visualization, review and editing; A.H.H.: conceptualization, review and editing, funding acquisition. All authors have read and agreed to the published version of the manuscript.

Funding

This research was funded by the U.S. Geological Survey Mineral Resources Program.

Data Availability Statement

Data are freely available as a U.S. Geological Survey Data Release [115]: https://doi.org/10.5066/P9UWAW28 (accessed on 31 March 2025).

Acknowledgments

Authors wish to thank R. Becker of Newmont Mining Corporation and R. Bond, M. McMullen, P. Anderson, and M. Bardou of Barrick Gold Corporation for sharing their enthusiasm in the field and expertise in the region during sample collection. We thank M. Cobel for SHRIMP-RG analysis assistance and data review as well as Z. Zajacz, A. Tsay, and C. Grondahl for LA-ICP-MS analysis assistance and data review. We are immensely grateful to Z. Zajacz for help with fluid exsolution modeling. Thank you greatly to V. Nesrstová for CoDa methodology review and editing, and to P. Vermeesch and V. Pawlowsky-Glahn for helpful CoDa-PCA resources and discussions. Lastly, we thank three anonymous reviewers for their constructive comments that improved this manuscript. Any use of trade, firm, or product names is for descriptive purposes only and does not imply endorsement by the U.S. Government.

Conflicts of Interest

The authors declare no conflicts of interest. The funders had no role in the design of the study; in the collection, analyses, or interpretation of data; in the writing of the manuscript; or in the decision to publish the results.

References

  1. Hofstra, A.H. Critical minerals in Carlin-type systems of the United States. In U.S.Geological Survey Scientific Investigations Report; U.S. Geological Survey: Reston, VA, USA, accepted.
  2. Muntean, J.L. Diversity in Carlin-Style Gold Deposits. Rev. Econ. Geol. 2018, 20, 1–363. [Google Scholar]
  3. Emsbo, P.; Groves, D.I.; Hofstra, A.H.; Bierlein, F.P. The giant Carlin gold province: A protracted interplay of orogenic, basinal, and hydrothermal processes above a lithospheric boundary. Miner. Depos. 2006, 41, 517–525. [Google Scholar] [CrossRef]
  4. Large, R.R.; Bull, S.W.; Maslennikov, V.V. A carbonaceous sedimentary source-rock model for Carlin-type and orogenic gold deposits. Econ. Geol. 2011, 106, 331–358. [Google Scholar] [CrossRef]
  5. Muntean, J.L.; Cline, J.S.; Simon, A.C.; Longo, A.A. Magmatic–hydrothermal origin of Nevada’s Carlin-type gold deposits. Nat. Geosci. 2011, 4, 122–127. [Google Scholar] [CrossRef]
  6. Large, S.J.E.; Bakker, E.Y.N.; Weis, P.; Wälle, M.; Ressel, M.; Heinrich, C.A. Trace elements in fluid inclusions of sediment-hosted gold deposits indicate a magmatic-hydrothermal origin of the Carlin ore trend. Geology 2016, 44, 1015–1018. [Google Scholar] [CrossRef]
  7. Ressel, M.W.; Henry, C.D. Igneous geology of the Carlin trend, Nevada: Development of the Eocene plutonic complex and significance for Carlin-type gold deposits. Econ. Geol. 2006, 101, 347–383. [Google Scholar] [CrossRef]
  8. Kesler, S.E.; Riciputi, L.C.; Ye, Z. Evidence for a magmatic origin for Carlin-type gold deposits: Isotopic composition of sulfur in the Betze-Post-Screamer Deposit, Nevada, USA. Miner. Depos. 2005, 40, 127–136. [Google Scholar] [CrossRef]
  9. Henry, C.D.; John, D.A.; Leonardson, R.W.; McIntosh, W.C.; Heizler, M.T.; Colgan, J.P.; Watts, K.E. Timing of Rhyolite Intrusion and Carlin-Type Gold Mineralization at the Cortez Hills Carlin-Type Deposit, Nevada, USA. Econ. Geol. 2023, 118, 57–91. [Google Scholar] [CrossRef]
  10. Mercer, C.N. Eocene magma plumbing system beneath Cortez Hills Carlin-type gold deposit, Nevada: Is there a deep-seated pluton? Econ. Geol. 2021, 116, 501–513. [Google Scholar] [CrossRef]
  11. Richards, J.P. Postsubduction porphyry Cu-Au and epithermal Au deposits: Products of remelting of subduction-modified lithosphere. Geology 2009, 37, 247–250. [Google Scholar] [CrossRef]
  12. Audétat, A.; Simon, A.C. Magmatic controls on porphyry copper deposits. In Geology and Genesis of Major Copper Deposits and Distracts of the World: A Tribute to Richard H. Sillitoe; Hedenquist, J.W., Harris, M., Camus, F., Eds.; Society of Economic Geologists: Littleton, CO, USA, 2012; Volume 16, pp. 553–572. [Google Scholar]
  13. Li, Y.; Audétat, A. Gold solubility and partitioning between sulfide liquid, monosulfide solid solution and hydrous mantle melts: Implications for the formation of Au-rich magmas and crust–mantle differentiation. Geochim. Cosmochim. Acta 2013, 118, 247–262. [Google Scholar] [CrossRef]
  14. Li, Y.; Audétat, A. Effects of temperature, silicate melt composition, and oxygen fugacity on the partitioning of V, Mn, Co, Ni, Cu, Zn, As, Mo, Ag, Sn, Sb, W, Au, Pb, and Bi between sulfide phases and silicate melt. Geochim. Cosmochim. Acta 2015, 162, 25–45. [Google Scholar] [CrossRef]
  15. Johnson, C.L.; Ressel, M.W.; Ruprecht, P. Toward a global Carlin-type exploration model: The relationship between Eocene magmatism and diverse gold-rich deposits in the Great Basin, USA. In Vision for Discovery, Geology and Ore Deposits of the Basin and Range, Proceedings of the Geological Society of Nevada; Koutz, F.R., Pennel, W.M., Eds.; Geological Society of Nevada: Reno, NV, USA, 2020; Volume 1, pp. 355–382. [Google Scholar]
  16. Simon, A.C.; Pettke, T.; Candela, P.A.; Piccoli, P.M.; Heinrich, C.A. Experimental determination of Au solubility in rhyolite melt and magnetite: Constraints on magmatic Au budgets. Am. Mineral. 2003, 88, 1644–1651. [Google Scholar] [CrossRef]
  17. Henry, C.D.; John, D.A.; Heizler, M.T.; Leonardson, R.W.; Colgan, J.; Watts, K.E.; Ressel, M.W.; Cousens, B.L. Why did Great Basin Eocene magmatism generate Carlin-type gold deposits when extensive Jurassic to Middle Miocene magmatism did not? Lessons from the Cortez region, northern Nevada, USA. In Vision for Discovery, Geology and Ore Deposits of the Basin and Range, Proceedings of the Geological Society of Nevada; Koutz, F.R., Pennel, W.M., Eds.; Geological Society of Nevada: Reno, NV, USA, 2020; Volume 1, pp. 339–353. [Google Scholar]
  18. Muntean, J.L.; Bonner, W.; Hill, T. Carlin-style gold-silver mineralization at the Cove deposit in Nevada, USA: Possible missing link between Carlin-type gold deposits and magmatic-hydrothermal systems. In Mineral Resources to Discover, Proceedings of the 14th biennial meeting of the Society for Geology Applied to Mineral Deposits, Quebec, QC, Canada, 20–23 August 2017; Mercier-Langevin, P., Ed.; Society for Geology Applied to Mineral Deposits: Genéve, Suisse, 2017; pp. 71–74. [Google Scholar]
  19. Johnson, C.L.; Dilles, J.H.; Kent, A.J.; Farmer, L.P.; Henry, C.D.; Ressel, M.W. Petrology and geochemistry of the Emigrant Pass volcanics, Nevada: Implications for a magmatic-hydrothermal origin of the Carlin gold deposits. In New Concepts and Discoveries, Proceedings of the Geological Society of Nevada; Pennell, W.M., Garside, L.G., Eds.; Geological Society of Nevada: Reno, NV, USA, 2015; Volume 1, pp. 391–408. [Google Scholar]
  20. Mercer, C.N.; Roberge, J.; Khoury, R.M.; Hofstra, A.H. Pre-eruptive characteristics of “suspect” silicic magmas in Carlin-type Au-forming systems. Am. Mineral. 2025. [Google Scholar]
  21. Hofstra, A.H.; Kreiner, D.C. Systems-Deposits-Commodities-Critical Minerals Table for the Earth Mapping Resources Initiative. In U.S. Geological Survey Open-File Report 2020–1042; United States Geological Survey: Reston, VA, USA, 2020; pp. 1–24. [Google Scholar]
  22. Brooks, W.E.; Thorman, C.H.; Snee, L.W. The 40Ar/39Ar ages and tectonic setting of the middle Eocene northeast Nevada volcanic field. J. Geophys. Res. Solid Earth 1995, 100, 10403–10416. [Google Scholar] [CrossRef]
  23. Ressel, M.W.; Noble, D.C.; Henry, C.D.; Trudel, W.S. Dike-Hosted Ores of the Beast Deposit and the Importance of Eocene Magmatism in Gold Mineralization of the Carlin Trend, Nevada. Econ. Geol. 2000, 95, 1417–1444. [Google Scholar] [CrossRef]
  24. Bond, R. Personal communication about informal names of dikes in the Cortez Hills pit used by Barrick Gold, 2013.
  25. Colgan, J.P.; Egger, A.E.; John, D.A.; Cousens, B.; Fleck, R.J.; Henry, C.D. Oligocene and Miocene arc volcanism in northeastern California: Evidence for post-Eocene segmentation of the subducting Farallon plate. Geosphere 2011, 7, 733–755. [Google Scholar] [CrossRef]
  26. Hastings, M.H. Relationship of Base-Metal Skarn Mineralization to Carlin-Type Gold Mineralization at the Archimedes Gold Deposit, Eureka, Nevada. Master’s Thesis, University of Nevada, Reno, NV, USA, 2008; p. 109. [Google Scholar]
  27. Nutt, C.J.; Hofstra, A.H. Alligator Ridge district, east-central Nevada: Carlin-type gold mineralization at shallow depths. Econ. Geol. 2003, 98, 1225–1241. [Google Scholar] [CrossRef]
  28. Farmer, M. An intrusive study of the Bluestar subdistrict: Carlin, Nevada. In Newmont Gold Company, Internal Report; Newmont: Vancouver, BC, Canada, 1996; p. 33. [Google Scholar]
  29. John, D.A.; Henry, C.D.; Colgan, J.P. Magmatic and tectonic evolution of the Caetano caldera, north-central Nevada: A tilted, mid-Tertiary eruptive center and source of the Caetano Tuff. Geosphere 2008, 4, 75–106. [Google Scholar] [CrossRef]
  30. Watts, K.E.; John, D.A.; Colgan, J.P.; Henry, C.D.; Bindeman, I.N.; Schmitt, A.K. Probing the volcanic–plutonic connection and the genesis of crystal-rich rhyolite in a deeply dissected supervolcano in the Nevada Great Basin: Source of the late Eocene Caetano Tuff. J. Petrol. 2016, 57, 1599–1644. [Google Scholar] [CrossRef]
  31. Mortensen, J.K.; Thompson, J.P.H.; Tosdal, R.M. U-Pb age constraints on magmatism and mineralization in the northern Great basin. In Geology and Ore Deposits 2000: The Great Basin and Beyond, Proceedings of the Geological Society of Nevada; Cluer, J.K., Price, J.G., Struhsacker, E.M., Hardyman, R.F., Morris, C.L., Eds.; Geological Society of Nevada: Reno, NV, USA, 2000; pp. 61–65. [Google Scholar]
  32. Dilles, P.A.; Wright, W.A.; Monteleone, S.E.; Russel, K.D.; Marlowe, K.E.; Wood, R.A.; Margolis, J. The geology of the West Archimedes deposit: A new gold discovery in the Eureka mining district, Eureka County, Nevada. In Geology and Ore Deposits of the American Cordillera, Proceedings of the Geological Society of Nevada Symposium, Reno, NV, USA, 10–13 April 1995; Coyner, A.R., Fahey, P.L., Eds.; Geological Society of Nevada: Reno, NV, USA, 1996; pp. 159–171. [Google Scholar]
  33. Nutt, C.J. Geologic map of the Alligator Ridge area, including the Buck Mountain East and Mooney Basin Summit quadrangles and parts of the Sunshine Well NE and Long Valley Slough quadrangles, White Pine County, Nevada. In U.S. Geological Survey Geologic Investigations Series Map I-2691, Scale 1:24,000; United States Geological Survey: Reston, VA, USA, 2000. [Google Scholar]
  34. Smith, M.T.; Rhys, D.; Ross, K.; Lee, C.; Gray, J.N. The Long Canyon deposit: Anatomy of a new off-trend sedimentary rock-hosted gold discovery in northeastern Nevada. Econ. Geol. 2013, 108, 1119–1145. [Google Scholar] [CrossRef]
  35. Chakurian, A.M.; Arehart, G.B.; Donelick, R.A.; Zhang, X.; Reiners, P.W. Timing constraints of gold mineralization along the Carlin trend utilizing apatite fission-track, 40Ar/39Ar, and apatite (U-Th)/He methods. Econ. Geol. 2003, 98, 1159–1171. [Google Scholar] [CrossRef]
  36. Tretbar, D.R.; Arehart, G.B.; Christensen, J.N. Dating gold deposition in a Carlin-type gold deposit using Rb/Sr methods on the mineral galkhaite. Geology 2000, 28, 947–950. [Google Scholar] [CrossRef]
  37. Esposito, R. Chapter 7: A protocol and review of methods to select, analyze and interpret melt inclusions to determine pre-eruptive volatile contents of magmas. In Fluid and Melt Inclusions: Applications to Geologic Processes; Lecumberri-Sanchez, P., Steele-MacInnis, M., Kontak, D., Eds.; Mineralogical Association of Canada: Quebec, QC, Canada, 2020; Volume 49, pp. 163–194. [Google Scholar]
  38. Rose-Koga, E.F.; Bouvier, A.S.; Gaetani, G.A.; Wallace, P.J.; Allison, C.M.; Andrys, J.A.; Angeles de la Torre, C.A.; Barth, A.; Bodnar, R.J.; Gartner, A.B.; et al. Silicate melt inclusions in the new millennium: A review of recommended practices for preparation, analysis, and data presentation. Chem. Geol. 2021, 570, 120145. [Google Scholar] [CrossRef]
  39. Mercer, C.N.; Hofstra, A.H.; Todorov, T.I.; Roberge, J.; Burgisser, A.; Adams, D.T.; Cosca, M. Pre-eruptive conditions of the Hideaway Park topaz rhyolite: Insights into metal source and evolution of magma parental to the Henderson porphyry molybdenum deposit, Colorado. J. Petrol. 2015, 56, 645–679. [Google Scholar] [CrossRef]
  40. Sisson, T.W.; Grove, T.L. Experimental investigations of the role of H2O in calc-alkaline differentiation and subduction zone magmatism. Contrib. Mineral. Petrol. 1993, 113, 143–166. [Google Scholar] [CrossRef]
  41. Kamenetsky, V.S.; Danyushevsky, L. Metals in quartz-hosted melt inclusions: Natural facts and experimental artifacts. Am. Mineral. 2005, 90, 1674–1678. [Google Scholar] [CrossRef]
  42. Zajacz, Z.; Hanley, J.J.; Heinrich, C.A.; Halter, W.E.; Guillong, M. Diffusive reequilibration of quartz-hosted silicate melt and fluid inclusions: Are all metal concentrations unmodified? Geochim. Cosmochim. Acta 2009, 73, 3013–3027. [Google Scholar] [CrossRef]
  43. Rottier, B.; Rezeau, H.; Casanova, V.; Kouzmanov, K.; Moritz, R.; Schlögova, K.; Wälle, M.; Fontboté, L. Trace element diffusion and incorporation in quartz during heating experiments. Contrib. Mineral. Petrol. 2017, 172, 1–20. [Google Scholar] [CrossRef]
  44. Ellis, B.S.; Szymanowski, D.; Magna, T.; Neukampf, J.; Dohmen, R.; Bachmann, O.; Ulmer, P.; Guillong, M. Post-eruptive mobility of lithium in volcanic rocks. Nat. Commun. 2018, 9, 3228. [Google Scholar] [CrossRef]
  45. Neukampf, J.; Ellis, B.S.; Magna, T.; Laurent, O.; Bachmann, O. Partitioning and isotopic fractionation of lithium in mineral phases of hot, dry rhyolites: The case of the Mesa Falls Tuff, Yellowstone. Chem. Geol. 2019, 506, 175–186. [Google Scholar] [CrossRef]
  46. Esposito, R.; Redi, D.; Danyushevsky, L.V.; Gurenko, A.; De Vivo, B.; Manning, C.E.; Bodnar, R.J.; Steele-MacInnis, M.; Frezzotti, M.L. Constraining the volatile evolution of mafic melts at Mt. Somma–Vesuvius, Italy, based on the composition of reheated melt inclusions and their olivine hosts. Eur. J. Mineral. 2023, 35, 921–948. [Google Scholar] [CrossRef]
  47. Lowenstern, J.B. Bursting the bubble of melt inclusions. Am. Mineral. 2015, 100, 672–673. [Google Scholar] [CrossRef]
  48. Moore, L.R.; Gazel, E.; Tuohy, R.; Lloyd, A.S.; Esposito, R. Bubbles matter: An assessment of the contribution of vapor bubbles to melt inclusion volatile budgets. Am. Mineral. 2015, 100, 806–823. [Google Scholar] [CrossRef]
  49. Egozcue, J.J.; Gozzi, C.; Buccianti, A.; Pawlowsky-Glahn, V. Exploring geochemical data using compositional techniques: A practical guide. J. Geochem. Explor. 2024, 258, 107385. [Google Scholar] [CrossRef]
  50. Aitchison, J. Principal component analysis of compositional data. Biometrika 1983, 70, 57–65. [Google Scholar] [CrossRef]
  51. Aitchison, J. The Statistical Analysis of Compositional Data. Monographs on Statistics and Applied Probability; Chapman & Hall Ltd.: London, UK, 1986; p. 416, Reprinted in 2003 with additional material by The Blackburn Press, London, UK. [Google Scholar]
  52. Pawlowsky-Glahn, V.; Egozcue, J.J.; Tolosana-Delgado, R. Modeling and Analysis of Compositional Data. Statistics in Practice; John Wiley & Sons: Chichester, UK, 2015; p. 272. [Google Scholar]
  53. Filzmoser, P.; Hron, K.; Templ, M. Applied Compositional Data Analysis. With Worked Examples in R; Springer Nature: Cham, Switzerland, 2018; p. 280. [Google Scholar]
  54. Greenacre, M. Compositional Data Analysis in Practice; Chapman and Hall/CRC: New York, NY, USA, 2018; p. 120. [Google Scholar]
  55. Greenacre, M. Compositional data analysis. Annu. Rev. Stat. Its Appl. 2021, 8, 271–299. [Google Scholar] [CrossRef]
  56. Le Moine Bauer, S.; Lu, G.S.; Goulaouic, S.; Puzenat, V.; Schouw, A.; Barreyre, T.; Pawlowsky-Glahn, V.; Egozcue, J.J.; Martelat, J.E.; Escartin, J.; et al. Structure and metabolic potential of the prokaryotic communities from the hydrothermal system of Paleochori Bay, Milos, Greece. Front. Microbiol. 2023, 13, 1060168. [Google Scholar] [CrossRef]
  57. Webster, J.D. The exsolution of magmatic hydrosaline chloride liquids. Chem. Geol. 2004, 210, 33–48. [Google Scholar] [CrossRef]
  58. Hsu, Y.J.; Zajacz, Z.; Ulmer, P.; Heinrich, C.A. Chlorine partitioning between granitic melt and H2O-CO2-NaCl fluids in the Earth’s upper crust and implications for magmatic-hydrothermal ore genesis. Geochim. Cosmochim. Acta 2019, 261, 171–190. [Google Scholar] [CrossRef]
  59. Driesner, T.; Heinrich, C.A. The system H2O–NaCl. Part I: Correlation formulae for phase relations in temperature–pressure–composition space from 0 to 1000 C, 0 to 5000 bar, and 0 to 1 XNaCl. Geochim. Cosmochim. Acta 2007, 71, 4880–4901. [Google Scholar] [CrossRef]
  60. Alex, A.; Zajacz, Z. The solubility of Cu, Ag and Au in magmatic sulfur–bearing fluids as a function of oxygen fugacity. Geochim. Cosmochim. Acta 2022, 330, 93–115. [Google Scholar] [CrossRef]
  61. Tattitch, B.C.; Blundy, J.D. Cu-Mo partitioning between felsic melts and saline-aqueous fluids as a function of X NaCleq, fO2, and fS2. Am. Mineral. 2017, 102, 1987–2006. [Google Scholar] [CrossRef]
  62. Zajacz, Z.; Candela, P.A.; Piccoli, P.M. The partitioning of Cu, Au and Mo between liquid and vapor at magmatic temperatures and its implications for the genesis of magmatic-hydrothermal ore deposits. Geochim. Cosmochim. Acta 2017, 207, 81–101. [Google Scholar] [CrossRef]
  63. Zajacz, Z.; Halter, W.E.; Pettke, T.; Guillong, M. Determination of fluid/melt partition coefficients by LA-ICPMS analysis of co-existing fluid and silicate melt inclusions: Controls on element partitioning. Geochim. Cosmochim. Acta 2008, 72, 2169–2197. [Google Scholar] [CrossRef]
  64. Simon, A.C.; Frank, M.R.; Pettke, T.; Candela, P.A.; Piccoli, P.M.; Heinrich, C.A. Gold partitioning in melt-vapor-brine systems. Geochim. Cosmochim. Acta 2005, 69, 3321–3335. [Google Scholar] [CrossRef]
  65. Rudnick, R.L.; Gao, S. Composition of the continental crust. In Treatise on Geochemistry, 2nd ed.; Turekian, K.K., Holland, H.D., Eds.; Elsevier: Toronto, Canada, 2014; pp. 1–51. [Google Scholar]
  66. Robb, L. Introduction to Ore-Forming Processes, 2nd ed.; Wiley-Blackwell: Hoboken, NJ, USA, 2020; p. 439. [Google Scholar]
  67. Zhang, D.; Audétat, A. What Caused the Formation of the Giant Bingham Canyon Porphyry Cu-Mo-Au Deposit? Insights from Melt Inclusions and Magmatic Sulfides. Econ. Geol. 2017, 112, 221–244. [Google Scholar] [CrossRef]
  68. Audétat, A.; Li, W. The genesis of Climax-type porphyry Mo deposits: Insights from fluid inclusions and melt inclusions. Ore Geol. Rev. 2017, 88, 436–460. [Google Scholar] [CrossRef]
  69. Emsbo, P.; Hofstra, A.H.; Lauha, E.A.; Griffin, G.L.; Hutchinson, R.W. Origin of High-Grade Gold Ore, Source of Ore Fluid Components, and Genesis of the Meikle and Neighboring Carlin-Type Deposits, Northern Carlin Trend, Nevada. Econ. Geol. 2003, 98, 1069–1105. [Google Scholar] [CrossRef]
  70. Hofstra, A.H.; Snee, L.W.; Rye, R.O.; Folger, H.W.; Phinisey, J.D.; Loranger, R.J.; Dahl, A.R.; Naeser, C.W.; Stein, H.J.; Lewchuk, M.T. Age constraints on Jerritt Canyon and other Carlin-type gold deposits in the Western United States; relationship to mid-Tertiary extension and magmatism. Econ. Geol. 1999, 94, 769–802. [Google Scholar] [CrossRef]
  71. Audétat, A. The metal content of magmatic-hydrothermal fluids and its relationship to mineralization potential. Econ. Geol. 2019, 114, 1033–1056. [Google Scholar] [CrossRef]
  72. Chelle-Michou, C.; Rottier, B.; Caricchi, L.; Simpson, G. Tempo of magma degassing and the genesis of porphyry copper deposits. Sci. Rep. 2017, 7, 40566. [Google Scholar] [CrossRef]
  73. Chiaradia, M.; Caricchi, L. Supergiant porphyry copper deposits are failed large eruptions. Commun. Earth Environ. 2022, 3, 107. [Google Scholar] [CrossRef]
  74. Chiaradia, M. Distinct magma evolution processes control the formation of porphyry Cu–Au deposits in thin and thick arcs. Earth Planet. Sci. Lett. 2022, 599, 117864. [Google Scholar] [CrossRef]
  75. Hofstra, A.; Lisitsin, V.; Corriveau, L.; Paradis, S.; Peter, J.; Lauzière, K.; Lawley, C.; Gadd, M.; Pilote, J.; Honsberger, I.; et al. Deposit classification scheme for the Critical Minerals Mapping Initiative Global Geochemical Database. In U.S. Geological Survey Open-File Report 2021–1049; United States Geological Survey: Reston, VA, USA, 2021; pp. 1–60. [Google Scholar]
  76. Murakami, H.; Seo, J.H.; Heinrich, C.A. The relation between Cu/Au ratio and formation depth of porphyry-style Cu–Au ± Mo deposits. Miner. Depos. 2009, 45, 11–21. [Google Scholar] [CrossRef]
  77. Halter, W.E.; Heinrich, C.A.; Pettke, T. Magma evolution and the formation of porphyry Cu-Au ore fluids: Evidence from silicate and sulfide melt inclusions. Miner. Depos. 2005, 39, 845–863. [Google Scholar] [CrossRef]
  78. Fithian, M.T. Geology, Geochemistry, and Geochronology of the Marigold Mine, Battle Mountain-Eureka Trend, Nevada. Ph.D. Thesis, Colorado School of Mines, Golden, CO, USA, 2015; p. 115. [Google Scholar]
  79. du Bray, E.A. Time, space, and composition relations among northern Nevada intrusive rocks and their metallogenic implications. Geosphere 2007, 3, 381–405. [Google Scholar] [CrossRef]
  80. Grondahl, C.; Zajacz, Z. Magmatic controls on the genesis of porphyry Cu–Mo–Au deposits: The Bingham Canyon example. Earth Planet. Sci. Lett. 2017, 480, 53–65. [Google Scholar] [CrossRef]
  81. Norling, B.; Rowe, M.C.; Chambefort, I.; Tepley III, F.J.; Morrow, S. Volatile behavior and trace metal transport in the magmatic–geothermal system at Pūtauaki (Mt. Edgecumbe), New Zealand. J. Volcanol. Geotherm. Res. 2016, 318, 27–44. [Google Scholar] [CrossRef]
  82. Johnson, E.R.; Kamenetsky, V.S.; McPhie, J. The Behavior of Metals (Pb, Zn, As, Mo, Cu) During Crystallization and Degassing of Rhyolites from the Okataina Volcanic Center, Taupo Volcanic Zone, New Zealand. J. Petrol. 2013, 54, 1641–1659. [Google Scholar] [CrossRef]
  83. Saunders, K.E.; Baker, J.A.; Wysoczanski, R.J. Microanalysis of large volume silicic magma in continental and oceanic arcs: Melt inclusions in Taupo Volcanic Zone and Kermadec Arc rocks, South West Pacific. J. Volcanol. Geotherm. Res. 2010, 190, 203–218. [Google Scholar] [CrossRef]
  84. Audétat, A.; Günther, D.; Heinrich, C.A. Magmatic-hydrothermal evolution in a fractionating granite: A microchemical study of the Sn-W-F-mineralized Mole Granite (Australia). Geochim. Cosmochim. Acta 2000, 64, 3373–3393. [Google Scholar] [CrossRef]
  85. Stefanova, E.; Driesner, T.; Zajacz, Z.; Heinrich, C.A.; Petrov, P.; Vasilev, Z. Melt and Fluid Inclusions in Hydrothermal Veins: The Magmatic to Hydrothermal Evolution of the Elatsite Porphyry Cu-Au Deposit, Bulgaria. Econ. Geol. 2014, 109, 1359–1381. [Google Scholar] [CrossRef]
  86. Stavast, W.J.; Keith, J.D.; Christiansen, E.H.; Dorais, M.J.; Tingey, D.; Larocque, A.C.L.; Evans, N. The fate of magmatic sulfides during intrusion or eruption, Bingham and Tintic districts, Utah. Econ. Geol. 2006, 101, 329–345. [Google Scholar] [CrossRef]
  87. Watts, K.E.; John, D.A.; Coble, M.A.; Colgan, J.P.; Henry, C.D. Ion microprobe study of Au and trace metals in sulfide melt inclusions from a rhyolite porphyry intrusion in the Caetano caldera, Nevada. In Geological Society of America Abstracts with Programs; Geological Society of America: Boulder, CO, USA, 2014; Volume 46, p. 447. [Google Scholar]
  88. Halter, W.E.; Pettke, T.; Heinrich, C.A. The origin of Cu/Au ratios in porphyry-type ore deposits. Science 2002, 296, 1844–1846. [Google Scholar] [CrossRef]
  89. Seedorff, E.; Einaudi, M.T. Henderson porphyry molybdenum system, Colorado: II. Decoupling of introduction and deposition of metals during geochemical evolution of hydrothermal fluids. Econ. Geol. 2004, 99, 39–72. [Google Scholar] [CrossRef]
  90. Ueki, K.; Iwamori, H. Geochemical differentiation processes for arc magma of the Sengan volcanic cluster, Northeastern Japan, constrained from principal component analysis. Lithos 2017, 290, 60–75. [Google Scholar] [CrossRef]
  91. Grunsky, E.C.; Caritat, P.D. State-of-the-art analysis of geochemical data for mineral exploration. Geochem. Explor. Environ. Anal. 2020, 20, 217–232. [Google Scholar] [CrossRef]
  92. Darabi-Golestan, F.; Hezarkhanı, A. Multivariate analysis of log-ratio transformed data and its priority in mining science: Porphyry and polymetallic vein deposits case studies. Bull. Miner. Res. Explor. 2019, 159, 185–200. [Google Scholar] [CrossRef]
  93. Ghezelbash, R.; Maghsoudi, A.; Daviran, M.; Yilmaz, H. Incorporation of principal component analysis, geostatistical interpolation approaches and frequency-space-based models for portraying the Cu-Au geochemical prospects in the Feizabad district, NW Iran. Geochemistry 2019, 79, 323–336. [Google Scholar] [CrossRef]
  94. Zhao, Z.; Qiao, K.; Liu, Y.; Chen, J.; Li, C. Geochemical data mining by integrated multivariate component data analysis: The Heilongjiang Duobaoshan area (China) case study. Minerals 2022, 12, 1035. [Google Scholar] [CrossRef]
  95. Su, Q.; Yu, H.; Xu, X.; Chen, B.; Yang, L.; Fu, T.; Liu, W.; Chen, G. Using Principal Component Analysis (PCA) Combined with Multivariate Change-Point Analysis to Identify Brine Layers Based on the Geochemistry of the Core Sediment. Water 2023, 15, 1926. [Google Scholar] [CrossRef]
  96. Hron, K.; Coenders, G.; Filzmoser, P.; Palarea-Albaladejo, J.; Faměra, M.; Matys Grygar, T. Analysing pairwise logratios revisited. Math. Geosci. 2021, 53, 1643–1666. [Google Scholar] [CrossRef]
  97. Salem, L.C.; Edmonds, M.; Corsaro, R.A.; Maclennan, J. Carbon dioxide in geochemically heterogeneous melt inclusions from Mount Etna, Italy. Geochem. Geophys. Geosystems 2019, 20, 3150–3169. [Google Scholar] [CrossRef]
  98. Vermeesch, P. Statistics for Geoscientists; University College London: London, UK, 2024; p. 224. [Google Scholar]
  99. Richards, J.P. High Sr/Y arc magmas and porphyry Cu±Mo±Au deposits: Just add water. Econ. Geol. 2011, 106, 1075–1081. [Google Scholar] [CrossRef]
  100. Chiaradia, M.; Ulianov, A.; Kouzmanov, K.; Beate, B. Why large porphyry Cu deposits like high Sr/Y magmas? Sci. Rep. 2012, 2, 685. [Google Scholar] [CrossRef]
  101. Chiaradia, M. Crustal thickness control on Sr/Y signatures of recent arc magmas: An Earth scale perspective. Sci. Rep. 2015, 5, 8115. [Google Scholar] [CrossRef]
  102. Xue, Q.; Zhang, L.; Chen, S.; Guo, K.; Li, T.; Han, Z.; Sun, W. Tracing black shales in the source of a porphyry Mo deposit using molybdenum isotopes. Geology 2023, 51, 688–692. [Google Scholar] [CrossRef]
  103. Simon, A.C.; Pettke, T.; Candela, P.A.; Piccoli, P.M. The partitioning behavior of silver in a vapor–brine–rhyolite melt assemblage. Geochim. Et Cosmochim. Acta 2008, 72, 1638–1659. [Google Scholar] [CrossRef]
  104. Zajacz, Z.; Seo, J.H.; Candela, P.A.; Piccoli, P.M.; Heinrich, C.A.; Guillong, M. Alkali metals control the release of gold from volatile–rich magmas. Earth Planet. Sci. Lett. 2010, 297, 50–56. [Google Scholar] [CrossRef]
  105. Heinrich, C.A.; Gunther, D.; Audétat, A.; Ulrich, T.; Frischknecht, R. Metal fractionation between magmatic brine and vapor, determined by microanalysis of fluid inclusions. Geology 1999, 27, 755–758. [Google Scholar] [CrossRef]
  106. Heinrich, C.A. How fast does gold trickle out of volcanoes? Science 2006, 314, 263–264. [Google Scholar] [CrossRef]
  107. Loucks, R.R.; Mavrogenes, J.A. Gold solubility in supercritical hydrothermal brines measured in synthetic fluid inclusions. Science 1999, 284, 2159–2163. [Google Scholar] [CrossRef] [PubMed]
  108. Frank, M.R.; Candela, P.A.; Piccoli, P.M.; Glascock, M.D. Gold solubility, speciation, and partitioning as a function of HCl in the brine-silicate melt-metallic gold system at 800 C and 100 MPa. Geochim. Cosmochim. Acta 2002, 66, 3719–3732. [Google Scholar] [CrossRef]
  109. Hanley, J.J.; Pettke, T.; Mungall, J.E.; Spooner, E.T. The solubility of platinum and gold in NaCl brines at 1.5 kbar, 600 to 800 C: A laser ablation ICP-MS pilot study of synthetic fluid inclusions. Geochim. Cosmochim. Acta 2005, 69, 2593–2611. [Google Scholar] [CrossRef]
  110. Simon, A.C.; Frank, M.R.; Pettke, T.; Candela, P.A.; Piccoli, P.M.; Heinrich, C.A.; Glascock, M. An evaluation of synthetic fluid inclusions for the purpose of trapping equilibrated, coexisting, immiscible fluid phases at magmatic conditions. Am. Mineral. 2007, 92, 124–138. [Google Scholar] [CrossRef]
  111. Arbonies, D.G.; Creel, K.D.; Jackson, M.L. Cortez Hills lower zone discovery and geologic update. In Proceedings of the Great Basin Evolution and Metallogeny; Steininger, R., Pennell, B., Eds.; Geological Society of Nevada: Reno/Sparks, NV, USA, 2011; pp. 447–462. [Google Scholar]
  112. Chelle-Michou, C.; Rottier, B. Transcrustal magmatic controls on the size of porphyry Cu systems: State of knowledge and open questions. SEG Special Publications, Soc. Econ. Geol. 2021, 24, 87–100. [Google Scholar]
  113. John, D.A.; Ayuso, R.A.; Barton, M.D.; Blakely, R.J.; Bodnar, R.J.; Dilles, J.H.; Gray, F.; Graybeal, F.T.; Mars, J.C.; McPhee, D.K.; et al. Porphyry copper deposit model, chap. B of Mineral deposit models for resource assessment. In U.S. Geological Survey Scientific Investigations Report 2010–5070–B; USGS: Reston, VA, USA, 2010; p. 169. [Google Scholar]
  114. Cox, D.P.; Singer, D.A. Gold—Distribution of gold in porphyry copper deposits. Contrib. Commod. Geol. Res. 1992, 1877, C1–C14. [Google Scholar]
  115. Mercer, C.N.; Hofstra, A.H. Melt inclusion and mineral geochemical analyses supporting the evaluation of petrogenesis, degassing, and metallogenic potential of mid-Cenozoic rhyolite magmas in northern Nevada, USA. In U.S. Geological Survey Data Release (Version 2.0, March 2025); USGS: Reston, VA, USA, 2020. [Google Scholar] [CrossRef]
Figure 1. Violin plot of metal concentrations in all samples. For reference, also shown are average upper and lower crust [65]; average continental crustal rhyolite [66]; regional black calcareous mudstones of the Roberts Mountains Formation and the upper member of the Popovich Formation, representing metasedimentary crustal rocks in the region (RMF and UMPF, respectively; [4]); and melt inclusion constraints on pre-eruptive magmas parental to Cu–Mo–Au mineralized systems [67,68]. The shape of the violin shows the full distribution of the data with a line at the median and dashed lines at the first and third quartile. Some metal concentrations range to below the analytical limits of detection limit (denoted < DL).
Minerals 15 00479 g001
Figure 2. Metal and sulfur concentrations in melt inclusions as a function of niobium (Nb). Due to its highly incompatible behavior, Nb is used as a proxy for melt evolution [20]. For reference, also shown are Carlin-type Au ore samples (whole rock [23,27,69,70]), average upper and lower crust values [65], and average basalt and continental crustal rhyolite [66] and references therein).
Minerals 15 00479 g002aMinerals 15 00479 g002b
Figure 3. Scatterplots showing absolute metal concentrations and ratios in melt inclusions. (ad) Concentration of elements enriched in Carlin-type Au deposits (Au, Tl, As, and Sb) with Cu and Ag, two key elements that are notably depleted in Carlin-type Au deposits. (eh) Concentration of base metals (Cu, Mo, Pb, Zn, Sn, W, Co, and Ni) depleted in Carlin-type Au deposits and enriched in porphyry deposits. Calculated hypothetical exsolved fluids (discussed below) are also shown. Rare fluid inclusion compositions from Carlin-type ore samples are shown from [6]. Also shown for reference are average upper and lower crust, basalt, and continental crustal rhyolite (same as Figure 2); regional black calcareous mudstones of the Roberts Mountains Formation (RMF) and the upper member of the Popovich Formation (UMPF; same as Figure 1); regional Eocene Nevada intrusion whole rock samples from [79]; whole rock samples of Emigrant Pass volcanics from [19]; melt inclusions from other types of porphyry or epithermal systems including Bingham Canyon Cu–Mo–Au [80], Henderson porphyry Mo [39], Taupo Volcanic Zone [81,82,83], Mole Granite [84], Rito del Medio Sn-W–Cu–Ag–Pb–Zn [42], and Elatsite porphyry Cu–Au [85]; magmatic pyrrhotite inclusion field is defined from the Bingham Canyon Cu–Mo–Au intrusions [67], Bingham Cu–Mo–Au and Tintic Ag–Pb–Zn–Cu–Au district dikes and sills [86], and the Caetano caldera ring fracture porphyry of [87].
Minerals 15 00479 g003aMinerals 15 00479 g003b
Figure 4. Covariance biplots of metals in melt inclusions. The vertices of rays represent the clr variables. Variance of each principal component is given as a percentage. Sample symbols are the same as previous figures. (a) Principal component one versus principal component two. (b) Principal component one versus principal component three. Pink shaded area covers samples with more I-type affinity, whereas blue shaded area covers samples with more A-type affinity. Sample symbols are the same as in Figure 2 and Figure 3.
Minerals 15 00479 g004
Figure 5. Schematic CoDa-PCA biplot highlighting possible connections to geologic processes (rhyolite characteristics on ordinate are reported in [20]). (a) Scatterplot of PC1 scores vs. europium anomalies, Eu/Eu*; Eu/Eu* is an indicator of melt evolution by plagioclase fractionation; higher Eu/Eu* indicates less plagioclase fractionation. (b) Scatterplot of PC1 scores vs. Sr/Y; Sr/Y is an indicator of melts that equilibrated with arc-metasomatized subcontinental lithospheric mantle and/or deep crust containing garnet and/or amphibole; higher Sr/Y ratios indicate more equilibration with these materials. (c) Scatterplot of PC1 scores vs. biotite fO2 (ΔNNO); this is an estimate of magma redox relative to the nickel–nickel oxide buffer; higher values indicate more oxidized systems. (d) Scatterplot of PC1 scores vs. Hr/Ta; restored Hr values (i.e., approximate water concentration before post-entrapment diffusive loss) normalized to the extent of fractional crystallization (Ta; note we use Ta to avoid spurious correlations with Nb); higher values indicate fundamentally more hydrous magmas. (e) Scatterplot of PC2 scores vs. Dy/Dy*; Dy/Dy* is a measure of the curvature of REE patterns; low Dy/Dy* highlights melt contributions controlled by sediment-enriched sources and interaction with mid- to deep-crustal phases such as amphibole, clinopyroxene, and garnet. (f) Scatterplot of PC3 scores vs. entrapment pressure (MPa). Sample symbols are the same as in Figure 2 and Figure 3.
Minerals 15 00479 g005
Table 1. Overview of igneous samples and nearby Carlin-type Au deposits.
Carlin TrendSample NameRock TypeIgneous Age (Ma)Carlin-Type Au Deposit NearbyCarlin-Type Au Deposit Age (Ma)Interpreted Timing 1Interpreted Petrogenetic Affinity 2
Long CanyonNanny Creek tuffRhyolite tuffs39.61–41.08Long Canyon39–41Syn-oreTransitional I-type/A-type
Carlin Beast dikePorphyritic dike37.55Beast<37.3Pre-oreI-type endmember
K dikePorphyritic dike40.3Genesis<40.3Pre-/syn-oreI-type
Battle Mountain–Eureka Caetano caldera suiteIntra-caldera tuff, ring fracture porphyry dike35.7Cortez Hills complex33.90–34.0Post-oreA-type endmember
Cortez Hills dikesPorphyritic dike35.7Cortez Hills complex35.71Syn-/post-oreTransitional I-type/A-type
Eureka domeRhyolite dome35.4Archimedes/Ruby Hill>36Post-oreA-type
Alligator Ridge Mooney Basin dikePorphyritic dike35.9Galaxy, Horseshoe, Saga<45, >34Syn-/post-oreA-type
1 Based on geologic and geochronologic evidence. 2 Following Mercer et al. [20], these terms are used primarily to describe an assortment of geochemical characteristics, not to imply specific tectonic interpretations. Ages are compiled from [7,9,22,23,25,27,28,29,30,31,32,33,34,35,36].
Table 2. Loadings corresponding to CoDa-PCA of melt inclusion data. Cells with loadings ≥0.3 in absolute value are highlighted with pale colors and loadings ≥0.6 in absolute value are highlighted with bold colors (blue = negative loadings, yellow = positive loadings). Last rows show the total variance explained by each principal component as well as the cumulative % variance.
Principal ComponentPC 1PC 2PC 3PC 4PC 5PC 6PC 7PC 8PC 9PC 10
Nb0.23−0.320.11−0.070.05−0.090.27−0.14−0.310.13
Cu −0.82−0.41−0.010.03−0.270.03−0.050.010.01−0.03
Zn0.15−0.200.050.110.240.40−0.040.240.480.50
As0.110.26−0.180.44−0.47−0.22−0.170.40−0.060.25
Mo−0.030.470.12−0.23−0.350.630.27−0.10−0.15−0.04
Ag−0.290.350.260.270.62−0.090.160.28−0.25−0.13
Sn0.32−0.43−0.030.06−0.100.050.330.34−0.01−0.52
Sb0.100.20−0.260.38−0.02−0.08−0.11−0.410.23−0.40
Te−0.02−0.04−0.090.020.230.15−0.15−0.350.35−0.11
W0.07−0.050.230.11−0.09−0.340.25−0.49−0.110.39
Au−0.040.10−0.76−0.450.20−0.150.100.08−0.130.15
Tl0.19−0.130.15−0.140.070.15−0.75−0.03−0.45−0.06
Pb0.020.190.39−0.53−0.12−0.43−0.100.170.42−0.14
% variance3718159553221
Cumulative
% variance
37557180859093959799
Table 3. Summary of rhyolite characteristics (discussed in [20]) used to test regression responses.
Compositional CharacteristicGeological Process Interpretation
NbHighly incompatible element used to model Rayleigh fractional crystallization and as a proxy for melt evolution; higher values are more evolved melts
TaHighly incompatible element used to model Rayleigh fractional crystallization and as a proxy for melt evolution; higher values are more evolved melts
HrRestored water content; calculated dissolved H concentration in melt before post-entrapment diffusive loss
Hr/Nb, Hr/TaRestored water contents normalized to the extent of melt evolution
ASIAluminum saturation index; variable used to classify feldspathic igneous rocks, separating metaluminous from peraluminous compositions
MALIModified alkali–lime index; variable used to classify feldspathic igneous rocks, a measure of calcic to alkalic affinity
PeralkPeralkalinity index; variable used in feldspathic igneous rock classification, discriminating peralkaline rocks from metaluminous and peraluminous rocks
Y+NbIncompatible elements used to discriminate I-type from A-type felsic compositions
Sr/YIndicator of melts that equilibrated with arc-metasomatized subcontinental lithospheric mantle and/or deep crust containing garnet and/or amphibole; typically high in porphyry Cu systems
Eu/Eu*Indicator of melt evolution by plagioclase fractionation; value close to 1 indicates small anomaly and little plagioclase fractionation; value close to 0 indicates large negative anomaly and abundant plagioclase fractionation
Biotite IV(F/Cl)Indicator of halogen activity in the magma, corrected for Mg/Fe ratio in the biotite, with lower values associated with higher degrees of F enrichment
Biotite fO2 (ΔNNO)Estimate of magma redox relative to the nickel–nickel oxide buffer; for reference, ΔNNO+1 to +2 is relatively oxidized (on par with subduction zone processes)
La/YbMeasure of the enrichment of LREE over HREE in melts that equilibrated with arc-metasomatized subcontinental lithospheric mantle and/or deep crust containing garnet and/or amphibole
Dy/Dy*Measure of the curvature of REE patterns, highlighting melt contributions controlled by mid- to deep-crustal phases; low values may indicate interaction with amphibole/clinopyroxene and garnet, sediment-enriched source, or LREE enriched source, whereas high values indicate LREE-depleted source
P (MPa)Pressure at which individual melt inclusions were trapped
T (°C)Temperature at which individual melt inclusions were trapped
Disclaimer/Publisher’s Note: The statements, opinions and data contained in all publications are solely those of the individual author(s) and contributor(s) and not of MDPI and/or the editor(s). MDPI and/or the editor(s) disclaim responsibility for any injury to people or property resulting from any ideas, methods, instructions or products referred to in the content.

