Article

Extraction of Copper from Printed Circuit Boards in an Alkaline Solution Using EDTA

by
Alan Oliveira Goulart
1,2,
Tácia Costa Veloso
3,
Hugo Marcelo Veit
4,* and
Tatiane Benvenuti
1
1
Departamento de Engenharia e Computação, Universidade Estadual de Santa Cruz, Ilhéus 45662-900, Brazil
2
Departamento de Engenharia Química, Escola Politécnica, Universidade de São Paulo, São Paulo 05508-010, Brazil
3
Centro de Formação em Tecno-Ciências e Inovação, Universidade Federal do Sul da Bahia, Ilhéus 45604-811, Brazil
4
Departamento de Engenharia de Materiais, Universidade Federal do Rio Grande do Sul, Porto Alegre 91509-900, Brazil
*
Author to whom correspondence should be addressed.
Minerals 2025, 15(4), 409; https://doi.org/10.3390/min15040409
Submission received: 18 December 2024 / Revised: 1 April 2025 / Accepted: 7 April 2025 / Published: 13 April 2025
(This article belongs to the Section Mineral Processing and Extractive Metallurgy)

Abstract

:
With the rapid technological development in the 21st century, the increasing consumption of electronic devices has led to a rise in the generation of waste electrical and electronic equipment (WEEE) due to the disposal of equipment considered obsolete. A significant portion of these wastes contain printed circuit boards (PCBs), which serve as substrates for the connection of microchips, resistors, capacitors, and other components. These boards are composed of various materials, primarily metals such as copper. Thus, this study investigated the recovery of copper from PCB waste (WPCBs) from computers through alkaline leaching, using EDTA and hydrogen peroxide at temperatures of 40 °C, 60 °C, and 80 °C, with a concentration of 0.6 mol/L and varying particle sizes. Using a UV-VIS spectrophotometer, it was observed that the copper extraction process with EDTA at 0.6 mol/L and a temperature of 60 °C achieved a recovery rate of 78.6% for particles smaller than 0.177 mm after 180 min, following the Avrami kinetic model. The results highlight the potential of EDTA as a complexing agent in copper extraction, positioning it as a promising technique to reduce environmental contamination and recover strategic resources through urban mining through the recovery of metals from WEEE.

1. Introduction

The growing production of electronic waste is driven by rapid technological advances and the frequent replacement of obsolete devices, meeting both the search for competitiveness and growing consumer demands. This trend reduces the lifespan of products and increases the volume of WEEE [1,2]. Among these wastes, commonly found items include refrigerators, air conditioners, televisions, notebooks, smartphones, light bulbs, electronic toys, and even medical devices and measuring and control instruments [3]. According to data published by the United Nations Institute for Training and Research (UNITAR), in 2024, it was estimated that 62 million tons of WEEE were generated in 2022, of which only 22.26%, approximately 13.8 million tons, were properly managed and documented. The projection is that WEEE generation will reach 82 million tons by 2030 [4].
The composition of WEEE may vary depending on the type of device discarded. Polymers, for example, represent approximately 20% to 30% of their weight, including ABS, HIPS, polycarbonate, and polypropylene, often combined with flame retardants and stabilizers [5]. Additionally, ceramic materials such as silica and mica constitute one-third of WEEE, while base and precious metals, together with rare earth elements, constitute the remaining 40% [6,7]. Most electronic devices contain printed circuit boards (PCBs), which represent 4% to 7% of their total weight and serve as substrates for essential components such as resistors, capacitors, and processors [8]. PCBs are typically manufactured from epoxy resins reinforced with glass fiber and Cu layers, sometimes coated with Au, resulting in composites with specific mechanical and electrical properties [9,10]. Other metals, such as Fe, Al, and Ni; precious metals, such as Au, Ag, Pd, and Pt; and rare earth elements, such as Nd, Gd, Ce, and Dy, can also be found in PCB components, along with Pb, Hg, and Cd, which are considered potentially toxic. Improper disposal of these materials can lead to the loss of strategic resources and cause serious environmental damage [4,11,12].
Several techniques can be used to recover material from Waste Printed Circuit Boards (WPCBs), including pretreatment processes such as classification and mechanical disassembly to remove components and peripherals attached to the boards [9]. For the recovery of materials, particularly metals, additional steps are implemented, such as crushing, leaching, purification, thermal treatments, and refining [13]. Fragmentation of the boards is commonly carried out using mills and shredders, adapted to handle the complexity of this waste [14]. As reported in the study by Hubau et al. (2019) [15], milling of WPCBs using a Retsch SM-2000 knife mill was able to produce waste particles smaller than 750 µm; however, particles between 500 and 750 µm could not be further reduced by this technique due to the higher presence of more ductile metals. In this regard, Touzé et al. (2022) [16] bioleaching techniques decrease, and the dispersion of metallic particles also declines, with particles between 750 µm and 2 mm showing a less uniform metal distribution, as determined by X-ray fluorescence (XRF). Regarding the polymeric fraction, Kumar et al. (2020) [17] observed that in WPCBs of different sizes, there are significant variations in the number of polymers. This variation was evidenced through mass loss tests and thermogravimetric analysis (TGA), noting a smaller fraction of polymeric material in particles smaller than 0.075 mm.
Alternatives for electronic waste management have been explored, including recycling, reuse, and recovery of metals through pyrometallurgical, hydrometallurgical, electrometallurgical, and bioleaching techniques, besides physical and mechanical processes [11]. Among these, hydrometallurgy stands out for the use of acidic or basic solutions for metal extraction, followed by recovery processes such as solvent extraction, chemical precipitation, adsorption, cementation, ion exchange membranes, or electrodeposition [8,18,19]. This method can be used after the initial mechanical crushing and classification stage, where the metallic fractions are exposed to the leaching process [7]. Leaching involves the use of acidic or alkaline solutions, such as halides, thiourea, thiosulfate, cyanide, HCl, H2SO4, and HNO₃. These agents promote the release of ions in the reaction medium by breaking metallic bonds, which can be mediated by the formation of metal complexes with the leaching agents [20,21].
An alternative to the traditionally employed techniques for metal extraction processes involves the use of complexing agents capable of creating a coordinated bond with a metal cation, creating a closed ring structure [21]. Due to its strong chelating properties and cost-effectiveness compared to other agents, ethylenediaminetetraacetic acid (EDTA) is recognized as an effective chelating agent. It has been applied in the recovery of metals such as Ni, Cd, Zn, Cu, and Pb [22,23,24,25]. EDTA forms stable metal complexes through coordinating covalent bonds between its ligands and metals within a heterocyclic ring structure. These complexes are water soluble, facilitating favorable conditions for the electrochemical recovery of target metals [8,11,24].
Recent studies indicate that copper, in both metallic and oxide form, interacts with EDTA in an alkaline medium, resulting in complexation as described by Yousefzadeh et al. (2020) [26], as shown in Equations (1) and (2). When Cu2+ binds to EDTA, a hexadentate ring complex is formed. In this structure, four carboxylate groups and two nitrogen atoms coordinate with the central metal, creating multiple bonds to the same cation, which enhances the complex’s stability [27].
C u 2 + + N a 2 EDTA 2   CuEDTA 2 + 2 N a +
CuO + N a 2 EDTA 2 + H 2 O   CuEDTA 2 + 2 N a + + 2 O H
In studies conducted by Jadhao et al. (2016) [25], copper recovery from WPCBs using EDTA was compared to the traditional acid leaching method with H2SO4. Using a concentration of EDTA at 0.5 M, reaction temperature of 100 °C, liquid/solid ratio of 15:1, stirring at 700 rpm, and pH equal to 8.0 for 3 h, it was achieved 85% copper extraction. Comparatively, leaching using H2SO4 and H2O2 under the same concentration conditions resulted in the recovery of just over 20% of the copper, demonstrating the superiority of the chelation technology, which extracted 58% more copper than leaching acidic under ideal conditions. Jadhao et al. [25] concluded that the use of EDTA not only demonstrates a superior recovery rate of copper in PCBs but also represents a more selective, sustainable, and less harmful to the environment method compared to acid leaching. In parallel studies such as that of Yousefzadeh et al. [26], the effectiveness of EDTA in copper recovery from WPCBs was evaluated, getting a copper recovery rate of 88% using EDTA at a concentration of 0.36 M at a temperature of 90 °C for a period of 2 h, demonstrating a slightly higher copper recovery capacity compared to the earlier study by Jadhao et al. [25]. It is worth noting that the studies by Jadhao et al. [25] and Yousefzadeh et al. [26] have limitations regarding the direct use of EDTA in the leaching process, with previous leaching of Cu using acid solutions, which implies economic and environmental impacts due to the inclusion of steps for metal extraction.
For a direct leaching process using EDTA, the combination with oxidizing agents such as H2O2 enables the direct extraction of metals such as copper in alkaline solutions. This is due to the interaction of H2O2 with the Cu⁰ surface through redox reactions, as shown in Equations (3) and (4), to form Cu2+ ions that are complexed by EDTA, as shown in Equations (5) and (6) [28].
H 2 O 2   O 2 + 2 H + + 2 e
H 2 O 2 + 2 e 2   O H
C u 0   C u 2 + + 2 e
C u 2 + + HEDTA 3 EDTA Cu 2 + H +
Torres and Lapidus (2016) [29] examined the combined use of EDTA and H2O2 compared to traditional reagents in the pretreatment and extraction of copper from electronic waste. The study included the use of inorganic acids such as HCl, HNO3, and H2SO4, as well as organic agents such as EDTA and citrate, with concentrations of 0.1 mol/L EDTA and 0.1 mol/L H2O2 to 20 g of WEEE at a temperature of 25 °C for a period of 6 h. This approach resulted in the removal of approximately 30% of copper from waste, which, according to the authors, was mainly influenced by the amount of reagent available for reaction. This suggests that higher extraction rates could be achieved by utilizing temperatures above 25 °C and using other reagents such as citrate, which, combined with hydrogen peroxide, achieved copper extractions of more than 90%.
Understanding reaction kinetics is essential for evaluating the effects of temperature, pressure, and composition on reaction rates [30]. Hydrometallurgical processes involve heterogeneous reactions where the solid phase is dissolved in a liquid or gas phase [30]. In the solvent extraction process, for example, metals transition between aqueous and organic phases with ion exchange, while in ion exchange, the rate depends on diffusion in the ion exchanger, varying according to process conditions [31,32]. The reaction rate is also affected by the quantity and surface area of the solutes, decreasing as they are consumed [32].
As described in the works of Liao et al. (2015) [33] and Muzayanha et al. (2020) [34], leaching kinetics can be expressed by homogeneous or heterogeneous models. The studies stated that the shrinking core model is the most commonly used in leaching processes, which can be controlled by surface chemical reactions, diffusion control, or mixed reactions, as shown in Equations (7)–(9), where X represents the extraction percentage, t is the leaching time, and k r , k d , and k m represent the chemical reaction rate constant, the diffusion reaction rate constant, and the mixed control reaction rate constant, respectively [35].
1 1 X 1 / 3 = k r t
1 2 3 X 1 X 2 / 3 = k d t
1 1 X 1 / 3 1 3 ln 1 X = k m t
If conventional models do not fit well with the experimental data, the Avrami equation can be considered an effective alternative for hydrometallurgical processes [36,37]. Originally proposed to describe crystallization kinetics, the Avrami equation assumes that the growth of a solid structure begins after random and homogeneous nucleation and that the growth rate remains constant and independent of the conversion fraction. This behavior is the inverse of what is expected in leaching processes, as shown in Equation (10), where k A is the Avrami constant, which can be used to evaluate activation energy using the Arrhenius equation, Equation (11), and m is a constant used as the control mechanism: if the leaching kinetics are governed by diffusion through the product layer, the exponent will be less than 0.5; otherwise, the rate-determining step will be the chemical reaction [35,38].
ln 1 X = k A t m
k A = k 0 exp E a RT
Regarding the leaching kinetics of copper in WPCBs, the study by Hao et al. (2022) [35] is revisited, which evaluated the removal rate of this metal in H2O2/H2SO4 solutions under different conditions of solid–liquid ratio, temperature, reagent concentration, particle size, and agitation, following the Avrami model. Hao et al. [35] demonstrated that the model fits the experimental data, enabling predictions of the leaching rate under varying conditions. Their findings suggest that the process is complex and controlled by both chemical reactions and diffusion. Other kinetic models, although initially proposed for homogeneous systems, can be applied to describe the behavior of a leaching reaction, following the reaction rate law up to the nth order, as presented by Faraji et al. (2022) [38] in Equation (12), relating the pseudo-homogeneous reaction rate constant ( k ) with the concentration of a substance ( C A ) during the leaching process for a reaction of order n .
R = k C A n
The pseudo-homogeneous model is a kinetic model often used to describe heterogeneous reactions by assuming that the reactants and products behave as if they were in a homogeneous phase, as demonstrated in the study done by Hao et al. [35]. In the context of leaching kinetics, the pseudo-homogeneous model assumes that the dissolution of metals (such as copper) follows a reaction rate law like homogeneous chemical reactions, despite occurring in a heterogeneous system (solid–liquid interface) [38].
The present study aimed to extract copper from WPCBs of different particle sizes using EDTA and H2O2 in an alkaline medium to investigate the effect of temperature and concentration on process efficiency. Unlike conventional processes that use EDTA after leaching, it is expected that the direct application of this reagent with an oxidizing agent such as H2O2 will enable the promotion of an alternative method in urban mining processes aimed at extracting metals.

2. Materials and Methods

2.1. Grinding, Classification, and Characterization of WPCBs

For the development of this research, the WPCBs used were extracted from discarded computer CPUs donated by the company ReciclaBrasil, located in Itabuna, Bahia. The motherboards were separated from components such as power supplies, cables, and heat sinks. The WPCBs still contained electronic elements such as resistors, capacitors, and processors, enriching the waste for the number of metals present and allowing the investigation of metal distribution relative to particle size after the grinding process. Initially, the waste was fragmented into pieces up to 100 mm using a silicon carbide disk grinder. Next, it was crushed using a knife mill, model MGVS-1, manufactured by Seibt, localized in Nova Petrópolis, Brazil, with a 3 mm screen, operating for 2 h. After crushing, the particles were classified using 7, 10, 20, 40, and 80 mesh sieves, resulting in two groups of WPCBs used in this study: PA20 (0.420 to 0.841 mm) and PA80 (<0.177 mm). Particles with sizes different from those adopted in this research were stored for future studies.
The metal composition of the PA20 and PA80 samples was initially determined using a XRF Spectrometer, model Niton XL3t, from Thermo Scientific, using the reference library “all geo”, with three 5.00 g samples collected from each sample group. To evaluate the elemental concentration of metals, present in the PCB waste samples after the grinding process, the methodology adopted by Korf et al. (2019) [39] was adapted, with eight 1.00 g samples selected for each particle size obtained in the sieving process (PA20, 0.841 mm–0.420 mm, and PA80, <0.177 mm). These samples were subjected to an acid digestion process using aqua regia. For each of the 32 samples, 37.5 mL of 37% hydrochloric acid and 12.5 mL of 65% nitric acid were used. After acid digestion, the samples were filtered and washed with distilled water, and the final volume was adjusted to 50.00 mL in volumetric flasks. An aliquot of 1.00 mL from each replicate was collected and transferred to 250.00 mL flasks and diluted for analysis using an ICP-OES, model 5110, from Agilent Technologies, carried out at the Laboratório de Corrosão (LACOR), at the Universidade Federal do Rio Grande do Sul (UFRGS), to determine the concentrations of metals such as Ag, Au, Al, Cu, Fe, Mn, Ni, Pb, Sr, Sn, and Zn.
To assess the polymeric fraction in printed circuit board wastes, a thermogravimetric analysis was performed using a thermal analyzer, model DTG-60H, from Shimadzu. The test was conducted with a heating rate of 10 °C/min up to 1000 °C and was carried out at the Laboratório de Pesquisa e Inovação em Materiais Avançados (LAPIMA), at the Universidade Estadual de Santa Cruz (UESC). Three samples from each waste group were selected based on their respective particle sizes to ensure a representative analysis.

2.2. Copper Extraction Process with H2O2/EDTA

The copper extraction and complexation process from WPCBs was carried out by releasing Cu2+ ions through metal oxidation with H2O2. In previous studies, such as the one by Jadhao et al. (2016) [25], it was shown that at EDTA concentrations lower than 0.50 mol/L, the percentage of copper recovery was less than 50%, even at temperatures up to 100 °C. Preliminary tests carried out before the conclusion of the present study also tested concentrations of 0.50 mol/L, 0.60 mol/L, and 0.70 mol/L, indicating that the concentration of 0.60 mol/L presented the best percentages of copper extraction, chosen for this reason. To prepare EDTA solutions at a concentration of 0.6 mol/L, disodium dihydrate EDTA was dissolved in 800 mL of distilled water. Due to the low solubility of the salt, NaOH was added in the form of a solid until a pH of 8.0 was reached. The solution was then transferred to a 1000.00 mL volumetric flask for standardization, with pH adjustments as needed. After obtaining the chelating solution, 10.00 g of WPCBs from the PA20 and PA80 samples were placed in 500 mL Erlenmeyer flasks, to which 180 mL of EDTA solution and 20 mL of 35% hydrogen peroxide were added.
To assess the effect of temperature on copper extraction from WPCBs using the EDTA and H2O2 solution, the Erlenmeyer flasks were placed in a thermostatic bath, model 577, from Fisaton, preheated and maintained at constant mechanical stirring at 700 rpm for three hours. For each sample group, PA20 and PA80, triplicates were performed at temperatures of 40 °C, 60 °C, and 80 °C, with six 2.00 mL aliquots collected at intervals of 15 min, 30 min, 1 h, 1 h and 30 min, 2 h, and 3 h. These were immediately filtered and transferred to their respective 10.0 mL volumetric flasks for dilution and homogenization and then stored for later analysis in a UV-VIS Spectrophotometer.

2.3. Determination of Extracted Copper Amount by UV-Vis Spectroscopy

To quantify the concentration of copper in the solutions resulting from the extraction process, the collected samples were analyzed using a digital UV-visible spectrophotometer, model GTA-96, manufactured by Global Trade Technology. For this, 100.00 mL of a 1.00 mol/L EDTA-Cu2+ standard solution was prepared. This solution was later analyzed by an ICP-OES, after a 600-fold dilution, allowing precise determination of the copper concentration in the standard solution. After establishing the copper concentration in the EDTA solutions, these standard solutions were diluted in ten 25.00 mL volumetric flasks to create EDTA-Cu2+ solutions ranging from 200 to 1100 ppm to construct an analytical curve for determining the absorbance peak in UV-Vis spectrophotometry.
To ensure the accuracy of analytical results according to the Beer–Lambert law, the absorbances of the solutions were maintained close to 1.0000 absorbance units (a.u) to prevent significant deviations in the wavelength equivalent to the peak absorbance. This approach was adopted following the procedures described by Canassa (2018) [40] and Rahardjo et al. (2018) [41], with the maximum absorbance peak for the EDTA-Cu2+ complex determined at a wavelength of 730 nm, as interpolated by the Beer–Lambert law.
The percentage of copper extraction, represented by E Cu , was obtained according to Equation (13), where m C u f represents the mass of copper in the H2O2/EDTA solution, determined from UV-Vis analysis and m C u 0 is the initial mass of copper present in WPCBs obtained from the pro ICP-OES analysis.
E Cu = m C u f m C u 0

3. Results and Discussion

3.1. XRF Analysis of WPCB Samples

To analyze the metal composition present in the WPCBs, an XRF was used, and the results are presented in Table 1, where RSD denotes the relative standard deviation. The samples were examined considering different particle sizes, with the abbreviation “Bal” representing elements that fell below the detection limit (Z < 10). The analysis revealed a notable pattern: metals such as Cu, Al, Zn, Ni, Bi, Au, and Ag showed a decrease in their mass fraction as particle size decreased. In contrast, Fe, Sn, Ti, Pb, Mn, and Sr increased the mass proportion in the smaller particle size fractions.
In the data dispersion analysis conducted via XRF, the equipment errors were below 10% for metals like Cu, Al, Zn, Ni, Sn, Bi, and Sr across all particle sizes studied. Conversely, elements such as Au, Ti, and Mn displayed greater variability in the measurements. For particles smaller than 0.841 mm, particularly Ag and Pb, a significant reduction in error was observed, indicating greater sample homogeneity. This behavior is corroborated by the findings of Touzé et al. (2022) [16], who reported RSD values below 10% for various metals in particles between 0.200 and 0.750 mm, highlighting the data dispersion in XRF analyses. However, larger particle samples, ranging from 0.750 to 2.000 mm, exhibited greater heterogeneity, underscoring the limitations of the XRF technique for larger particle sizes. The accuracy of XRF measurements is impacted by particle size, with larger particles showing greater standard deviation and reduced X-ray intensity, which directly influences the accuracy of the detected concentrations [42].
Despite this, with proper calibration, portable XRF proves to be a fast and non-destructive technique, ideal for preliminary analyses and assessment of the relative distribution of metals in WPCBs, as highlighted by Touzé et al. (2022) [16]. This technique allowed for the semi-quantitative identification of prevalent metals in PCBs, especially Cu and Fe. To validate these findings, additional analyses were conducted using ICP-OES after sample digestion in aqua regia to confirm the collected data.

3.2. ICP-OES Analysis of WPCB Samples

After digesting the WPCBs in aqua regia, an analysis by ICP-OES enabled a quantitative evaluation of the metal content and distribution across different particle sizes resulting from fragmentation with a knife mill. As shown in Table 2, where ME represents the total fraction of extracted metals, it was observed that metals such as Cu, Zn, Ni, Pb, Sn, Mn, Ag, and Au exhibited a decrease in mass concentration as particle size decreased. Conversely, Fe, Al, and Sr showed an increase in mass concentration with the reduction in particle size. These patterns, consistent with the XRF spectroscopy data, indicated that Cu is the predominant metal in PCBs, especially in the 0.420 to 0.841 mm range (PA20), followed by Zn and Fe. However, metals such as Sn, Pb, and Au showed high standard deviations in particles smaller than 0.420 mm, suggesting an irregular distribution in these finer particle sizes.
The post-digestion analysis in aqua regia also indicated differences in metal distribution relative to particle size, with the 0.420 to 0.841 mm range (PA20) showing the highest concentration of dissolved metals, equivalent to 50.5%, while WPCBs smaller than 0.177 mm (PA80) had a fraction of 30.9%. In the study by Blumbergs et al. (2022) [7], an increase in metal concentration was observed in PCB particles with sizes between 0.18 and 0.35 mm, reaching up to 57.7% by weight, while fractions sized between 0.711 and 1.40 mm had a metal content of 14.3% by weight, which differs from the results obtained in this study. Additionally, Blumbergs et al. found that particle size fractions from 0.09 to 0.35 mm were the most promising for determining the contents of metals such as Ag, Au, Pd, Pt, Al, Cd, Co, Cr, Cu, Fe, Mn, Mo, Ni, Pb, Sb, Sn, Ti, V, and Zn, based on ICP-OES analysis.
As reported by Hubau et al. (2019) [15], precious metals such as Ag and Au exhibited elevated concentrations in particles smaller than 0.063 mm. On the other hand, metals like Cu, Fe, Al, Pb, Sn, Zn, and Ni showed the highest concentrations in particles ranging from 0.400 to 0.800 mm, which aligns with the findings of this study. According to Suponik et al. (2021) [43], the efficiency of the metal separation process is intrinsically linked to particle size, highlighting that complete separation of metals from polymeric and ceramic components is more feasible in particles smaller than 0.3 mm and, to a lesser extent, for those below 0.8 mm. Thus, an increase in metal concentration was expected in particles smaller than 0.177 mm (PA80). However, it was observed that the presence of ductile metals like Cu, Au, and Ag, which tend to deform rather than break, decreases, while more brittle metals like Fe fragment more uniformly during grinding. This phenomenon results in the formation of fine wires or flattening of more ductile metals, leading to a lower fragmentation rate for these materials and, consequently, a greater accumulation of these metals in larger particles, as documented by Blumbergs et al. (2022) [7] and Yamane et al. (2011) [44].
For a better presentation and comparison of the data obtained by ICP-OES and XRF, the weighted average was calculated for the concentrations of the elements that make up the metallic fraction in the WPCBs ( M i ) , according to Equation (14), where p P A 20 i and p P A 80 i refer to the proportion of the concentration of the element in the metallic fraction and, m P A 20 and m P A 80 , represents the total fraction of metals in each particle size, and i is the metal analyzed. Thus, in Figure 1, we find the results of the weighted averages represented in a bar chart.
M i = p P A 20 i m P A 20 + p P A 80 i m P A 80 m P A 20 + m P A 80  

3.3. Determination of the Polymeric Fraction

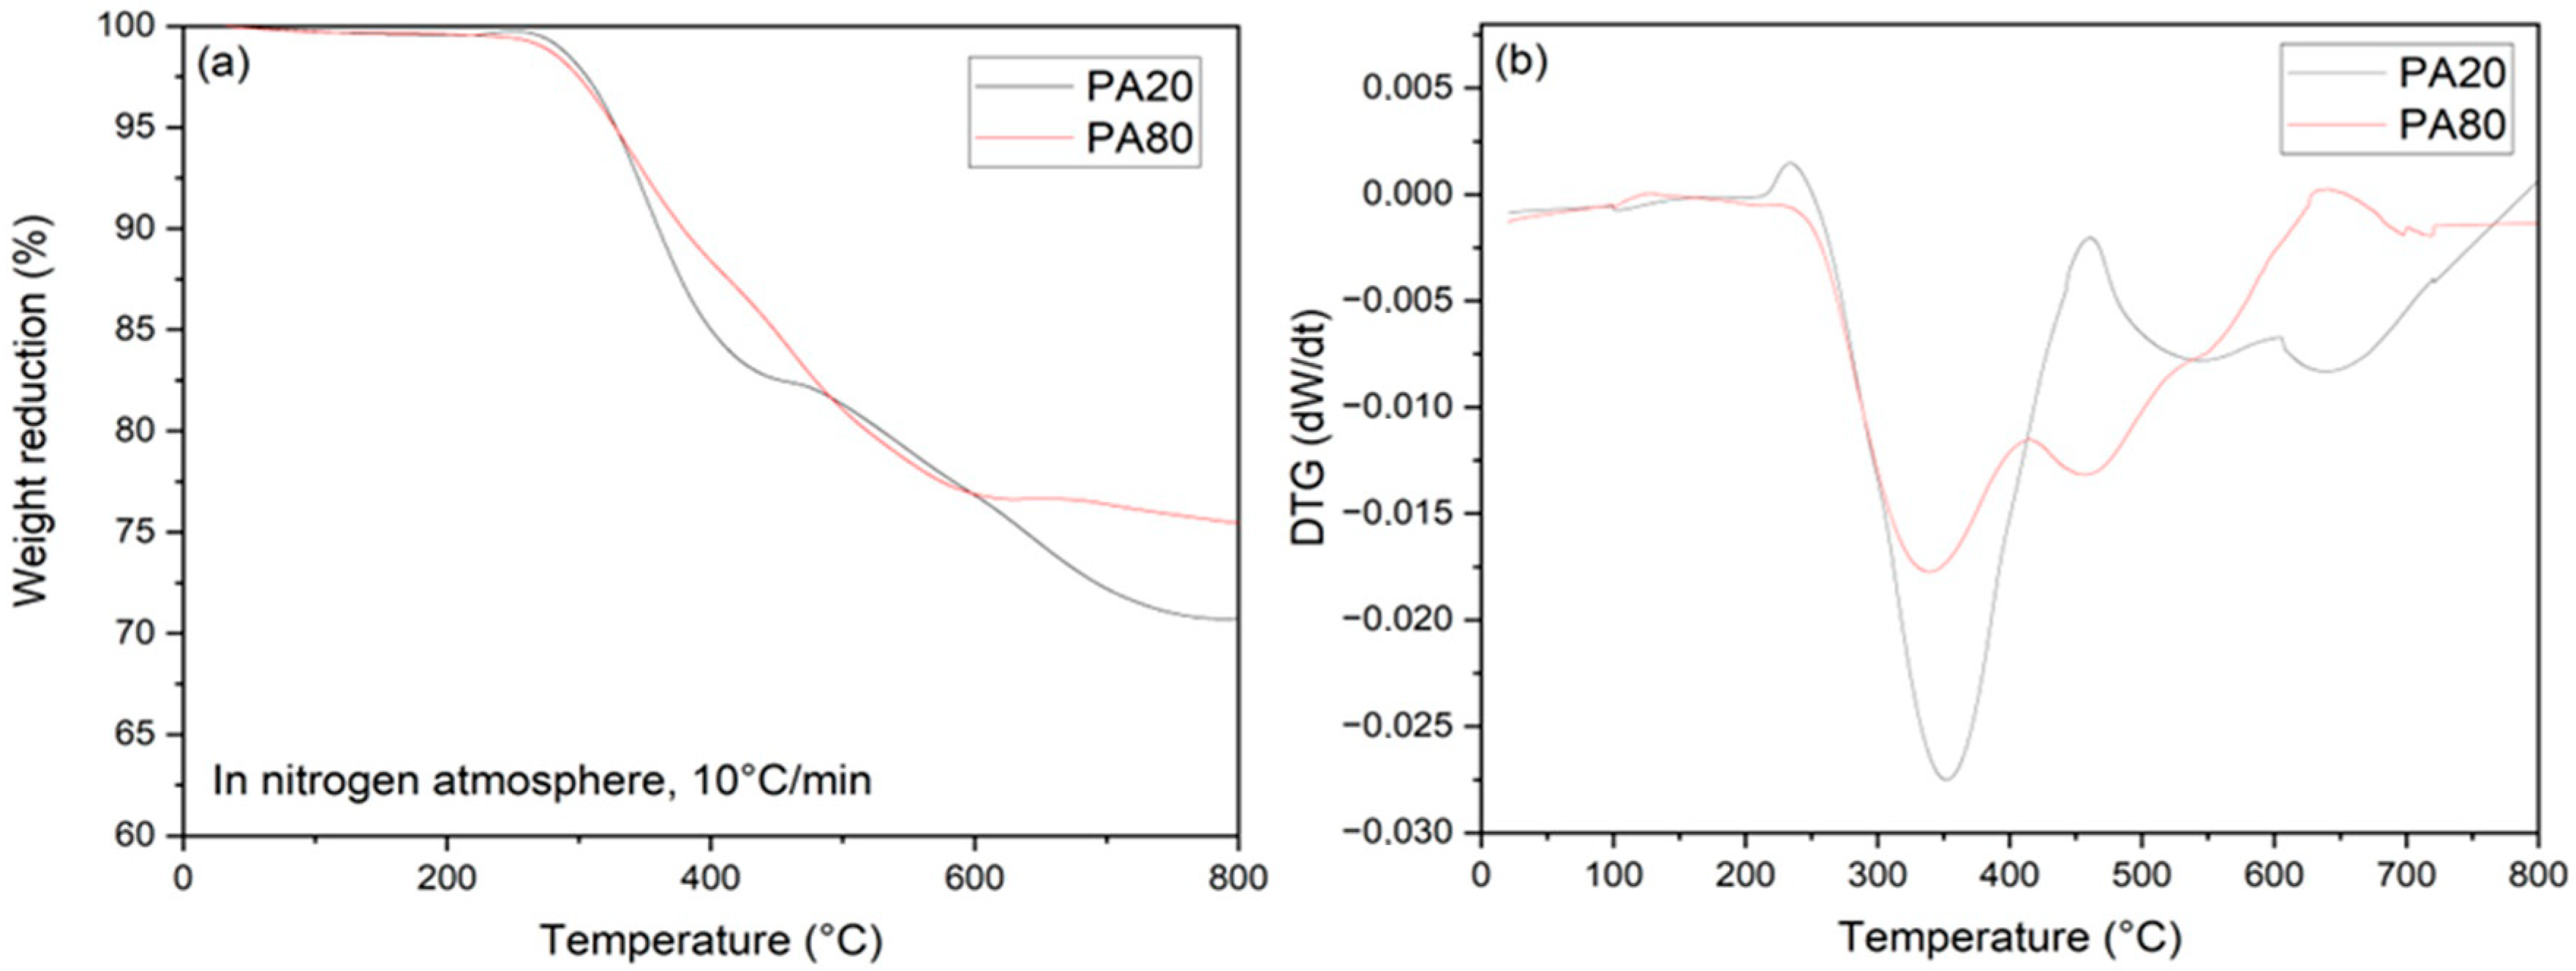
To verify the total fraction of polymers present in the WPCBs, thermogravimetric analyses were conducted for each particle size used to evaluate mass loss as a function of increasing temperature. The results, presented in Figure 2a, show that between 310 °C and 320 °C, there was a rapid decomposition of the material. In all particle sizes, mass reduction stabilized around 750 °C. At this point, the thermogravimetric analysis revealed that particles from the PA80 group had the lowest content of polymeric materials, with a mass reduction of about 24.17%, while PA20 particles exhibited a reduction of 28.93%. Furthermore, Figure 2b displays the graph of the derivative of the thermogravimetric curve, indicating the highest peaks in the range of 300 to 400 °C for all particle size ranges. It was expected that smaller particles, due to their larger surface area, would promote more efficient combustion, resulting in a greater mass variation for the PA80 group, as presented by Kumar et al. (2020) [17]. However, this was not observed, thus suggesting a lesser presence of the polymeric fraction in WPCBs ground to a size smaller than 0.177 mm.
According to Kumar et al. (2020) [17], the decomposition of phosphorus-based flame retardants occurs between 100 and 280 °C, while brominated flame retardants, made of hydrogen bromide and brominated aromatic compounds, decompose between 280 and 370 °C. The researchers showed that the degradation temperature, at which the sample mass begins to decrease due to thermal decomposition of the epoxy resin or paper laminate, reaches a maximum of about 320 °C. The first phase of rapid decomposition occurs from 250 to 350 °C, with an approximate peak at 310–320 °C, while a second slower phase of decomposition begins after 400 °C, reaching a peak near 500 °C, indicating the presence of more thermally stable components in the PCBs.
The results obtained by TGA were used in the calculation of material distribution, and it was possible to quantify the distribution of metals, polymers, and ceramic materials in the various particle sizes examined. These results are shown in Table 3, indicating that there is a decrease in the fraction of metallic materials with a decrease in particle size (PA80 in relation to PA20).
The findings of this study are in line with the findings of Charitopoulou et al. (2022) [5] regarding the distribution of the material fractions in the PCI waste. The results show that the use of a knife mill for grinding and the unique fragmentation of the PCBs results in particles of size between 0.420 and 0.841 mm (PA20) with the highest concentration of metals, which favors the use of recovery processes, such as the hydrometallurgical route.

3.4. Copper Extraction from WPCBs with H2O2/EDTA

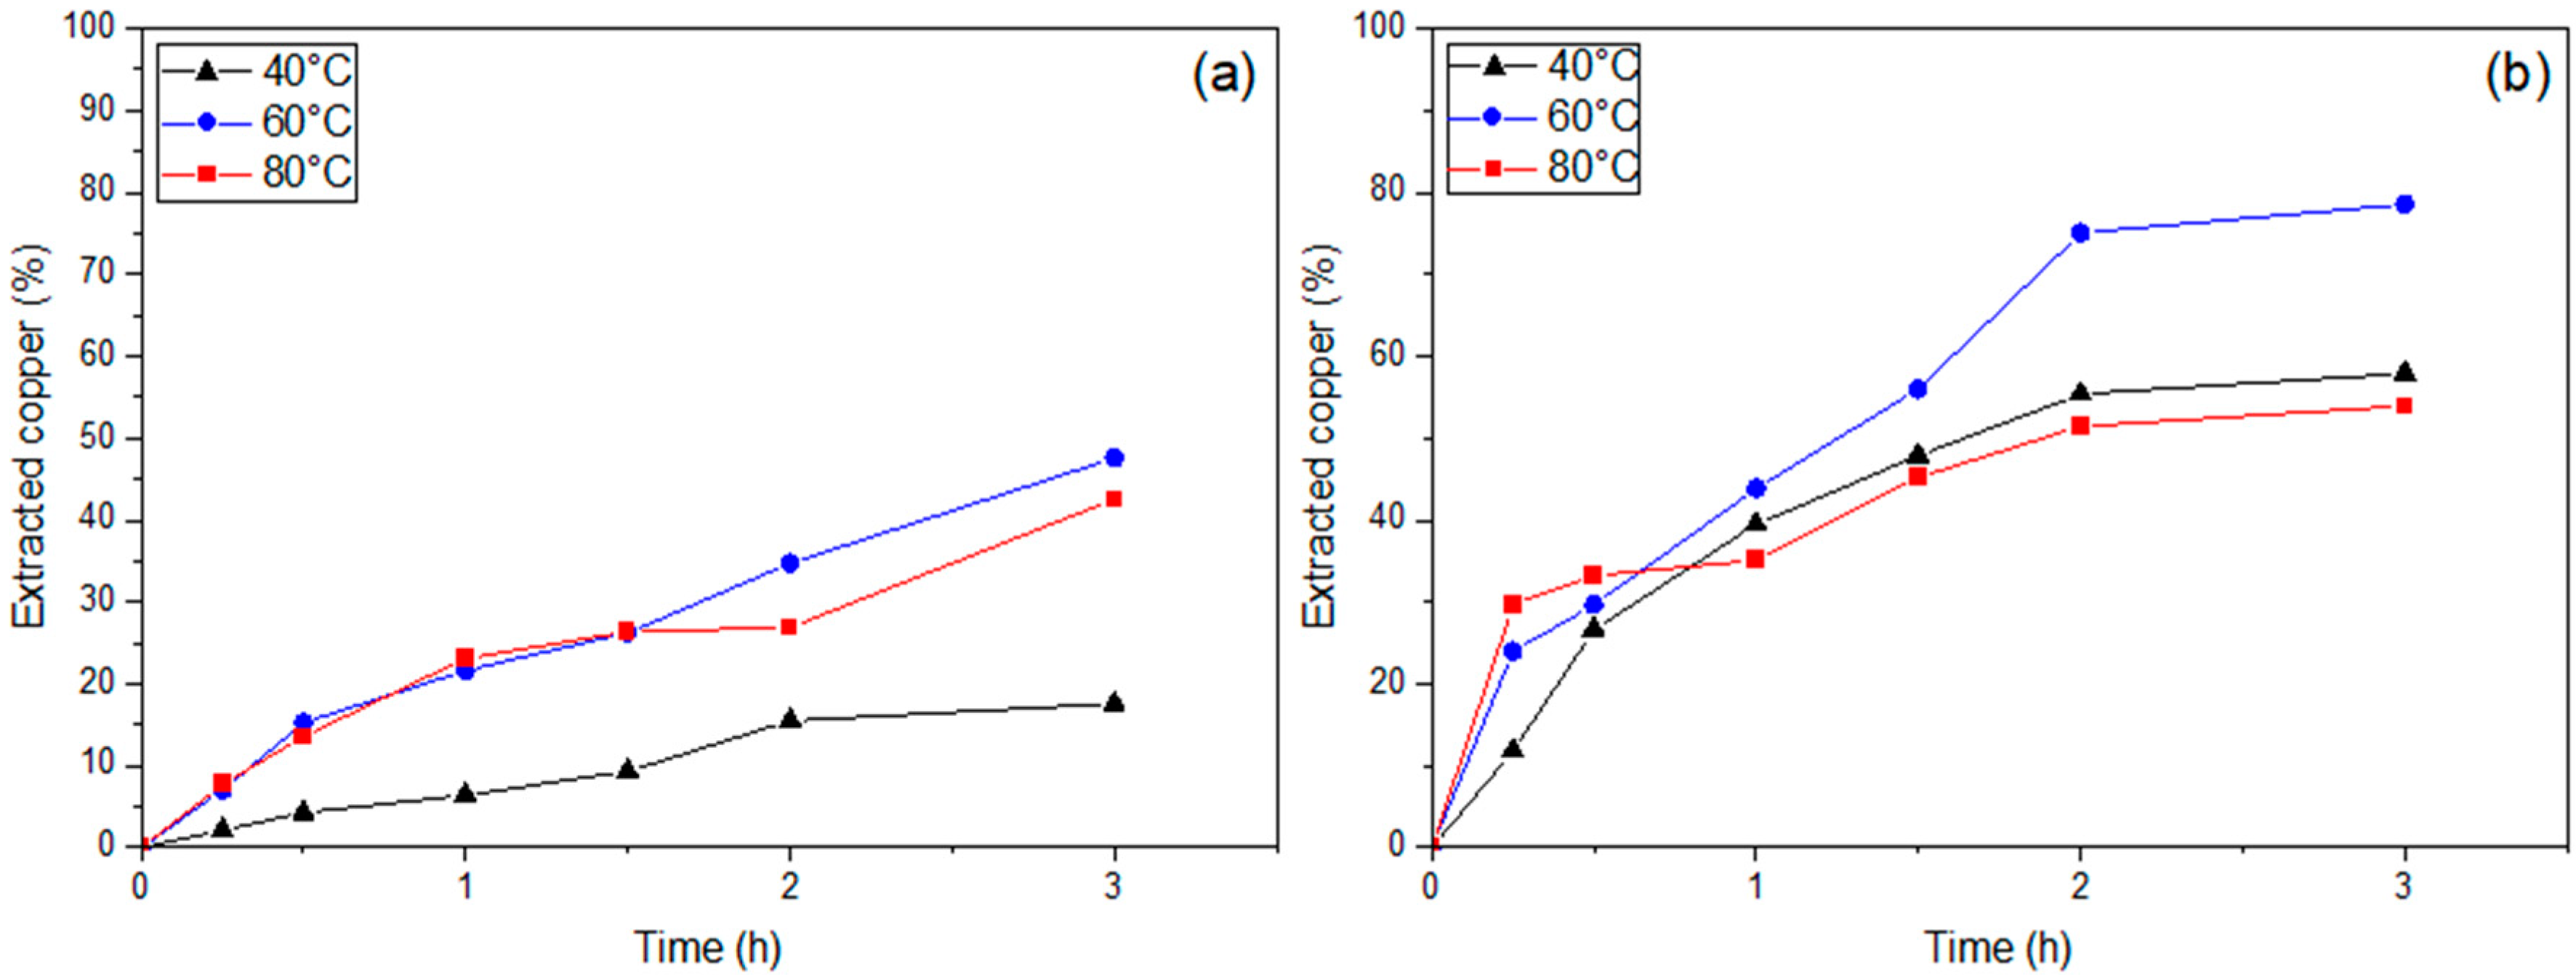
For copper extraction from WPCBs using 0.6 mol/L H2O2 and EDTA, with only the reaction temperature varying—at 40 °C, 60 °C, and 80 °C—the results obtained are shown in Table 4 and graphically in Figure 3. During the 3-h experiment, six 2.00 mL aliquots were collected at intervals of 15 min, 30 min, 1 h, 1 h and 30 min, 2 h, and 3 h, represented by t 1 , t 2 , t 3 , t 4 , t 5 , and t 6 , respectively, and subjected to analysis by UV-Vis spectrophotometry.
The results obtained with increasing temperature indicated that copper extraction from PCBs significantly increased with the rise in temperature in both samples analyzed. In the PA20 samples, copper extraction percentages reached 47.6% at a temperature of 60 °C, representing a 30% increase compared to the results at 40 °C. However, when the temperature increased from 60 °C to 80 °C, a reduction in Cu extraction rates was observed, suggesting that at higher temperatures, the degradation rate of H2O2 in the presence of metallic materials accelerates, leading to the formation of hydrogen gas (H2) in the presence of Fe, which is adsorbed onto the copper surface [34]. Additionally, with the degradation of H2O2, the amount of available oxidant becomes insufficient to sustain high leaching rates [28].
For smaller particle sizes (PA80), a significant increase (20.7%) in extraction percentages was observed when the temperature rose from 40 °C to 60 °C, increasing from 57.9% to 78.6%, representing the highest copper extraction rate obtained for H2O2/EDTA solutions in this study. The accelerated degradation of H2O2 at 80 °C reduced the amount of metal removed from the residues, as shown in Figure 1. This indicates that within the first 30 min of the experiment, the amount of EDTA-Cu2+ complex formed was greater at 80 °C than at 40 °C and 60 °C in the PA80 samples. These results align with studies conducted by Jadhao et al. (2016) [25], where a copper extraction rate of approximately 84% was achieved using EDTA at a concentration of 0.5 mol/L, a solid/liquid ratio of 15:1, stirring speed of 700 rpm, reaction temperature of 100 °C, reaction time of 3 h, and pH 7. It is worth noting that the authors’ results were obtained after metal extraction with H2SO4 and H2O2, with EDTA added after the oxidation and formation of Cu2+ to facilitate complex formation. In contrast, in the present study, the formation of the EDTA-Cu2+ complex and the metal oxidation by H2O2 occurred in parallel.
By evaluating the percentage of copper extraction in the WPCB particles, it is possible to estimate a mass balance of the process, considering the amount of residue and the amount of copper present from the results obtained by ICP-OES and TGA, in this case. As the percentage of the extracted metal varies with the temperature and the size of the waste particles, it is possible to estimate, by means of a weighted average, the amount of Cu extracted ( E C ) in each evaluated condition, as shown in Table 5.
To determine the total amount of copper in the process, an accountability factor is defined ( A F ), Equation (15), where the mass of copper extracted at 60 °C, the mass of copper remaining in the WPCBs ( C R ) and the mass of copper present in the aliquots collected over time for the study of extraction kinetics ( K C ), according to Equation (16).
AF = Total   mass   of   copper Initial   mass   of   copper × 100 %
Total   mass   of   copper = E C + C R + K C
Although the results indicate that the extraction process needs improvement, a study developed by Deng et al. [23] showed that EDTA demonstrated selectivity to the extraction of Cu2+ by the formation of soluble EDTA(Cu)2− complexes when compared to ferrous ions such as Fe2+ and Fe3+, resulting in a lower percentage of iron extraction (17%–35%). The authors highlighted that, under optimized conditions, the percentual of Cu extraction in 5 h was 85%. After EDTA precipitation, the authors reported that efficiency above 80% was possible after three cycles, which demonstrates the premise of reagent reuse of the reagent.

3.5. Kinetics of Copper Extraction from WPCBs with H2O2/EDTA

The kinetics study was conducted at 40 °C, 60 °C, and 80 °C, with different models applied to fit the experimentally obtained data. Table 6 presents the results of the shrinking core model to evaluate the controlling mechanisms of the copper extraction/complexation reaction from WPCBs, as described in Equations (7)–(9). The values of the kinetic constant k were obtained by interpolating the experimentally collected data over time, as shown in Table 6.
The shrinking core model was not effective in representing the reaction behavior with increasing temperature. Using the initial equations did not produce a linear relationship, resulting in low regression coefficients (R² < 0.95) across all temperatures and particle sizes analyzed. In contrast, in the study by Trinh, Kim, and Lee (2020) [45], copper leaching with H2SO4/H2O2 in PCBs followed the shrinking core model with diffusion control through the oxide layer formed during the process, achieving a fit with R² greater than 0.97. The authors identified this model as the most suitable for interpreting the copper leaching mechanism from PCB sludge, where the extraction rate was influenced by variations in temperature and activation energy. This behavior differs from that observed in copper extraction with H2O2/EDTA in the current study, where redox processes may have directly influenced the extraction rate of this metal.
Some homogeneous kinetic models were also tested to evaluate the behavior of copper leaching, given that the shrinking core model did not fit the data. This approach was like that used by Hao et al. (2022) [35] in copper leaching reactions in PCBs using H2O2/H2SO4. Accordingly, Table 7 presents the equations of homogeneous kinetic models applied to the copper extraction process using H2O2/EDTA at different temperatures, and the results from applying these kinetic models are shown in Table 8.
The Avrami kinetics model was also tested to determine the best linear fit for the experimental data. To do this, Equation (10) was adjusted to represent the data in the form of a linear regression, according to Equation (18), for determining the kinetic coefficients k A and m . The results obtained from applying the Avrami model are shown in Table 9 and are graphically represented in Figure 4.
y ( x ) = a + b x
ln ln 1 X   = ln k A + m l n t
The control mechanism coefficient m remained above 0.5, indicating that the dominant step is the chemical reaction, except for the PA80 sample at 80 °C and PA20 sample at 60 °C, which aligned better with the shrinking core model, controlled by diffusion model and chemical reaction, respectively. This suggests the presence of adsorbed H2 on the Cu particle surfaces with smaller sizes caused by the decomposition of hydrogen peroxide. The Avrami model was also considered the most appropriate for describing the kinetics of copper leaching from PCBs under most temperature and particle size conditions in the H2O2/H2SO4 system in the study by Hao et al. (2022) [35], which concluded that temperature, reagent concentration, solid–liquid ratio, particle size, and stirring speed are factors that influence the leaching rate and the efficiency of the copper extraction process. As discussed by Faraji et al. (2022) [38], when the application of conventional models is unable to describe the reaction kinetics, the application of empirical equations or Avrami’s model can aid in the determination of the leaching mechanism.
Based on the results obtained for the Avrami model, the mean value of the coefficient m was 0.81347 for PA20 and 0.62143 for PA80. The activation energy ( E a ) for each sample subjected to the leaching process with heating was determined using the linearized Arrhenius law, as shown in Equation (19). This determination was performed by interpolating the data obtained through Avrami kinetics, and the results are presented in Figure 5.
ln k A = E a R 1 T + ln A
The activation energy results for samples PA20 and PA80 were close, 43.5106 kJ/mol and 44.1587 kJ/mol, respectively. In previous studies, such as that by Jadhao et al. (2016) [25], which used EDTA for copper recovery, the activation energy for copper extraction using H2O2/H2SO4 followed by recovery with EDTA was 22.2 kJ/mol. The difference in activation energy values found in the present study indicates that the copper leaching process using H2O2/EDTA requires higher energy to break the metallic bonds in copper and form the EDTA-Cu2+ complex. The decrease in extraction efficiency at 80 °C can be attributed to the accelerated degradation of H2O2, resulting in the formation of gaseous H2, which hinders the oxidation reaction of copper, mainly due to the bubbles on the metal surface. This phenomenon is consistent with what was reported by Torres and Lapidus (2016) [29] from the use of H2O2 in Cu leaching processes.

4. Conclusions

The results of this research indicate that hydrometallurgical techniques, particularly those employing H2O2/EDTA solutions, present a promising approach for metal recovery from WPCBs. The metal characterization of this waste, supported by data from literature and confirmed through ICP-OES analysis, revealed a significant predominance of copper, underscoring the importance of developing techniques for metal extraction.
The copper leaching tests conducted with alkaline solutions demonstrated that using a H2O2/EDTA solution at a temperature of 60 °C allowed for the extraction of 78.6% of the copper present in WPCBs with particle sizes below 0.177 mm after 3 h. Using the Avrami model indicated that the mechanisms of copper leaching with alkaline H2O2/EDTA solutions are controlled by chemical reactions, and the activation energy obtained through the Arrhenius equation was 44.1587 kJ/mol. This value is higher than those reported in the literature for copper leaching reactions with H2O2/H2SO4, indicating that the reaction with EDTA requires a greater amount of energy to proceed.
The findings of this study reinforce the potential of an alternative method to the use of H2SO4 in metal recovery, especially due to the recyclability of EDTA, which can be reused in subsequent cycles, significantly reducing operational costs and environmental impact. Metal recovery using EDTA as an agent emerges as a viable and selective alternative for hydrometallurgical processes, primarily due to EDTA’s reusability, which decreases the demand for chemical inputs.

Author Contributions

Conceptualization, A.O.G. and T.B.; methodology, A.O.G.; investigation, A.O.G.; resources, T.B and T.C.V.; data curation, writing—original draft preparation, A.O.G.; writing—review and editing, A.O.G., T.B., T.C.V. and H.M.V.; visualization, H.M.V.; supervision, H.M.V. and T.B; project administration, T.B.; funding acquisition, T.B. All authors have read and agreed to the published version of the manuscript.

Funding

This research was funded by National Council for Scientific and Technological Development (CNPq), grant number 421814/2021-7 and 403815/2023-1, PROPP UESC grant number SEI 073.11155.2022.0013030-16, Brazilian Federal Agency for Support and Evaluation of Graduate Education (CAPES), project number 88887.708305/2022-00 – UESC/PROCIMM, Research Development Foundation (FUNDEP), under the Catalisa ICT initiative – 143 – with support from the CNPq and the Brazilian Micro and Small Business Support Service (SEBRAE).

Data Availability Statement

Data are contained within the article.

Acknowledgments

The authors agree to laboratories LAMMA-UESC, GERLAB-UESC and LACOR-UFRGS.

Conflicts of Interest

The authors declare no conflicts of interest.

References

  1. Shittu, O.S.; Williams, I.D.; Shaw, P.J. Global E-Waste Management: Can WEEE Make a Difference? A Review of e-Waste Trends, Legislation, Contemporary Issues and Future Challenges. Waste Manag. 2021, 120, 549–563. [Google Scholar] [CrossRef] [PubMed]
  2. Wu, C.; Awasthi, A.K.; Qin, W.; Liu, W.; Yang, C. Recycling Value Materials from Waste PCBs Focus on Electronic Components: Technologies, Obstruction and Prospects. J. Environ. Chem. Eng. 2022, 10, 108516. [Google Scholar] [CrossRef]
  3. Forti, V.; Baldé, C.P.; Kuehr, R. E-Waste Statistics: Guidelines on Classifications, Reporting and Indicators, 2nd ed.; United Nations University, ViE–SCYCLE: Bonn, Germany, 2018. [Google Scholar]
  4. Baldé, C.P.; Kuehr, R.; Yamamoto, T.; McDonald, R.; Althaf, S.; Bel, G.; Deubzer, O.; Fernandez-Cubillo, E.; Forti, V.; Gray, V.; et al. The Global E-Waste Monitor 2024; Genebra: Geneva, Switzerland, 2024. [Google Scholar]
  5. Charitopoulou, M.A.; Stefanidis, S.D.; Lappas, A.A.; Achilias, D.S. Catalytic Pyrolysis of Polymers with Brominated Flame-Retardants Originating in Waste Electric and Electronic Equipment (WEEE) Using Various Catalysts. Sustain. Chem. Pharm. 2022, 26, 100612. [Google Scholar] [CrossRef]
  6. Arias, N.R.; Arias, S.F.R.; Rivera, L.A.M.; Oliveros, M.E.M. Recovery of Copper through Concentration Processes from Ashes Produced by WEEE Pyrolysis. J. Appl. Res. Technol. 2021, 19, 163–171. [Google Scholar] [CrossRef]
  7. Blumbergs, E.; Serga, V.; Shishkin, A.; Goljandin, D.; Shishko, A.; Zemcenkovs, V.; Markus, K.; Baronins, J.; Pankratov, V. Selective Disintegration–Milling to Obtain Metal-Rich Particle Fractions from E-Waste. Metals 2022, 12, 1468. [Google Scholar] [CrossRef]
  8. Li, H.; Eksteen, J.; Oraby, E. Hydrometallurgical Recovery of Metals from Waste Printed Circuit Boards (WPCBs): Current Status and Perspectives–A Review. Resour. Conserv. Recycl. 2018, 139, 122–139. [Google Scholar] [CrossRef]
  9. Annamalai, M.; Gurumurthy, K. Characterization of End-of-Life Mobile Phone Printed Circuit Boards for Its Elemental Composition and Beneficiation Analysis. J. Air Waste Manag. Assoc. 2021, 71, 315–327. [Google Scholar] [CrossRef]
  10. Dhanasekar, S.; Stella, T.J.; Thenmozhi, A.; Bharathi, N.D.; Thiyagarajan, K.; Singh, P.; Reddy, Y.S.; Srinivas, G.; Jayakumar, M. Study of Polymer Matrix Composites for Electronics Applications. J. Nanomater. 2022, 2022, 8605099. [Google Scholar] [CrossRef]
  11. Hao, J.; Wang, Y.; Wu, Y.; Guo, F. Metal Recovery from Waste Printed Circuit Boards: A Review for Current Status and Perspectives. Resour. Conserv. Recycl. 2020, 157, 104787. [Google Scholar] [CrossRef]
  12. Faraji, F.; Golmohammadzadeh, R.; Pickles, C.A. Potential and Current Practices of Recycling Waste Printed Circuit Boards: A Review of the Recent Progress in Pyrometallurgy. J. Environ. Manag. 2022, 316, 115242. [Google Scholar] [CrossRef]
  13. Nekouei, R.K.; Pahlevani, F.; Rajarao, R.; Golmohammadzadeh, R.; Sahajwalla, V. Two-Step Pre-Processing Enrichment of Waste Printed Circuit Boards: Mechanical Milling and Physical Separation. J. Clean. Prod. 2018, 184, 1113–1124. [Google Scholar] [CrossRef]
  14. Eswaraiah, C.; Soni, R.K. Milling and Classification of Printed Circuit Boards for Material Recycling. Part. Sci. Technol. 2015, 33, 659–665. [Google Scholar] [CrossRef]
  15. Hubau, A.; Chagnes, A.; Minier, M.; Touzé, S.; Chapron, S.; Guezennec, A.G. Recycling-Oriented Methodology to Sample and Characterize the Metal Composition of Waste Printed Circuit Boards. Waste Manag. 2019, 91, 62–71. [Google Scholar] [CrossRef] [PubMed]
  16. Touzé, S.; Laperche, V.; Hubau, A.; Moreau, P. PXRF on Printed Circuit Boards: Methodology, Applications, and Challenges. Waste Manag. 2022, 146, 66–76. [Google Scholar] [CrossRef]
  17. Kumar, A.; Holuszko, M.E.; Janke, T. Determination of loss on ignition test conditions for nonmetal fraction from processed waste printed circuit boards. Resour. Conserv. Recycl. 2020, 163, 105105. [Google Scholar] [CrossRef]
  18. Wongsawa, T.; Traiwongsa, N.; Pancharoen, U.; Nootong, K. A Review of the Recovery of Precious Metals Using Ionic Liquid Extractants in Hydrometallurgical Processes. Hydrometallurgy 2020, 198, 105488. [Google Scholar] [CrossRef]
  19. Li, X.; Gao, Q.; Jiang, S.; Nie, C.; Zhu, X.; Jiao, T. Review on the Gentle Hydrometallurgical Treatment of WPCBs: Sustainable and Selective Gradient Process for Multiple Valuable Metals Recovery. J. Environ. Manag. 2023, 348, 119288. [Google Scholar] [CrossRef]
  20. Binnemans, K.; Jones, P.T. The Twelve Principles of Circular Hydrometallurgy. J. Sust. Metall. 2023, 9, 1–25. [Google Scholar] [CrossRef]
  21. Nithya, R.; Sivasankari, C.; Thirunavukkarasu, A. Electronic Waste Generation, Regulation and Metal Recovery: A Review. Environ. Chem. Lett. 2021, 19, 1347–1368. [Google Scholar] [CrossRef]
  22. Sirola, K. Chelating Adsorbents in Purification of Hydrometallurgical Solutions; Lappeenrannan Teknillinen Yliopisto: Lappeenranta, Finland, 2009; ISBN 978-952-214-843-8. [Google Scholar]
  23. Chauhan, G.; Jadhao, P.R.; Pant, K.K.; Nigam, K.D.P. Novel Technologies and Conventional Processes for Recovery of Metals from Waste Electrical and Electronic Equipment: Challenges & Opportunities–A Review. J. Environ. Chem. Eng. 2018, 6, 1288–1304. [Google Scholar] [CrossRef]
  24. Deng, D.; Deng, C.; Liu, T.; Xue, D.; Gong, J.; Tan, R.; Mi, X.; Gong, B.; Wang, Z.; Liu, C.; et al. Selective Recovery of Copper from Electroplating Sludge by Integrated EDTA Mixed with Citric Acid Leaching and Electrodeposition. Sep. Purif. Technol. 2022, 301, 121917. [Google Scholar] [CrossRef]
  25. Jadhao, P.; Chauhan, G.; Pant, K.K.; Nigam, K.D.P. Greener Approach for the Extraction of Copper Metal from Electronic Waste. Waste Manag. 2016, 57, 102–112. [Google Scholar] [CrossRef] [PubMed]
  26. Yousefzadeh, S.; Yaghmaeian, K.; Mahvi, A.H.; Nasseri, S.; Alavi, N.; Nabizadeh, R. Comparative Analysis of Hydrometallurgical Methods for the Recovery of Cu from Circuit Boards: Optimization Using Response Surface and Selection of the Best Technique by Two-Step Fuzzy AHP-TOPSIS Method. J. Clean. Prod. 2020, 249, 119401. [Google Scholar] [CrossRef]
  27. Monzyk, B.; Martyak, N.M.; Berger, P. Complexation Equilibria for the Copper—EDTA—Cyanide System. Trans. IMF 1995, 73, 50–53. [Google Scholar] [CrossRef]
  28. Choi, W.K.; Oh, W.Z.; Woo, S.I. Dissolution Behaviors of Copper Metal in Alkaline H2O2-EDTA Solutions. J. Nucl. Sci. Technol. 1993, 30, 549–553. [Google Scholar] [CrossRef]
  29. Torres, R.; Lapidus, G.T. Copper Leaching from Electronic Waste for the Improvement of Gold Recycling. Waste Manag. 2016, 57, 131–139. [Google Scholar] [CrossRef]
  30. Ross, J.R.H. The Kinetics and Mechanisms of Catalytic Reactions. In Heterogeneous Catalysis; Elsevier: Amsterdam, The Netherlands, 2012; pp. 123–142. [Google Scholar] [CrossRef]
  31. Dwadasi, B.S.; Goverapet Srinivasan, S.; Rai, B. Interfacial Structure in the Liquid–Liquid Extraction of Rare Earth Elements by Phosphoric Acid Ligands: A Molecular Dynamics Study. Phys. Chem. Chem. Phys. 2020, 22, 4177–4192. [Google Scholar] [CrossRef]
  32. Havlík, T. Kinetics of Heterogeneous Reactions of Leaching Processes. In Hydrometallurgy; Havlík, T., Ed.; Woodhead Publishing: Cambridge, UK, 2008; pp. 184–241. [Google Scholar] [CrossRef]
  33. Liao, Y.; Huang, F.; Zhou, J.; Li, B. Kinetics and Behavior of Cobalt Extraction from Low Nickel Matte Converter Slag by Pressure Oxidative Leaching with Sulfuric Acid. CIESC J. 2015, 66, 3971–3978. [Google Scholar] [CrossRef]
  34. Muzayanha, S.U.; Yudha, C.S.; Hasanah, L.M.; Gupita, L.T.; Widiyandari, H.; Purwanto, A. Comparative Study of Various Kinetic Models on Leaching of Nca Cathode Material. Indo J. Chem. 2020, 20, 1291–1300. [Google Scholar] [CrossRef]
  35. Hao, J.; Wang, X.; Wang, Y.; Wu, Y.; Guo, F. Optimizing the Leaching Parameters and Studying the Kinetics of Copper Recovery from Waste Printed Circuit Boards. ACS Omega 2022, 7, 3689–3699. [Google Scholar] [CrossRef]
  36. Li, Q.; Liu, Z.; Liu, Q. Kinetics of Vanadium Leaching from a Spent Industrial V2O5/TiO2 Catalyst by Sulfuric Acid. Ind. Eng. Chem. Res. 2014, 53, 2956–2962. [Google Scholar] [CrossRef]
  37. Smith, A.J.; Garciano, L.O.; Tran, T.; Wainwrigh, M.S. Structure and Kinetics of Leaching for the Formation of Skeletal (Raney) Cobalt Catalysts. Ind. Eng. Chem. Res. 2008, 47, 1409–1415. [Google Scholar] [CrossRef]
  38. Faraji, F.; Alizadeh, A.; Rashchi, F.; Mostoufi, N. Kinetics of Leaching: A Review. Rev. Chem. Eng. 2022, 38, 113–148. [Google Scholar] [CrossRef]
  39. Korf, N.; Løvik, A.N.; Figi, R.; Schreiner, C.; Kuntz, C.; Mählitz, P.M.; Rösslein, M.; Wäger, P.; Rotter, V.S. Multi-Element Chemical Analysis of Printed Circuit Boards: Challenges and Pitfalls. Waste Manag. 2019, 92, 124–136. [Google Scholar] [CrossRef]
  40. Canassa, T. Utilização Da Lei de Lambert-Beer Para Determinação Da Concentração de Soluções. J. Exp. Tech. Instrum. 2018, 1, 23–30. [Google Scholar] [CrossRef]
  41. Rahardjo, S.B.; Saraswati, T.E.; Masykur, A.; Finantrena, N.N.F.; Syaima, H. Synthesis and Characterization of Tetrakis (2-Amino-3-Methylpyridine) Copper (II) Sulfate Tetrahydrate. IOP Conf. Ser. Mater. Sci. Eng. 2018, 349, 012056. [Google Scholar] [CrossRef]
  42. Zhang, X.; Zhang, H.; Chang, F.; Ashraf, U.; Peng, W.; Wu, H.; Liu, Q.; Liu, F.; Zhang, Y.; Duan, L. Application of Corrected Methods for High-Resolution XRF Core Scanning Elements in Lake Sediments. Appl. Sci. 2020, 10, 8012. [Google Scholar] [CrossRef]
  43. Suponik, T.; Franke, D.M.; Nuckowski, P.M.; Matusiak, P.; Kowol, D.; Tora, B. Impact of Grinding of Printed Circuit Boards on the Efficiency of Metal Recovery by Means of Electrostatic Separation. Minerals 2021, 11, 281. [Google Scholar] [CrossRef]
  44. Yamane, L.H.; de Moraes, V.T.; Espinosa, D.C.R.; Tenório, J.A.S. Recycling of WEEE: Characterization of Spent Printed Circuit Boards from Mobile Phones and Computers. Waste Manag. 2011, 31, 2553–2558. [Google Scholar] [CrossRef]
  45. Trinh, H.B.; Kim, S.; Lee, J. Selective Copper Recovery by Acid Leaching from Printed Circuit Board Waste Sludge. Metals 2020, 10, 293. [Google Scholar] [CrossRef]
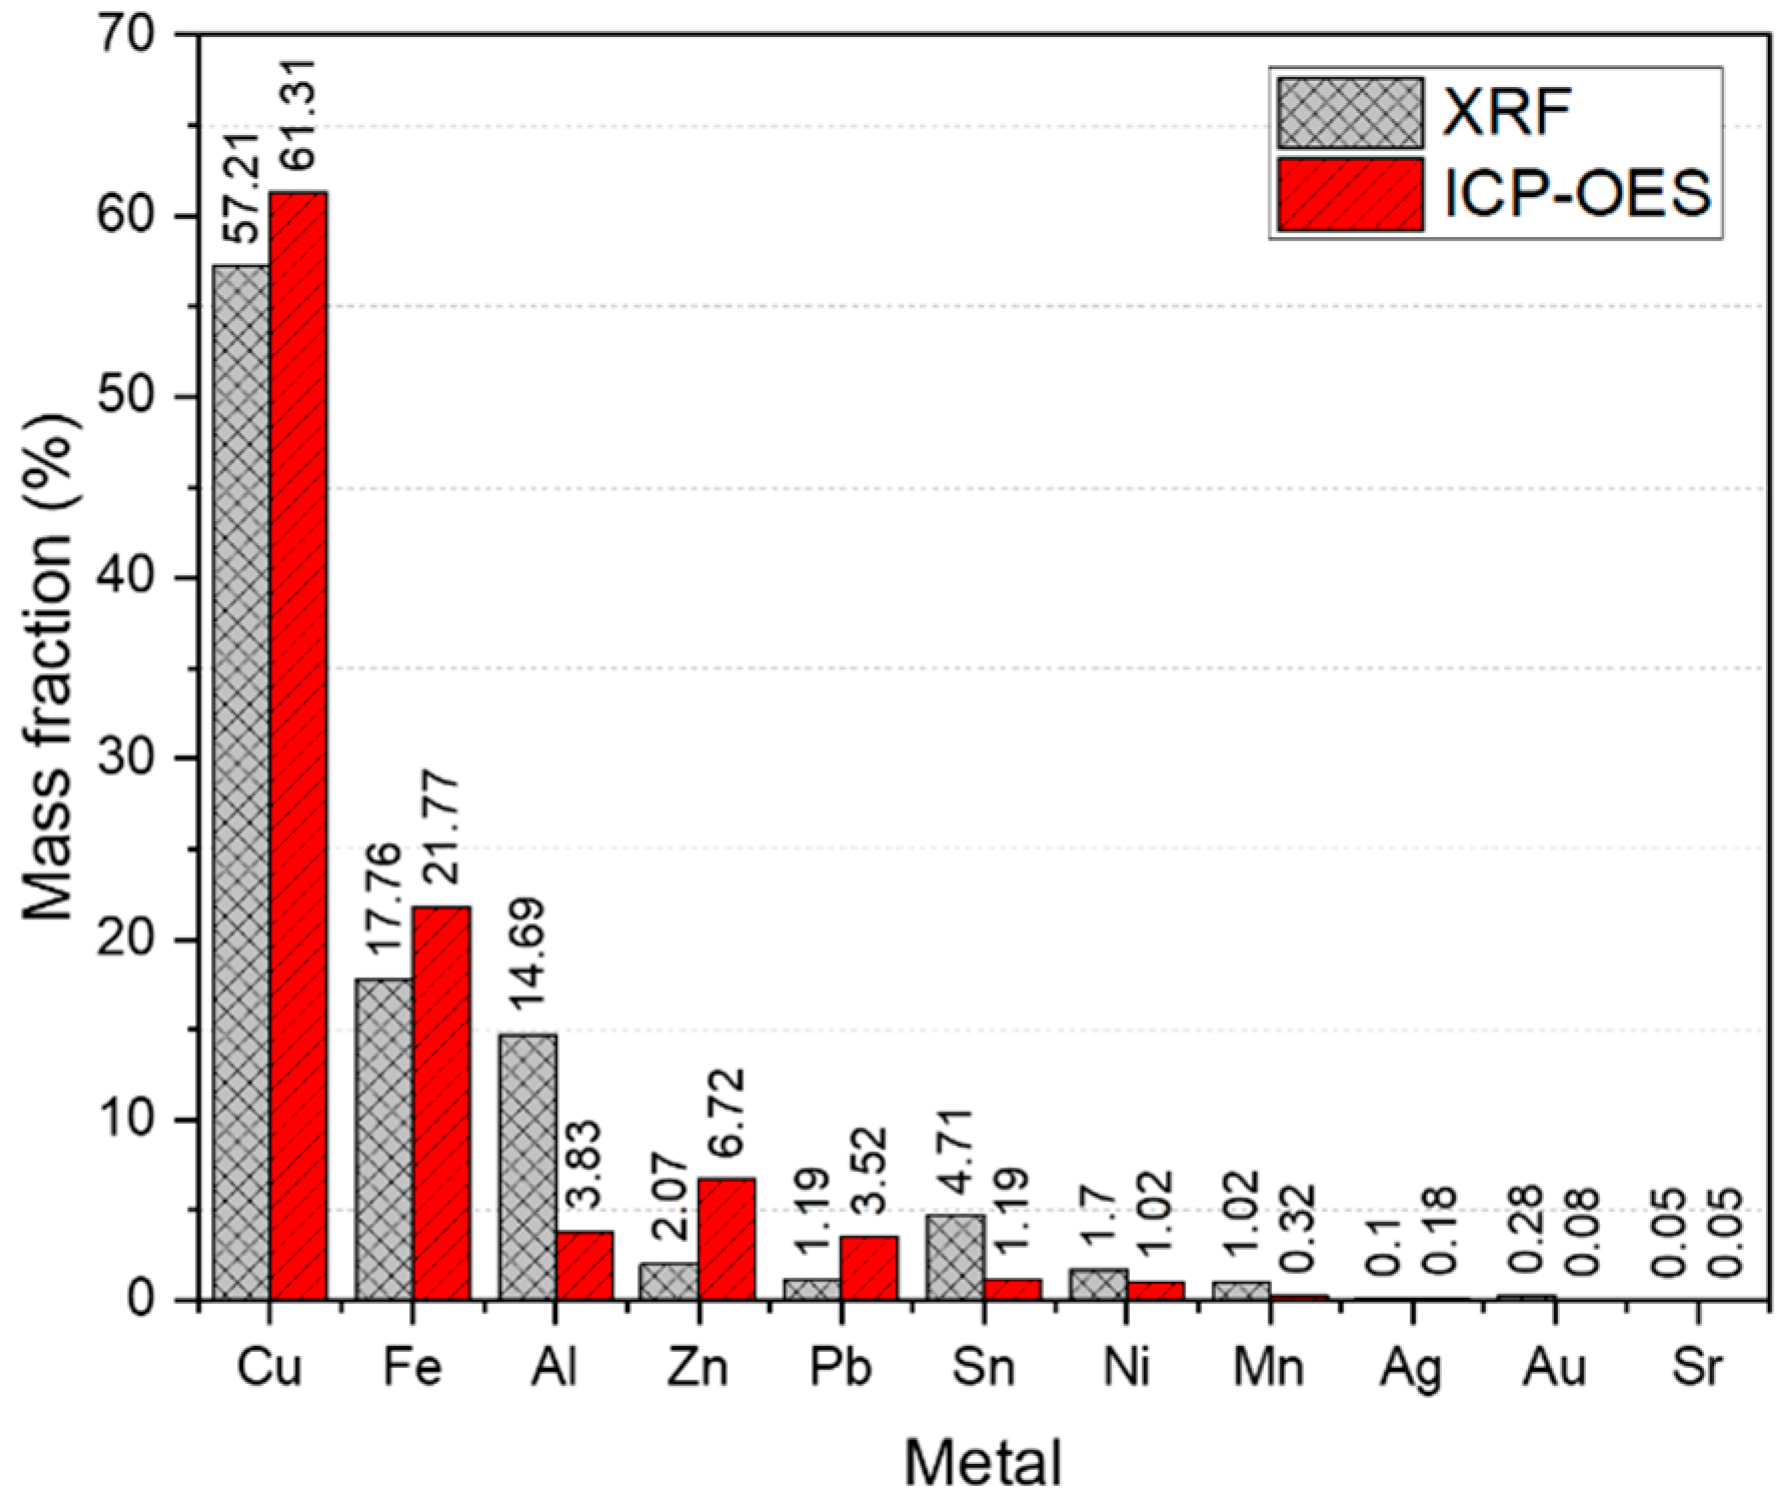
Figure 1. The mass ratio of elements found in WPCBs.
Minerals 15 00409 g001
Figure 2. Results of the (a) TGA analysis and (b) derived from the thermogravimetric curve (DTG) of samples of WPCBs in different sizes.
Minerals 15 00409 g002
Figure 3. Copper extraction percentages from WPCBs using H2O2 and EDTA at different temperatures for residues (a) PA20 and (b) PA80.
Minerals 15 00409 g003
Figure 4. Avrami kinetics tested for copper leaching using H2O2/EDTA in samples (a) PA20 and (b) PA80.
Minerals 15 00409 g004
Figure 5. Determination of activation energy ( E a ) for samples PA20 and PA80 by copper extraction with H2O2/EDTA at different temperatures.
Minerals 15 00409 g005
Table 1. XRF analysis results of the metal fraction in PCBs.
MetalPA20PA80
Mean (%)RSD (%)Mean (%)RSD (%)
Bal45.391.1641.991.28
Cu26.851.0213.211.22
Al6.272.775.332.98
Fe2.361.1518.330.86
Sn1.941.662.211.62
Zn0.791.680.342.93
Ni0.572.080.303.84
Pb0.512.310.582.20
Bi0.372.470.272.81
Ti0.296.810.257.87
Au0.134.970.096.15
Ag0.073.070.043.67
Mn0.0417.530.187.31
Sr0.033.540.033.36
Table 2. ICP-OES analysis results from aqua regia digestion for WPCBs with different particle sizes.
MetalPA20PA80
Mean
(%)
RSD
(%)
Mean
(%)
RSD
(%)
Cu36.630.247.092.26
Zn5.280.340.290.49
Fe4.520.2319.730.3
Pb1.774.570.775.79
Al0.931.032.170.82
Sn0.4614.940.4511.92
Ni0.660.530.173.42
Mn0.150.950.110.86
Ag0.093.940.050.74
Au0.035.640.0316.64
Sr0.010.360.040.14
ME50.530.5730.901.13
Table 3. Fraction of the different materials in the samples of WPCBs.
SampleMaterials
MetalsPolymerCeramic
Mean
(%)
SD
(%)
Mean
(%)
SD
(%)
Mean
(%)
SD
(%)
PA2050.50.328.93.120.53.1
PA8030.90.424.13.444.93.4
Table 4. Results of copper extraction using H2O2/EDTA at 40 °C, 60 °C and 80 °C.
TimePA20PA80
Extraction Cu (%)RSD
(%)
Extraction Cu (%)RSD
(%)
40 °C
T12.10.611.80.5
T24.31.826.60.7
T36.42.139.51.7
T49.30.647.92.1
T515.52.455.42.7
T617.62.257.92.5
60 °C
T17.00.624.06.3
T215.32.229.71.7
T321.62.043.80.5
T426.20.156.010.8
T534.70.875.00.7
T647.60.978.61.4
80 °C
T17.80.629.71.0
T213.61.233.20.9
T323.11.535.10.8
T426.41.845.21.5
T526.92.151.40.8
T642.62.454.40.8
Table 5. Mass balance of the Cu extraction process in PCBs, using H2O2/EDTA.
StepPA20PA80
Initial feed (WPCBs)10.0 g10.0 g
Copper mass in WPCBs3.66 g0.71 g
Mass of copper extracted at 60 °C1.74 g0.56 g
Mass of Copper remaining in WPCBs1.86 g0.13 g
Copper present in the rates of solution collected over time 0.06 g0.02 g
Accountability factor100%100%
Table 6. Application of the shrinking core model in copper leaching using H2O2/EDTA.
Temperature
(°C)
Chemical ReactionDiffusionMixed
k r R 2 k d R 2 k m R 2
PA20
400.000350.951720.000020.924620.000720.95184
600.000980.989760.000190.946080.002080.98958
800.000780.949520.000140.906920.001650.94570
PA80
400.001240.874390.0003220.937740.00270.88417
600.002090.941570.0007490.931400.00490.94272
800.000710.928590.0002170.936770.00170.93035
Table 7. Alternative leaching equations using pseudo-homogeneous kinetic models.
Reaction Equation ,   k t
Zeroth order X
First order l n ( 1 X )
Second order 1 ( 1 X )
Three-halves-order kinetics (reaction control) 1 X 1 / 2 1
One-half-order kinetics (reaction control) 1 1 X 1 / 2
Two-thirds-order kinetics (reaction control) 1 1 X 1 / 3
One-thirds-order kinetics (diffusion control) 1 1 X 2 / 3
Table 8. Kinetic constants and coefficients of variation obtained by applying pseudo-homogeneous models.
ModelTemperature
40 °C60 °C80 °C
k R 2 k R 2 k R 2
PA20
Zeroth order0.000350.951720.000980.989760.000780.94952
First order0.000020.924620.000190.946080.000140.90692
Second order0.000720.951840.002080.989580.001650.94570
Three-halves-order0.000580.952100.000790.984350.001530.94604
One-half-order0.000520.951590.000700.989420.001120.94907
Two-thirds-order0.000680.951440.000920.988590.001410.94824
One-thirds-order0.000350.951720.000480.989760.000780.94952
PA80
Zeroth order0.001240.874390.002090.941570.000710.92859
First order0.0003220.937740.0007490.931400.00490.94272
Second order0.000710.928590.0002170.936770.00170.93035
Three-halves-order0.002910.915080.003480.937830.001860.93585
One-half-order0.001710.864960.002710.939650.001050.92692
Two-thirds-order0.002100.855150.002280.936760.001280.92519
One-thirds-order0.001240.874390.001390.941570.000770.92859
Table 9. Values of the coefficients obtained by applying the Avrami kinetic model.
Temperature (°C) k A m R 2
PA20
400.00190.90120.9803
600.00860.82040.9812
800.01220.71890.9709
PA80
400.01860.77650.9537
600.03120.74900.9548
800.13000.33880.9067
Disclaimer/Publisher’s Note: The statements, opinions and data contained in all publications are solely those of the individual author(s) and contributor(s) and not of MDPI and/or the editor(s). MDPI and/or the editor(s) disclaim responsibility for any injury to people or property resulting from any ideas, methods, instructions or products referred to in the content.