1. Introduction
High-purity quartz is an important raw material for emerging industries, widely used in optical fiber, photovoltaic, chip, aerospace, and other fields. It is a key component of the new generation of information industries, and new energy and high-end manufacturing. As a result, it is considered one of the world’s scarce mineral resources [
1,
2,
3,
4,
5,
6]. During the growth of quartz crystals, various impurities are introduced into the quartz interior, such as surface adsorption, mineral inclusions, gas–liquid inclusions, quasi-isomorphisms, etc. Therefore, there is no quartz in nature with a pure SiO
2 composition [
7,
8]. Methods for the removal of quartz internal impurities mainly include physical and chemical methods; physical methods can remove almost all mineral impurities down to monomers, but cannot remove the gas–liquid inclusions and lattice internal homogeneous impurities; the chemical method mainly removes the quartz sand particles on the surface or embedded in the particles of inclusions in the impurities, and can also remove some of the lattice impurities, but the lattice impurities in Al, Ti, B, Li, and other elements do not show an obvious removal effect [
9,
10].
In the definition of high-purity quartz, the first requirement is high purity, i.e., very low impurity content, especially for lattice impurities. In downstream industrial applications, it is also the content of key fractional impurities such as Al, Ti, B, Li, etc., in quartz sand that is used as the main grading standard, such as the IOTA standard of the U.S. Sibelco Company, and the PQ standard of the China Pacific Quartz Company [
11]. Obtaining high-purity quartz sand requires a series of complex de-impurity processes, including pretreatment (sorting, crushing), physical treatment (grinding, magnetic separation, flotation, etc.), chemical treatment (acid washing, high-temperature chlorination roasting, etc.), and heat treatment (high-temperature calcination) [
12]. The cost of removing impurities from quartz is often high and the current evaluation of high-purity quartz deposits relies on judgment based on metallurgical purification tests, due to the lack of efficient and cost-effective evaluation methods.
Laser ablation inductively coupled plasma mass spectrometry (LA-ICP-MS) is a powerful tool for in situ micro-area trace element analysis, which has the advantages of high sensitivity, high spatial resolution, low detection limit, fast analysis speed, simultaneous determination of multiple elements and isotope ratios, etc. [
13,
14]. However, the hardness of quartz minerals leads to difficult exfoliation and easy spattering, high transparency, and difficulty focusing in the exfoliation process. In addition, the trace element content in raw high-purity quartz ore is extremely low; some elements are below the detection limit for NIST610, 612, and other standard samples of trace elements relative to high-purity quartz.
Previous studies have conducted compositional analyses of quartz from magmatic–hydrothermal lithogenesis, where trace element contents are generally elevated. For instance, T. Goette et al. characterized the relationship between cathodoluminescence (CL) spectra and trace element concentrations in hydrothermal α-quartz crystals from Gigerwald (Switzerland) and Rohdenhaus (West Germany), analyzed primarily via LA-ICP-MS [
15]. Other scholars, such as Flem and Müller, applied LA-ICP-MS for in situ trace element analysis of high-purity quartz [
16]. Similarly, Zhou Haoyang et al. mapped quartz compositions in pegmatites from the Tysfjord region of northern Norway, identifying the Drag area within the Tysfjord tectonic window as hosting pegmatitic quartz of the highest chemical quality [
17]. However, our research on high-purity quartz deposits reveals significant variations in trace element test results across different LA-ICP-MS analytical methods due to the lack of low-impurity standard samples. Additionally, comparative studies between LA-ICP-MS analytical outcomes and beneficiation/purification results remain notably absent.
In this paper, we propose to use two kinds of lasers, nanosecond and femtosecond, to analyze the content of four elements, namely Al, Ti, B, and Li, in quartz in situ by using dot ablation, line ablation, and surface scanning methods, because these four elements mainly exist as lattice substitutions, while elements such as K, Na, Ca, etc., are strongly affected by inclusions, and most of them can be removed during the purification process, which is not considered in this study. The optimal method and parameters for LA-ICP-MS analysis of quartz minerals are discussed in comparison with the final purification results, and a set of efficient and cost-effective methods for the evaluation of high-purity quartz deposits is established.
2. Sample Selection
The samples studied were taken from high-purity quartz deposits of grade 4N5 and above, with the main purpose of comparative study with the quality of high-purity quartz sands obtained from purification experiments. To better validate the methodology, we studied samples of rocks with different quartz contents, including granite pegmatite rim zones and core zones, which have significant differences in their quartz contents and mineral assemblages. The main characteristics of the samples examined are described separately below.
Yamansu (the Quartz Beach) is located in the eastern Tianshan region, southeast of Hami, Xinjiang, situated at the convergence zone between the Central Asian Orogenic Belt and the Tarim Plate. The study area has undergone prolonged, multi-stage, and diverse tectonic deformation involving different deformation mechanisms and structural levels since the Archean. The interweaving of faults with varying properties and formation periods has created and preserved extremely complex structural features. The region has experienced frequent magmatic activity, with widespread development of granitic intrusions from different periods and types, making it a crucial window for revealing the tectonic evolution of the Central Asian Orogenic Belt.
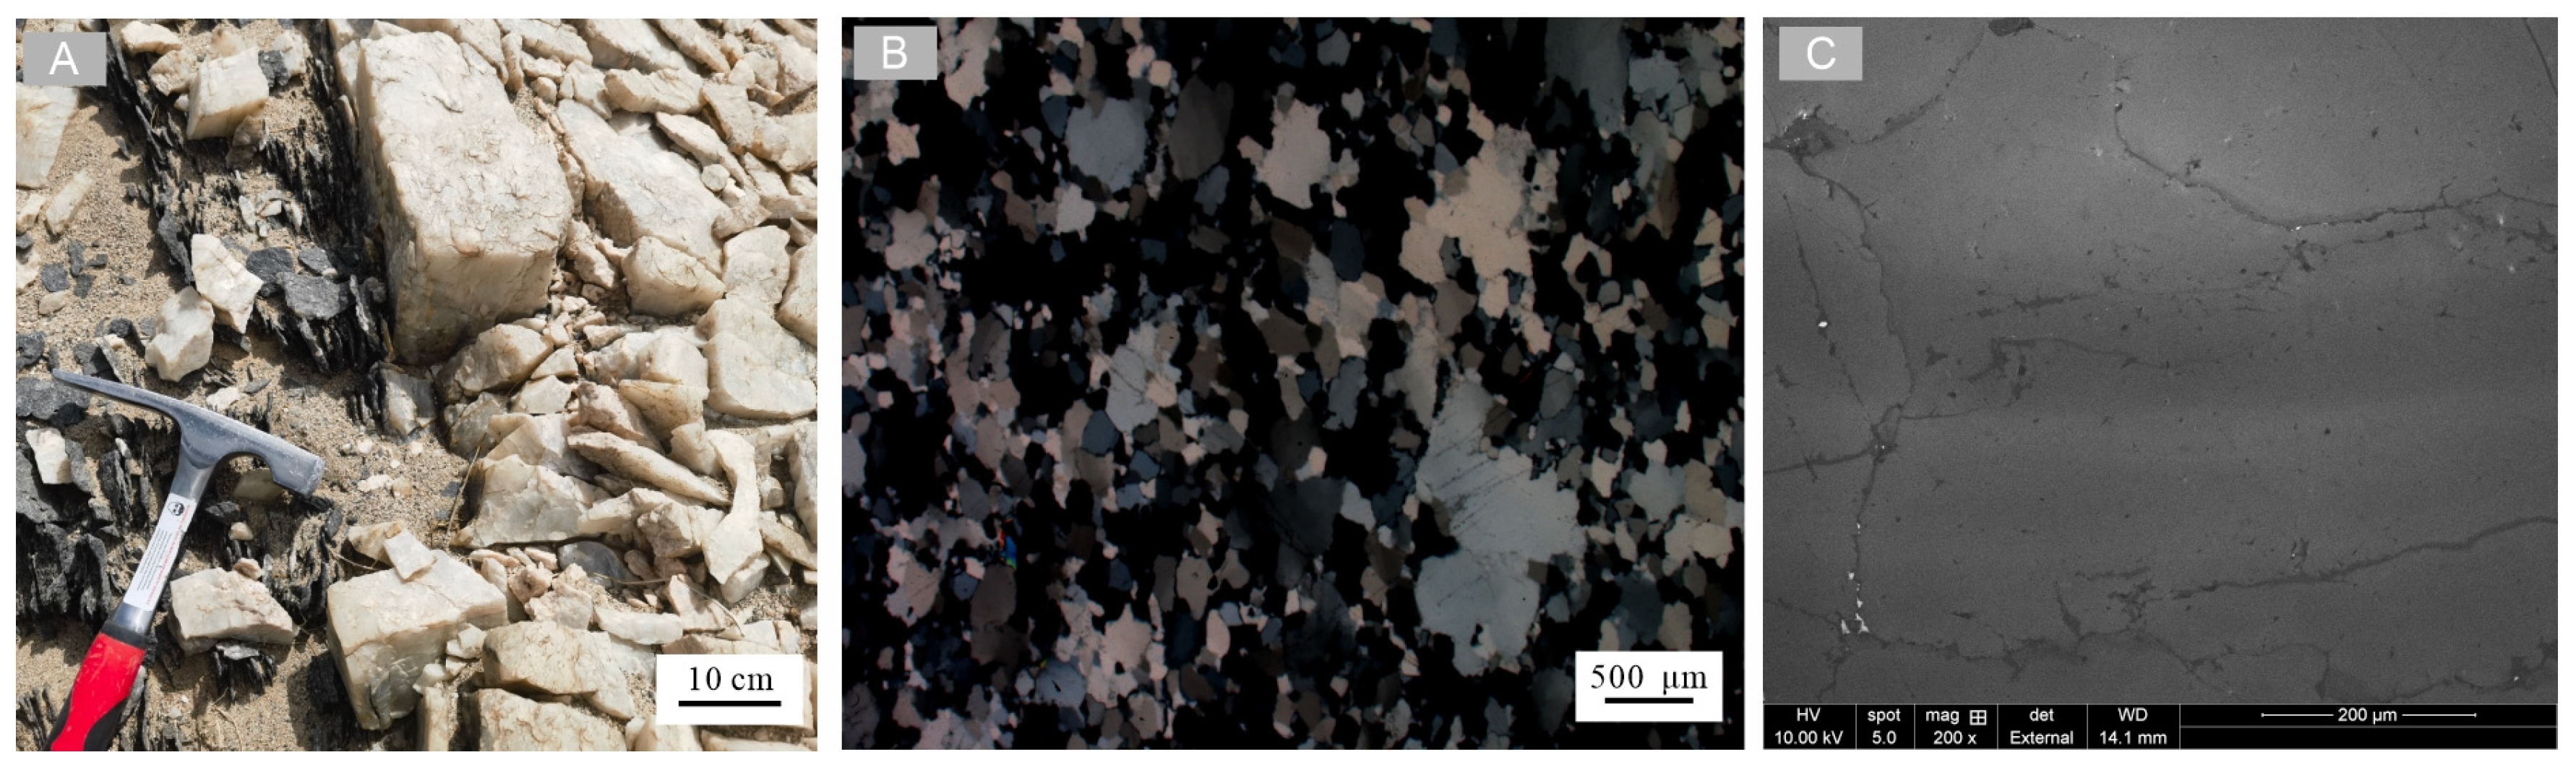
The selected sample from the Yamansu is the core of granitic pegmatite (Sample YM,
Figure 1A). The sample is predominantly composed of quartz, presenting a white coloration with hard and compact texture, showing a slight greasy luster. The quartz grains are anhedral and granular (
Figure 1B). Under cathodoluminescence (CL) imaging, the sample exhibits dark coloration with nearly uniform CL intensity (
Figure 1C). Through beneficiation and metallurgical purification processes targeting the quartz component, this sample achieved ultra-high purity at grade 4N78 (SiO
2 > 99.9978%).
The second sample was selected from the Taerlang granitic pegmatite, located in western Altay City, Xinjiang, within the Altay Mountain. The Altay Mountain is located in the central part of the Central Asian Orogenic Belt, bounded by the Irtysh Major Fault to the south, adjacent to the Siberian Plate in the north, and neighboring the Mongolian Altai region to the east. This region has undergone prolonged and complex tectonic evolution, resulting in the formation of numerous non-ferrous, ferrous, and rare metal deposits that constitute the renowned Altay Metallogenic Province [
18].
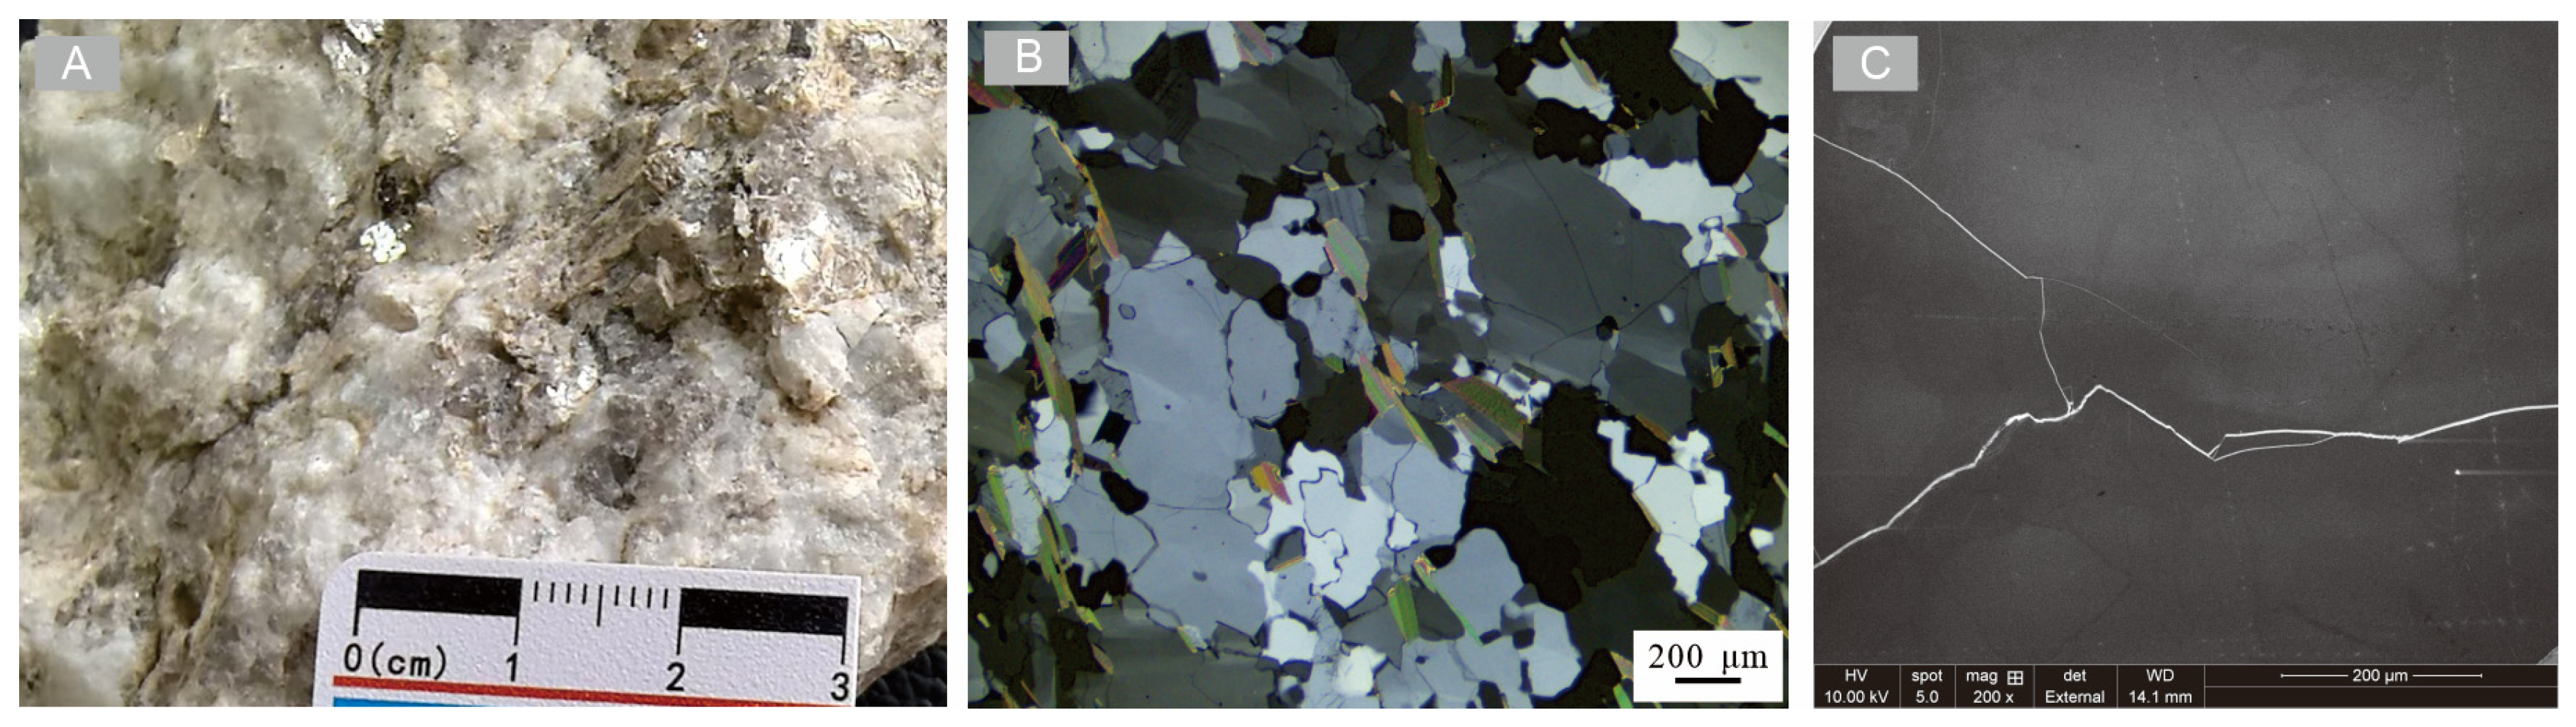
The studied muscovite granite pegmatite (Sample TEL,
Figure 2A) exhibits a mineral assemblage dominated by quartz, plagioclase, and muscovite, with accessory biotite. The sample presents a white coloration, featuring quartz grains with a slight greasy luster and highly anhedral crystal forms (
Figure 2B). CL analysis reveals dark toned quartz displaying nearly uniform CL intensity distribution (
Figure 2C). Through an advanced beneficiation and metallurgical purification process specifically targeting quartz components, this sample achieved exceptional purity at grade 4N8 (SiO
2 > 99.998%).
3. Methods
Due to quartz’s high optical transparency and limited laser energy absorption, elevated laser energy density is typically required for effective ablation. To enhance ablation success rates, this study employed laser spot thicknesses of 120–150 mm, significantly exceeding conventional parameters (~100 mm).
Before the LA-ICP-MS analysis of trace elements in quartz, comprehensive microscopic and CL analysis was conducted to characterize inclusion distribution patterns and identify quartz growth stages. Target domains with minimal inclusions and distinct CL zoning were strategically selected based on inclusion spatial configurations and CL response heterogeneity. CL imaging was performed using a MonoCL4 system at the Institute of Geology, Chinese Academy of Geological Sciences.
The nanosecond LA-ICP-MS analysis was conducted at the Mineral Microanalysis Laboratory of the Research Center for Mineral Deposit Genesis and Exploration Technology, Hefei University of Technology in China. The laser ablation system utilized was the Analyte HE from Photomachine, coupled with an Agilent 7900 ICP-MS (Agilent Technologies Inc., Santa Clara, CA, USA). Analytical parameters were configured as follows: laser energy density 6 J/cm2, spot diameter 40 μm, repetition rate 7 Hz, He carrier gas flow 0.6 L/min, ICP-MS RF power 1350 W, Ar nebulizer gas flow 0.75 L/min, and sampling depth 5.5 mm. The standard reference samples NIST610 and NIST612 were employed for calibration. In this study, the detection limits of each element by nanosecond laser dot ablation are Al 0.62 μg/g, Ti 0.08 μg/g, Li 0.07 μg/g, and B 5.25 μg/g.
The femtosecond LA-ICP-MS analysis was performed at the State Key Laboratory of Nuclear Resources and Environment, East China University of Technology. The system consisted of an NWR Femto 257 femtosecond laser ablation unit paired with a PE NexION 1000 ICP-MS. Operational parameters included the following: spot size 40 μm, repetition rate 20 Hz, ablation speed 10 μm/s, and ablation depth 10 μm. Calibration utilized NIST610, NIST612, and NIST 614 reference samples. To verify the accuracy of the data, we conducted comparative tests of the natural smoky quartz crystal from Shandong Province, a type of quartz characterized by low contents of Al, Ti, and other trace elements [
19]. The measurement errors are within 10%. In this study, the detection limits of each element by femtosecond laser dot ablation are Al 0.51 μg/g, Ti 2.21 μg/g, Li 0.17 μg/g, and B 1.06 μg/g. The detection limits for femtosecond laser line ablation and area scanning are Al 0.09 μg/g, Ti 0.47 μg/g, Li 0.30 μg/g, and B 0.7 μg/g.
The comprehensive mineral processing and purification experiments for quartz samples were conducted at the Zhengzhou Institute of Multipurpose Utilization of Mineral Resources, Chinese Academy of Geological Sciences. The process involved sequential beneficiation techniques including gravity separation, magnetic separation, flotation, and acid leaching to achieve deep impurity removal and purification. After subjecting the samples to deep impurity removal and metallurgical purification, analytical procedures were conducted under strictly controlled chemical pretreatment environments to eliminate external interference. Following protocols of ≥1.0 g sample aliquots, mixed-acid digestion at ambient pressure was performed in a Class 100 chemical safety cabinet. Combined ICP-OES and ICP-MS techniques were subsequently employed at the Zhengzhou Institute of Multipurpose Utilization of Mineral Resources, Chinese Academy of Geological Sciences. Triplicate measurements with averaged results were implemented to ultimately determine trace element concentrations in the purified samples [
10].
In this study, one sample each from the Yamansu (coded YM) and Taerlang (coded TEL) areas underwent comparative analysis using both nanosecond and femtosecond laser ablation systems. To advance the application of LA-ICP-MS in high-purity quartz deposit assessment, a total of 80 quartz samples from diverse locations within the Yamansu area were analyzed using LA-ICP-MS. Spatial distribution patterns of trace impurities were systematically investigated through geological map plotting, enabling comprehensive characterization of regional quartz impurity zonation and concentration gradients.
4. Results
Five inclusion-free quartz grains from each sample were subjected to nanosecond laser dot ablation, with pronounced thermal effects observed during the process (
Figure 3A). The analytical results are summarized in
Table 1. The elemental concentrations of Sample YM ranged as follows: Al 7.59~12.58 μg/g, Ti 4.87~10.51 μg/g, Li 0.05~0.82 μg/g, and B 5.79~8.81 μg/g. The elemental compositions of Sample TEL are exhibited as follows: Al 11.06~37.17 μg/g, Ti 3.90~7.22 μg/g, Li 0.02~5.24 μg/g, and B 1.56~2.58 μg/g.
Following the same analytical protocol as nanosecond laser ablation, femtosecond laser ablation was performed on quartz samples, including five dot ablations, five line ablations, and one laser mapping. The thermal effects were significantly less pronounced compared to nanosecond laser ablation (
Figure 3B). The analytical results are summarized in
Table 1.
The femtosecond laser dot ablation results for Sample YM are stated as follows: Al 8.35~32.98 μg/g, Ti 5.44~61.61 μg/g, Li 0~0.23 μg/g, and B 0.93~5.06 μg/g. The results for Sample TEL are presented as follows: Al 20.67~26.57 μg/g, Ti 3.65~5.85 μg/g, Li 1.33~2.62 μg/g, and B 2.55~5.24 μg/g.
The femtosecond laser line ablation results for Sample YM are stated as follows: Al 11.13~12.51 μg/g, Ti 3.63~5.54 μg/g, Li 0.02~0.38 μg/g, and B 0.29~0.67 μg/g. The results for Sample TEL are Al 20.67~26.57 μg/g, Ti 3.65~5.85 μg/g, Li 1.33~2.62 μg/g, and B 2.55~5.24 μg/g.
The femtosecond laser map is composed of multiple lines of line ablation. The results took the average value. Sample YM shows the following results: Al 21.75 μg/g, Ti 13.08 μg/g, Li 1.16 μg/g, and B 0.91 μg/g. Sample TEL shows Al 31.5 μg/g, Ti 6.41 μg/g, Li 2.84 μg/g, and B 1.27 μg/g.
The refined elemental concentrations of both samples following beneficiation and metallurgical purification are presented in
Table 1. Sample YM shows Al 9.15 μg/g, Ti 8.26 μg/g, Li 0.09 μg/g, and B 0.36 μg/g. Sample TEL shows Al 11.41 μg/g, Ti 3.07 μg/g, Li 0.18 μg/g, and B 0.22 μg/g.
5. Discussion
5.1. Validity of Quartz LA-ICP-MS Analysis Data
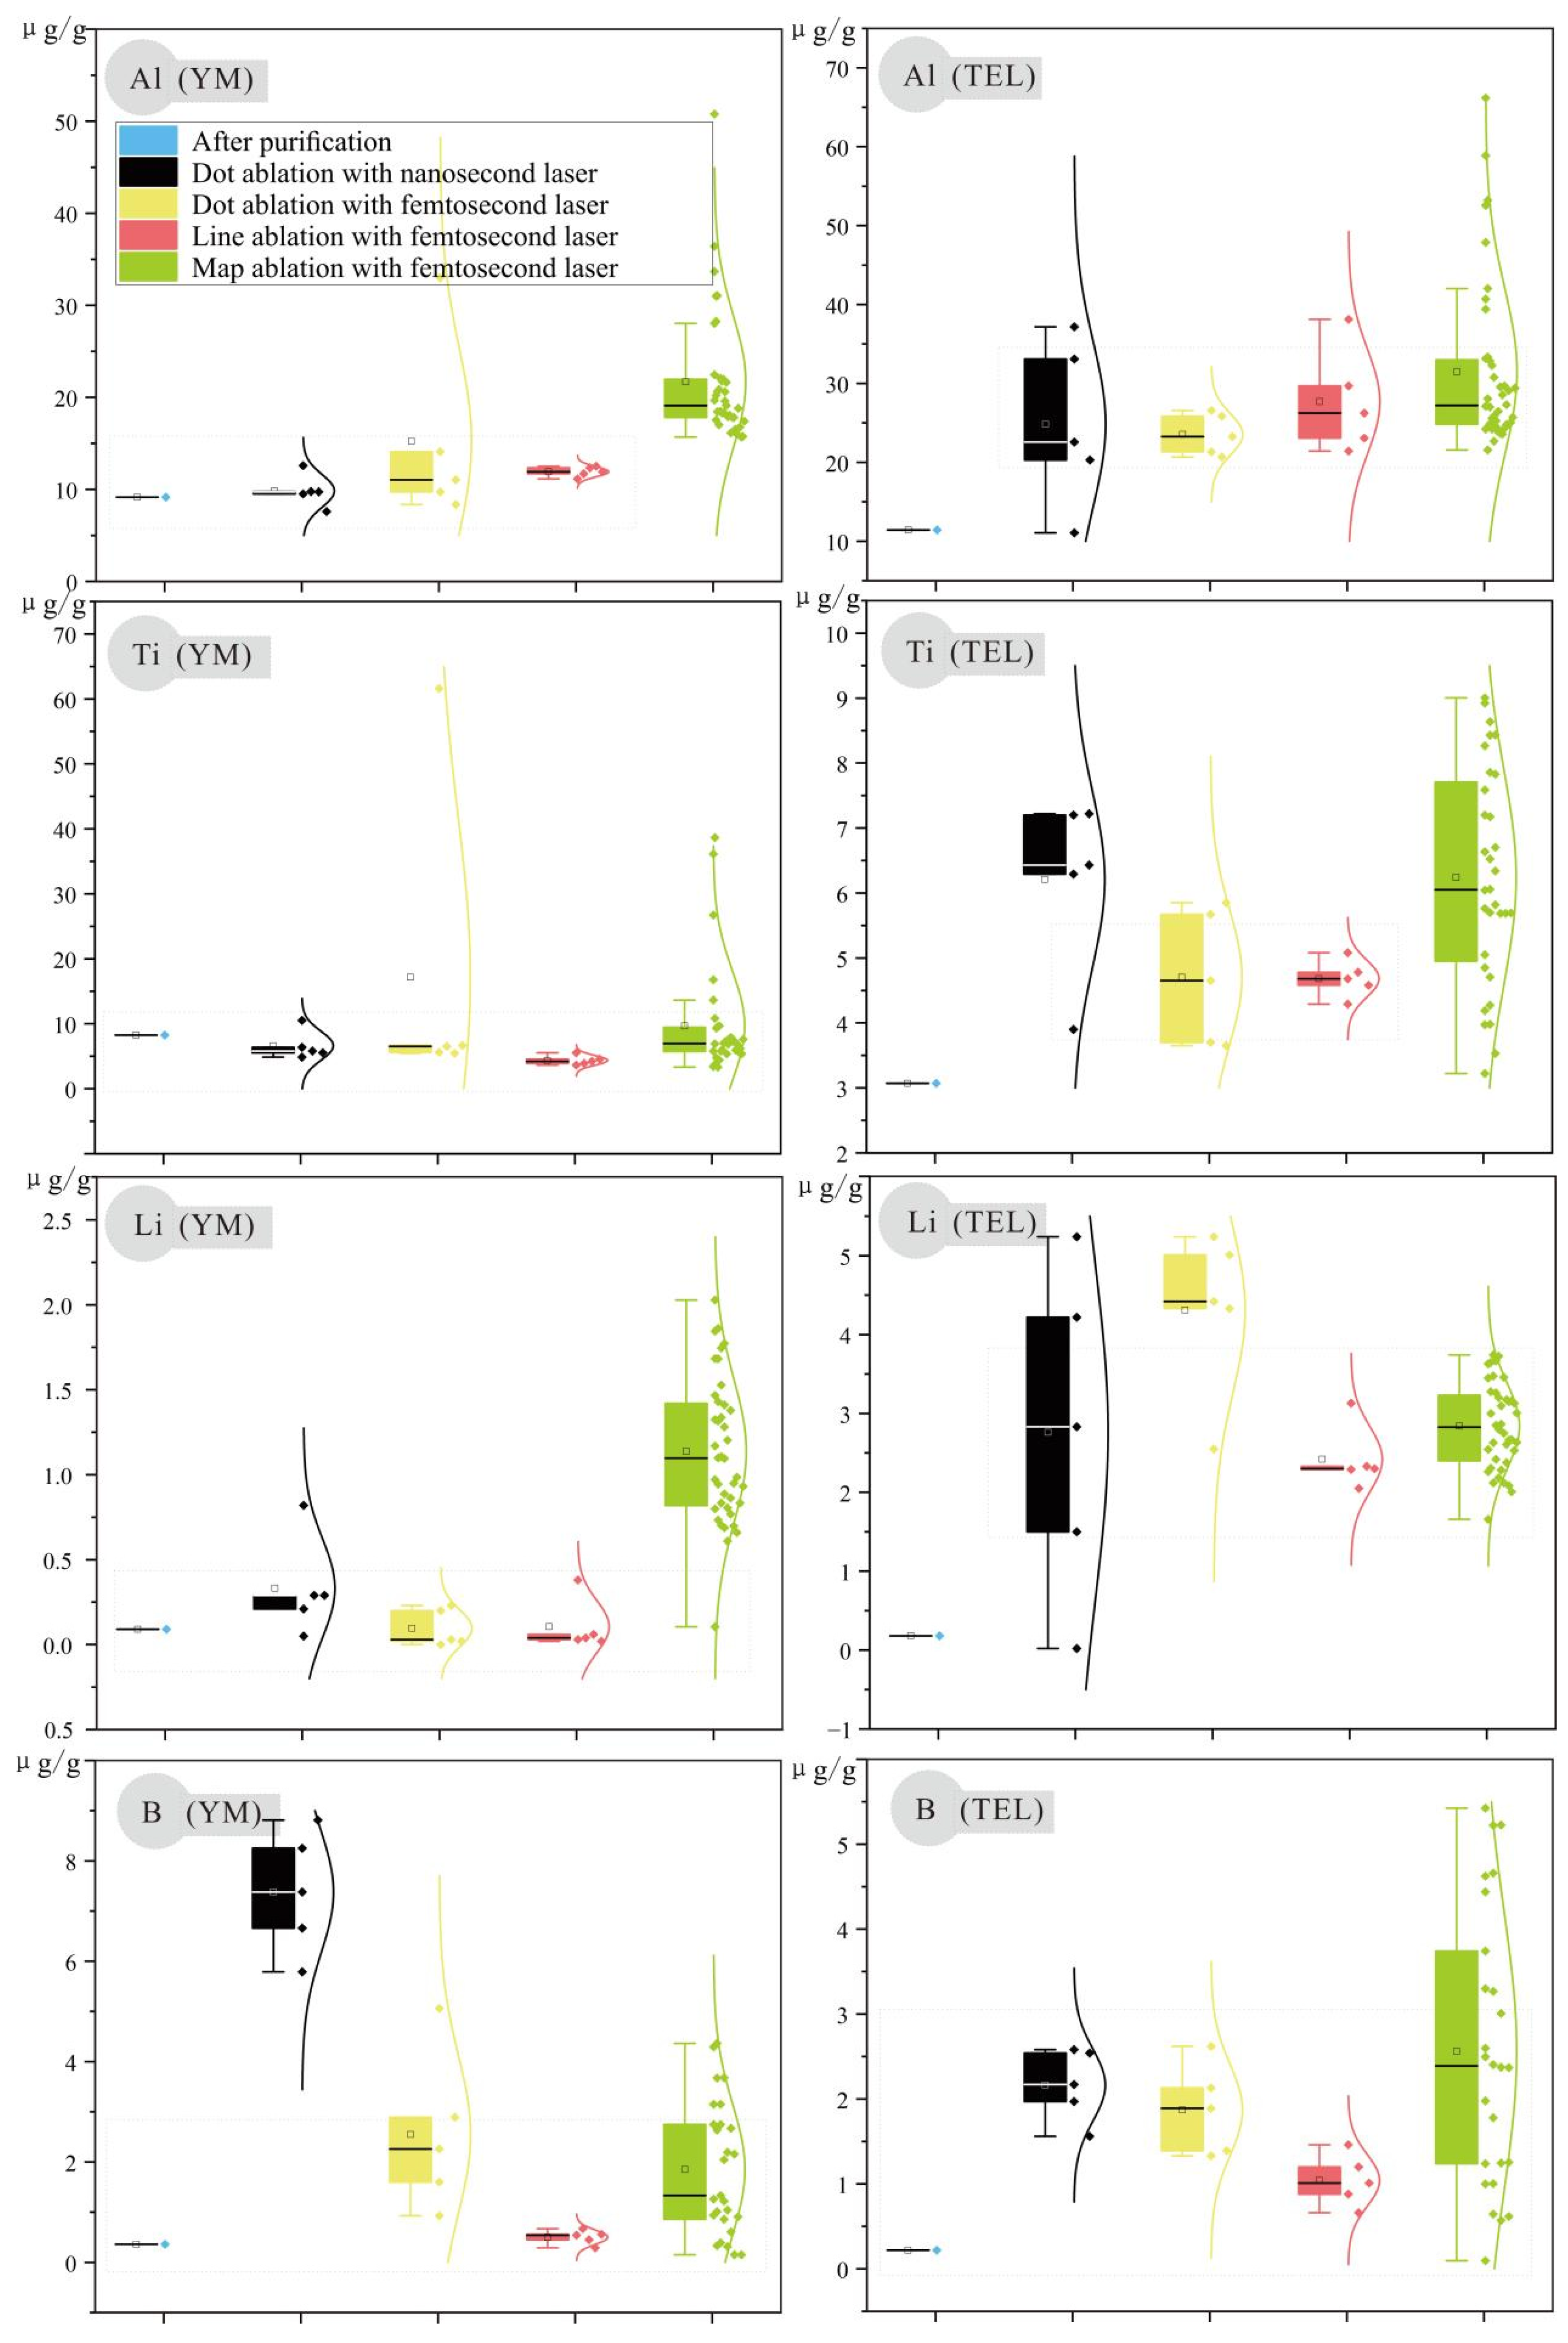
A comparative study was conducted on the purified elemental content of two samples using nanosecond laser dot ablation, femtosecond laser dot ablation, femtosecond laser line ablation, and femtosecond laser area mapping (
Figure 4). All standard reference sample results showed good performance within acceptable error ranges. The analysis of the research sample results revealed the following:
① CL analysis exhibited good uniformity, indicating structural homogeneity in quartz lattice and elemental composition. Data distributions obtained from different ablation methods showed significant similarities, consistent with quartz CL characteristics. ② Laser ablation measurements generally showed slightly higher values than beneficiation purification results. This discrepancy arises because laser ablation cannot completely exclude the influence of inclusions and associated minerals, whereas impurity elements in purified samples mainly originate from the lattice after removing most inclusions and intergrown minerals. ③ Considering potential ablation of inclusions or associated minerals during laser processing, femtosecond laser dot ablation demonstrated the best stability among the four methods for Al element analysis after excluding outliers. Nanosecond laser dot ablation and femtosecond line ablation also showed good stability, while femtosecond area scanning exhibited lower stability due to its larger ablation range. ④ For Ti element analysis, femtosecond line ablation showed optimal stability. Nanosecond dot ablation and femtosecond dot ablation displayed good stability, while femtosecond area scanning results showed wider variations similar to Al element patterns. ⑤ Li element analysis paralleled Ti results, with femtosecond line ablation showing the best stability, followed by nanosecond and femtosecond dot ablation, while area scanning exhibited moderate performance. ⑥ For B element analysis, nanosecond dot ablation, femtosecond dot ablation, and line ablation all demonstrated good stability, with femtosecond line ablation showing the closest agreement with purification results.
In conclusion, empirical evaluation indicates that femtosecond laser line ablation demonstrates optimal stability and the closest alignment with beneficiation purification results. Both the nanosecond and femtosecond dot ablation methods also exhibited good stability. However, femtosecond area scanning results showed poorer stability, potentially influenced by inclusions or associated minerals.
To further determine which laser ablation method demonstrates superior effectiveness and accuracy, we established a comprehensive evaluation model integrating stability and closeness metrics. The variance of analytical data for each laser ablation group was calculated, with lower variance values indicating better data stability. The evaluation results are detailed in
Table 2. To evaluate the correlation between the LA-ICP-MS results and purified quartz sand, the mean squared error (MSE) was calculated between each dataset and the post-beneficiation reference values. Lower MSE values signify higher agreement with purification outcomes. These results are presented in
Table 2. A composite score was derived through weighted integration of stability and closeness metrics. Considering the greater importance of stability, weighting coefficients of 0.6 (stability) and 0.4 (closeness) were assigned. The weighted score was calculated as the following function: Weighted Score = Variance × 0.6 + MAE × 0.4. Lower variance indicates better stability; lower MAE reflects higher closeness. As shown by the weighted scores in
Table 3, femtosecond laser line ablation demonstrated optimal comprehensive performance for Al, Ti, Li, and B. Nanosecond laser dot ablation ranked second. Femtosecond laser dot ablation exhibited the poorest comprehensive performance due to unstable Ti elemental results.
5.2. Application of Quartz in Situ Micro-Area Analysis in High-Purity Quartz Deposit Evaluation
To enhance the applicability of quartz LA-ICP-MS analytical results in high-purity quartz deposit evaluation, this study draws upon the methodological framework established for the Tysfjord high-purity quartz deposit in Norway [
9,
18]. However, granitic pegmatites exhibit mineralogical structural zoning, sequentially comprising the border zone, wall zone, intermediate zone, and core zone from the periphery inward; the geological environments (e.g., temperature) during quartz formation vary across these zones [
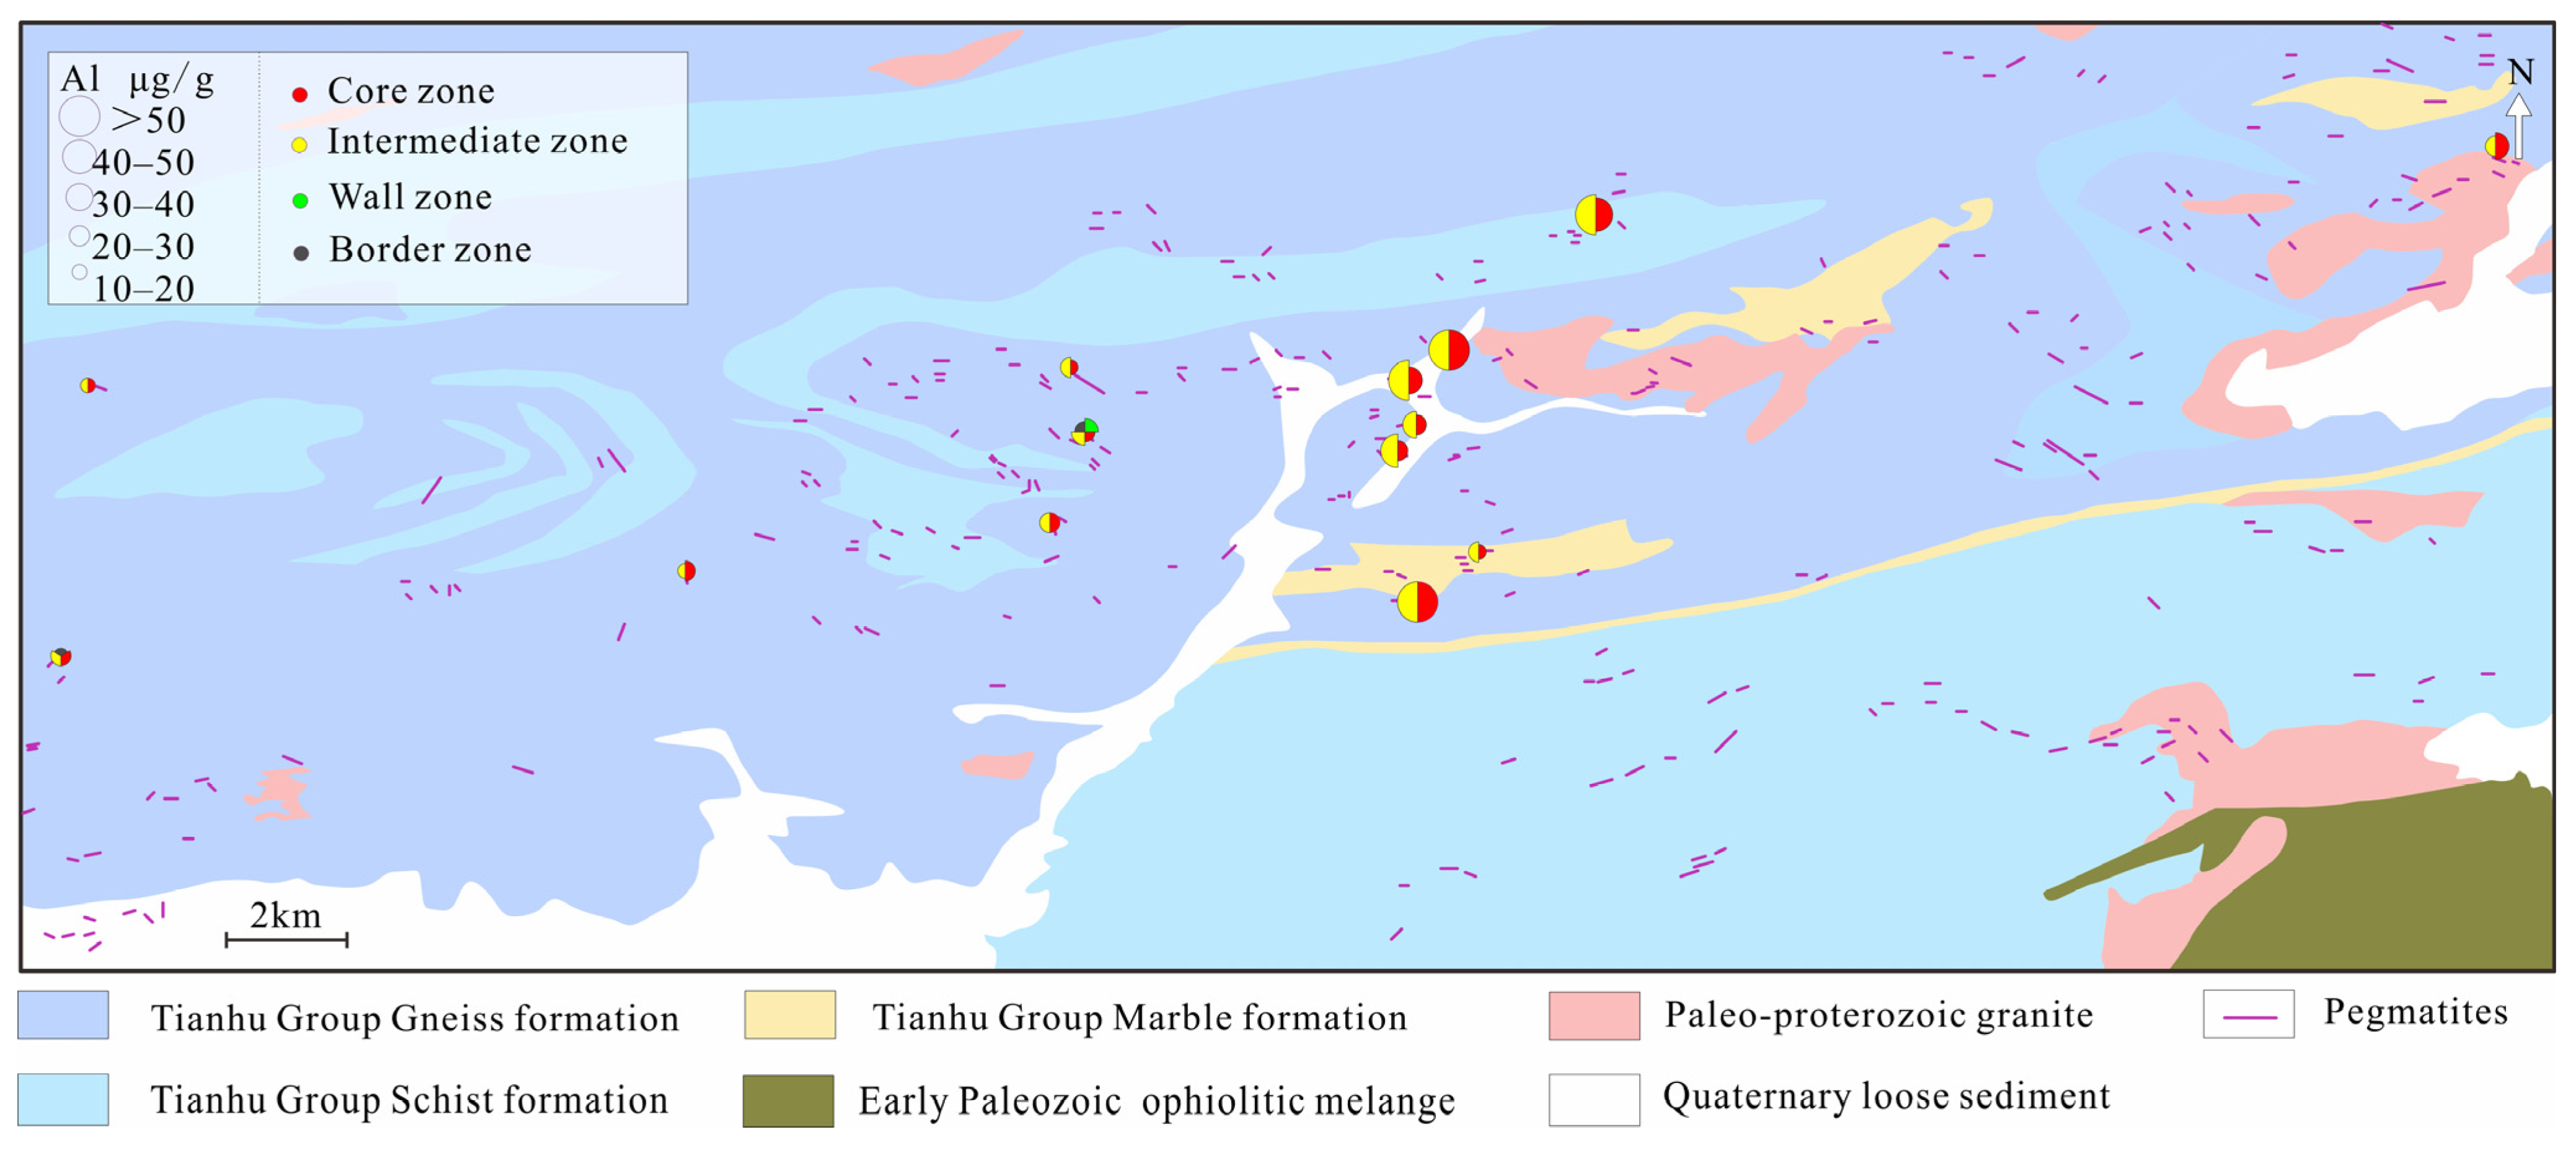
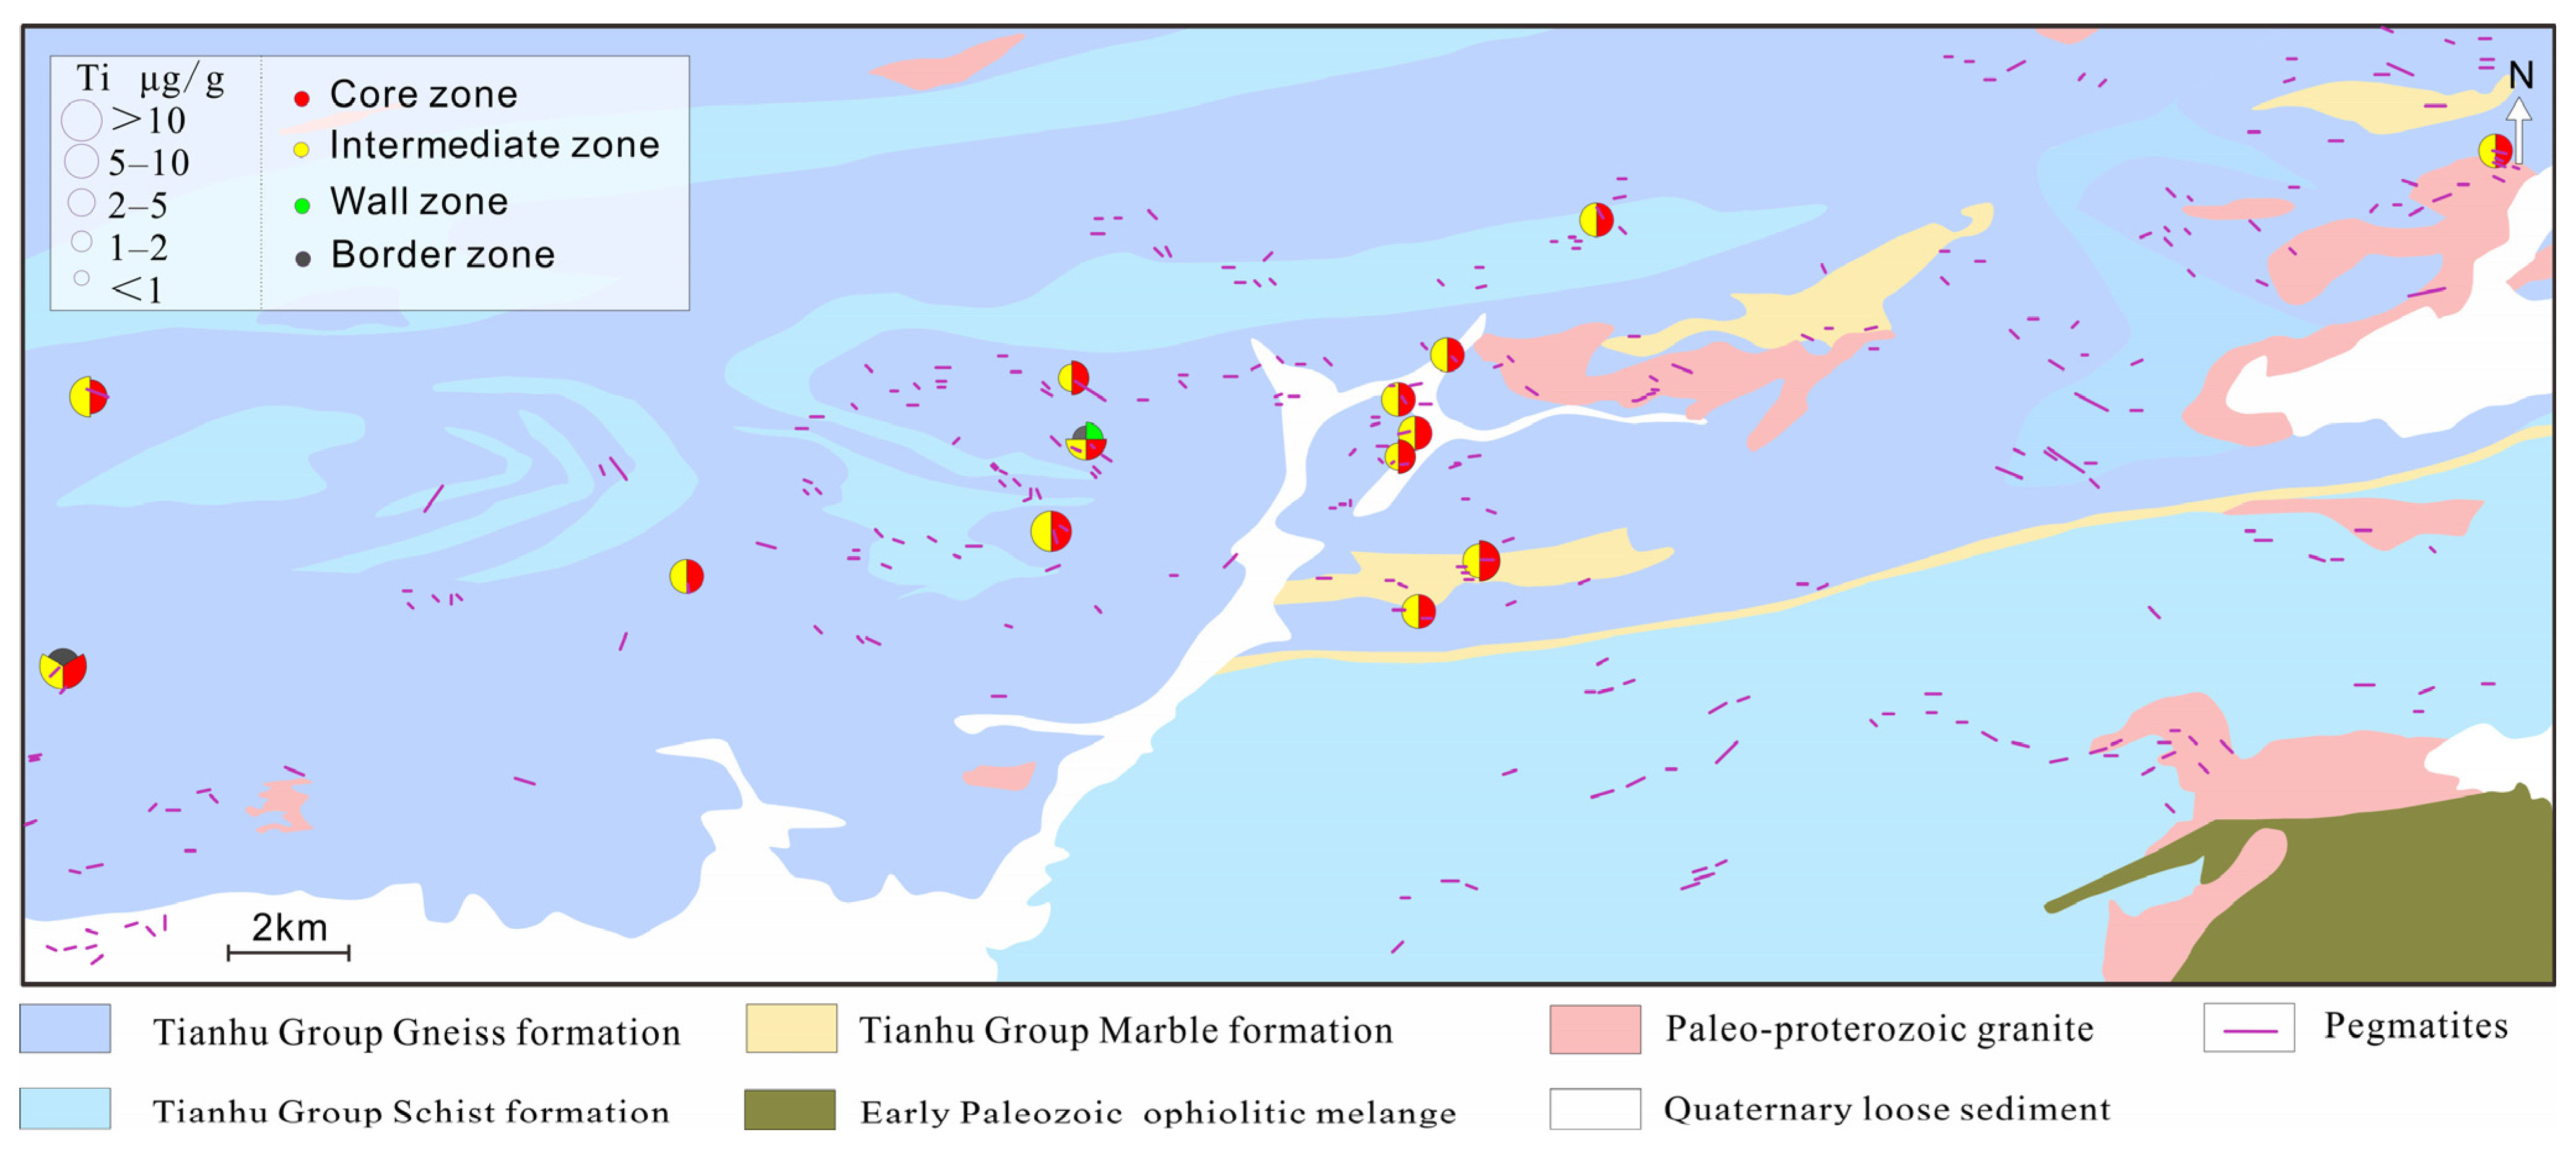
20], leading to differences in impurity content. To address this, our study conducted detailed geological mapping and systematically sampled quartz from distinct structural zones of the Yamansu high-purity quartz deposit. In situ micro-area analysis of quartz (Al and Ti results shown in
Table 2) revealed spatial trends: Al concentrations display an east-high-west-low pattern (
Figure 5), while Ti distribution remains relatively uniform (
Figure 6). These findings provide refined assessments of regional quartz impurity content, indicating superior high-purity quartz mineralization potential in the western region compared to the east.
To validate this conclusion, beneficiation and purification tests were performed on samples from the central and western zones. The western sample yielded 4N7.8-grade (99.9978% SiO2) high-purity quartz sand, whereas the eastern sample produced 4N6-grade (99.996% SiO2) quartz sand. These results align with the quartz in situ microanalytical mapping, demonstrating that LA-ICP-MS analysis of quartz is a viable tool for prospecting and evaluating high-purity quartz deposits.
6. Conclusions
LA-ICP-MS analysis of quartz effectively quantifies trace element concentrations. However, in high-purity quartz raw material deposits where trace element levels are exceptionally low, significant variations in data quality emerge across different laser ablation methods. Through systematic evaluation integrating four ablation modes—nanosecond laser dot ablation, femtosecond laser dot ablation, femtosecond laser line ablation, and mapping—with quartz purification results, the following conclusions are drawn: Femtosecond laser line ablation demonstrates superior analytical stability for Al, Ti, Li, and B, coupled with high concordance with metallurgical purification outcomes. Nanosecond laser dot ablation exhibits moderate performance in both stability and data concordance. Laser mapping yields suboptimal results due to unavoidable inclusion of mineral inclusions and co-crystallized phases, resulting in poor data.
The application of quartz in situ trace element mapping enables precise delineation of high-purity quartz potential zones. Strong consistency between microanalytical data and purification results validates LA-ICP-MS as an efficient exploration tool for high-purity quartz deposits.


 ,
, 

