
Applying Mineral System Criteria to Develop a Predictive Modelling for Epithermal Gold Mineralization in Northern New Brunswick: Using Knowledge-Driven and Data-Driven Methods


Abstract
1. Introduction
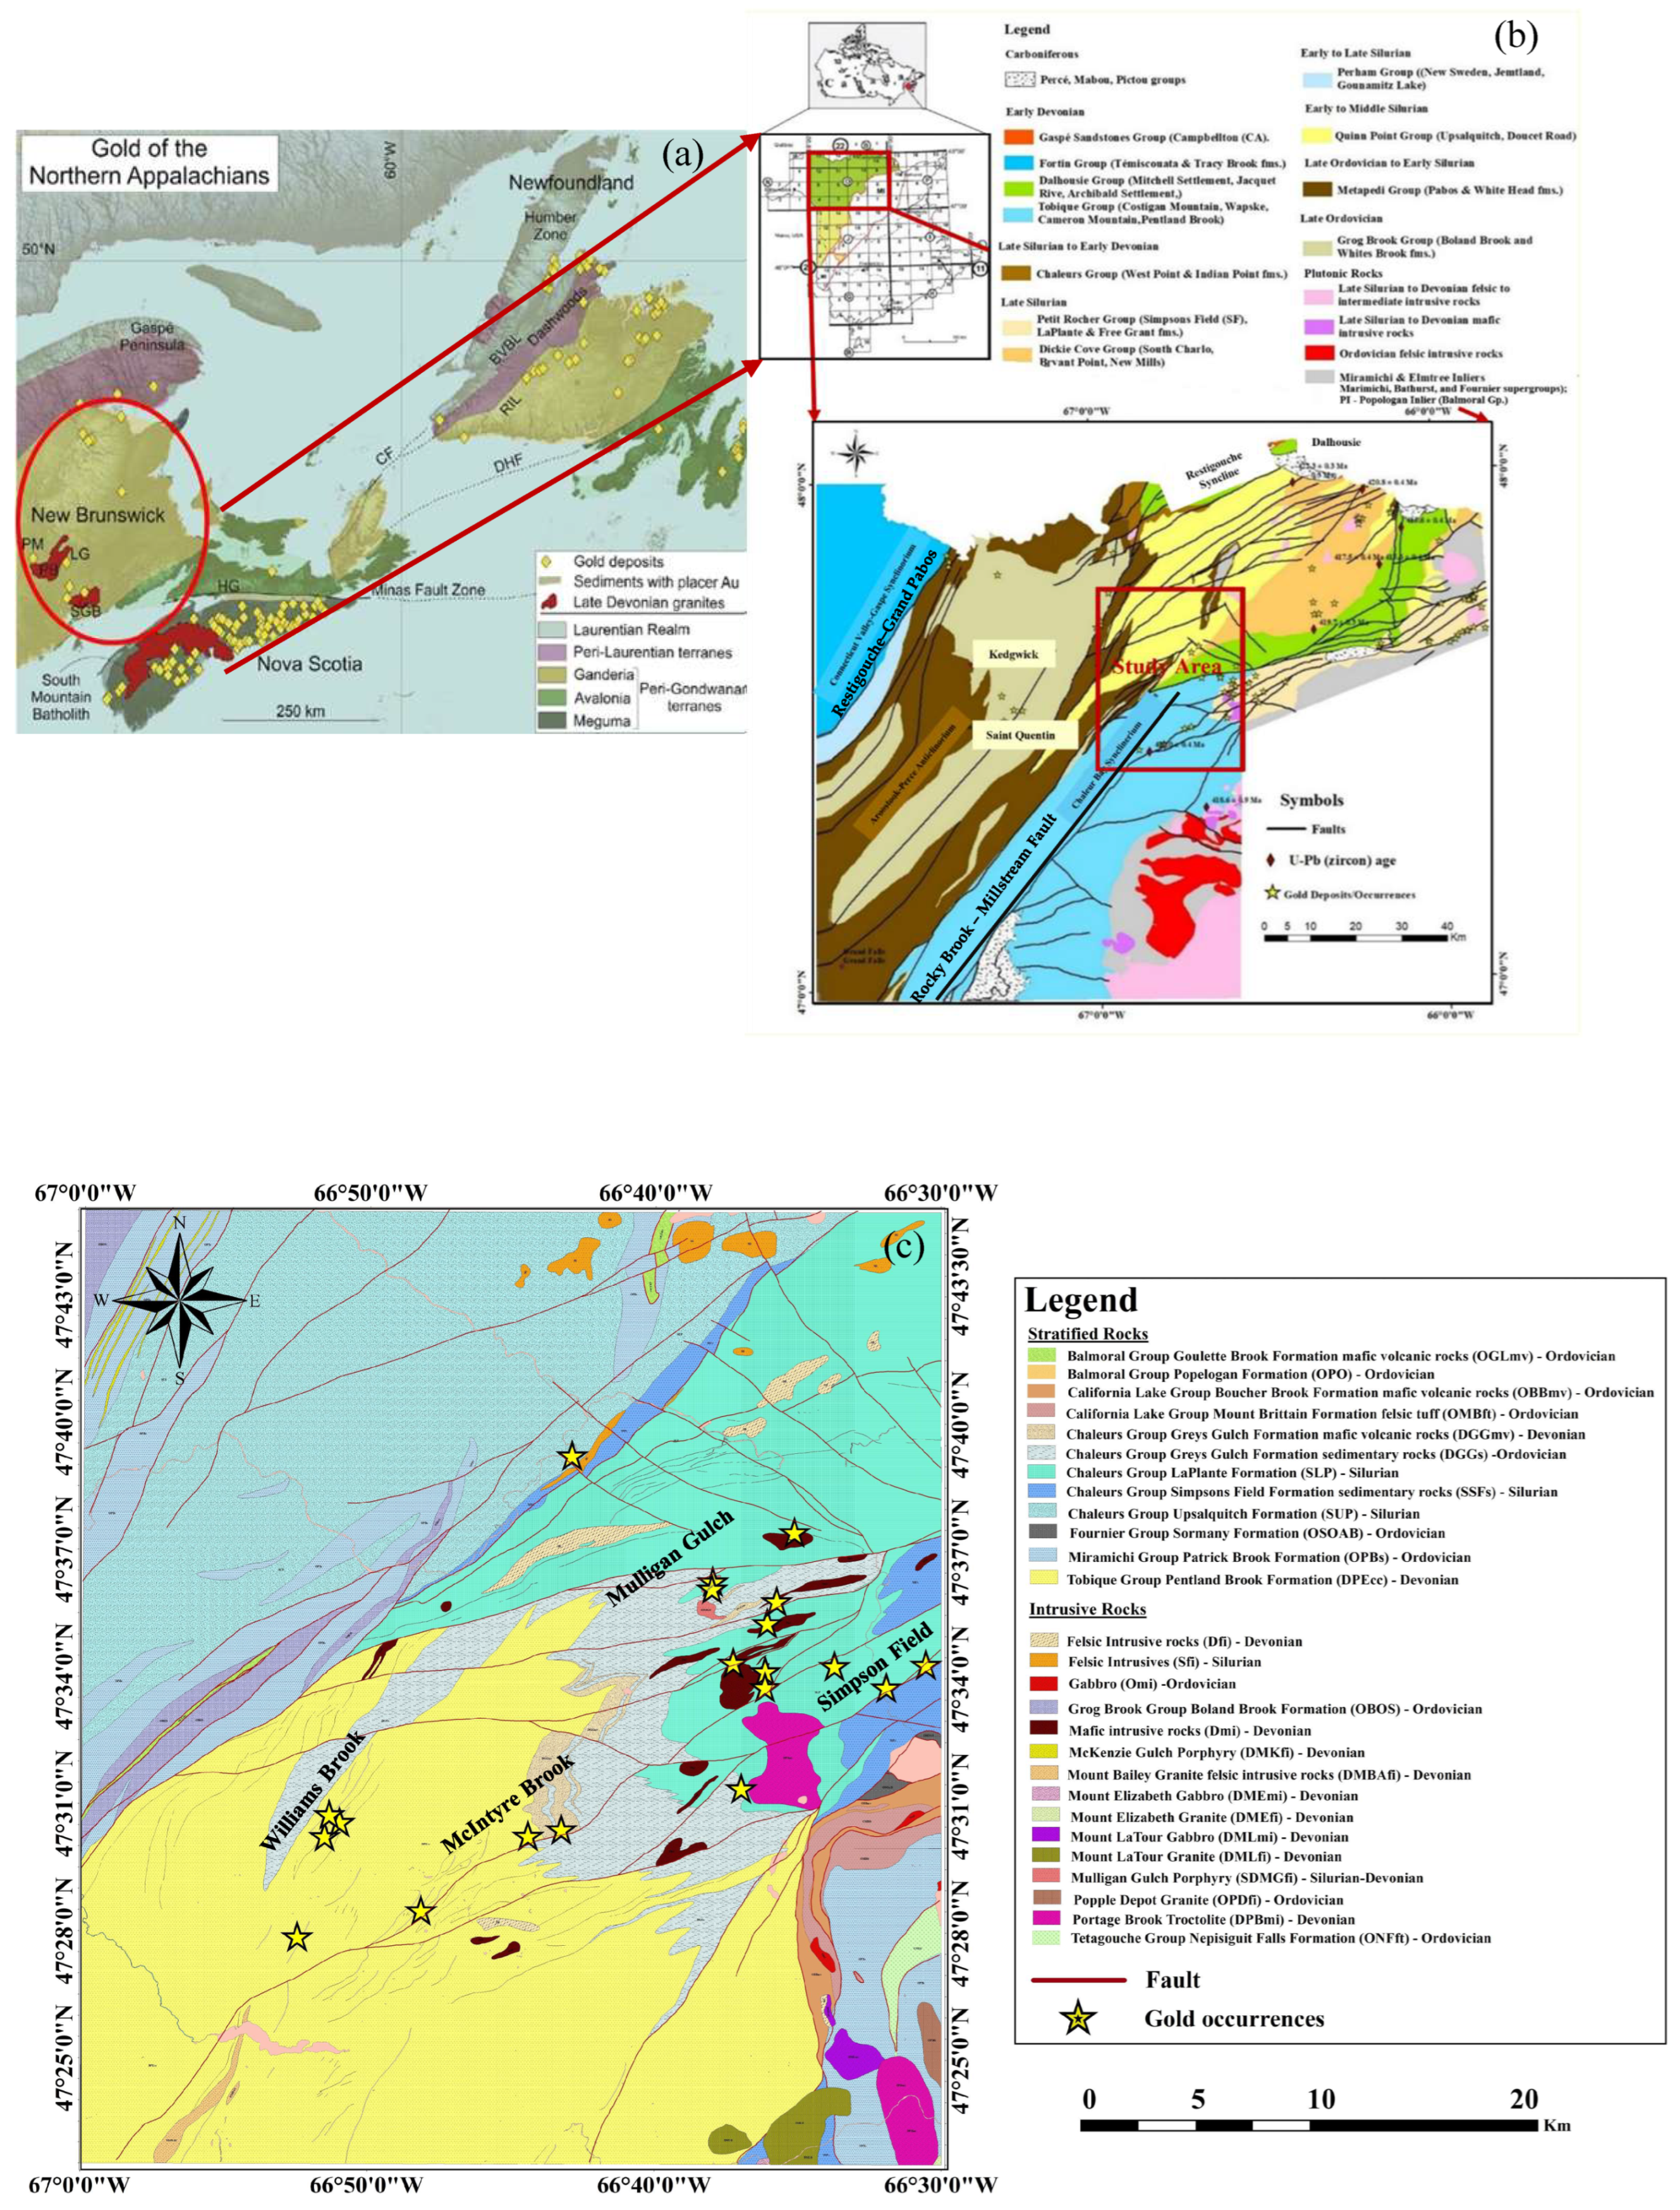
2. Geology of the Study Area
3. Epithermal Gold System
Epithermal Gold Mineralization in New Brunswick
4. Materials and Methods
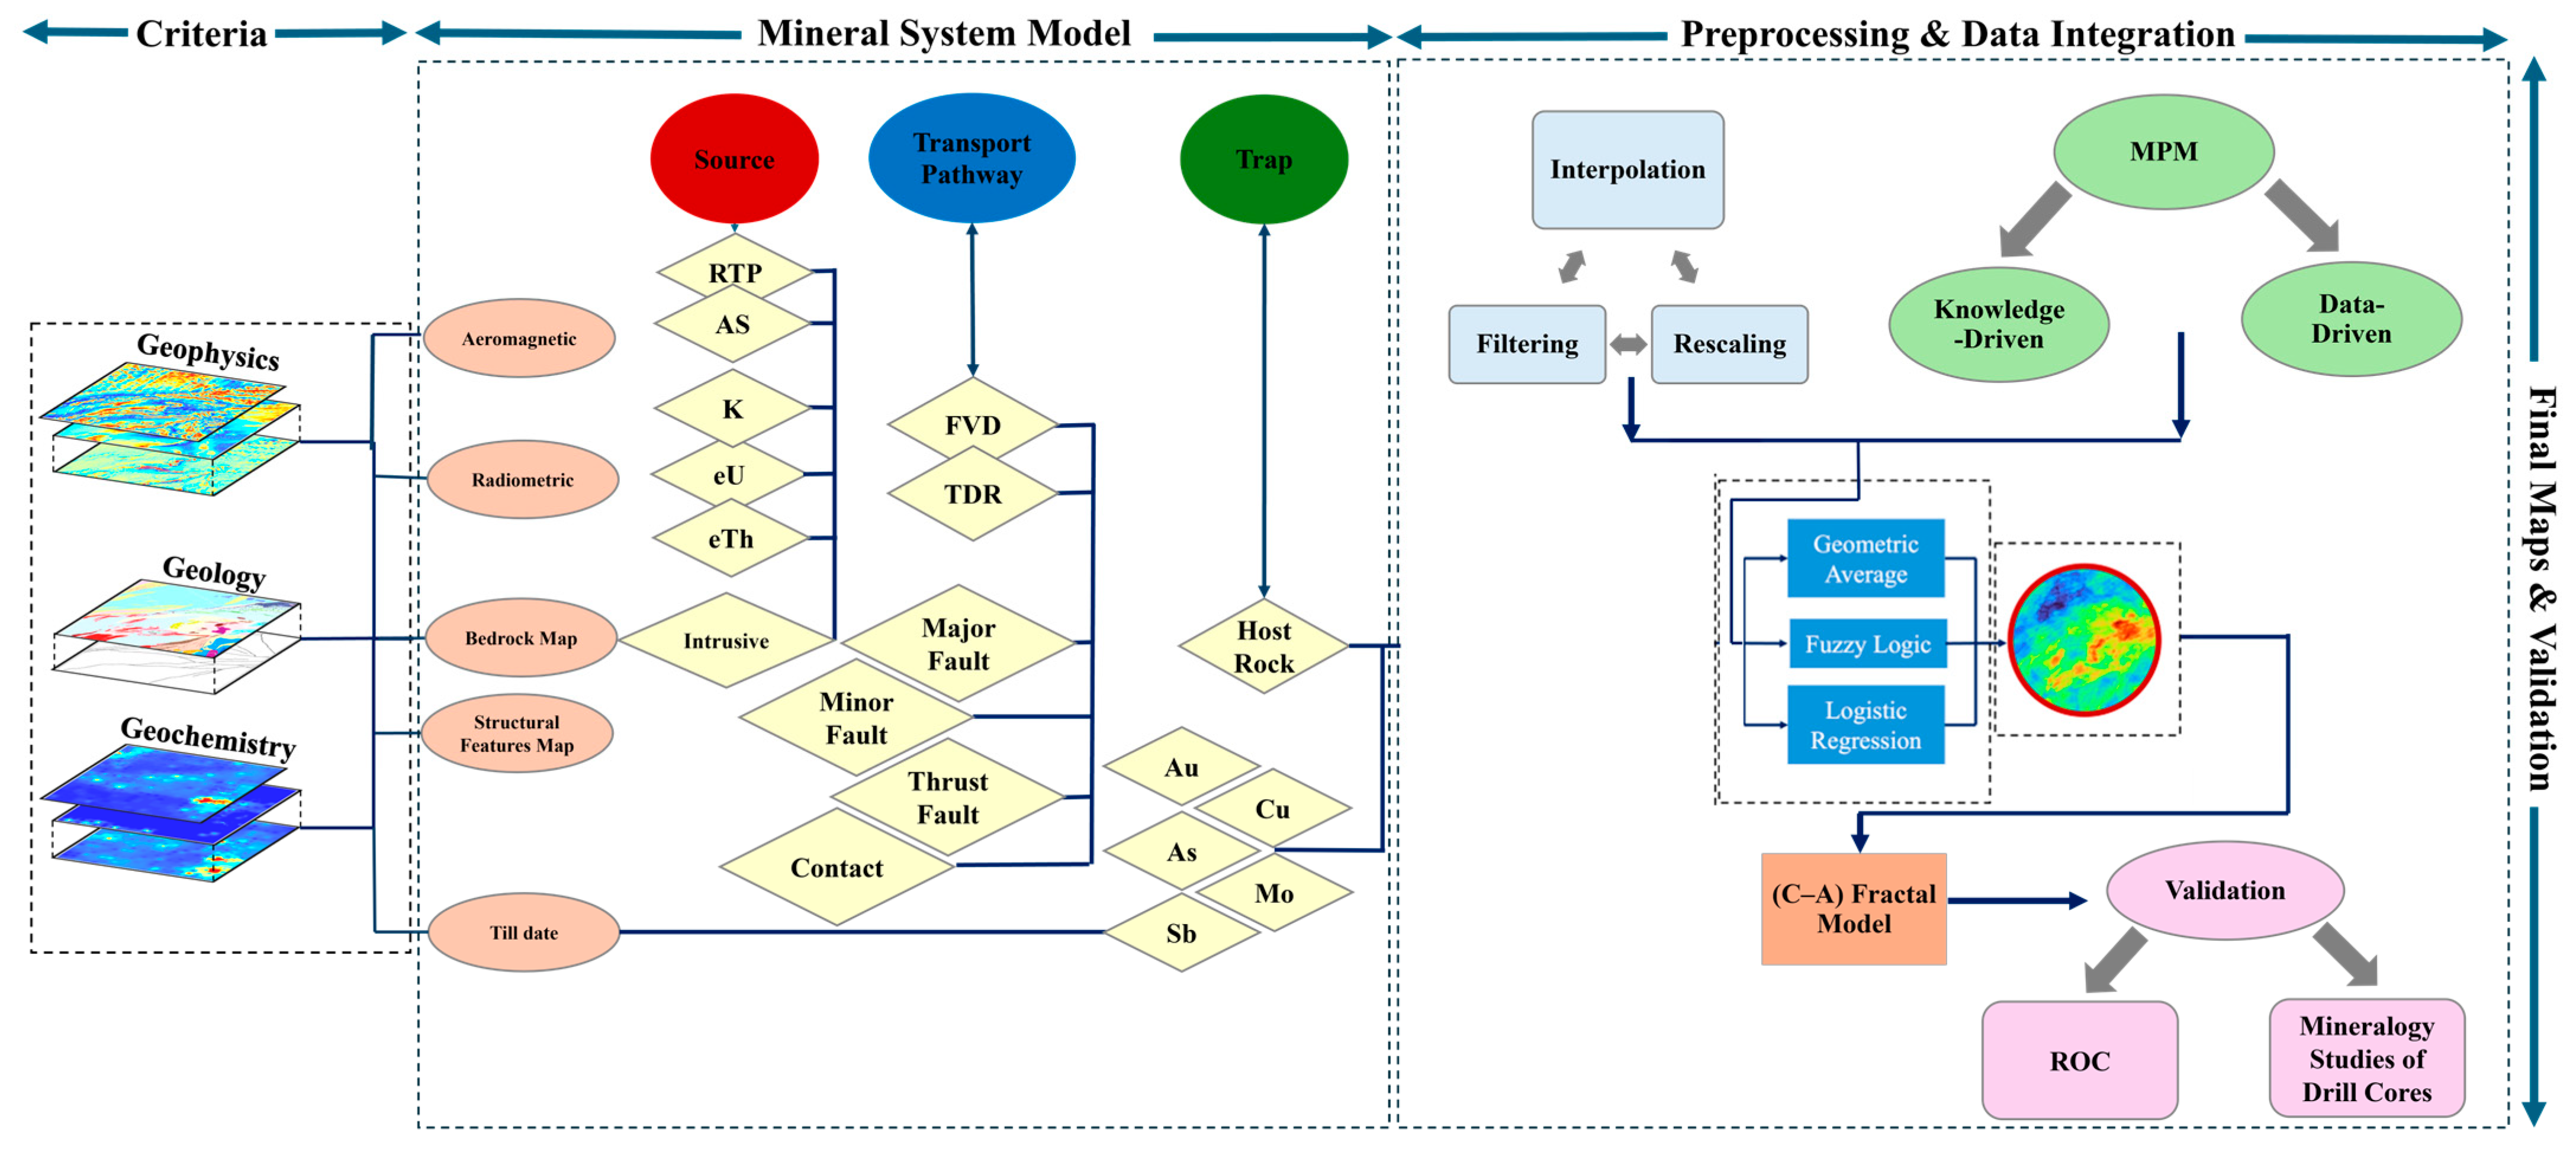
4.1. Framework of Model
4.2. Dataset
4.2.1. Geological Data
4.2.2. Surficial Geochemical till Data
4.2.3. Geophysical Data
4.3. Methods
4.3.1. Log-Ratio Approach and Principal Component Analysis
4.3.2. Logistic Transformation
4.3.3. Fuzzy Logic
4.3.4. Geometric Average
4.3.5. Logistic Regression
4.3.6. Fractal-Based Discretization of MPM Maps
4.3.7. Receiver Operating Characteristic
5. Mineral System Approach
5.1. Mapping Components to Targeting Criteria
5.1.1. Source
5.1.2. Pathway
5.1.3. Trap
6. Results and Discussion
7. Conclusions and Recommendations
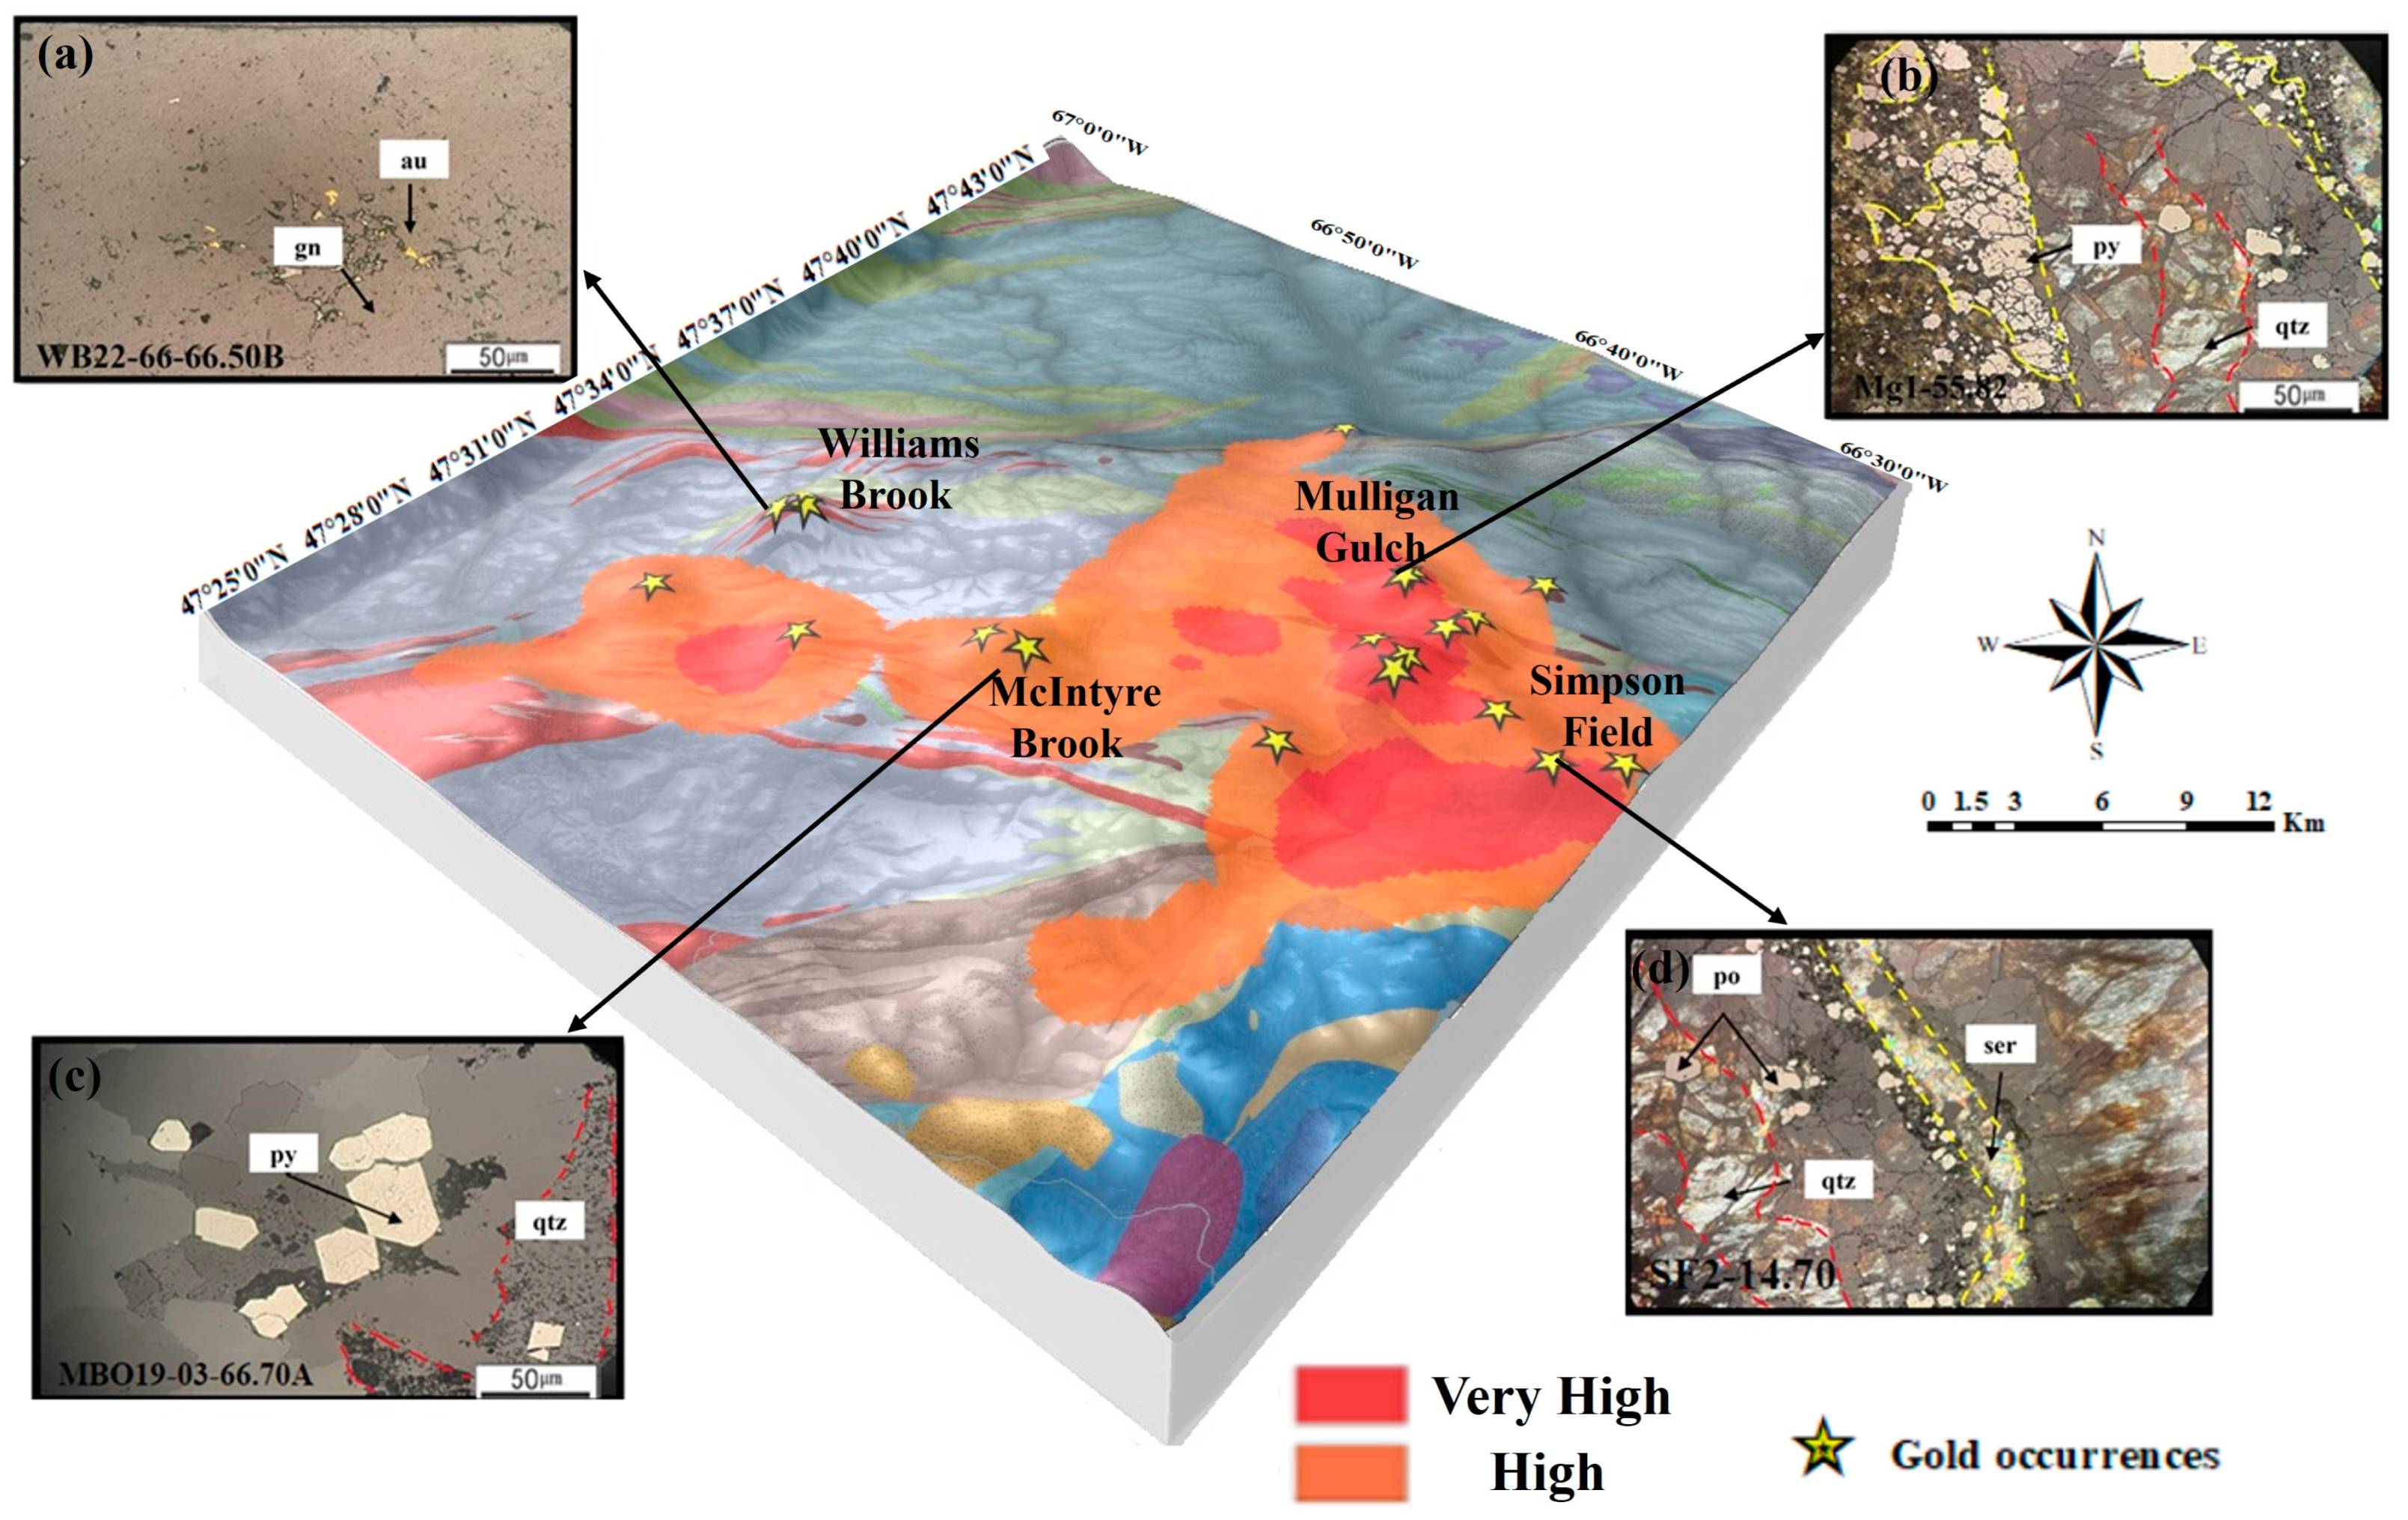
- This study applied an MPM technique to identify high-favorability zones for epithermal gold mineralization in Northern New Brunswick. By integrating geological expertise with advanced computational methods, namely, fuzzy logic, geometric average, and logistic regression, it achieved a high level of predictive accuracy. The identified zones strongly correlated with known gold occurrences, especially in the structurally controlled Tobique–Chaleur Zone.
- Geological, geochemical, and geophysical datasets were crucial in defining evidence layers that represented the mineral system components. The alignment of high-favorability zones with key structural features, such as the Rocky Brook–Millstream Fault system, demonstrated the importance of faults as fluid pathways. The study also underscored the role of felsic and mafic intrusive rocks as essential magmatic sources, contributing to gold mineralization.
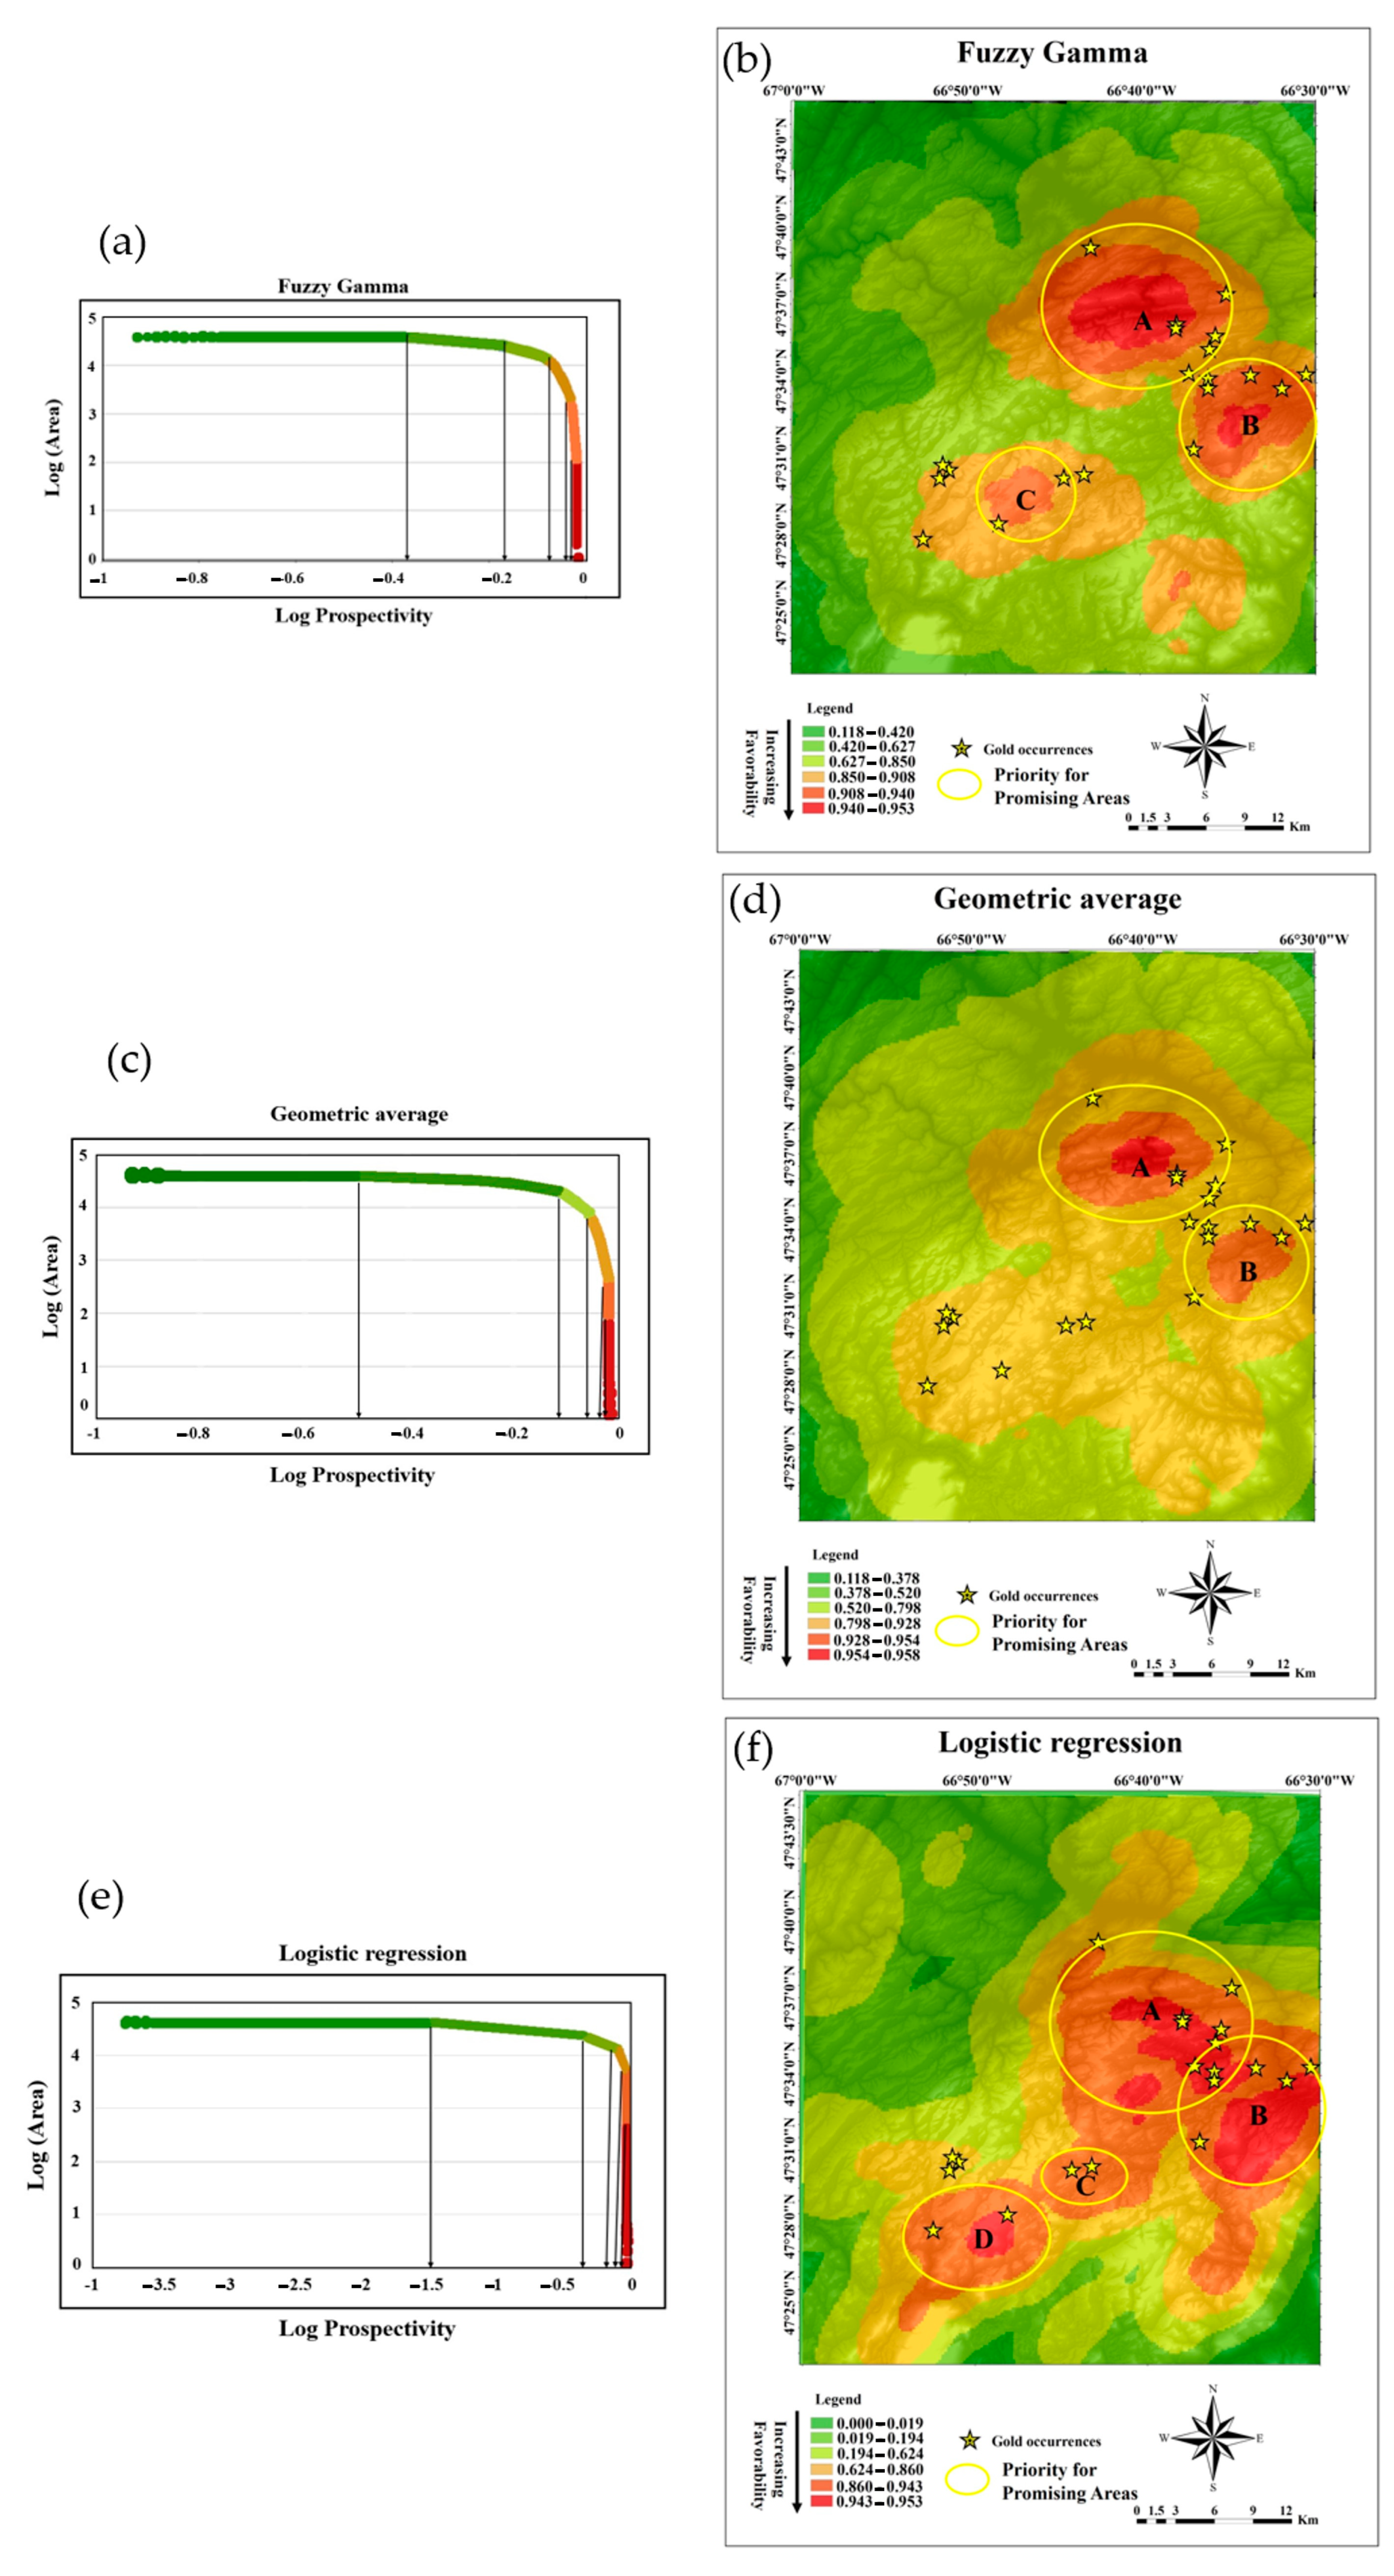
- The fuzzy gamma model delineated extensive, continuous zones with high potential. The geometric average method identified more localized but somewhat dispersed areas of interest. The logistic regression model generated sharply defined high-potential zones that closely corresponded with known occurrences. Integrating knowledge-driven approaches (fuzzy logic and geometric average) with a data-driven method (logistic regression) enhanced the accuracy and effectiveness of the prospectivity analysis.
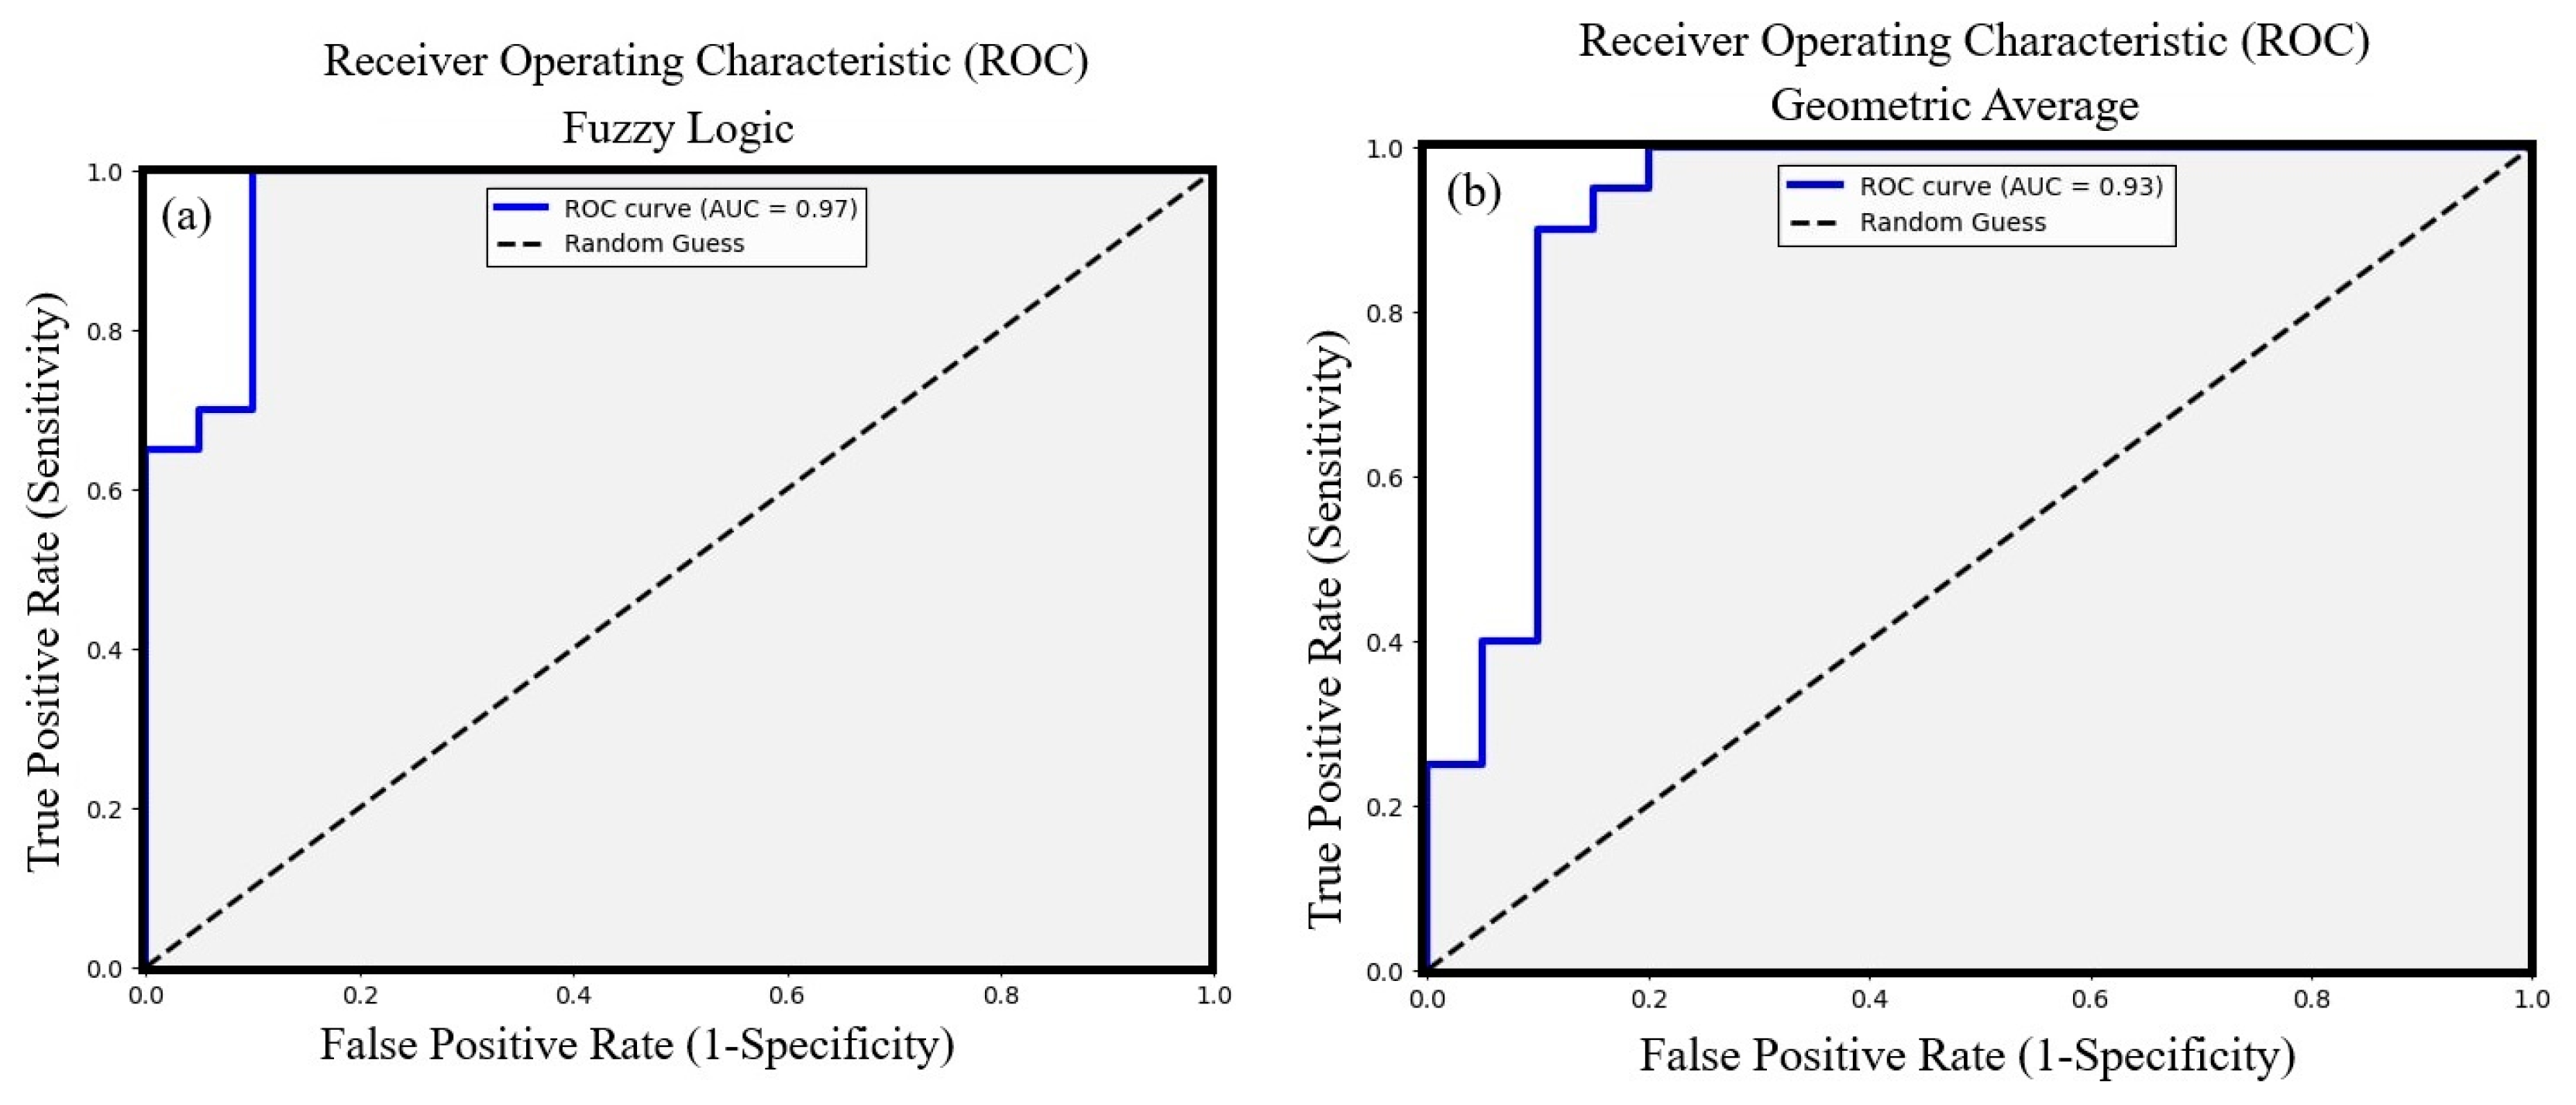
- The high area under the curve (AUC) values obtained from the receiver operating characteristic (ROC) curves validate the robustness and reliability of the MPM methods used in this study. Specifically, the fuzzy overlay model achieved the highest AUC (0.97), followed by the geometric average model (0.93). These values indicate strong predictive accuracy, confirming that the models effectively delineate high-favorability zones for epithermal gold mineralization in Northern New Brunswick.
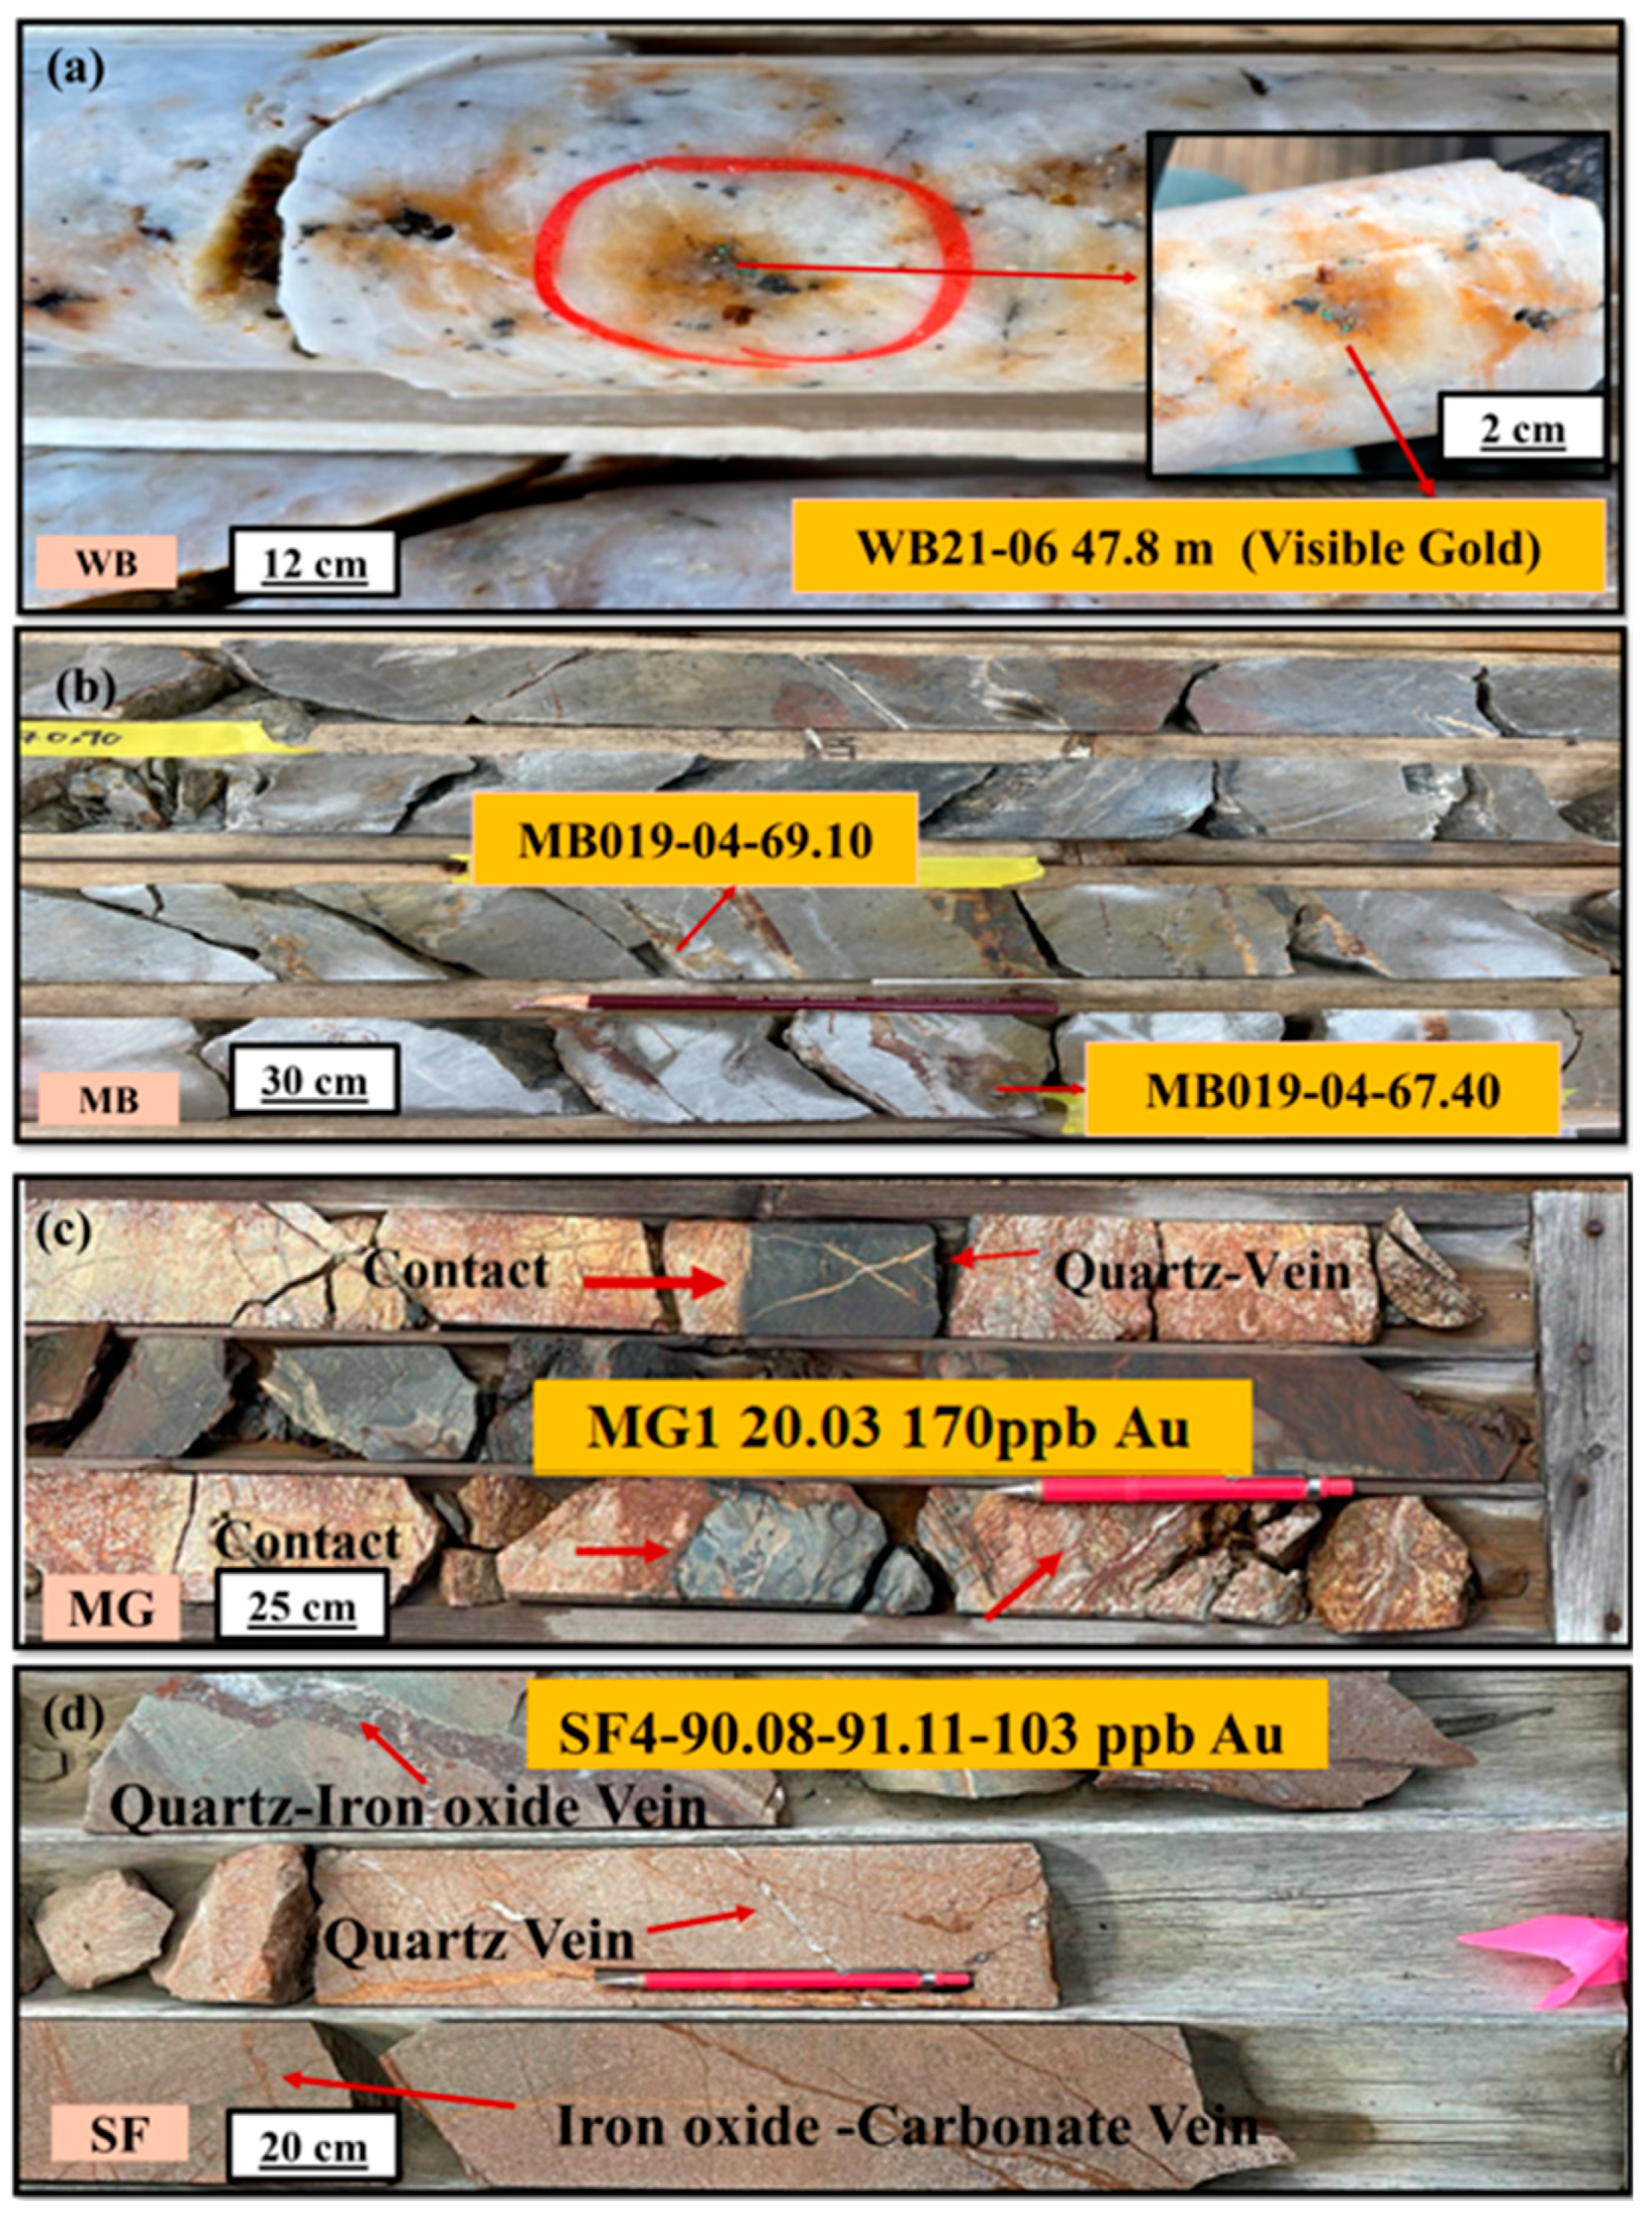
- The study identified indicator minerals and pathfinder elements that strongly correlate with high-potential zones. Drill core analysis confirmed the presence of gold-bearing quartz veins and associated mineralization, further reinforcing the accuracy of the MPM models.
- 6.
- Incorporate field-based validation (e.g., additional drilling or detailed mapping) in the newly identified high-favorability zones to confirm the presence of epithermal gold mineralization.
- 7.
- Explore machine-learning techniques beyond logistic regression (e.g., random forests or support vector machine) to capture nonlinear relationships and optimize predictive accuracy.
- 8.
- Acquire or integrate higher-resolution geophysical and geochemical datasets—where it is feasible to further reduce uncertainty and improve the spatial resolution of prospectivity maps.
- 9.
- Apply the presented methodology to related mineral deposit styles (e.g., orogenic gold, base-metal skarns) within the Appalachian or other structurally complex terrains, assessing model adaptability and limitations.
Author Contributions
Funding
Data Availability Statement
Acknowledgments
Conflicts of Interest
References
- Liu, L.; Lu, J.; Tao, C.; Liao, S.; Chen, S. GIS-Based Mineral Prospectivity Mapping of Seafloor Massive Sulfide on Ultraslow-Spreading Ridges: A Case Study of Southwest Indian Ridge 48.7–50.5° E. Nat. Resour. Res. 2021, 30, 971–987. [Google Scholar] [CrossRef]
- Li, C.; Xiao, K.; Sun, L.; Tang, R.; Dong, X.; Qiao, B.; Xu, D. CNN-Transformers for Mineral Prospectivity Mapping in the Maodeng–Baiyinchagan Area, Southern Great Xing’an Range. Ore Geol. Rev. 2024, 167, 106007. [Google Scholar] [CrossRef]
- Khammar, F.; Nykänen, V.; Beier, C.; Niiranen, T. Translating Mineral Systems Criteria into a Prospectivity Model for IOCG Deposits in the Kolari Region, Finland. Ore Geol. Rev. 2024, 174, 106326. [Google Scholar] [CrossRef]
- Khalifani, F.; Bahroudi, A.; Barak, S.; Abedi, M. An Integrated Fuzzy AHP-VIKOR Method for Gold Potential Mapping in Saqez Prospecting Zone, Iran. Earth Obs. Geomat. Eng. 2019, 3, 21–33. [Google Scholar]
- Josso, P.; Hall, A.; Williams, C.; Le Bas, T.; Lusty, P.; Murton, B. Application of Random-Forest Machine Learning Algorithm for Mineral Predictive Mapping of Fe-Mn Crusts in the World Ocean. Ore Geol. Rev. 2023, 162, 105671. [Google Scholar] [CrossRef]
- Yu, Z.; Li, B.; Wang, X. Mineral Prospectivity Mapping Susceptibility Evaluation Based on Interpretable Ensemble Learning. Ore Geol. Rev. 2024, 173, 106248. [Google Scholar]
- Karbalaeiramezanali, A.; Parsa, M.; Lentz, D.R.; Thorne, K.G. Prospectivity Modeling of Devonian Intrusion-Related W–Mo–Sb–Au Deposits in the Pokiok Plutonic Suite, West-Central New Brunswick, Canada, Using a Monte Carlo-Based Framework. Nat. Resour. Res. 2025, 34, 669–702. [Google Scholar]
- Liu, B.; Zheng, W.; Wang, L.; Li, C.; Kong, Y.; Tang, R.; Luo, D.; Xie, M. Mineral Exploration Model for Lhasa Area, Eastern Gangdese Metallogenic Belt: Based on Knowledge-Driven Compositional Data Analysis and Catchment Basin Division. J. Geochem. Explor. 2024, 259, 107415. [Google Scholar]
- Nykänen, V.; Törmänen, T.; Niiranen, T. Cobalt Prospectivity Using a Conceptual Fuzzy Logic Overlay Method Enhanced with the Mineral Systems Approach. Nat. Resour. Res. 2023, 32, 2387–2416. [Google Scholar] [CrossRef]
- Skirrow, R.G.; Murr, J.; Schofield, A.; Huston, D.L.; van der Wielen, S.; Czarnota, K.; Coghlan, R.; Highet, L.M.; Connolly, D.; Doublier, M.; et al. Mapping Iron Oxide Cu-Au (IOCG) Mineral Potential in Australia Using a Knowledge-Driven Mineral Systems-Based Approach. Ore Geol. Rev. 2019, 113, 103011. [Google Scholar] [CrossRef]
- Bonham-Carter, G.F.; Agterberg, F.P. Application of a Microcomputer-Based Geographic Information System to Mineral-Potential Mapping. In Microcomputer Applications in Geology 2; Elsevier: Amsterdam, The Netherlands, 1990; pp. 49–74. [Google Scholar] [CrossRef]
- Harris, J.R.; Grunsky, E.; Behnia, P.; Corrigan, D. Data- and Knowledge-Driven Mineral Prospectivity Maps for Canada’s North. Ore Geol. Rev. 2015, 71, 788–803. [Google Scholar] [CrossRef]
- Lawley, C.J.M.; Tschirhart, V.; Smith, J.W.; Pehrsson, S.J.; Schetselaar, E.M.; Schaeffer, A.J.; Houlé, M.G.; Eglington, B.M. Prospectivity Modelling of Canadian Magmatic Ni (±Cu ± Co ± PGE) Sulphide Mineral Systems. Ore Geol. Rev. 2021, 132, 103985. [Google Scholar] [CrossRef]
- Lauzon, D.; Gloaguen, E. Quantifying Uncertainty and Improving Prospectivity Mapping in Mineral Belts Using Transfer Learning and Random Forest: A Case Study of Copper Mineralization in the Superior Craton Province, Quebec, Canada. Ore Geol. Rev. 2024, 166, 105918. [Google Scholar] [CrossRef]
- Parsa, M.; Lentz, D.R.; Walker, J.A. Predictive Modeling of Prospectivity for VHMS Mineral Deposits, Northeastern Bathurst Mining Camp, NB, Canada, Using an Ensemble Regularization Technique. Nat. Resour. Res. 2023, 32, 19–36. [Google Scholar] [CrossRef]
- Boadi, B.; Sunder Raju, P.V.; Wemegah, D.D. Analysing Multi-Index Overlay and Fuzzy Logic Models for Lode-Gold Prospectivity Mapping in the Ahafo Gold District–Southwestern Ghana. Ore Geol. Rev. 2022, 148, 105059. [Google Scholar] [CrossRef]
- Wang, L.; Yang, J.; Wu, S.; Hu, L.; Ge, Y.; Du, Z. Enhancing Mineral Prospectivity Mapping with Geospatial Artificial Intelligence: A Geographically Neural Network-Weighted Logistic Regression Approach. Int. J. Appl. Earth Obs. Geoinf. 2024, 128, 103746. [Google Scholar] [CrossRef]
- Yousefi, M.; Carranza, E.J.M. Prediction-Area (P-A) Plot and C-A Fractal Analysis to Classify and Evaluate Evidential Maps for Mineral Prospectivity Modeling. Comput. Geosci. 2015, 79, 69–81. [Google Scholar] [CrossRef]
- Keykhay-Hosseinpoor, M.; Porwal, A.; Rajendran, K. Targeting Porphyry Cu Deposits in the Chahargonbad Region of Iran: A Joint Application of Deep Belief Networks and Random Forest Techniques. Geochemistry 2024, 84, 126155. [Google Scholar]
- van Staal, C.R. Pre-Carboniferous Tectonic Evolution and Metallogeny of the Canadian Appalachians. In Mineral Deposits of Canada: A Synthesis of Major Deposit Types, District Metallogeny, the Evolution of Geological Provinces and Exploration Methods; Geological Association of Canada: St. John’s, NL, Canada, 2007; pp. 793–818. [Google Scholar]
- Romer, R.L.; Kroner, U. Paleozoic Gold in the Appalachians and Variscides. Ore Geol. Rev. 2018, 92, 475–505. [Google Scholar] [CrossRef]
- Van Staal, C.R.; Whalen, J.B.; Valverde-Vaquero, P.; Zagorevski, A.; Rogers, N. Pre-Carboniferous, Episodic Accretion-Related, Orogenesis along the Laurentian Margin of the Northern Appalachians. Geol. Soc. Spec. Publ. 2009, 327, 271–316. [Google Scholar] [CrossRef]
- Hatcher, R.D. The Appalachian Orogen: A Brief Summary. In Memoir of the Geological Society of America; Geological Society of America: Boulder, CO, USA, 2010; Volume 206, pp. 1–19. [Google Scholar] [CrossRef]
- Van Wagoner, N.A.; Leybourne, M.I.; Dadd, K.A.; Baldwin, D.K.; McNeil, W. Late Silurian Bimodal Volcanism of Southwestern New Brunswick, Canada: Products of Continental Extension. Geol. Soc. Am. Bull. 2002, 114, 400–418. [Google Scholar]
- Sánchez-Mora, D.; McFarlane, C.R.M.; Walker, J.A.; Lentz, D.R. Geochemistry and U–Pb Geochronology of the Williams Brook Area, Tobique–Chaleur Zone, New Brunswick: Stratigraphic and Geotectonic Setting of Gold Mineralization. Can. J. Earth Sci. 2021, 58, 1040–1058. [Google Scholar] [CrossRef]
- Wilson, R.A.; van Staal, C.R.; Kamo, S.L. Rapid Transition from the Salinic to Acadian Orogenic Cycles in the Northern Appalachian Orogen: Evidence from Northern New Brunswick, Canada. Am. J. Sci. 2017, 317, 449–482. [Google Scholar] [CrossRef]
- Watters, S. Structure and Alteration Related to Hercynian Gold Deposition, Cape Spencer, New Brunswick, Canada. Ph.D. Thesis, Western University, London, ON, Canada, 1993. [Google Scholar]
- Goodfellow, W.D.; McCutcheon, S.R.; Peter, J.M. Massive Sulfide Deposits of the Bathurst Mining Camp, New Brunswick, and Northern Maine: Introduction and Summary of Findings. In Massive Sulfide Deposits of the Bathurst Mining Camp, New Brunswick, and Northern Maine; Society of Economic Geologists: Littleton, CO, USA, 2003. [Google Scholar] [CrossRef]
- McClenaghan, S.H.; Goodfellow, W.D.; Lentz, D.R. Gold in Massive Sulfide Deposits, Bathurst Mining Camp: Distribution and Genesis. In Massive Sulfide Deposits of the Bathurst Mining Camp, New Brunswick, and Northern Maine; Society of Economic Geologists: Littleton, CO, USA, 2003. [Google Scholar] [CrossRef]
- Lentz, D.R.; Thorne, K.; Yang, X.; Carroll, B.M.W. Preliminary Analysis of the Controls on the Various Episodes of Gold Mineralization at the Lake George Antimony Deposit, New Brunswick. Miner. Resour. Rep. MRR 2002, 4, 55–79. [Google Scholar]
- Morrissy, C. Gold Assessment at the Lake George Mine, York County, New Brunswick; New Brunswick Department of Natural Resources and Energy, Mineral Resources: Fredericton, NB, Canada, 1991. [Google Scholar]
- Corbett, G. Epithermal gold for explorationists. Appl. Geosci. Pract. Res. Aust. 2002, 67, 1-8–1-26. [Google Scholar]
- Fyffe, L.R.; Fricker, A. Tectonostratigraphic Terrane Analysis of New Brunswick. Atl. Geol. 1987, 23, 113–122. [Google Scholar] [CrossRef]
- Bernier, M.A.; Webber, G.R. Mineralogical and Geochemical Analysis of Shallow Overburden as an Aid to Gold Exploration in Southwestern Gaspésie, Quebec, Canada. J. Geochem. Explor. 1989, 34, 115–145. [Google Scholar] [CrossRef]
- Rodgers, J. The Tectonics of the Appalachians; John Wiley and Sons: New York, NY, USA, 1970; 271p. [Google Scholar]
- Wilson, R.A.; Kamo, S.L. The Salinic Orogeny in Northern New Brunswick: Geochronological Constraints and Implications for Silurian Stratigraphic Nomenclature. Can. J. Earth Sci. 2012, 49, 222–238. [Google Scholar] [CrossRef]
- Wilson, R.A. The Middle Paleozoic Rocks of Northern and Western New Brunswick, Canada; New Brunswick Department of Energy and Resource Development, Geological Surveys Branch: Fredericton, NB, Canada, 2017. [Google Scholar]
- John, D.A.; Vikre, P.G.; du Bray, E.A.; Blakely, R.J.; Fey, D.L.; Rockwell, B.W.; Mauk, J.L.; Anderson, E.D.; Graybeal, F.T. Descriptive Models for Epithermal Gold-Silver Deposits; Scientific Investigations Report; U.S. Geological Survey: Reston, VA, USA, 2018. [Google Scholar] [CrossRef]
- White, N.C.; Hedenquist, J.W. Epithermal Gold Deposits: STYLES, CHARACTERISTICS AND EXPLORATION. SEG Discov. 1995, 1–13. [Google Scholar] [CrossRef]
- Aminu, M.B.; Adiat, K.A.N.; Akinlalu, A.A.; Olomo, K.O.; Owolabi, T.O.; Aliyu, E.O. A Review on the Applications of Airborne Geophysical and Remote Sensing Datasets in Epithermal Gold Mineralisation Mapping. Geosystems Geoenvironment 2024, 3, 100284. [Google Scholar] [CrossRef]
- Yousefi, F.; White, T.; Lentz, D.R.; McFarlane, C.R.M.; Thorne, K.G. Middle Devonian Evandale Porphyry Cu-Mo (Au) Deposit, Southwestern New Brunswick, Canada: Analysis of Petrogenesis to Potential as a Source for Distal Intrusion-Related Epithermal Gold Mineralization. Ore Geol. Rev. 2023, 162, 105716. [Google Scholar] [CrossRef]
- Sánchez Mora, D. Petrogenesis of the Low Sulfidation Gold Mineralization in the Williams Brook Area, Tobique-Chaleur Zone, New Brunswick. Master’s Thesis, University of New Brunswick, Fredericton, NB, Canada, 2014. [Google Scholar]
- Khalifani, F.M.; Lentz, D.R.; Parsa, M.; Walker, J.A. Recognizing Gold Mineralization Pathfinders with Portable XRF and Micro-X-Ray Fluorescence Spectrometry in the Williams Brook Epithermal System, NB: Analysis of Indicator Elements and Minerals. Atl. Geosci. 2023, 59, 56. [Google Scholar]
- Khalifani, F.; Lentz, D.R.; Parsa, M.; Walker, J. Portable XRF-Aided Pattern Recognition for Characterization of Gold Mineralization in Northern New Brunswick. In Proceedings of the Exploration, Mining and Petroleum New Brunswick (EMP 2022), Fredericton, NB, Canada, 23–25 October 2022. [Google Scholar]
- Bustard, A.L.; Lentz, D.R. Characteristics and Structural Setting of Veinhosted Au-Ag-Pb-Zn Mineralization Associated with the Mulligan Gulch Porphyry, Northcentral New Brunswick; Geoscience Report; New Brunswick Department of Natural Resources and Energy Development: Fredericton, NB, Canada, 2024; Volume 33, p. 2024. [Google Scholar]
- Cheng, Q.; Agterberg, F.P.; Ballantyne, S.B. The Separation of Geochemical Anomalies from Background by Fractal Methods. J. Geochem. Explor. 1994, 51, 109–130. [Google Scholar] [CrossRef]
- Yousefi, M.; Carranza, E.J.M. Data-Driven Index Overlay and Boolean Logic Mineral Prospectivity Modeling in Greenfields Exploration. Nat. Resour. Res. 2016, 25, 3–18. [Google Scholar] [CrossRef]
- New Brunswick Department of Natural Resources (NBDNR). Bedrock Geology of New Brunswick. Minerals. Policy and Planning Division. Map NR-1 (2008 Edition). Scale 1:500000 (Revised 2008); New Brunswick Department of Natural Resources (NBDNR): Fredericton, NB, Canada, 2008. [Google Scholar]
- New Brunswick Department of Natural Resources (NBDNR). Till Geochemistry Data of New Brunswick. 2014. Available online: https://www2.gnb.ca/content/gnb/en/departments/erd/open-data/geochemistry.html (accessed on 1 January 2023).
- Mami Khalifani, F.; Bahroudi, A.; Aliyari, F.; Abedi, M.; Yousefi, M.; Mohammadpour, M. Generation of an Efficient Structural Evidence Layer for Mineral Exploration Targeting. J. Afr. Earth Sci. 2019, 160, 103609. [Google Scholar] [CrossRef]
- Khalifani, F.M.; Barak, S.; Abedi, M.; Yousefi, S. Gold Prospectivity Mapping through Generation and Integration of Geophysical, Geochemical, Remote Sensing, and Geological Evidence Layers in Saqez Area, NW Iran. Int. J. Min. Geo-Eng. 2023, 57, 351–363. [Google Scholar]
- Geological Survey of Canada (GSC). Aeromagnetic Data 1000m Campbelltown. 1986. Available online: https://Geophysical-Data.Canada.ca/Portal/Results?MinLong=-69.19&maxLong=-63.42&minLat=44.19&maxLat=49.59 (accessed on 1 January 2023).
- Geological Survey of Canada (GSC). Aeromagnetic Data 300m Campbelltown. 1987. Available online: https://Geophysical-Data.Canada.ca/Portal/Results?MinLong=-69.19&maxLong=-63.42&minLat=44.19&maxLat=49.59 (accessed on 1 January 2023).
- Cooper, G.R.J.; Cowan, D.R. Edge Enhancement of Potential-Field Data Using Normalized Statistics. Geophysics 2008, 73, H1–H4. [Google Scholar] [CrossRef]
- Baranov, V. A New Method For Interpretation Of Aeromagnetic Maps: Pseudo-gravimetric Anomalies. Geophysics 1957, 22, 359–382. [Google Scholar] [CrossRef]
- Feizi, F.; Karbalaei-Ramezanali, A.A.; Farhadi, S. Application of Multivariate Regression on Magnetic Data to Determine Further Drilling Site for Iron Exploration. Open Geosci. 2021, 13, 138–147. [Google Scholar] [CrossRef]
- Golshadi, Z.; Ramezanali, A.K.; Kafaei, K. Interpretation of Magnetic Data in the Chenar-e Olya Area of Asadabad, Hamedan Iran, Using Analytic Signal, Eulerdeconvolution, Horizontal Gradient and Tilt Derivative Methods. Boll. Geofis. Teor. Appl. 2016, 57, 329–342. [Google Scholar] [CrossRef]
- Almasi, A.; Yousefi, M.; Carranza, E.J.M. Erratum to “Prospectivity Analysis of Orogenic Gold Deposits in Saqez-Sardasht Goldfield, Zagros Orogen, Iran” Ore Geol. Rev. 91 (2017) 1066–1080. Ore Geol. Rev. 2018, 95, 1198. [Google Scholar] [CrossRef]
- Geological Survey of Canada (GSC). Airborne Radiometric Data 5000m National-Scale Maps. 1976. Available online: https://geophysical-data.canada.ca/Portal/Results?minLong=-69.19&maxLong=-63.42&minLat=44.19&maxLat=49.59 (accessed on 1 January 2023).
- Braga, L.P.V.; Braga, J. Mapping Gold Pathfinder Metal Ratios in Northern Nevada, USA: A Compositional Analysis Approach. J. Geochem. Explor. 2020, 219, 106616. [Google Scholar] [CrossRef]
- Khammar, F.; Yousefi, S.; Joonaghani, S.A. Analysis of Lithogeochemical Data Using Log-Ratio Transformations and C-A Fractal to Separate Geochemical Anomalies in Tak-Talar, Iran. Arab. J. Geosci. 2021, 14, 686. [Google Scholar] [CrossRef]
- Heidarian, H.; Lentz, D.R.; Thorne, K.; Rogers, N. Application of Portable X-Ray and Micro-X-Ray Fluorescence Spectrometry to Characterize Alteration and Mineralization within Various Gold Deposits Hosted in Southern New Brunswick, Canada. J. Geochem. Explor. 2021, 229, 106847. [Google Scholar] [CrossRef]
- Mohammadpour, M.; Bahroudi, A.; Abedi, M.; Rahimipour, G.; Jozanikohan, G.; Khalifani, F.M. Geochemical Distribution Mapping by Combining Number-Size Multifractal Model and Multiple Indicator Kriging. J. Geochem. Explor. 2019, 200, 13–26. [Google Scholar] [CrossRef]
- Aitchison, J. The Statistical Analysis of Compositional Data, Monographs on Statistics and Applied Probability, 1st ed.; Chapman and Hall: London, UK, 1986. [Google Scholar]
- Imamalipour, A.; Barak, S.; Khalifani, F.M. Quantifying Mass Changes during Hydrothermal Alteration in Listwaenite-Type Mercury Mineralization, Tavreh Area, Northwestern Iran. Geochem. Explor. Environ. Anal. 2020, 20, 425–439. [Google Scholar] [CrossRef]
- Yousefi, M.; Nykänen, V. Data-Driven Logistic-Based Weighting of Geochemical and Geological Evidence Layers in Mineral Prospectivity Mapping. J. Geochem. Explor. 2016, 164, 94–106. [Google Scholar] [CrossRef]
- Yousefi, M.; Kamkar-Rouhani, A.; Carranza, E.J.M. Geochemical Mineralization Probability Index (GMPI): A New Approach to Generate Enhanced Stream Sediment Geochemical Evidential Map for Increasing Probability of Success in Mineral Potential Mapping. J. Geochem. Explor. 2012, 115, 24–35. [Google Scholar] [CrossRef]
- Yousefi, M.; Carranza, E.J.M. Geometric Average of Spatial Evidence Data Layers: A GIS-Based Multi-Criteria Decision-Making Approach to Mineral Prospectivity Mapping. Comput. Geosci. 2015, 83, 72–79. [Google Scholar] [CrossRef]
- Zadeh, L.A. Fuzzy Sets. Inf. Control 1965, 8, 338–353. [Google Scholar] [CrossRef]
- Porwal, A.; Carranza, E.J.M.; Hale, M. Artificial Neural Networks for Mineral-Potential Mapping: A Case Study from Aravalli Province, Western India. Nat. Resour. Res. 2003, 12, 155–171. [Google Scholar] [CrossRef]
- Behera, S.; Panigrahi, M.K. Mineral Prospectivity Modelling Using Singularity Mapping and Multifractal Analysis of Stream Sediment Geochemical Data from the Auriferous Hutti-Maski Schist Belt, S. India. Ore Geol. Rev. 2021, 131, 104029. [Google Scholar] [CrossRef]
- Kim, Y.-H.; Choe, K.-U.; Ri, R.-K. Application of Fuzzy Logic and Geometric Average: A Cu Sulfide Deposits Potential Mapping Case Study from Kapsan Basin, DPR Korea. Ore Geol. Rev. 2019, 107, 239–247. [Google Scholar] [CrossRef]
- Kost, S.; Rheinbach, O.; Schaeben, H. Using Logistic Regression Model Selection towards Interpretable Machine Learning in Mineral Prospectivity Modeling. Geochemistry 2021, 81, 125826. [Google Scholar] [CrossRef]
- Porwal, A.; González-Álvarez, I.; Markwitz, V.; McCuaig, T.C.; Mamuse, A. Weights-of-Evidence and Logistic Regression Modeling of Magmatic Nickel Sulfide Prospectivity in the Yilgarn Craton, Western Australia. Ore Geol. Rev. 2010, 38, 184–196. [Google Scholar] [CrossRef]
- Zhao, J.; Sui, Y.; Zhang, Z.; Zhou, M. Application of Logistic Regression and Weights of Evidence Methods for Mapping Volcanic-Type Uranium Prospectivity. Minerals 2023, 13, 608. [Google Scholar] [CrossRef]
- Nykänen, V.; Salmirinne, H. Prospectivity Analysis of Gold Using Regional Geophysical and Geochemical Data from the Central Lapland Greenstone Belt, Finland; Special Paper of the Geological Survey of Finland 2007; Geological Survey of Finland: Espoo, Finland, 2007. [Google Scholar]
- Raines, G.L. Are Fractal Dimensions of the Spatial Distribution of Mineral Deposits Meaningful? Nat. Resour. Res. 2008, 17, 87–97. [Google Scholar] [CrossRef]
- Cheng, Q.; Agterberg, F.P. Multifractal Modeling and Spatial Point Processes. Math. Geol. 1995, 27, 831–845. [Google Scholar] [CrossRef]
- Zhao, J.; Chen, S.; Zuo, R.; Carranza, E.J.M. Mapping Complexity of Spatial Distribution of Faults Using Fractal and Multifractal Models: Vectoring towards Exploration Targets. Comput. Geosci. 2011, 37, 1958–1966. [Google Scholar] [CrossRef]
- Wang, G.; Zhang, S.; Yan, C.; Song, Y.; Sun, Y.; Li, D.; Xu, F. Mineral Potential Targeting and Resource Assessment Based on 3D Geological Modeling in Luanchuan Region, China. Comput. Geosci. 2011, 37, 1976–1988. [Google Scholar] [CrossRef]
- Mantilla-Dulcey, A.; Goyes-Peñafiel, P.; Báez-Rodríguez, R.; Báez-Rodríguez, R. Porphyry-Type Mineral Prospectivity Mapping with Imbalanced Data via Prior Geological Transfer Learning. Gondwana Res. 2024, 136, 236–250. [Google Scholar] [CrossRef]
- Fawcett, T. An Introduction to ROC Analysis. Pattern Recognition Letters. Pattern Recognit. Lett. 2006, 27, 861–874. [Google Scholar]
- Nykänen, V.; Niiranen, T.; Molnár, F.; Lahti, I.; Korhonen, K.; Cook, N.; Skyttä, P. Optimizing a Knowledge-Driven Prospectivity Model for Gold Deposits Within Peräpohja Belt, Northern Finland. Nat. Resour. Res. 2017, 26, 571–584. [Google Scholar] [CrossRef]
- Wyborn, L.A.I.; Heinrich, C.A.; Jaques, A.L. Australian Proterozoic Mineral Systems: Essential Ingredients and Mappable Criteria. In Proceedings of the 1994 AusIMM Annual Conference, Darwin, Australia, 5–9 August 1994; Australasian Institute of Mining and Metallurgy: Melbourne, Australia, 1994. [Google Scholar]
- McCuaig, T.C.; Hronsky, J. The Mineral Systems Concept: The Key to Exploration Targeting. Appl. Earth Sci. 2017, 126, 77–78. [Google Scholar] [CrossRef]
- Hagemann, S.G.; Lisitsin, V.A.; Huston, D.L. Mineral System Analysis: Quo Vadis. Ore Geol. Rev. 2016, 76, 504–522. [Google Scholar]
- Kreuzer, O.P.; Etheridge, M.A.; Guj, P.; McMahon, M.E.; Holden, D.J. Linking Mineral Deposit Models to Quantitative Risk Analysis and Decision-Making in Exploration. Econ. Geol. 2008, 103, 829–850. [Google Scholar] [CrossRef]
- Hronsky, J.M.A.; Groves, D.I. Science of Targeting: Definition, Strategies, Targeting and Performance Measurement. Aust. J. Earth Sci. 2008, 55, 3–12. [Google Scholar] [CrossRef]
- McCuaig, T.C.; Beresford, S.; Hronsky, J. Translating the Mineral Systems Approach into an Effective Exploration Targeting System. Ore Geol. Rev. 2010, 38, 128–138. [Google Scholar] [CrossRef]
- Li, T.; Xia, Q.; Zhao, M.; Gui, Z.; Leng, S. Prospectivity Mapping for Tungsten Polymetallic Mineral Resources, Nanling Metallogenic Belt, South China: Use of Random Forest Algorithm from a Perspective of Data Imbalance. Nat. Resour. Res. 2020, 29, 203–227. [Google Scholar] [CrossRef]
- Gabo-Ratio, J.A.; Buena, A.E.; Villaplaza, B.R.B.; Payot, B.D.; Dimalanta, C.B.; Queaño, K.L.; Andal, E.S.; Yumul, G.P. Epithermal Mineralization of the Bonanza-Sandy Vein System, Masara Gold District, Mindanao, Philippines. J. Asian Earth Sci. X 2020, 4, 100041. [Google Scholar] [CrossRef]
- Groves, D.I.; Goldfarb, R.J.; Knox-Robinson, C.M.; Ojala, J.; Gardoll, S.; Yun, G.Y.; Holyland, P. Late-Kinematic Timing of Orogenic Gold Deposits and Significance for Computer-Based Exploration Techniques with Emphasis on the Yilgarn Block, Western Australia. Ore Geol. Rev. 2000, 17, 1–38. [Google Scholar] [CrossRef]
- Goldfarb, R.J.; Groves, D.I.; Gardoll, S. Orogenic Gold and Geologic Time: A Global Synthesis. Ore Geol. Rev. 2001, 18, 1–75. [Google Scholar] [CrossRef]
- Gahlan, H.A.; Azer, M.K.; Asimow, P.D.; Al-Kahtany, K.M. Formation of Gold-Bearing Listvenite in the Mantle Section of the Neoproterozoic Bir Umq Ophiolite, Western Arabian Shield, Saudi Arabia. J. Afr. Earth Sci. 2022, 190, 104517. [Google Scholar] [CrossRef]
- Hafezi, A.; Asadi Haroni, H.; Tabatabaei, S.H.; Esmaeiloghli, S. Adopting a Cell-Based Method to Identify Mineralized Geological Structures in Support of Mineral Prospectivity Mapping at the Kuh–Lakht Epithermal Gold Deposit, Central Iran. Ore Geol. Rev. 2024, 171, 106175. [Google Scholar] [CrossRef]
- Geological Survey of Canada (GSC). Airborne Radiometric Data 1000m National-Scale Maps. 1976. Available online: https://geophysical-data.canada.ca/Portal/Results?minLong=-69.19&maxLong=-63.42&minLat=44.19&maxLat=49.59 (accessed on 1 January 2023).


| Fundamental Processes of the Gold Mineralization | Outline of Targeting Criteria | Predictor Maps | Source of Data | Practices Employed | Figure |
|---|---|---|---|---|---|
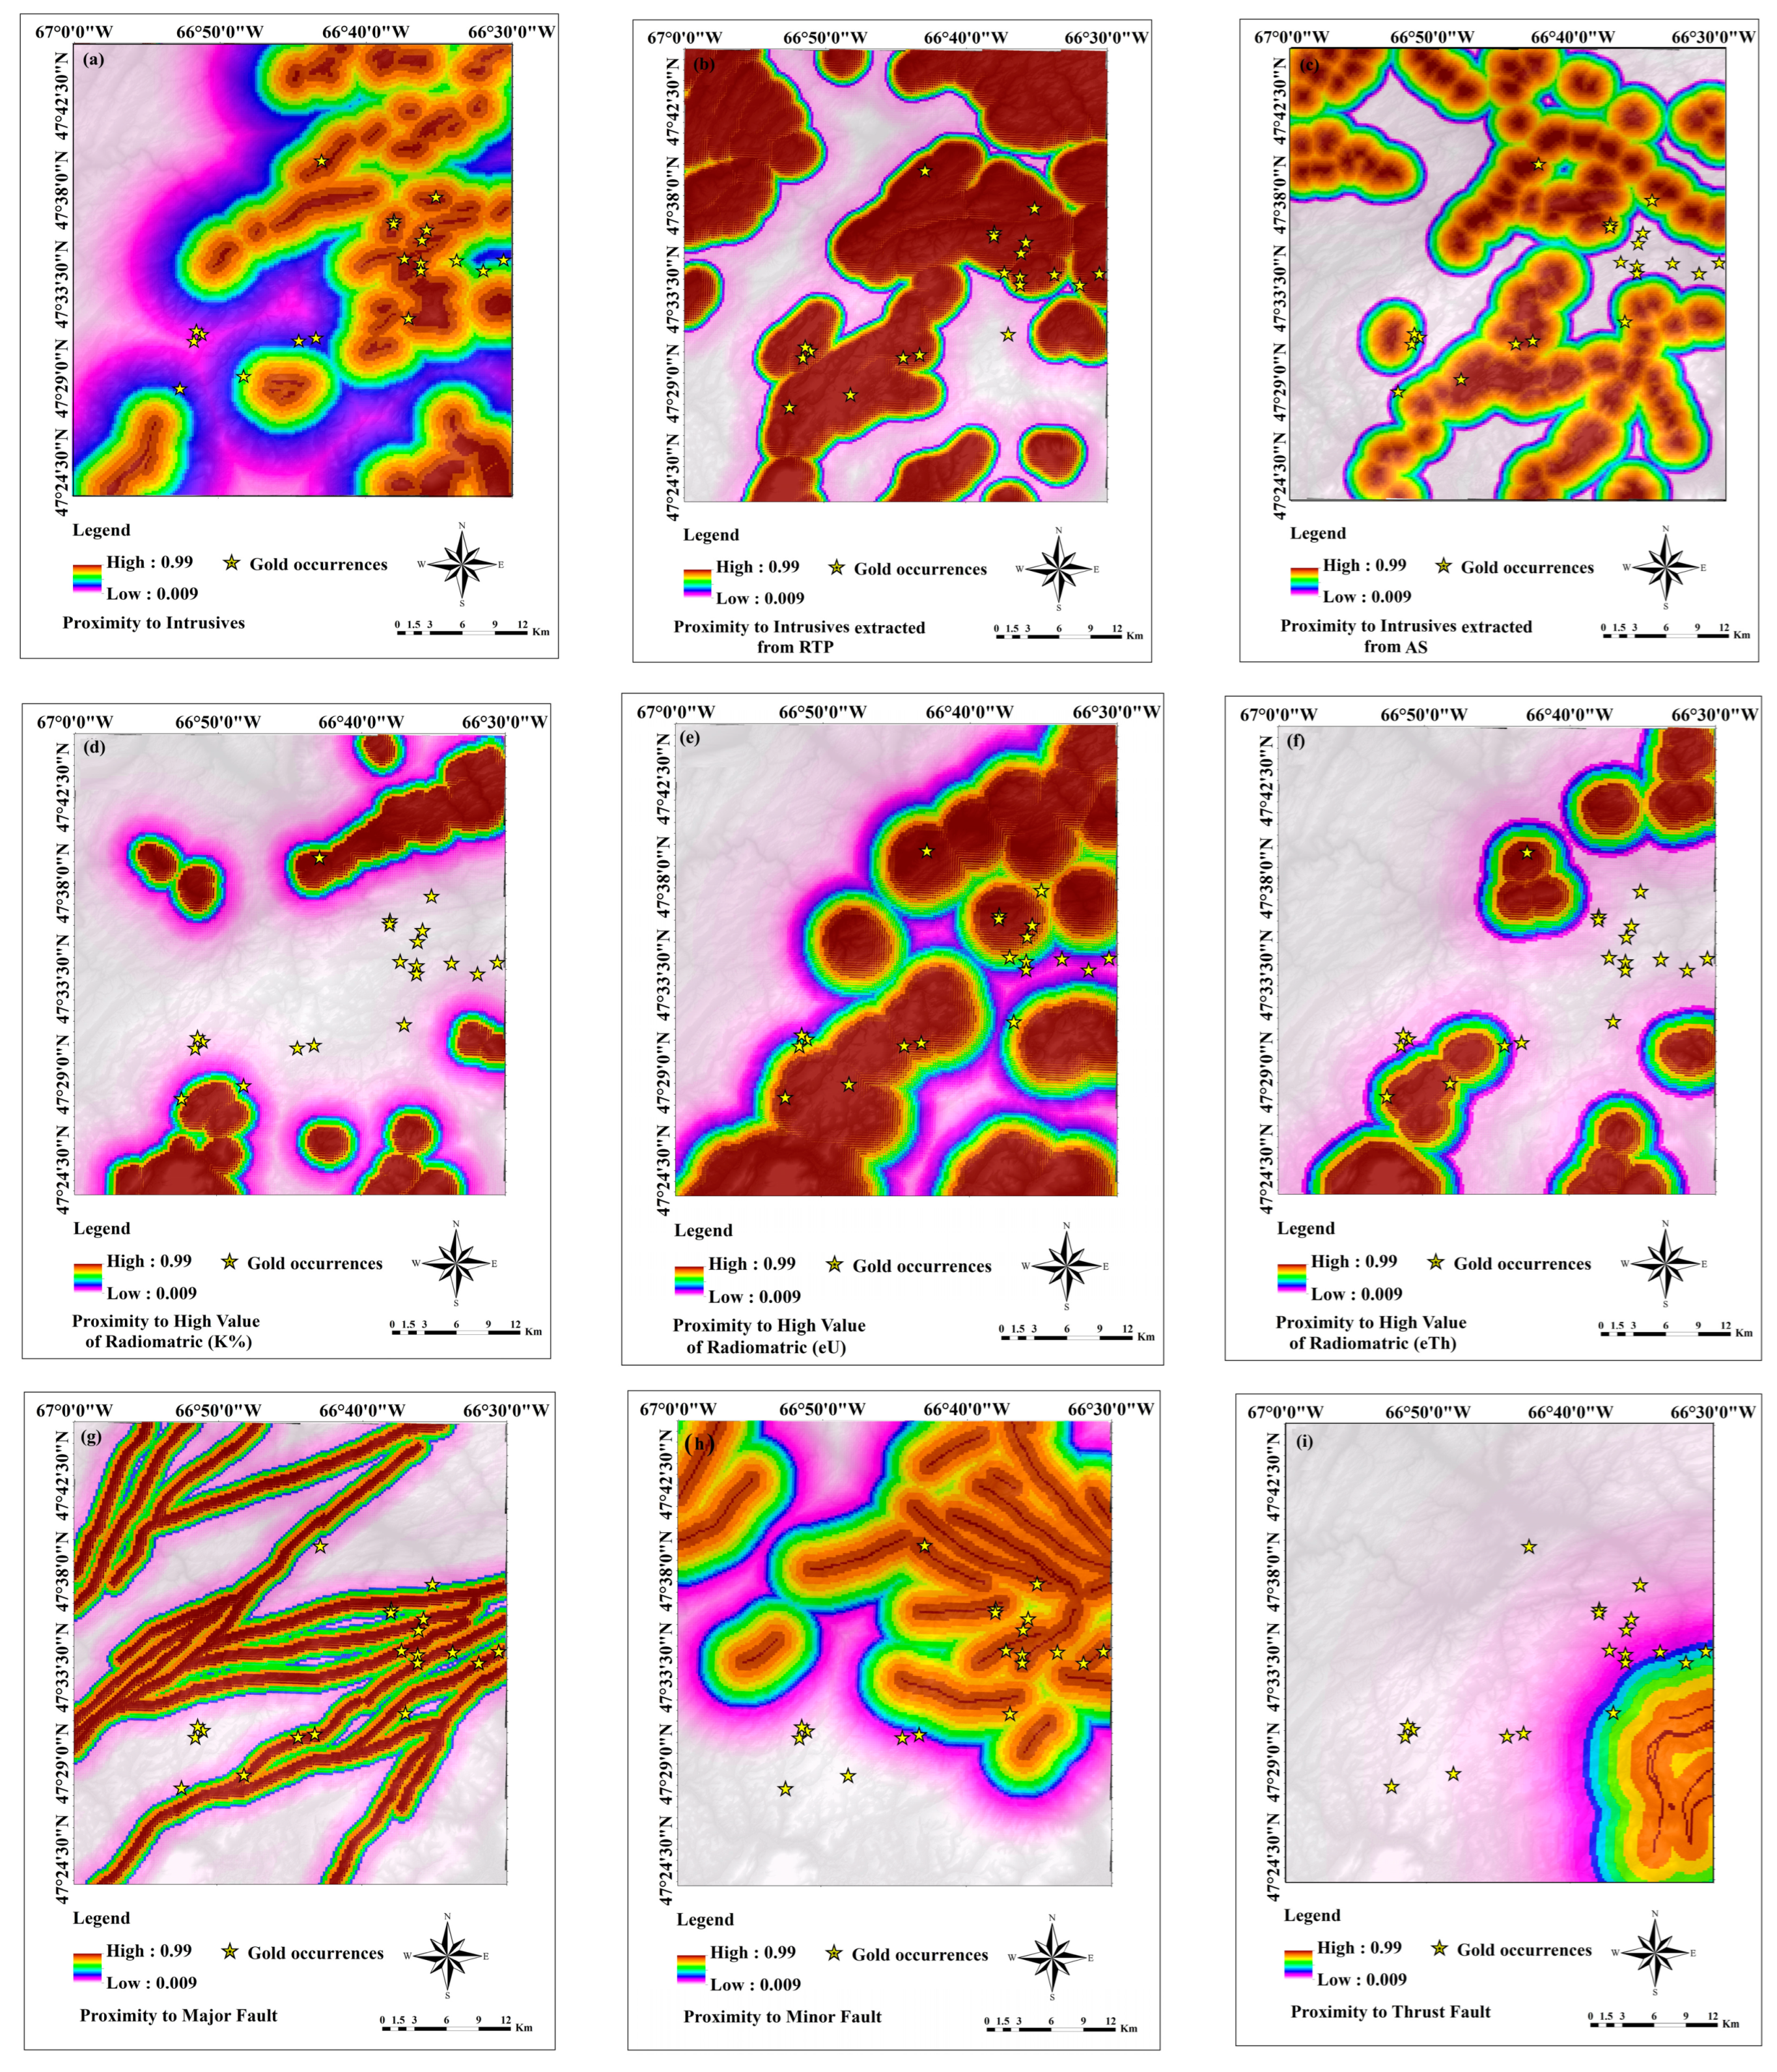
| Source | Tobique Group and Chaleurs Group mafic and felsic intrusive rocks with Silurian-Devonian aged | Ramsay Brook Gabbro, Upsalquitch Lake Gabbro, Silurian Felsic Intrusive, Portage Brook Troctolite mafic intrusive, Mulligan Gulch Porphyry felsic intrusive, Mount Bailey Granite, Mount LaTour Gabbro, Mount Elizabeth Gabbro, Mount Elizabeth Granite | 1:50,000 bedrock geology maps (21O/10 & 21O/07) [48] | The Euclidean distance was calculated using intrusive rocks, including both Granite and Gabbro units. | Figure 5a |
| High values of RTP and Analytic Signal | Campbelltown aeromagnetic data with 200 m resolution [52] Bathurst aeromagnetic data with 75 m resolution [53] | After applying the reduction to the pole (RTP) and analytic signal (AS) filters, the Euclidean distance was determined from the RTP anomalous regions [19]. | Figure 5b,c | ||
| High values of K, eU, and eTh, | Campbelltown radiometric data with 100 m resolution [52] Campbelltown radiometric data with 1000 m resolution [96] | The Euclidean distance was computed using the radiometric K, eU, and eTh elements. | Figure 5d–f | ||
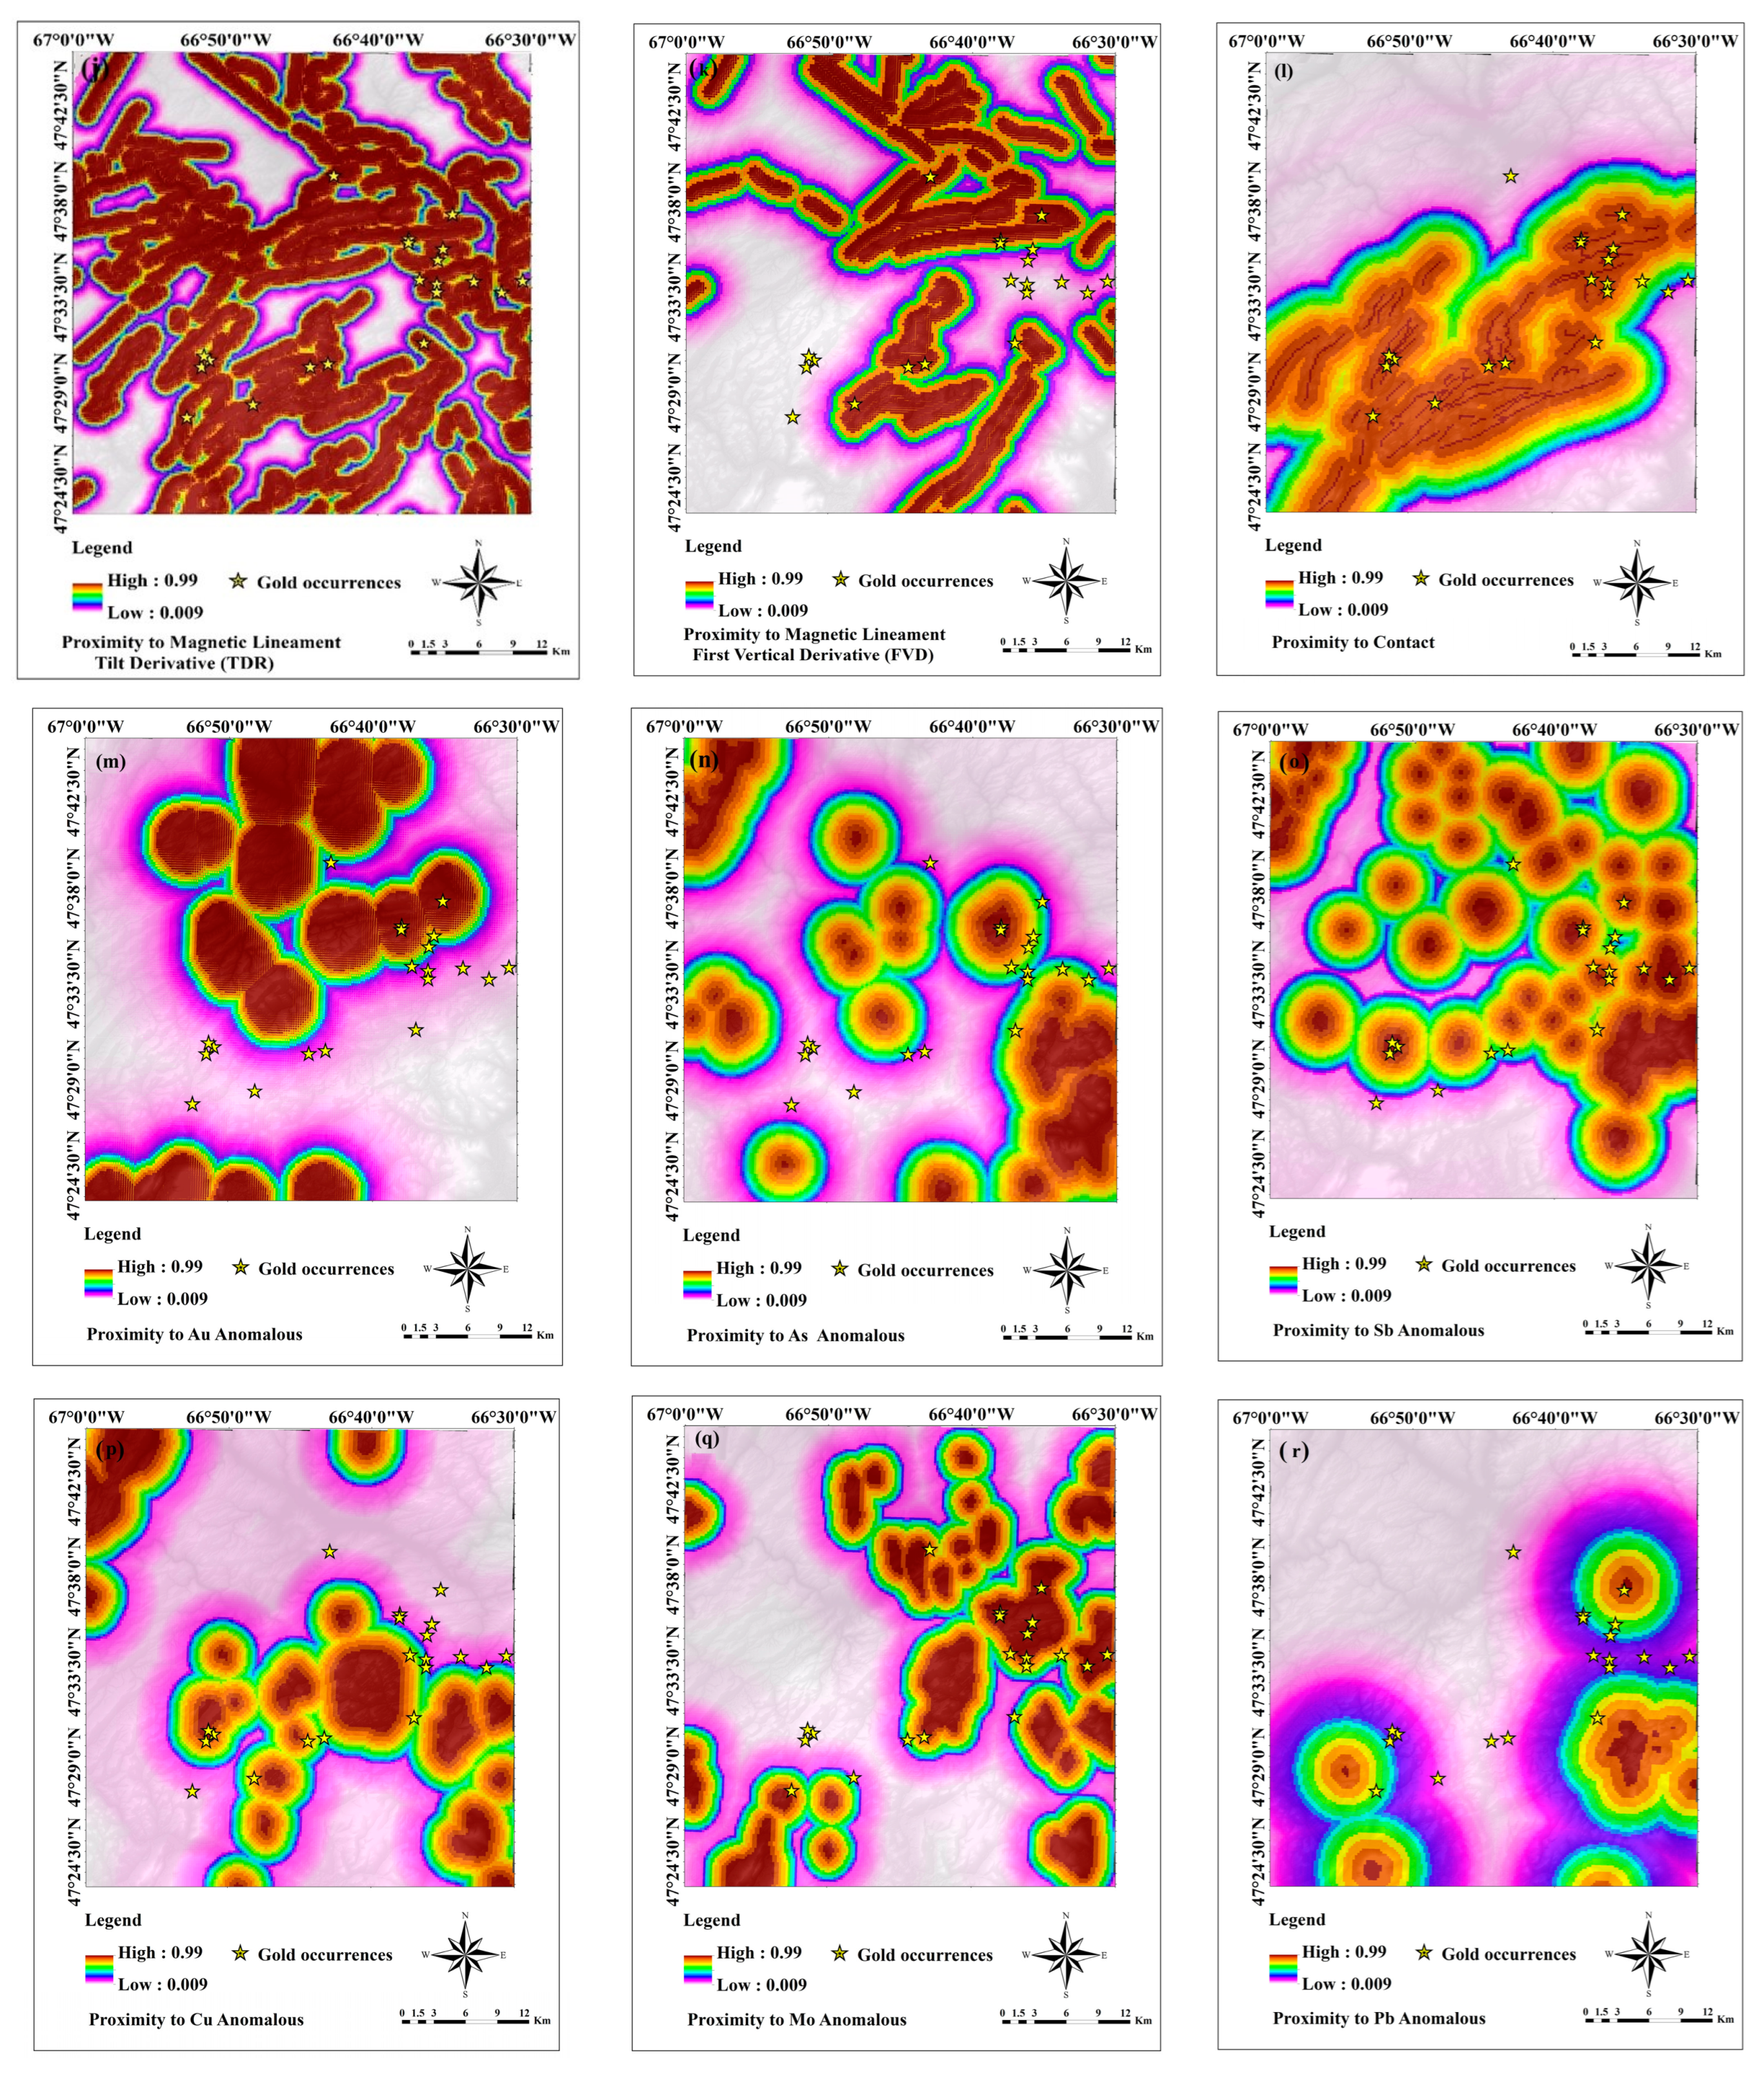
| Pathway of hydrothermal fluid | Faults, lineament, and lithological contacts | Proximity to mapped major, minor, and thrust faults | 1:500,000 bedrock geology map [48] | Major, minor, and thrust faults were identified through geological map analysis, and the Euclidean distance from these fault structures was subsequently calculated. | Figure 5g–i |
| Proximity to extracted Magnetic lineament features using the value of tilt derivative (TDR) and first vertical derivative (FVD) | Campbelltown aeromagnetic data with 200 m resolution [52] Bathurst aeromagnetic data with 75 m resolution [53] | Shallow and deep magnetic structures were highlighted using various derivative-based techniques, including the tilt derivative and first vertical derivative. Following this enhancement, the Euclidean distance to the identified structures was calculated [19]. | Figure 5j,k | ||
| Proximity to lithological contacts | 1:500,000 bedrock geology map [48] | Faults were identified through the analysis of geological maps, and the Euclidean distance to these fault structures was then calculated. | Figure 5l | ||
| Trap and metal deposition and emplacement | Geochemical indicator elements | Anomalous signature of Au, As, Cu, Mo, Pb, Sb, Zn, and W elements | Geochemical till data collected at 2000 m sampling intervals [49] | Gold pathfinder geochemical signatures were analyzed after applying a central log-ratio transformation, and Euclidean distances to anomalous basins were calculated. | Figure 5m–t |
| Host rocks | Proximity to Greys Gulch Formation felsic, mafic volcanic and sedimentary rocks, Wapske Formation felsic and mafic volcanic, Wapske Formation mixed volcanic and sedimentary, Free Grant Formation sedimentary rocks | 1:50,000 bedrock geology maps (21O/10 & 21O/07) [48] | Euclidean distances to felsic and mafic volcanic rocks were calculated. | Figure 5u |
Disclaimer/Publisher’s Note: The statements, opinions and data contained in all publications are solely those of the individual author(s) and contributor(s) and not of MDPI and/or the editor(s). MDPI and/or the editor(s) disclaim responsibility for any injury to people or property resulting from any ideas, methods, instructions or products referred to in the content. |
© 2025 by the authors. Licensee MDPI, Basel, Switzerland. This article is an open access article distributed under the terms and conditions of the Creative Commons Attribution (CC BY) license (https://creativecommons.org/licenses/by/4.0/).
Share and Cite
Mami Khalifani, F.; Lentz, D.R.; Walker, J.A.; Khammar, F. Applying Mineral System Criteria to Develop a Predictive Modelling for Epithermal Gold Mineralization in Northern New Brunswick: Using Knowledge-Driven and Data-Driven Methods. Minerals 2025, 15, 345. https://doi.org/10.3390/min15040345
Mami Khalifani F, Lentz DR, Walker JA, Khammar F. Applying Mineral System Criteria to Develop a Predictive Modelling for Epithermal Gold Mineralization in Northern New Brunswick: Using Knowledge-Driven and Data-Driven Methods. Minerals. 2025; 15(4):345. https://doi.org/10.3390/min15040345
Chicago/Turabian StyleMami Khalifani, Farzaneh, David R. Lentz, James A. Walker, and Fereshteh Khammar. 2025. "Applying Mineral System Criteria to Develop a Predictive Modelling for Epithermal Gold Mineralization in Northern New Brunswick: Using Knowledge-Driven and Data-Driven Methods" Minerals 15, no. 4: 345. https://doi.org/10.3390/min15040345
APA StyleMami Khalifani, F., Lentz, D. R., Walker, J. A., & Khammar, F. (2025). Applying Mineral System Criteria to Develop a Predictive Modelling for Epithermal Gold Mineralization in Northern New Brunswick: Using Knowledge-Driven and Data-Driven Methods. Minerals, 15(4), 345. https://doi.org/10.3390/min15040345