Article

Mapping Bronze Disease Onset by Multispectral Reflectography

1
National Research Council—National Institute of Optics (CNR-INO), Largo E. Fermi 6, 50125 Florence, FI, Italy
2
Department of Sciences of Antiquity, “La Sapienza” University of Rome, Piazzale Aldo Moro 5, 00186 Rome, RM, Italy
3
Department of Chemistry “Ugo Schiff” and CSGI Consortium, University of Florence, Via della Lastruccia 3-13, 50019 Sesto Fiorentino, FI, Italy
*
Author to whom correspondence should be addressed.
Minerals 2025, 15(3), 252; https://doi.org/10.3390/min15030252
Submission received: 7 January 2025 / Revised: 24 February 2025 / Accepted: 26 February 2025 / Published: 28 February 2025
(This article belongs to the Special Issue Spectral Behavior of Mineral Pigments, Volume II)

Abstract

:
The early detection of bronze disease is a significant challenge not only in conservation science but also in various industrial fields that utilize copper alloys (i.e., shipbuilding and construction). Due to the aggressive nature of this corrosion pathway, developing methods for its early detection is pivotal. The presence of copper trihydroxychlorides is the main key indicator of the ongoing autocatalytic process. Commonly used for pigment identification, reflectance imaging spectroscopy (RIS) or fiber optics reflectance spectroscopy (FORS) was recently employed for mapping atacamite distribution in extended bronze corrosion patinas. In this work, we detected the onset of bronze disease using visible–near-infrared (VIS-NIR) multispectral reflectography, which allowed for disclosing features that were poorly detectable to the naked eye. The image cube was analyzed using the spectral correlation mapper (SCM) algorithm to map the distribution of copper trihydroxychlorides. FORS and Raman spectroscopy were employed to characterize the patina composition and validate RIS data. A set of bronze samples, representative of Florentine Renaissance workshops, was specifically realized for the present study and artificially aged at different corrosion stages.

Graphical Abstract

1. Introduction

Studying heritage artifacts provides insights into their materials, production processes, and states of conservation, enabling the development of appropriate preservation strategies [1]. Despite the large variety of techniques available for investigating Cultural Heritage objects, only a few ensure a complete and non-invasive analysis [2]. The preciousness and uniqueness of artworks have fostered the research in the field of heritage science on defining and optimizing analytical techniques and protocols that do not involve either sampling or the use of radiation-intensive probes [3].
In this regard, fiber optic reflectance spectroscopy (FORS) and reflectance imaging spectroscopy (RIS), often in synergy with molecular or elemental analysis, are among the most common non-invasive methods for the study of Cultural Heritage materials such as pigments, dyes, inks, etc. [3,4]. RIS in the infrared spectral region is best known for its effectiveness in visualizing underpaintings and underdrawings [5,6,7]. In recent years, both methods have been applied separately for the surface characterization and mapping of compounds typically found in bronze patinas [4,8,9].
Usually, the study of minerals and pigments is decoupled from the identification of metal patinas and corrosion products typically found on Cultural Heritage objects [10]. However, the same compounds found in pigments can also be produced by metal degradation, resulting in the chance of characterizing the same materials from different perspectives. For instance, bronze corrosion products such as azurite, malachite, atacamite, paratacamite, and botallackite are also known as pigments on paintings, manuscripts, and sculptures [4,11,12].
The identification of copper trihydroxychlorides (Cu2(OH)3Cl), i.e., the polymorphs atacamite, botallackite, and clinoatacamite and the separate phase paratacamite, is pivotal during the study of bronze corrosion process. The presence of these substances is the main symptom of bronze disease, an autocatalytic electrolytic corrosion pathway.
In the presence of high humidity and temperature, chloride ions (Cl) can penetrate the protective layer of cuprite (Cu2O, which forms spontaneously by the reaction between copper and oxygen) and react with the underlying copper to form nantokite (CuCl) [4,13]. The dissolution of nantokite forms porous cuprite and HCl, which reacts with copper to yield fresh nantokite, in a cyclic process [13,14,15]. The attack on the alloy by HCl and the continued conversion of Cu to CuCl may result in typical pitting corrosion and loss of mechanical properties, possibly causing the irreversible disruption of the whole object [16]. The formation of an outer layer of copper trihydroxychlorides from the reaction of nantokite with water and oxygen is the most evident consequence of the onset of bronze disease [17]. Moreover, the conversion of nantokite to copper trihydroxychlorides induces mechanical stress due to their larger volume, resulting in cracking or fragmentation of the surface [18]. The layered structure of bronze disease patinas makes identifying corrosion products challenging. Although nantokite is the phenomenon’s root, it is hardly accessible since it forms beneath the outermost layer of cuprite. Identifying copper trihydroxychlorides is generally easier, as they appear on the surface of objects [13,14]. However, the atacamite group can be confused or obscured by other similarly colored compounds, such as harmless malachite or azurite [4]. Discriminating between these products and harmless ones is crucial both to determine the conservation status of the artwork and to guide selective cleaning operations.
In the last two decades, the most widely used techniques (often in synergy) for the detection and characterization of bronze corrosion products are optical microscopy (OM), scanning electron microscopy (SEM) coupled with energy-dispersive X-ray spectroscopy (EDS), X-ray diffraction (XRD), and X-ray photoelectron spectroscopy (XPS) [19,20,21,22,23,24], alongside Raman spectroscopy (RS) and X-ray fluorescence (XRF) [25,26,27,28,29,30]. Additionally, techniques that are often employed in other research topics, such as laser-induced breakdown spectroscopy (LIBS) [31], X-ray computer micro-tomography (micro CT) [32,33], and voltammetry of immobilized microparticles (VIMPs) [34,35,36], are receiving increased attention for the detection of bronze disease. Most of them are invasive or require sampling, hampering their use. Therefore, new non-invasive methodologies based on reflectance spectroscopy and machine learning methods, developed purposely to detect bronze disease by mapping the presence of copper trihydroxychlorides [4,8,9], pave the way for a novel diagnostic approach.
FORS is effective for monitoring corrosion and detecting atacamite spots in inhomogeneous patinas. It enables the discrimination of atacamite and nantokite (CuCl) from other non-injurious corrosion products, such as azurite and malachite, as these different mineralizations feature distinctive spectral characteristics in the 1000–2500 nm range [4]. The relatively low spatial resolution (in the millimetric scale for most devices) and the difficulty in identifying components in mixtures are the main limitations of the technique [4]. However, recent applications of machine learning algorithms to FORS spectra have allowed for the discrimination of individual compounds in mixtures [8]. Currently, the small databases available enable the recognition of a limited number of corrosion products [8].
In the last few years, visible (VIS), near infrared (NIR), and shortwave infrared (SWIR) hyperspectral imaging has been proposed for the analysis of metal artifacts. Promising results have been obtained in both the discrimination between pure metals and alloys [37] and the identification of bronze corrosion products, such as copper oxides, chlorides, carbonates, and phosphates, based on their features in reflectance spectra [9,38]. Of particular relevance are the methods that enable the mapping of copper trihydroxychloride distribution by spectral correlation mapper (SCM) analysis [38] and the automatic detection by machine learning algorithms for spectral clustering [9].
To date, reflectance spectroscopy has been mainly used to distinguish corrosion products on extensive and visible patinas, but it has not been explicitly applied to the early diagnosis of bronze disease. Given the aggressiveness and the autocatalytic nature of this corrosion pathway, recognizing the phenomenon in the early stage is crucial for the preservation of copper alloy artifacts.
This work focuses on the application of non-invasive spectroscopic techniques, either imaging or point-wise, to detect the onset of bronze disease before it becomes visible to the naked eye. To this end, twelve bronze samples were artificially aged at different stages of corrosion (from fresh to highly corroded) and characterized using a multi-analytical approach based on VIS-NIR multispectral reflectography, FORS, and Raman spectroscopy.
Data collected by VIS-NIR multispectral reflectography were processed with false-color imaging (IR-FC) [39,40] and principal component analysis (PCA) [41,42], allowing for revealing poorly detectable surface characteristics. The multispectral image cube was analyzed using the spectral correlation mapper (SCM) algorithm [43,44], which enabled the mapping of the distribution of copper trihydroxychlorides and cuprite on the samples’ surfaces. An in-house-developed software was used to perform color difference mapping between fresh and corroded bronze. Fiber optics reflectance spectroscopy and Raman spectroscopy enabled the characterization of patina constituents, integrating and validating RIS data.

2. Materials and Methods

2.1. Samples

A set of twelve bronze samples was cast in plates by Fonderia Artistica Art’ù (Florence, Italy), then sawed in squared coupons (3.7 × 3.7 × 0.5 cm3), and polished using a Dremel rotary tool (sanding band sleeve grit 240). The quaternary alloy 85Cu-5Sn-5Zn-5Pb was chosen as representative of Florentine Renaissance workshops [45,46]. The bronze composition was assessed by XRF (Table 1) using the portable energy-dispersive XRF spectrometer ELIO (XGLab SRL, Milan, Italy) (rhodium anode; accelerating voltage: 40 kV; electron current: 40 µA; integration time: 60 s; spot diameter: 3 mm; energy resolution on the Mn-kα line: 125 eV; X-ray beam incidence angle: 68°; detection angle: 63.5°). Calibration was performed using MBH Cu-based certified reference materials (32XLB12 and 32XSN6, LGC, ARMI|MBH Analytical, Manchester, NH, USA).
Bronze coupons were aged in the presence of acid vapors (HCl 1.0 M) and high relative humidity (~100%) inside sealed glass jars placed in a heated stove at 50 °C for an increasing time from 0 to 143 h (Table 2) [16]. The time intervals were selected based on our previous experiments and the visual appearance of the sample surface to produce a wide range of patinas.

2.2. VIS-NIR Multispectral Imaging

The multispectral VIS-NIR scanner developed at CNR-INO (Florence, Italy) [47] was used to collect a spectral cube consisting of 32 narrow-band images (16 VIS and 16 NIR) collected simultaneously in the range 380–2550 nm by point-wise scanning (XY) of the surface. The spectral resolution was 20–30 nm in the 380–750 nm range and 50–100 nm in the 750–2500 nm range. The scanner featured an optical head with the illumination sources and the collection catoptric lens in a 45°/0° illumination/detection geometry. The catoptric lens focused the radiation back-scattered by the object on the entrance end of a 6 by 6 square-shaped fiber bundle (250 micron spacing between adjacent fibers). At the output end, each fiber was connected to a photodiode equipped with an interference filter for band selection. The lighting system included two narrow-spot white LEDs and two low-voltage current-stabilized halogen lamps that uniformly irradiated a 5 cm2 area with a total irradiance comparable to sunlight conditions (109 klx). The continuous motion of the sources prevented significant surface heating (less than 4 °C) [48]. An autofocus system, based on a triangulation optical probe, a Z translation stage, and in-house software kept the optical head at the right distance during scanning. Calibration was performed using a certified white 99% reflectance reference standard (Spectralon, Labsphere®, North Sutton, NH, USA) and measuring the background noise. Data were collected with a sampling step of 250 µm, a speed of 500 mm/s, and an exposure time of 0.5 ms/point. The samples were mounted on a vertical stand in an arrangement of two rows and six columns and measured in a single acquisition (overall area of 22.5 × 8 cm2). To increase the spatial resolution, we carried out oversampling by acquiring four scans with a proper offset, which were merged in post-production.

IR False-Color (IR-FC) Imaging, Principal Component Analysis (PCA), Color Difference (∆E*) Mapping, and Spectral Correlation Mapper (SCM)

The stack of monochromatic images acquired using the VIS-NIR scanner was processed in IR-FC images, principal component analysis (PCA), color difference, and spectral correlation (SC) mapping, using in-house software.
According to the traditional method, IR-FC images were created by replacing the red (R = 700 nm) channel with the NIR (N) image and shifting the red (R) and green (G = 546.1 nm) channels to the green (G) and blue (B = 453.8 nm) ones, respectively (NRG → RGB) [39,40,49,50]. After scrolling all IR images, reflectographic images at 950 nm and 2100 nm were selected as representative of the surface corrosion because not only do they strongly emphasize surface features, but also their reflectance characteristics are highly different, allowing for highlighting the distinct patina details. PCA reduced the number of dimensions in a large dataset to a smaller set of variables (principal components, PCs), that retain most of the original information. PC vectors were chosen following decreasing variance: the first principal component explained the greatest amount of variance in the original features; the second component was orthogonal to the first and explained the greatest amount of variance left after the first principal component, etc. [3,5,51]. Being the directions of variance uncorrelated, the information in the PCs was never redundant [52]. We performed PCA on the stack of 32 images, resulting in the first four components explaining the 91.68%, 5.24%, 1.31%, and 0.56% covariance, respectively. Color-composite images were then produced by combining selected PCs in the RGB space.
In-house-developed software was used to perform color difference mapping. For each corroded sample, the color difference map was obtained using the non-corroded C2 sample as a reference. The ∆E* was calculated in the 1976 CIE L*a*b* color space ( E   = L 2 + a 2 + b 2 ) for each pixel and displayed on a color scale from blue (minimum ∆E*) to red (maximum ∆E*) [53,54].
SCM was performed using a spectral correlation algorithm based on Pearson’s correlation coefficient, which regards spectra as N-dimensional vectors, where N is the number of spectral bands [43,44]. The similarity between a reference and the target spectra was calculated as the angle amplitude between the two vectors by centralizing the data at their mean: the smaller the angle, the greater the similarity. The correlation coefficient varies from −1 to 1 where −1, 0, and +1 represent anti-correlation, no correlation, and maximum correlation, respectively [43,44].

2.3. Confocal Raman Microspectroscopy (CRM)

Raman spectra were collected using a Renishaw in Via™ confocal Raman microscope equipped with a Leica Microsystems DM2700 optical microscope (Wetzlar, Germany). Analyses were performed using the 532 nm laser source and a 50× long-distance objective (NA = 0.5; theoretical spot size: 0.65 µm). Spectra were recorded in the 100–3800 cm−1 spectral range, with an 1800 L/mm grating and a thermoelectrically cooled CCD detector (spectral range: 400–1060 nm; spectral resolution: 1 cm−1/CCD pixel). A laser power of 0.5–2.5 mW and an integration time of 10 s with 1–5 accumulations were set. Data were processed using OriginPro 2024 software.

2.4. Fiber Optics Reflectance Spectroscopy (FORS)

FORS measurements were acquired using two Zeiss (Oberkochen, Germany) Multi-Channel Spectrometers (MCS): the MCS601 UV-NIR C (spectral sensitivity 190–1015 nm) and MCS611 NIR 2.2 (spectral sensitivity 900–2200 nm), having a spectral resolution of 0.8 and 5.0 nm/pixel, respectively. The illumination spot size was ∅ = 3.0 mm. Analysis was performed with a 45°/0° illumination/detection geometry, using a certified white 99% reflecting reference standard (Spectralon, Labsphere®, North Sutton, NH, USA) and measuring the background noise. The integration time was set to ~200 ms. On each sample, we collected three spectra, each representing the average of three measurements.

3. Results and Discussion

The different artificial aging times resulted in a wide range of corrosion patinas, ranging from red–brown compact layers to green, powdery deposits. As shown in Figure 1a, the duration of the aging treatment did not determine a linear development of the corrosion patina. For instance, sample C8 (65 h aging) is more similar to samples C10–C12 (aging time 72–143 h) than to samples C7 and C9 (aging time 62 and 68 h, respectively). The nonlinear aging behavior could be attributed to the artisanal production of the samples and related to the inhomogeneity of the alloy, texture, cast defects, and other factors. However, this study is not intended to provide a statistical representation, which may not be meaningful due to the low reproducibility of our hand-cast samples. Nevertheless, this lack of reproducibility perfectly reflects the unique nature and conservation state of each work of art.

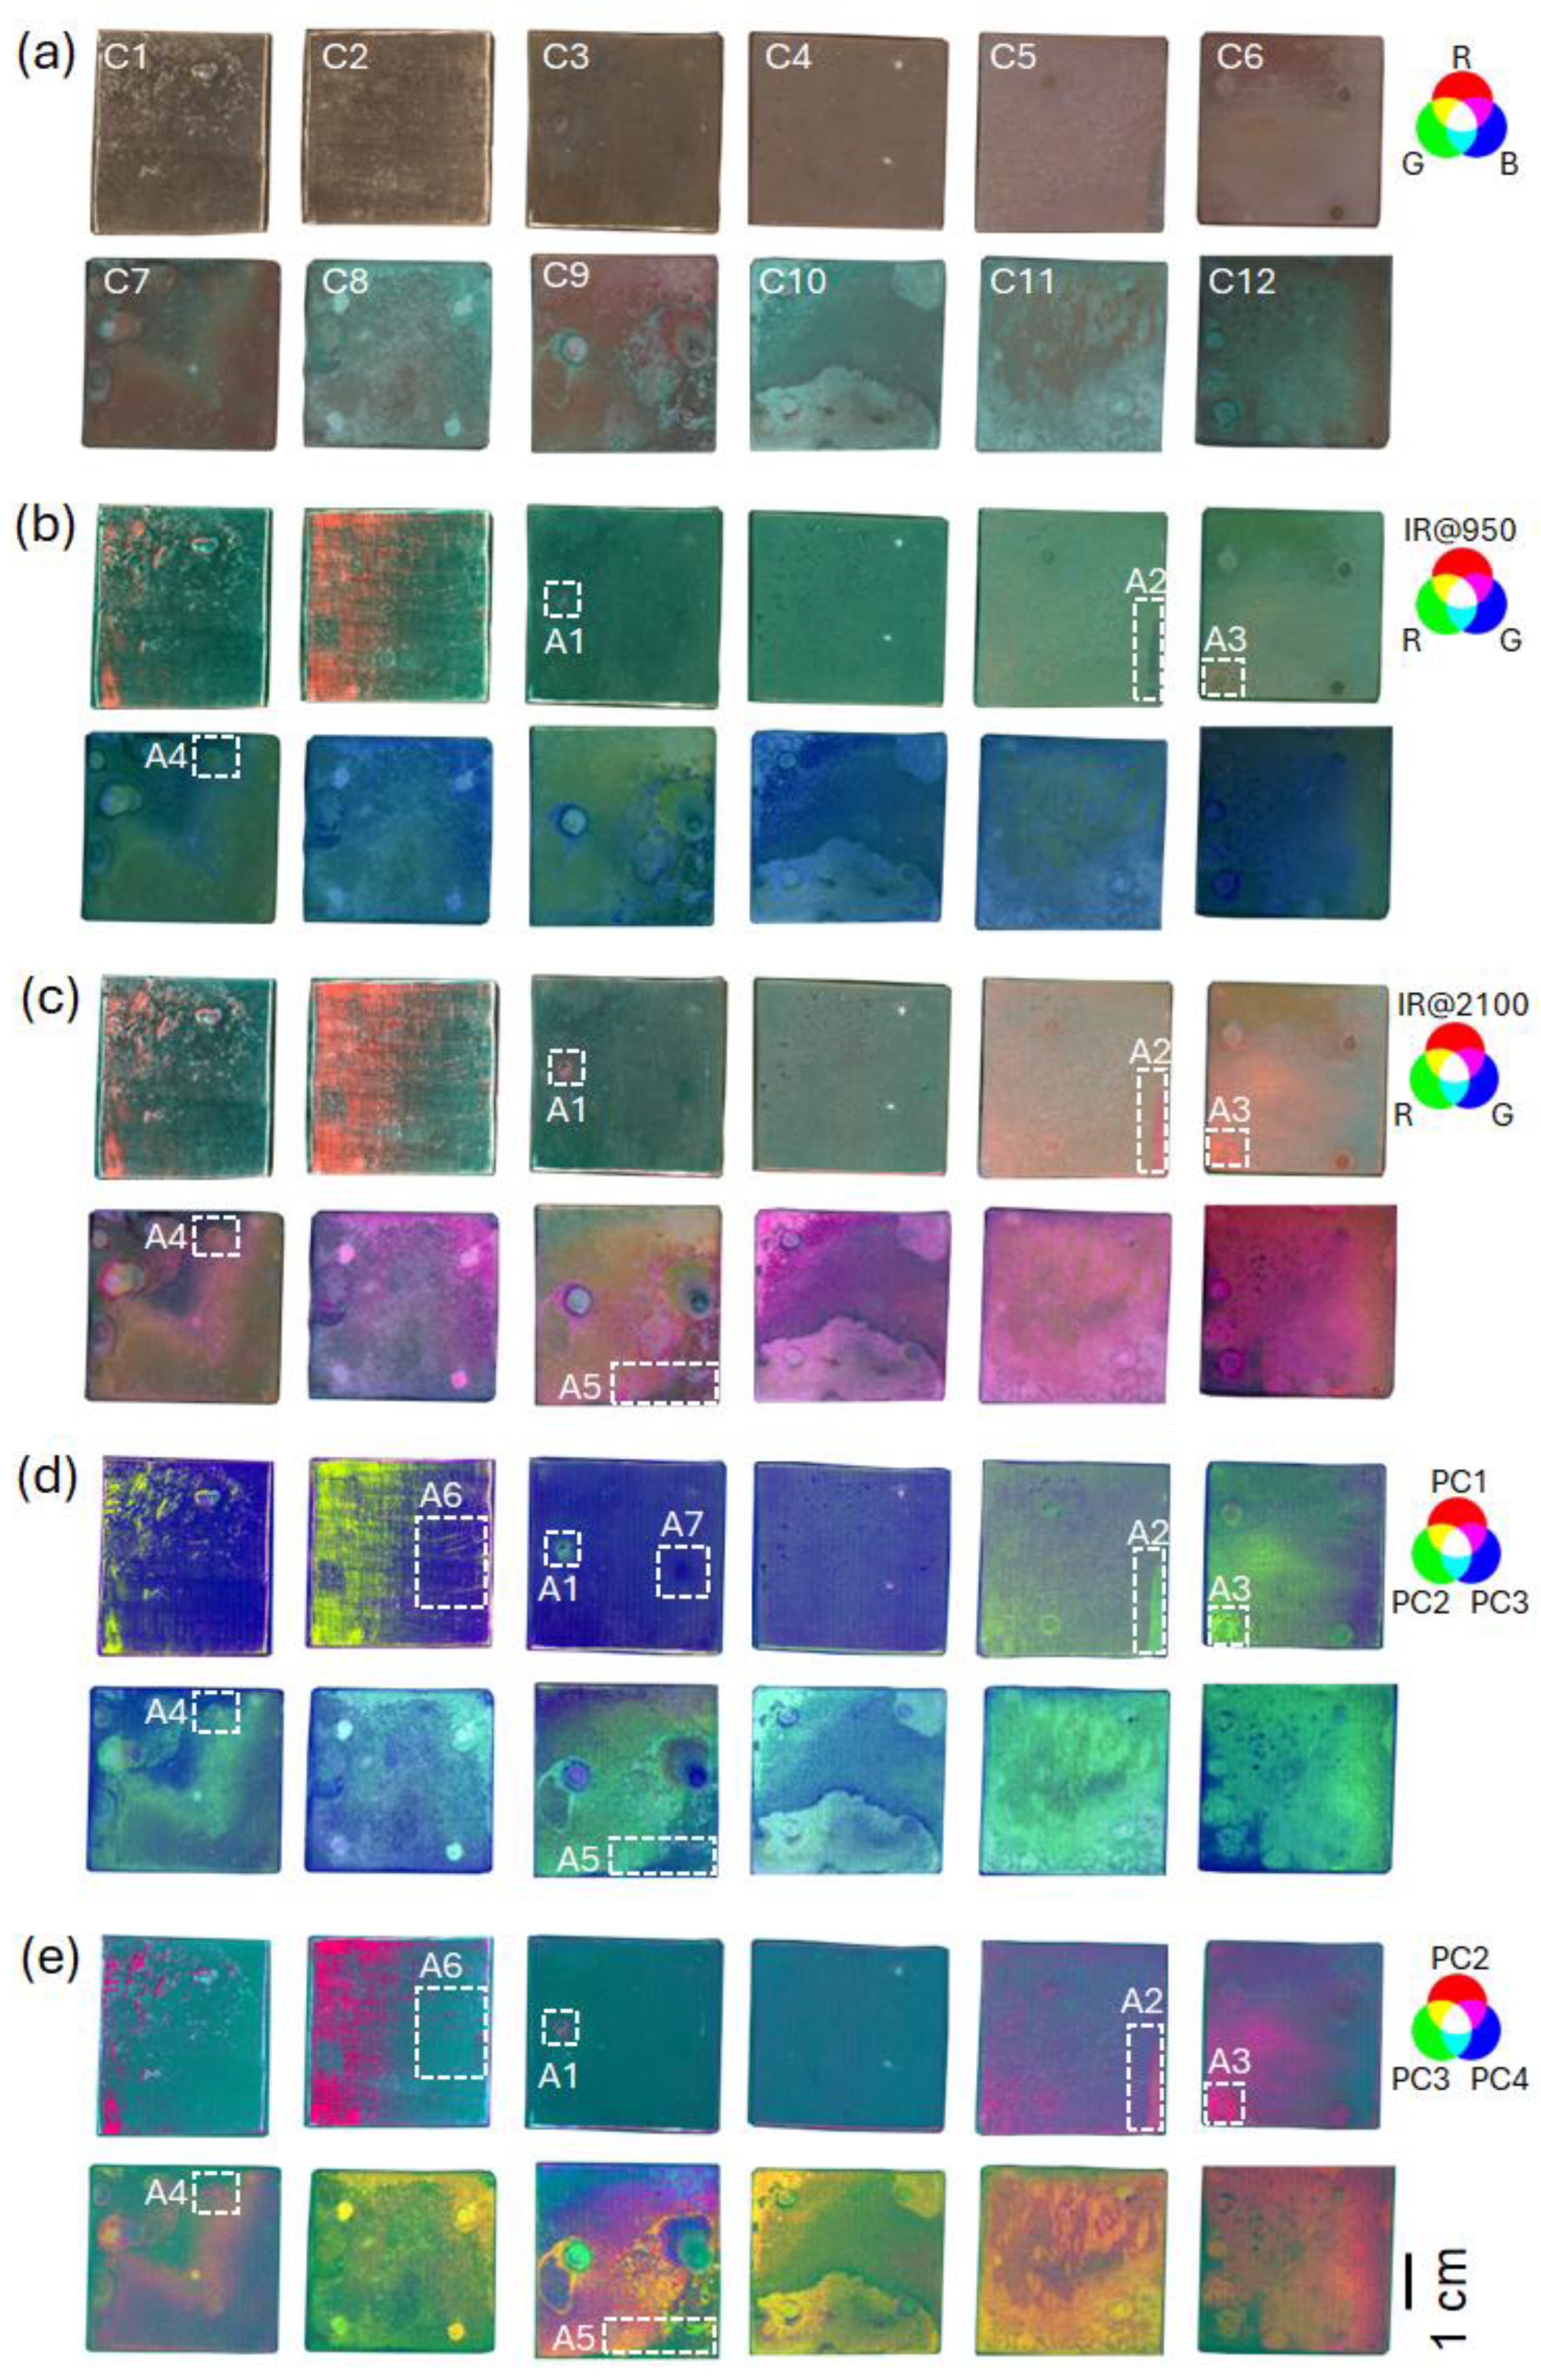
3.1. Patina Visualization

The artificial patinas (Figure 1a) were examined through traditional IR false-color images using the IR reflectography at 950 nm (Figure 1b) and 2100 nm (Figure 1c; see Material and Methods) and color-composite images were created using the PCs (Figure 1d,e), which highlighted differences in the spectral response and distribution of patina constituents and details that are not readily visible to the naked eye.
Compared to 950 nm, the higher reflection of IR at 2100 nm (Figure 1c) by samples C3, C4, C5, and C6 (14, 24, 38, and 48 h aging, respectively) suggested the presence of inhomogeneities in the patina and irregular distribution of alteration products. IR-FC images, particularly at 2100 nm, revealed features such as the spots on C3, C5, C6, C7, and C9 (details A1, A2, A3, A4, and A5 in Figure 1, respectively) as well as irregularities like the pores on the entire surface of C4, C5, C6, and C12.
The PC color-composite images (PC1–3 and PC2–4, Figure 1d,e, respectively) evidenced scratches on C2 (detail A6) and further highlighted pores on C4 and C12. PC1–3 also pointed out a dark area in C3 (detail A7, Figure 1d), while PC2–4 greatly accentuated the significant unevenness of patinas on C7–C12 (Figure 1e).
Samples C3–C6 were particularly noteworthy, as they did not exhibit macroscopic signs of ongoing bronze disease corrosion (i.e., green patinas), but they featured hidden details, visible only in IR-FC and PC color-composite images, which may be related to this phenomenon.

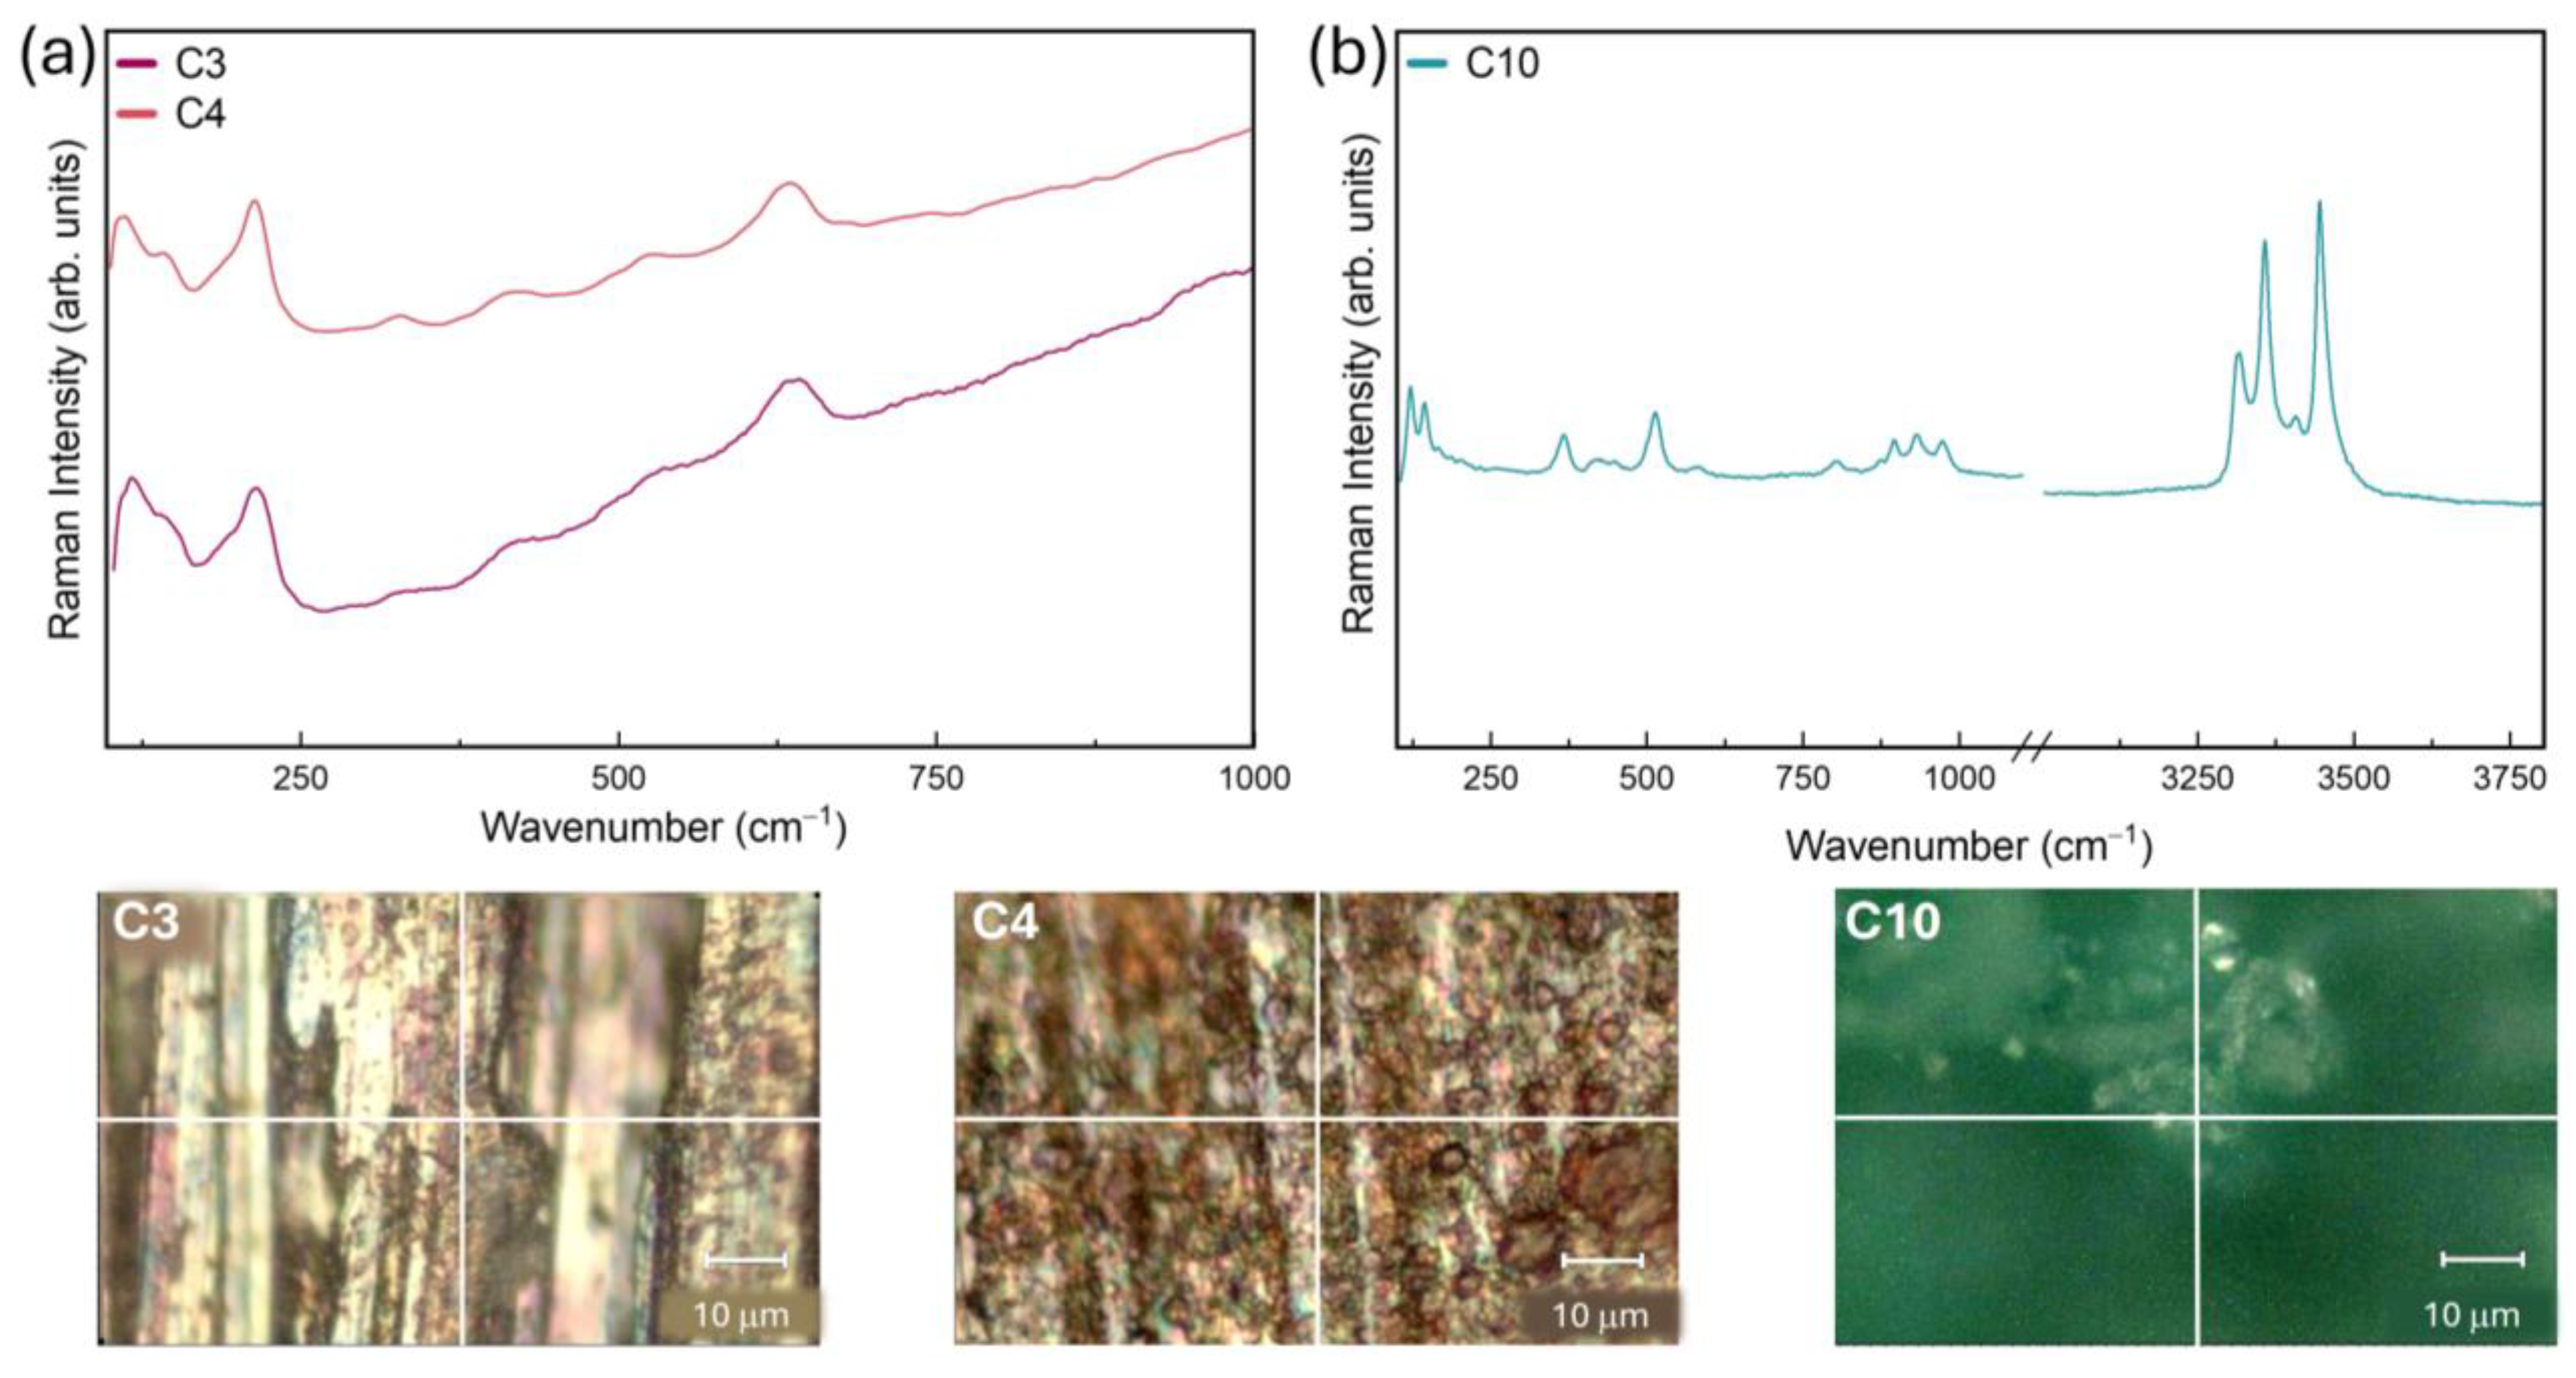
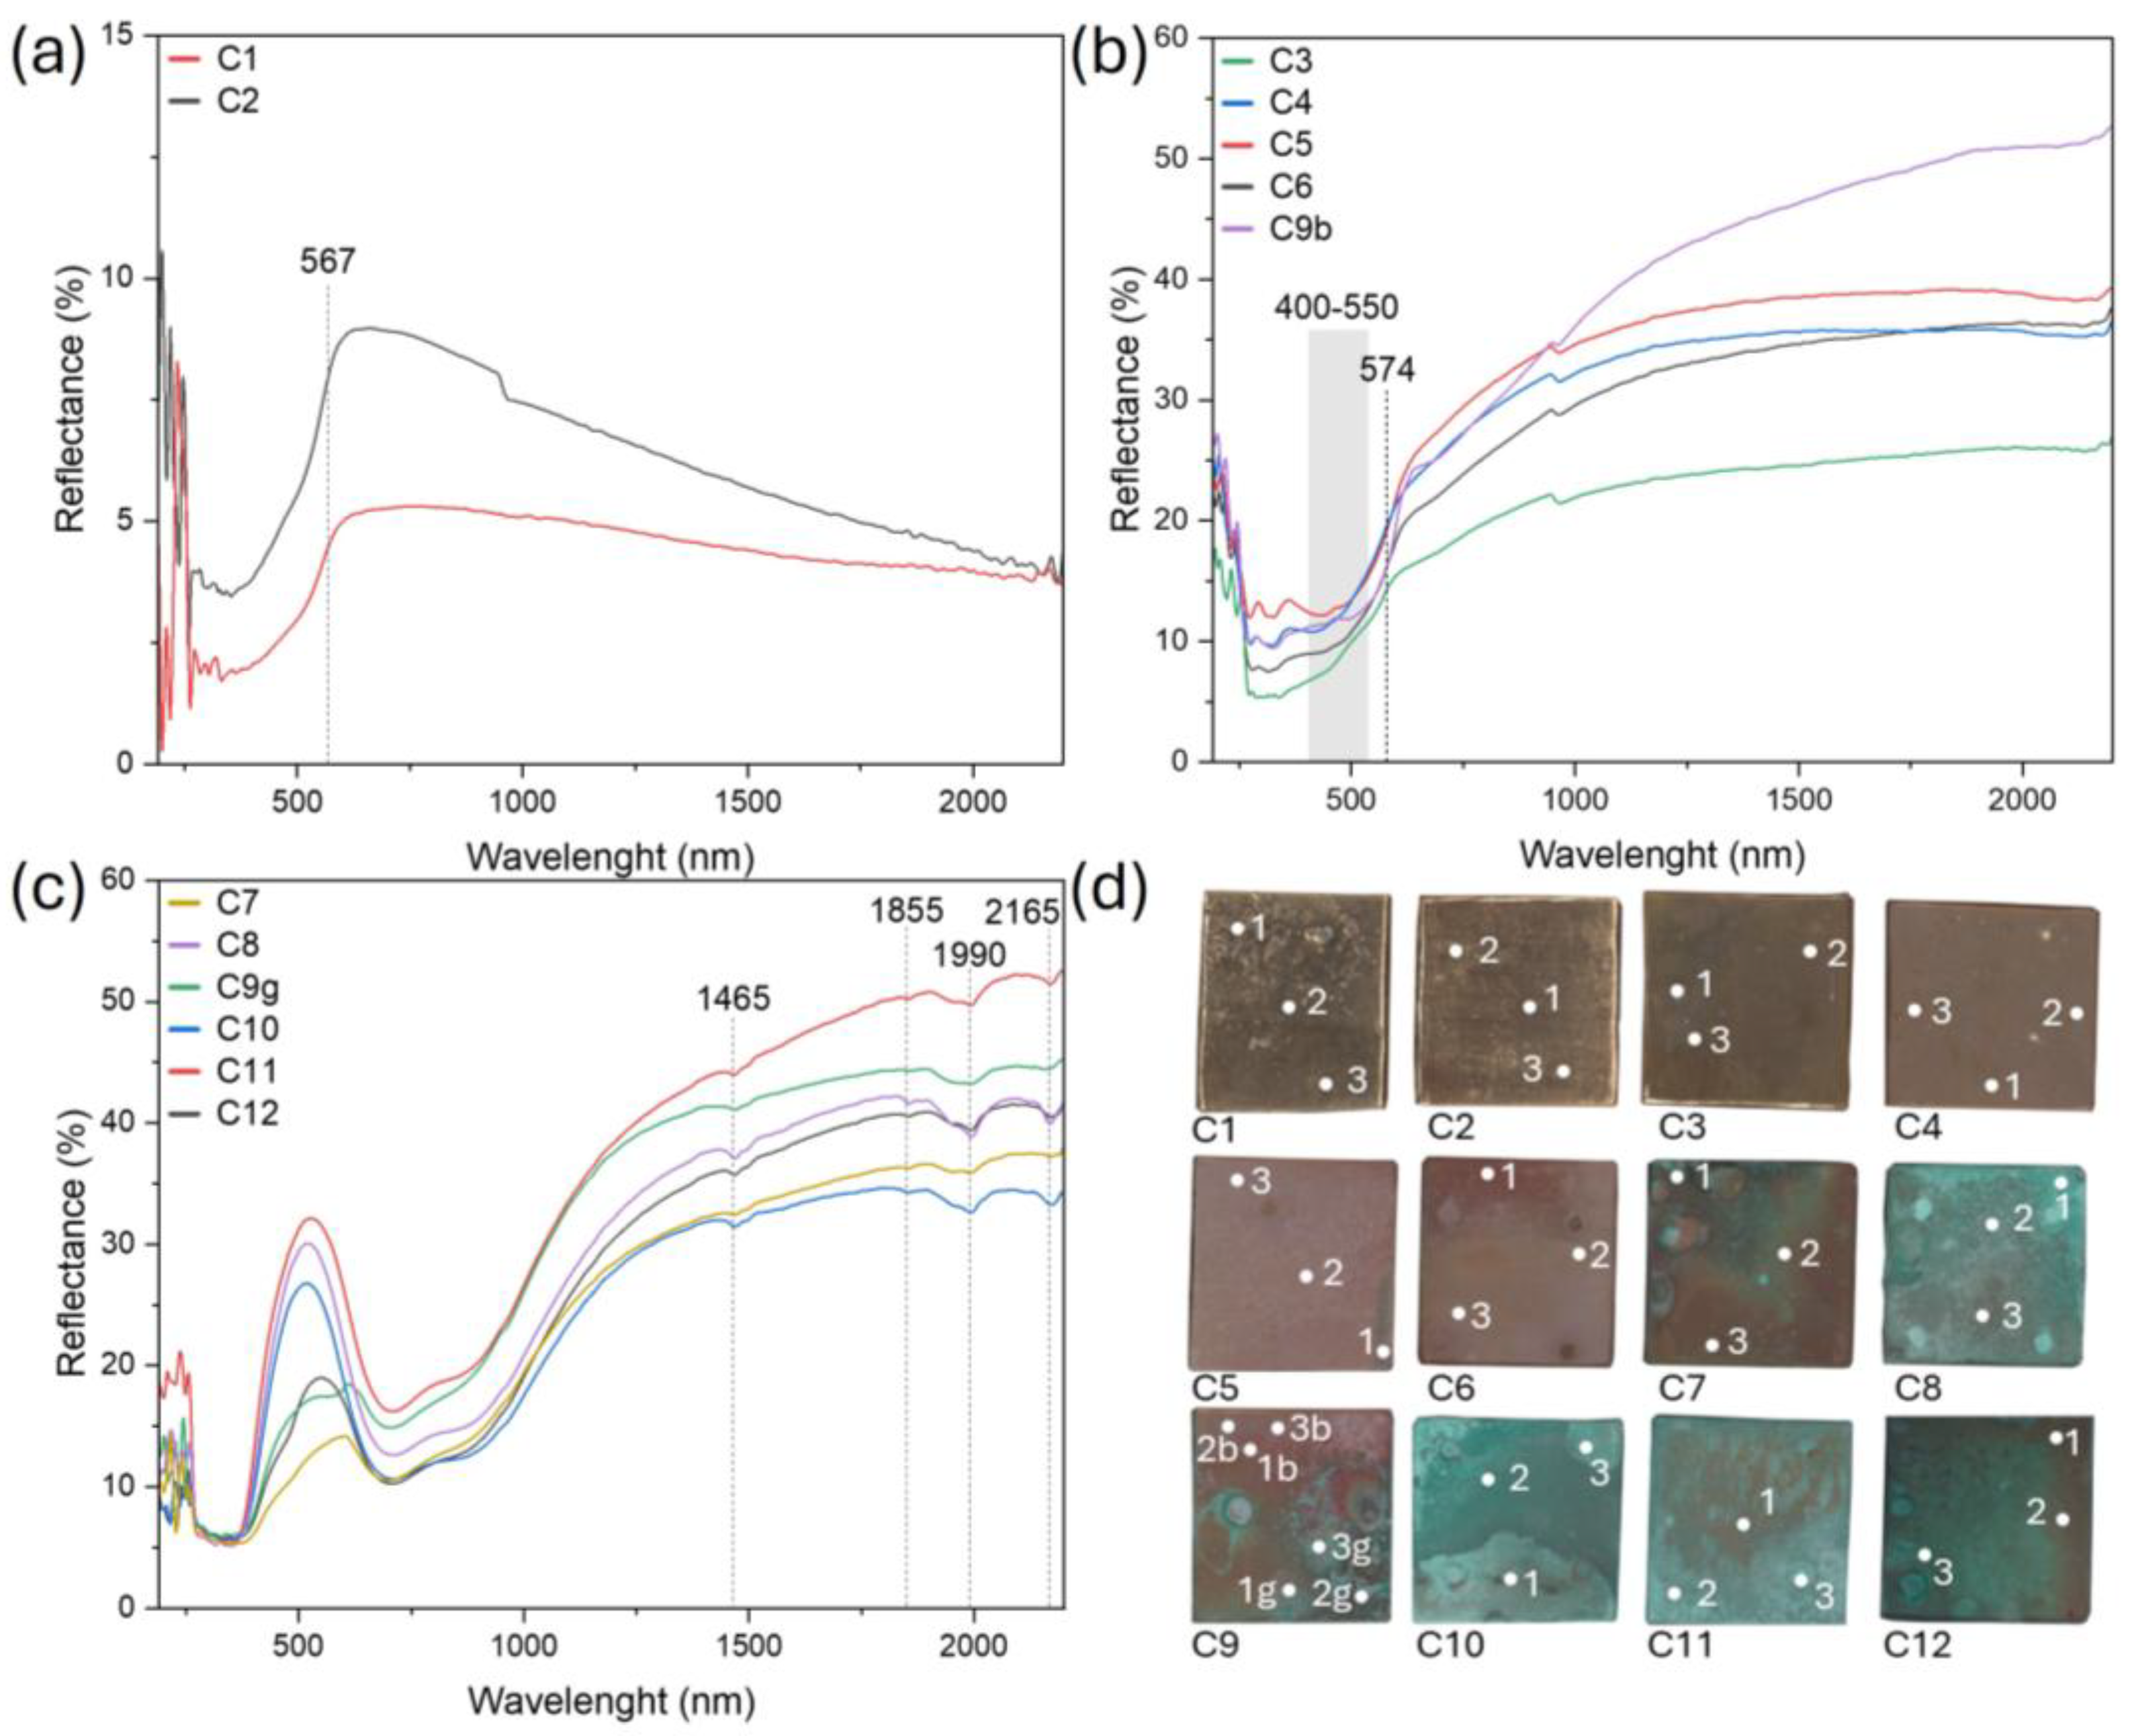
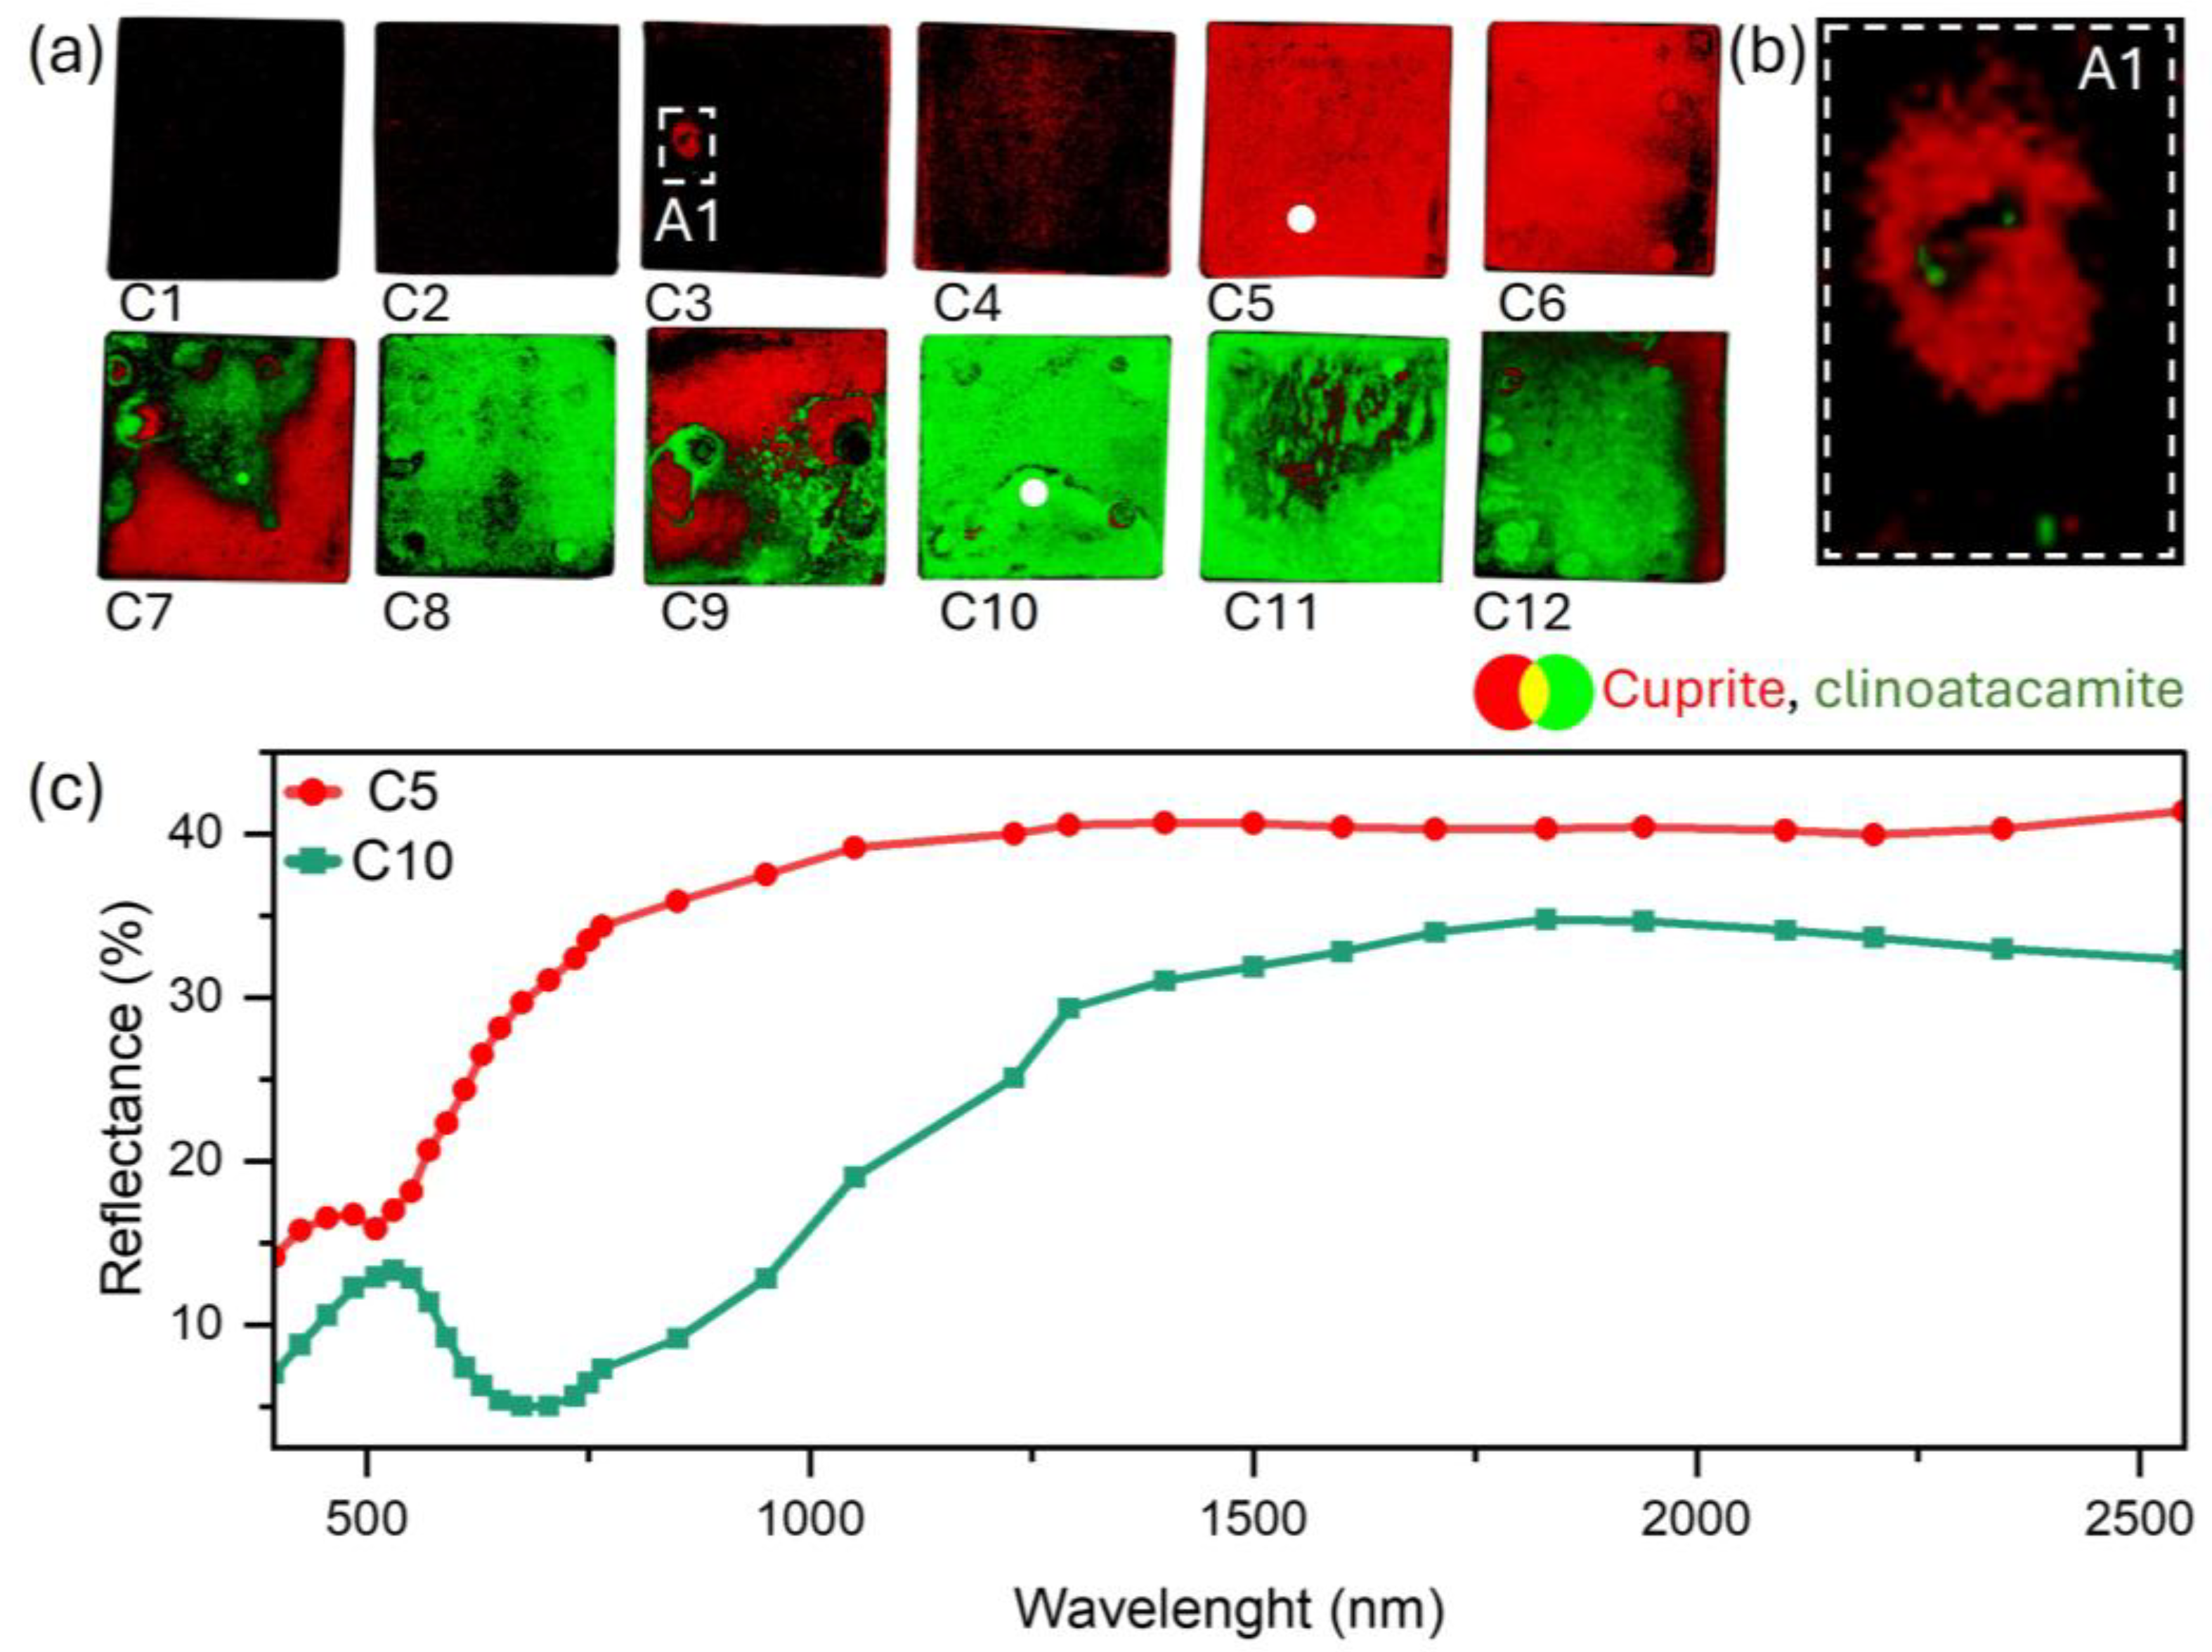
3.2. Patina Component Identification and Mapping

Based on reflectance imaging spectroscopy (RIS) results, we further analyzed selected points on samples using Raman and FORS spectroscopy to disclose the chemical composition of the patinas (Figure 2 and Figure 3).
Raman spectra collected on red–brown areas of C3, C4, C5, C7, and C9 featured typical cuprite peaks (Figure 2a) at 107, 147 (Raman symmetry allowed), 218 (overtone-defective Cu2O), 319, 413 (overtone), 525, and 630 cm−1 (Raman symmetry allowed) [25,27,55,56,57,58,59].
Analysis of the green corrosion products on samples C7–C12 identified clinoatacamite in patina (Figure 2b), detected by Raman signals at 120 and 142 cm−1 (Cl–Cu–Cl bending), 369 and 420 cm−1 (CuCl stretch), 515 and 576 cm−1 (CuO stretch), 799, 893, 928, and 970 (hydroxyl deformation), and 3308, 3354, and 3445 cm−1 (hydroxyl stretching) [16,60,61].
Strong fluorescence in the spectrum of C6 hindered the full identification of patina composition. Nevertheless, a green crystal on its surface exhibited spectral features consistent with clinoatacamite.
No corrosion products were detected on the uncorroded samples C1 and C2.
FORS results were in agreement with those obtained by Raman analysis: FORS spectra collected on red–brown areas showed the usual cuprite sigmoid shape with the inflection point at 574 nm (Figure 3b) and the absorption band at about 400–550 nm (Figure 3b) [4,8,9,62]. Data acquired on green patinas match the reflectance spectra of copper trihydroxychlorides, which show absorption bands at 1465, 1855, 1990, and 2165 nm [4,9,16] (Figure 3c). No corrosion products were detected on C1 and C2 (Figure 3a). The inflection point at 567 nm is consistent with the bronze reflectance spectra reported in the literature [63].
We processed the RIS data cube using the standard illuminant D65 and standard observer 1931 (2°) to obtain CIELab coordinates from the tristimulus XYZ ones. To show the effect of corrosion on the sample color appearance, we computed color difference images in the 1976 CIE color space by comparing each point of the aged samples to the uncorroded bronze sample C2, used as a reference (aging time 0 h) (Figure 4).
Table 3 reports the color difference (ΔE*) calculated from RIS data on the same points evaluated from FORS measurements (see Figure 3d). Figure 4a and Table 3 show the increasing trend of ΔE* with aging time. Samples C8 and C10 exhibit the highest ΔE* on their whole surface. With aging, the samples tend to darken (Figure 4b), turning red/yellow in the early stages of aging (Figure 4c) and then shifting to green/blue shades (Figure 4d).
Based on the results of Raman and FORS analyses, which made it possible to identify with certainty where cuprite and clinoatacamite were present, we performed SCM to map their distribution on the samples’ surfaces. Therefore, we selected the spectra of cuprite and clinoatacamite from the RIS data cube in the points identified by Raman and FORS analyses, which were used as internal endmembers to obtain the distribution map of the two minerals. These maps, displayed in red (cuprite) and green (clinoatacamite) colors, are combined using the trichromatic additive synthesis (Figure 5a). Despite oxidation hardly visible to the naked eye, area A1 of sample C3 showed a high correlation with cuprite and a small amount of clinoatacamite, highlighted by IR-FC and PC color-composite images.
The enlargement of the color-composite image obtained by mixing the SC maps of cuprite and clinoatacamite on area A1 (sample C3, Figure 5b) shows the presence of clinoatacamite, which is a significant signal of the onset of bronze disease, which is not visible to the naked eye. Therefore, to validate the results of SCM analysis, additional Raman spectra were collected on area A1 of the C3 sample (Figure 6), confirming the presence of clinoatacamite in small spots (diameter < 10 μm, Figure 6a, bottom), not detected with FORS due to the instrument spot dimension. Outside this small clinoatacamite spot, only cuprite, characterized by peaks at 145, 215, and 630 cm−1, was detected (Figure 6b).

4. Conclusions

This study was aimed at demonstrating the effectiveness of the combined use of a set of non-invasive spectroscopic techniques for detecting the onset of bronze disease. RIS, FORS, and Raman spectroscopy were used to characterize a set of twelve artificially aged bronze samples at different stages of corrosion (from fresh to highly corroded). Raman and FORS analyses identified the composition of the corrosion products, namely clinoatacamite and cuprite. IR-FC and PCA highlighted superficial features not visible to the naked eye. Based on Raman and FORS spectra acquired in selected points of patinas, the SCM classification algorithm was applied to the RIS data cube to map the distribution of cuprite and clinoatacamite throughout the sample set.
SCM analysis enabled the early detection of bronze disease by correlating clinoatacamite found on highly corroded samples with a small formation on a just-oxidized sample. In fact, the method presented herein allowed for identifying the bronze disease after just 14 h of artificial aging. The non-invasive early detection of bronze disease is pivotal in conservation science as well as in industrial fields based on copper alloys.
A further challenge to the use of RIS for bronze disease detection might arise from patinas with a more complex composition (e.g., mixture of oxides, chlorides, and carbonates). However, the implementation of databases containing reflectance spectra of corrosion product mixtures and the application of machine learning methods could solve this issue.

Author Contributions

Conceptualization, D.P. and R.F.; methodology, D.P. and R.F.; validation, D.P. and R.F.; formal analysis, D.P.; investigation, D.P. and S.I.; resources, R.F., E.C. and J.S.; data curation, D.P. and R.F.; writing—original draft preparation, D.P.; writing—review and editing, R.F., E.C., S.I. and J.S.; visualization, D.P.; supervision, R.F. and E.C.; project administration, R.F.; funding acquisition, R.F, E.C. and J.S. All authors have read and agreed to the published version of the manuscript.

Funding

This research was funded by PE_00000020—CHANGES: Cultural Heritage Active Innovation for Sustainable Society project, PIANO NAZIONALE DI RIPRESA E RESILIENZA (PNRR)—MISSIONE 4 COMPONENTE 2, INVESTIMENTO 1.3—CUP D53C22002560006, funded by Next Generation EU. S.I. acknowledges PNRR H2IOSC (Humanities and Cultural Heritage Italian Open Science Cloud) Project (IR0000029), CUP_B63C2200073005, funded by Next Generation EU. The contents reflect only the authors' view, and the European Commission is not responsible for any use that may be made of the information it contains.

Data Availability Statement

Dataset available on request from the authors.

Conflicts of Interest

The authors declare no conflicts of interest.

References

  1. Lehmann, E.H.; Vontobel, P.; Deschler-Erb, E.; Soares, M. Non-Invasive Studies of Objects from Cultural Heritage. Nucl. Instrum. Methods Phys. Res. Sect. A Accel. Spectrometers Detect. Assoc. Equip. 2005, 542, 68–75. [Google Scholar] [CrossRef]
  2. Di Turo, F. Limits and Perspectives of Archaeometric Analysis of Archaeological Metals: A Focus on the Electrochemistry for Studying Ancient Bronze Coins. J. Cult. Herit. 2020, 43, 271–281. [Google Scholar] [CrossRef]
  3. Dal Fovo, A.; Sepiacci, L.; Innocenti, S.; Striova, J.; Fontana, R. Botticelli-Style Tempera Portrait on Tile: Imaging and Specific on-Site Spectroscopic Analysis and Cleaning Examination. J. Cult. Herit. 2024, 66, 229–235. [Google Scholar] [CrossRef]
  4. Liu, W.; Li, M.; Wu, N.; Liu, S.; Chen, J. A New Application of Fiber Optics Reflection Spectroscopy (FORS): Identification of “Bronze Disease” Induced Corrosion Products on Ancient Bronzes. J. Cult. Herit. 2021, 49, 19–27. [Google Scholar] [CrossRef]
  5. Dal Fovo, A.; Morello, M.; Mazzinghi, A.; Toso, C.; Pampaloni, E.; Fontana, R. Disclosure of a Concealed Michelangelo-Inspired Depiction in a 16th-Century Painting. J. Imaging 2024, 10, 175. [Google Scholar] [CrossRef]
  6. Cucci, C.; Delaney, J.K.; Picollo, M. Reflectance Hyperspectral Imaging for Investigation of Works of Art: Old Master Paintings and Illuminated Manuscripts. Acc. Chem. Res. 2016, 49, 2070–2079. [Google Scholar] [CrossRef]
  7. Delaney, J.K.; Thoury, M.; Zeibel, J.G.; Ricciardi, P.; Morales, K.M.; Dooley, K.A. Visible and Infrared Imaging Spectroscopy of Paintings and Improved Reflectography. Herit. Sci. 2016, 4, 6. [Google Scholar] [CrossRef]
  8. Hu, Q.; Liu, W.; Liu, S.; Chen, J. Detecting Copper Trihydroxychlorides with Reflectance Spectroscopy and Machine Learning Methods. J. Cult. Herit. 2023, 59, 49–56. [Google Scholar] [CrossRef]
  9. Liggins, F.; Vichi, A.; Liu, W.; Hogg, A.; Kogou, S.; Chen, J.; Liang, H. Hyperspectral Imaging Solutions for the Non-Invasive Detection and Automated Mapping of Copper Trihydroxychlorides in Ancient Bronze. Herit. Sci. 2022, 10, 142. [Google Scholar] [CrossRef]
  10. Moffa, C.; Merola, C.; Magboo, F.P., Jr.; Chiadroni, E.; Giuliani, L.; Curcio, A.; Palumbo, L.; Felici, A.C.; Petrarca, M. Pigments, Minerals, and Copper-Corrosion Products: Terahertz Continuous Wave (THz-CW) Spectroscopic Characterization of Antlerite and Atacamite. J. Cult. Herit. 2024, 66, 483–490. [Google Scholar] [CrossRef]
  11. De Haro, A.; Córdova, M.; Rua Landa, C.; Huck-Iriart, C.; Siracusano, G.; Maier, M.S.; Tomasini, E. Methodologies for the Characterization and Identification of Natural Atacamite as a Pigment in Andean Colonial Painting. Heritage 2023, 6, 5116–5129. [Google Scholar] [CrossRef]
  12. Tomasini, E.P.; Landa, C.R.; Siracusano, G.; Maier, M.S. Atacamite as a Natural Pigment in a South American Colonial Polychrome Sculpture from the Late XVI Century. J. Raman Spectrosc. 2013, 44, 637–642. [Google Scholar] [CrossRef]
  13. MacLeod, I.D. Bronze Disease: An Electrochemical Explanation. ICCM Bull. 1981, 7, 16–26. [Google Scholar] [CrossRef]
  14. Grayburn, R.; Dowsett, M.; Hand, M.; Sabbe, P.-J.; Thompson, P.; Adriaens, A. Tracking the Progression of Bronze Disease—A Synchrotron X-Ray Diffraction Study of Nantokite Hydrolysis. Corros. Sci. 2015, 91, 220–223. [Google Scholar] [CrossRef]
  15. Bozzini, B.; Alemán, B.; Amati, M.; Boniardi, M.; Caramia, V.; Giovannelli, G.; Gregoratti, L.; Kazemian Abyaneh, M. Novel Insight into Bronze Disease Gained by Synchrotron-Based Photoelectron Spectro-Microscopy, in Support of Electrochemical Treatment Strategies. Stud. Conserv. 2017, 62, 465–473. [Google Scholar] [CrossRef]
  16. Porcu, D.; Innocenti, S.; Galeotti, M.; Striova, J.; Dei, L.; Carretti, E.; Fontana, R. Spectroscopic and Morphologic Investigation of Bronze Disease: Performance Evaluation of Portable Devices. Heritage 2022, 5, 3548–3561. [Google Scholar] [CrossRef]
  17. Wang, T.; Wang, J.; Wu, Y. The Inhibition Effect and Mechanism of L-Cysteine on the Corrosion of Bronze Covered with a CuCl Patina. Corros. Sci. 2015, 97, 89–99. [Google Scholar] [CrossRef]
  18. Kwon, H. Corrosion Behaviors of Artificial Chloride Patina for Studying Bronze Sculpture Corrosion in Marine Environments. Coatings 2023, 13, 1630. [Google Scholar] [CrossRef]
  19. Mezzi, A.; Angelini, E.; Riccucci, C.; Grassini, S.; De Caro, T.; Faraldi, F.; Bernardini, P. Micro-Structural and Micro-Chemical Composition of Bronze Artefacts from Tharros (Western Sardinia, Italy). Surf. Interface Anal. 2012, 44, 958–962. [Google Scholar] [CrossRef]
  20. Casaletto, M.P.; Ingo, G.M.; Albini, M.; Lapenna, A.; Pierigè, I.; Riccucci, C.; Faraldi, F. An Integrated Analytical Characterization of Corrosion Products on Ornamental Objects from the Necropolis of Colle Badetta-Tortoreto (Teramo, Italy). Appl. Phys. A 2010, 100, 801–808. [Google Scholar] [CrossRef]
  21. Faraldi, F.; Çilingirǒglu, A.; Angelini, E.; Riccucci, C.; De Caro, T.; Batmaz, A.; Mezzi, A.; Caschera, D.; Cortese, B. Micro-Chemical and Micro-Structural Investigation of Archaeological Bronze Weapons from the Ayanis Fortress (Lake Van, Eastern Anatolia, Turkey). Appl. Phys. A 2013, 113, 911–921. [Google Scholar] [CrossRef]
  22. Ingo, G.M.; Bustamante, A.D.; Alva, W.; Angelini, E.; Cesareo, R.; Gigante, G.E.; Zambrano, S.D.P.A.; Riccucci, C.; Di Carlo, G.; Parisi, E.I.; et al. Gold Coated Copper Artifacts from the Royal Tombs of Sipán (Huaca Rajada, Perù): Manufacturing Techniques and Corrosion Phenomena. Appl. Phys. A 2013, 113, 877–887. [Google Scholar] [CrossRef]
  23. Ingo, G.M.; Riccucci, C.; Lavorgna, M.; Salzano de Luna, M.; Pascucci, M.; Di Carlo, G. Surface Investigation of Naturally Corroded Gilded Copper-Based Objects. Appl. Surf. Sci. 2016, 387, 244–251. [Google Scholar] [CrossRef]
  24. Ingo, G.M.; Albini, M.; Bustamante, A.D.; Zambrano Alva, S.d.P.; Fernandez, A.; Giuliani, C.; Messina, E.; Pascucci, M.; Riccucci, C.; Staccioli, P.; et al. Microchemical Investigation of Long-Term Buried Gilded and Silvered Artifacts From Ancient Peru. Front. Mater. 2020, 7, 230. [Google Scholar] [CrossRef]
  25. Privitera, A.; Corbascio, A.; Calcani, G.; Della Ventura, G.; Ricci, M.A.; Sodo, A. Raman Approach to the Forensic Study of Bronze Patinas. J. Archaeol. Sci. Rep. 2021, 39, 103115. [Google Scholar] [CrossRef]
  26. de Caro, T.; Susanna, F.; La Russa, M.F.; Macchia, A. The Fontanamare Discovery (Sardinia Coast, Italy), a Case of Underwater Corrosion of Bronze Coins. Minerals 2023, 13, 1085. [Google Scholar] [CrossRef]
  27. de Caro, T.; Angelini, E.; Sebar, L.E. Application of U-Raman Spectroscopy to the Study of the Corrosion Products of Archaeological Coins. ACTA IMEKO 2021, 10, 234–240. [Google Scholar] [CrossRef]
  28. Robotti, S.; Rizzi, P.; Soffritti, C.; Garagnani, G.L.; Greco, C.; Facchetti, F.; Borla, M.; Operti, L.; Agostino, A. Reliability of Portable X-Ray Fluorescence for the Chemical Characterisation of Ancient Corroded Coppertin Alloys. Spectrochim. Acta Part B At. Spectrosc. 2018, 146, 41–49. [Google Scholar] [CrossRef]
  29. Soffritti, C.; Fabbri, E.; Merlin, M.; Garagnani, G.L.; Monticelli, C. On the Degradation Factors of an Archaeological Bronze Bowl Belonging to a Private Collection. Appl. Surf. Sci. 2014, 313, 762–770. [Google Scholar] [CrossRef]
  30. Oudbashi, O. Multianalytical Study of Corrosion Layers in Some Archaeological Copper Alloy Artefacts. Surf. Interface Anal. 2015, 47, 1133–1147. [Google Scholar] [CrossRef]
  31. Arafat, A.; Na’es, M.; Kantarelou, V.; Haddad, N.; Giakoumaki, A.; Argyropoulos, V.; Anglos, D.; Karydas, A.-G. Combined in Situ Micro-XRF, LIBS and SEM-EDS Analysis of Base Metal and Corrosion Products for Islamic Copper Alloyed Artefacts from Umm Qais Museum, Jordan. J. Cult. Herit. 2013, 14, 261–269. [Google Scholar] [CrossRef]
  32. Abate, F.; De Bernardin, M.; Stratigaki, M.; Franceschin, G.; Albertin, F.; Bettuzzi, M.; Brancaccio, R.; Bressan, A.; Morigi, M.P.; Daniele, S.; et al. X-Ray Computed Microtomography: A Non-Invasive and Time-Efficient Method for Identifying and Screening Roman Copper-Based Coins. J. Cult. Herit. 2024, 66, 436–443. [Google Scholar] [CrossRef]
  33. Wang, Z.; Xi, X.; Li, L.; Zhang, Z.; Han, Y.; Wang, X.; Sun, Z.; Zhao, H.; Yuan, N.; Li, H.; et al. Tracking the Progression of the Simulated Bronze Disease—A Laboratory X-Ray Microtomography Study. Molecules 2023, 28, 4933. [Google Scholar] [CrossRef] [PubMed]
  34. Cano, E.; Crespo, A.; Lafuente, D.; Ramirez Barat, B. A Novel Gel Polymer Electrolyte Cell for In-Situ Application of Corrosion Electrochemical Techniques. Electrochem. Commun. 2014, 41, 16–19. [Google Scholar] [CrossRef]
  35. Doménech-Carbó, A.; Doménech-Carbó, M.; Martínez-Lázaro, I. Electrochemical Identification of Bronze Corrosion Products in Archaeological Artefacts. A Case Study. Microchim Acta 2008, 162, 351–359. [Google Scholar] [CrossRef]
  36. Yang, X.; Wu, W.; Chen, K. Investigation on the Electrochemical Evolution of the Cu-Sn-Pb Ternary Alloy Covered with CuCl in a Simulated Atmospheric Environment. J. Electroanal. Chem. 2022, 921, 116636. [Google Scholar] [CrossRef]
  37. Grazzi, F.; Cucci, C.; Casini, A.; Stefani, L.; Kardjilov, N.; Thiele, A.; Hošek, J.; Picollo, M. Merging of Imaging Techniques Based on Reflectance Hyperspectral and Neutron Tomography for Characterization of a Modern Replica of a 13th Century Knife from Croatia. In Optics for Arts, Architecture, and Archaeology VII; SPIE: Munich, Germany, 2019; Volume 11058, pp. 161–173. [Google Scholar]
  38. Orsilli, J.; Caglio, S. Combined Scanned Macro X-Ray Fluorescence and Reflectance Spectroscopy Mapping on Corroded Ancient Bronzes. Minerals 2024, 14, 192. [Google Scholar] [CrossRef]
  39. Hayem-Ghez, A.; Ravaud, E.; Boust, C.; Bastian, G.; Menu, M.; Brodie-Linder, N. Characterizing Pigments with Hyperspectral Imaging Variable False-Color Composites. Appl. Phys. A 2015, 121, 939–947. [Google Scholar] [CrossRef]
  40. Moon, T.; Schilling, M.R.; Thirkettle, S. A Note on the Use of False-Color Infrared Photography in Conservation. Stud. Conserv. 1992, 37, 42–52. [Google Scholar] [CrossRef]
  41. Prati, S.; Sciutto, G.; Bonacini, I.; Mazzeo, R. New Frontiers in Application of FTIR Microscopy for Characterization of Cultural Heritage Materials. In Analytical Chemistry for Cultural Heritage; Mazzeo, R., Ed.; Springer International Publishing: Cham, Switzerland, 2017; pp. 129–160. ISBN 978-3-319-52804-5. [Google Scholar]
  42. Marengo, E.; Manfredi, M.; Zerbinati, O.; Robotti, E.; Mazzucco, E.; Gosetti, F.; Bearman, G.; France, F.; Shor, P. Development of a Technique Based on Multi-Spectral Imaging for Monitoring the Conservation of Cultural Heritage Objects. Anal. Chim. Acta 2011, 706, 229–237. [Google Scholar] [CrossRef]
  43. Deborah, H.; George, S.; Hardeberg, J.Y. Pigment Mapping of the Scream (1893) Based on Hyperspectral Imaging. In Image and Signal Processing; Elmoataz, A., Lezoray, O., Nouboud, F., Mammass, D., Eds.; Springer International Publishing: Cham, Switzerland, 2014; pp. 247–256. [Google Scholar]
  44. de Carvalho, O.A.; Menese, P.R. Spectral Correlation Mapper (SCM): An Improvement on the Spectral Angle Mapper (SAM). In Proceedings of the Summaries of the 9th JPL Airborne Earth Science Workshop, Pasadena, CA, USA, 23–25 February 2000; pp. 65–74. [Google Scholar]
  45. Castelle, M.; Bormand, M.; Vandenberghe, Y.; Bourgarit, D. Two of a Kind: Shining New Light on Bronze Spiritelli Attributed to Donatello. Stud. Conserv. 2020, 65, 200–211. [Google Scholar] [CrossRef]
  46. Salvioli, N.; Sarri, S.; Agresti, J.; Osticioli, I.; Siano, S. Conservation Treatments and Archaeometallurgical Insights on the Medici Riccardi Horse Head. In Artistry in Bronze; Daehner, J.M., Lapatin, K., Spinelli, A., Eds.; The Greeks and Their Legacy XIXth International Congress on Ancient Bronzes; Getty Publications: Los Angeles, CA, USA, 2017; pp. 319–328. ISBN 978-1-60606-541-9. [Google Scholar]
  47. Daffara, C.; Pampaloni, E.; Pezzati, L.; Barucci, M.; Fontana, R. Scanning Multispectral IR Reflectography SMIRR: An Advanced Tool for Art Diagnostics. Acc. Chem. Res. 2010, 43, 847–856. [Google Scholar] [CrossRef] [PubMed]
  48. Striova, J.; Ruberto, C.; Barucci, M.; Blažek, J.; Kunzelman, D.; Dal Fovo, A.; Pampaloni, E.; Fontana, R. Spectral Imaging and Archival Data in Analysing Madonna of the Rabbit Paintings by Manet and Titian. Angew. Chem. 2018, 130, 7530–7534. [Google Scholar] [CrossRef]
  49. Kruse, F.A.; Lefkoff, A.B.; Boardman, J.W.; Heidebrecht, K.B.; Shapiro, A.T.; Barloon, P.J.; Goetz, A.F.H. The Spectral Image Processing System (SIPS)—Interactive Visualization and Analysis of Imaging Spectrometer Data. Remote Sens. Environ. 1993, 44, 145–163. [Google Scholar] [CrossRef]
  50. Ohno, Y. CIE Fundamentals for Color Measurements. In Proceedings of the Digital Printing Technologies, IS&T’s NIP16, International Conference, Vancouver, CA, USA, 16–20 October 2000. No. 16. [Google Scholar]
  51. Quintero Balbas, D.; Dal Fovo, A.; Montalbano, L.; Fontana, R.; Striova, J. Non-Invasive Contactless Analysis of an Early Drawing by Raffaello Sanzio by Means of Optical Methods. Sci. Rep. 2022, 12, 15602. [Google Scholar] [CrossRef]
  52. Dal Fovo, A.; Mattana, S.; Ramat, A.; Riitano, P.; Cicchi, R.; Fontana, R. Insights into the Stratigraphy and Palette of a Painting by Pietro Lorenzetti through Non-Invasive Methods. J. Cult. Herit. 2023, 61, 91–99. [Google Scholar] [CrossRef]
  53. Pellis, G.; Bertasa, M.; Ricci, C.; Scarcella, A.; Croveri, P.; Poli, T.; Scalarone, D. A Multi-Analytical Approach for Precise Identification of Alkyd Spray Paints and for a Better Understanding of Their Ageing Behaviour in Graffiti and Urban Artworks. J. Anal. Appl. Pyrolysis 2022, 165, 105576. [Google Scholar] [CrossRef]
  54. Schanda, J. Colorimetry: Understanding the CIE System; John Wiley & Sons: Hoboken, NJ, USA, 2007; ISBN 978-0-470-04904-4. [Google Scholar]
  55. Ropret, P.; Kosec, T. Raman Investigation of Artificial Patinas on Recent Bronze—Part I: Climatic Chamber Exposure. J. Raman Spectrosc. 2012, 43, 1578–1586. [Google Scholar] [CrossRef]
  56. Cosano, D.; Esquivel, D.; Mateos, L.D.; Quesada, F.; Jiménez-Sanchidrián, C.; Ruiz, J.R. Spectroscopic Analysis of Corrosion Products in a Bronze Cauldron from the Late Iberian Iron Age. Spectrochim. Acta Part A Mol. Biomol. Spectrosc. 2018, 205, 489–496. [Google Scholar] [CrossRef]
  57. Choi, H.; Yu, Y.; Cho, N. Chemical Composition, Crystal Structure, and Microstructure of Slags on the Korean Peninsula from the First Copper Production Remains of the 9th Century. Crystals 2024, 14, 327. [Google Scholar] [CrossRef]
  58. Kwon, H.; Cho, N. In-Situ Non Destructive Investigation of Contemporary Outdoor Bronze Sculptures. Herit. Sci. 2024, 12, 167. [Google Scholar] [CrossRef]
  59. Ospitali, F.; Chiavari, C.; Martini, C.; Bernardi, E.; Passarini, F.; Robbiola, L. The Characterization of Sn-Based Corrosion Products in Ancient Bronzes: A Raman Approach. J. Raman Spectrosc. 2012, 43, 1596–1603. [Google Scholar] [CrossRef]
  60. Frost, R.L.; Martens, W.; Kloprogge, J.T.; Williams, P.A. Raman Spectroscopy of the Basic Copper Chloride Minerals Atacamite and Paratacamite: Implications for the Study of Copper, Brass and Bronze Objects of Archaeological Significance. J. Raman Spectrosc. 2002, 33, 801–806. [Google Scholar] [CrossRef]
  61. Frost, R.L. Raman Spectroscopy of Selected Copper Minerals of Significance in Corrosion. Spectrochim. Acta Part A Mol. Biomol. Spectrosc. 2003, 59, 1195–1204. [Google Scholar] [CrossRef] [PubMed]
  62. de Ferri, L.; Mazzini, F.; Vallotto, D.; Pojana, G. In Situ Non-Invasive Characterization of Pigments and Alteration Products on the Masonry Altar of S. Maria Ad Undas (Idro, Italy). Archaeol. Anthropol. Sci. 2019, 11, 609–625. [Google Scholar] [CrossRef]
  63. Aceto, M.; Agostino, A.; Fenoglio, G.; Idone, A.; Gulmini, M.; Marcello, P.; Ricciardi, P.; Delaney, J. Characterisation of Colourants on Illuminated Manuscripts by Portable Fibre Optic UV-Visible-NIR Reflectance Spectrophotometry. Anal. Methods 2014, 6, 1488–1500. [Google Scholar] [CrossRef]
Figure 1. Artificially corroded bronze samples: (a) RGB image; (b) IR-FC (R = 950 nm); (c) IR-FC image (R = 2100 nm); (d) PC color-composite image obtained by merging PC1, 2, and 3; and (e) PC color-composite image obtained by merging PC2, 3, and 4. White boxes highlight some details, the visibility of which is increased by processing. The bar scale (bottom right) applies to all images.
Minerals 15 00252 g001
Figure 2. Raman spectra of (a) cuprite on samples C3 (in purple) and C4 (red); and (b) of clinoatacamite C10 (the diagnostic range is 100–1000 cm−1). Bottom: microscopic images of measurement points (50×).
Minerals 15 00252 g002
Figure 3. Reflectance spectra averaged over the points shown in d (190–2200 nm) of (a) uncorroded samples C1 and C2; (b) samples C3–C6 and on C9b (brown area); (c) samples C7–C12 (green areas); and (d) RGB image of samples C1 to C12 with highlighted the measurement points used to calculate the averaged spectra reported in a, b, and c.
Minerals 15 00252 g003
Figure 4. Color difference image between corroded (samples C3–C12) and uncorroded samples (the uncorroded sample C2 was used as a reference): (a) maps of ΔE* variation; (b) maps of ΔL* variation; (c) maps of Δa* variation; and (d) maps of Δb* variation.
Minerals 15 00252 g004
Figure 5. (a) Color-composite image obtained by mixing the SC maps of cuprite (red) and clinoatacamite (green); (b) detail A1 of sample C3; and (c) reflectance spectra collected at the white points highlighted in a, used as endmembers for spectral correlation mapping.
Minerals 15 00252 g005
Figure 6. Top: Raman spectra of (a) clinoatacamite and (b) cuprite (the diagnostic range is 100–1000 cm−1) on area A1 (sample C3). Bottom: microscopic images of the measurement points (50×).
Minerals 15 00252 g006
Table 1. Quantitative composition (wt%) of the bronze alloy.
Ni (Kα)Cu (Kα)Zn (Kα)Sn (Kα)Pb (Lα)Tot.
Bronze
composition
0.3887.442.926.572.69100
St. dev.0.020.350.010.010.35
Table 2. Duration of the artificial aging for each bronze sample.
SampleAging Time (Hours)SampleAging Time (Hours)
C10C762
C20C865
C314C968
C424C1072
C538C11134
C648C12143
Table 3. Variation in CIEL*a*b* coordinates of corroded samples compared to fresh bronze using RIS data.
SampleMeasurement Point∆L*∆a*∆b*∆E*
C310.04−5.76−8.6811.72
2−2.570.282.454.92
311.54−8.57−11.7920.22
C412.04−0.02−1.373.64
26.991.35−1.067.92
33.461.47−0.075.21
C511.57−3.82−11.2512.30
213.925.37−2.8215.30
39.584.222.5311.39
C61−11.059.17−5.4115.51
211.261.24−1.8911.69
39.573.63−1.828.42
C71−7.580.36−6.0113.74
2−6.48−4.971.146.29
3−8.48−2.34−1.826.72
C810.90−6.36−6.619.87
223.00−28.94−12.9739.32
32.55−17.89−16.2726.28
C91b1.018.30−4.3510.26
2b1.062.95−7.238.79
3b3.828.25−7.9312.59
1g4.45−23.77−11.8227.85
2g10.31−12.45−15.1923.13
3g16.99−20.53−9.2328.54
C10110.30−18.22−9.9323.25
215.07−14.82−11.1324.10
34.19−20.31−15.3727.35
C1116.67−8.46−7.3213.46
28.92−17.98−17.5527.14
319.98−21.97−14.8433.32
C121−4.07−8.47−4.0810.43
2−5.76−6.00−7.2310.46
3−1.79−18.42−8.5420.48
Disclaimer/Publisher’s Note: The statements, opinions and data contained in all publications are solely those of the individual author(s) and contributor(s) and not of MDPI and/or the editor(s). MDPI and/or the editor(s) disclaim responsibility for any injury to people or property resulting from any ideas, methods, instructions or products referred to in the content.

