3.1. Magnetic Matrix Optimization
The particle size fraction of the sample is primally distributed in −0.25 + 0.10 mm and −0.10 + 0.043 mm, and the corresponding yields are 46.52% and 40.79%, respectively. Consequently, the suitable rod diameters are more than 2.5 and 1.0 mm because
K > 10. The
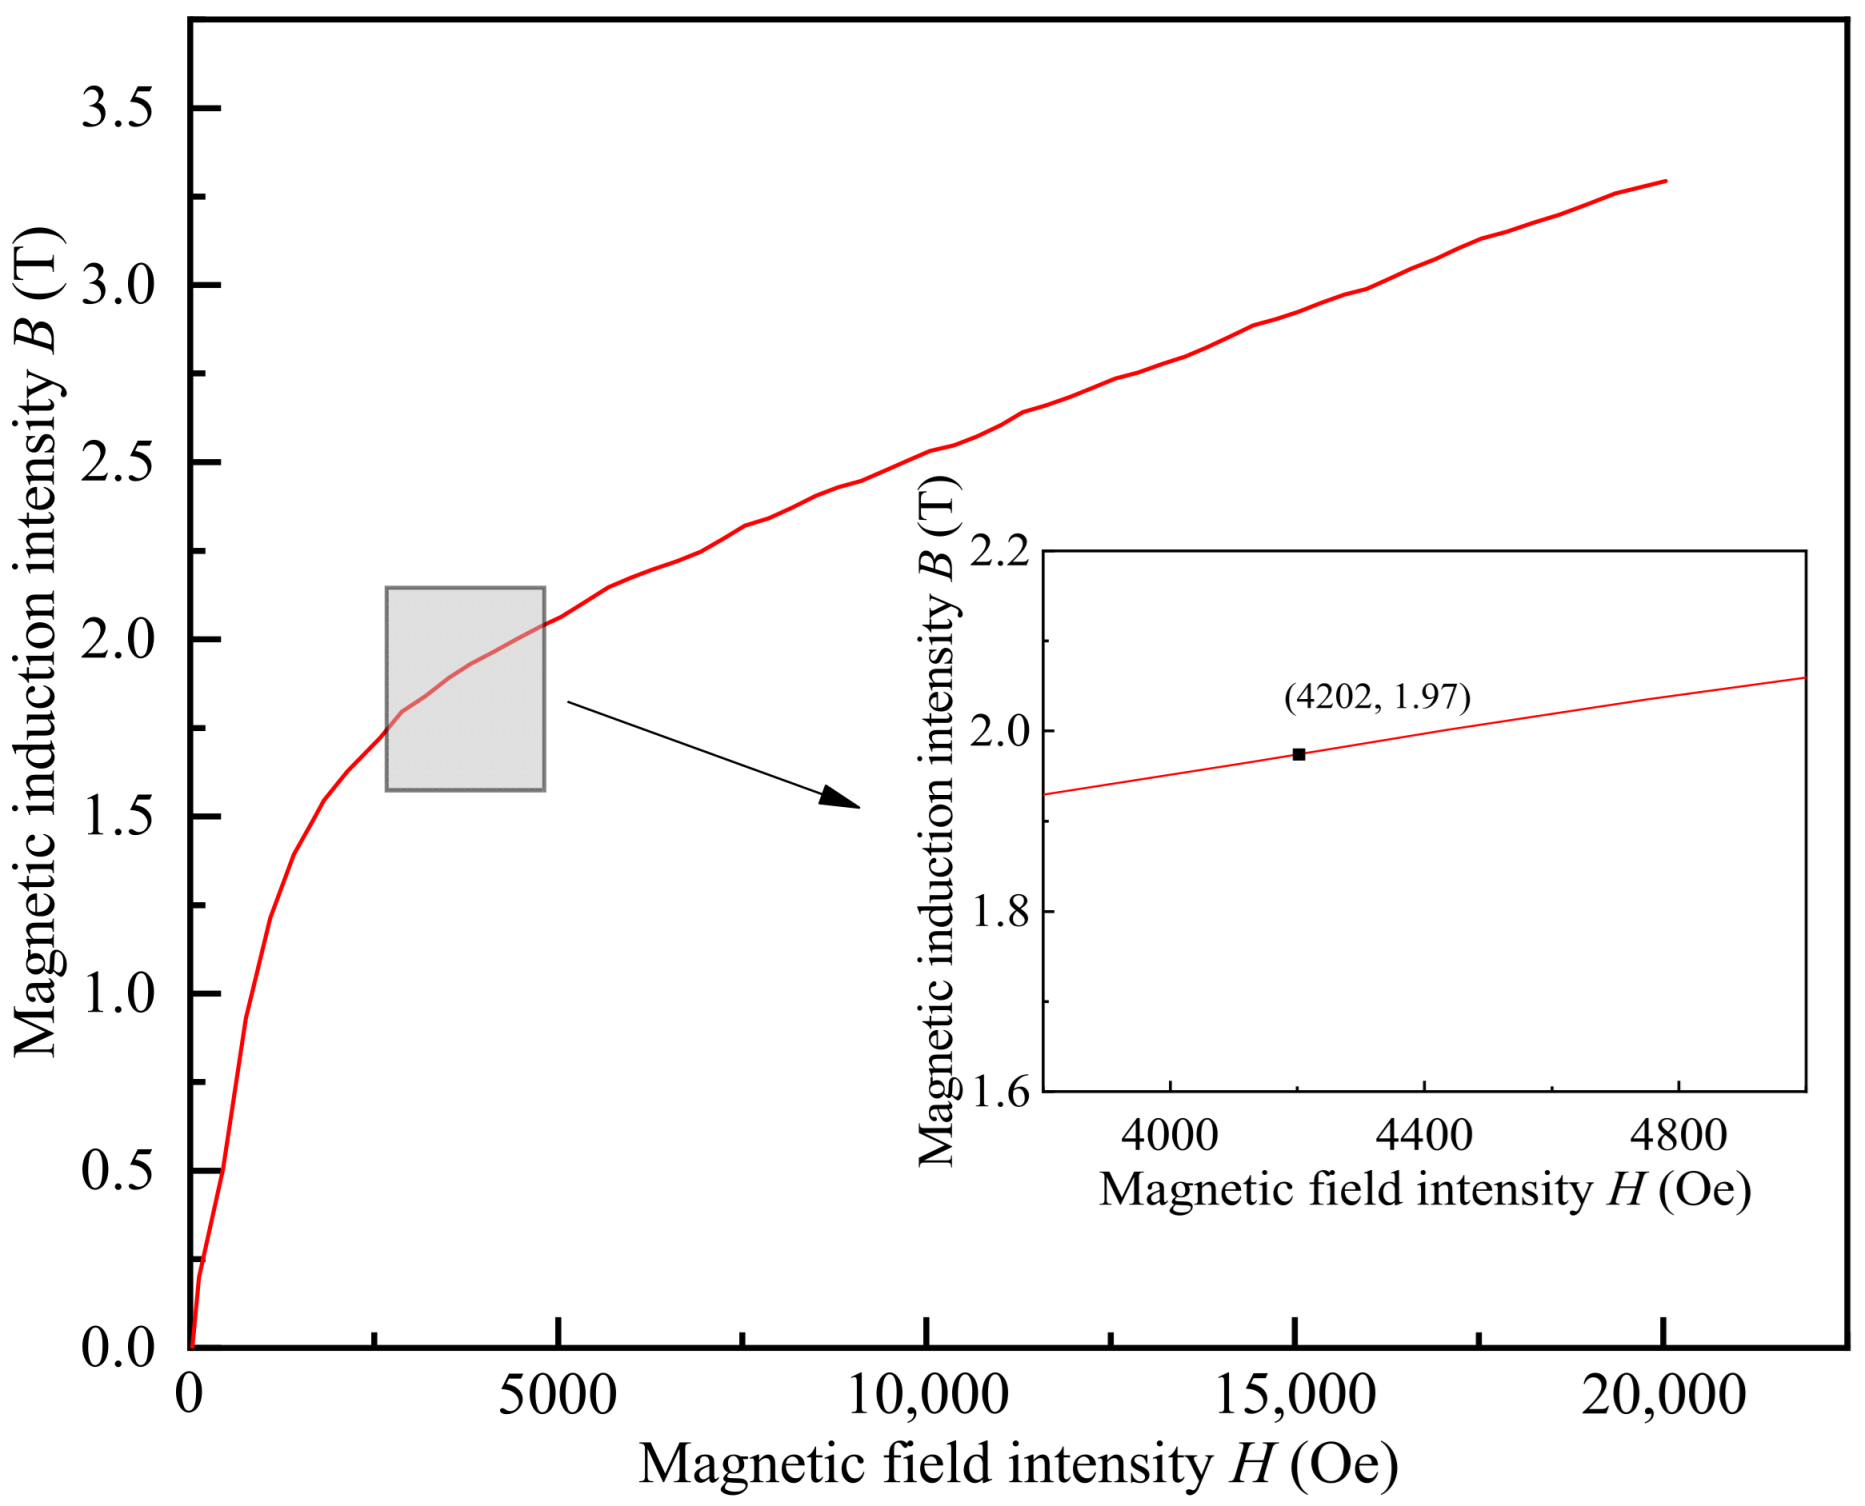
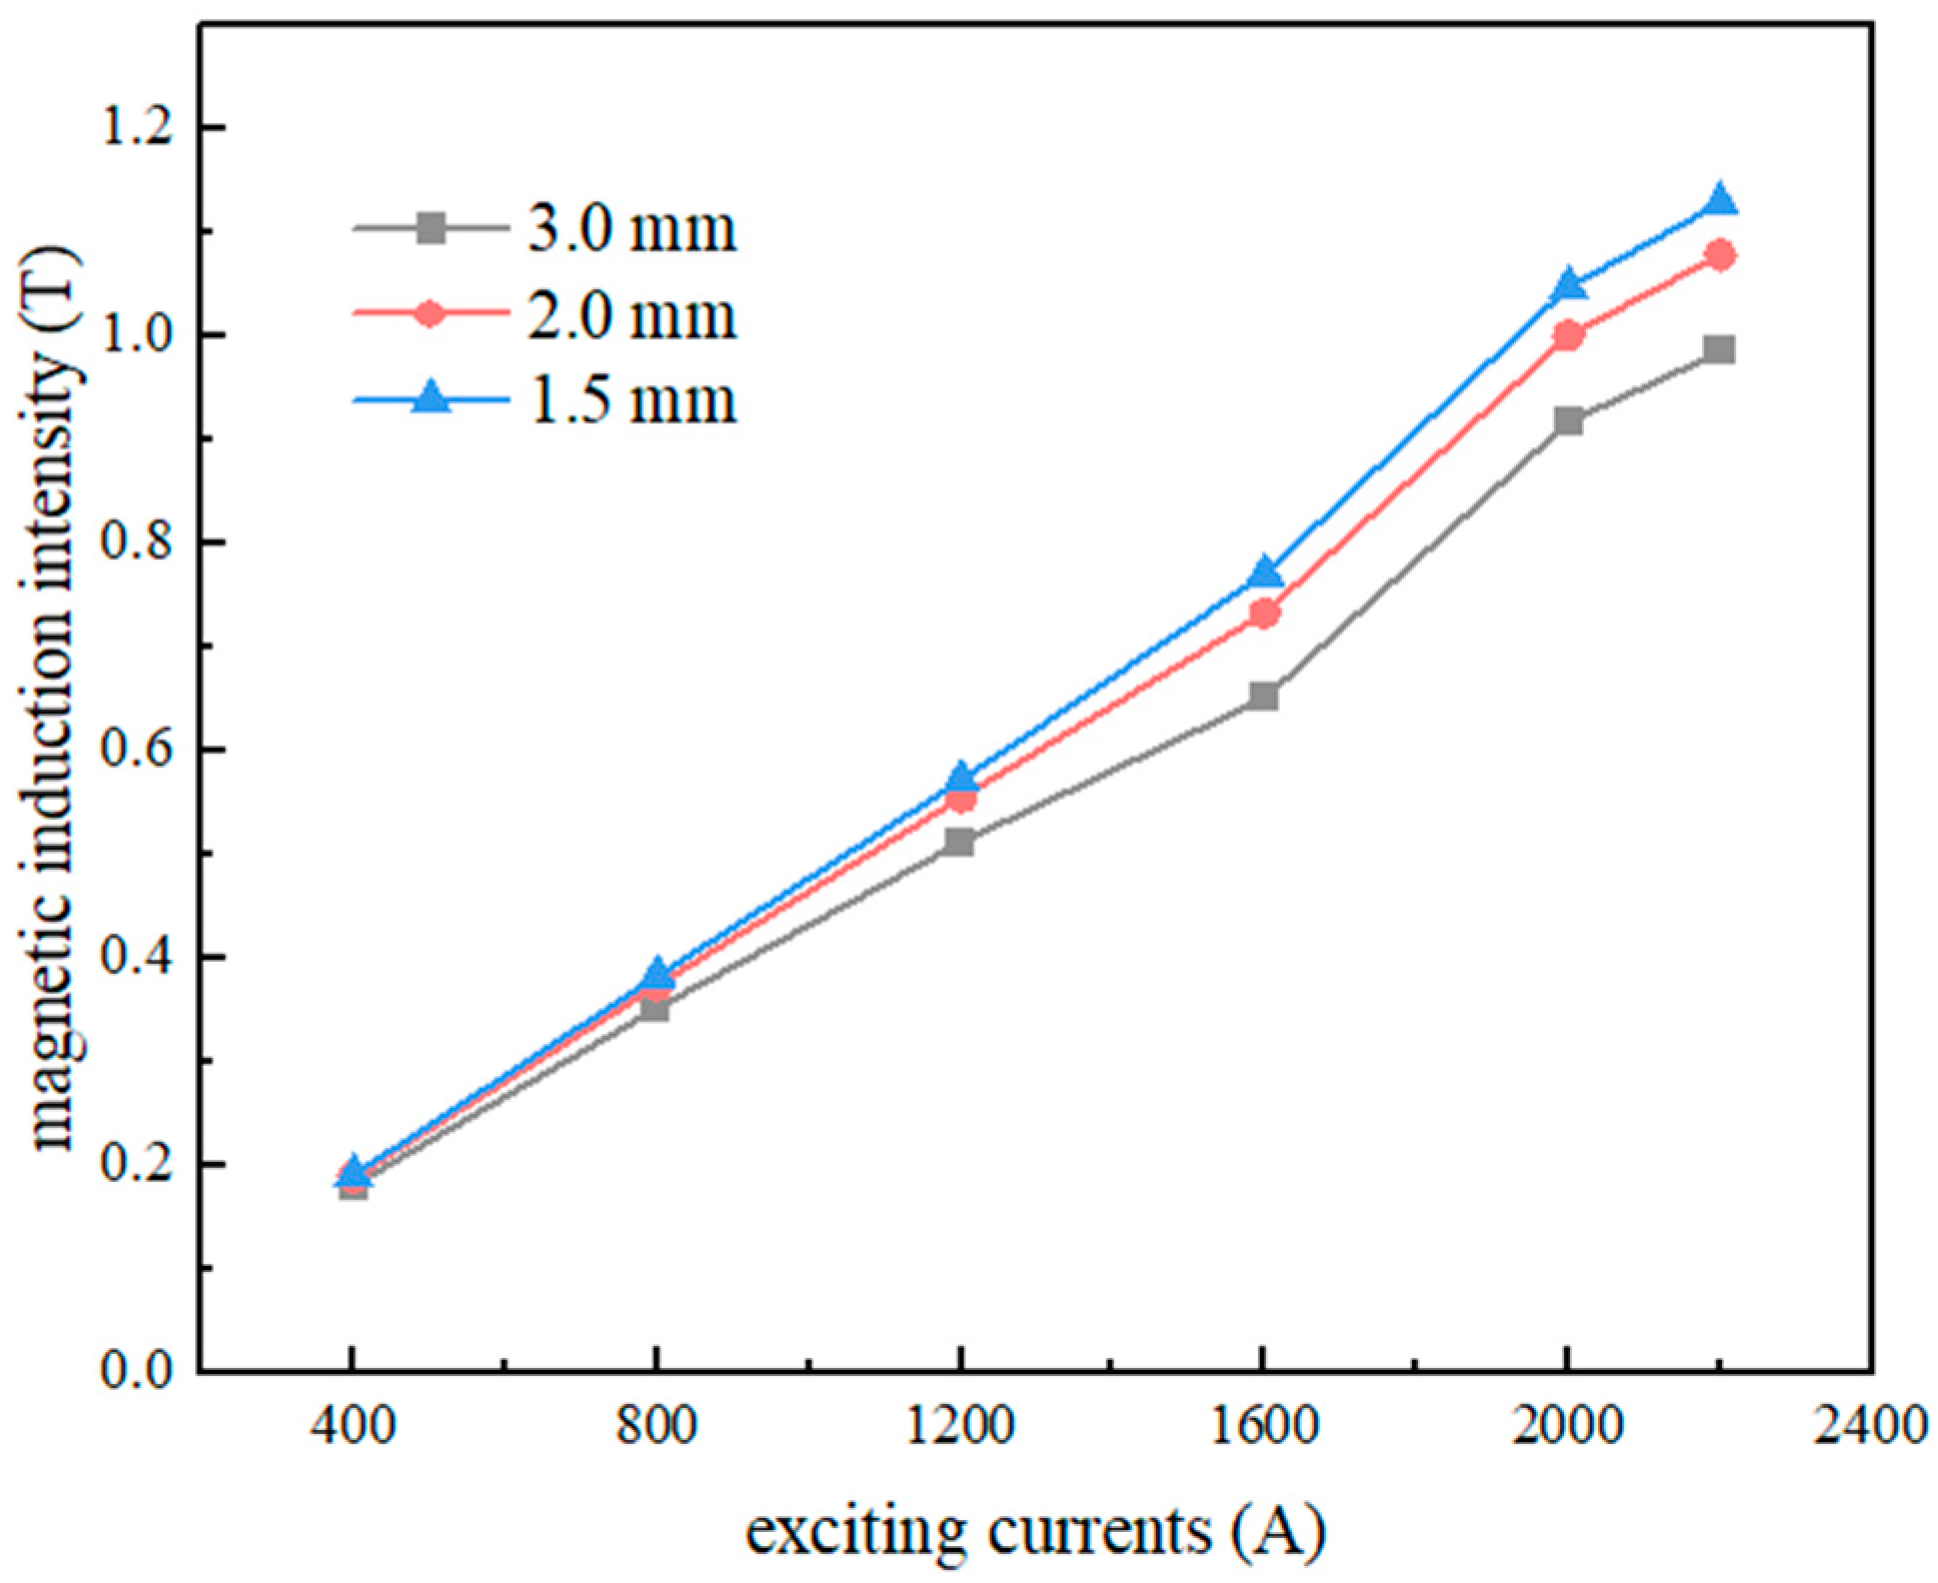
ϕ3.0 mm rod is suitable as the matrix for separating the −0.25 + 0.10 mm fraction. Meanwhile, the optimal rod diameter for separating the −0.10 + 0.043 mm fraction remains to be determined. The maximum magnetic induction strength measured on the surface of rods with different diameters under varying exciting currents is presented in
Figure 8. The test data are measured in the unmoving state of the device.
The results presented in
Figure 8 indicate that the difference in magnetic induction intensity on the surfaces of rods with different diameters becomes pronounced with the increase in the excitation current. Specifically, the magnetic induction field of the
ϕ3.0 mm rod is lower than that of the
ϕ2.0 and
ϕ1.5 mm rods. Under a large current, the magnetic induction intensities of the
ϕ2.0 and
ϕ1.5 mm rods are similar, with the former slightly lower. Considering the stability of the mechanical properties and the induction field, the
ϕ3.0 mm magnetic matrix rod is suitable for separating coarse particle size fractions with stronger magnetism, and
ϕ2.0 and
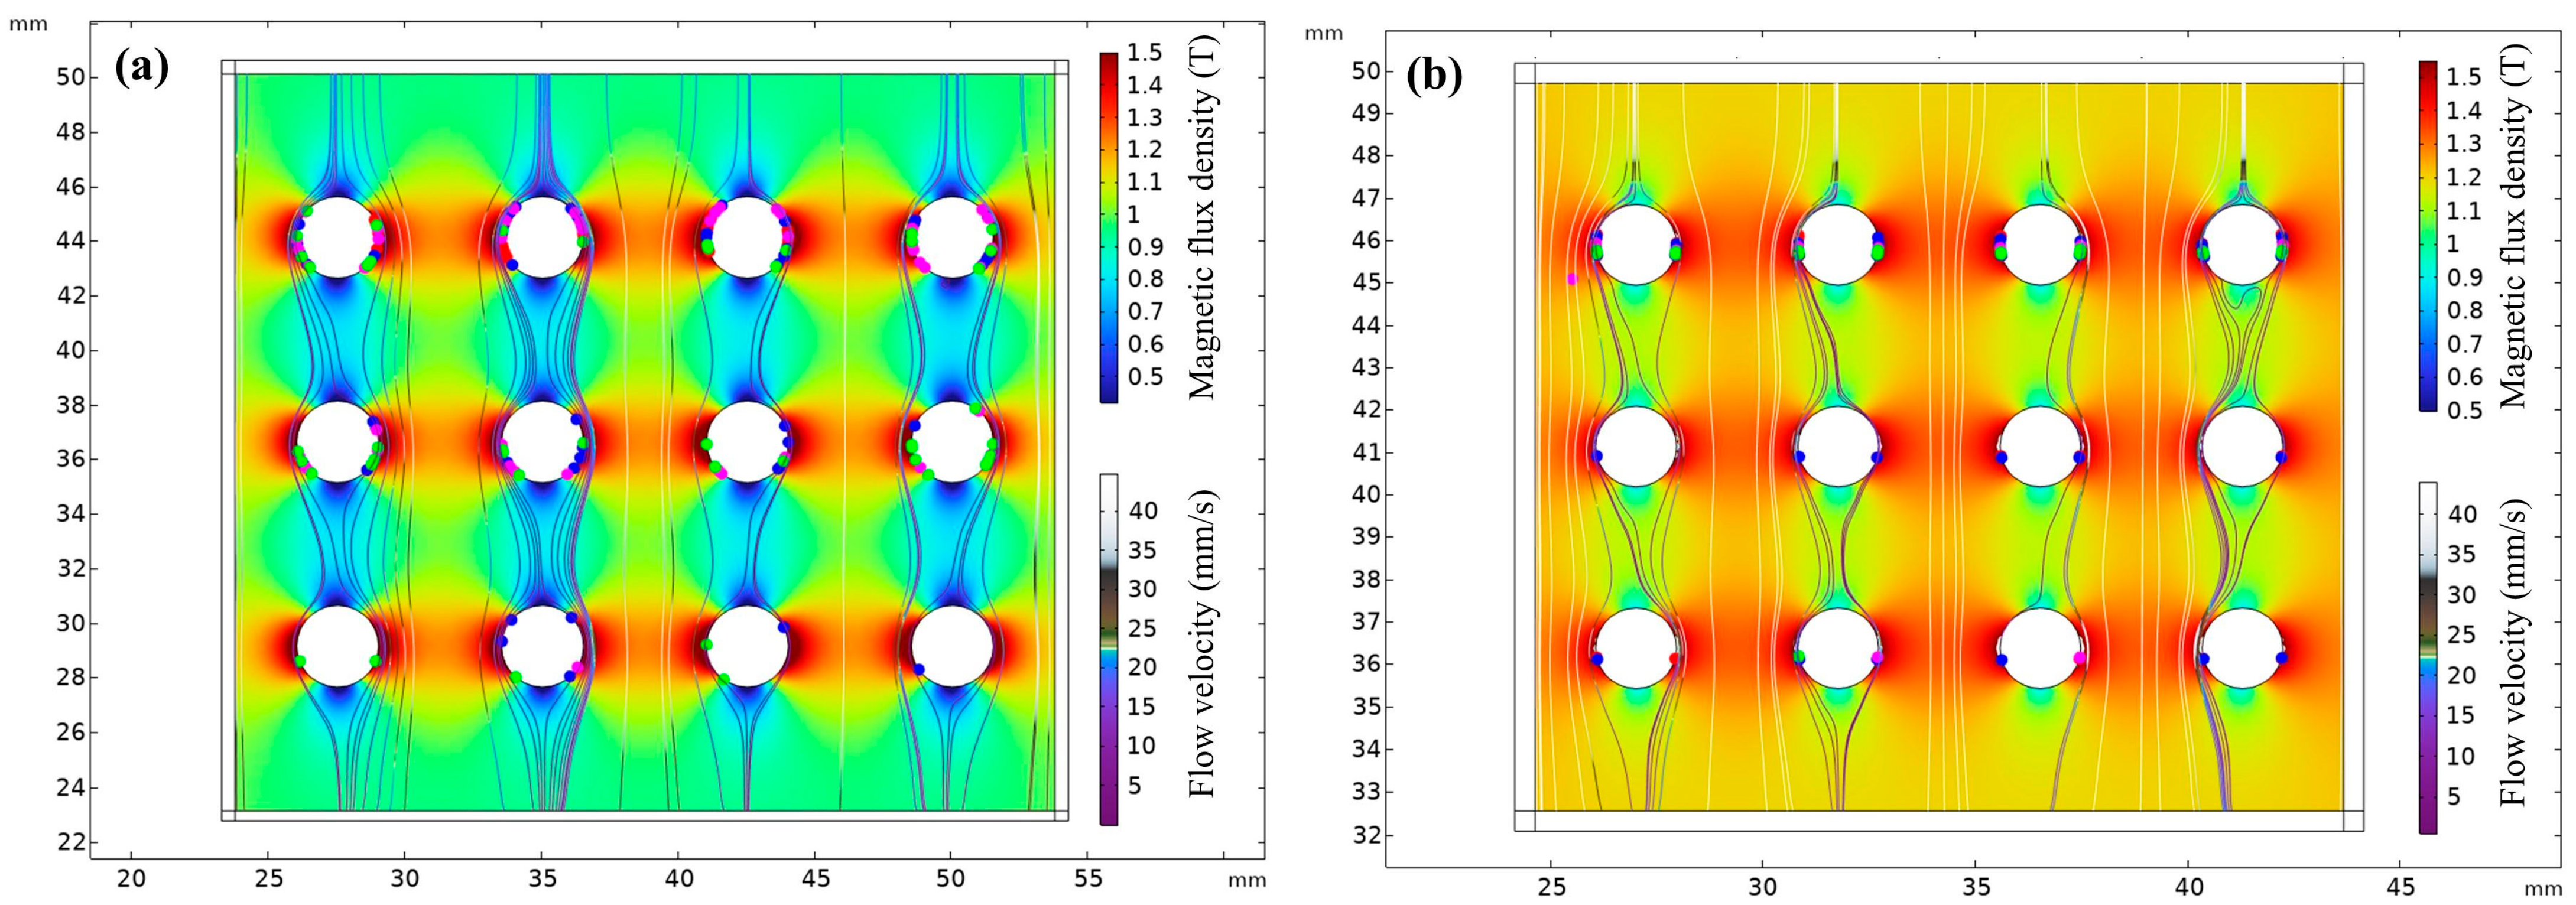
ϕ1.5 mm are suitable for separating relatively fine particle size fractions with weaker magnetism. This inference can be verified by the models of particle tracking with different diameters of rod matrixes in
Figure 9, as well as the capture probability of particles using rod matrixes in
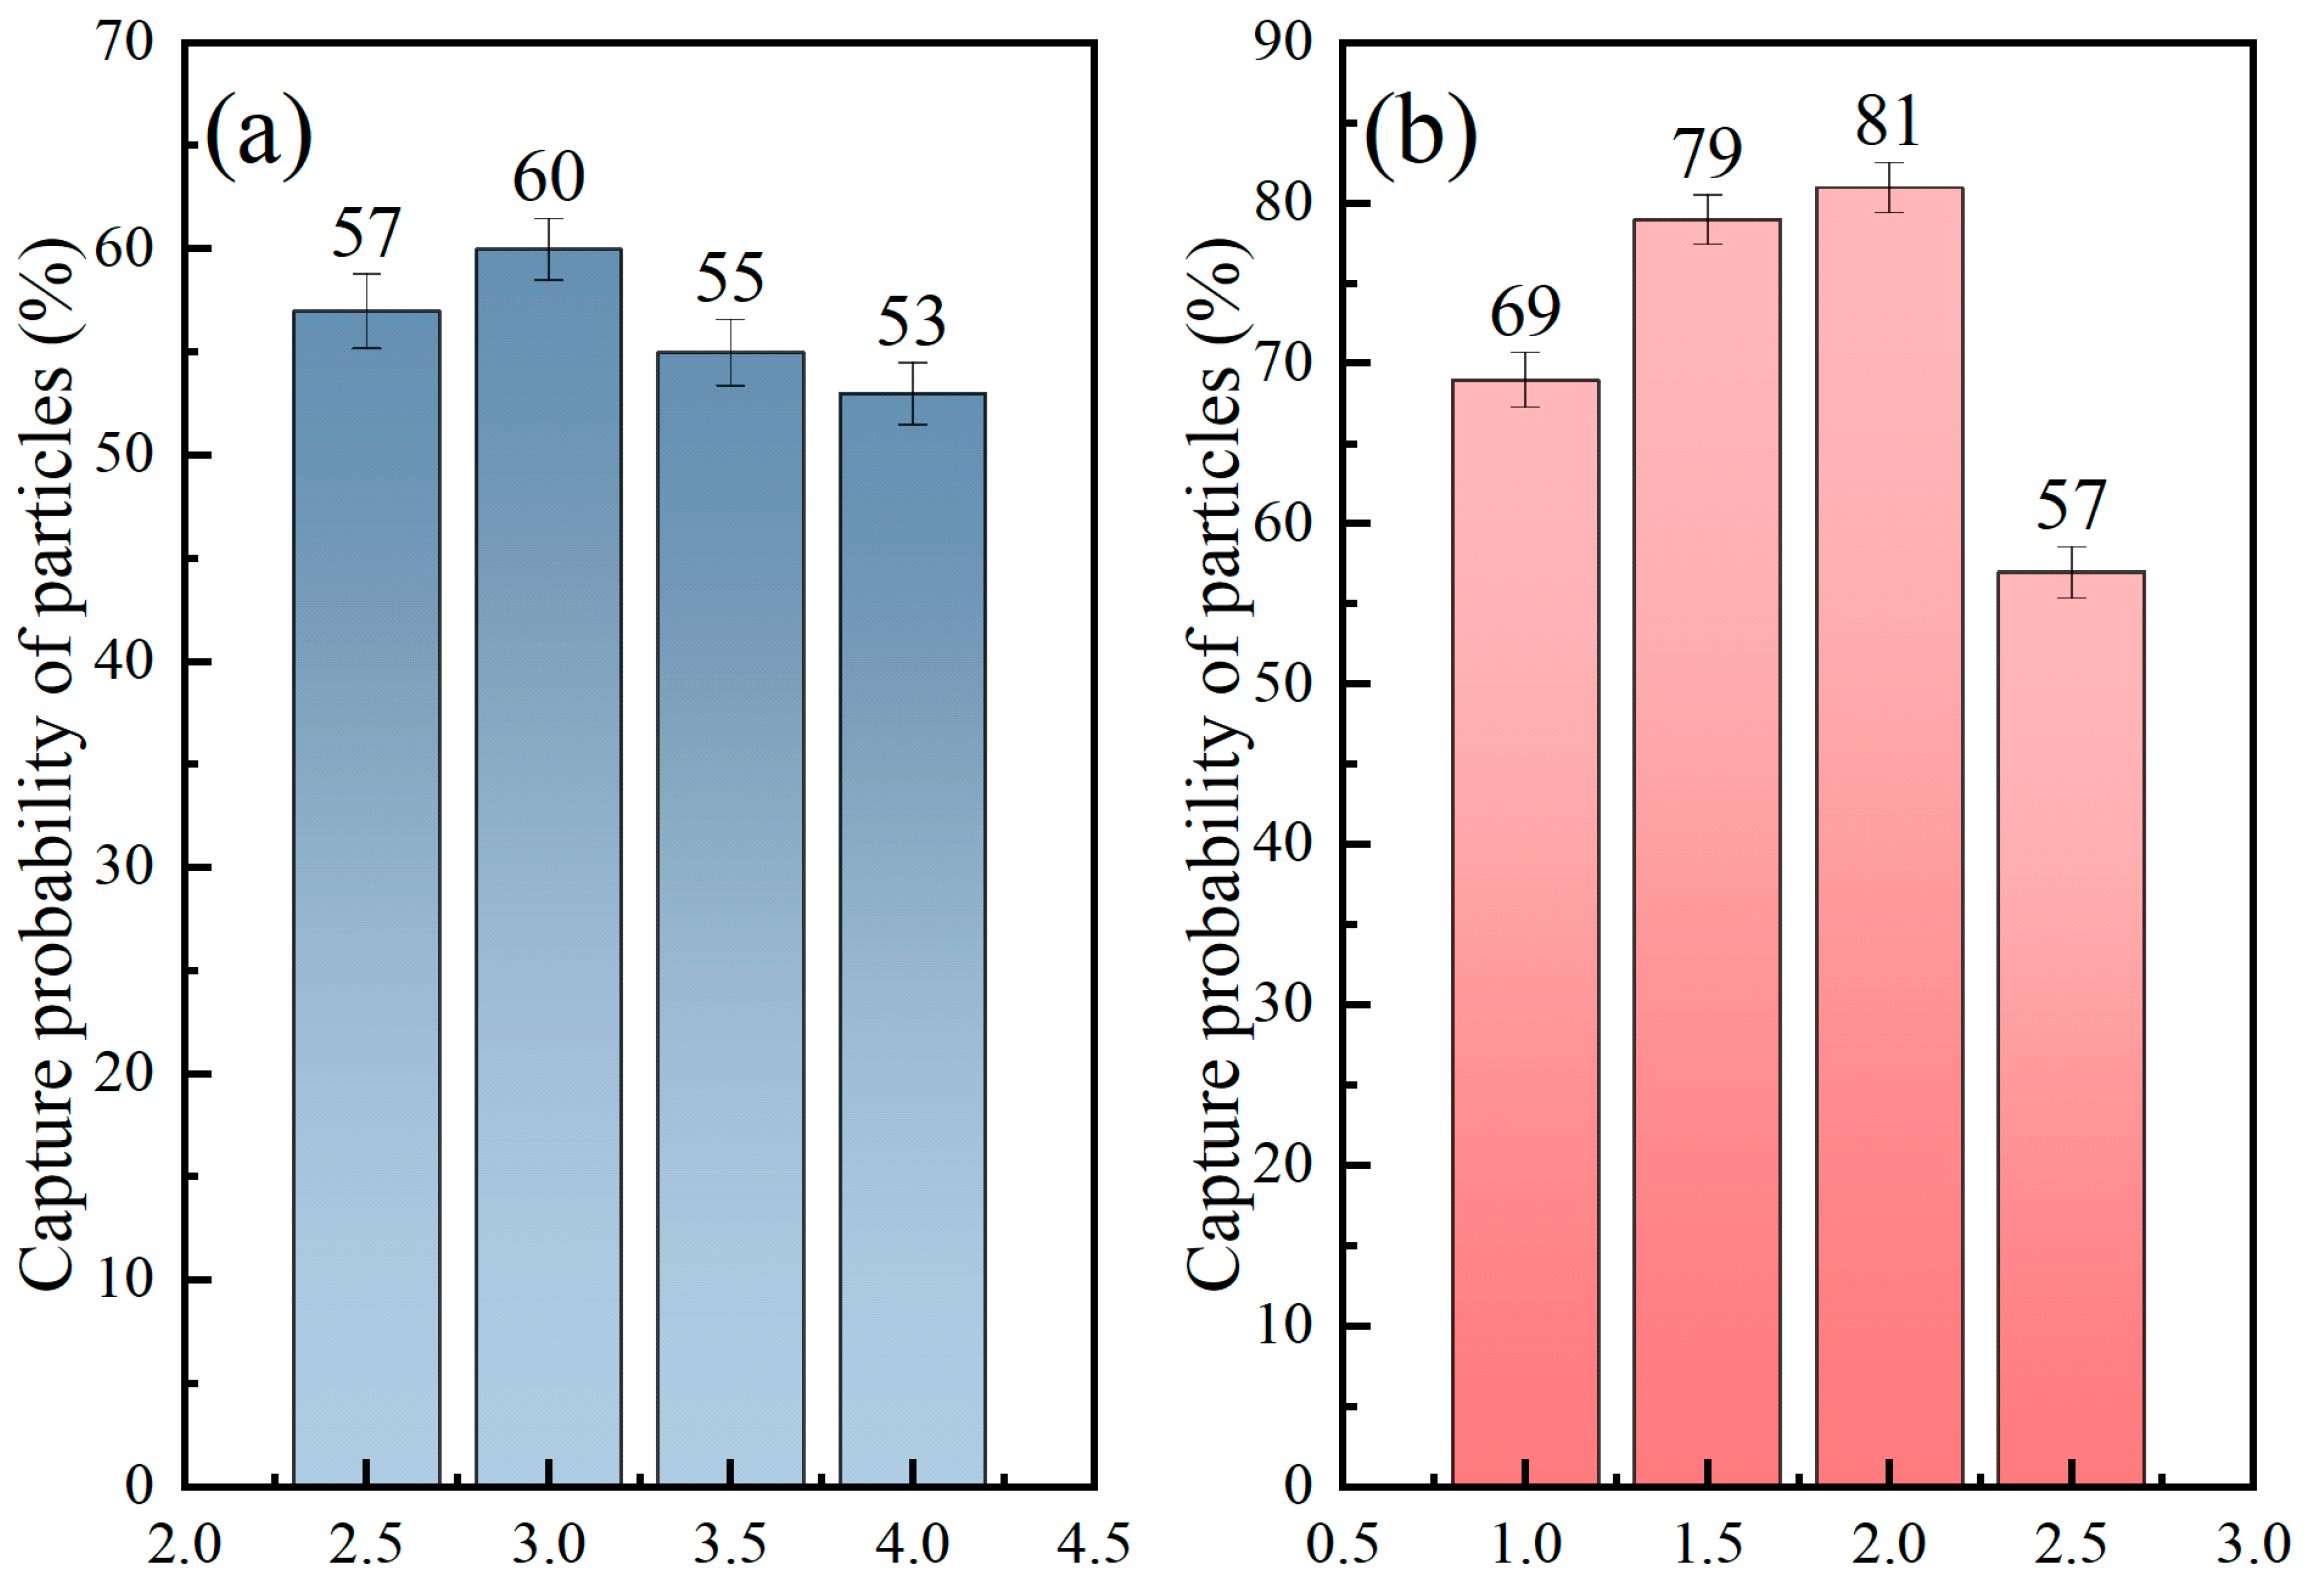
Figure 10.
Figure 10 shows that the highest particle capture probability of 60% is achieved for the −0.25 + 0.10 mm fraction when the diameter of the rod matrix is
ϕ3.0 mm. When the diameter of the rod matrix is
ϕ2.0 mm, the capture probability for the −0.10 + 0.043 mm particles is a maximum of 81%, which is very close to the 79% capture probability for a diameter of
ϕ1.5 mm.
In addition to the diameter of the rods, their filling ratio also affects the magnetic field distribution. Taking the magnetic matrix rod of
ϕ2.0 mm as an example, the maximum magnetic induction strength measured on the surfaces of rods with different filling ratios under varying exciting currents is shown in
Figure 11.
Figure 11 demonstrates that the magnetic induction strength initially rises with the increase in the filling ratio and then declines. The filling ratio always falls in a range from 14% to 16% when the maximum magnetic induction intensity is achieved at various excitation currents. A higher magnetic induction intensity corresponds to a stronger ability to capture magnetic minerals. Therefore, an optimal filling ratio of approximately 16% is chosen.
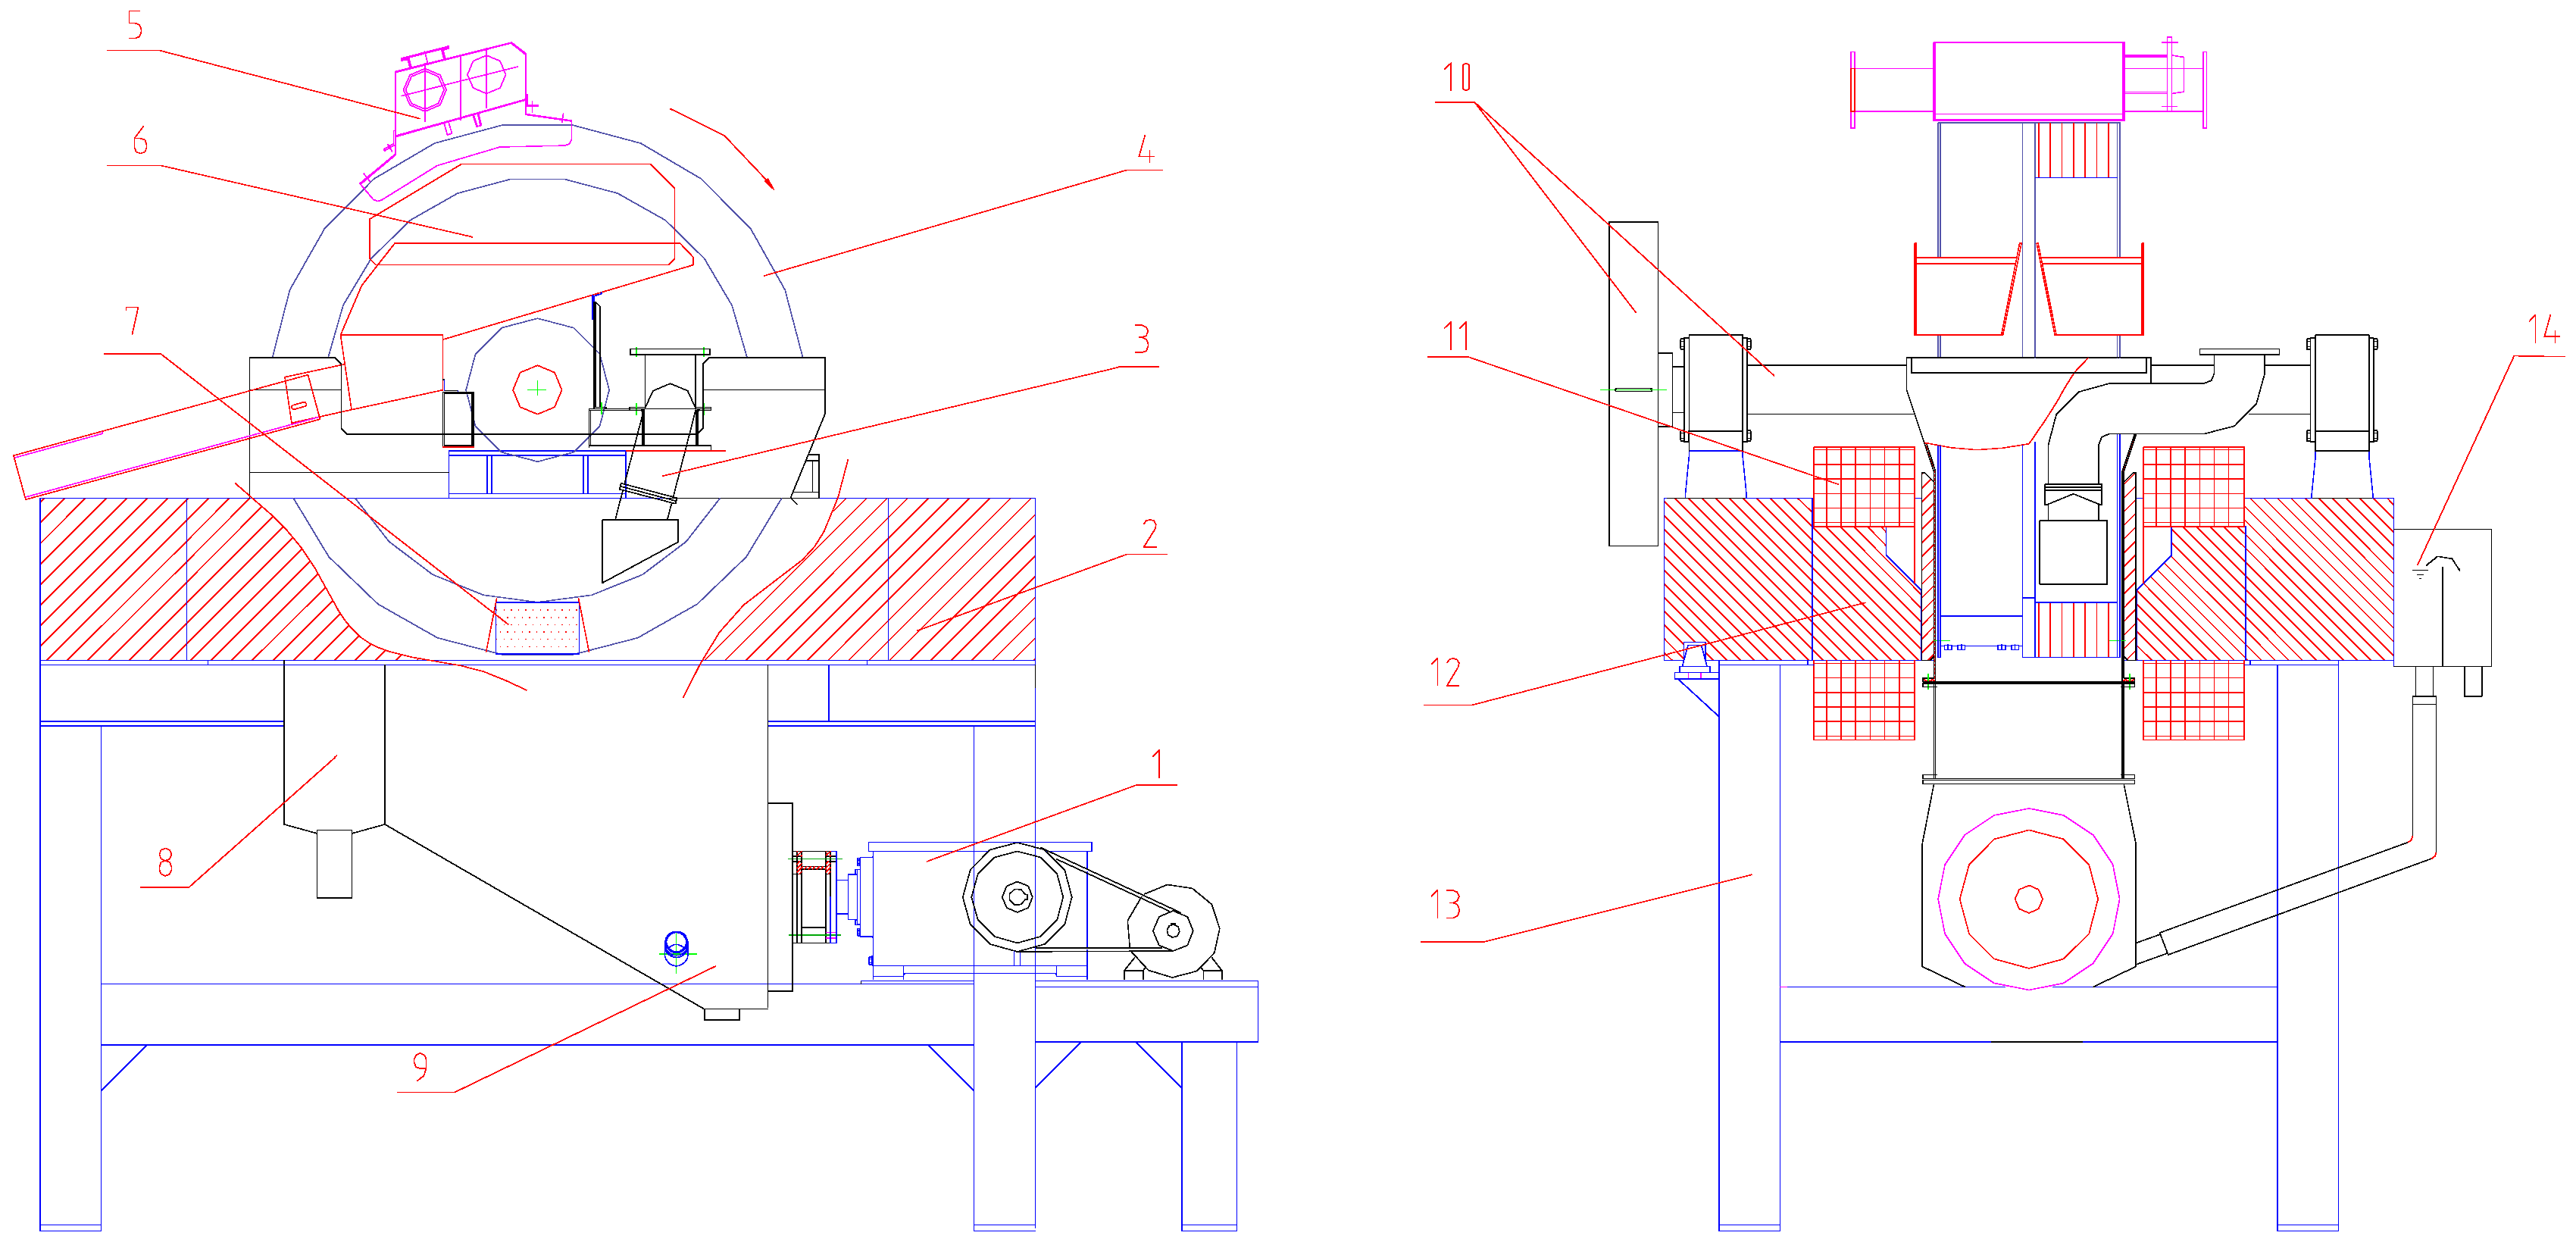
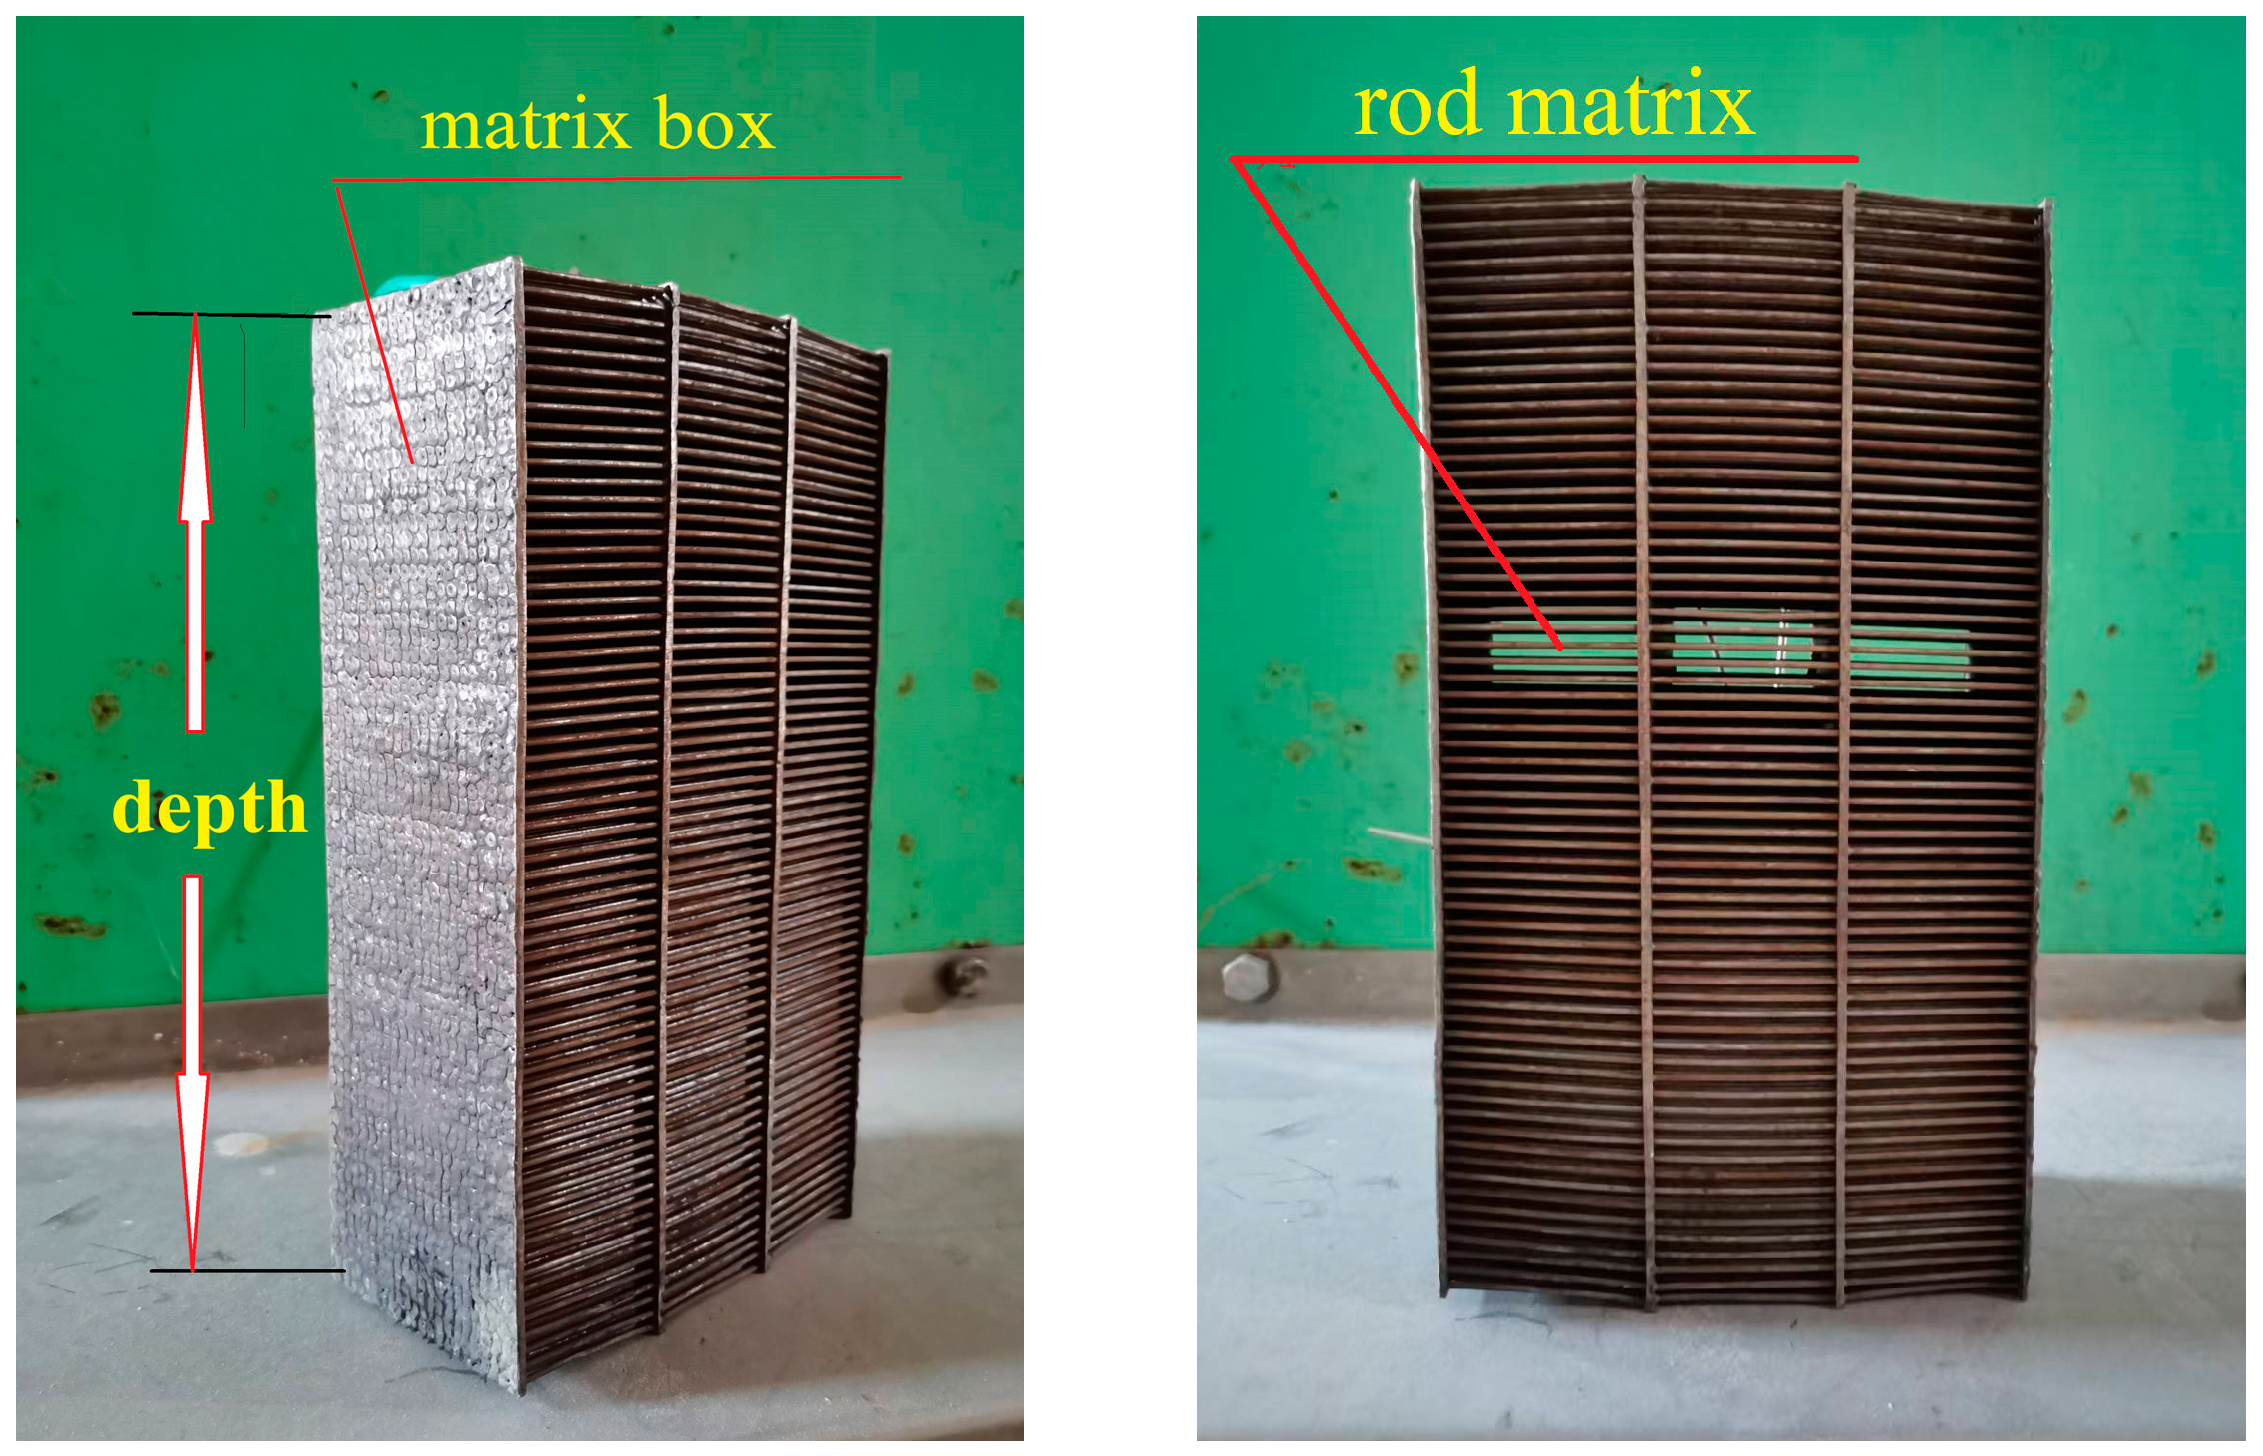
The number of arranged layers (also referred to as “depth”) in the magnetic matrix is closely correlated with the capture capacity and the unloading efficiency of magnetic particles. A typical matrix box utilized in the transverse-field HGMS is depicted in
Figure 12, with a depth of 248 mm, a length of 140 mm, a width of 78 mm, and a rod diameter of 2.0 mm as an example. The depth of the matrix box is high, resulting in a large processing capacity. The optimal test conditions are as follows: feed quantity of 1500 g, stroke of 14 mm, pulsating frequency of 240 r/min, and magnetic field intensity of 0.42 T, which are obtained through condition tests. The experimental results of the ore unloading efficiency with different flushing water quantities are presented in
Table 4. The findings show that ore unloading efficiency ranges from 75.59% to 85.78% as the flushing water flow rate increases from 3 L/min to 12 L/min. Despite the higher flushing water volumes, the ore unloading efficiency remains suboptimal. This notion suggests that the commonly used magnetic matrix box, characterized by a considerable depth, is inherently limited in its ability to achieve high ore unloading efficiency.
The element matrix method is utilized to assess the capture of magnetic particles at various positions within the matrix box (from top to bottom) and further investigate the potential for reducing the depth of the matrix box. In this method, the matrix box is divided into five elements (A~E) (
Figure 13). The steps to obtain the amount of ilmenite particles captured by each layer of matrix (A~E) are as follows: restore the process of capturing ilmenite particles in the magnetic matrix box in the stationary state; when the feeding is finished, keep the original background magnetic field strength unchanged (0.42 T) until there is no liquid outflow at the bottom of the matrix box; and then reduce the background magnetic field strength to 0.1 T, although, at this time, the ilmenite particles are subjected to the magnetic force of the substrate decreases, but the particles are still captured on the surface of the substrate under the action of the capillary force of the liquid. Immediately after that, perform a layer-by-layer slow removal of the matrix and collection of ilmenite particles in the order of A~E. Multiple experiments were conducted, and the data were statistically processed. The experimental results, summarized in
Table 5, suggest a gradual decrease in the capture weight and the TiO
2 grade as one moves from element A to E. Specifically, the capture weight and TiO
2 grade of element A are 252.60 g and 16.19%, whereas those of element E are only 55.65 g and 11.82%, respectively. These findings indicate that the capture efficiency in the lower elements of the matrix box is significantly reduced, thus supporting the feasibility of minimizing the number of layers in the matrix box.
In summary,
Table 4 and
Table 5 indicate that the matrix box should not be considerably deep, as this would hinder the efficient unloading of ore and prevent the achievement of optimal capture performance. Therefore, the typically used deep, integrated matrix box must be segmented to balance capturing and unloading efficiencies, allowing for independent unloading in each segment.
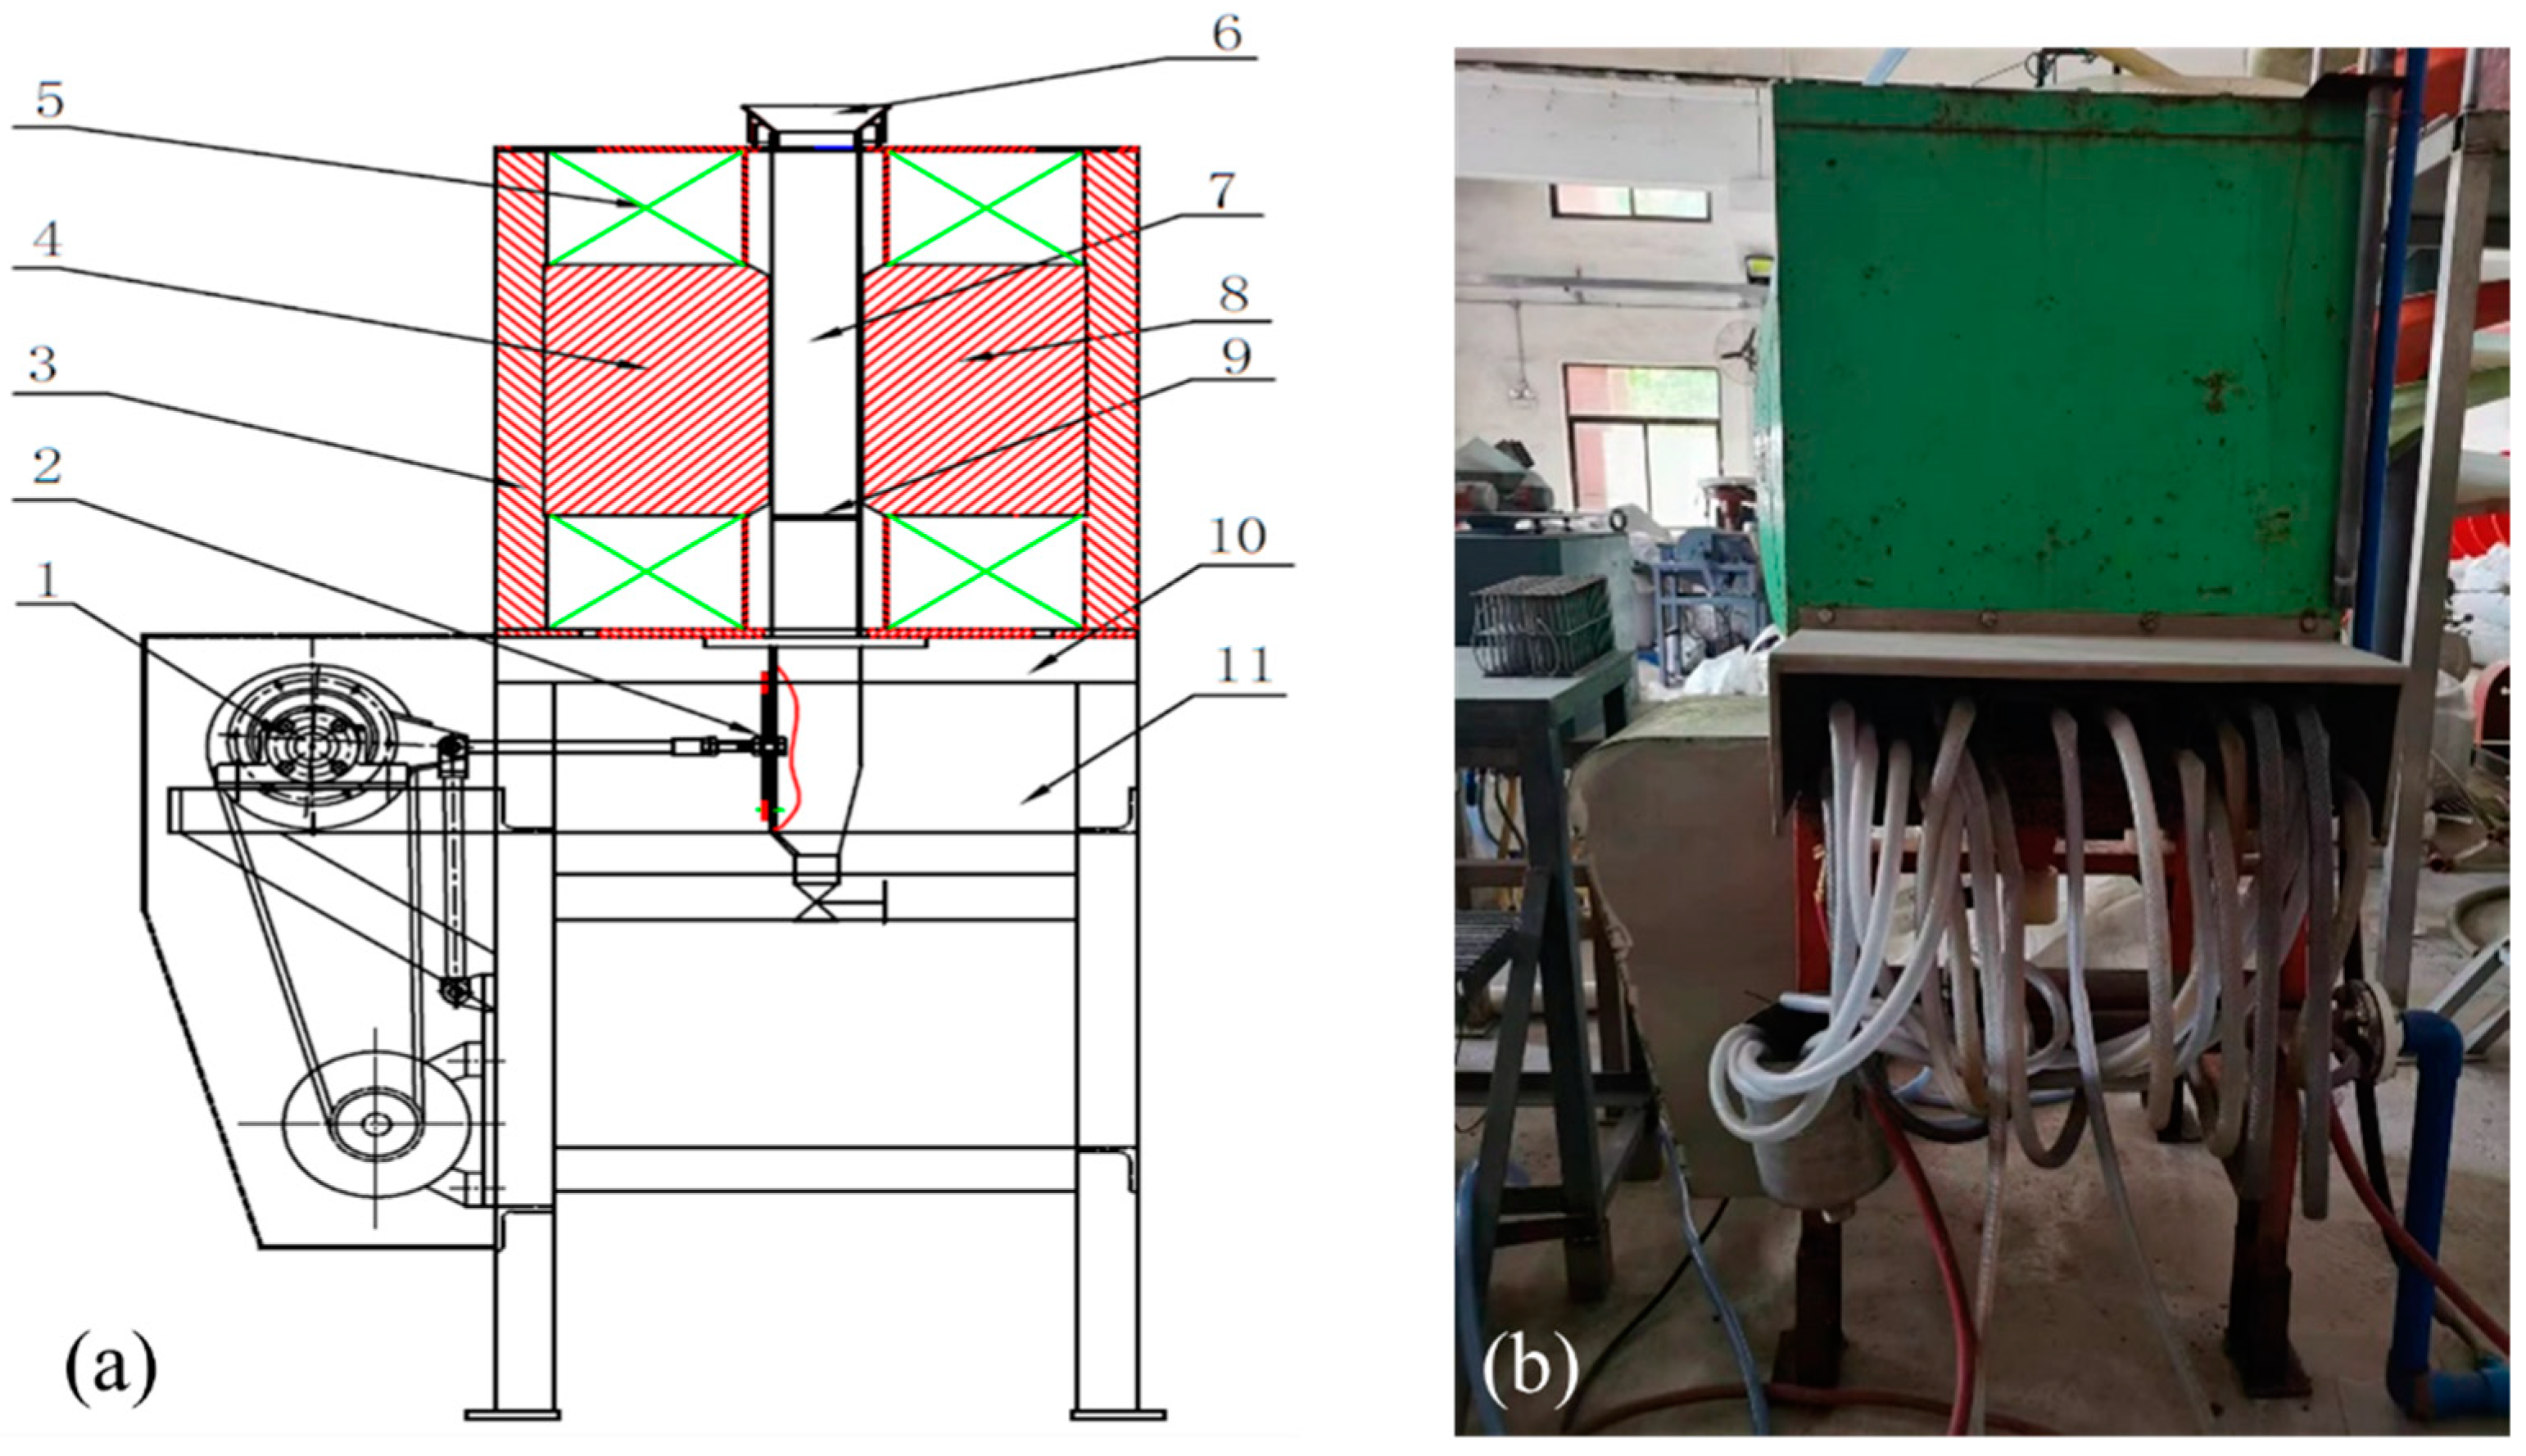
3.2. Pilot-Scale Validation Research
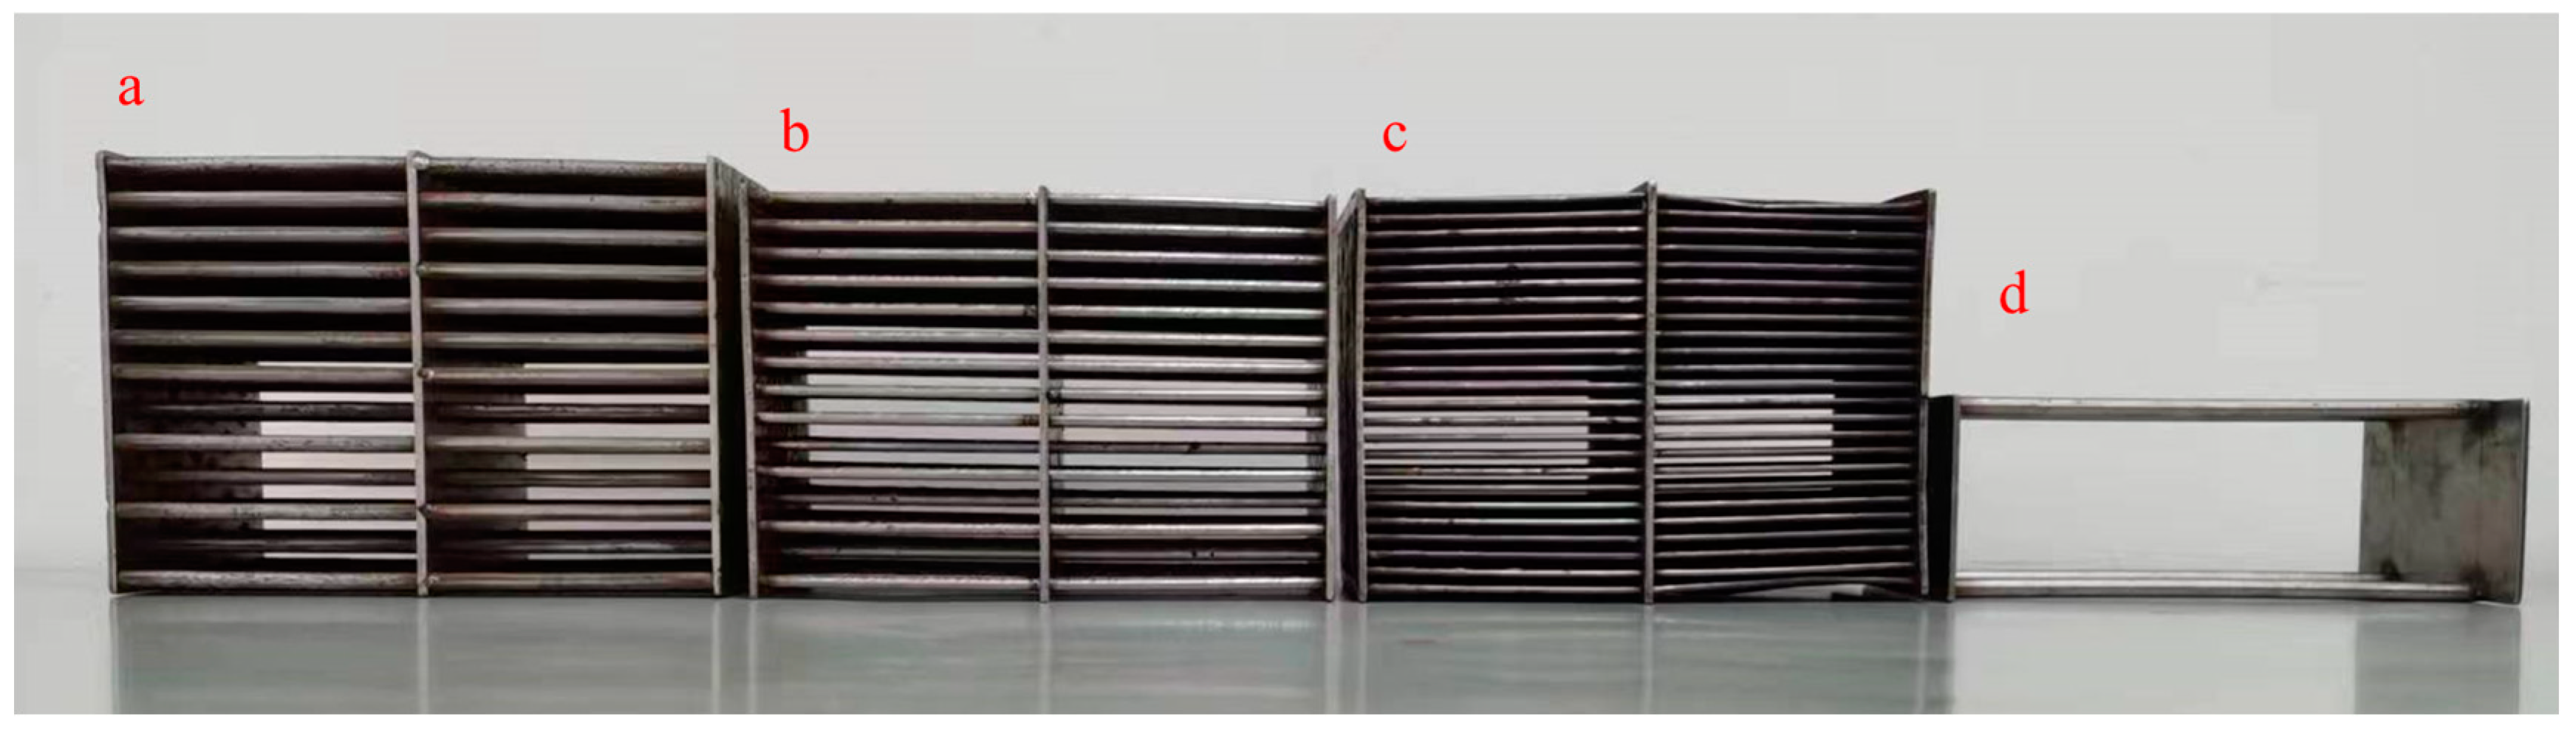
Segmented short magnetic matrix boxes with rod diameters of 3, 2, and 1.5 mm are fabricated to validate the results of the magnetic matrix box optimization, as illustrated in
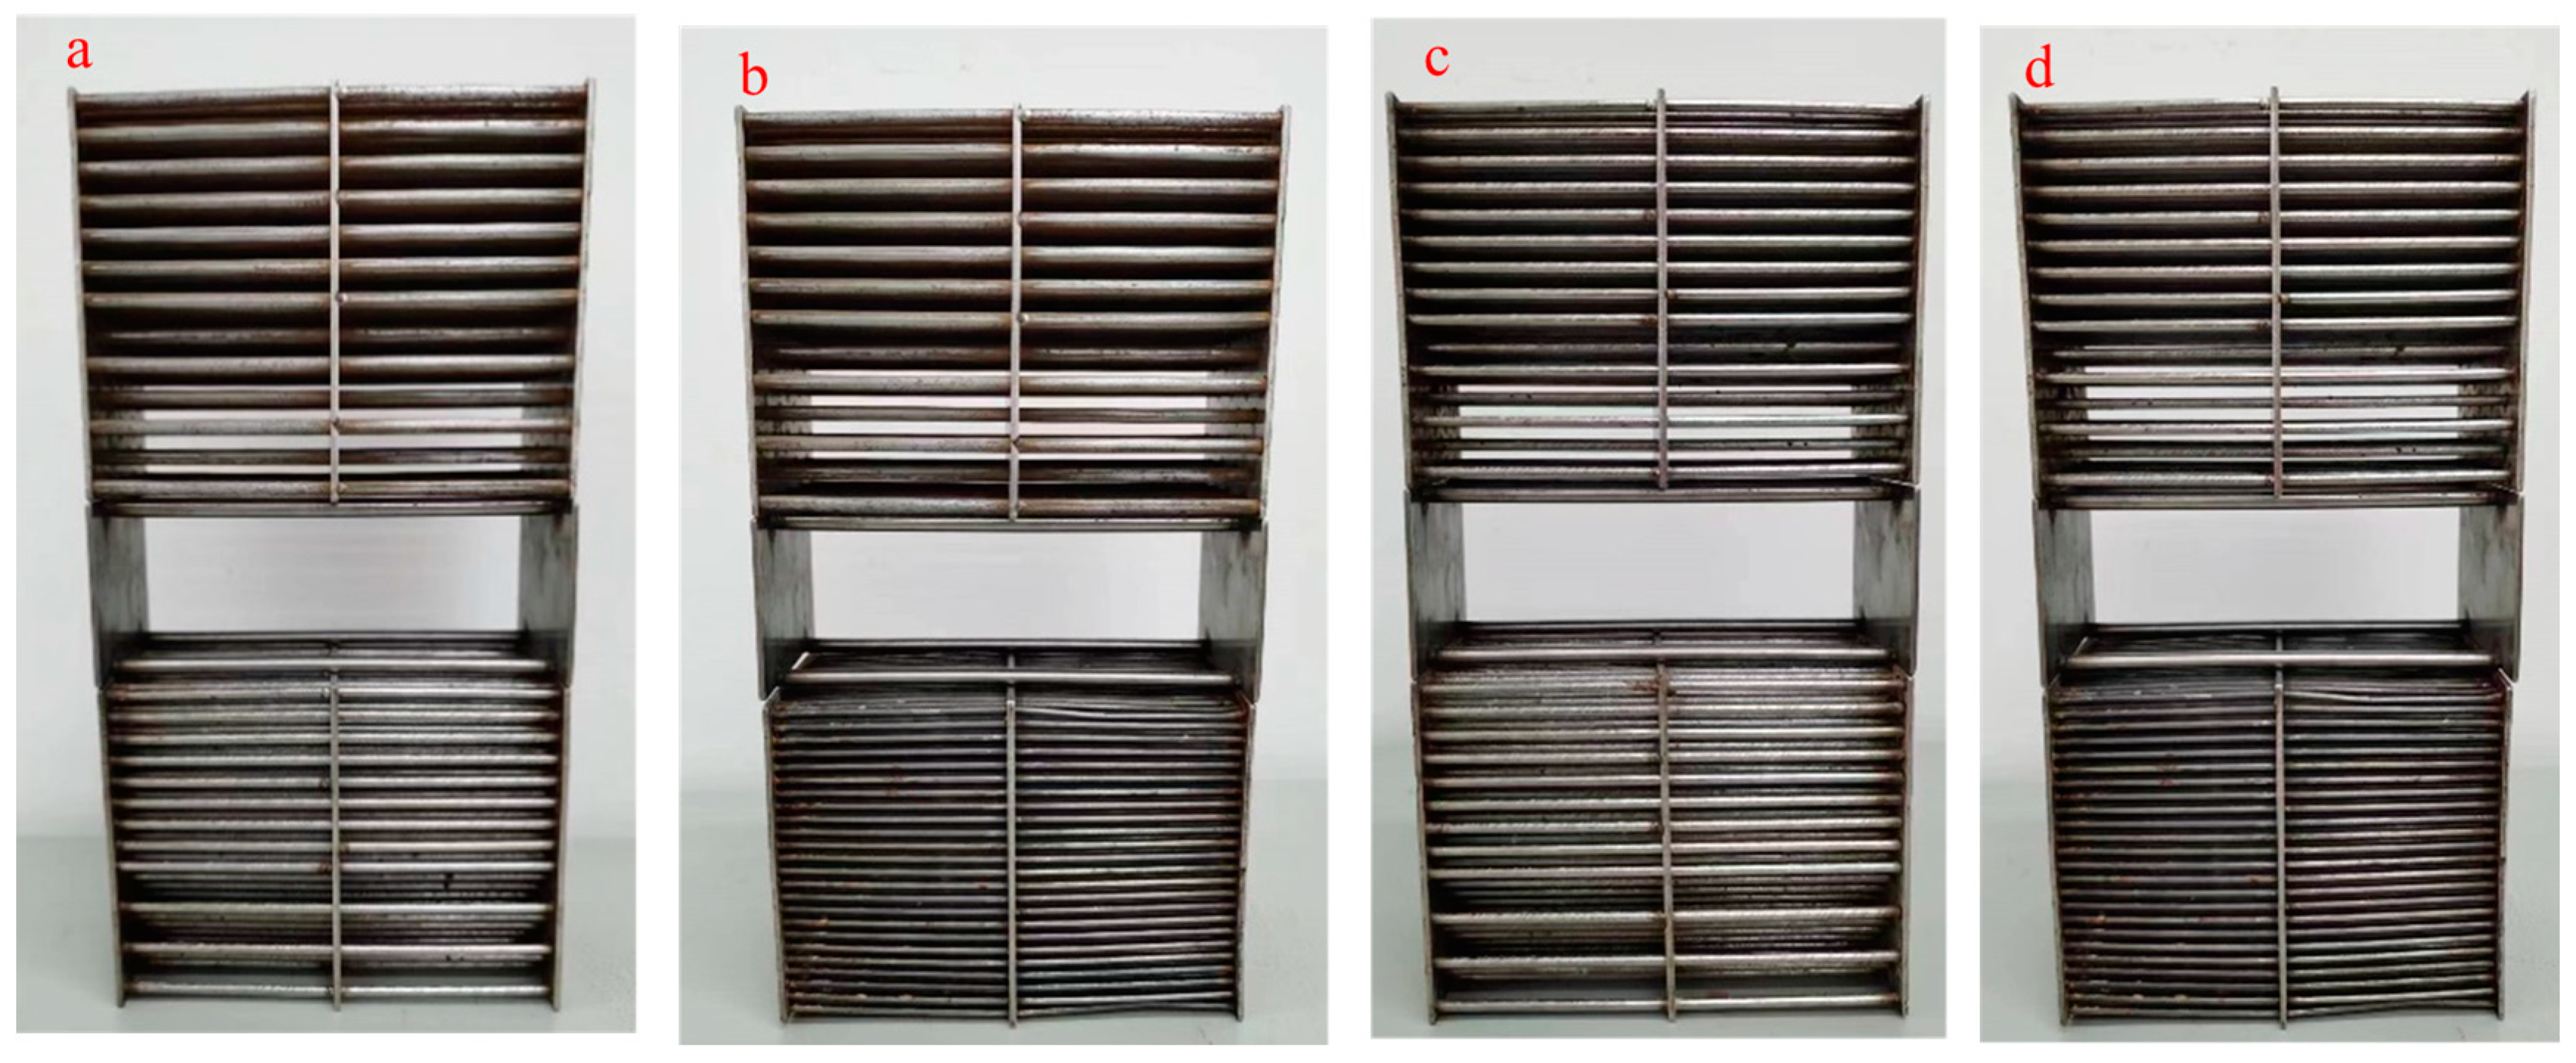
Figure 14a–c. The typical combinations of these short matrix boxes used in pilot-scale HGMSs are demonstrated in
Figure 15. The rod diameter of the upper-layer matrix box is intentionally larger than that of the lower-layer matrix box, facilitating the early capture of relatively coarse and strongly magnetic particles. The upper and lower-layer matrix boxes are connected via a holder (
Figure 14d). The experimental results for the typical combination of the double-layer matrix box are presented in
Table 6. The combination of matrix boxes with rod diameters of
ϕ3 and
ϕ2 mm yields the optimal performance for ilmenite separation. This configuration achieves a TiO
2 grade of 18.46% and a recovery of 87.32%. Additionally, this configuration exhibits the highest ore unloading efficiency, at 94.07%. The separation index and ore unloading efficiency surpass the results presented in
Table 4 that were obtained using the traditional integrated matrix box. The suitable magnetic matrix box combination is
ϕ3 mm and
ϕ2 mm. This notion means that the two-layer ring can be used in industrial equipment. The inner ring is configured with a magnetic matrix box of
ϕ3 mm rod. Meanwhile, the outer ring is configured with a magnetic matrix box of
ϕ2 mm rod.
The specific results of the screen analysis for the optimal concentrate and size fraction recovery are listed in
Table 7. These results indicate that the recovery of the size fractions ranging from −0.15 mm to +0.038 mm is relatively uniform, with a value of approximately 90%. However, the recovery of the coarser fraction (+0.15 mm) and the finer fraction (−0.038 mm) is comparatively low. The lower recovery of the coarser fraction can be attributed to poor dissociation. Meanwhile, the reduced recovery of the finer fraction is due to the insufficient magnetic attraction resulting from the small particle size. Therefore, these pilot-scale experimental findings provide strong evidence that supports the validity of the magnetic matrix optimization.
3.3. Industrial Application Case
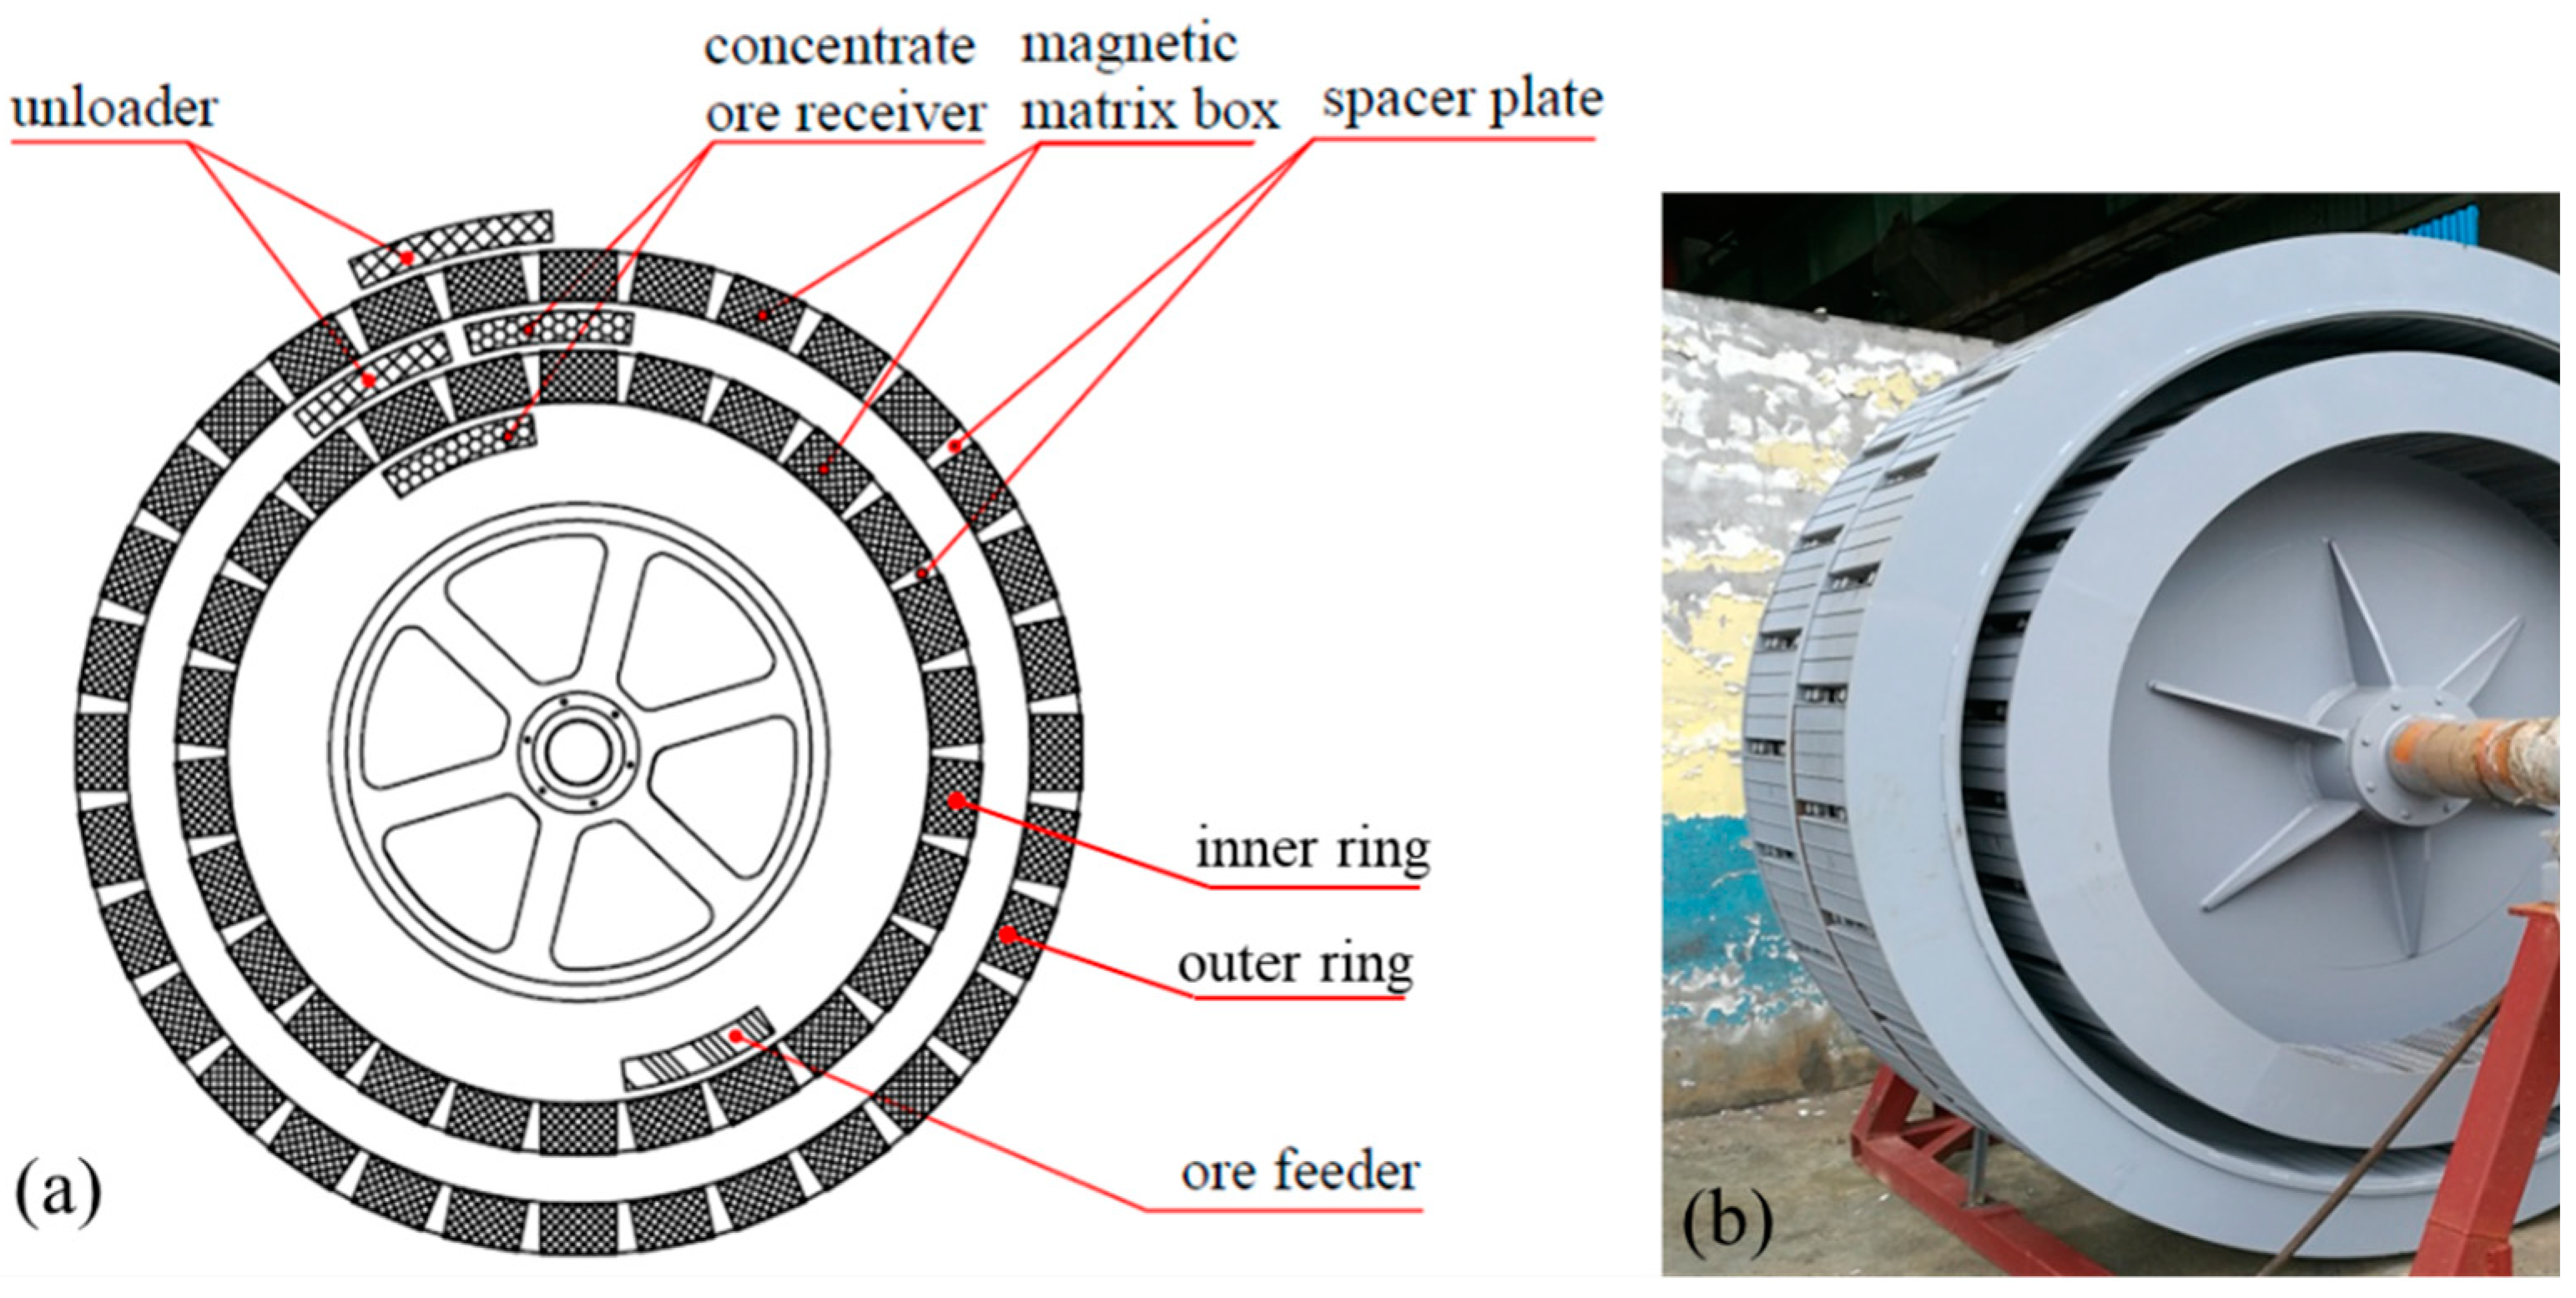
The industrial testing machine is developed based on the success of the pilot test. The two-layer sorting ring for the transverse-field industrial HGMS is demonstrated in
Figure 16. The volumes of the magnetic matrix boxes in the outer and inner rings presented in
Table 8. The rod diameter of the outer ring is 2 mm, while that of the inner ring is 3 mm. The data in
Table 8 indicate that the magnetic matrix volumes of the transverse-field and longitudinal-field HGMSs are comparable when using the same vertical ring diameter. The transverse-field industrial HGMS with the two-layer ring used in the beneficiation plant is shown in
Figure 17.
The industrial best operating parameters of the transverse-field HGMS (SSS-III-2750) are as follows: vertical ring speed of 4.0 r/min, magnetic field intensity of 0.45 T, pulsating stroke of 10 mm, and pulsating frequency of 120 r/min. The industrial best operating parameters of the longitudinal-field HGMS are as follows: vertical ring speed of 4.0 r/min, magnetic field intensity of 0.50 T, pulsating stroke of 14 mm, and pulsating frequency of 170 r/min. The comprehensive index for a 1-month stable production is provided in
Table 9. The result indicates that the separation index for the transverse-field HGMS outperforms that of the longitudinal-field HGMS. The production achieved a TiO
2 grade of 18.01% with a recovery of 87.28% after a roughing separation. The particle size distribution in the concentrate and size fraction recovery of the two-layer ring transverse-field HGMS is shown in
Table 10. The size fraction recovery is more than 91% when the size fraction is from −0.15 mm to +0.043 mm, similar to the result in the pilot plant test.


