Article

Natural Hydrogen Generation from Phanerozoic Sedimentary Siderite

1
MI-Energie, 75004 Paris, France
2
Laboratoire des Fluides Complexes et leurs Réservoirs (LFCR)—E2S UPPA, Université de Pau et des Pays de l’Adour, 64012 Pau, France
3
GEO4U, Praia de Botafogo, 501/Bloco 101—Sala 101/Parte Botafogo, Rio de Janeiro 22250-040, Brazil
4
Vinci-Technologies, 92022 Nanterre, France
*
Author to whom correspondence should be addressed.
Minerals 2025, 15(11), 1218; https://doi.org/10.3390/min15111218
Submission received: 25 September 2025 / Revised: 8 November 2025 / Accepted: 10 November 2025 / Published: 18 November 2025
(This article belongs to the Section Mineral Deposits)

Abstract

Siderite (FeCO3) is an iron carbonate present in Archean and Neoproterozoic Banded Iron Formations (BIFs) as well as in much more recent sedimentary basins. Due to its high iron content, it could be part of H2 systems, and we have quantified its potential as a H2-generating rock and its kinetics from samples from the Llanos Basin in Colombia and from the Solimões Basin in Brazil. The H2 potential of natural siderite-rich Cenozoic formations was measured with a Hydrogen-Eval pyrolyzer, where the H2 yield depends linearly on the siderite content of the rock. It reaches 3.5 mol/kg for a sample containing 50% of siderite. The siderite is known to be unstable and to decompose at relatively low temperatures, between 100 and 200 °C. These results suggest that sedimentary siderite could be an additional potential H2-generating rock, through oxido-reduction, with an active H2 generation window between 3 and 6 km. In sedimentary basin at these depths, reservoirs and traps are likely to be present, and the porosity could be ideal for accumulation. Strong external water supply through hydrodynamics will promote H2 generation, but the dehydration of rocks such as clays will also enable it through local water supply.

1. Natural Hydrogen Generation

Natural (or geological) hydrogen is evolving from a geological curiosity, or a proxy for the origin of life on Earth, into one of the portfolios of solutions for a more sustainable energy mix, trying to move away from coal and hydrocarbons. For a long time, its origin was considered to be linked only to the serpentinization of ultrabasic rocks, i.e., oxidation of Fe(II) of olivine into Fe(III), associated with water reduction giving H2 [1]. However, many known locations of natural H2 exclude this source, simply because of the lack of this type of rock in their surroundings [2]. Researchers have suggested many other possible origins of H2, including radiolysis [3], magma degassing [4], pyritization from H2S [5], ammonium decomposition [6], magnetite [7] and other mineral destabilizations that induce the reduction of water to dihydrogen through the oxidation of Fe(II) into Fe(III) [8]. The list of minerals containing ferrous iron is long. Among them is siderite, an iron carbonate FeCO3, which presents the interest of its unstable behavior with only a slight temperature increase [9,10]. The release of the ferrous iron from siderite into water, coupled with its high solubility, can trigger a redox reaction involving iron and water. This reaction produces H2, leaving behind insoluble ferric iron, which then precipitates into iron oxides, such as magnetite or hematite. Other reactions may generate H2; the late maturation of organic matter also results in H2 generation [11], as do mechanoradical reactions [12,13]. The relative importance of these different mechanisms remains to be quantified and will certainly depend on the geological context.
Some of the known H2 surface leakages are located within ophiolites [4], where serpentinization is the most likely origin. However, H2 leakages are also numerous onshore in intracratonic contexts [14]. The Archean and Neoproterozoic areas, such as those in Brazil, Australia, and South Africa, are often rich in H2 indices. Radiolysis and/or the oxidoreduction of BIFs have been proposed as primary sources [2,8,15]. H2 has also been noticed in more recent sedimentary basins, such as the Paris and Aquitaine basins in France [16], the Cooper Basin in Australia [17], China [18] and the Llanos Basin in Colombia. In the Songliao Basin (China), or the Cooper Basin (Australia), organic matter (OM) has been proposed as the source for H2 measured in wells [17,18]; however, the generation of a free H2 phase from OM is not expected below 200 °C. In this study, we studied the yields of the natural siderite-rich samples and the kinetics of their H2 generation. The majority of these samples originate from a tertiary foreland basin where significant near-surface [19] and borehole [20] H2 indices have been documented. The basin is not deep enough to favor an organic origin within the Cretaceous or Cenozoic sequences [21,22], but some siderite beds have been noted in the sedimentary infilling, and we studied this hypothesis. Other suggestions could be made, such as a deeper source of H2, within the basement. We will not evaluate them in this study, though we do not disregard them.

2. Materials and Methods

Although siderite is frequently mentioned in the literature concerning natural H2 [9,23] and is occasionally proposed as a potential H2-generating rock, the quantitative yield of natural H2 that can be generated from siderite remains poorly known. As part of this study, experimental work using a Hydrogen-Eval was carried out to quantify the H2 generation associated with siderite decomposition, depending on temperature and availability of water. Since the samples are natural, they contain other minerals, and their influence on H2 generation will be discussed. The Hydrogen-Eval consists of a pyrolyzer coupled with a H2 detector.
The Hydrogen-Eval, a newly developed instrument manufactured by Vinci Technologies, was specifically designed for natural H2 exploration and in situ H2 stimulation. This device is engineered to evaluate the full H2 generation potential of rock samples, characterize the kinetics of H2 generation, and ultimately contribute to a more accurate prediction of the quantity of H2 generated in a specific basin. The instrument quantifies the rock H2 yields from two primary reactions: iron oxidation and late-stage maturation of the OM contained in the samples. Additionally, any H2 already present in the rock can be expelled and quantified using this method. The Hydrogen-Eval (Figure 1) is fundamentally a pyrolyzer coupled with detectors for various gases, including H2. Because the maturation of OM follows the Arrhenius law, the fluids generated in natural conditions could be extrapolated from the ones generated rapidly at higher temperature in the lab. The temperature rise is imposed by the circulation of a hot gas, dry N2 in the Rock-Eval [24]. However, water is needed to trigger oxidation, so the iron oxidation requires a wet gas and a separate procedure described below.

2.1. Main Analytical Process and Technical Settings

The Hydrogen-Eval is based on both dry and wet pyrolysis, employing either nitrogen (N2) or a mixture of nitrogen and water vapor (N2 + H2O) as the carrier gas. The methodology applies a controlled temperature cycle to the rock sample to either release in situ hydrogen trapped within organic matter or fluid inclusions or, in the case of wet pyrolysis, to generate hydrogen through redox reactions between water and iron-rich minerals.
The rock sample is crushed into powder and approximately 10 mg is placed in a crucible, which is then heated. The standard temperature cycle begins at an initial temperature of 300 °C, held for 1 min, and then increases to a final temperature of 1200 °C at a heating rate of 25 °C per minute. The heating ramp is followed by a final isothermal step lasting five minutes. The temperature cycles are fully customizable, enabling, for example, kinetic studies. Depending on the chosen temperature profile and the oven cooling time required between successive analyses, the total duration of a single analysis ranges from one to two hours.
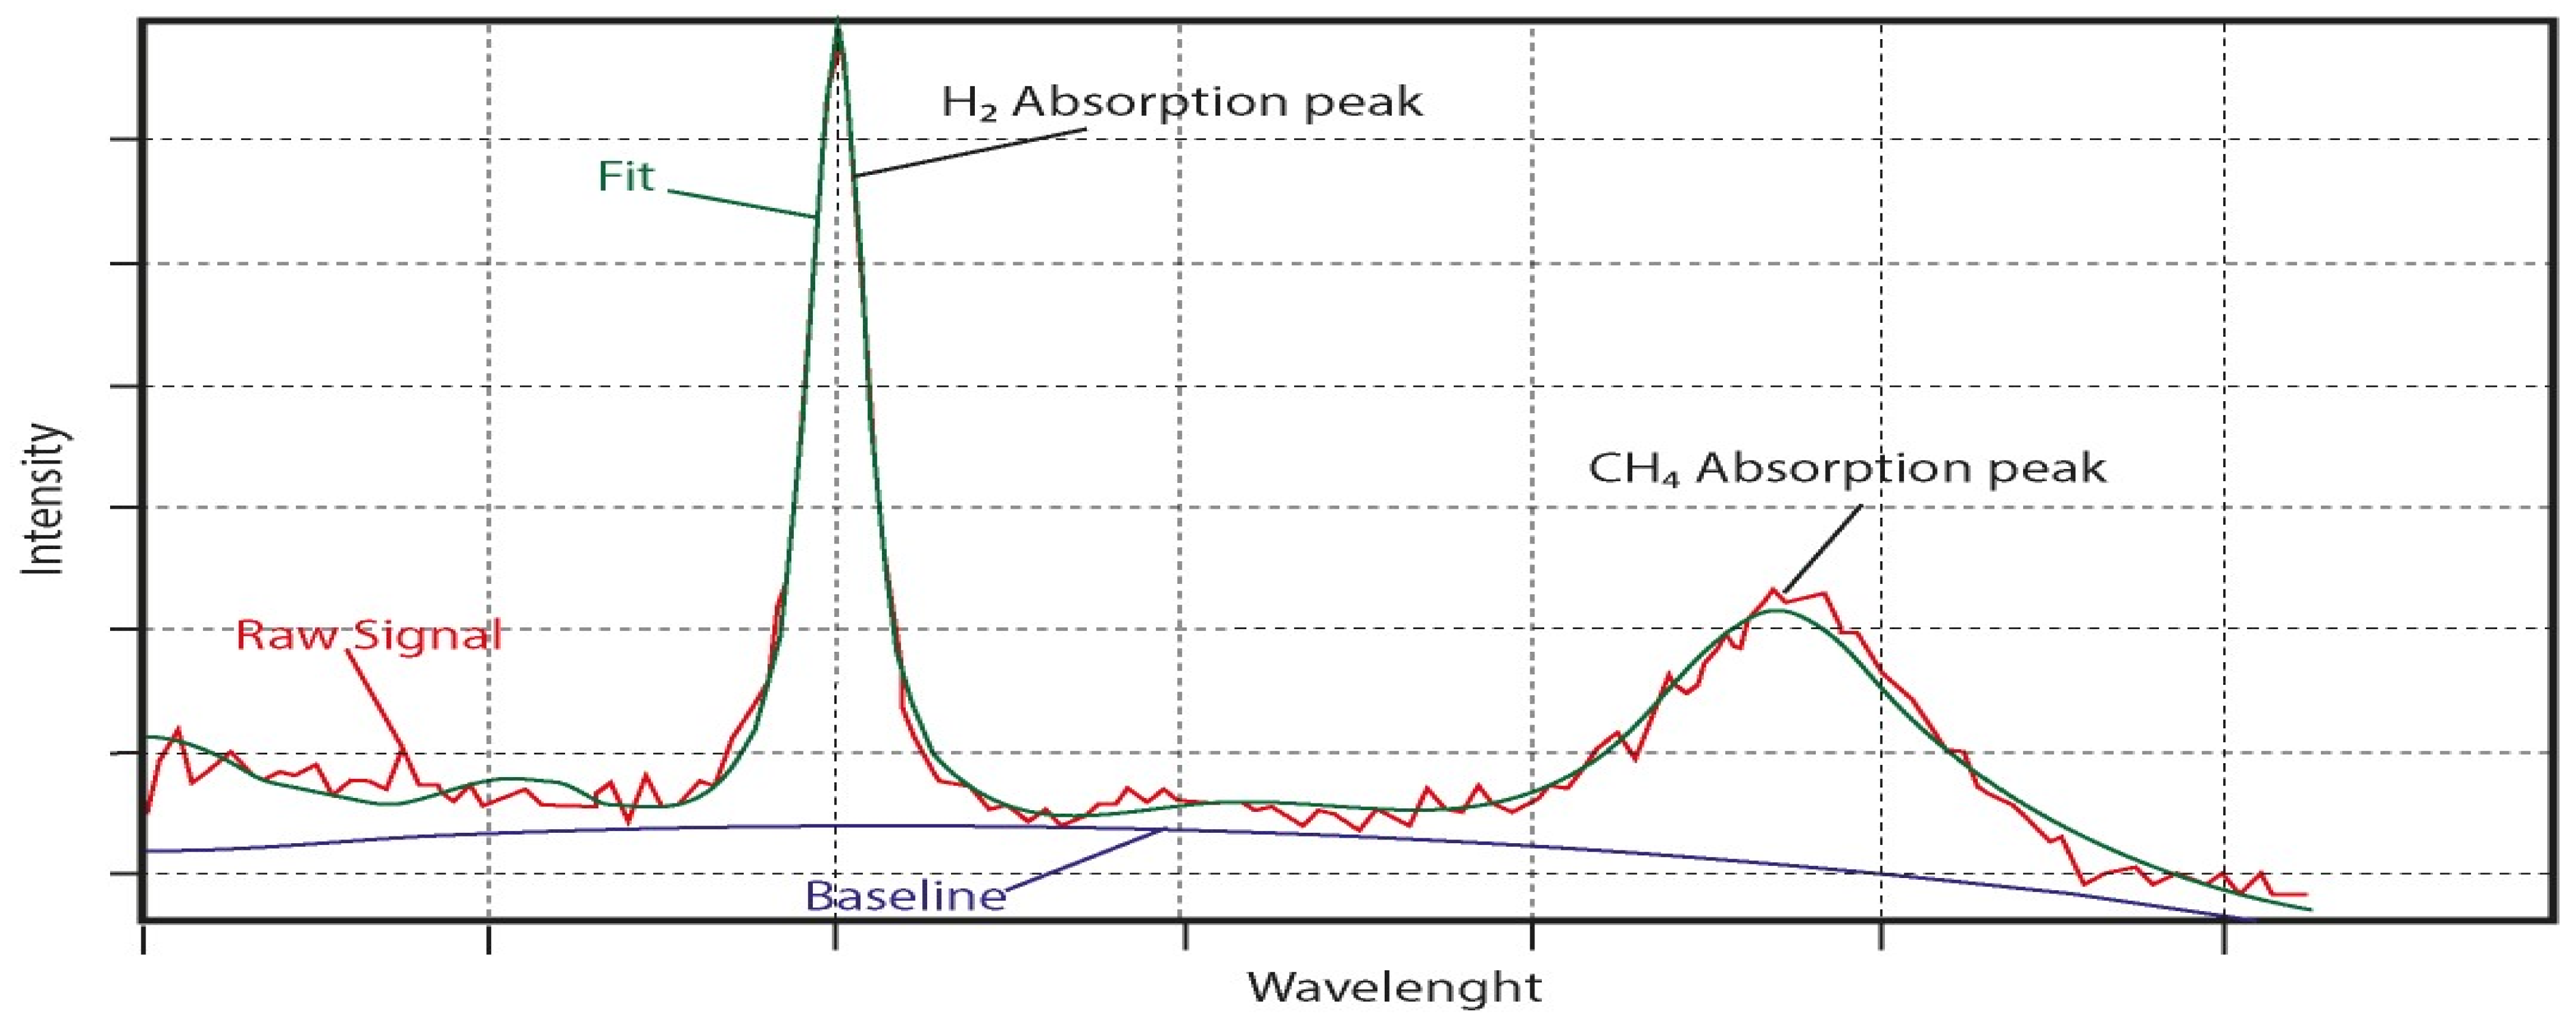
To reach temperatures up to 1200 °C while preventing H2 generation from the oxidation of metallic components within the oven, all parts in contact with the sample, including the oven chamber, piston, and crucibles, are made of inert ceramic materials. The carrier gas, flowing at a rate of 100 mL/min, is directed to the detection system, which consists of a Tunable Diode Laser Absorption Spectroscopy (TDLAS) detector capable of accurately measuring H2 concentrations at the parts-per-million (ppm) level (Figure 2). Additionally, this detector is highly selective, effectively preventing interference between H2 and any coexisting gases.
Nevertheless, certain gases or particles, such as light hydrocarbons, high concentrations of water vapor, and dust, can interfere with the H2 measurements. To ensure accurate detection, the system mandates the use of specific elements, including hydrocarbon traps, dryers, and filters.

2.1.1. Dry Carrier Gas Mode (DG)

In this specific setup, the carrier gas consists solely of nitrogen (N2). This dry mode is primarily utilized for investigating H2 production from organic-rich rocks, such as petroleum source rocks, coals, or biomass. Hydrogen released from OM generally occurs at high temperatures, between 750 and 850 °C, typically following hydrocarbon generation. However, additional H2 signals from different sources can also arise during dry pyrolysis, including H2 trapped in fluid inclusions or H2 produced via redox reactions when shales and iron-rich minerals are both present. Indeed, thermal cracking of shale releases some water during pyrolysis (typically between 500 and 800 °C), which can then react with iron to produce H2.
The Hydrogen-Eval provides two main parameters: the H2 potential (S2H2) and Tpeak H2. The S2H2 is an equivalent for hydrogen to the Rock-Eval hydrocarbon potential parameter (S2), expressed in milligrams per gram of rock or millimoles per kilogram of rock. Tpeak H2 is defined as the temperature at the maximum of the highest H2 peak. In terms of value range, Tpeak for immature coal is around 800 °C, and the H2 yield is one-quarter of the Total Organic Carbon (TOC) [25].

2.1.2. Wet Carrier Gas Mode (WG)

In this setup, the carrier gas (N2) is enriched with water vapor via a precise and adjustable water injection system, allowing for accurate control of the water concentration within the gas stream. While the absolute water concentration is typically set at approximately 67.5%, it can be customized within a broad range of 5% to 90%. This wet pyrolysis mode is designed to evaluate the H2 generation potential of iron-rich rocks through redox reactions with water. However, other H2 sources, such as H2 produced from the thermal cracking of organic matter, may also contribute to the measured signal. For this reason, it is advisable to perform complementary dry-mode analyses to isolate and quantify the H2 produced specifically by redox reactions. Additionally, TOC measurements can help to assess whether H2 generation from OM is a likely contributor to the observed signal.
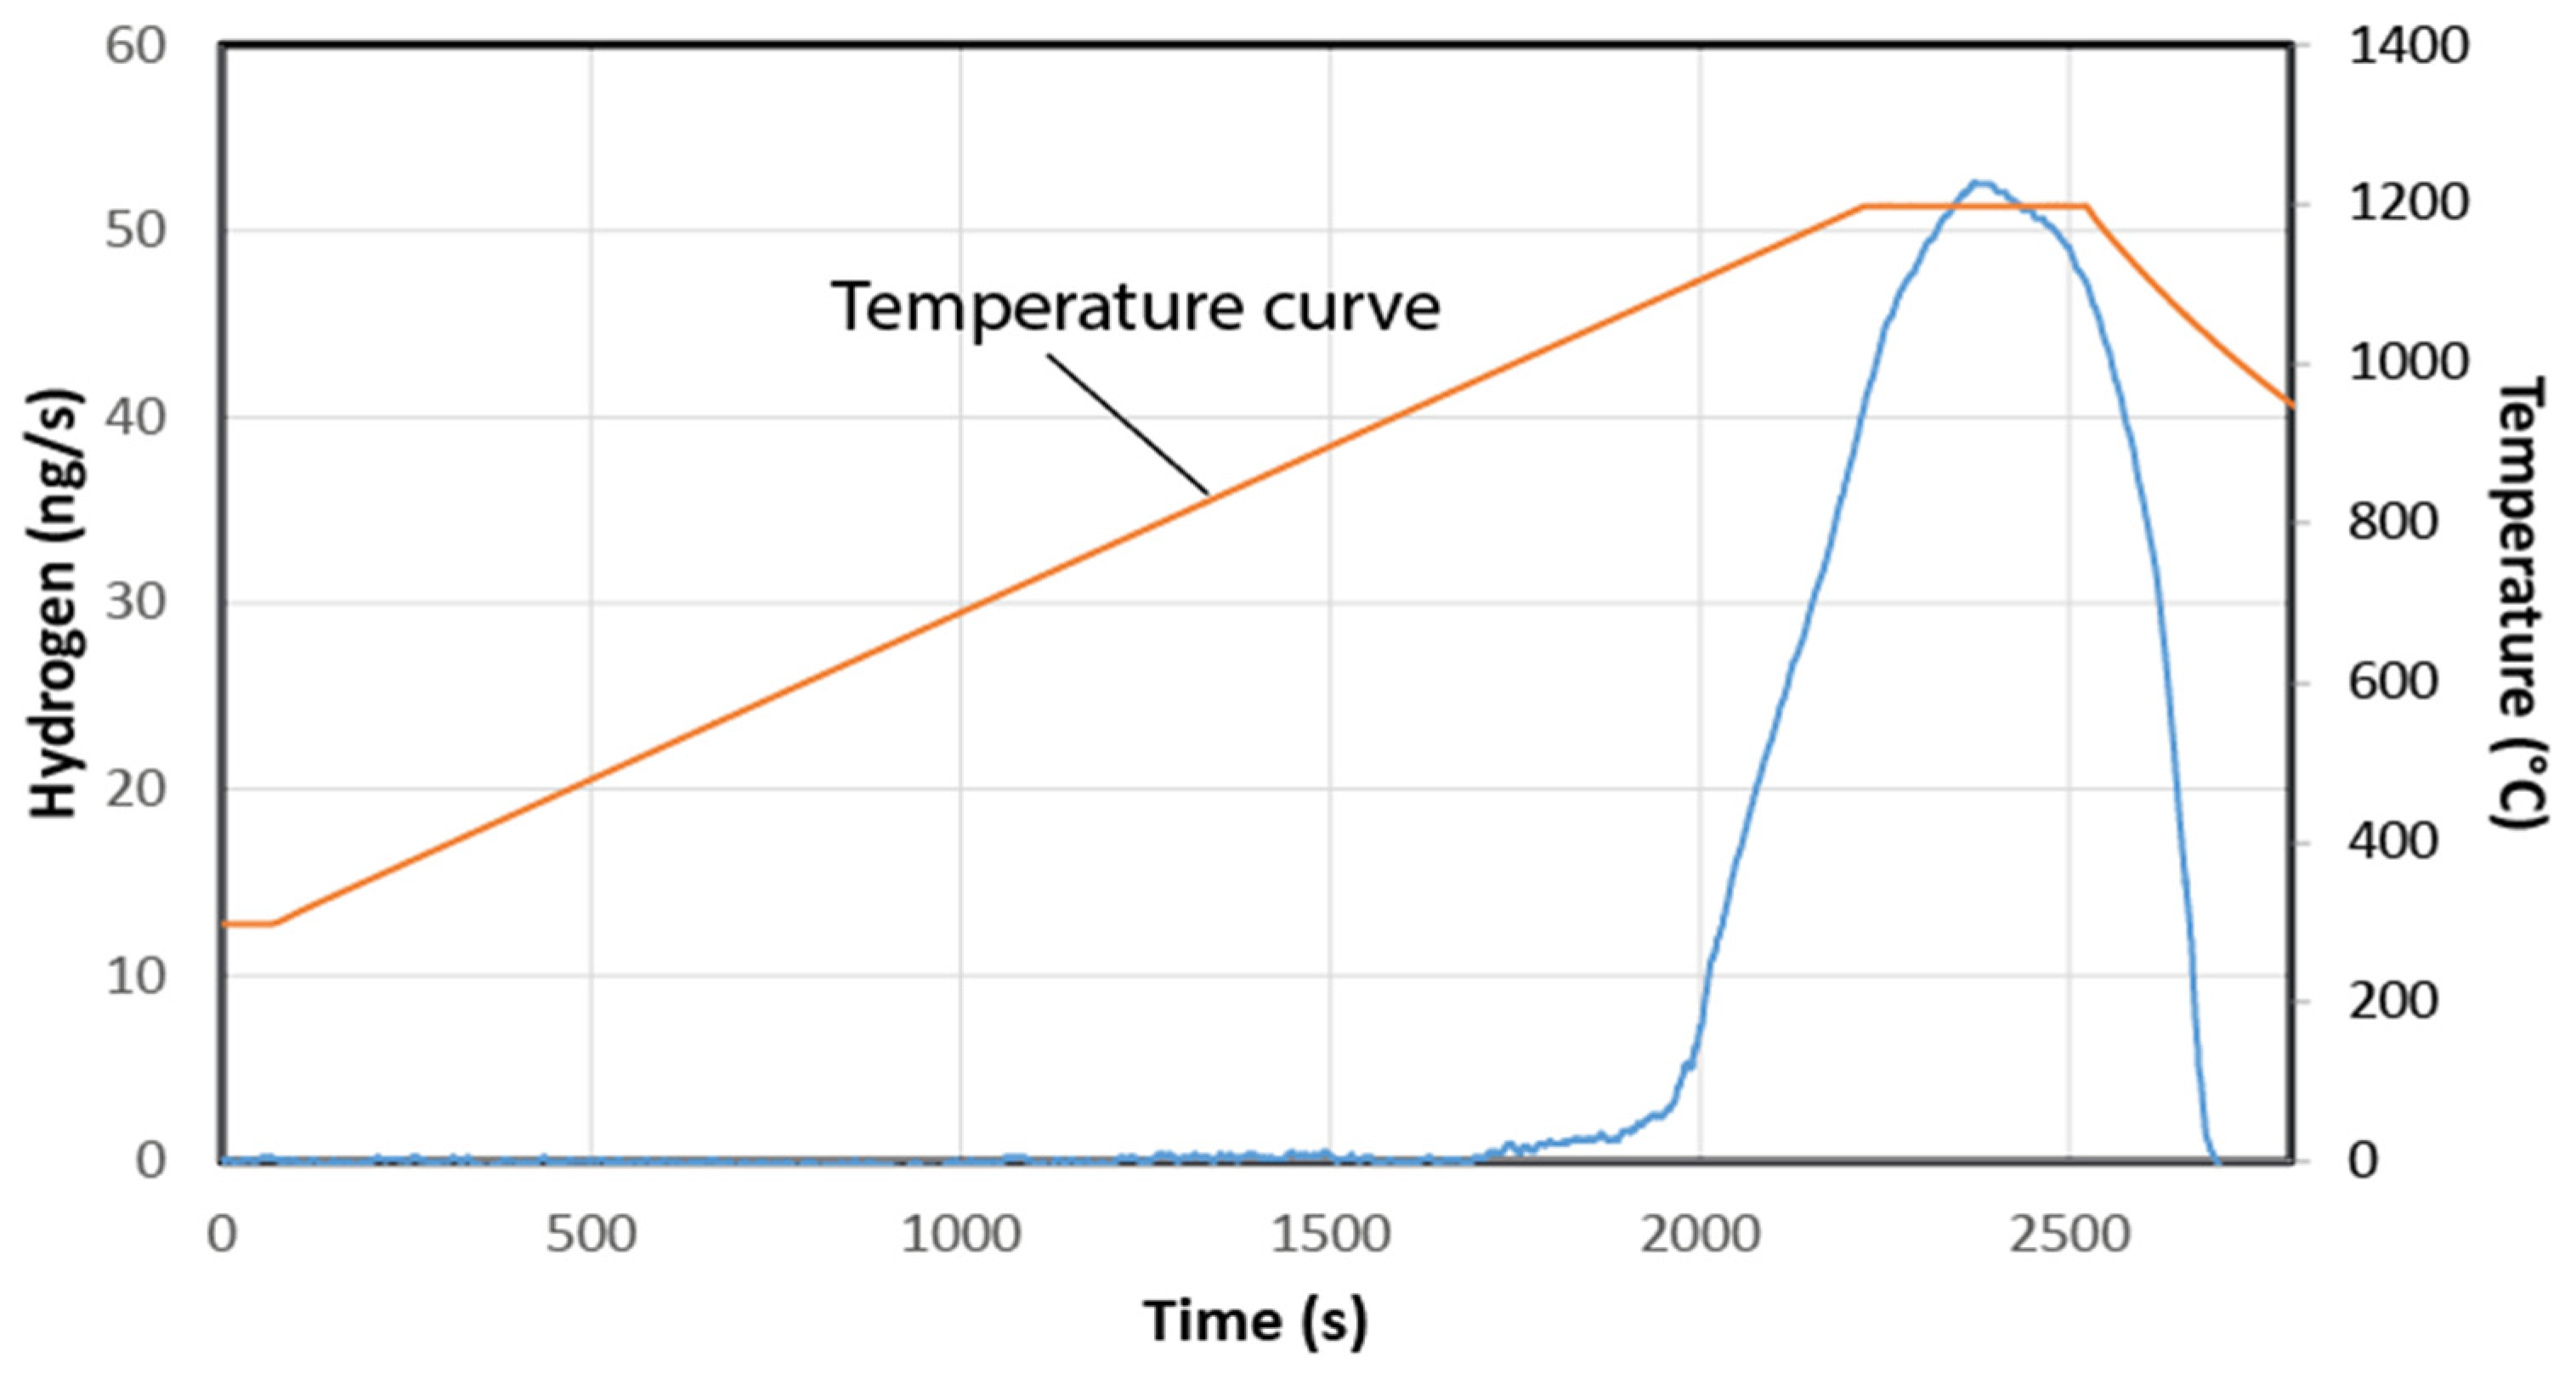
In the wet carrier gas analysis mode, H2 production can occur at high temperatures due to the thermal cracking of water above 1000 °C. This background H2 signal must be accounted for and subtracted from the analysis curve to ensure accurate quantification, particularly when testing rocks with low H2 generation potential. To correct for this, a blank run using an empty crucible is performed under the exact same analytical conditions (including temperature cycle and water concentration) as the sample analysis (Figure 3). The H2 signal obtained from the blank is then subtracted from the sample response.

2.1.3. Limitation

H2 generation via oxidation reduction is not solely a function of temperature; consequently, the proposed kinetic model will require future refinement. Factors such as water chemistry and the presence of other minerals will need to be taken into account. Nevertheless, this initial approach allows for a semi-quantitative assessment of the H2 generation rate. It demonstrates that in the case of siderite or, more generally, iron oxides, H2 can be generated rapidly in sedimentary basins at low temperatures, below 150 °C. As with OM in Rock-Eval, open pyrolysis at high temperatures is not intended to replicate the reactions at the molecular level but rather to provide quantifiable figures for a basin-scale approach.
In the current study, we quantify H2 generation using both modes: with a dry gas and with a wet gas. The wet gas mode allows for quantifying the oxido-reduction of the iron-rich minerals present in the rock. The dry gas mode, up to now, has been mainly used to quantify the H2 coal potential [25] but may give other information, as will be discussed later in this article.

2.2. Material

The work presented here is based on an analysis of eight samples from wells located in the Llanos Basin in Colombia for the H2 yields. Details about the siderite presence in the Llanos Basin and quantitative analysis of its volume are discussed in a separate companion paper (in preparation by the Servicio Geologico Colombiano). Details about the Solimões Basin in Brazil, where the samples used for the kinetics were derived, can be found in [26]. The H2 generation potential of siderite and the kinetics of this reaction were analyzed using the previously described open-system pyrolyzer (Hydrogen-Eval). The percentage of siderite in the studied samples was analyzed using the same pyrolizer but in its previous version (Rock-Eval_Sulfur) [27]. DRX data are also available but they are less quantitative.

3. Siderite in Sedimentary Basin

3.1. Siderite Deposit

Siderite most often forms in sediments shortly after deposition, representing an early type of diagenesis. It is mainly observed in environments where oxygen is absent (anoxic or dysoxic) [28]. The usual key depositional environments are as follows:
  • Shallow Marine Environments and Freshwater: Coastal areas, continental shelf margins, deltas, lakes, and peat bogs.
  • Sediments Rich in Organic Matter: The breakdown of organic matter by bacteria consumes oxygen and produces carbon dioxide (CO2).
Siderite precipitates when the interstitial water in sediments becomes sufficiently rich in ferrous iron (Fe2+) and bicarbonate ions (HCO3):
Fe2+ + 2HCO3  FeCO3 (siderite) + H2O + CO2
This process requires low pH (slightly acidic) conditions and low oxidation reduction potentials (Eh) (reducing environment). Siderite can form in competition with other iron minerals, particularly pyrite (FeS2). Siderite formation is favored by a low-sulfate concentration, typically continental or isolated shallow environments, which limits the production of hydrogen sulfide (H2S) necessary for pyrite formation [28].
In practice, siderite is rarely observed in sedimentary settings [29]; however, we hypothesize that the instability of siderite at relatively low temperatures may account for this apparent rarity. Nevertheless, siderite deposits are sometimes very thick and not exclusively within ancient cratons. In Colombia, the main iron mine, Paz del Rio, in the Eastern Cordillera, is located in a siderite bed up to 7 m thick and Mid-Eocene to Oligocene in age. The very unusual conditions in terms of CO2 described in the African lake Nyos [30] are not mandatory, and siderites are also found in classical freshwater depositional environments such as the Carboniferous or Permian sequences in France [31].

3.2. The Llanos Basin Short Geological Setting

Height of the studied samples come from the Llanos Basin, which is currently the Eastern Cordillera Belt foreland basin located east of the Colombian Andes (Figure 4a). The basin’s genesis is linked to the evolution of the Andean Mountain Range, and its formation dates back to the Late Cretaceous. To the west, the subduction of the Pacific Ocean was taking place at that time in an extensional context, which included a back-arc depocenter [32]. The collision started with oceanic terranes obduction of the Western Cordillera during the Campanian-Maastrichtian [33,34,35]. As a result of the intensifying shortening, the former Cretaceous depocenter, the current Eastern Cordillera, was inverted. This inversion resulted in westward thrusting over the Magdalena Valley and subsequent eastward thrusting, leading to the flexure and sediment infilling of a regional foreland basin from the Middle Paleocene to Early Eocene (50–60 Ma) (Figure 4b). Since the Miocene, the ongoing uplift of the Eastern Cordillera separates the Llanos Basin from the Magdalena Valley intermontane basin [36].
The Llanos Basin was a low-elevation area during the Early Cretaceous, so there is no record of sedimentation for that time [37]. Conversely, the Late Cretaceous records the sedimentation during a period of eustatic sea-level rise that flooded the Llanos Basin, reaching its maximum transgression in the Campanian stage [38]. The Une and Guadalupe Formations are sandstone-rich, while the Gachetá Formation is clayey and was deposited in transitional (estuaries) to shallow marine (shoreface and offshore) environments [39] (Figure 4c). The amalgamation of the Western Cordillera oceanic terrains resulted in a regional regression and the development of broad alluvial and coastal plains in the basin represented by the Guaduas Formation (Maastrichtian-Paleocene). Globally, the entire Llanos area emerged at that time.
The accumulation of Paleocene units took place during the period of reactivation and inversion of the extensional structures of the regional Mesozoic basin [36], leading to the formation of fluvial and coastal plain systems in the basin. The Mirador Formation (Early–Late Eocene) records another important episode of shortening, uplift, and exhumation of the Eastern Cordillera [36], characterized by the accumulation of conglomerates and arenites deposited in fluvial and estuarine environments. A regional transgressive event, which occurred during the Late Eocene, is marked by the deposition of the lower section of the Carbonera Formation (Member C8). This transgression resulted from an increase in the accommodation/sediment supply ratio (A/S). From the Late Eocene to the Middle Miocene, sedimentation within the basin was primarily controlled by the A/S ratio, which was itself a result of the flexural subsidence rates.
The León Formation, a predominantly Middle Miocene mudstone unit, registers a notable increase in accommodation rates during a period of intensive thrusting in the hinterland [38,40]. An increase in the size and extent of the foreland lake, which developed throughout much of the Cenozoic, occurred during a major marine flooding event (16.1 to 12.4 Ma) in the Middle Miocene [34]. The subsidence is not uniform across the Llanos Basin; the deepest part is northward, with thickness up to 4 km of the Guayabo Formation. In the south, however, this unit is only 1.5 km thick, and all the Paleocene to Middle Miocene series are thicker there. As a result, the maturation of the source rocks started first in the southwest and then extended to the north [41]. The HC migrated from west to east.

3.3. Hydrogen in the Llanos

H2 soil measurements have previously been published in both the Llanos and in the Putumayo Basin [19]. The basin is large (96,000 km2), and a systematic review has not yet been published, but the available data are already quite numerous (several thousands) and consistently indicate a high soil H2 content. Figure 4 synthesizes these data. Structurally, Zones 1 and 3 are in the foredeep but rather close to the reliefs of the Eastern Cordillera. Zone 2 is located further east, in an area where the Cenozoic infilling of the foredeep is only 2 km thick. Zone 3 corresponds to the Servicio Geologico Colombiano (SGC) database. Zone 4 is located within the first relief in the Putumayo Basin, which is also a foreland setting but involves a different sequence [42]. In the Llanos Basin, H2 has also been detected in wells, and values above 1% have been reported in oil reservoirs, between Zones 1 and 2, but the exact location remains confidential [20].
The average H2 content is always over 100 ppm. Such a high content in the soil is unusual. Even in areas where known H2-generating rocks (H2_GRs) are present such as the Semail Ophiolites in Oman or RAK in the Middle East, the average H2 content is much lower. For instance, in the RAK emirates, over 144 measurements, the average was 22 ppm [43]. In Namibia, the average H2 content in the soil was 37 ppm during the first campaign conducted in 2022 [44], with 191 measurements available in the Supplementary Material of [2], and 10 ppm during the second campaign, with 230 measurements in [45]. In the previously cited cases, the H2_GRs present in the area are, respectively, the ultra-mafic from the ophiolites [46] and the BIF from the Neoproterozoic Damara belt [44,45].
The existence of these very high values in the Llanos Basin remains unexplained and served as the primary motivation for initiating this work. For this shallow basin, late maturation of OM Cretaceous and Cenozoic SR cannot be proposed as H2_GR. Below, the Paleozoic facies contains some TOC, but their maturation was mainly acquired before the Mesozoic Era [21,41]. In the crystalline basement, intrusive granitic rocks that may generate H2 via radiolysis are locally present. Another alternative H2_GR could reside within the Neoproterozoic grabens, which are highlighted by the gravity and magnetic data [47]. Furthermore, the Guyana Shield to the east, at the Venezuelan border, has the potential to generate H2 through oxidation reduction and radiolysis. However, this craton is too distant, and it is difficult to imagine that H2 generated in this area could reach the western part of the basin while fluid flows are in the opposite direction. We, therefore, test a third hypothesis: that siderite plays a role in the presence of H2 in the southwestern part of the Llanos Basin.
To characterize this role, we present two primary findings: (1) the H2 generation potential of the siderite-bearing facies and (2) the kinetics of H2 generation by siderite, which is critical for evaluating present-day production rates.

4. Results_1: H2 Yields of the Siderite Beds

4.1. Pyrolysis of the Samples

The eight samples come from three different wells (1, 2, and 3), all located near Point 3 on the maps in Figure 4, at depths between 3277 and 3665 feet (999 m to 1117 m). The temperature at that depth was around 67 °C. The gradient (Table 1) was estimated from the BHT, considering that the average surface temperature is 25 °C.
The main results of the Rock-Eval (RE) analysis are presented in Table 2, and the full dataset can be found in the Supplementary Material; see [48] and references inside for the description of all parameters. The measurements clearly show that there is no organic matter in these samples, and the TOC remains lower than 0.67%. The computed Tmax is not displayed since the values are irrelevant when the S2 is close to 0. The mineral organic content, taking into account both pyrolysis and oxidation, ranges from 0.5 to 4.5%.

4.2. H2 Generation from the Studied Samples

For each sample, two additional measurements were performed with the Hydrogen-Eval, first with the dry gas system (DG) and then with the wet gas (WG). The results are presented in Table 3 and displayed in Figure 5. The maximum H2 generation with the dry gas here is reached at a much lower temperature, 600 °C for sample 7 in Figure 6. It is consistent with the fact that the reaction is not related to the maturation of any OM, as the S2 is near 0 (Table 2) and no methane or other HCs were generated during pyrolysis.
A strong correlation is observed between the siderite content and the H2 for both WG and DG pyrolysis, particularly when the siderite content exceeds 9%. One may note that the samples coming from the same well (e.g., Well N°2 samples 3, 4, 5, 6) are perfectly in line and follow the equation below:
H2 yield (in mmol/kg of rock) = 75 × % of siderite
This correlation is less evident for the other wells. Furthermore, the correlation is not expected to be observed if siderite oxidation results in the neoformation of goethite and magnetite. Note that the H2 yield is higher than the theoretical H2 yield calculated from siderite oxidation alone. This result implies the involvement of other minerals present in these natural samples, such as magnetite or iron-rich shales, in the observed H2 generation.
In WG mode, the nitrogen flow that heats the sample contains water vapor, which oxidizes the available minerals. In the current study, siderite is the primary element oxidized. In this WG mode, the green dots in Figure 5 show a clear correlation between siderite content and H2 yield. This correlation also exists in DG mode. Figure 6 demonstrates a critical timing difference: H2 production occurs at a lower temperature in WG mode. Conversely, during siderite decomposition via DG heating, H2 production is delayed until after the water is released. This water is likely liberated through the dehydration of minerals such as clays. Once this water is released, siderite can decompose, which delays the H2 peak compared to heating using wet gas. Since the samples are natural, the presence of shale is not surprising, and the smectite/illite transformation has often been described in the Llanos Basin [49].

5. Results_2: Siderite Evolution Versus Temperature

  • Kinetic of the Thermal Decomposition of Siderite
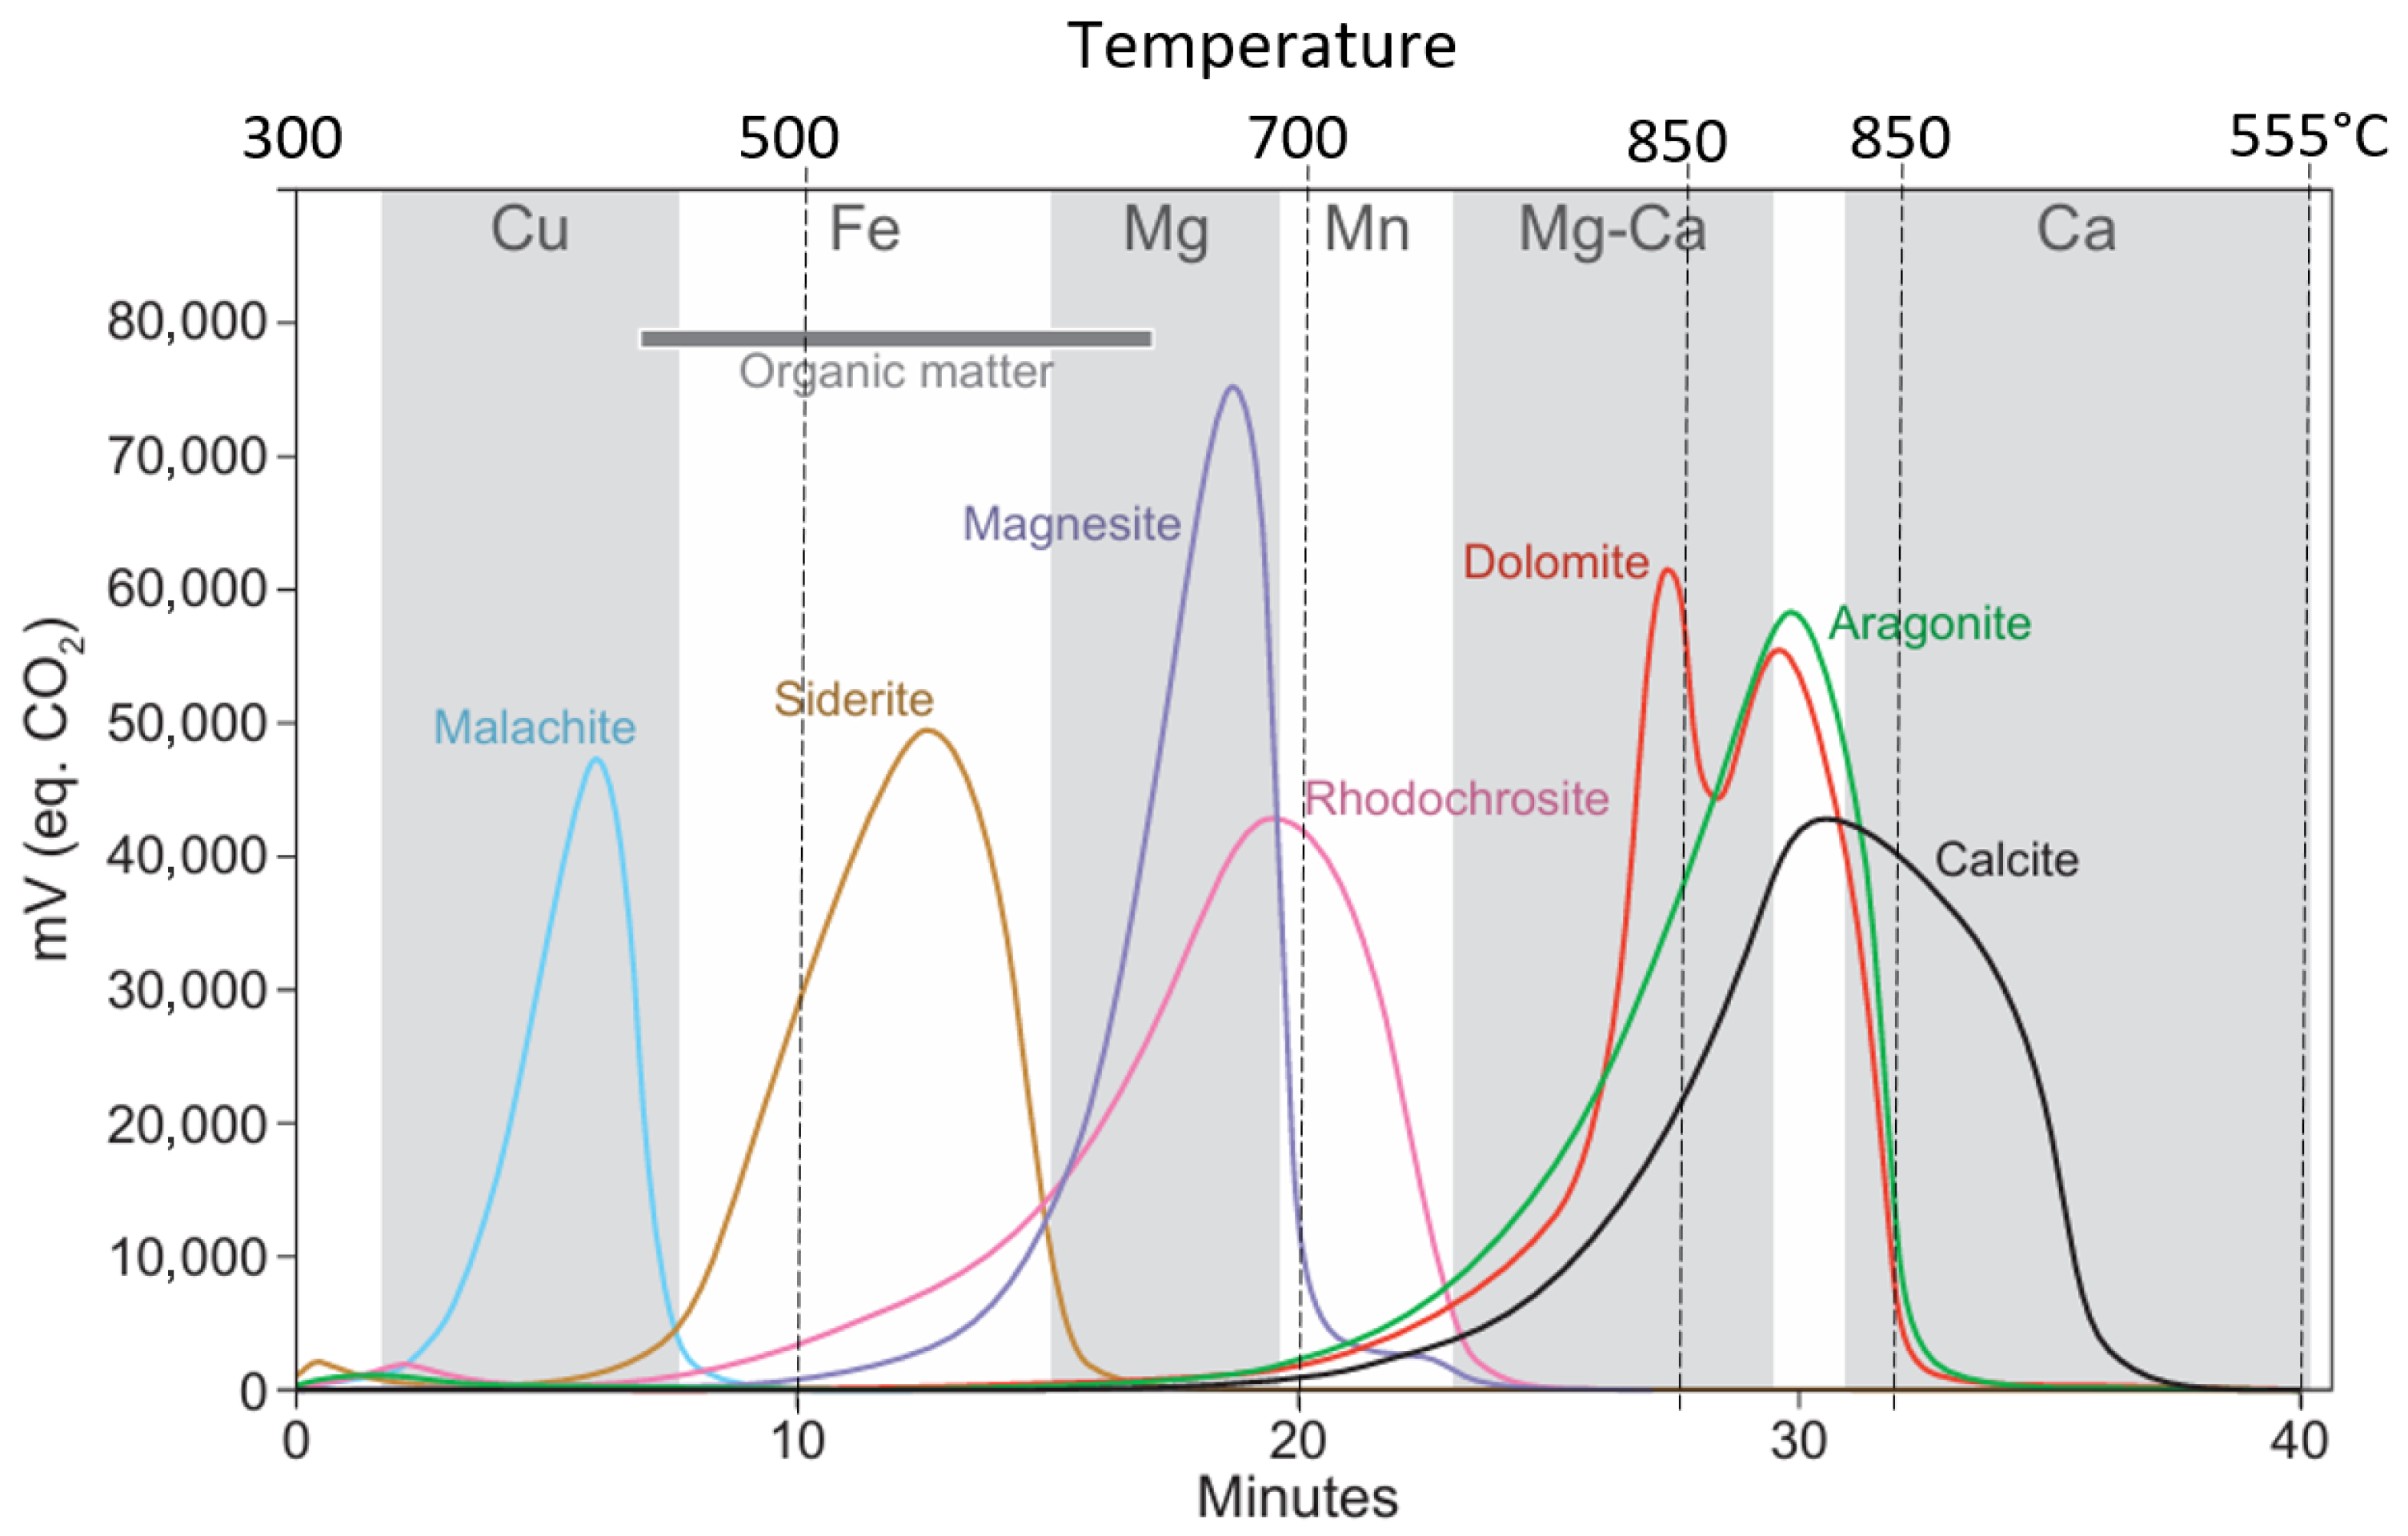
Siderite is known to be among the least thermally stable carbonates with respect to decomposition [27]. As illustrated in Figure 7, using the Rock-Eval instrument with the oxidation oven, only the copper carbonates exhibit lower decomposition Tpeak values. The temperature ramp used in [27] is 20 °C/min.
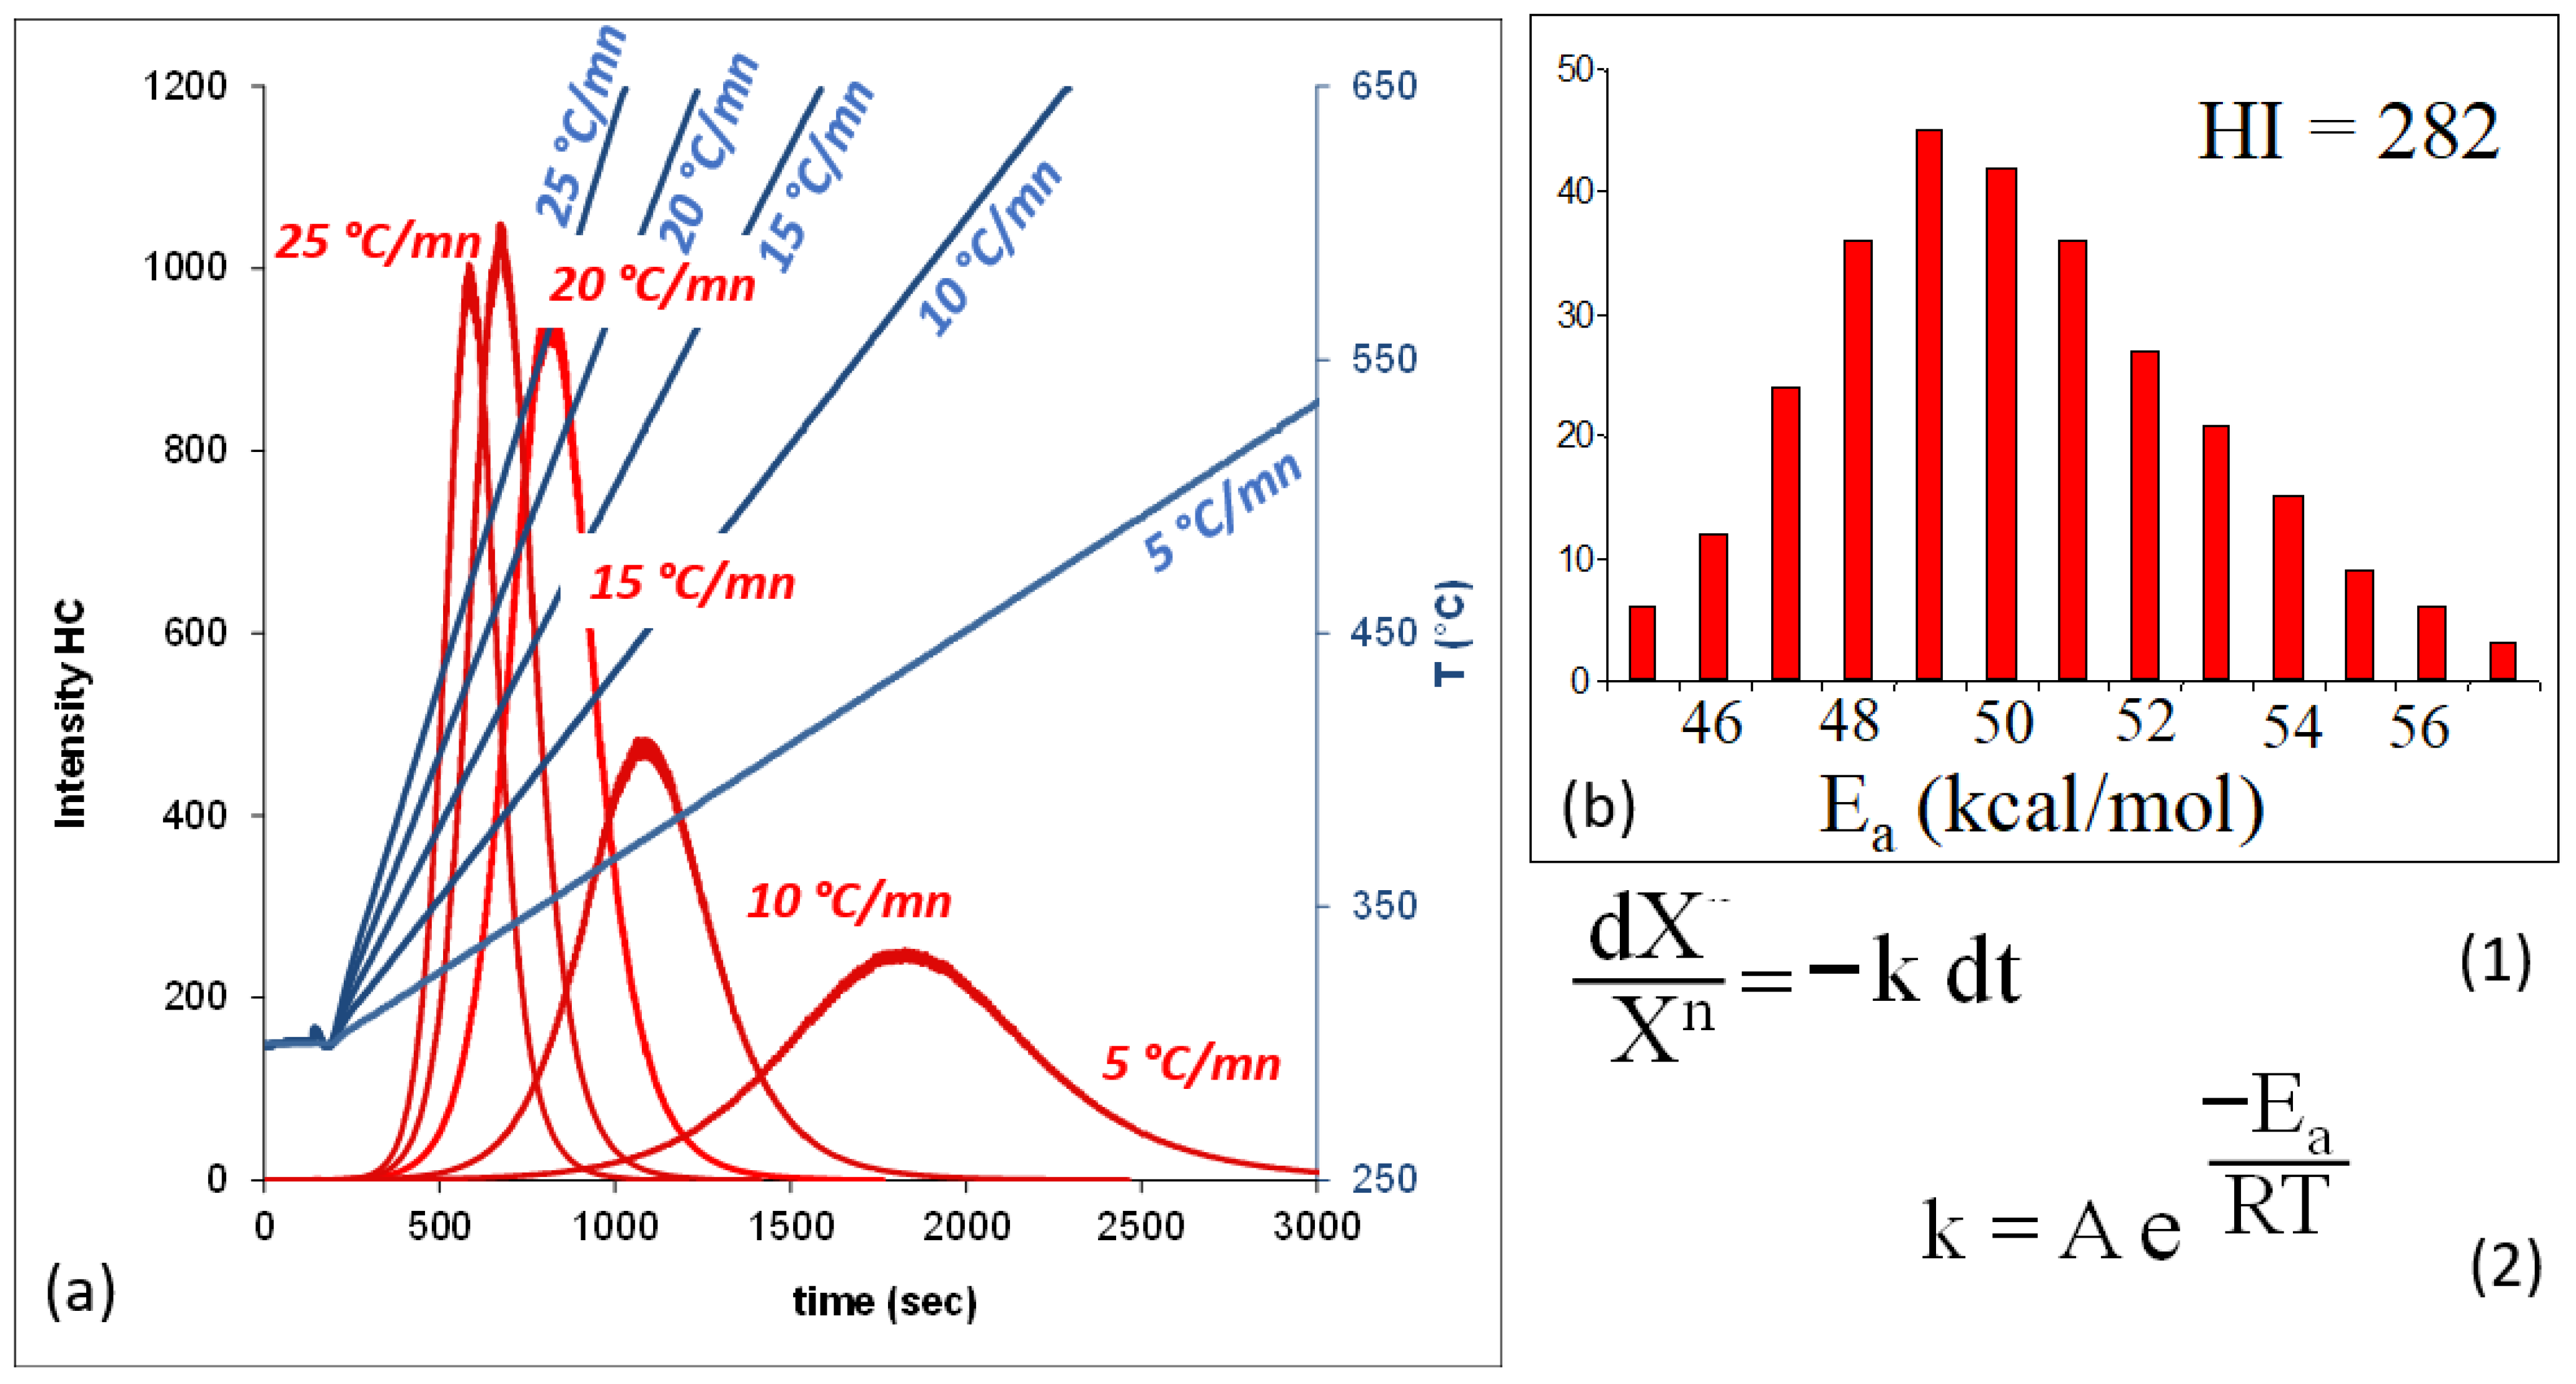
Using the same instrument (Rock-Eval), it is possible to obtain various curves of siderite decomposition with various ramps of temperature. Figure 8 presents the measurement principle, commonly utilized to characterize the kinetic parameters of hydrocarbon generation from kerogen.
The kinetic law is presented in Equation (1), Figure 8, where X represents the amount of remaining material, here the siderite, n is the reaction order, k is the rate of the reaction and t is time. Equation (2) represents the Arrhenius law, defining k with Ea as the activation energy of the chemical reaction, A the Arrhenius factor, R the ideal gas constant and T the temperature in Kelvin.
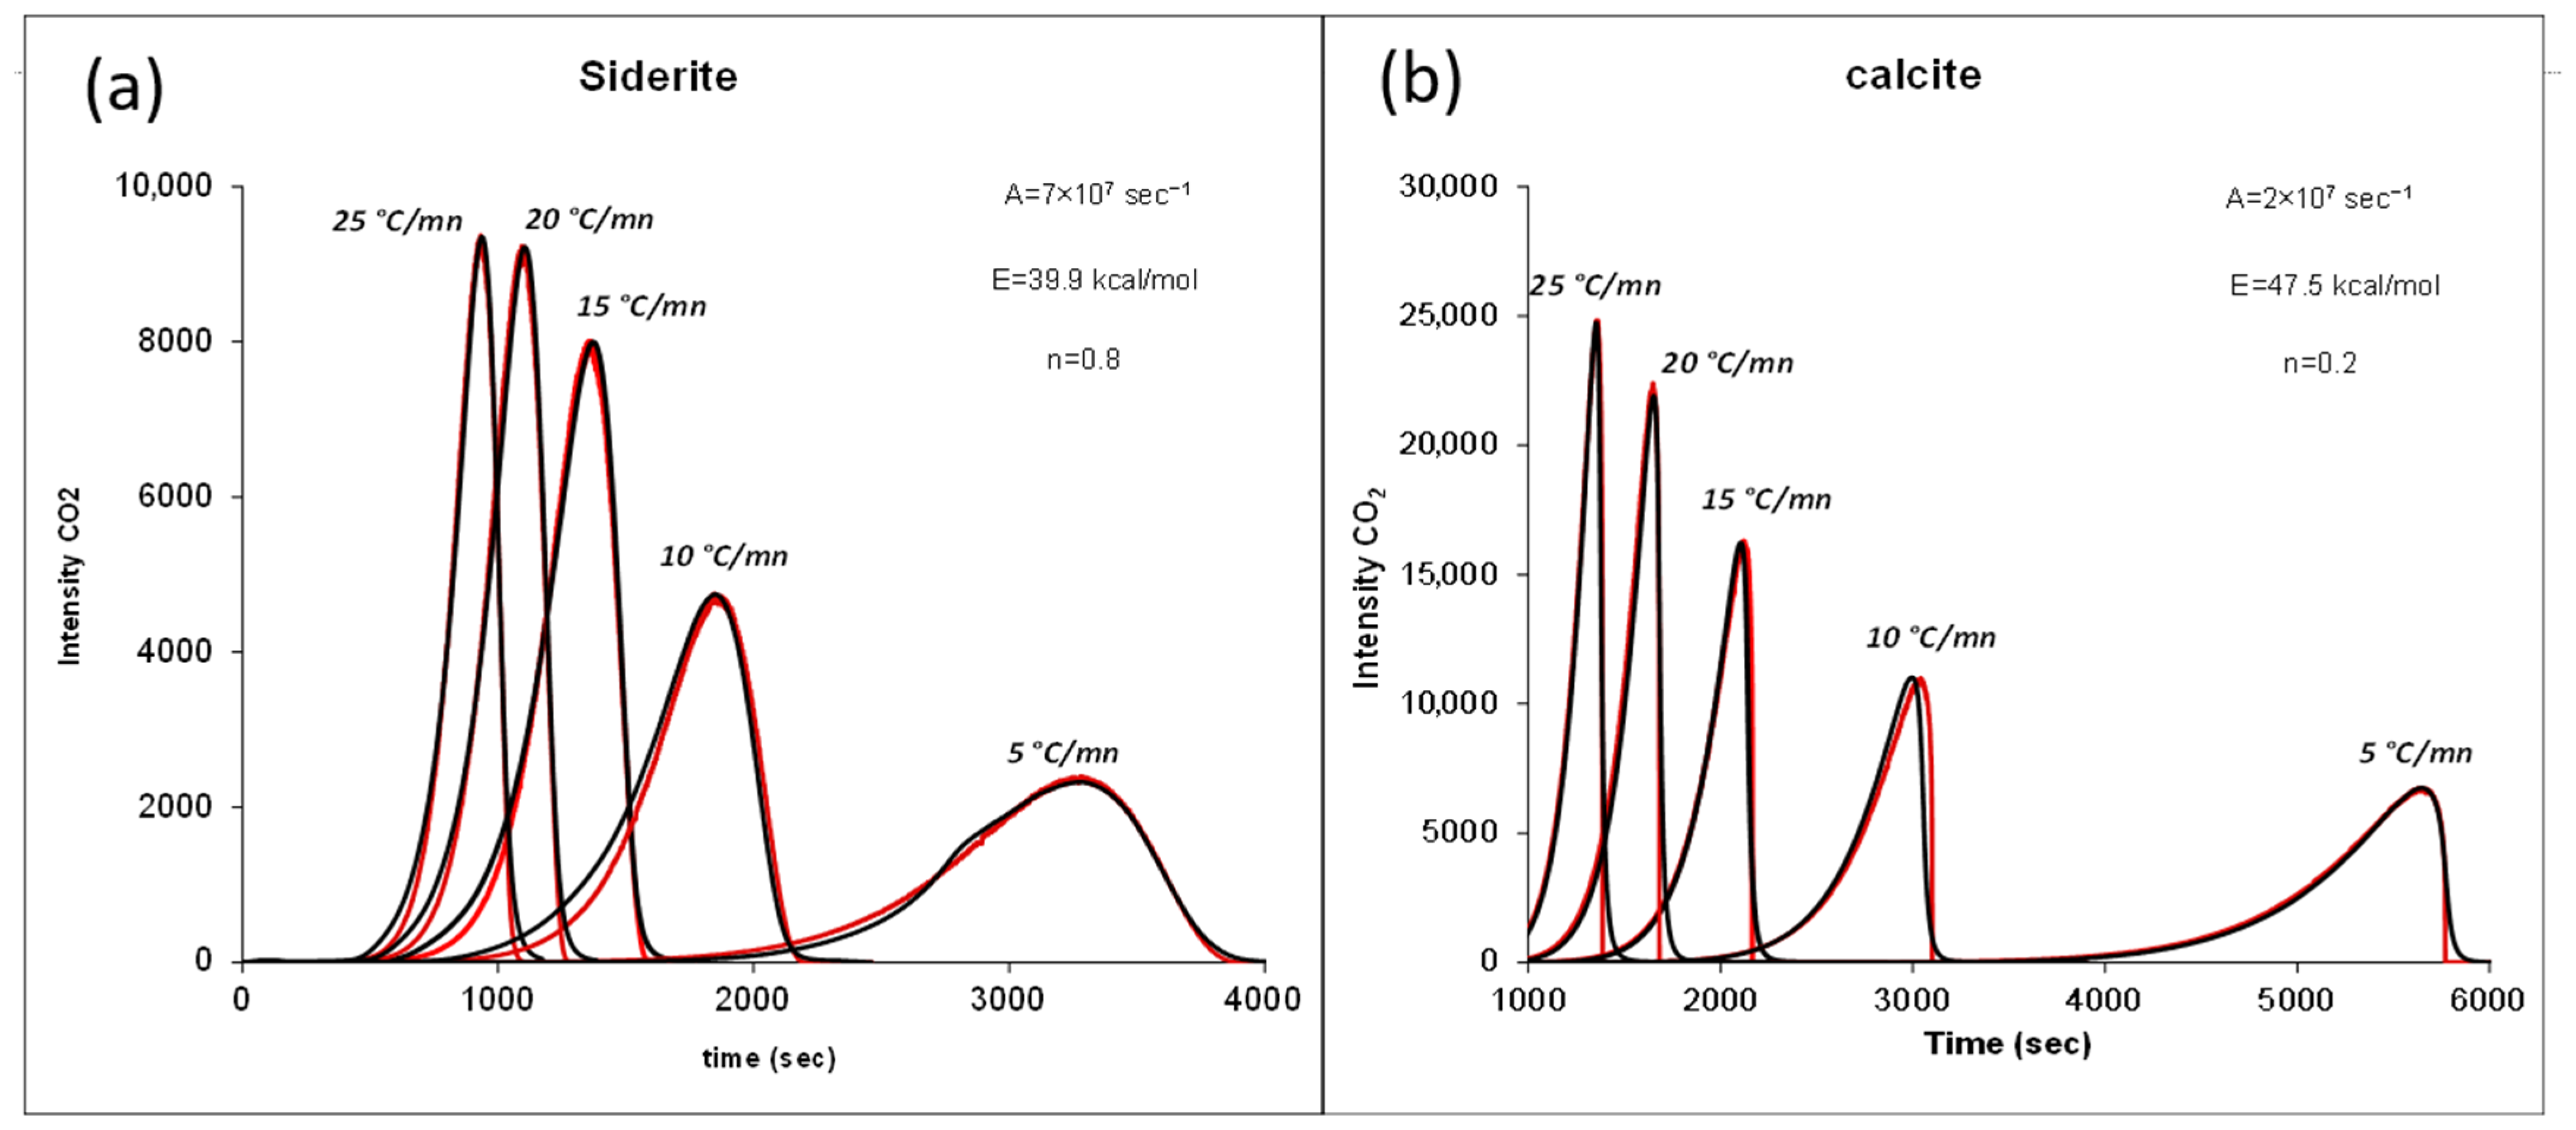
We apply this technique to the kinetics of siderite decomposition, using the Rock-Eval oxidation oven, with various temperature ramps, as shown in Figure 9. These measurements were performed on siderite from the Solimões Basin; further sample details are available in [26]. The measured curves are well fitted, with a single activation energy of 39.9 kcal/mol, an Arrhenius factor of 7 × 10⁷ s−1, and an order of 0.8. This non-integer reaction order indicates that the alteration mechanism is not a single-step decomposition of the siderite crystal but likely involves several intermediate products. The activation energy is much lower than that generally observed for the decomposition of organic matter generating hydrocarbons. It is possible to calculate, by extrapolating these kinetic parameters to geologic conditions, that one needs less than 100 thousand years at 151 °C to decompose 50% of this siderite.
In Figure 9b presents the same results for calcite (CaCO3) decomposition. The best fit corresponds to a single activation energy of 47.5 kcal/mol, the Arrhenius 2 × 10⁷ s−1, and the reaction order of 0.2. Similar to the siderite result, this non-integer reaction order suggests the involvement of complex chemical alteration processes. The significantly higher activation energy for calcite highlights its greater thermal stability. Extrapolating to the same time range of 100 thousand years, one needs a temperature of 247 °C to alter 50% of this calcite. This is approximately 100 °C more than for altering siderite.
These kinetic parameters are valuable for future basin models, providing a quantitative indication of a weakness of siderite with thermal stress. The easy decomposition of siderite leads to the release of its ferrous iron Fe(II) into aquifer waters. As ferrous iron is highly soluble in water, it can interact and be oxidized into ferric iron Fe(III), whereas water is reduced into H2. This was also observed with the Hydrogen-Eval.
It is important to note that the kinetics of siderite decomposition should not be considered constant. The values presented here were computed on natural siderite [10,26]. Synthetic siderites decompose much faster, and the siderite from Greenland studied by [48] presented a decomposition peak also slightly earlier (508 °C for an 30 °C/min heating ramp).

6. Discussion

6.1. Potential of Siderite for the Generation of Hydrogen

In summary, rock samples were analyzed using both the Rock-Eval 7 and the novel Hydrogen-Eval. Pyrolysis was performed with dry nitrogen carrier gas (Rock-Eval and Hydrogen-Eval) and wet nitrogen carrier gas (Hydrogen-Eval) with a temperature ramp of 25 °C/min. CO and CO2 were quantified with the Rock-Eval using infrared cells, and water was measured. H2 was measured using the Hydrogen-Eval using both carrier gas modes (dry and wet nitrogen).
Figure 10 presents the various curves obtained from one of the rock samples containing siderite (Sample 1). With the Rock-Eval, we observe a water signal (blue curve) with two peaks: a first one with a Tpeak around 296 °C at the very beginning of the temperature ramp, and a second one with a Tpeak of 566 °C. We interpret the first peak as corresponding to the evaporation of free water remaining in the sample. The second, higher temperature peak is attributed to the release of water linked to the phyllosilicates of the sample (in this sample, 8% kaolinite). The two peaks of CO and CO2 correspond to the destabilization of siderite, with Tpeak values of 547 °C and 538 °C, respectively. These values are consistent with those obtained when computing the kinetic parameters presented in the previous section.
Looking at the H2 signal with the Hydrogen-Eval using the DG mode (red curve in Figure 10), it appears that H2 begins to be generated some time after siderite decomposition (Tpeak of 681 °C) and just after the beginning of the water release from associated phyllosilicates (second peak of the blue curve at 566 °C). This is linked to the availability of water, which is necessary to generate H2 through the typical reaction of Fe(II) oxidation and water reduction.
The green curve, which represents H2 generation using a wet carrier gas (nitrogen + water vapor), exhibits two peaks. The first one, with Tpeak centered at approximately 615 °C, occurs at a lower temperature than the H2 peak observed with the dry carrier gas (Tpeak of 681 °C). This may be explained, as previously discussed, by the availability of water in the system. With a dry carrier gas, water is not accessible until the decomposition of phyllosilicates. Conversely, with water vapor present in the carrier gas, H2 may be generated before, but yet after siderite decomposition, as the temperature of the REDOX reaction appears higher than the temperature of siderite decomposition.
A second peak of H2 generation (green curve in Figure 10) can be seen with a high Tpeak of 885 °C. The first H2 generation is generating iron oxide, which is, in this case, magnetite (tested with a magnet on the residue), and as the water vapor continues to be available. Thanks to the carrier gas, a second REDOX reaction can occur, oxidizing the magnetite into hematite and reducing the available water. If the carrier gas is dry, all the water is consumed at the first peak (Tpeak of 681 °C), and the formed magnetite cannot be oxidized further into hematite. It should be noted that the presence of the two peaks in wet gas pyrolysis is not observed in all samples (see Figure 6 for Sample 7).
The quantity of H2 generated differs significantly between the dry and wet pyrolysis modes, a difference directly attributable to the relative availability of water. Figure 8 shows that the H2 yield is proportional to the siderite content in the rock, with two different slopes corresponding to the dry or wet carrier gas. Considering the total availability of water (e.g., within an active aquifer setting), the maximum potential of siderite is around 7 moles of H2 per kilogram of siderite. This means that 6.4 kg of siderite is required to produce 1 m3 of H2 under standard conditions.
This potential for H2 generation (7 mol/kg of siderite) is much higher than the usual estimates of H2 generation through serpentinization, varying around 0.2–0.4 mol/kg [50,51,52]. Another important observation is that, even though siderite-rich layers are relatively small generally in sedimentary basins, the liberation of soluble ferrous iron in water allows for an extension of the kitchen of H2 generation, not only linked to the siderite-rich layers but also to the whole halo, where water charged with ferrous iron is invading the sediments. These findings considerably extend the potential area of H2 generation within sedimentary basins. Crucially, the reactions described here occur at temperatures and depths significantly lower than those typically required for the serpentinization or late maturation of OM. There is a possible source for H2, a “H2 kitchen” at a depth of 3 km, or less, in sedimentary basins.
In conclusion, siderite has excellent potential for generating H2, but the generation kinetics must allow this process to occur at temperatures, depths, and timescales compatible with those of the studied area, as is the case in the Llanos Basin.

6.2. Open vs. Closed System

Among the various works dealing with siderite decomposition [9,23], two main types of experiments are presented, either in open or in closed systems. The results of these two kinds of experiments cannot be compared directly, as demonstrated before in the literature about hydrocarbon generation through thermal cracking, produced through dry open system pyrolysis like the Rock-Eval [53], dry closed systems in gold tubes [54,55] or closed systems with hydrous pyrolysis [56].
The thermal siderite decomposition in a closed system is limited by an equilibrium occurring between siderite and water on one side and H2 with byproducts like magnetite, CO2, etc., on the other side. Consequently, H2 generation is limited by the Law of Mass Action governing the chemical reaction. In an open system, because of the constant extraction of H2, the chemical reaction may continue until the total consumption of the initial siderite. Conversely, since water is a reactant in H2 generation, open systems operate at higher temperature, with supercritical water, whereas closed systems are typically operated at temperatures below the critical temperature of water. Therefore, the temperatures in closed systems provide more realistic conditions for comparison to natural geological settings. Another issue for various experiments generating H2 from siderite is the presence or not of a gas phase. If present, the gas phase extracts the hydrogen molecules out of the mineral/water assemblage generating H2, acting as a headspace extractor, or a semi-open system. In nature, it is hypothesized, but not demonstrated, that H2, like helium, for example, is extracted from its generating rock thanks to another gas compound acting like a carrier gas. This gas compound often seems to be N2 in the case of H2 accumulations, but it could also be CO2 or other abundant gases.
One of the consequences of these differences is the very contrasting conclusions obtained: in closed systems, the water/rock ratio must be high in order to generated hydrogen (around 200 according to [23]), whereas it may be very low in open systems. In this study, we observe that, with dry heating with the Hydrogen-Eval, H2 is generated due to the water existing in associated shales, and the water/rock ratios are then around 0.1. With water vapor in the carrier gas of the Hydrogen-Eval, the water/rock ratio is around 70. Another point is that the generated H2 may react secondarily with minerals in a closed system (for ameliorating the stoichiometry of magnetite acting, in this case, as a hydrogen sink, for example [23]), whereas in open systems like the Hydrogen-Eval, the immediate extraction of H2 prevents any later consumption of this gas. The temperature of generation may also be extremely variable, from temperatures below 100 °C for some cases like BIF [8], or at supercritical temperatures in the case of hydrothermal systems (e.g., Italy [57]).
As with hydrocarbon systems, geologic H2 systems are between a completely open system (as some accumulations occur) and a completely closed system (as H2 migrates out of its generation pod). Therefore, the geological cases probably present an intermediate scenario between the various types of experiments presented above, and more work is needed in order to quantify, in a consistent way, the amount of H2 generated from siderite.

7. Conclusions

The H2 yield and kinetics of siderite decomposition make siderite-rich facies excellent H2_GRs, especially at low temperatures under active hydrodynamics conditions. As a comparison, the olivine and peridotite studied by [58,59] are one to two orders of magnitude less prolific.
The rapid destabilization of siderite with temperature in the presence of water implies that there is a relatively narrow temperature window in which this generation of H2 occurs. Incidentally, our experiments also explain the rarity of siderite in sedimentary records; above a certain temperature, it disappears.
In addition, it may be envisioned that H2 generated through siderite decomposition, in the geological formations, offers REDOX conditions favorable to other H2 generation mechanisms. In other words, considering the numerous possible processes of H2 generation suggested in the recent literature, some of the processes occurring for H2 generation like siderite decomposition prepare a reduced subsurface environment. This reduced environment can significantly impact the efficiency of other H2-generating reactions. For example, the ammonium decomposition generates only N2 and H2O in oxidizing conditions but N2 and H2 in reducing conditions [6]. Also, generated H2 may be best preserved thanks to these reducing conditions. The occurrence of siderite should be considered not only as an important source of natural H2 but also a factor that catalyzes other H2 generation mechanisms and enhances H2 preservation.
This work, therefore, opens up new prospects for the exploration of H2 in sedimentary areas devoid of mafic or ultramafic rocks. In the Carboniferous basin of eastern France, where high levels of dissolved H2 have been detected in aquifers (//news.cnrs.fr/articles/a-gigantic-hydrogen-deposit-in-northeast-france), the origin of this H2 has not yet been identified. The basin is rich in coal, a possible source, but also in iron, particularly siderite [31], which can also contribute to H2 charge. The temperatures required for H2 formation through coal maturation are high, exceeding 200 °C [17,18,25], but siderite can react at much lower temperatures. The present work significantly expands the range of temperatures at which H2 can be generated.

Supplementary Materials

The following supporting information can be downloaded at: https://www.mdpi.com/article/10.3390/min15111218/s1, Table S1: Rock Eval Data.

Author Contributions

Conceptualization, I.M.; methodology, A.P., J.A. and N.B.; validation, I.M.; investigation, A.P., J.A., N.B.; I.M.; writing—original draft preparation and review, A.P., J.A., N.B.; I.M., supervision, I.M.; funding acquisition, I.M. and N.B. All authors have read and agreed to the published version of the manuscript.

Funding

The Colombian field data acquisition was funded by Servicio Geological Colombiano, and the Hydrogen-Eval development was funded by Vinci technologies.

Data Availability Statement

Data are in the text and Supplementary Material.

Acknowledgments

We thank Alexander Piragua and Juan Carlos Montaña for initiating this work and the full SGC H2 team who helped to build the knowledge and database about H2 in the Llanos, Victoria Camacho, Luis Bravo, Estéfany Mora and Felipe Pastor. We also thank Alejandra Carrillo, UPPA, who participated in the field acquisition.

Conflicts of Interest

The co-authors Alain Prinzhofer and Jérémie Ammouial, and Nicolas Bouton are affiliated with the GEO4U and Vinci Technologies companies. The remaining authors declare that the research was conducted in the absence of any commercial or financial relationships that could be construed as a potential conflict of interest.

Abbreviations

The following abbreviations are used in this manuscript:
SRSource rock for hydrocarbon
GRGenerating rock for H2
RERock-Eval Pyrolyzer
HCHydrocarbon
OMOrganic Matter

References

  1. Klein, F.; Tarnas, J.D.; Bach, W. Abiotic Sources of Molecular Hydrogen on Earth. Elements 2020, 16, 19–24. [Google Scholar] [CrossRef]
  2. Lévy, D.; Roche, V.; Pasquet, G.; Combaudon, V.; Geymond, U.; Loiseau, K.; Moretti, I. Natural H2 Exploration: Tools and Workflows to Characterize a Play. Sci. Technol. Energy Transit. 2023, 78, 27. [Google Scholar] [CrossRef]
  3. Lin, L.-H.; Slater, G.F.; Sherwood Lollar, B.; Lacrampe-Couloume, G.; Onstott, T.C. The Yield and Isotopic Composition of Radiolytic H2, a Potential Energy Source for the Deep Subsurface Biosphere. Geochim. Cosmochim. Acta 2005, 69, 893–903. [Google Scholar] [CrossRef]
  4. Zgonnik, V. The Occurrence and Geoscience of Natural Hydrogen: A Comprehensive Review. Earth-Sci. Rev. 2020, 203, 103140. [Google Scholar] [CrossRef]
  5. Arrouvel, C.; Prinzhofer, A. Genesis of Natural Hydrogen: New Insights from Thermodynamic Simulations. Int. J. Hydrogen Energy 2021, 46, 18780–18794. [Google Scholar] [CrossRef]
  6. Jacquemet, N.; Prinzhofer, A. The Association of Natural Hydrogen and Nitrogen: The Ammonium Clue? Int. J. Hydrogen Energy 2024, 50, 161–174. [Google Scholar] [CrossRef]
  7. Geymond, U.; Briolet, T.; Combaudon, V.; Sissmann, O.; Martinez, I.; Duttine, M.; Moretti, I. Reassessing the Role of Magnetite during Natural Hydrogen Generation. Front. Earth Sci. 2023, 11, 1169356. [Google Scholar] [CrossRef]
  8. Geymond, U.; Ramanaidou, E.; Lévy, D.; Ouaya, A.; Moretti, I. Can Weathering of Banded Iron Formations Generate Natural Hydrogen? Evidence from Australia, Brazil and South Africa. Minerals 2022, 12, 163. [Google Scholar] [CrossRef]
  9. Milesi, V.; Guyot, F.; Brunet, F.; Richard, L.; Recham, N.; Benedetti, M.; Dairou, J.; Prinzhofer, A. Formation of CO2, H2 and Condensed Carbon from Siderite Dissolution in the 200–300 °C Range and at 50MPa. Geochim. Cosmochim. Acta 2015, 154, 201–211. [Google Scholar] [CrossRef]
  10. Milesi, V.; Prinzhofer, A.; Guyot, F.; Brunet, F.; Richard, L.; Dairou, J.; Benedetti, M. Unconventional Generation of Hydrocarbons in Petroleum Basin: The Role of Siderite/Water Interface. Mineral. Mag. 2013, 77, 1661–1817. [Google Scholar]
  11. Li, X.; Krooss, B.M.; Weniger, P.; Littke, R. Molecular Hydrogen (H2) and Light Hydrocarbon Gases Generation from Marine and Lacustrine Source Rocks during Closed-System Laboratory Pyrolysis Experiments. J. Anal. Appl. Pyrolysis 2017, 126, 275–287. [Google Scholar] [CrossRef]
  12. Hirose, T.; Kawagucci, S.; Suzuki, K. Mechanoradical H2 Generation during Simulated Faulting: Implications for an Earthquake-Driven Subsurface Biosphere. Geophys. Res. Lett. 2011, 38, 1–5. [Google Scholar] [CrossRef]
  13. Lefeuvre, N.; Truche, L.; Donzé, F.-V.; Vandenborre, J.; Gaucher, E.C.; Magnin, V. The Contribution of Mechanoradical Reactions to Crustal Hydrogen Generation. Earth Planet. Sci. Lett. 2025, 660, 119363. [Google Scholar] [CrossRef]
  14. Mosquera-Rivera, J.E.; Jiménez-Vergara, J.M.; Betancourt-Flórez, R.E.; Vargas-Jiménez, C.A.; Ball, P.J. Evaluating and Revealing Statistical Patterns and Database Performance in Hydrogen Exploration. Interpretation 2025, 13, SA29–SA46. [Google Scholar] [CrossRef]
  15. Lollar, B.S.; Onstott, T.C.; Lacrampe-Couloume, G.; Ballentine, C.J. The Contribution of the Precambrian Continental Lithosphere to Global H2 Production. Nature 2014, 516, 379–382. [Google Scholar] [CrossRef]
  16. Lefeuvre, N.; Thomas, E.; Truche, L.; Donzé, F.; Cros, T.; Dupuy, J.; Pinzon-Rincon, L.; Rigollet, C. Characterizing Natural Hydrogen Occurrences in the Paris Basin From Historical Drilling Records. Geochem. Geophys. Geosyst. 2024, 25, e2024GC011501. [Google Scholar] [CrossRef]
  17. Boreham, C.J.; Edwards, D.S.; Feitz, A.J.; Murray, A.P.; Mahlstedt, N.; Horsfield, B. Modelling of Hydrogen Gas Generation from Overmature Organic Matter in the Cooper Basin, Australia. APPEA J. 2023, 63, S351–S356. [Google Scholar] [CrossRef]
  18. Horsfield, B.; Mahlstedt, N.; Weniger, P.; Misch, D.; Vranjes-Wessely, S.; Han, S.; Wang, C. Molecular Hydrogen from Organic Sources in the Deep Songliao Basin, P.R. China. Int. J. Hydrogen Energy 2022, 47, 16750–16774. [Google Scholar] [CrossRef]
  19. Patiño, C.; Piedrahita, D.; Colorado, E.; Aristizabal, K.; Moretti, I. Natural H2 Transfer in Soil: Insights from Soil Gas Measurements at Varying Depths. Geosciences 2024, 14, 296. [Google Scholar] [CrossRef]
  20. Patiño, C.; Strąpoć, D.; Torres, O.; Mullins, O.; Bustos, U.; Bermudez, O.; López, A.; Trujillo, M.; Morales, H. First Downhole Sampling of a Natural Hydrogen Reservoir in Colombia. Front. Energy Res. 2024, 12, 1443269. [Google Scholar] [CrossRef]
  21. Vayssaire, A.; Abdallah, H.; Hermoza, W.; Figari, E. Regional Study and Petroleum System Modeling of the Eastern Llanos Basin. AAPG Search Discov. 2014, 9. [Google Scholar]
  22. Gonzalez-Penagos, F.; Moretti, I.; Guichet, X. Fluid Flow Modeling in the Llanos Basin, Colombia. AAPG Mem. 2017, 114, 191–217. [Google Scholar]
  23. Geymond, U.; Truche, L.; Sissmann, O.; Kubániová, D.; Recham, N.; Martinez, I. Mineralogical Changes and H2 Generation Yield During Hydrothermal Alteration of a Magnetite-Siderite Assemblage. JGR Solid Earth 2025, 130, e2024JB030724. [Google Scholar] [CrossRef]
  24. Behar, F.; Beaumont, V.; De B. Penteado, H.L. Rock-Eval 6 Technology: Performances and Developments. Oil Gas Sci. Technol. —Rev. IFP 2001, 56, 111–134. [Google Scholar] [CrossRef]
  25. Moretti, I.; Bouton, N.; Ammouial, J.; Carrillo Ramirez, A. The H2 Potential of the Colombian Coals in Natural Conditions. Int. J. Hydrogen Energy 2024, 77, 1443–1456. [Google Scholar] [CrossRef]
  26. Milesi, V.; Prinzhofer, A.; Guyot, F.; Benedetti, M.; Rodrigues, R. Contribution of Siderite–Water Interaction for the Unconventional Generation of Hydrocarbon Gases in the Solimões Basin, North-West Brazil. Mar. Pet. Geol. 2016, 71, 168–182. [Google Scholar] [CrossRef]
  27. Pillot, D.; Deville, E.; Prinzhofer, A. Identification and Quantification of Carbonates Species Using Rock-Eval Pyrolysis. Oil Gas Sci. Technol. 2014, 69, 341–349. [Google Scholar] [CrossRef]
  28. Armenteros, I. Chapter 2 Diagenesis of Carbonates in Continental Settings. In Developments in Sedimentology; Elsevier: Amsterdam, The Netherlands, 2010; Volume 62, pp. 61–151. ISBN 978-0-444-53526-9. [Google Scholar]
  29. Kamgaing, T. Précipitation de carbonates de cations divalents dans les systèmes lacustres: Intérêt, état des connaissances des mécanismes et suggestions (Revue critique de la littérature). Rev. Sci. L’eau 2015, 28, 81–102. [Google Scholar] [CrossRef]
  30. Bernard, A.; Symonds, R.B. The Significance of Siderite in the Sediments from Lake Nyos, Cameroon. J. Volcanol. Geotherm. Res. 1989, 39, 187–194. [Google Scholar] [CrossRef]
  31. Perrier, V.; Charbonnier, S. The Montceau-Les-Mines Lagerstätte (Late Carboniferous, France). Comptes Rendus Palevol 2014, 13, 353–367. [Google Scholar] [CrossRef]
  32. Mora, A.; Reyes-Harker, A.; Rodriguez, G.; Tesón, E.; Ramirez-Arias, J.C.; Parra, M.; Caballero, V.; Mora, J.P.; Quintero, I.; Valencia, V.; et al. Inversion Tectonics under Increasing Rates of Shortening and Sedimentation: Cenozoic Example from the Eastern Cordillera of Colombia. SP 2013, 377, 411–442. [Google Scholar] [CrossRef]
  33. Villagómez, D.; Spikings, R. Thermochronology and Tectonics of the Central and Western Cordilleras of Colombia: Early Cretaceous–Tertiary Evolution of the Northern Andes. Lithos 2013, 160–161, 228–249. [Google Scholar] [CrossRef]
  34. Jaramillo, C.; Romero, I.; D’Apolito, C.; Bayona, G.; Duarte, E.; Louwye, S.; Escobar, J.; Luque, J.; Carrillo-Briceño, J.D.; Zapata, V.; et al. Miocene Flooding Events of Western Amazonia. Sci. Adv. 2017, 3, e1601693. [Google Scholar] [CrossRef] [PubMed]
  35. Cardona, A.; Leon, S.; Jaramillo, J.S.; Schmitt, A.K.; Mejia, D.; Arenas, J.C. Cretaceous Record from a Mariana– to an Andean–Type Margin in the Central Cordillera of the Colombian Andes; The Geology of Colombia; Servicio Geológico Colombiano: Bogotá, Colombia, 2020. [Google Scholar]
  36. Horton, B.K.; Parra, M.; Mora, A. Construction of the Eastern Cordillera of Colombia: Insights from the Sedimentary Record; Servicio Geológico Colombiano: Bogotá, Colombia, 2019; p. 32. [Google Scholar]
  37. Sarmiento, L.F. Llanos Basin, Geology and Hydrocarbon Potential; Petroleum Geology of Colombia; Agencia Nacional de los Hydrocarburos: Bogota, Colombia, 2011; Volume 9. [Google Scholar]
  38. Cooper, M.A.; Addison, F.T.; Alvarez, R.; Hayward, A.B.; Howe, S.; Pulham, A.J.; Taborda, A. Basin Development and Tectonic History of the Llanos Basin, Colombia. In Petroleum Basins of South America; American Association of Petroleum Geologists: Tulsa, OK, USA, 1995; ISBN 978-1-62981-083-6. [Google Scholar]
  39. Fajardo, A.; Rojas, L.; Christancho, J. Definición del Modelo Estratigráfico en el Intervalo Cretáceo Superior a Mioceno Medio en la Cuenca Llanos Orientales y Piedemonte Llanero; Informe Final ICP-ECOPETROL: Santander, Colombia, 2000; p. 114. [Google Scholar]
  40. Reyes-Harker, A.; Ruiz-Valdivieso, C.F.; Mora, A.; Ramírez-Arias, J.C.; Rodriguez, G.; De La Parra, F.; Caballero, V.; Parra, M.; Moreno, N.; Horton, B.K.; et al. Hyperspectral Imaging for the Determination of Bitumen Content in Athabasca Oil Sands Core Samples. Bulletin 2015, 99, 1407–1453. [Google Scholar] [CrossRef]
  41. Moretti, I.; Mora, C.A.; Zamora, W.; Valendia, M.; Rodriguez, G.; Mayorga, M. Llanos N-S Petroleum System Variation (Colombia). In Proceedings of the AAPG Extended Abstract, AAPG Annual Convention and Exhibition, Denver, CO, USA, 7–10 June 2009; p. 6. [Google Scholar]
  42. Wolaver, B.D.; Coogan, J.C.; Horton, B.K.; Bermudez, L.S.; Sun, A.Y.; Wawrzyniec, T.F.; Zhang, T.; Shanahan, T.M.; Dunlap, D.B.; Costley, R.A.; et al. Structural and Hydrogeologic Evolution of the Putumayo Basin and Adjacent Fold-Thrust Belt, Colombia. Bulletin 2015, 99, 1893–1927. [Google Scholar] [CrossRef]
  43. Pasquet, G.; Loiseau, K.; Diatta, M.; Firpo, G.; Swire, P.; Amey, A.; Burckhart, T.; Moretti, I. Natural Hydrogen in the Northern Semail Ophiolite: A Case Study in the Emirate of Ras Al Khaimah, UAE. Int. J. Hydrogen Energy 2024, 110, 787–796. [Google Scholar] [CrossRef]
  44. Moretti, I.; Geymond, U.; Pasquet, G.; Aimar, L.; Rabaute, A. Natural Hydrogen Emanations in Namibia: Field Acquisition and Vegetation Indexes from Multispectral Satellite Image Analysis. Int. J. Hydrogen Energy 2022, 47, 35588–35607. [Google Scholar] [CrossRef]
  45. Roche, V.; Geymond, U.; Boka-Mene, M.; Delcourt, N.; Portier, E.; Revillon, S.; Moretti, I. A New Continental Hydrogen Play in Damara Belt (Namibia). Sci. Rep. 2024, 14, 11655. [Google Scholar] [CrossRef]
  46. Zgonnik, V.; Beaumont, V.; Larin, N.; Pillot, D.; Deville, E. Diffused Flow of Molecular Hydrogen through the Western Hajar Mountains, Northern Oman. Arab. J. Geosci. 2019, 12, 71. [Google Scholar] [CrossRef]
  47. Dueñas, H. Neoproterozoic Records of the Llanos Orientales Basin, Colombia; Servicio Geológico Colombiano: Bogotá, Colombia, 2019. [Google Scholar]
  48. Baudin, F.; Bouton, N.; Wattripont, A.; Carrier, X. Carbonates Thermal Decomposition Kinetics and Their Implications in Using Rock-Eval® Analysis for Carbonates Identification and Quantification. Sci. Technol. Energy Transit. 2023, 78, 38. [Google Scholar] [CrossRef]
  49. Gonzalez Penagos, F.; Moretti, I.; Guichet, X. Formation Water Flow and Diagenesis in the Colombian Llanos Foreland Basin. First Break 2011, 29, 51–58. [Google Scholar] [CrossRef]
  50. McCollom, T.M.; Donaldson, C. Generation of Hydrogen and Methane during Experimental Low-Temperature Reaction of Ultramafic Rocks with Water. Astrobiology 2016, 16, 389–406. [Google Scholar] [CrossRef]
  51. Huang, R.; Sun, W.; Song, M.; Ding, X. Influence of pH on Molecular Hydrogen (H2) Generation and Reaction Rates during Serpentinization of Peridotite and Olivine. Minerals 2019, 9, 661. [Google Scholar] [CrossRef]
  52. Rezaee, R. Quantifying Natural Hydrogen Generation Rates and Volumetric Potential in Onshore Serpentinization. Geosciences 2025, 15, 112. [Google Scholar] [CrossRef]
  53. Espitalie, J.; Deroo, G.; Marquis, F. La Pyrolyse Rock-Eval et Ses Applications. Deuxieme Partie. Rev. l’Institut Fr. Pét. 1985, 40, 563–579. [Google Scholar] [CrossRef]
  54. Behar, F.; Kressmann, S.; Rudkiewicz, J.L.; Vandenbroucke, M. Experimental Simulation in a Confined System and Kinetic Modeling of Kerogen and Oil Cracking. Org. Geochem. 1992, 19, 173–189. [Google Scholar] [CrossRef]
  55. Burnham, A.K. A Simple Kinetic Model of Petroleum Formation and Cracking; Lawrence livermore Lab: Livermore, CA, USA, 1989; p. 11. [Google Scholar]
  56. Lewan, M.D. Evaluation of Petroleum Generation by Hydrous Pyrolysis Experimentation. Philos. Trans. 1985, 315, 123–134. [Google Scholar]
  57. Leila, M.; Lévy, D.; Battani, A.; Piccardi, L.; Šegvić, B.; Badurina, L.; Pasquet, G.; Combaudon, V.; Moretti, I. Origin of Continuous Hydrogen Flux in Gas Manifestations at the Larderello Geothermal Field, Central Italy. Chem. Geol. 2021, 585, 120564. [Google Scholar] [CrossRef]
  58. McCollom, T.M.; Klein, F.; Robbins, M.; Moskowitz, B.; Berquó, T.S.; Jöns, N.; Bach, W.; Templeton, A. Temperature Trends for Reaction Rates, Hydrogen Generation, and Partitioning of Iron during Experimental Serpentinization of Olivine. Geochim. Cosmochim. Acta 2016, 181, 175–200. [Google Scholar] [CrossRef]
  59. Miller, H.M.; Mayhew, L.E.; Ellison, E.T.; Kelemen, P.; Kubo, M.; Templeton, A.S. Low Temperature Hydrogen Production during Experimental Hydration of Partially-Serpentinized Dunite. Geochim. Cosmochim. Acta 2017, 209, 161–183. [Google Scholar] [CrossRef]
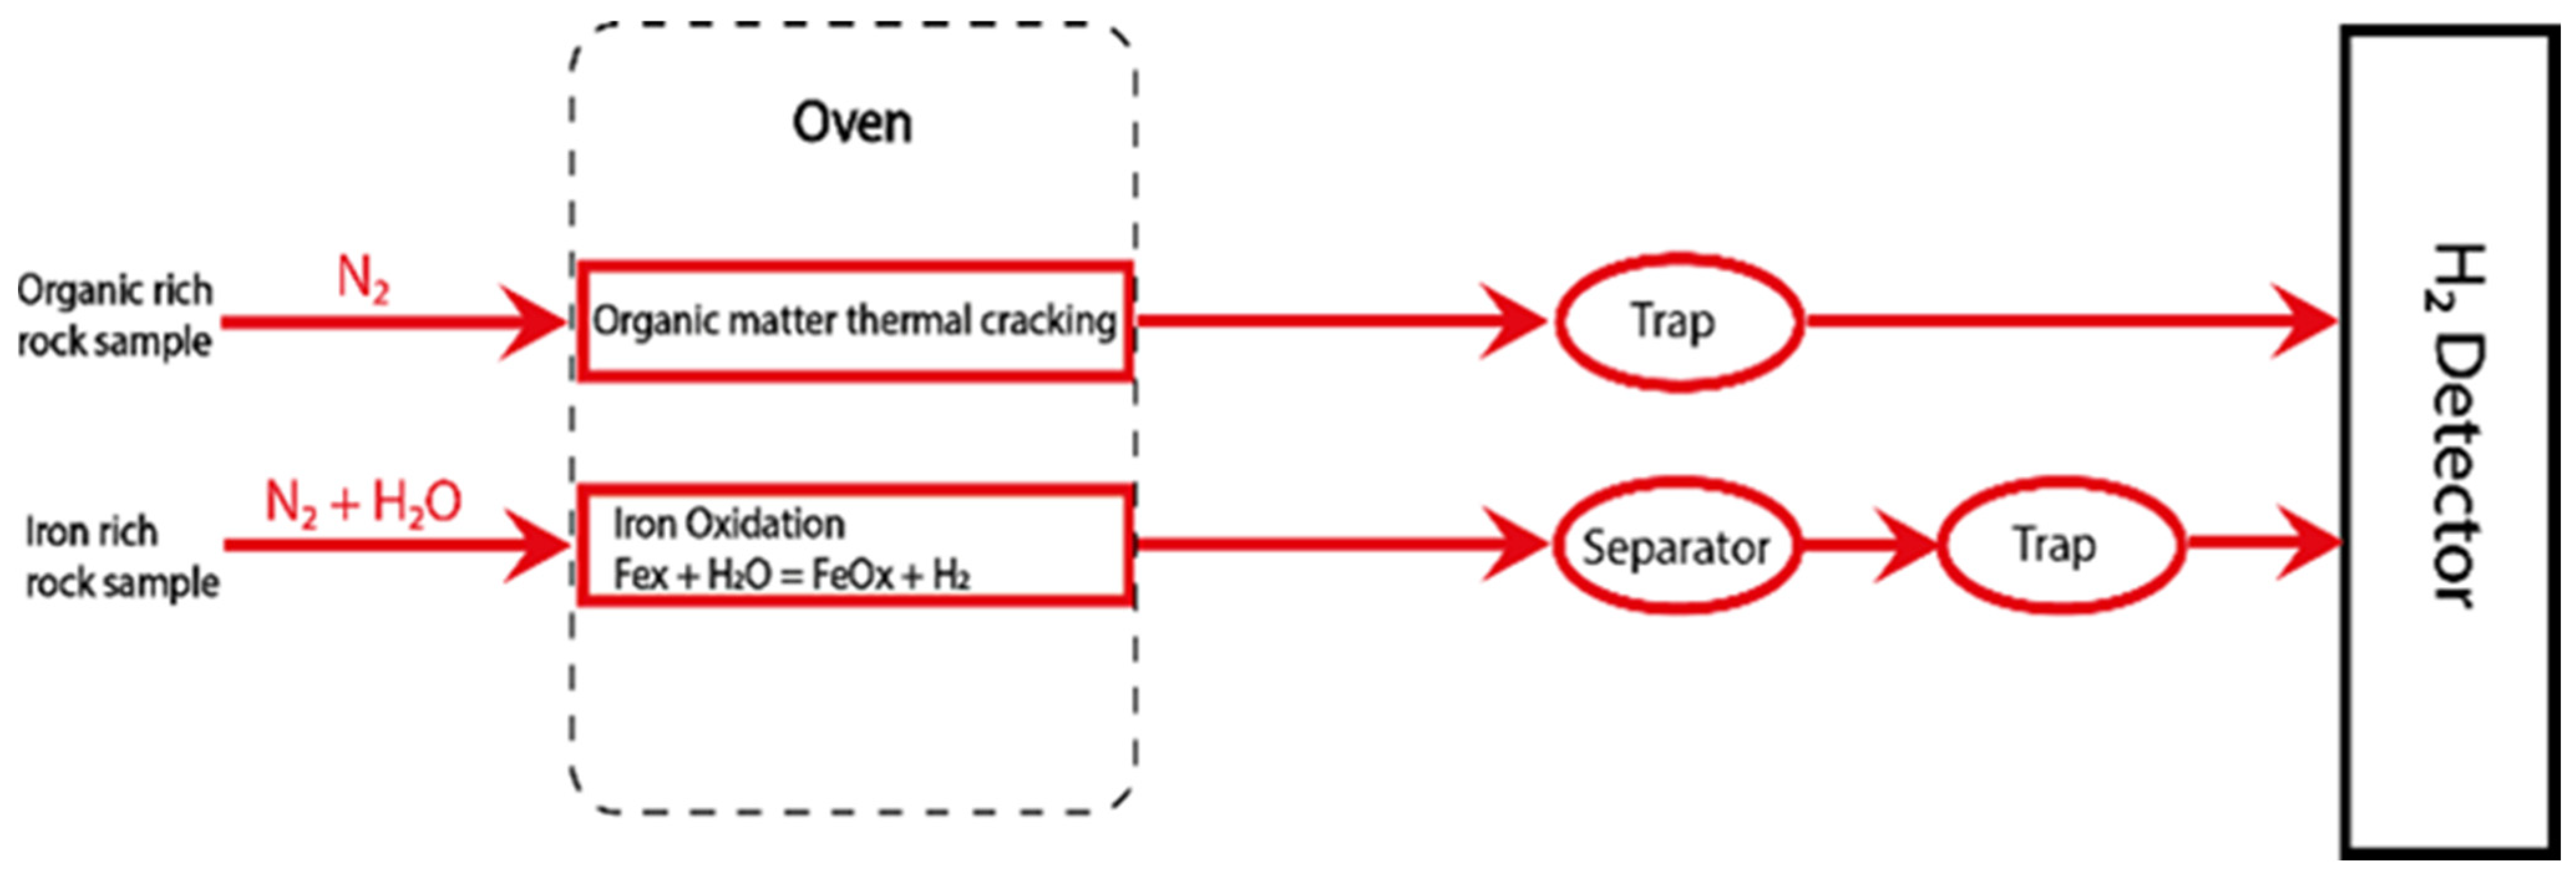
Figure 1. Principle of the Hydrogen-Eval pyrolyzer. The rock can be heated using two types of gas: dry nitrogen, as with the Rock-Eval, or wet nitrogen to trigger redox reactions.
Minerals 15 01218 g001
Figure 2. Absorption peaks of H2 and CH4 detected by the TDLAS detector during dry pyrolysis of an organic-rich sample. Arbitrary scales.
Minerals 15 01218 g002
Figure 3. Pyrogram of a blank analysis using a wet carrier gas analysis. The blue curve represents the amount of H2 produced by the water splitting at high temperature. Below 1000 °C it is null or neglectable.
Minerals 15 01218 g003
Figure 4. (a) Map showing the known H2 emanations zones in the Llanos Basin. Data have not been published in the other areas, but this does not mean that there is no H2. The square around Zone 3 indicates where the Colombian studied samples are coming from. (b) Schematic cross-section showing the pinch out of the series eastward and the main structural plays of the oil and gas industry. (c) Simplified stratigraphic column, where the studied samples of siderite are from the top of the Mirador Formation.
Minerals 15 01218 g004
Figure 5. Amount of H2 generated through pyrolysis of the eight siderite-bearing samples. The amounts are presented for dry pyrolysis (red circles) and wet pyrolysis (green circles), respectively. The numbers #1 to #8 are the sample number.
Minerals 15 01218 g005
Figure 6. Comparison of the H2 production rate with dry gas and with wet gas mode for sample 7. Exceptionally, in that case, the quantity of H2 generated within the two modes is the same (see Figure 5 and Table 3). Blue line H2 generation in the WG mode. Green line H2 generation in the DG mode. Red line, Temperature, scale on the right.
Minerals 15 01218 g006
Figure 7. Peaks of alterations in different pure mineral standards (malachite, siderite, magnesite, rhodochrosite, dolomite, aragonite, and calcite) with a heating ramp of 20 °C/min between 300 and 850 °C (from 2 to 27.5 min; then, there is a plateau at 850 °C, and the temperature decreases to 555 °C at 40 min). Modified from [27].
Minerals 15 01218 g007
Figure 8. Principle for determining kinetic parameters with a Rock-Eval, used generally for the decomposition of organic matter giving hydrocarbons. (a) S2 peaks (generated hydrocarbons) from various ramps of temperature of the Rock-Eval, from 5 °C/min to 25 °C/min. (b) Histogram of activation energies obtained after fitting the measured curves of Figure 8a. The two main equations of kinetics are represented, with k as the kinetic velocity, n the order of the reaction, t the time and X the residual amount of organic matter. A is the Arrhenius factor, Ea the activation energy, T the temperature in Kelvin and R the ideal gas constant.
Minerals 15 01218 g008
Figure 9. (a) Curves of siderite decomposition obtained with a Rock-Eval, for various ramps of temperature (in black). Best fit obtained with a kinetic model using the parameters presented in the figure (in red). (b) Calcite decomposition curves obtained with a Rock-Eval, for various ramps of temperature (in black). Best fit obtained with a kinetic model using the parameters presented in the figure (in red).
Minerals 15 01218 g009
Figure 10. Emission of CO, CO2 and H2O using a Rock-Eval 7, and the emission of H2 through dry and wet carrier gas, respectively, with the Hydrogen-Eval for Sample 1 (siderite content 26.9%).
Minerals 15 01218 g010
Table 1. Studied samples, all from the Mirador Formation.
SampleWellsDepth (Feet)Temperature BHT (°C)Gradient °C/kmEstimated Temperature
113277.2568.341.766.7
213284.768.341.766.8
323660.6671.13968.6
423662.3371.13968.6
523662.571.13968.6
623665.571.13968.7
733433.4271.141.768.7
833435.571.141.768.7
Table 3. Siderite content and H2 yields measured with the Hydrogen-Eval from the studied samples.
SampleSiderite (in %)H2_DG mmol/kgH2_WT mmol/kg
126.867901624
24.15573817
39.06295618
411.76342982
513.984361007
639.4910743364
723.3413121345
826.335721660
Table 2. Results of Rock-Eval sulfur (extract). The full dataset is available in the Supplementary Material. HI: Hydrogen Index, TOC: Total Organic Carbon: MINC Carbon mineral.
SampleS1 (mg/g)S2 (mg/g)S3 (mg/g)S3’ (mg/g)S5 (mg/g)HITOC %Pyro MINC %MINC %Siderite %
10.010.092.3792.057.22210.442.662.8626.1
20.050.150.1314.920.86470.310.430.454.3
30.010.022.4534.532.9590.20.961.0410.0
40.010.023.1946.022.5960.321.271.3513.0
50.010.023.1854.772.6250.331.521.615.4
60.010.010.83142.431.8610.674.394.4442.8
70.0101.4589.151.7500.32.622.6725.75
80.010.010.6893.912.3420.462.892.9528.45
Disclaimer/Publisher’s Note: The statements, opinions and data contained in all publications are solely those of the individual author(s) and contributor(s) and not of MDPI and/or the editor(s). MDPI and/or the editor(s) disclaim responsibility for any injury to people or property resulting from any ideas, methods, instructions or products referred to in the content.