Article

Sedimentary Provenance Analysis of Tight Sandstone Gas Reservoirs in the Middle Jurassic Shaximiao Formation, Western Sichuan Depression

1
College of Geosciences, China University of Petroleum, Beijing 102249, China
2
SINOPEC, Southwest Oil and Gas Branch, Chengdu 610041, China
*
Authors to whom correspondence should be addressed.
Minerals 2025, 15(11), 1217; https://doi.org/10.3390/min15111217
Submission received: 16 October 2025 / Revised: 14 November 2025 / Accepted: 15 November 2025 / Published: 18 November 2025
(This article belongs to the Section Mineral Exploration Methods and Applications)

Abstract

The sedimentary provenance system of tight sandstone gas reservoirs in the Middle Jurassic Shaximiao Formation, in the Sichuan Basin’s western depression, has multifaceted complexity with multi-provenanced transport distances, which affect the development of reservoir pore structure. Therefore, how to pinpoint the provenance characteristics of tight sandstone reservoirs remains a challenging task that needs to be resolved in the Shaximiao Formation across different regions (X, J, Z, and Q zones) in the Western Sichuan Depression. To address this, preliminary identification of provenance sources was achieved by a radar chart and a QFL (quartz, feldspar, and lithic fragment) triangular diagram. Comprehensive analysis was subsequently conducted utilizing heavy mineral assemblages, characteristic indices of heavy minerals, geochemical elements statistics, geochemical elements standardization curves, and the Chemical Index of Alteration (CIA). The results demonstrate that both the X and Q regions receive lithic fragments predominantly from the Longmenshan Thrust Belt (LMTB), and the J region exhibits dual provenance contributions from the western LMTB and the northeastern Micang–Dabashan Tectonic Belt (MDTB). However, in the Z region, well-developed fault systems in the western sector create a blocking effect on sediments derived from the front of the LMTB. The provenance area is from the northeastern MDTB, with a straight-line distance of about 300 km. The distribution and transportation distance of the long-axis provenance of the MDTB and the short-axis provenance of the LMTB may be the main reasons for the differences in lithic fragments, heavy minerals, and geochemical elements of the Shaximiao Formation reservoirs in different regions.

1. Introduction

Sedimentary rocks record rich geological information regarding sediment provenance and tectonic settings [1]. Detrital material and geochemical elements in sandstones can provide insights into the recycling ratio of ancient sediments, the distribution and transportation processes of the provenance area, and the tectonic background [2,3]. Provenance analysis, as a pivotal research focus in sedimentary geology, has been continuously enhanced and refined through the application of diverse analytical techniques [4,5]. The mainstream methodological framework for sedimentary provenance analysis encompasses sedimentological characterization, petrological investigation, heavy mineral analysis, elemental geochemistry, geochronological dating, geophysical exploration, and clay mineralogy studies [6,7,8].
Sedimentological methods demonstrate advantages in their straightforward application, operational effectiveness, and low-cost nature, with limitations in determining specific parameters such as the sedimentary provenance area locations and compositional characteristics of parent rocks [9,10]. By analyzing terrigenous clastic rocks derived from parent rock formations in the basin, the lithological characteristics of sedimentary provenance area parent rocks can be effectively deduced [11,12]. The detrital composition preserved in tight sandstone reservoirs provides critical insights into both basement configuration and rock provenance characteristics, serving as a reliable geological indicator for provenance terrain identification and paleo-sedimentary environment reconstruction [13,14]. Provenance analysis can employ heavy mineral assemblages, characteristic mineral indices, and the zircon–tourmaline–rutile index (ZTR index) in sandstones to systematically constrain sediment provenance characteristics [15,16].
Heavy mineral analysis has a wide range of applications and good application effects in provenance analysis research. The type of parent rock in the provenance area can be determined based on the characteristics of heavy minerals [17,18]. The older the sediment age, the more dispersed the distribution of heavy mineral content, the less information reflecting the provenance rock, and the more difficult it is to determine the provenance [19]. Elemental geochemistry serves as a powerful analytical tool for provenance studies, having gained widespread application in global geological research [20]. This methodology demonstrates distinct advantages, including operational efficiency, cost-effectiveness, and quantitative precision, while being particularly effective in unconventional hydrocarbon reservoirs [21]. Due to the influence of physical and chemical conditions in ancient water flow and sedimentary environments, sediment transport processes undergo complex exchange or adsorption interactions with media in close contact [22]. However, rare-earth elements and trace elements in sediments have difficulty undergoing physical and chemical reactions with such media and can characterize the inherent properties of detrital materials [23]. This enables differentiation between multi-provenance and single-provenance while avoiding the influence of hydrodynamic factors [18]. Therefore, the use of geochemical element analysis methods (rare-earth element analysis and trace element analysis) can accurately analyze and distinguish sedimentary paleoclimate, paleoenvironment, and provenance areas.
The composition of parent rocks varies in different provenance areas. Due to factors such as transportation distance, weathering intensity, and river width, the heavy mineral composition, geochemical elements, and pore structure of sedimentary rocks vary greatly, which restricts the selection of oil and gas exploration targets [24,25]. The tight gas reservoir of the Shaximiao Formation in the Western Sichuan Depression underwent a systematic provenance investigation through combined petrological analysis with comprehensive examinations of diagnostic characteristics, including heavy mineral assemblages and geochemical element distributions. Building upon these analytical findings, a comprehensive provenance analysis was performed. The heavy mineral index and geochemical element analysis provide critical insights for identifying provenance areas of Jurassic Shaximiao tight sandstone gas reservoirs.

2. Geological Setting

The Western Sichuan Depression is distributed parallel to the LMTB and has undergone multistage and complex tectonic activities. Due to the dive of the Yangtze Plate, the Western Sichuan Depression changed from a peripheral foreland basin in the Late Triassic to a composite foreland basin in the Middle Jurassic [26]. During the deposition period of the Jurassic Shaximiao Formation, the LMTB was in a relatively static state. At this time, the MDTB was relatively active, which indicates that the sedimentary system in the Western Sichuan Depression has gradually migrated from the northern parts of the Longmenshan to the front areas of Micang–Dabashan [27]. The tight sandstone gas reservoirs of the Jurassic Shaximiao Formation in the Western Sichuan Depression are mainly distributed in four areas: Z, Q, X, and J (Figure 1a,b).
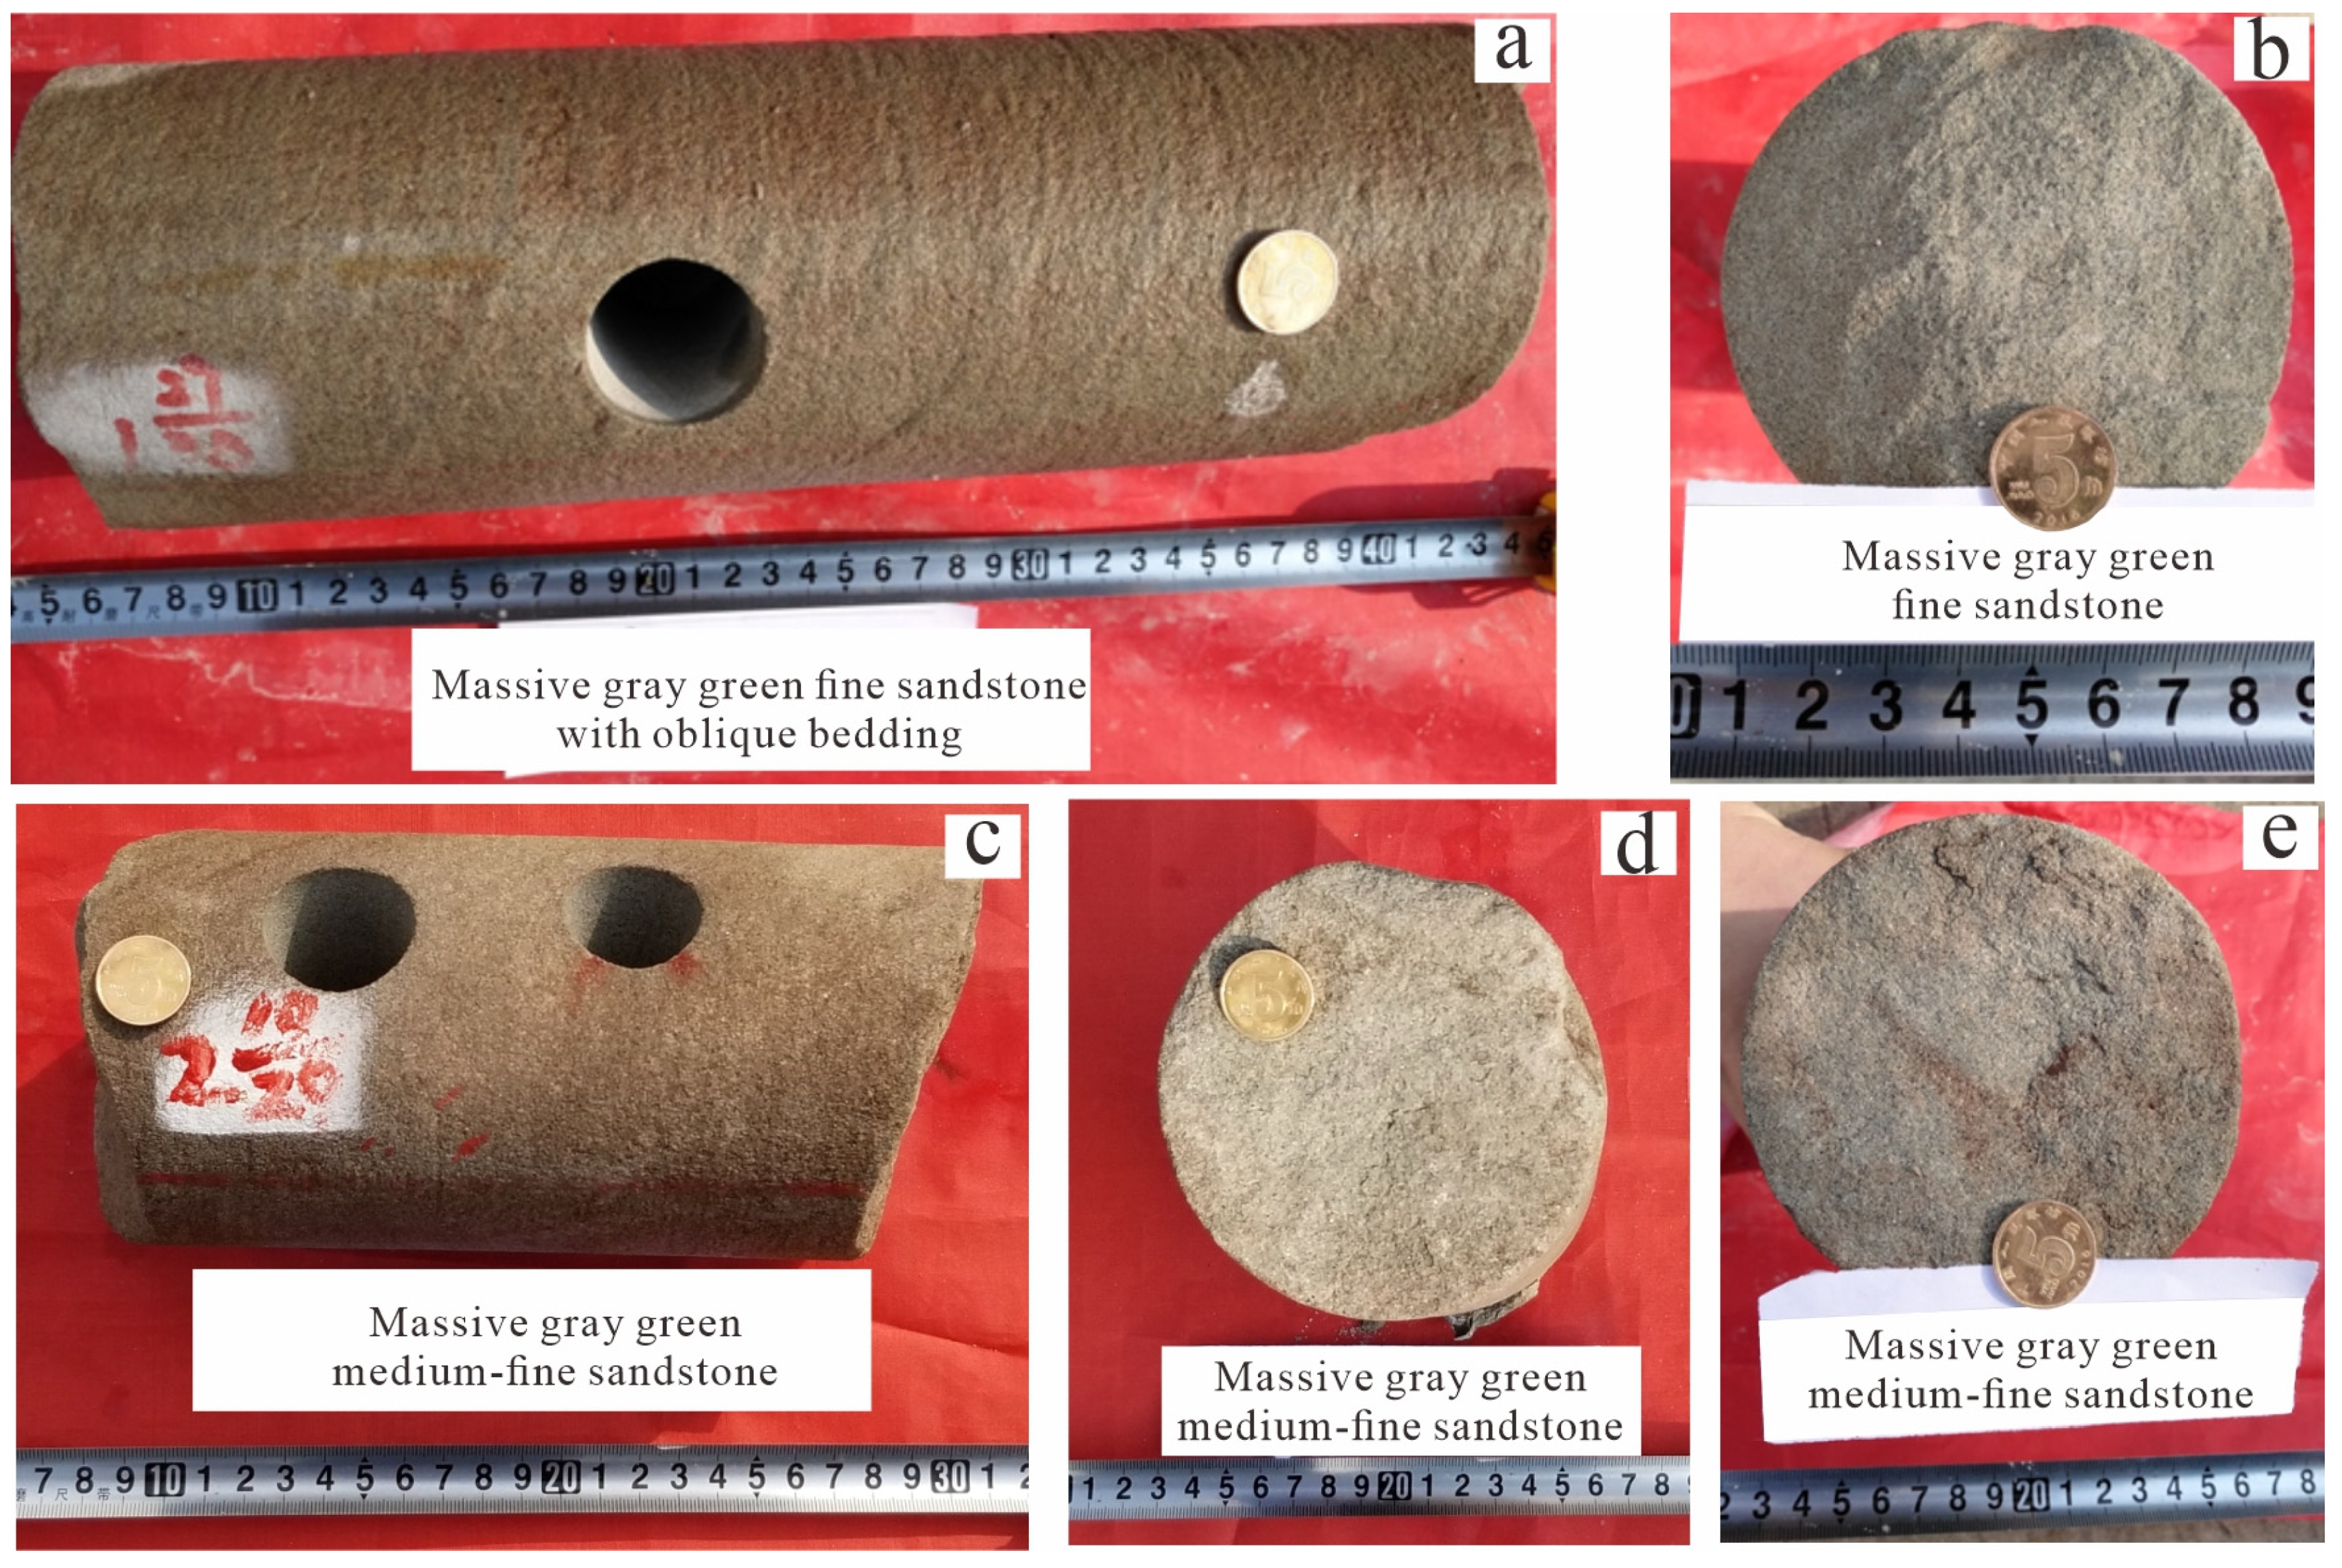
In the Early Jurassic, the Western Sichuan Depression was mainly influenced by the short-axis provenance of Longmen Mountain [28]. During the sedimentary period of the Shaximiao Formation in the Middle Jurassic, the Longmenshan Thrust Belt and surrounding areas were strongly uplifted, providing a large amount of material supply for the Western Sichuan Depression [29]. Longmen Mountain forms a short-axis relationship with the depression, while Micang–Dabashan forms a long-axis relationship with the depression [30]. The thickness of the sand body in the direction of Longmen Mountain (western edge of the basin) is relatively thin, not exceeding 400 m, with a tendency to thicken toward the east, reaching over 800 m in the central Sichuan region [31]. The overall average thickness is 500 m (Figure 1c). The river delta sedimentary reservoir of the Shaximiao Formation is mainly composed of gray-green and gray medium-fine sandstone (Figure 1d and Figure 2).
Figure 1. Structural background, stratigraphic distribution, and lithology of the Western Sichuan Depression. (a) Geographical positioning of the Sichuan Basin and study area; (b) Tectonic setting and simplified geological map of the middle part of the Western Sichuan Depression (reproduced with permission from [29] [Tectonic evolution of the Sichuan Basin, Southwest China. Earth-Science Reviews]; published by [Elsevier], [2018]); (c) stratigraphic and lithological distribution map (reproduced with permission from [32] [A new method for logging identification of fluid properties in tight sandstone gas reservoirs based on gray correlation weight analysis—A case study of the Middle Jurassic Shaximiao Formation on the eastern slope of the Western Sichuan Depression, China. Interpretation]; published by [SEG Library], [2021]); (d) 2595.34–2595.62 m, well Z6, massive gray-green medium-fine sandstone.
Minerals 15 01217 g001
Figure 2. Macro-characteristics of the core samples from the study area. (a) 1537.33–1537.6 m, well Z2, massive gray-green fine sandstone, cross-bedding; (b) 1627.27 m, well Z4, massive gray-green fine sandstone; (c) 2644.52–2644.82 m and (d) 2644.82 m, well Z5, massive gray-green medium-fine sandstone; (e) 2595.62 m, well Z6, massive gray-green medium-fine sandstone, section of Figure 1c.
Minerals 15 01217 g002

3. Methods

3.1. Experimental Samples

The core samples of these experiments were extracted from real drill cores of the Jurassic Shaoximiao Formation in the Western Sichuan Depression. This study included 215 thin-section experimental samples, 70 XRD experimental samples, and 128 geochemical element determination samples (comprising both trace elements and rare-earth elements). To fulfill diverse analytical requirements, a series of experimental procedures was implemented on identical core specimens. These samples are primarily composed of fine-grained sandstone and medium to fine-grained sandstone, exhibiting a distinctly compact lithology with minimal occurrence of fractures and dissolution pores (Figure 2). The full-diameter core is mainly block-shaped. Some samples show cross-bedding (Figure 1c and Figure 2a,c).

3.2. Heavy Mineral Index Method

The heavy mineral characteristic index includes ATi; GZi; the stability coefficient, Wi; ZTR; and Ruzi. The ATi index can reflect the provenance changes of acidic magmatic rocks in sediments and the degree of weathering of sediments (Formula (1)) [17,18].
A T i = 100 × a p a t i t e % ( a p a t i t e % + t o u r m a l i n e % )
The GZi index can reflect the changes in the provenance of garnet as the parent rock (Formula (2)) [18,21].
G Z i = 100 × G a r n e t % ( G a r n e t % + z i r c o n % )
The stability coefficient, Wi, can reflect the distance characteristics of sediment transport (Formula (3)) [18,19].
W i = S t a b l e   h e a v y   m i n e r a l s % U n s t a b l e   h e a v y   m i n e r a l s %
ZTR is an important indicator for measuring the maturity of heavy minerals (Formula (4)) [19]. The higher its value, the higher the maturity, indicating that it is farther away from the provenance area.
Z T R = ( z i r c o n % + r u t i l e % + t o u r m a l i n e % ) ( p o m e g r a n a t e   g a r n e t % + z i r c o n % + a p a t i t e % + t o u r m a l i n e % )
RuZi can determine the type of provenance rock, and a high RuZi value indicates the provenance of basic ultrabasic rocks, acidic magmatic rocks, or metamorphic rocks (Formula (5)) [17,18,21].
R u Z i = r u t i l e % ( r u t i l e % + z i r c o n % )

3.3. Chemical Variation Index Method

The Chemical Variation Index (CIA) can quantitatively evaluate the weathering degree of tight sandstone minerals and assist in determining the provenance area (Formula (6)). Nevertheless, the high value of the CIA suggests transportation and recycling from provenance areas located far away from the depositional basin [33], which in turn is consistent with a provenance from the interior of a stable craton (Sichuan Basin). Usually, when the CIA < 60, it reflects a weak degree of weathering in the provenance area. When 60 ≤ CIA < 80, it reflects a strong degree of weathering in the provenance area. When 80 ≤ CIA < 100, it reflects that the provenance area has undergone strong weathering [34]. CaO* refers to the CaO content in the non-chemical sedimentary part of rocks.
C I A = A l 2 O 3 / ( A l 2 O 3 + C a O * + N a 2 O + K 2 O ) × 100

4. Results

4.1. Petrographic Analysis

The rock composition was determined by observing 179 thin-section images under a microscope. The mass fractions of quartz, feldspar, and lithic fragments accounted for 35%–75%, 5%–45%, and 10%–45% of the total rock mass, respectively, with average values of 49.81%, 24.98%, and 23.65% (Table 1).
The rock thin sections of wells X1 and Q1 show that the pores are not well developed and have poor connectivity. The pores are mainly intergranular dissolution pores and intergranular pores (Figure 3a,b). In the rock thin sections of well J4, the rock pores are relatively developed with poor connectivity, mainly consisting of intergranular pores and intergranular dissolved pores (Figure 3c,d). In the rock thin sections of well Z6, the rock pores are relatively developed with good connectivity, mainly consisting of intergranular pores and intergranular dissolved pores (Figure 3e,f). The thin-section observation results for the 179 tight sandstone samples from the Shaximiao Formation in different areas of the Western Sichuan Depression show significant differences in reservoir pore structure (Figure 3 and Table 1).

4.2. Relative Content of Heavy Minerals and Geochemical Elements

The heavy mineral composition and relative content of the tight sandstone samples were determined using XRD diffraction analysis in the laboratory, and the results are shown in Table 2. The ultra-stable heavy minerals in the sediment samples of the tight sandstone gas reservoir of the Shaximiao Formation in the Western Sichuan Depression include zircon, tourmaline, and rutile. Stable heavy minerals include garnet, anatase, and ilmenite. Unstable heavy minerals include apatite, epidote, pyroxene, limonite, leucoxene, and pyrite (Table 2).
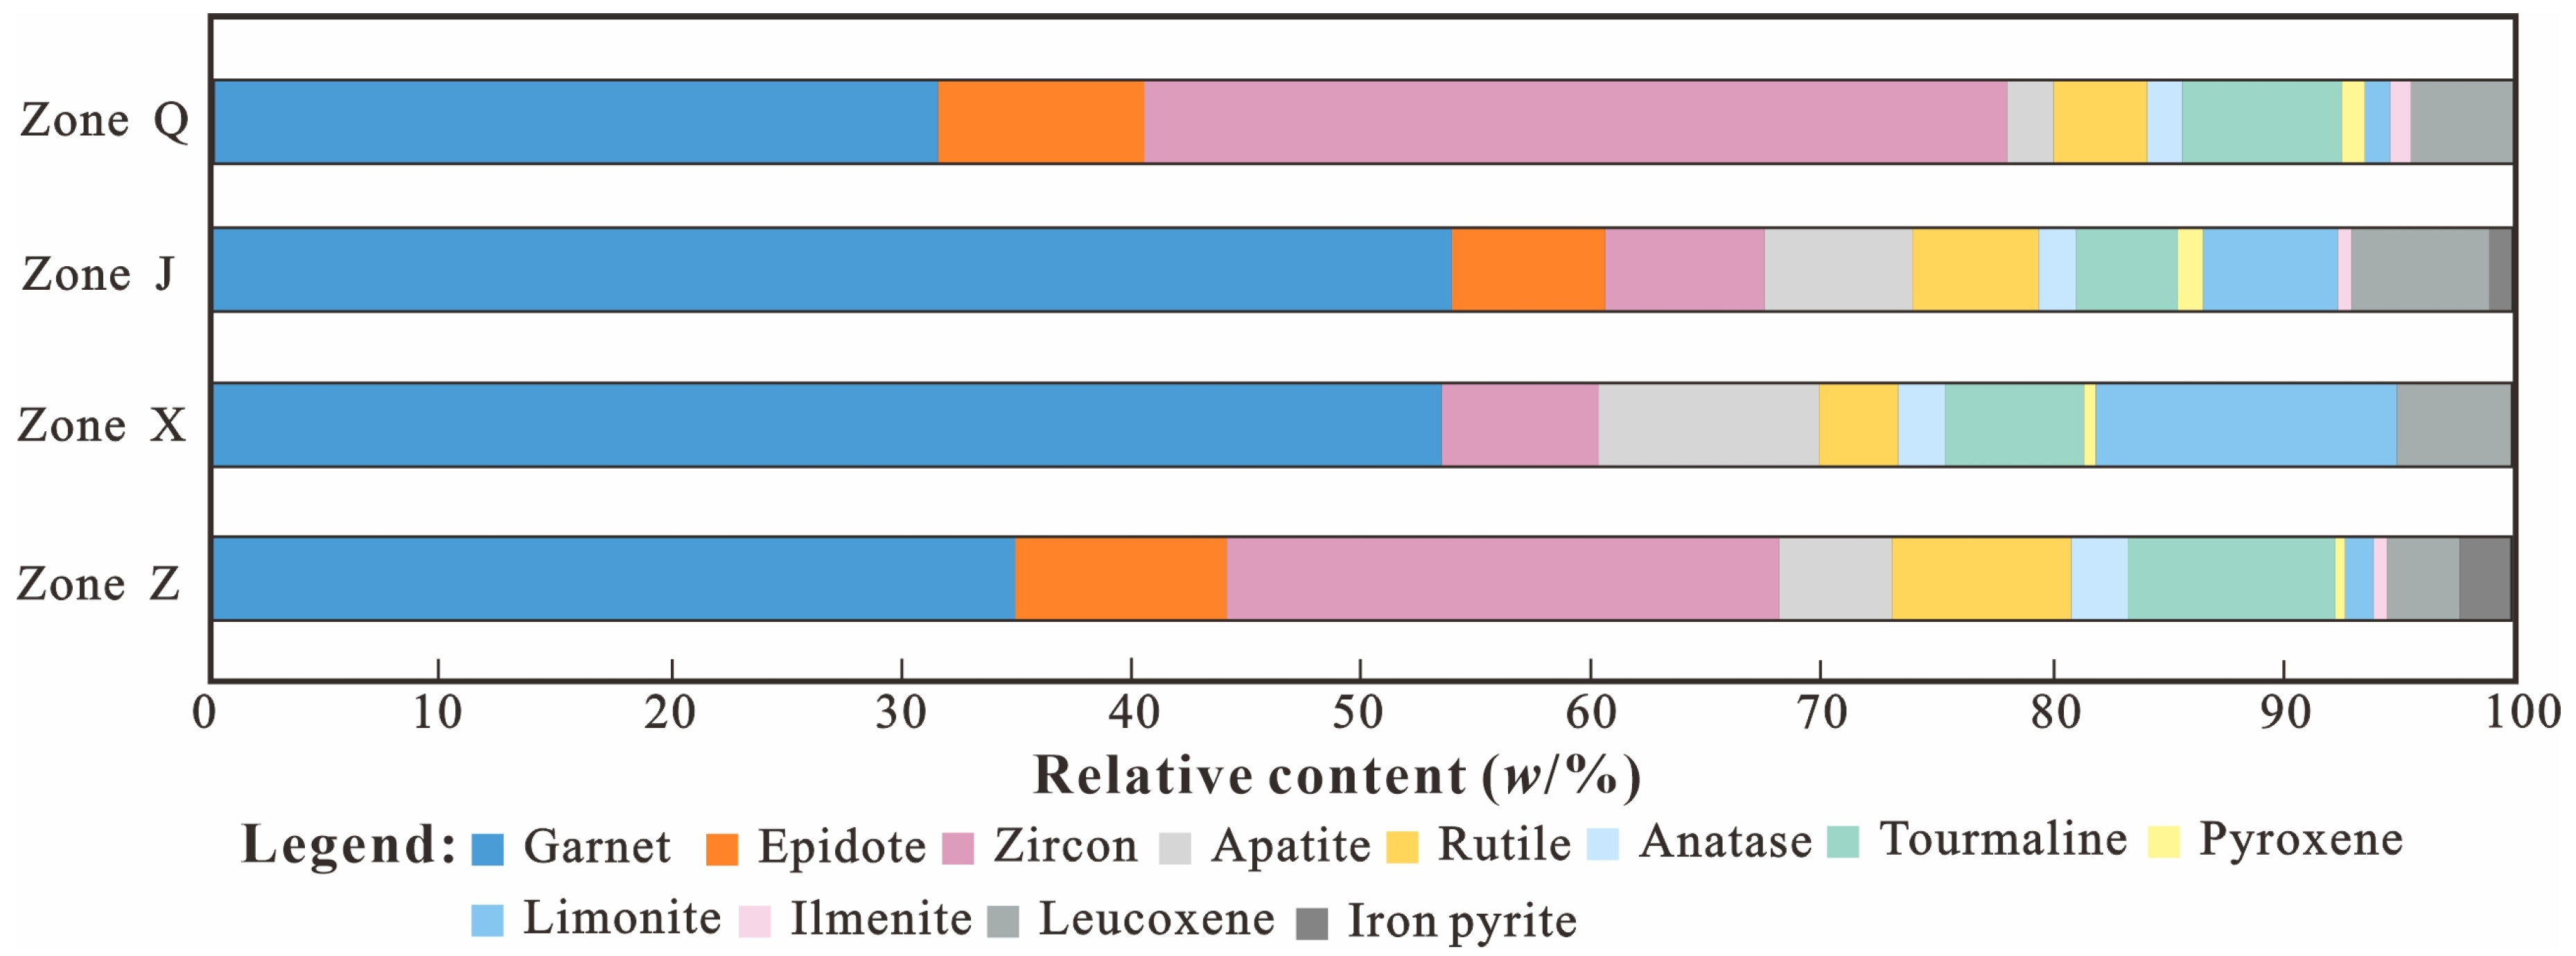
The heavy mineral composition of the tight sandstone samples in the Shaximiao Formation reservoir in the Q and X regions exhibits high garnet and high apatite features, indicating that the provenance rocks are mainly metamorphic rocks from the western Longmenshan tectonic belt, followed by acidic magmatic rocks. The higher content of limonite in area X indicates a higher degree of oxidation in its sedimentary environment, shallower water bodies, and closer proximity to the provenance area. The heavy mineral assemblage in region J is similar to that in regions Q and X, but its unstable mineral content of epidote is relatively high (Figure 4).
Table 3 and Table 4 show the composition and content of rare-earth elements and trace elements in the tight sandstone of the Shaximiao Formation in the Western Sichuan Depression. The distribution characteristics of rare-earth elements are relatively similar in different samples in the Z and J regions. The content of La, Ce, and Nd is relatively high. There are significant differences in the distribution characteristics of rare-earth elements between different samples in the X and Q regions, especially in the Ce element content, which differs by up to 70 × 10−6 in the X region (Table 3). The distribution characteristics of trace elements in samples from different regions are similar. The difference in Ba element content is the largest, with a difference rate between the maximum and minimum values of 0.84 (Table 4).

5. Discussion

5.1. Analysis of Lithic Fragments

5.1.1. Distribution of Lithic Fragments

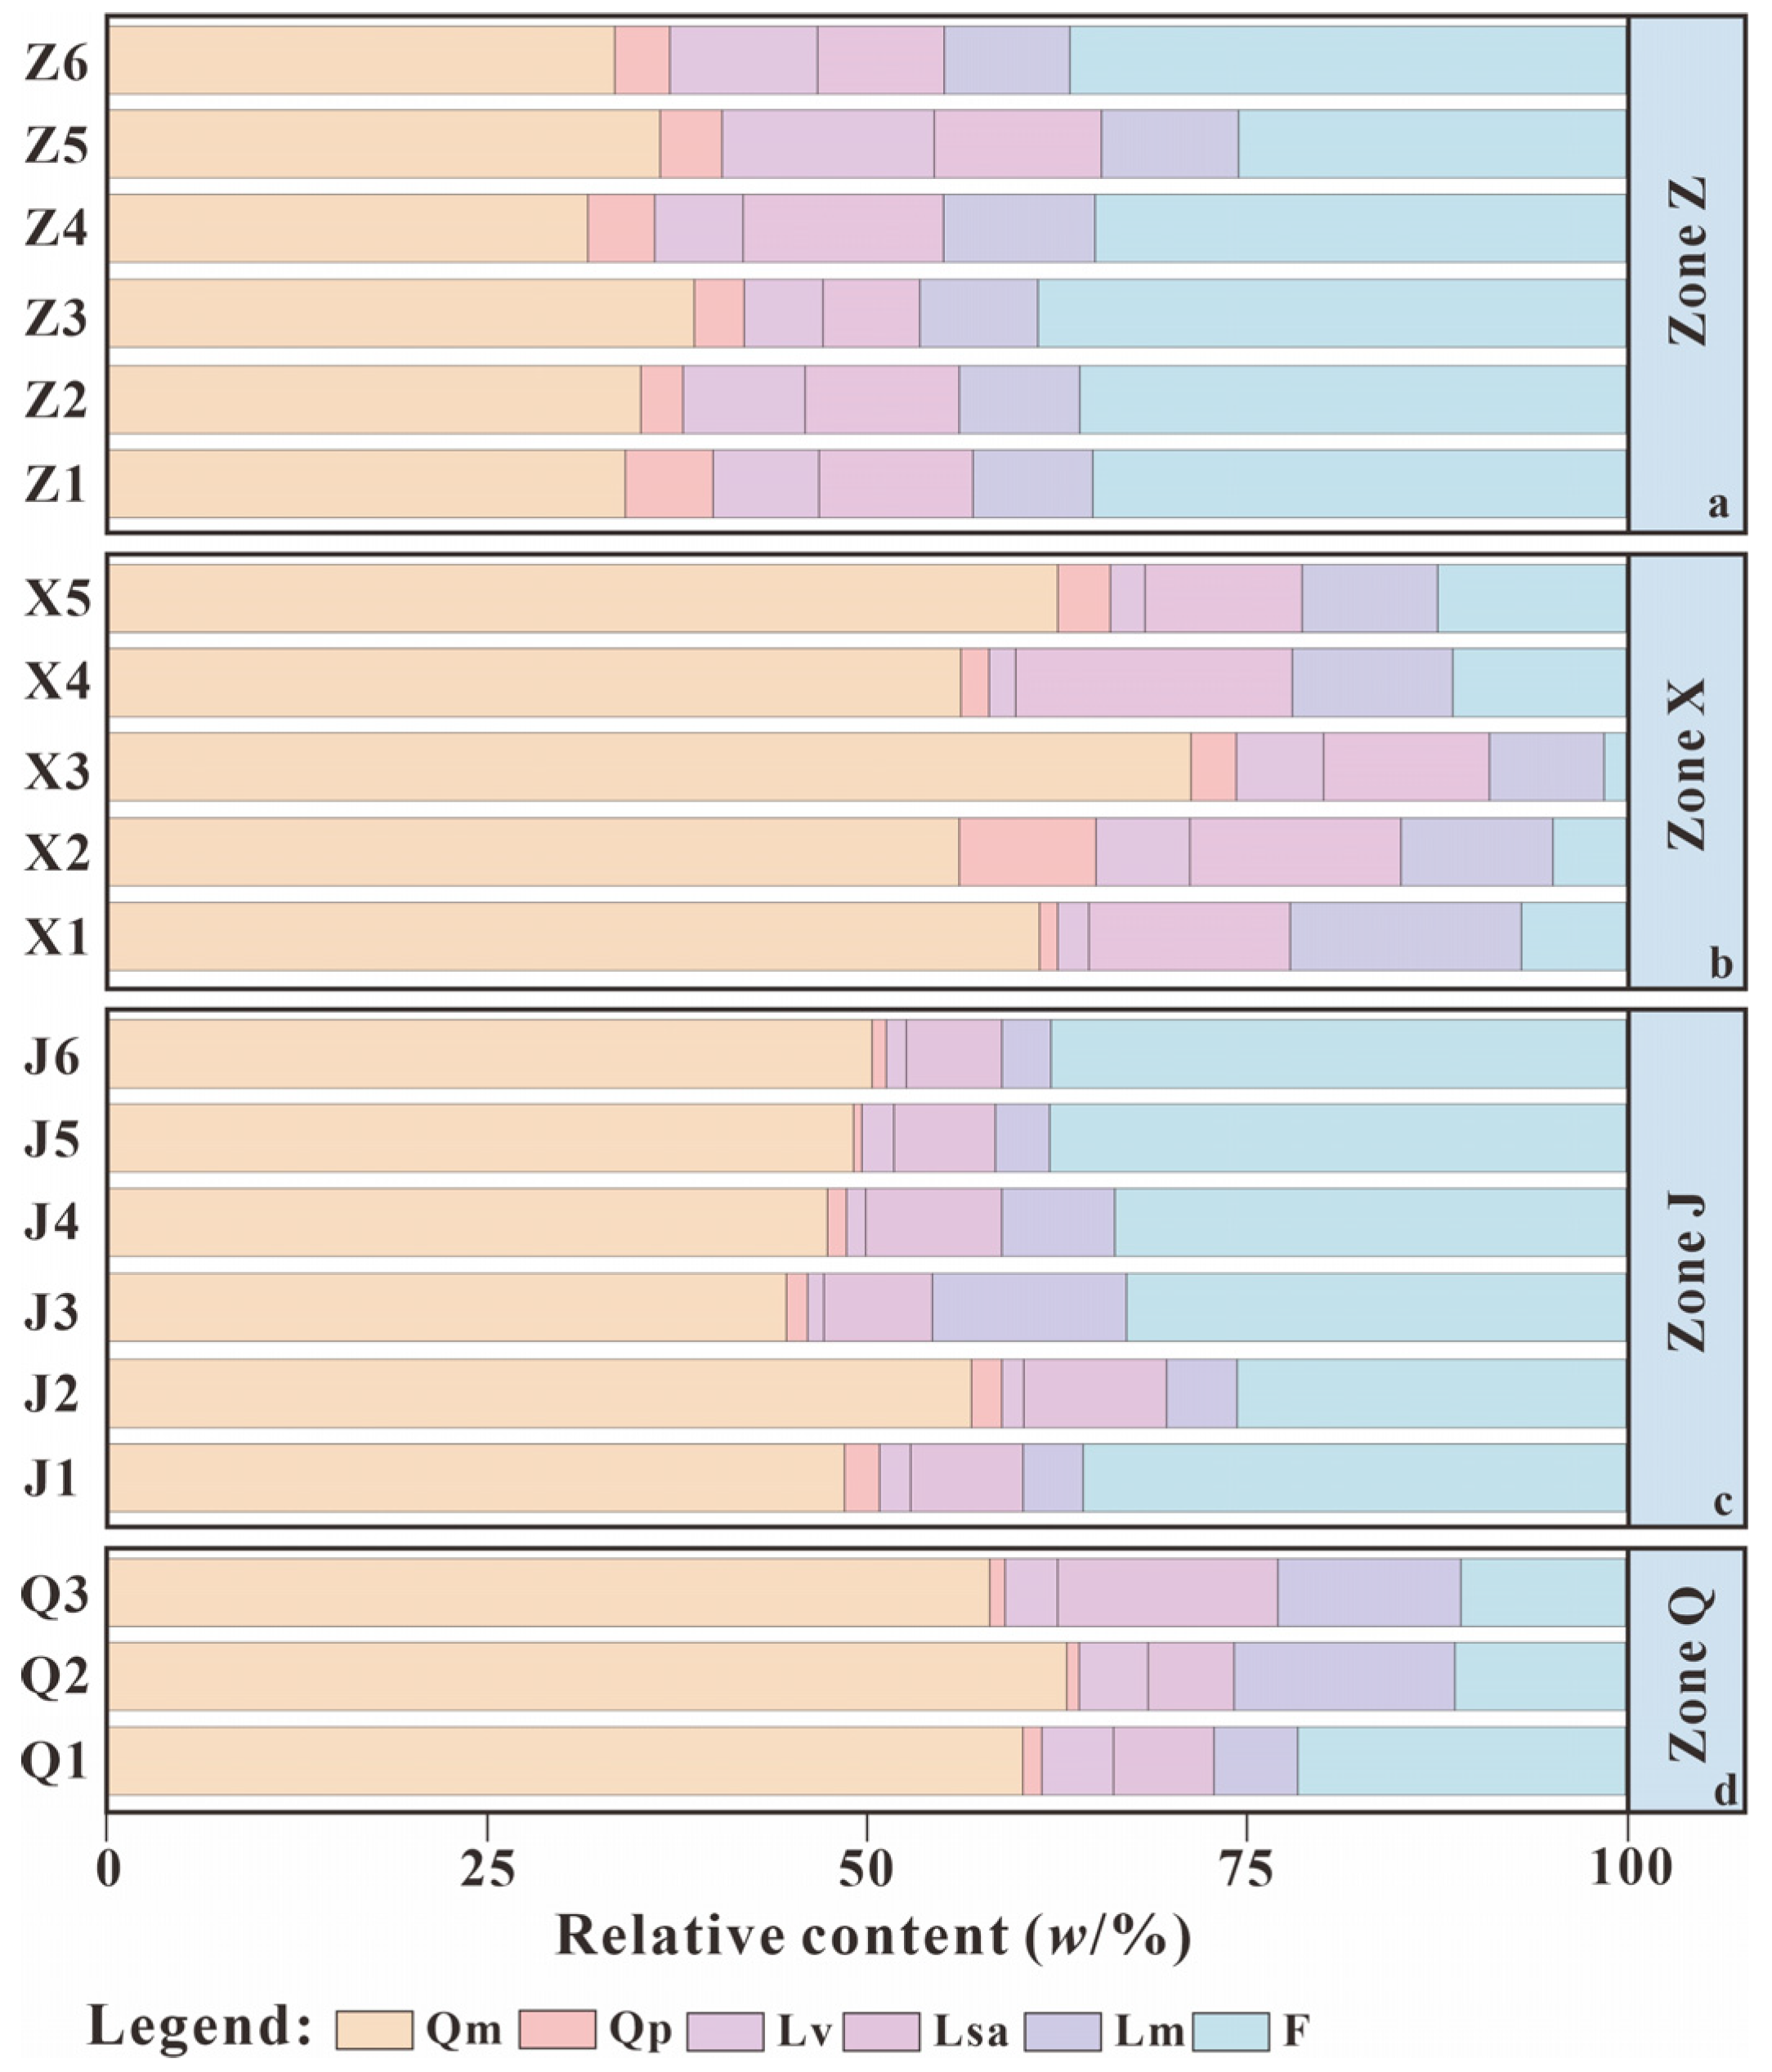
The distribution characteristics of lithic fragment content in Zone Z are significantly different from those in the other three zones, with a relatively low amount of monocrystalline quartz and similar characteristics to the three types of lithic fragment contents, indicating that its provenance may differ from that of Zones X and Q (Figure 5a). The X and Q areas exhibit high amounts of monocrystalline quartz and low amounts of monocrystalline feldspar, suggesting that they may share the same provenance (Figure 5b,d). The distribution of lithic fragment content is largely influenced by the provenance of the LMTB in the west. The amount of monocrystalline quartz in Zone J is slightly lower than that in Zones X and Q, while the amount of monocrystalline feldspar is comparable to that in Zone Z, suggesting that it may be influenced not only by the provenance of Zones X and Q but also by that of Zone Z (Figure 5c).

5.1.2. Radar Chart Analysis

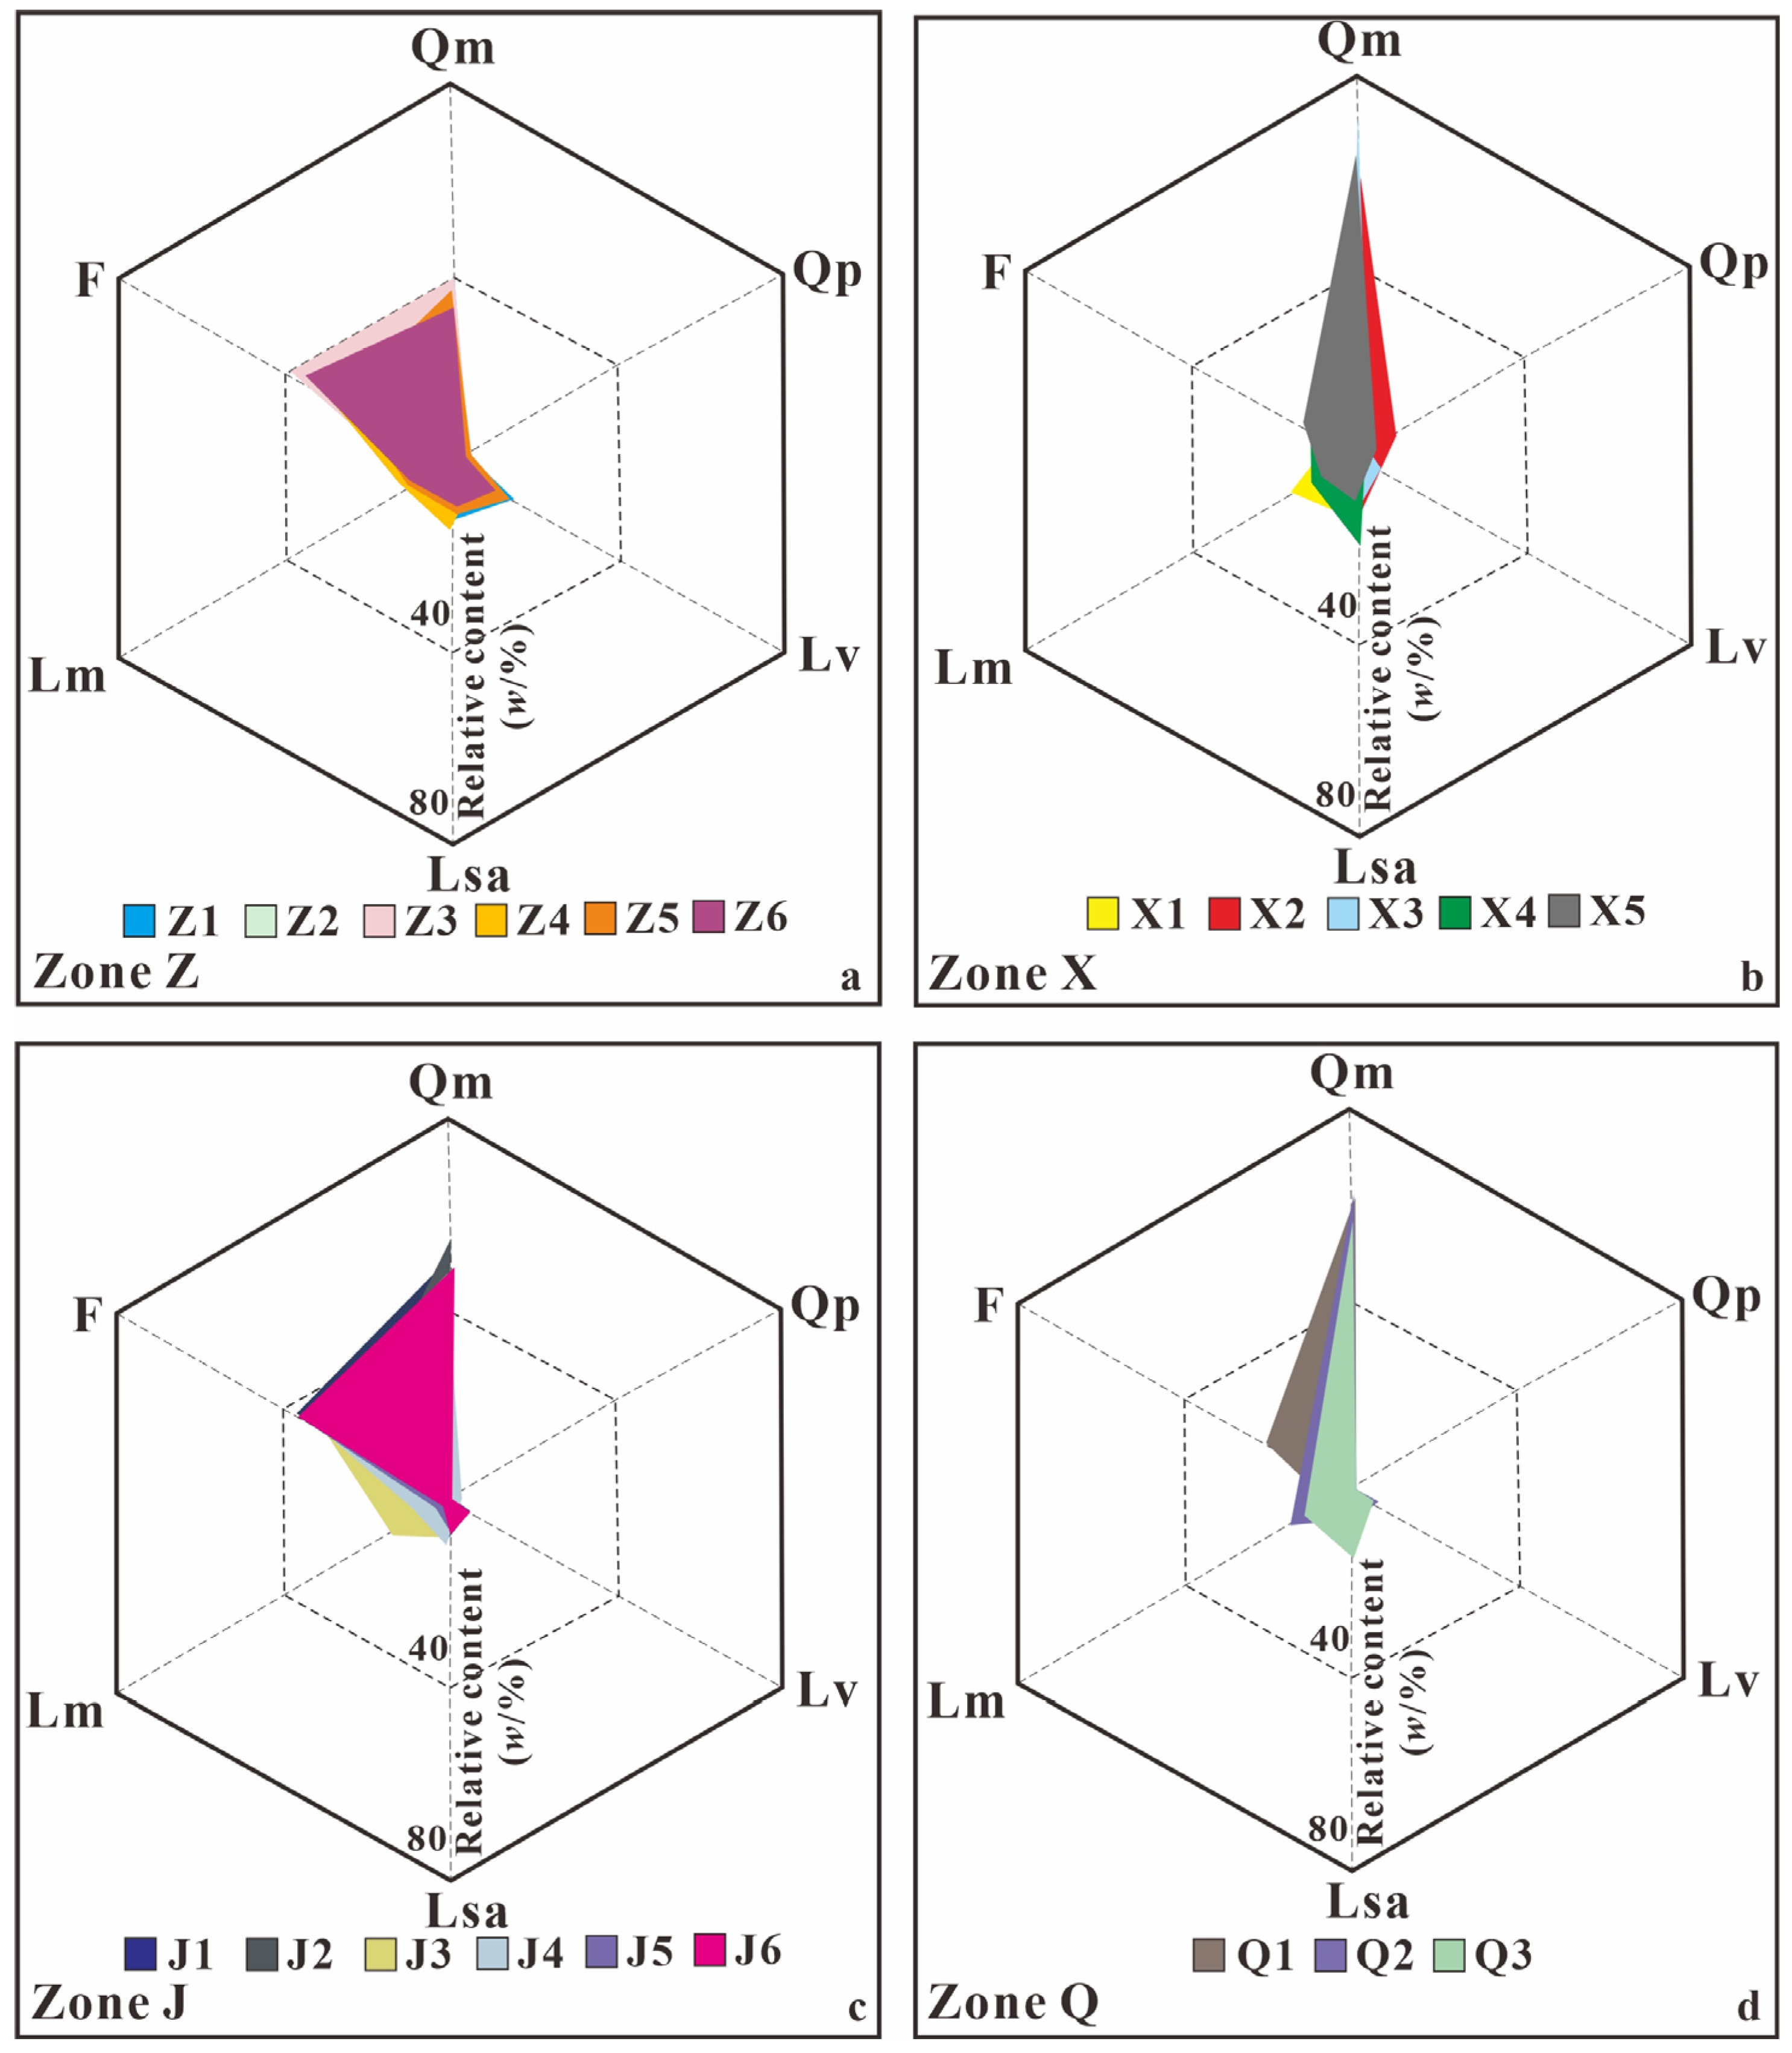
This study investigates the distribution patterns of tight sandstone clasts in the Shaximiao Formation of the Western Sichuan Depression through radar imagery analysis. Distinct radar signatures were observed across different regions. The Z area exhibits shovel-shaped radar patterns, whereas conical morphologies characterize the X and Q areas (Figure 6a,b,d). The J area demonstrates triangular radar configurations, sharing similarities with both the Z area’s shovel-shaped patterns and the conical features of the X and Q regions (Figure 6c).
Comparative analysis of these radar imagery variations reveals three key findings: (1) The Z area has distinct provenance origins compared to the X and Q areas. (2) No significant provenance differentiation exists between the X and Q areas. (3) The J area’s provenance materials show potential similarities to the Z area’s provenance system while maintaining partial affinities with the X and Q provenance regions.

5.1.3. Ternary Chart Analysis

Tectonic dynamics serve as the primary governing mechanism for sedimentary infill processes in basin systems. The application of QFL (quartz, feldspar, and lithic fragment) ternary analysis to investigate sandstone compositional maturity provides an effective methodology for deciphering the tectonic framework of provenance areas [35].
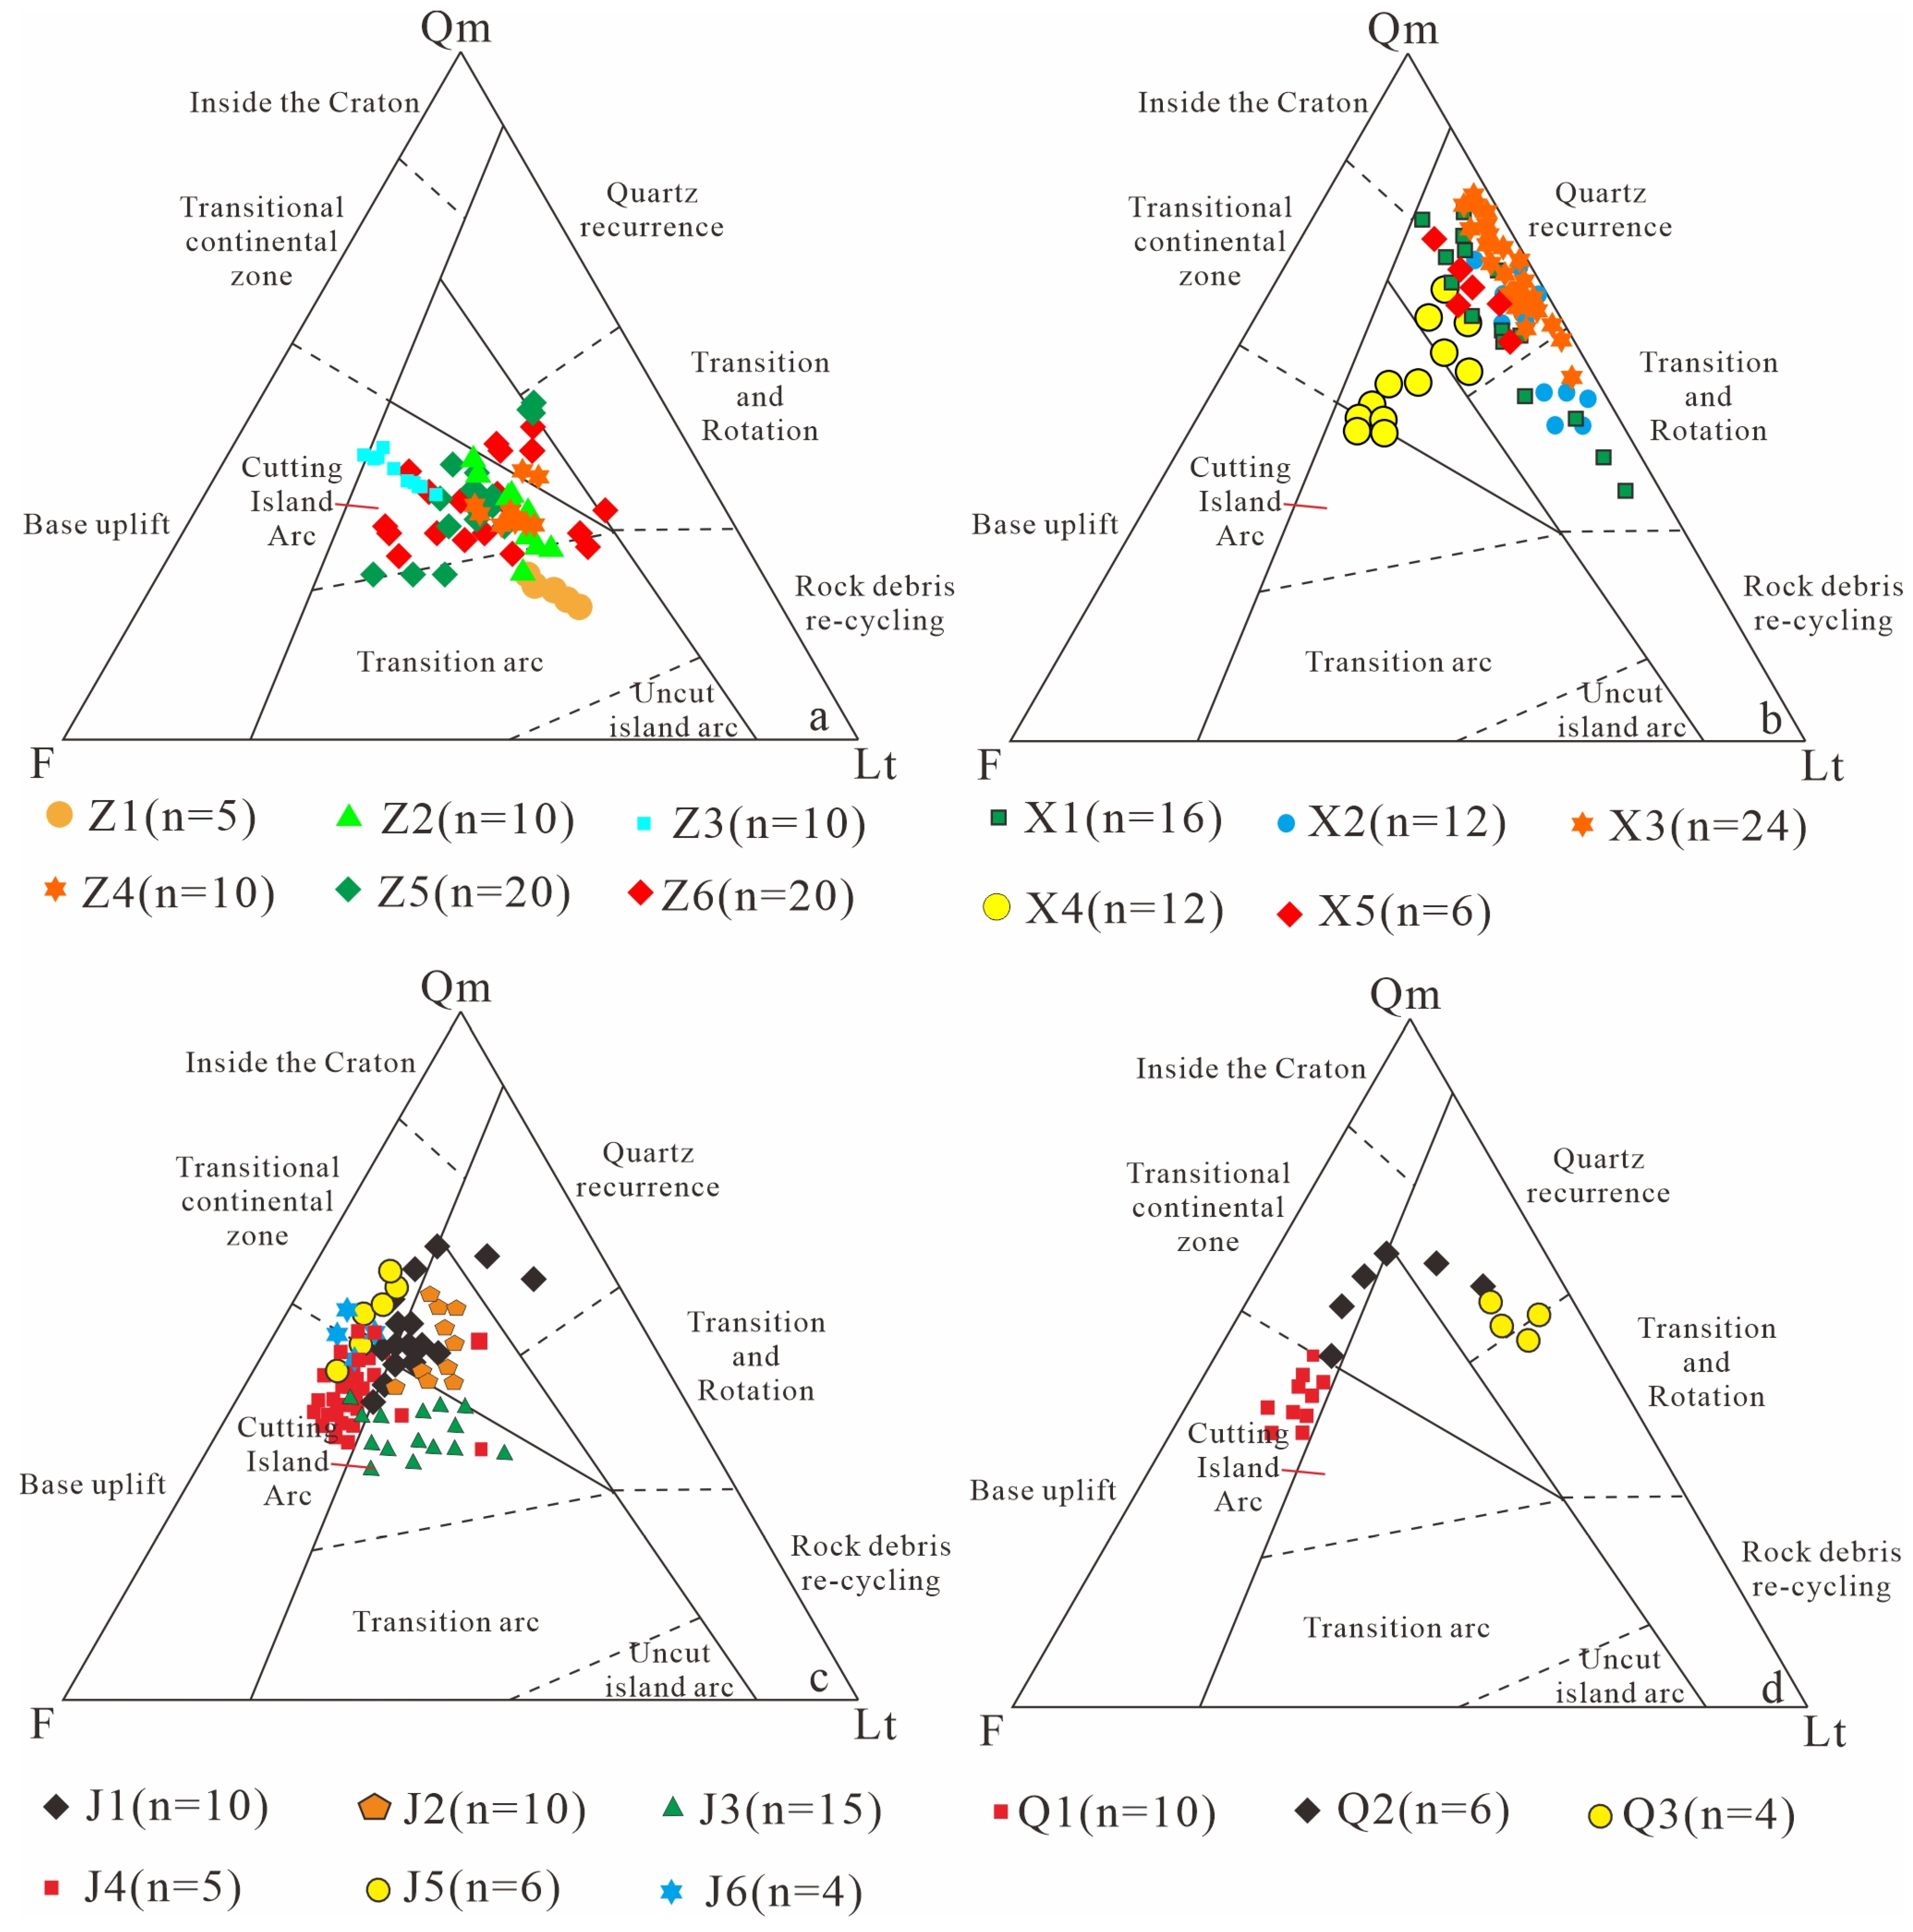
Figure 5 displays a ternary diagram illustrating the compositional characteristics and provenance types of tight sandstone clasts in the Western Sichuan Depression. The distribution of compositional data reveals distinct regional patterns: samples from the Z area predominantly cluster within the dissected island arc domain, whereas those from the X area are concentrated in the recycled orogenic belt sector (Figure 7a,b). J area specimens exhibit tripartite distribution across basement uplift, transitional continental, and dissected arc zones, suggesting multiple provenance influences on their lithic composition (Figure 7c). In the Q area, approximately 70% of samples influenced by the Sichuan–Yunnan Tectonic Belt occupy basement uplift and transitional continental zones, while the remaining 30% align with the recycled orogenic belt signature (Figure 7d).

5.2. Analysis of Heavy Minerals

The heavy mineral assemblage in the Z region has the characteristics of high garnet and high zircon, and its pyrite content is slightly higher than that of limonite, indicating that its sedimentary environment is a reducing environment with deeper water bodies (Figure 4). Given that the relative contents of the ultra-stable heavy minerals zircon, tourmaline, and rutile are higher than in the other three regions, it is believed that the main provenance of material in the Z region comes from the Micang–Dabashan Tectonic Belt in the northeast, which is further away.
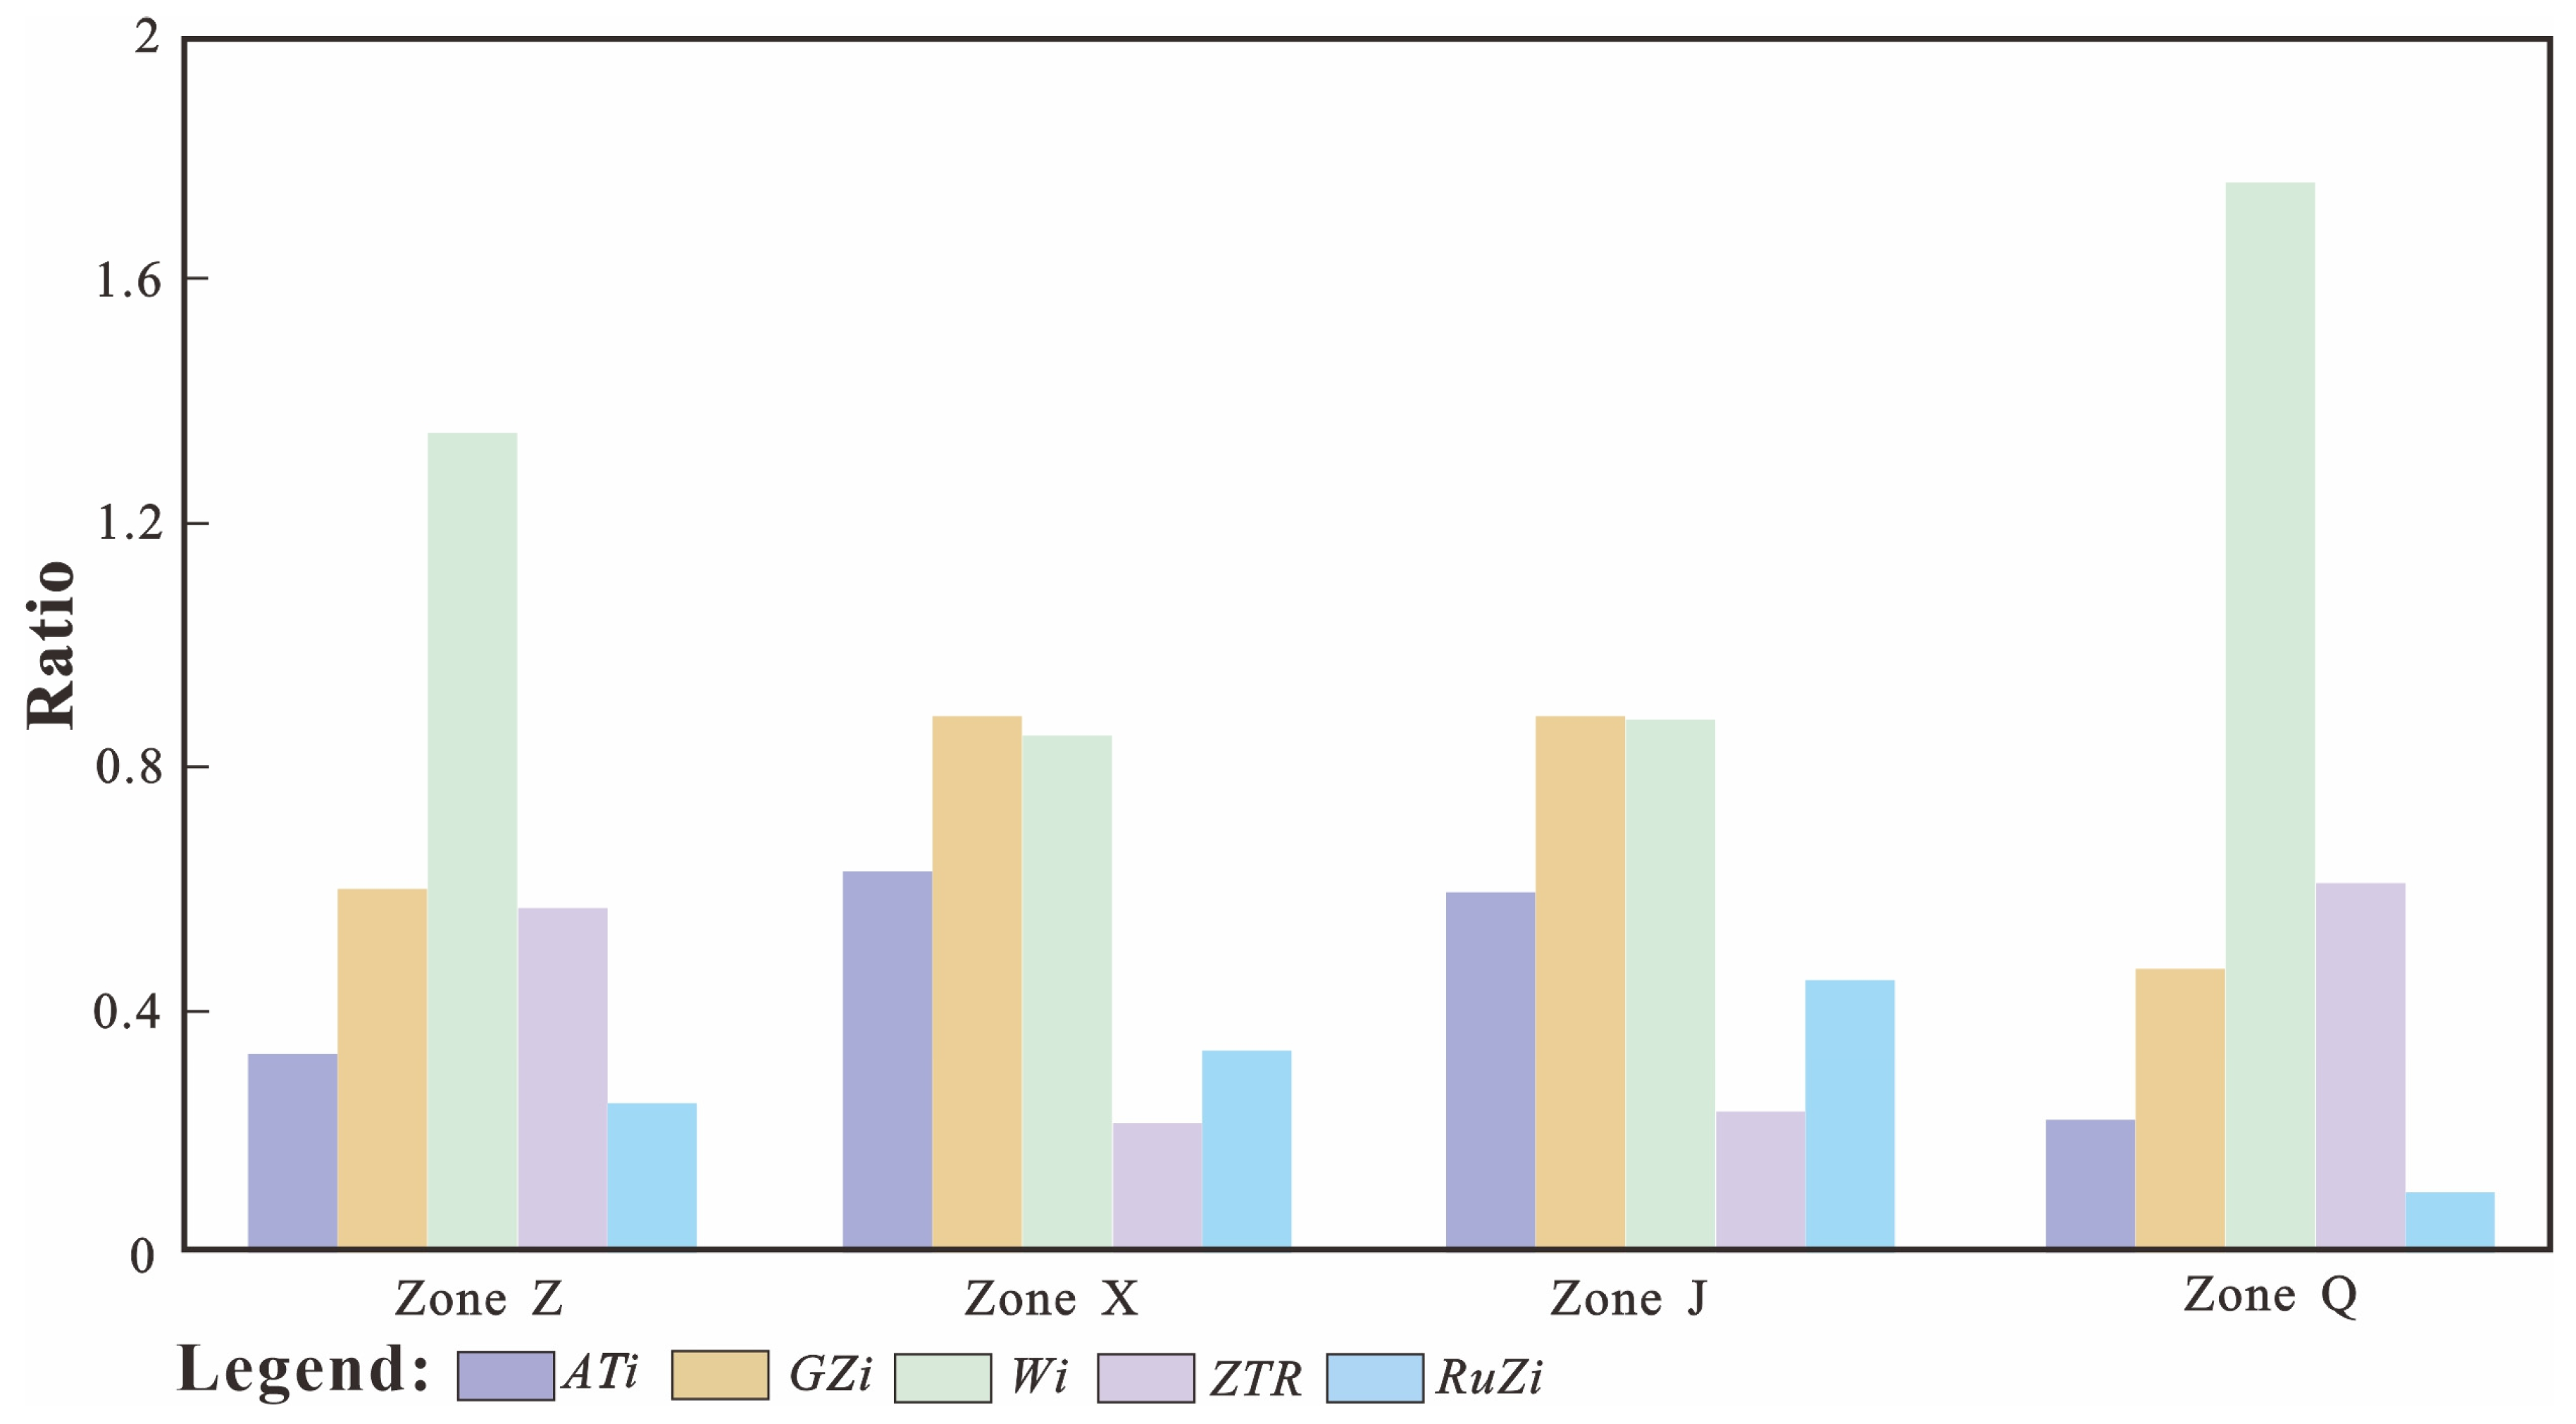
The distribution of heavy mineral characteristic indices of tight sandstone samples in the Shaximiao Formation reservoir in the X, J, and Q regions is similar, with relatively high ATi and RuZi values, indicating that the provenance rocks are mainly metamorphic and acidic magmatic rocks, and the degree of weathering is relatively high. A low ZTR value indicates that it is relatively close to the provenance region. The heavy mineral characteristic indices Wi and ZTR in the Z region are both high, indicating that it is far from the provenance area and confirming the conclusion drawn from the heavy mineral association characteristics, in that the provenance area of the Z region is the Micangshan–Dabashan Tectonic Belt (Figure 8). The accuracy of using heavy mineral analysis for provenance is relatively high in the Jurassic Shaximiao Formation of the Western Sichuan Depression.

5.3. Analysis of Geochemical Elements

5.3.1. Analysis of Rare-Earth Element Ratio

The standardized values of rare-earth element data and trace element data for rock samples are obtained by comparing the rare-earth element values and trace element values of Leed chondrite meteorites. The rare-earth element and trace element values of Leed chondrite meteorites can be obtained through the research of Pourmand et al., 2012 [36].
The rare-earth element data of standardized rock samples can be used for rare-earth element ratio analysis. Table 5 shows the rare-earth element ratios of rock samples from the Shaximiao Formation in the Western Sichuan Depression. In the table, the ∑REE value is the total number of rare-earth elements, and the ∑LREE/∑HREE value is the ratio of light rare-earth element content to heavy rare-earth element content. The δEu value is a parameter used to measure the degree of enrichment or depletion of the Eu element in a sample relative to other rare-earth elements. The δCe value is used to describe the degree of separation between the Ce element and other rare-earth elements in the sample.
The average ∑REE of rock samples from the Shaximiao Formation in Zone Z ranges from 145 to 220 × 10−6 (ppm), and the ∑LREE/∑HREE ratio ranges from 9.5 to 11. The ∑REE values in region X range from 135 to 285 × 10−6 (ppm), and the ∑LREE/∑HREE ratio is distributed between 8.5 and 11. The ∑REE values in region J range from 190 to 200 × 10−6 (ppm), and the ∑LREE/∑HREE ratio is distributed between 11.5 and 13. The ∑REE values in the Q region range from 165 to 230 × 10−6 (ppm), and the ∑LREE/∑HREE ratio ranges from 9 to 12. The ∑LREE/∑HREE ratios are all greater than 8, indicating the enrichment of light rare-earth elements in the tight sandstone samples of the Shaximiao Formation in the Western Sichuan Depression, with the J area being the most enriched in light rare-earth elements.
The average LaN/YbN values of rock samples from the Shaximiao Formation in the Z, X, J, and Q areas of the Western Sichuan Depression are 12.03, 10.9, 16.06, and 11.16, respectively, all greater than 10. The average values of LaN/SmN are 4.26, 4.15, 4.41, and 4.08, respectively, all greater than 4. The average values of GdN/YbN are 1.97, 1.79, 1.49, and 1.95, respectively, all of which are less than 2. The δEu and δCe values are both less than 1, indicating a significant negative anomaly. All four regions have the characteristics of large differentiation between light and heavy rare-earths, a high degree of light rare-earth fractionation, and a low degree of heavy rare-earth fractionation.
The average La/Th values of the tight sandstone samples in the Shaximiao Formation of Zone Z are relatively small, while the average Zr/Hf values are relatively large. The average values of La/Yb in region X are relatively small, while the average values of Zr/Th and Sc/Cr are relatively large. The average values of La/Sc in the Q region are relatively small, while the average values of Co/Th and Rb/Sr are relatively large. The average ratio of rare-earth elements to trace elements in region J is either the highest or the lowest. The distribution characteristics of trace elements Th and Hf in the Z region differ significantly from those in the X and Q regions. The distribution characteristics of rare-earth elements and trace elements in the J region are not only similar to those in the Z region but also to those in the X and Q regions.

5.3.2. Standardized Curve Analysis

It is too difficult to analyze the provenance characteristics of light and heavy rare-earth and trace elements solely through statistical analysis data from the four regions. Therefore, standardized curve graphs are used to further analyze the distribution characteristics of light and heavy rare-earth and trace elements in order to clarify their provenance characteristics.
All four regions have enrichment characteristics of light rare-earth elements, and the differentiation of heavy rare-earth elements in the four regions is more obvious. The distribution curves of rare-earth elements in the X and J regions have similar characteristics. In comparison, the heavy rare-earth element curves in the Z and J regions first decrease and then increase at the positions of Er, Tm, Yb, and Lu, with the overall end of the curves showing a boat shape. The J region also showed significant negative differentiation characteristics in the three heavy rare-earth elements Gd, Tb, and Dy (Figure 9).
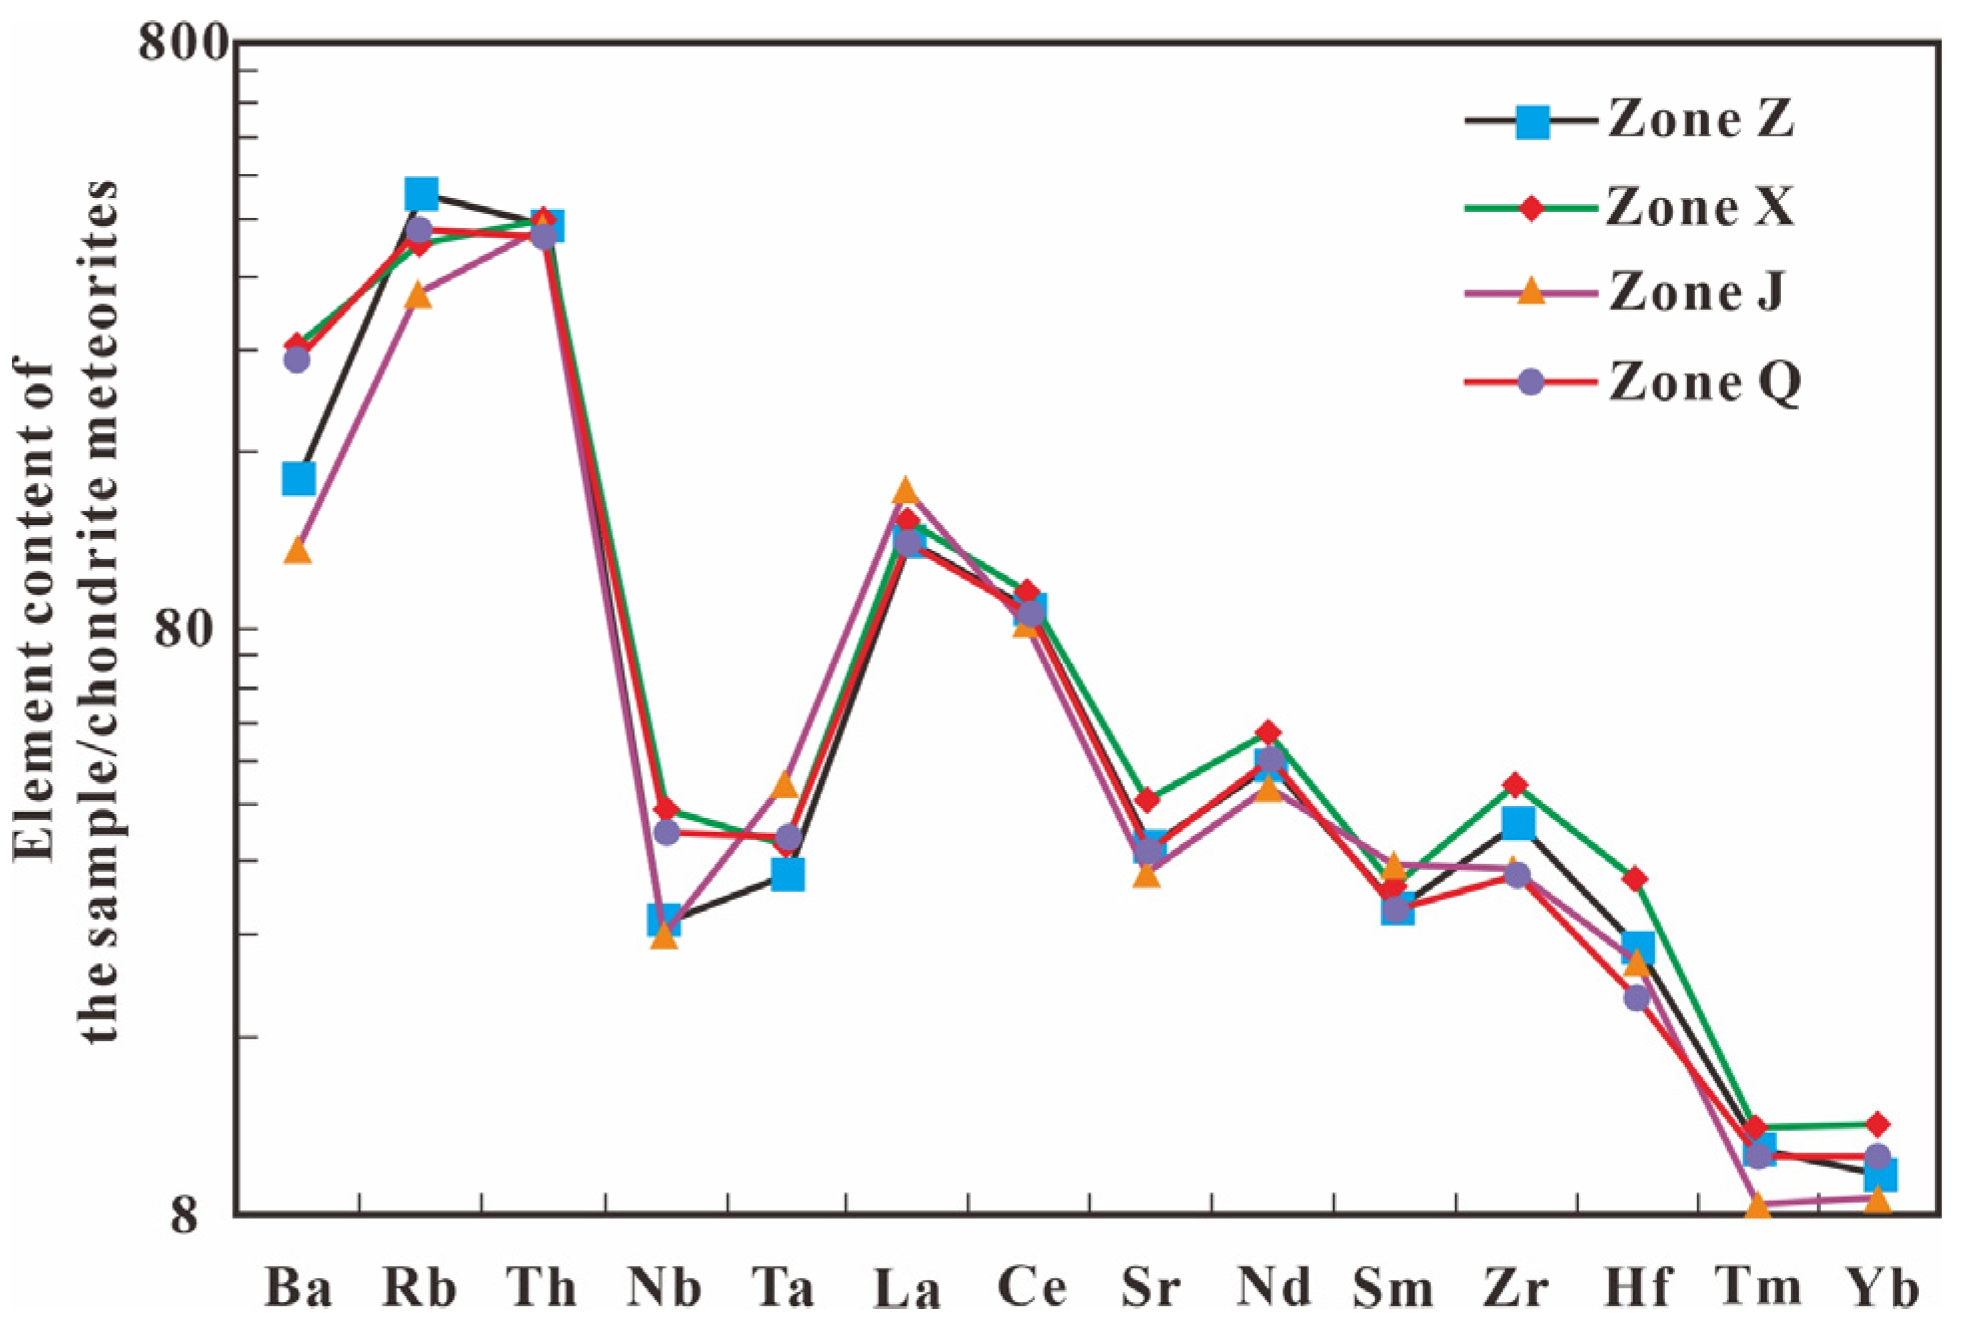
The standardized curve of the combination of trace elements and rare-earth elements shows the overall depletion of large ion lithophile elements Ba and Sr and enrichment of Rb and Th. High-field-strength elements Nb and Ta are deficient, with significant distribution differences, exhibiting plateau characteristics, while Zr and Hf are enriched. The light rare-earth elements La and Ce are enriched, while Nd and Sm are weakly enriched. The heavy rare-earth elements Tm and Yb are weakly enriched with significant distribution differences. The curves as a whole present the characteristics of “four peaks, three valleys, and one flat”. The “four peaks” refer to the enrichment distribution characteristics of large ion lithophile elements Rb and Th; light rare-earth elements La, Ce, and Nd; and high-field-strength element Zr. The “three valleys” refer to the distribution characteristics of the depletion of large ion lithophile elements Ba and Sr and the weak enrichment of light rare-earth element Sm. The “three valleys” are indicative of the depletion of large ion lithophile elements Ba and Sr, while light rare-earth element Sm fractionation remains subdued. The “one flat” refers to a lack of high-field-strength elements Nb and Ta. Similarly, the distribution curve characteristics of the X region and the J region are similar, while the distribution curves of the Z region and the J region exhibit high slope characteristics at the positions of the Ba, Rb, Th, Nb, Ta, and La elements. The curve of the slope of the J region is larger and more similar to a straight line (Figure 10).

5.3.3. Analysis of CIA

We analyzed the weathering degree of tight sandstone minerals in different areas of the Shaximiao Formation in the Western Sichuan Depression through a chemical change index triangle diagram. The projection of data points in Zone Z is mainly distributed within the shadow triangle formed by the weathering trend line, potassium metasomatism line, and feldspar content line, with a CIA mean of 61.23% (Figure 11a). The data points in the X and Q regions are mostly projected outside the shadow triangle, with CIA mean values of 54.25% and 52.74%, respectively, indicating weak weathering (Figure 11b,c). The projection distribution of data points in region J is relatively scattered, with a CIA mean value of 55.13% (Figure 11d).

5.4. Sedimentary Provenance

During the Shaximiao Formation depositional period, detrital inputs from the Longmen Mountain in the Western Sichuan Basin lacked island arc tectonic affinities, whereas the northeastern Daba Mountain experienced intense arc–continent collision, generating provenance materials with composite island arc and active continental margin signatures [28,29]. Integration of lithic fragment distribution histograms with radar imagery interpretations reveals distinct provenance systems. The Z area tight sandstone reservoirs derive primarily from the Micang–Dabashan Tectonic Belt (northeast). The X and Q areas show dominant sourcing from differential segments of the western LMTB. The J area exhibits dual provenance—principally from the northeastern Micang–Dabashan Tectonic Belt, with secondary contributions from the western LMTB.
The foreland basin of the Western Sichuan Depression was formed during the Middle Jurassic, while the MDTB was relatively active at this time. The Qinling orogenic belt continued to push and uplift during the Middle Jurassic. The sedimentary provenance with island arc properties in the MDTB was eroded and transported to the basin for sedimentation. During the long-distance transportation of the long-axis provenance of the MDTB, the content of unstable heavy minerals decreased. However, at this time, Longmen Mountain was affected by multiple tectonic activities, and the short-axis provenance provided the foreland basin of the Western Sichuan Depression with metamorphic and igneous rocks as the main detrital materials with complex tectonic backgrounds. The unstable heavy mineral content was relatively high during short-distance transport.
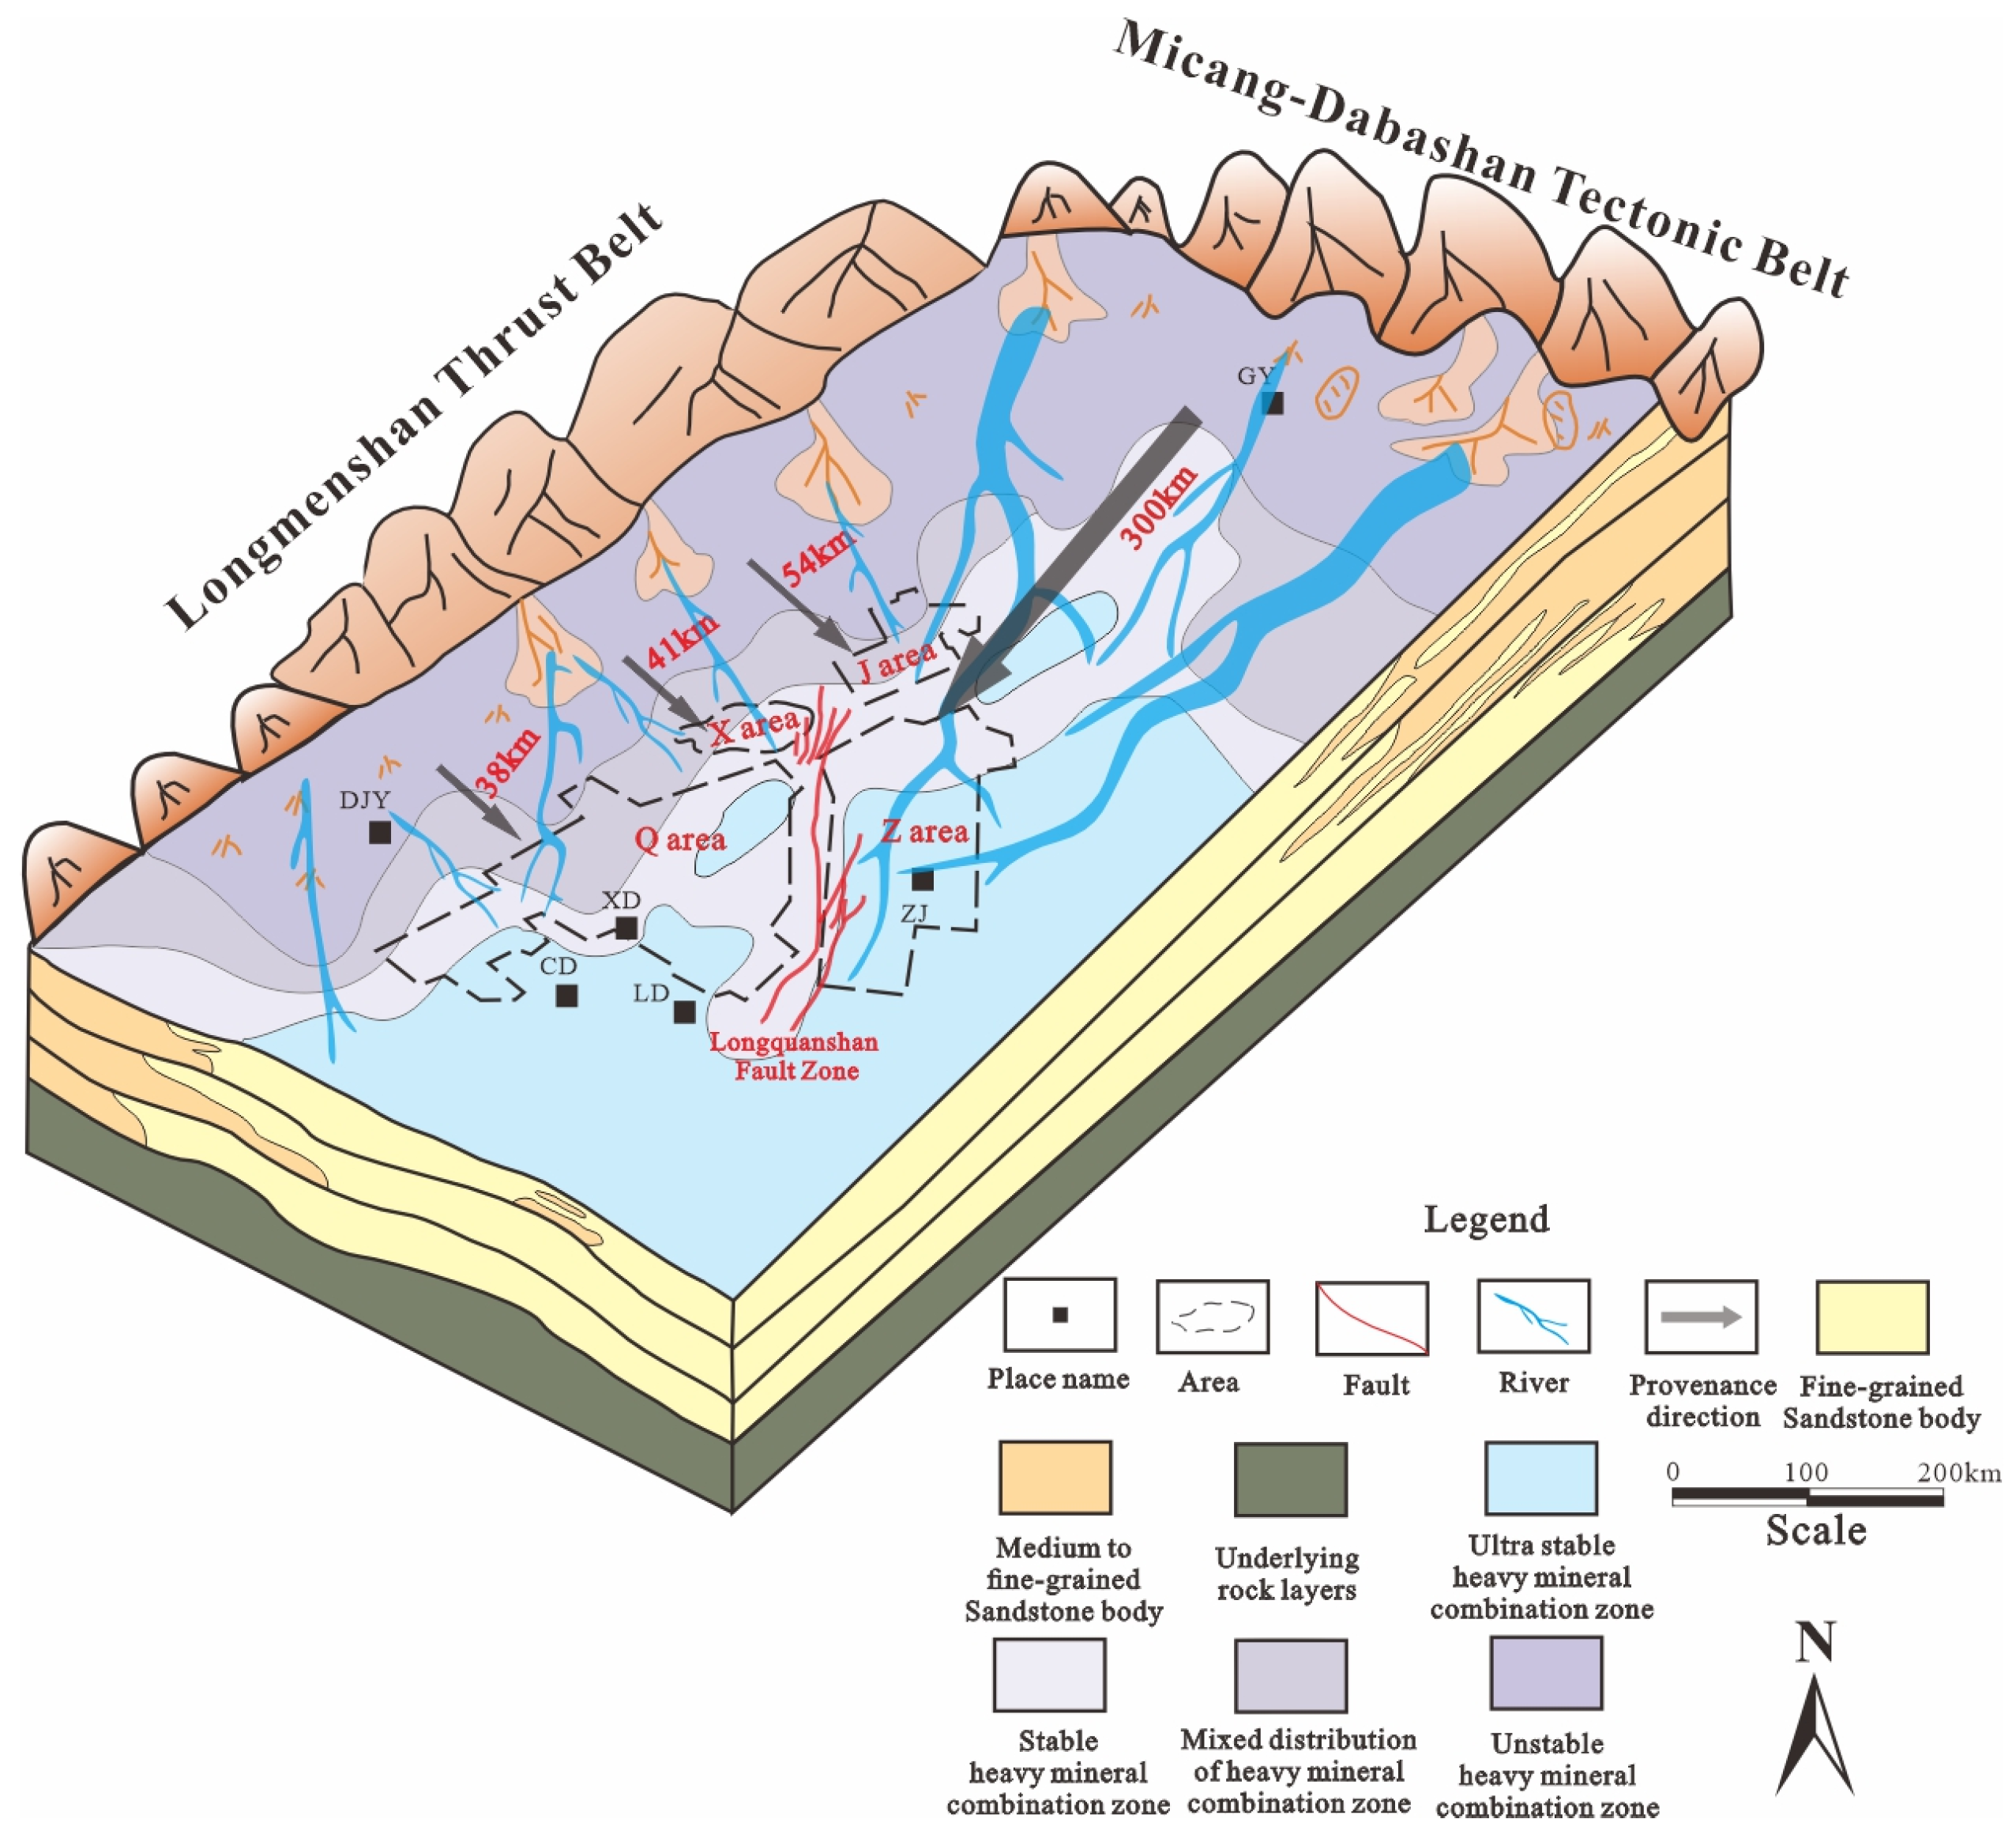
By analyzing the rock fragment characteristics, heavy mineral characteristics, and geochemical element characteristics of the tight sandstone in the Shaximiao Formation in different areas of the Western Sichuan Depression, it was found that the provenance characteristics of the X and Q areas are similar, mainly coming from Longmen Mountain, with a straight-line distance of about 40 km (the approximate distance during the sedimentation period) from the provenance area (Figure 12).
The provenance characteristics of region J are similar to those of regions X, Q, and J, indicating that it has dual provenance, mainly from Longmen Mountain in the west and MDTB in the northeast. The western region is 54 km (the approximate distance during the sedimentation period) away from the provenance area in a straight line, while the northeast region is relatively far away (less than 300 km) from the provenance area (Figure 12).
The monocrystalline quartz content of lithic fragment material in the Z area is relatively low, with a tectonic background of cutting island arcs. The mineral combination has the characteristics of high garnet and high zircon, with high heavy mineral characteristic indices, Wi and ZTR. The geochemical element characteristics have certain differences from the X, Q, and J regions, with a CIA greater than 60%. During the sedimentary period of the Shaximiao Formation, the Longquanshan Fault that developed in the Lower Jurassic had a blocking effect on the provenance from the front edge of Longmen Mountain in the west.
Therefore, its provenance comes from the Micang–Dabashan Tectonic Belt in the northeast, with a straight-line distance of about 300 km from the provenance area, which is relatively far away (Figure 12).
Therefore, the long-axis provenance of the MDTB (northeast) has the characteristics of high feldspar and low rock lithic fragments. The sorting of reservoirs in the long-axis source system is good, and the sorting index is less than 1. The short-axis provenance of the LMTB in the western region has the characteristics of high quartz and low feldspar. The short-axis provenance system reservoir is located near the Longmenshan tectonic belt, with high compaction and relatively poor sorting, and the sorting index is greater than 2. In general, rock combinations rich in feldspar and low in lithic fragments were more conducive to the preservation of primary pores and the development of secondary pores. The long-axis provenance reservoirs of the MDTB (northeast) may be of higher quality than the short-axis provenance reservoirs of the LMTB in the west.

6. Conclusions

(1)
The tight sandstone of the Shaximiao Formation in the Western Sichuan Depression is mainly composed of quartz, with comparable feldspar and lithic fragment contents. There are significant differences in the structural background characteristics and radar distribution characteristics of lithic fragment materials between the Z region and the X and Q regions, with the J region falling between these two characteristics. The stable and ultra-stable heavy minerals mainly include garnet, zircon, rutile, and tourmaline. The distribution characteristics of heavy minerals in the X, Q, and J regions are relatively similar but differ significantly from those in the Z region. The heavy mineral index characteristics of the Z region indicate that it was far away from the provenance area during the sedimentation period of the Shaximiao Formation.
(2)
The distribution characteristics of rare-earth elements vary greatly, while the distribution characteristics of trace elements are similar. The relative difference in Ba element content is 0.84. The geochemical element characteristics of the tight sandstone in the Shaximiao Formation of the X and Q regions are similar, and they may have the same provenance area. The geochemical element characteristics of the Z region are different from those of the X and Q regions, and the provenance area is far away. The geochemical element characteristics of the J region are similar to those of the Z region, and the provenance area is relatively close.
(3)
Our multi-method provenance characteristic analysis of tight sandstone in the Shaximiao Formation of the Western Sichuan Depression shows that the provenance characteristics of the X and Q regions are similar, mainly coming from Longmen Mountain. The J region has dual provenances, mainly from Longmen Mountain in the west and Micang–Dabashan in the northeast, with the northeast being relatively far from the provenance area. The material provenance in Zone Z comes from Micang–Dabashan in the northeast, with a straight-line distance of about 300 km from the material provenance area. The long-axis provenance reservoir of the MDTB (northeast) may be of higher quality.

Author Contributions

Conceptualization, X.L., D.C. and S.F.; Methodology, X.L., D.C., S.F. and Q.W.; Data curation, S.F.; Writing—original draft, X.L., S.F. and Q.W.; Writing—review & editing, X.L., D.C. and Q.W.; Supervision, D.C.; Funding acquisition, D.C. and Q.W. All authors have read and agreed to the published version of the manuscript.

Funding

This study was supported by the National Natural Science Foundation of China (No. 42302141).

Data Availability Statement

The original contributions presented in this study are included in the article. Further inquiries can be directed to the corresponding author.

Acknowledgments

We sincerely appreciate all anonymous reviewers and the handling editor for their comments and suggestions.

Conflicts of Interest

Author Shaoke Feng was employed by SINOPEC, Southwest Oil and Gas Branch. The remaining authors declare that the research was conducted in the absence of any commercial or financial relationships that could be construed as a potential conflict of interest.

Abbreviations

CIAChemical Index of Alteration
LMTBLongmenshan Thrust Belt
MDTBMicang–Dabashan Tectonic Belt
ZTRZircon–tourmaline–rutile
XRDX-ray diffraction
QmMonocrystalline quartz
QpPolycrystalline quartz
LvVolcanic lithic fragments
LsaSedimentary lithic fragments
LmMetamorphic lithic fragments
L (Lv + Lsa + Lm)Unstable lithic fragments
QFLQuartz, feldspar, and lithic fragments
Lt (Lv + Lsa + Lm+ Qp)Polycrystalline lithic fragments

References

  1. Zeng, M.; Zhang, X.; Cao, H.; Ettensohn, F.R.; Cheng, W.; Lang, X. Late Triassic initial subduction of the Bangong-Nujiang Ocean beneath Qiangtang revealed: Stratigraphic and geochronological evidence from Gaize, Tibet. Basin Res. 2016, 28, 147–157. [Google Scholar] [CrossRef]
  2. Ma, A.; Hu, X.; Garzanti, E.; Han, Z.; Lai, W. Sedimentary and tectonic evolution of the southern Qiangtang basin: Implications for the Lhasa-Qiangtang collision timing. J. Geophys. Res. Solid Earth 2017, 122, 4790–4813. [Google Scholar] [CrossRef]
  3. Hu, X.; Zhang, Y.; Li, C.; Li, G.; Liu, J.; Li, Y.; Su, J.; Jia, M. Provenance of Wushan Loess in the Yangtze Three Gorges Region: Insights from Detrital Zircon U-Pb Geochronology and Late Pleistocene East Asian Monsoon Variations. Minerals 2025, 15, 1180. [Google Scholar] [CrossRef]
  4. Tang, M.; Ji, W.-Q.; Chu, X.; Wu, A.; Chen, C. Reconstructing crustal thickness evolution from europium anomalies in detrital zircons. Geology 2020, 49, 76–80. [Google Scholar] [CrossRef]
  5. Liu, Z.; Chen, P.; Chen, H.; Yu, B.; Mi, R.; Qiu, L.; Fu, Y.; Zeng, Q. Sedimentary Processes of the Dazhuyuan Formation in Northern Guizhou (Southwest China): Evidence from Detrital Zircon Geochronology and Whole Rock Geochemistry. Minerals 2025, 15, 1167. [Google Scholar] [CrossRef]
  6. Wang, Z.; Zhan, W.; Wang, J.; Peng, Q.; Wei, W.; Wang, D.; Ma, Q.; Song, C.; Feng, X. Geochemistry and zircon geochronology of the Late Triassic volcanic–sedimentary successions in northern Tibet: Implications for the provenance and tectonic evolution of the Mesozoic Qiangtang Basin. Gondwana Res. 2023, 117, 321–343. [Google Scholar] [CrossRef]
  7. Qu, X.; Wang, Q.; Wang, D.; Lei, T.; Chen, H.; Wang, J.; Jiang, W.; Zhang, W.; Luo, L.; Liu, J.; et al. Provenance of Volcanogenic Deposits from the Shanxi Formation of the Daniudi Gas Field, Ordos Basin, and Its Tectonic Implications. Minerals 2023, 13, 1546. [Google Scholar] [CrossRef]
  8. Gao, S.; Xu, Z.; Xie, C.; Ma, Z.; Deng, P.; Liu, H. Late Triassic sedimentary environments and detrital zircon provenance analysis in the Amdo area of the Tibetan Plateau: Implications for the evolution of the Meso-Tethys Ocean. Palaeogeogr. Palaeoclim. Palaeoecol. 2025, 657, 112601. [Google Scholar] [CrossRef]
  9. Bhatia, M.R.; Crook, K.A.W. Trace element characteristics of graywackes and tectonic setting discrimination of sedimentary basins. Contrib. Miner. Pet. 1986, 92, 181–193. [Google Scholar] [CrossRef]
  10. Hu, L.S.; Du, Y.S.; Cawood, P.A.; Xu, Y.J.; Yu, W.C.; Zhu, Y.H.; Yang, J.H. Drivers for late Paleozoic to early Mesozoic orogenesis in South China: Constraints from the sedimentary record. Tectonophysics 2014, 618, 107–120. [Google Scholar] [CrossRef]
  11. Fan, J.-J.; Li, C.; Wang, M.; Xie, C.-M.; Xu, W. Features, provenance, and tectonic significance of Carboniferous–Permian glacial marine diamictites in the Southern Qiangtang–Baoshan block, Tibetan Plateau. Gondwana Res. 2015, 28, 1530–1542. [Google Scholar] [CrossRef]
  12. Abudeif, A.M.; Aal, G.Z.A.; Abdelbaky, N.F.; Ali, M.H.; Mohammed, M.A. An Integrated Geophysics and Isotope Geochemistry to Unveil the Groundwater Paleochannel in Abydos Historical Site, Egypt. Minerals 2023, 13, 64. [Google Scholar] [CrossRef]
  13. Berzina, A.N.; Berzina, A.P.; Gimon, V.O. Paleozoic–Mesozoic Porphyry Cu(Mo) and Mo(Cu) Deposits within the Southern Margin of the Siberian Craton: Geochemistry, Geochronology, and Petrogenesis (a Review). Minerals 2016, 6, 125. [Google Scholar] [CrossRef]
  14. Liu, S.; Liu, Y. Sedimentary Characteristics Analysis and Sedimentary Facies Prediction of Jurassic Strata in the Northwest Margin of Junggar Basin—Covering the W105 Well Region in the Wuerhe Area. Minerals 2022, 12, 68. [Google Scholar] [CrossRef]
  15. Hu, P.-Y.; Zhai, Q.-G.; Cawood, P.A.; Weinberg, R.F.; Zhao, G.-C.; Zhou, R.-J.; Tang, Y.; Liu, Y.-M. Detrital zircon REE and tectonic settings. Lithos 2024, 480–481, 107661. [Google Scholar] [CrossRef]
  16. Stalder, R.; Jaeger, D.; Andò, S.; Garzanti, E.; Chiessi, C.; Sawakuchi, A.; Ludwig, T.; Strasser, M. Trace element and OH content of quartz grains in the Amazon river: Potential application in provenance analysis. Sediment. Geol. 2025, 480, 106853. [Google Scholar] [CrossRef]
  17. Yao, X.; Feng, C.; Zhou, W.; Wu, P.; Qu, H.; Lei, J.; Chen, Z.; Ge, Y.; Sun, M. The sedimentary provenance of Upper Miocene Dongfang submarine fan, Yinggehai Basin: Source-to-sink system unravelled through new detrital zircon U-Pb ages and heavy mineral analysis. Mar. Pet. Geol. 2025, 182, 107557. [Google Scholar] [CrossRef]
  18. Ocheli, A.; Ogbe, O.B.; Omoko, E.N.; Aigbadon, G.O. Stratigraphic correlation and provenance study of exposed Eocene—Oligocene sedimentary sequences in southern Nigeria using high-resolution heavy minerals and garnet geochemical analyses. Solid Earth Sci. 2024, 9, 100189. [Google Scholar] [CrossRef]
  19. Jagodziński, R.; Sternal, B.; Stattegger, K.; Szczuciński, W. Sediment distribution and provenance on the continental shelf off the Mekong River, SE Vietnam: Insights from heavy mineral analysis. J. Asian Earth Sci. 2020, 196, 104357. [Google Scholar] [CrossRef]
  20. O’Sullivan, G.; Chew, D.; Kenny, G.; Henrichs, I.; Mulligan, D. The trace element composition of apatite and its application to detrital provenance studies. Earth-Science Rev. 2020, 201, 103044. [Google Scholar] [CrossRef]
  21. Etimita, O.M.; Beka, F.T. Heavy mineral analysis of Eocene sands and sandstones of Nanka Formation, Cenozoic Niger Delta petroleum province. Geol. Ecol. Landsc. 2020, 4, 251–256. [Google Scholar] [CrossRef]
  22. Bauer, S.; Yang, J.; Stuckman, M.; Verba, C. Rare Earth Element (REE) and Critical Mineral Fractions of Central Appalachian Coal-Related Strata Determined by 7-Step Sequential Extraction. Minerals 2022, 12, 1350. [Google Scholar] [CrossRef]
  23. Chen, G.; Robertson, A.H. User’s guide to the interpretation of sandstones using whole-rock chemical data, exemplified by sandstones from Triassic to Miocene passive and active margin settings from the Southern Neotethys in Cyprus. Sediment. Geol. 2020, 400, 105616. [Google Scholar] [CrossRef]
  24. Bao, Y.; Sun, M.; Wang, Y.; Lu, J.; Wu, Y.; Chen, H.; Li, S.; Qin, Y.; Wang, Z.; Wen, J.; et al. Impact of cascade reservoir on the sources of organic matter in sediments of Lancang river. iScience 2025, 28, 111681. [Google Scholar] [CrossRef]
  25. Bello, A.M.; Usman, M.B.; Amao, A.O.; Salisu, A.M.; Al-Ramadan, K.; Abubakar, U.; Mukkafa, S.; Kwami, I.A.; Chiroma, L.U.; Al-Hashem, M.; et al. Linking provenance and diagenesis to reservoir quality evolution of sandstones: The Paleocene-Eocene Kerri-Kerri Formation, northeastern Nigeria. Mar. Pet. Geol. 2025, 172, 107227. [Google Scholar] [CrossRef]
  26. Chen, X.; Ji, Y.; Yang, K. Impacts of sedimentary characteristics and diagenesis on reservoir quality of the 4th member of the Upper Triassic Xujiahe formation in the western Sichuan basin, southwest China. Mar. Pet. Geol. 2024, 167, 106981. [Google Scholar] [CrossRef]
  27. Feng, S.; Xie, R.; Radwan, A.E.; Wang, Y.; Zhou, W.; Cai, W. Accurate determination of water saturation in tight sandstone gas reservoirs based on optimized Gaussian process regression. Mar. Pet. Geol. 2023, 150, 106149. [Google Scholar] [CrossRef]
  28. Yue, D.; Wu, S.; Xu, Z.; Xiong, L.; Chen, D.; Ji, Y.; Zhou, Y. Reservoir quality, natural fractures, and gas productivity of upper Triassic Xujiahe tight gas sandstones in western Sichuan Basin, China. Mar. Pet. Geol. 2018, 89, 370–386. [Google Scholar] [CrossRef]
  29. Liu, S.; Yang, Y.; Deng, B.; Zhong, Y.; Wen, L.; Sun, W.; Li, Z.; Jansa, L.; Li, J.; Song, J.; et al. Tectonic evolution of the Sichuan Basin, Southwest China. Earth-Sci. Rev. 2021, 213, 103470. [Google Scholar] [CrossRef]
  30. Feng, S.; Xiong, L.; Radwan, A.E.; Xie, R.; Yin, S.; Zhou, W. Accurate identification of low-resistivity gas layer in tight sandstone gas reservoirs based on optimizable neural networks. Geoenergy Sci. Eng. 2024, 241, 213094. [Google Scholar] [CrossRef]
  31. Feng, S.; Xie, R.; Zhou, W.; Yin, S.; Chen, J.; Zhang, M.; Luo, Z. The new interpretation of the geological origin about differentiation phenomenon of resistivity in the tight sandstone reservoir. Arab. J. Geosci. 2021, 14, 2074–2089. [Google Scholar] [CrossRef]
  32. Feng, S.; Xie, R.; Zhou, W.; Yin, S.; Deng, M.; Chen, J.; Zhang, Z.; Xiang, M.; Luo, Z. A new method for logging identification of fluid properties in tight sandstone gas reservoirs based on gray correlation weight analysis—A case study of the Middle Jurassic Shaximiao Formation on the eastern slope of the Western Sichuan Depression, China. Interpretation 2021, 9, T1167–T1181. [Google Scholar] [CrossRef]
  33. Nesbitt, H.W.; Young, G.M. Early Proterozoic climates and plate motions inferred from major element chemistry of lutites. Nature 1982, 299, 715–717. [Google Scholar] [CrossRef]
  34. Bhatia, M.R. Plate tectonics and geochemical composition of sandstones. J. Geol. 1983, 91, 611–627. [Google Scholar] [CrossRef]
  35. Dickinson, W.R. Interpreting Provenance Relations from Detrital Modes of Sandstones. In Provenance of Arenites; Zuffa, G.C., Ed.; D. Reidel Publishing Company: Dordrecht, The Netherlands, 1985; Volume 148, pp. 333–362. [Google Scholar] [CrossRef]
  36. Pourmand, A.; Dauphas, N.; Ireland, T.J. A novel extraction chromatography and MC-ICP-MS technique for rapid analysis of REE, Sc and Y: Revising CI-chondrite and Post-Archean Australian Shale (PAAS) abundances. Chem. Geol. 2012, 291, 38–54. [Google Scholar] [CrossRef]
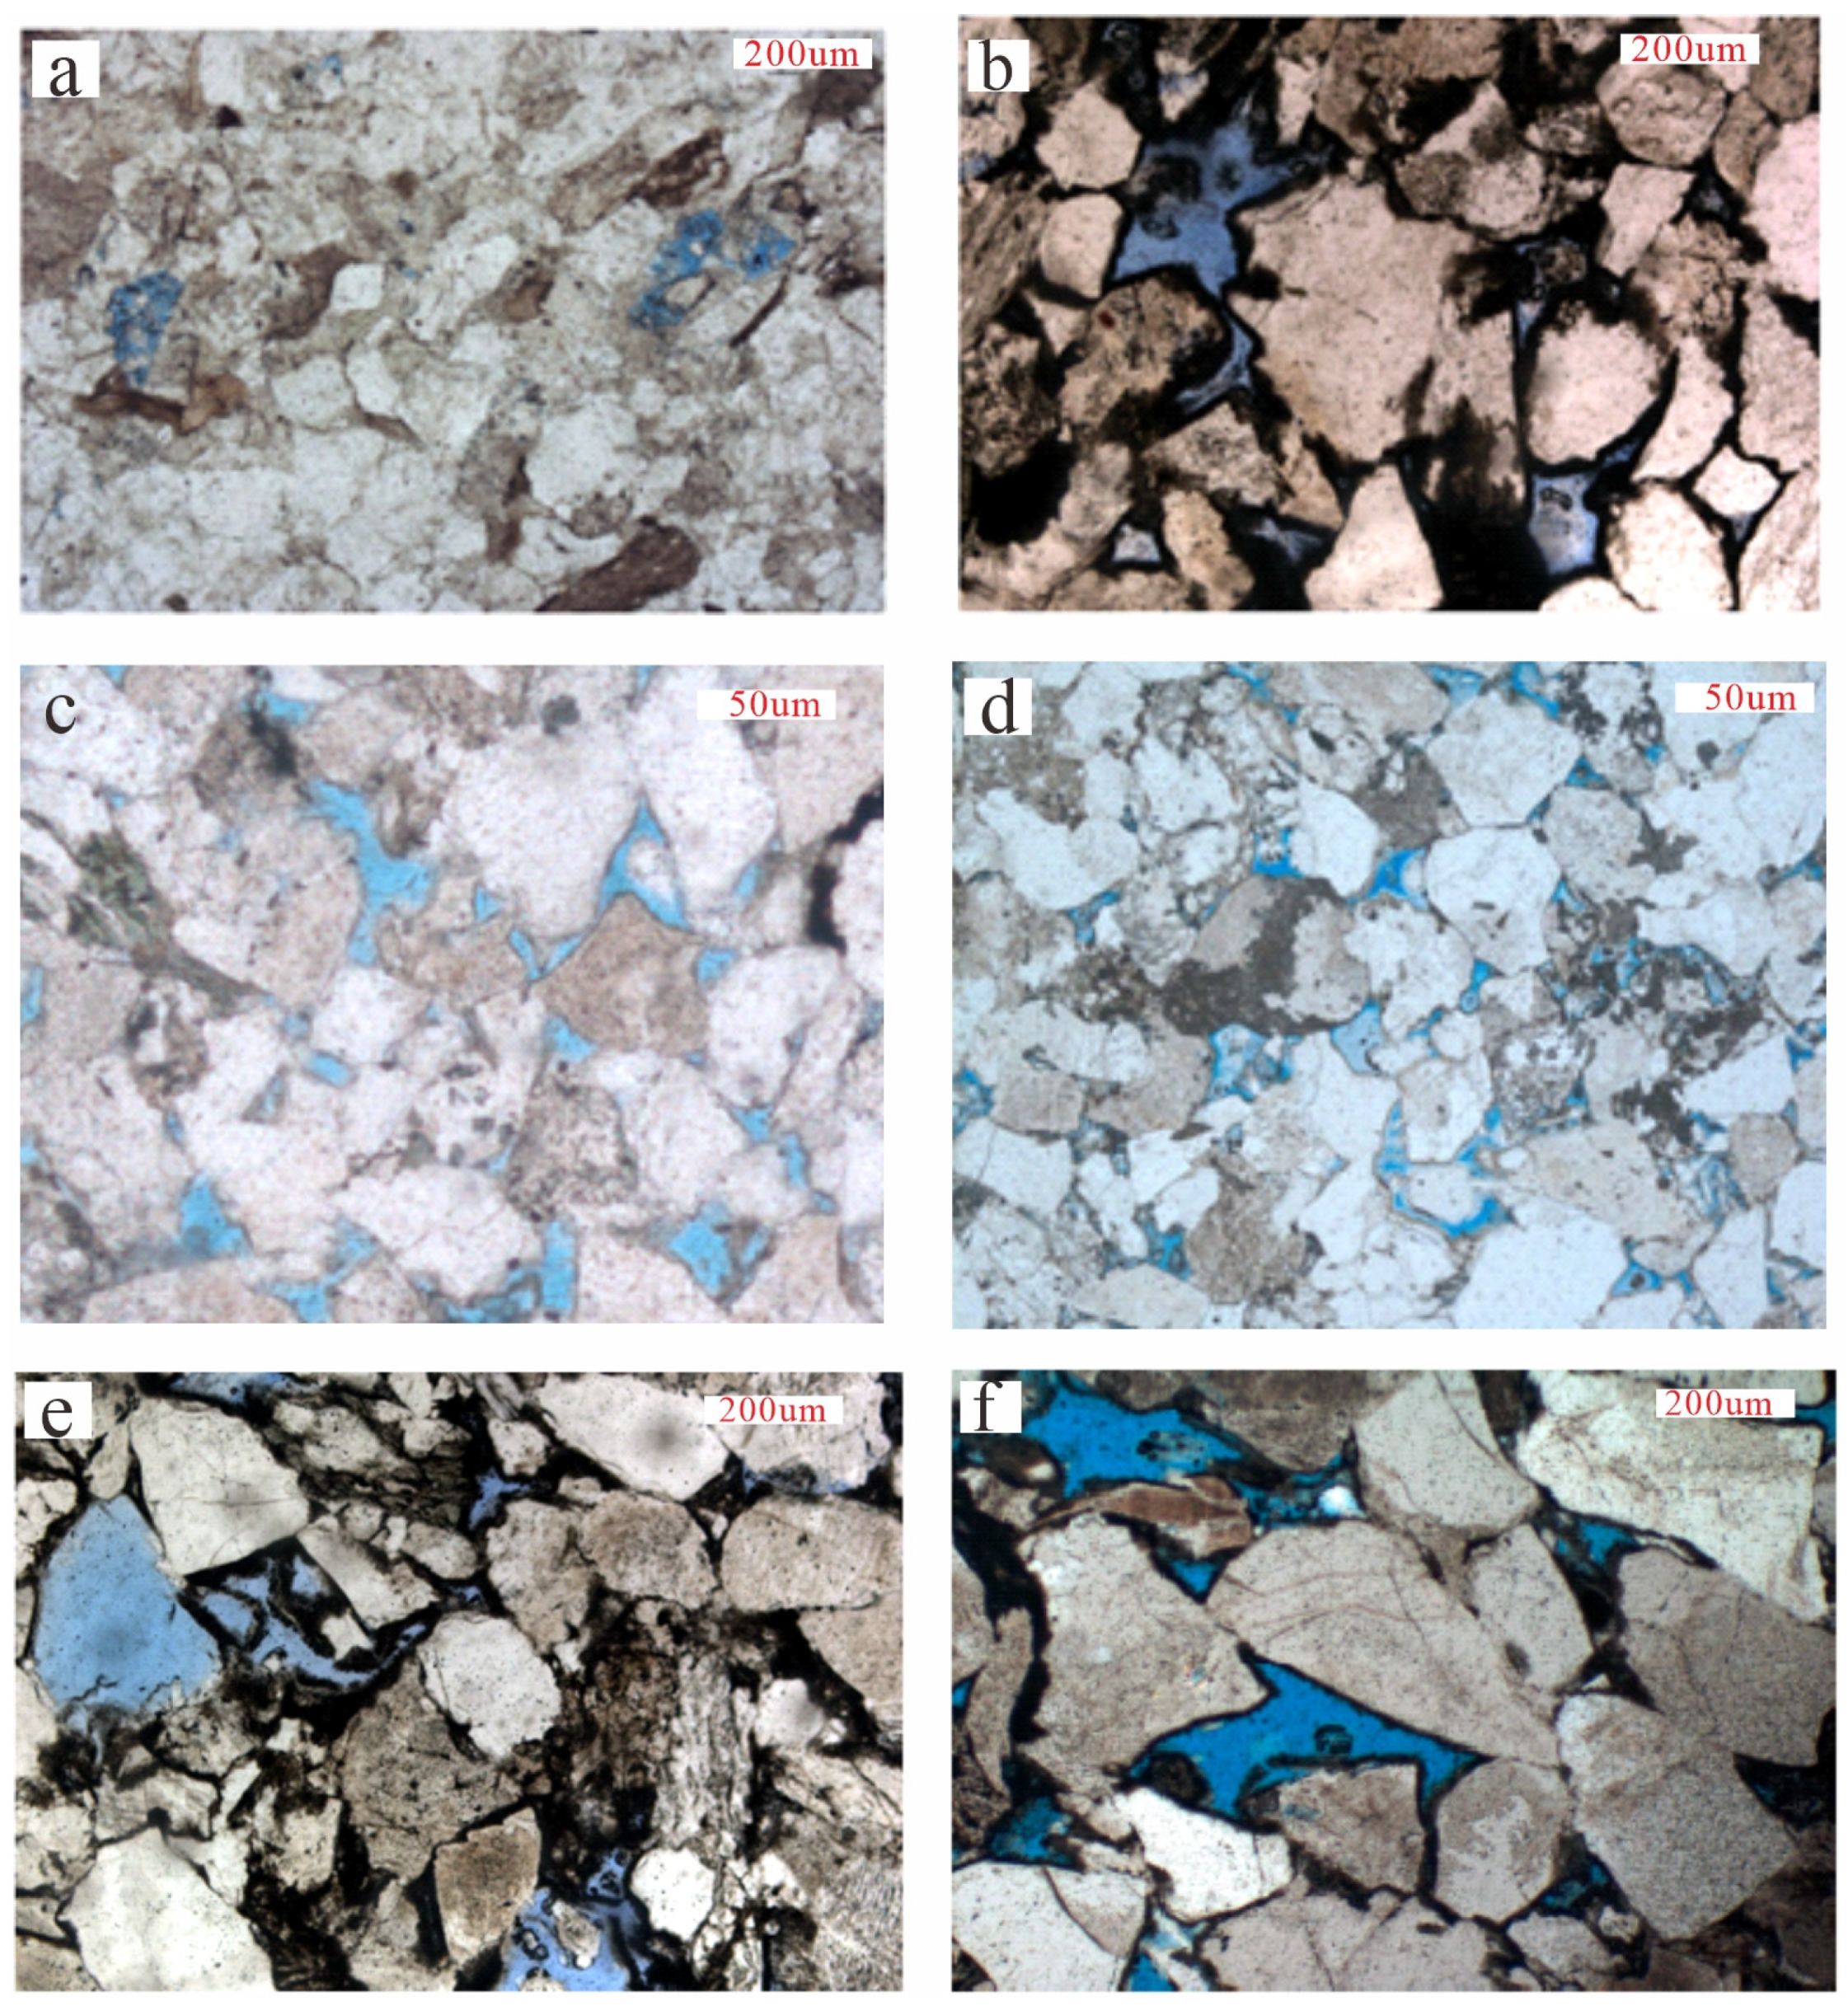
Figure 3. Thin section of reservoir rocks in the Shaximiao Formation. (a) Depth of thin sample 2000.11 m, well Q1, gray-green fine-grained lithic quartz sandstone; (b) depth of thin sample 1992.6 m, well X1, gray-green fine-grained lithic quartz sandstone; (c) depth of thin sample 2093.61 m, well J4, gray-green fine-grained lithic feldspar sandstone; (d) depth of thin sample 2058.87 m, well J4, gray-green fine-grained lithic feldspar sandstone; (e) depth of thin sample 2195.44 m, well Z6, gray-green fine-grained lithic feldspar sandstone; (f) depth of thin sample 2305.25 m, well Z6, gray-green fine-grained lithic feldspar sandstone. The blue color in the image represents pores.
Minerals 15 01217 g003
Figure 4. Histogram of heavy mineral distribution in the tight sandstone of the Shaximiao Formation.
Minerals 15 01217 g004
Figure 5. Distribution characteristics of tight sandstone lithic fragments in Shaximiao Formation. (a) Zone Z, (b) Zone X, (c) Zone J, (d) Zone Q.
Minerals 15 01217 g005
Figure 6. Radar distribution characteristics of tight sandstone lithic fragments in the Shaximiao Formation of the Western Sichuan Depression. (a) Zone Z, (b) Zone X, (c) Zone J, (d) Zone Q.
Minerals 15 01217 g006
Figure 7. A ternary diagram of the composition characteristics and provenance types of tight sandstone lithic fragments in the Western Sichuan Depression. (a) Zone Z, (b) Zone X, (c) Zone J, (d) Zone Q.
Minerals 15 01217 g007
Figure 8. Distribution characteristics of the heavy mineral index in the tight sandstone of the Shaximiao Formation.
Minerals 15 01217 g008
Figure 9. Distribution diagram of rare-earth element standardization curves.
Minerals 15 01217 g009
Figure 10. Distribution diagram of trace elements and rare-earth element standardization curves.
Minerals 15 01217 g010
Figure 11. Analysis of weathering of tight sandstone in Shaximiao Formation, Western Sichuan Depression. (a) Zone Z, (b) Zone X, (c) Zone J, (d) Zone Q.
Minerals 15 01217 g011
Figure 12. Sedimentary provenance distribution of tight sandstone gas reservoirs in different areas of the Shaximiao Formation, Western Sichuan Depression.
Minerals 15 01217 g012
Table 1. Statistical data table for rock composition of tight sandstone thin sections in the Shaximiao Formation.
ZoneWellNumber of SamplesQmQpLvLsaLmFLLt
Zone ZZ11034.355.657.00108.0035.0025.030.65
Z2835.322.688.00108.0036.0026.028.68
Z31238.383.165.2667.6938.4619.122.26
Z4731.674.336.001310.0035.0029.033.33
Z51236.434.0714.00119.0025.5034.038.07
Z61333.553.459.7688.3736.5026.529.95
Zone XX11061.281.281.941315.396.8330.631.89
X21256.159.006.06149.984.9229.938.93
X31371.392.865.75117.641.4824.327.14
X4556.31.71.851810.3711.5030.532.20
X5662.763.142.51108.9012.4021.724.84
Zone JJ11344.392.211.7973.5732.6012.214.41
J21254.161.941.2794.6524.0014.816.74
J3743.191.311.11712.5031.4020.521.81
J41047.521.181.2197.5033.5017.818.98
J5545.610.691.9563.2735.2011.412.09
J6446.230.771.2262.9434.509.910.67
Zone QQ1660.331.334.4575.3221.6716.717.99
Q21062.640.764.40614.3811.1724.425.18
Q3458.151.093.401512.0610.8029.931.05
Note: Monocrystalline quartz—Qm; polycrystalline quartz—Qp; volcanic lithic fragments—Lv; sedimentary lithic fragments—Lsa; metamorphic lithic fragments—Lm; monocrystalline feldspar—F; unstable lithic fragments—L (Lv + Lsa + Lm); polycrystalline lithic fragments—Lt (Lv + Lsa + Lm + Qp).
Table 2. Heavy mineral composition and relative content (w/%) of tight sandstone in Shaximiao Formation, Western Sichuan Depression.
ZoneWellGarnetEpidoteZirconApatiteRutileAnataseTourmalinePyroxeneLimoniteIlmeniteLeucoxeneIron Pyrite
Zone ZZ16657321523042
Z22314321116600052
Z34312141361401033
Z43719131172502022
Z53921141630300022
Zone XX254077323022020
X3430712339017060
X46806641620070
Zone JJ25165763527071
J35779650405151
Zone QQ151561142629040
Q25238852815251
Table 3. Rare-earth element test results for tight sandstone in Shaximiao Formation, Western Sichuan Depression.
ZoneWellLaCePrNdSmEuGdTbDyHoErTmYbLu
Zone ZZ145.587.19.935.76.11.25.80.814.440.982.740.322.600.40
Z243.486.79.937.06.81.36.20.844.330.912.460.372.310.56
Z347.491.510.438.47.41.46.90.995.111.092.860.342.740.42
Z445.295.811.632.76.21.16.20.694.671.122.330.332.190.44
Z533.163.77.125.94.50.84.10.583.240.721.940.311.940.39
Zone XX128.156.06.625.14.90.94.60.653.400.721.910.311.850.27
X239.576.88.732.15.71.05.10.683.660.782.220.352.170.34
X355.2104.911.942.87.41.56.70.925.141.153.210.533.270.50
X462.6120.213.951.68.71.58.01.025.701.273.680.603.940.62
Zone JJ251.280.59.631.77.41.24.20.674.290.992.550.362.080.54
J352.478.58.930.36.91.23.80.623.780.782.350.292.170.39
Zone QQ1-151.3101.511.139.66.61.36.10.824.330.942.600.402.550.38
Q1-240.075.68.632.35.91.25.60.824.380.932.610.402.420.37
Q236.370.08.130.05.71.25.40.794.150.882.370.372.320.35
Q340.076.68.932.95.91.25.80.834.510.992.700.422.590.39
Note: The unit of rare-earth elements in the samples is 10−6.
Table 4. Trace element test results for tight sandstone in Shaximiao Formation, Western Sichuan Depression.
ZoneWellScVCrCoZnRbSrZrNbBaHfTaPbTh
Zone ZZ112.41558911.08117215721010.37605.561.0012.116.0
Z27.7715613.1647029423310.22696.260.7712.511.8
Z313.61109117.9508817016111.24574.180.727.916.6
Z49.51088615.2488714618711.43674.30.788.414.3
Z58.9897714.147968323011.33345.880.847.712
Zone XX16.2493310.945582401249.43673.40.6118.78.2
X28.9937212.4718515119614.84605.290.949.812.2
X319.519313921.4837830418122.516554.580.878.616.8
X411.4988914.08811511943321.544814.111.299.720.3
Zone JJ29.3687410.2537714917310.23554.580.978.713.0
J312.61019815.4696215816410.52995.471.3311.214.7
Zone QQ1-114.411210325.013111426816716.99564.321.0026.115.6
Q1-29.7917817.5898815117415.75734.590.9763.312.1
Q29.692821682559517014.44024.560.8814.211.5
Q313.51158914.8959614613614.85613.610.9223.514.2
Note: The unit of trace elements in the samples is 10−6.
Table 5. Rare-earth element ratios of tight sandstone rock samples from the Shaximiao Formation in the Western Sichuan Depression.
ZoneWell∑REE∑LREE/
∑HREE
LaN/
YbN
LaN/
SmN
GdN/
YbN
DyN/
SmN
δEuδCeLa/
Th
La/
Sc
Co/
Th
La/
Yb
Rb/
Sr
Zr/
Hf
Zr/
Th
Sc/
Cr
Zone ZZ1203.710.211.54.61.80.40.60.92.83.70.717.51.137.813.10.1
Z2202.810.412.43.92.10.40.61.03.75.61.118.80.237.219.70.1
Z3216.99.611.43.92.00.40.60.92.93.51.117.30.538.59.70.2
Z4210.710.613.64.42.20.40.60.93.24.81.120.70.643.513.10.1
Z5148.110.311.24.51.70.40.60.92.83.71.217.11.239.119.20.1
Zone XX1135.38.910.03.52.00.40.60.93.44.51.315.20.236.515.10.2
X2179.210.712.04.21.90.40.60.93.24.41.018.20.637.116.10.1
X3245.110.511.14.51.60.40.50.93.32.81.316.90.339.510.80.1
X4283.410.410.54.41.60.40.60.93.15.50.715.91.030.721.30.1
Zone JJ2197.211.616.24.21.60.30.60.93.95.50.824.60.537.813.30.1
J3192.312.615.94.61.40.30.60.93.64.21.024.10.430.011.20.1
Zone QQ1-1229.511.713.34.81.90.40.60.93.33.61.620.10.638.710.70.1
Q1-2181.29.310.94.11.90.40.60.93.34.11.416.50.637.914.40.1
Q2167.99.110.33.91.90.40.60.93.23.81.415.61.037.314.80.1
Q3183.99.110.24.11.80.40.61.02.83.01.015.41.037.79.60.2
Disclaimer/Publisher’s Note: The statements, opinions and data contained in all publications are solely those of the individual author(s) and contributor(s) and not of MDPI and/or the editor(s). MDPI and/or the editor(s) disclaim responsibility for any injury to people or property resulting from any ideas, methods, instructions or products referred to in the content.