Article

Optimizing Flocculation and Settling Parameters of Superfine Tailings Slurry Based on the Response Surface Method and Desirability Function

by
Zhenjiang Wen
1,2,
Shihu Shi
1,2,*,
Biyao Geng
1,2,
Jianxun Fu
1,2,
Si Huo
1,2 and
Huan Zhang
1,2
1
China ENFI Engineering Corporation, Beijing 100038, China
2
Key Laboratory of Safe and Green Mining of Metal Mines with Cemented Paste Backfill National Mine Safety Administration, Beijing 100038, China
*
Author to whom correspondence should be addressed.
Minerals 2025, 15(11), 1216; https://doi.org/10.3390/min15111216
Submission received: 25 September 2025 / Revised: 29 October 2025 / Accepted: 4 November 2025 / Published: 18 November 2025
(This article belongs to the Special Issue Advances in Mine Backfilling Technology and Materials, 2nd Edition)

Abstract

Highly efficient flocculation and settling of tailings slurry is crucial for achieving high-concentration and low-cost backfill. Aiming to address the problem of the poor solid–liquid separation effect of superfine tailings slurry, this article improves its flocculation and settling effect by optimizing parameters. The flocculation and settling test was designed and carried out by the response surface method (RSM), with tailings slurry concentration (TSC), unit consumption of flocculant (UCF), and concentration of flocculant solution (CFS) as the influencing factors. The flocculation and settling effect was characterized by the underflow concentration (UC), settling velocity (SV), and mean chord length of floc (MCLF). A response surface regression model was established based on the test results to analyze the impact patterns of various factors and their interactions. Multi-objective optimization via the desirability function (DF) yielded optimal parameters: a TSC of 19%, a UCF of 16 g/t, and a CFS of 0.4%. Furthermore, experimental verification revealed that the relative error between the results and predicted values was within 3%. This indicates that optimizing flocculation and settling parameters has guiding significance for improving the thickening efficiency of superfine tailings, which will help optimize the tailings thickening process and reduce filling costs in mines.

1. Introduction

Mining is a traditional, rough industry. Compared with other industries, its working environment is poor, and if not handled properly, it can cause serious damage to the ecological environment. A large amount of solid waste, including waste rock and tailings, is generated during the mining and processing of mineral resources. If the bulk of the tailings generated during processing is improperly handled, it will not only occupy land and pollute the environment but can also lead to safety issues. Therefore, determining how to correctly dispose and utilize tailings is crucial for the green and sustainable development of mines [1,2]. At present, tailings cemented backfill is one of the most common and effective methods used to treat tailings in mines across the globe. However, due to the low concentration of tailings slurry discharged from the concentrator, direct filling increases the water dewatering and also has an impact on the filling effect. Therefore, the flocculation and settling of tailings slurry is key to preparing high-concentration filling slurry [3,4]. A flocculant is typically added to improve the settling velocity and effect of tailings slurry in mines [5]. Extensive research has been performed to investigate the preparation of high-concentration filling slurry via flocculation and settling of tailings. Such studies focus on the influence of flocculant type and unit consumption, as well as the tailings’ chemical composition, mass concentration, pH, and particle size on the flocculation settling velocity and underflow concentration of the tailings [6,7,8,9,10,11]. Genetic algorithms and neural networks have also been employed to optimize the flocculation parameters of tailings [12,13,14]. However, research on the properties of tailing flocs is limited. The size of the flocs is a critical influencing factor that can effectively characterize the flocculation and settling effect [15,16]. The majority of existing work investigates the influence of flocculant type and unit consumption, flocculant solution mass concentration (referred to as flocculant concentration), tailings slurry mass concentration (referred to as slurry concentration), etc., on the flocculation and settling of tailings. However, there is a lack of systematic research on the influence of multi-factor interaction, parameter optimization, and mechanism of tailings flocculation settling, especially for superfine tailings. Therefore, based on existing research, the current paper employs the response surface method to explore the influence of numerous factors and their corresponding interactions on the flocculation and settling effect of superfine tailings, including settling velocity, underflow concentration, and floc size. The satisfaction criterion is used to optimize the flocculation and settling parameters of the tailings, thus achieving the optimal flocculation and settling effect while minimizing costs and providing a reference for optimizing the mine superfine tailings thickening process.

2. Test Materials and Methods

2.1. Materials

The test materials of this study mainly include tailings, flocculants, and water.

2.1.1. Tailings

The tailings were obtained from the Shahe Zhongguan Iron Mine of Hebei Iron & Steel Group in Xingtai City, Hebei Province, China. The moisture content of the samples was approximately 15%. Following drying, the density was measured by the pycnometer method, and the loose bulk density and tamped bulk density were measured by the graduated cylinder method. The physical property test results of tailings are shown in Table 1. The chemical composition of tailings was determined using an X-ray fluorescence spectrometer (XRF), and the results are shown in Table 2. The particle size distribution (PSD) of tailings was analyzed by a Malvern 3000 laser particle size analyzer; the result is shown in Figure 1. The proportions of particles −74 μm and −20 μm in the tailings samples are approximately 88.36% and 59.85%, respectively. Combined with other characteristic particle size indicators, the samples contained superfine tailings [17,18].

2.1.2. Flocculant

Polyacrylamide (PAM) flocculants, obtained from Beijing Tongyuan, China, were used in the experiments. The samples included three types: Anionic polyacrylamide (APAM) with a relative molecular weight of 15 million (APAM-1500), Cationic polyacrylamide (CPAM) with an ionic degree of 60 (CPAM-60), and Non-ionic polyacrylamide (NPAM) with a relative molecular weight of 10 million (NPAM-1000).

2.1.3. Water

To ensure consistency with the tailings thickening conditions at the mine site, the tests utilized mill process water with a pH of 7.96.

2.2. Test Method for Tailings Flocculation and Settling

2.2.1. Process of Flocculation and Settling Test for Tailings Slurry

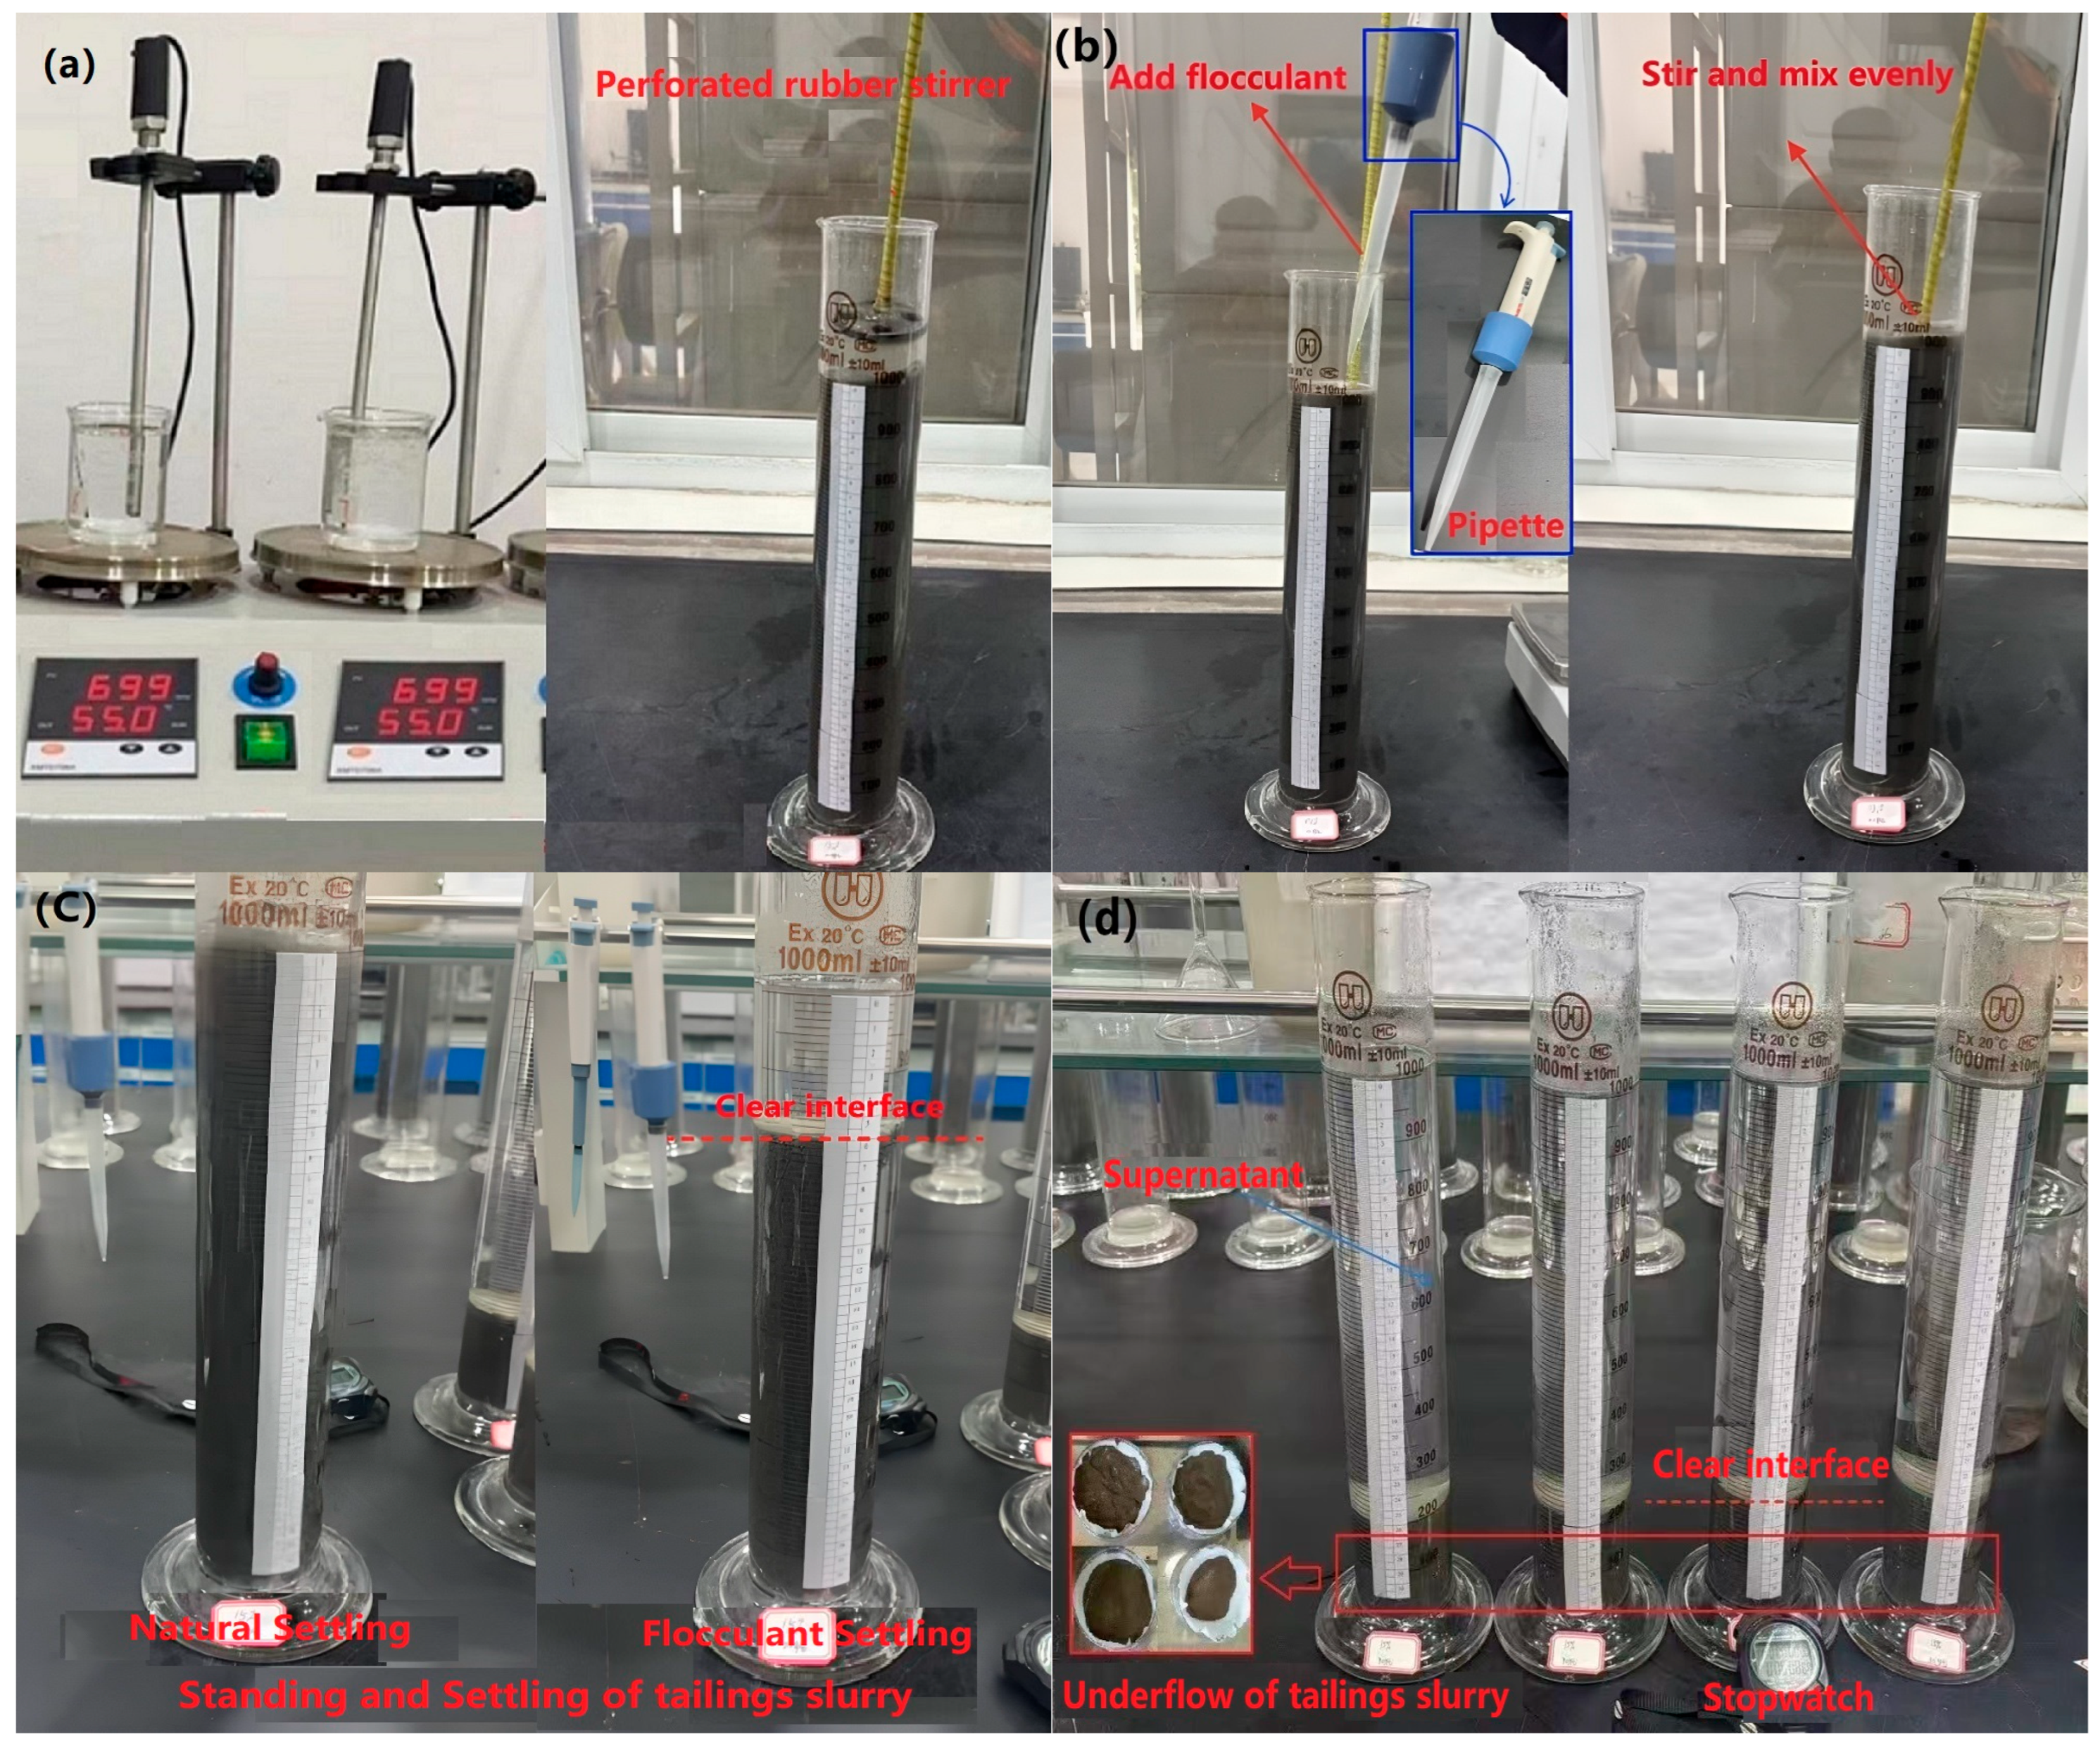
The tailings flocculation and settling test was conducted in accordance with the Chinese national standard GB/T 51450-2022 Technical Standard for Metal and Non-metal Mine Filling Engineering [19]. The main steps include the following: (a) Preparation of the flocculant solution and tailings slurry. The prepared tailings slurry was then poured into a graduated cylinder and stirred up and down 10 times by a perforated rubber stirrer to prevent the tailings from settling before adding the flocculant. (b) For flocculation settling of tailings slurry, the flocculant was added with a pipette, then, the mixture was stirred up and down 5 times with a perforated rubber stirrer to mix the flocculant and tailings slurry evenly, and then was allowed to stand. In contrast, natural settling required no flocculant and involved only mixing and standing. (c) Immediately after the tailings slurry and flocculant were stirred and mixed, timing was started with a stopwatch, then the clear interface between the supernatant and slurry was observed, and the clear interface height (CIH) was read and recorded at the target time point (e.g., 0, 5, 10, 15 s … 40, 50, 60, 120 s …, 24 h) through the coordinate paper on the graduated cylinder. After standing for 24 h, the supernatant above the tailings slurry was discharged by siphoning, and the UC of the tailings slurry was determined by drying. A static settling curve was drawn based on the recorded data. The SV of the tailings slurry was calculated by performing regression analysis of the uniform section in the settling curve. The test process is shown in Figure 2.

2.2.2. Measurement Method for MCLF

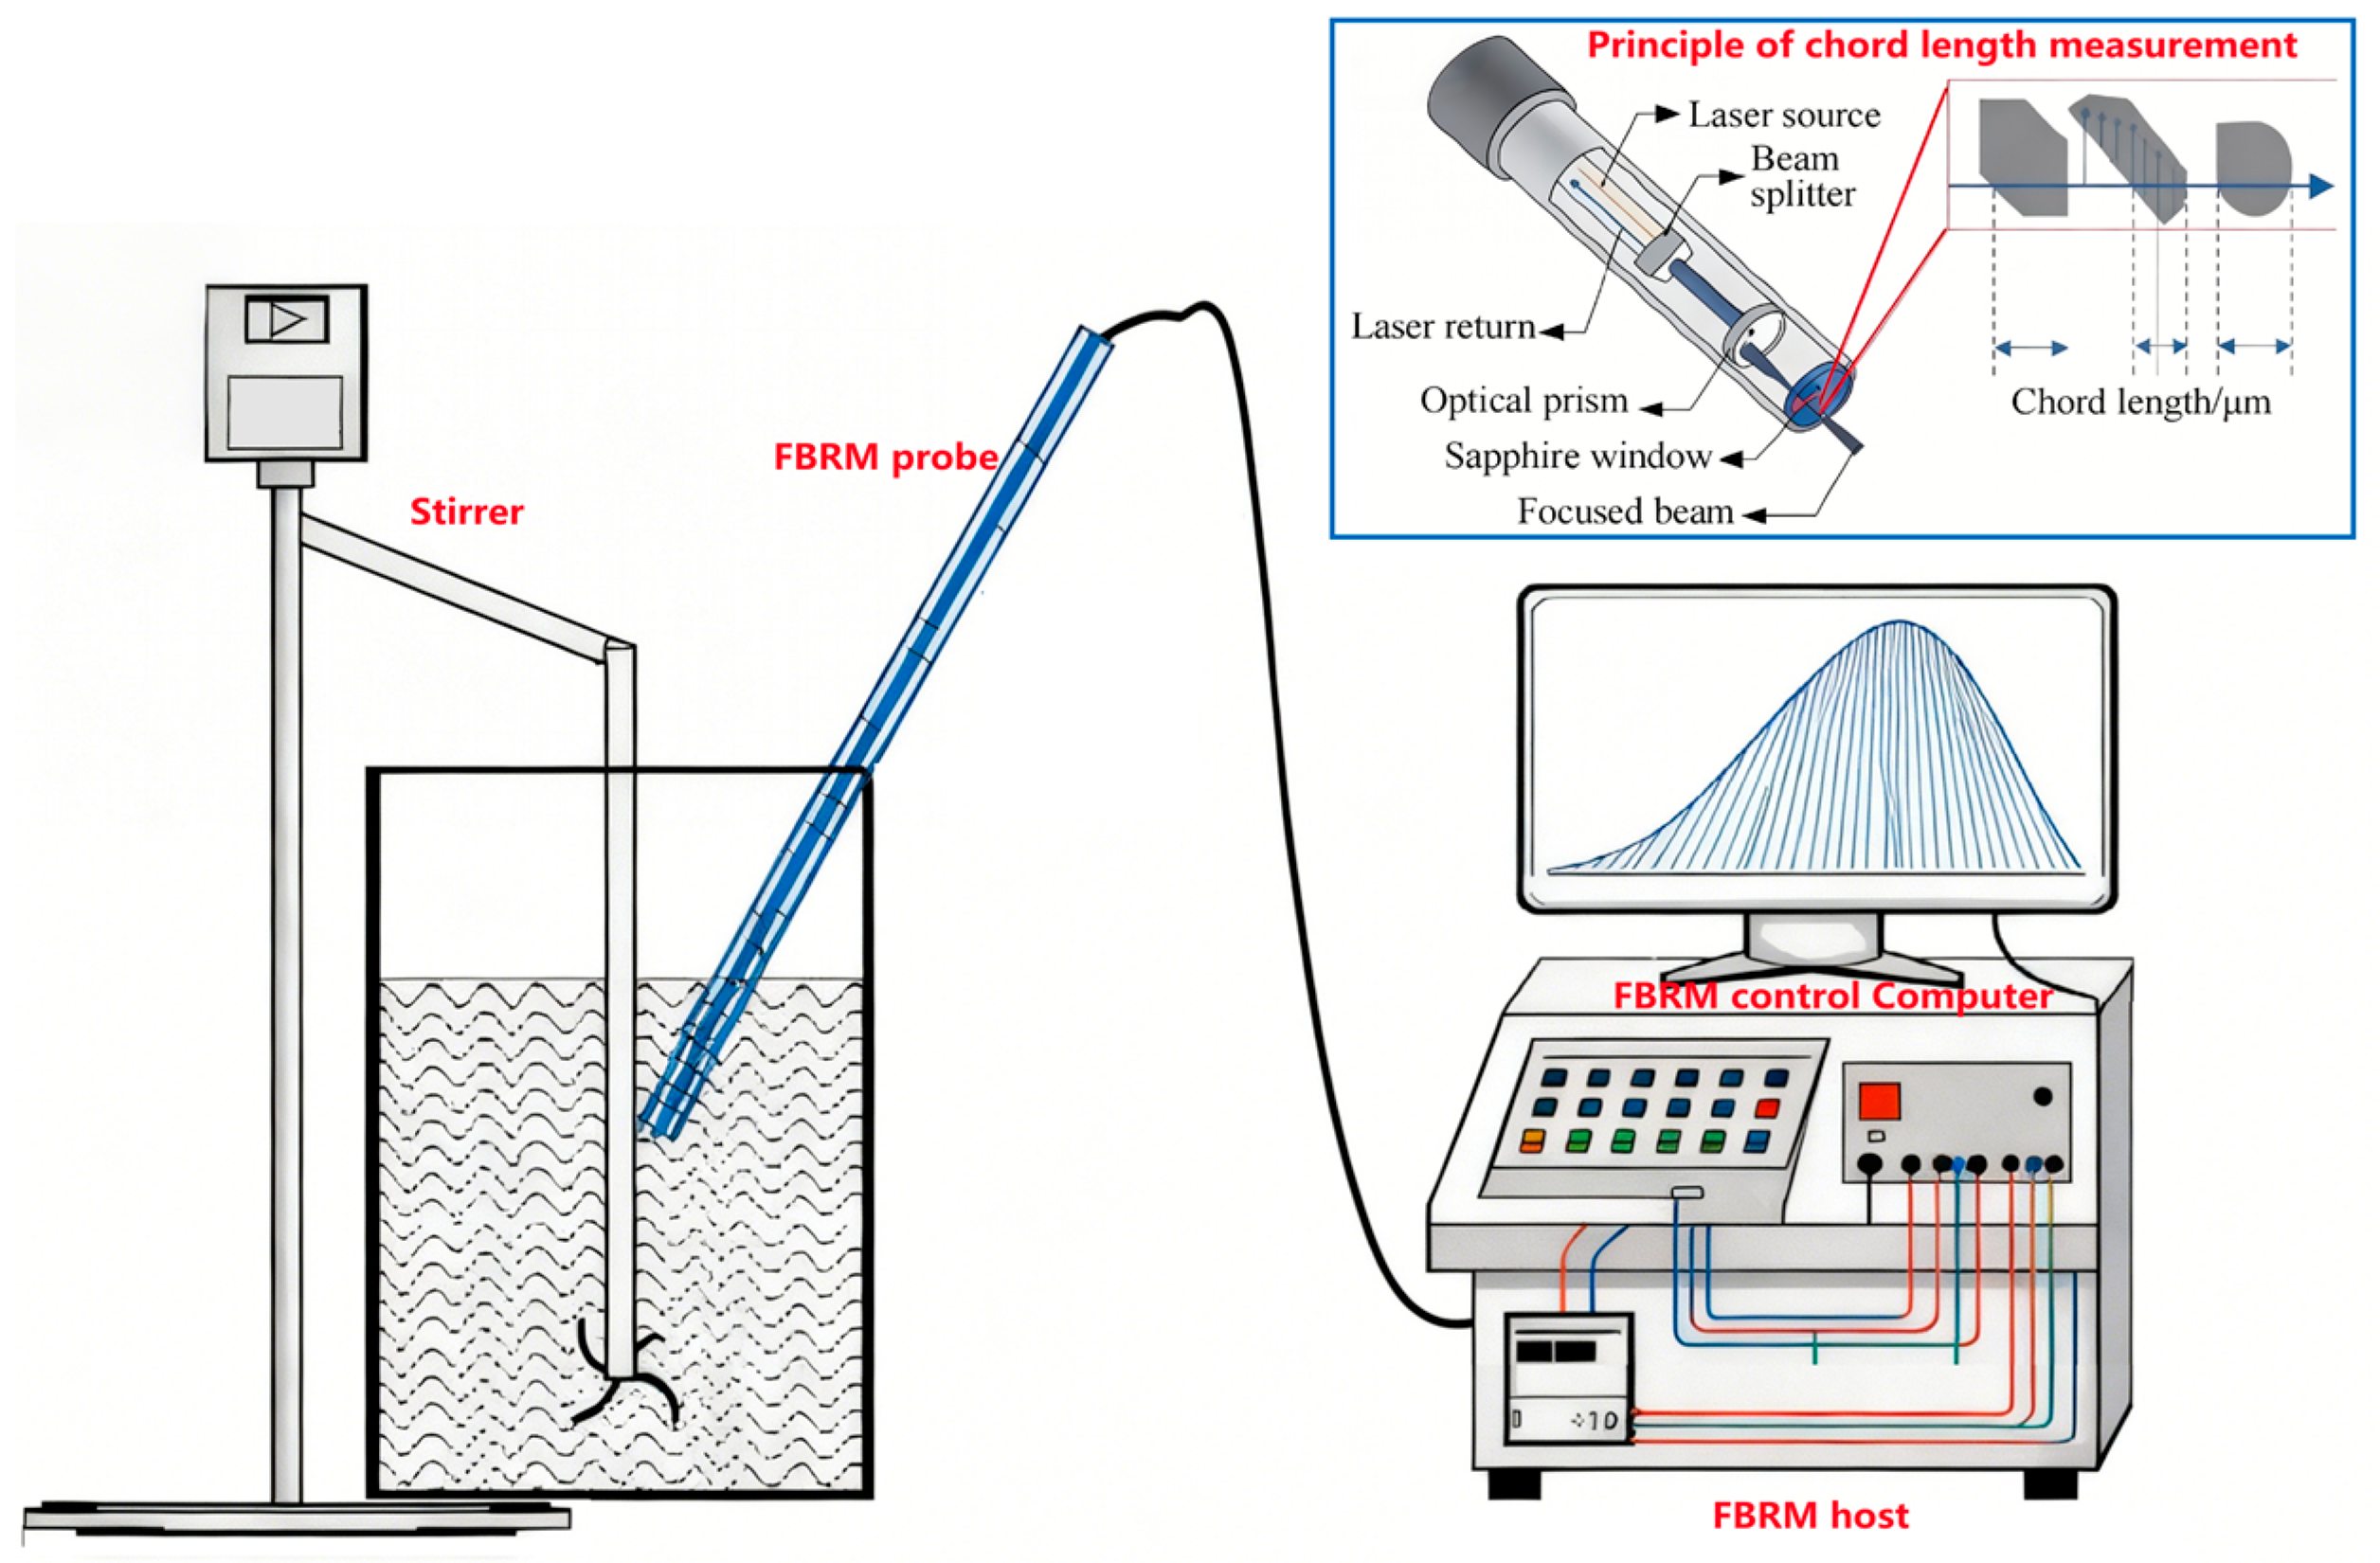
Meanwhile, during the flocculation and settling process, Focused Beam Reflection Measurement (FBRM G600L, METTLER TOLEDO, Greifensee, Switzerland) was used to measure the floc size [15]. FBRM technology is an in situ and real-time particle characterization technique. Its working principle is to scan a fixed speed circular path on the outer surface of a sapphire window with a focused laser beam generated by a rotating optical prism in FBRM. The laser beam encounters suspended flocs on the window surface, producing backscattered laser which is detected by the sensor inside the probe. The chord length of the floc can be calculated by multiplying the time delay between laser emission and reflection by the scanning speed [15,20,21]. The FBRM test device and the principle of chord length testing are shown in Figure 3 [20,21]. The experiment was conducted in a beaker using a GZ120-S cantilever mechanical stirrer to rapidly mix and prepare tailings slurry at 300 rpm. After stirring for 3 min, the flocculant solution was injected using a pipette, and the mixing speed was then reduced to 150 rpm. At the same time, the FBRM probe was placed in the beaker for monitoring. The measurement data were processed by applying the Marco channel and the length-weighted average method in the FBRM software to obtain the weighted mean chord length of floc (referred to as the mean chord length of floc, MCLF).

2.3. Flocculant Selection Test

The type of flocculant has a significant impact on the flocculation and settling effect of tailings slurry. To identify the suitable flocculants, the control variable method was employed by keeping the test parameters such as TSC, UCF, and CFS constant. Meanwhile, the flocculation and settling effects of three flocculant types (APAM-1500, CPAM-60, and NPAM-1000) were compared with natural static settling. The flocculant selection is determined by the SV, the clarity of the supernatant, and the cost analysis. The experimental scheme and results of the UC test are shown in Table 3.

2.4. Experiment Design and Optimization Methods

RSM is an optimization method that integrates experimental design and mathematical modeling. By testing representative local points, a functional relationship is fit between factors and results in the global range. In order to optimize each factor, RSM determines a response surface function Y = f(x) that is infinitely close to the mapping function y = f(x). More specifically, the Box–Behnken experimental design is implemented, and a response surface model is derived as shown in Equation (1) [22,23]. However, multiple responses cannot be optimized simultaneously. In order to overcome this limitation, a multi-objective optimization algorithm based on satisfaction criteria can be used [24,25,26]. In DF optimization, individual desirability functions must first be established based on the regression models of each response surface, as expressed in Equation (2a, b), to calculate the satisfaction of each response quantity accordingly. The weighted geometric average multi-objective optimization function of each single desirability function, that is, the overall desirability function D, is subsequently determined [26,27], as shown in Equation (2c).
y = i = 1 n a i i x i 2 + i = 1 n 1 i = 1 n a i j x i x j + i = 1 n a i x i + a 0
d y i = 0   if   y i < L i   y i L i H i L i s   if   L i y i H i 1   if   y i > H i
d y i = 0   if   y i > H i   y i H i L i H i s   if   L i y i H i 1   if   y i < L i
D = i = 1 k d y i e i 1 e i
where a0, ai, aii, and aij are the regression coefficients for the constant term, linear terms, quadratic terms, and interaction terms, respectively. d(yi) is the desirability function of the i-th response surface; yi is the i-th response value; Li and Hi are the i-th lower and upper limits of the response value, respectively; s is a parameter that determines how closely the response should approach the target value and is set as 1 for the convenience of calculations; and k and ei represent the number and weight of the response, respectively, where the latter reflects the importance of the response. Equation (2a) is applicable to response quantities with larger response values and a higher desirability degree; Equation (2b) is applicable to response quantities with smaller response values and a higher desirability degree.
In summary, the response surface desirability function multi-objective optimization method (RSM-DF) begins by designing and conducting a limited number of experiments according to the influence factors and level range determined through the preliminary exploratory test, after which a response surface regression model is established based on the test results. The influence of a single factor and the multi-factor interactions on the response are evaluated, and the satisfaction function is employed to convert each response value into a number between 0 and 1.
The flocculation and settling effects of tailings slurry are greatly affected by TSC, UCF, CFS, and the interaction among them [19,20]. The optimization of the flocculation conditions can not only effectively improve the flocculation and settling effect, but can also reduce costs. Thus, we investigated the TSC (x1), the UCF (x2), the CFS (x3) and their interactions with the UC (y1), SV (y2), and MCLF (y3), and determined their optimal proportions. Previous research has determined the flocculation effect to be optimized for TSC, UCF, and CFS values ranging from 15% to 25%, 10 g·t−1 to 20 g·t−1, and 0.1% to 0.4%, respectively [28]. Based on this, a three-factor test was designed across three levels using the Box–Behnken framework in Design-Expert. Table 4 provides details of the test scheme.

3. Results

3.1. Flocculant Selection

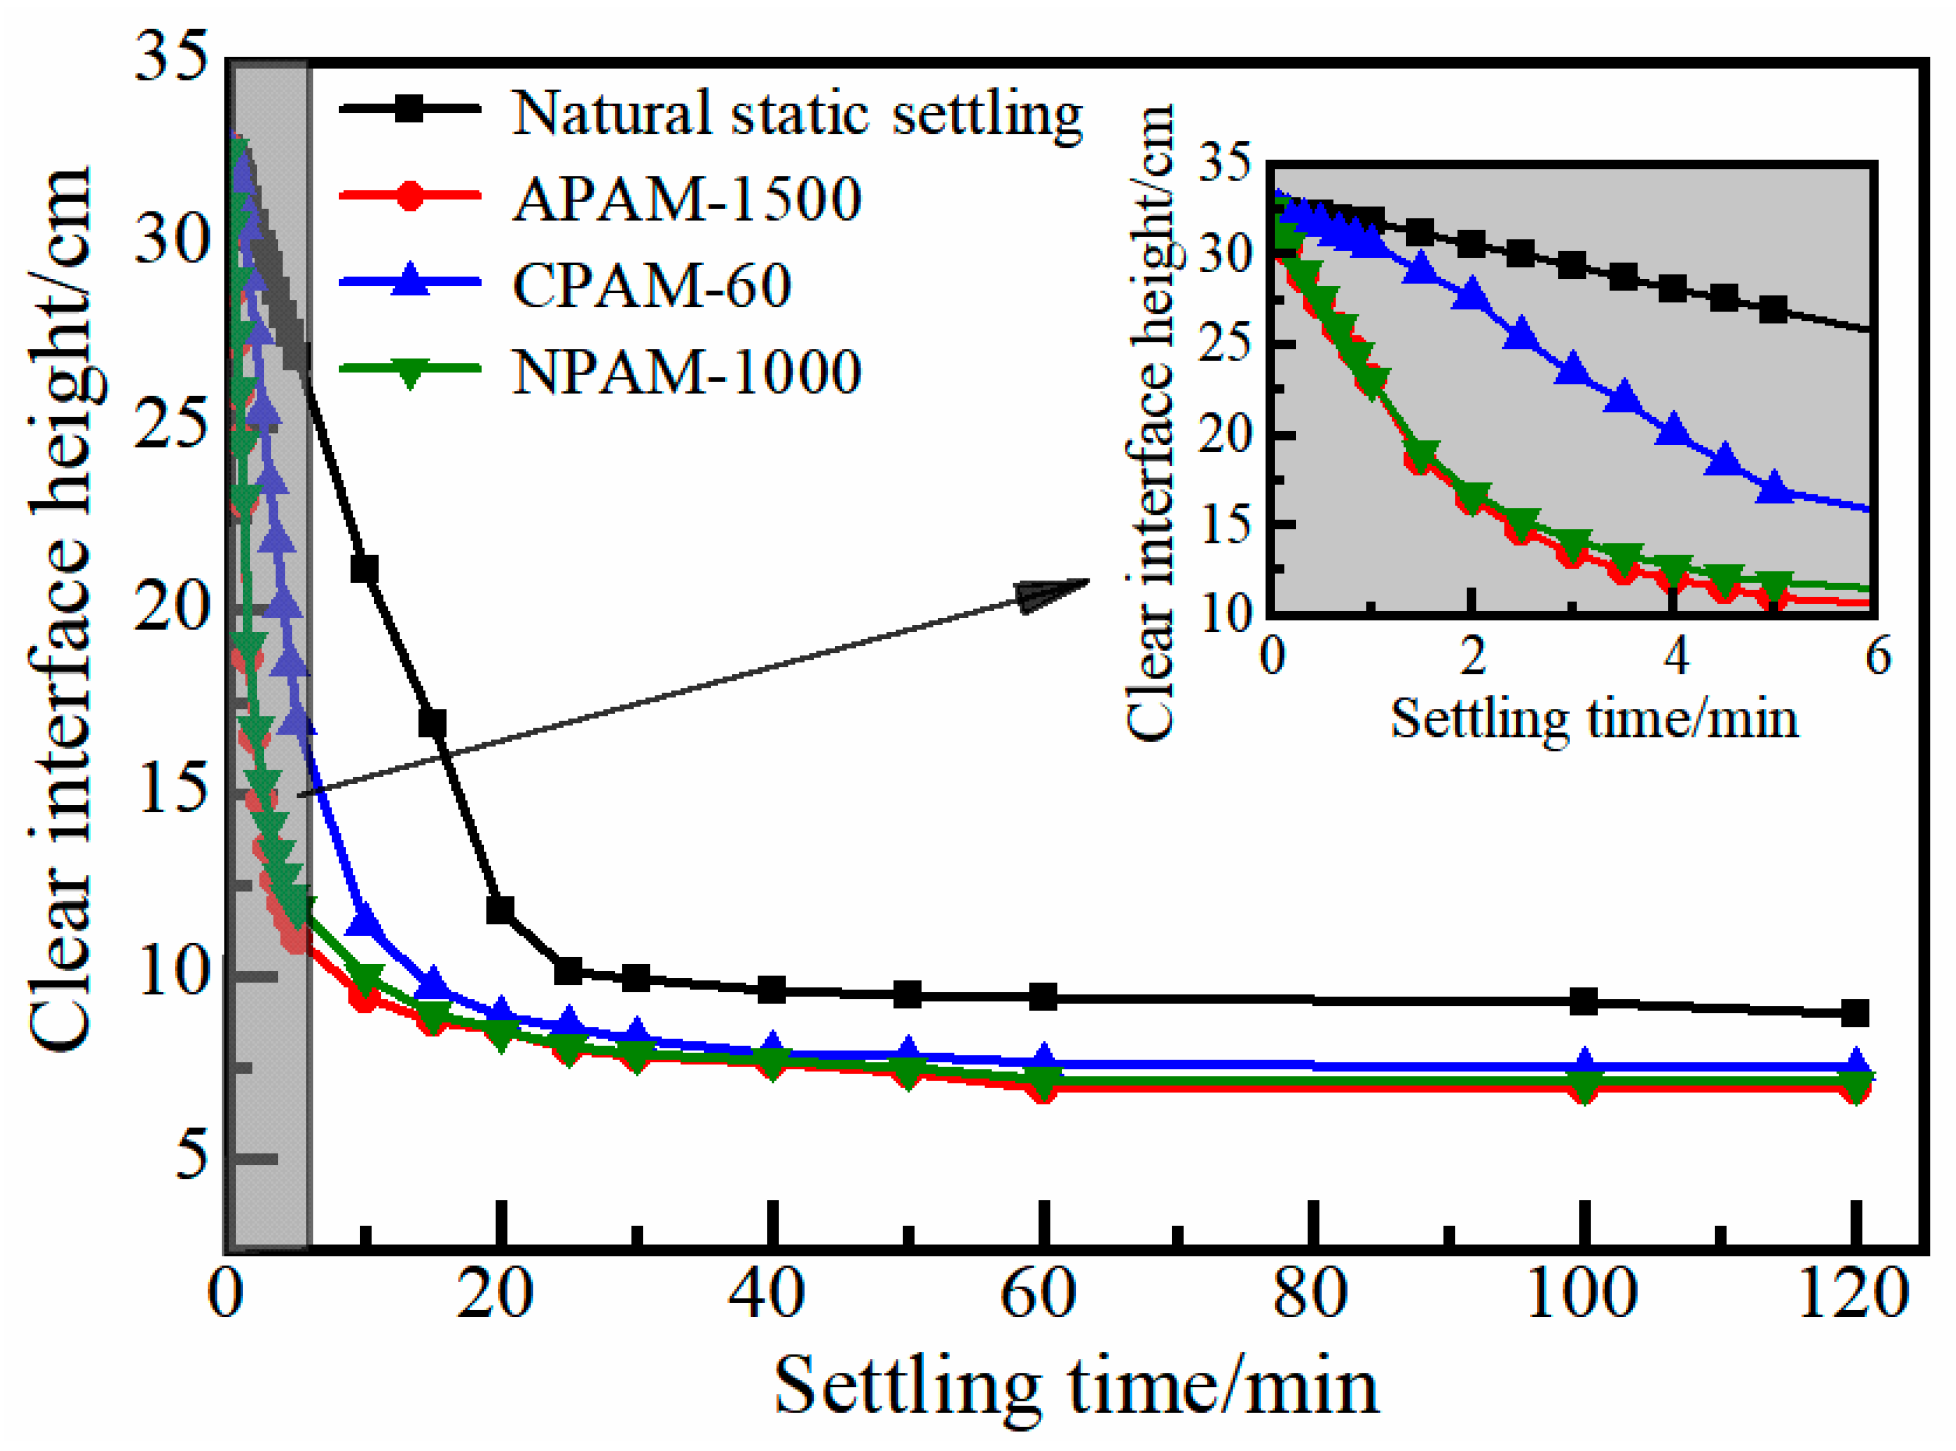
The tests were performed in accordance with the flocculation and settling test method in Section 2.2 and the scheme in Table 3. The settling curves of the tailings slurry for different flocculants and the natural static settling curve are shown in Figure 4.
It can be seen from Figure 4 that the natural static settling velocity of the tailings slurry is extremely slow. Following the addition of the flocculant, a clear interface rapidly forms, and the settling velocity exhibits a marked increase. The APAM-1500 and CPAM-60 flocculants demonstrate the highest and lowest settling velocities, respectively. The cost analysis of flocculants reveals that the prices of APAM-1500, CPAM-60, and NPAM-1000 are RMB 13/kg, RMB 25/kg, and RMB 16/kg, respectively. Thus, the unit price of CPAM-60 is higher than that of the other two flocculants, and there is no advantage in flocculation performance. In addition, based on the configuration of the flocculant solution process, at the same concentrations of anionic and nonionic solution, APAM-1500 requires 1 h to form a homogeneous solution, while NPAM-1000 requires 2 h. Therefore, considering flocculation types, costs, and preparation process, the APAM-1500 flocculant is considered optimal.

3.2. Flocculation and Settling Test Results

According to the test method and design, the flocculation and settling test was performed, and the SV, UC, and floc size (MCLF) were determined. The test results are shown in Table 5.

4. Discussion

4.1. Establishment and Significance Analysis of RSM Model

Design-Expert was applied to perform multiple regression fitting on the experimental results to establish the RSM model, as shown in Equations (3)–(5). The prediction results of the model are shown in Table 5. In order to validate the reliability of the response surface model determined in this paper, we performed variance analysis, and the results are shown in Table 6. The F values of each model are calculated as 43.92, 200, and 21.28, respectively, all of which exceed F0.95 (3,9) = 3.86 and p < 0.001, indicating a significant regression effect of each model. The corresponding correlation coefficients R2 are all close to 1, at 0.926, 0.996, and 0.965, respectively. Figure 5 depicts the (x, y, z) relative error three-dimensional scatter diagram derived using the relative error between the test and predicted values of y1, y2, and y3. It should be noted that the error scatter is projected on each plane. The relative error in each plane projection ranges within 0%–3%, with the exception of several outliers. This indicates the strong fitting effect of each model.
y 1 = 28.72 + 3.61 x 1 + 1.89 x 2 54.10 x 3 + 2 × 10 3 x 1 x 2 + 0.397 x 1 x 3 0.353 x 2 x 3 0.086 x 1 2 0.063 x 2 2 + 116.28 x 3 2   ( R 2 = 0 . 926 )
y 2 = 14.82 + 1.66 x 1 + 0.48 x 2 9.71 x 3 + 2 × 10 4 x 1 x 2 + 0.053 x 1 x 3 0.110 x 2 x 3 0.046 x 1 2 0.011 x 2 2 + 21.28 x 3 2   ( R 2 = 0 . 996 )
y 3 = 121.42 + 23.32 x 1 + 6.35 x 2 205.0 x 3 + 0.23 x 1 x 2 + 1.57 x 1 x 3 1.10 x 2 x 3 0.76 x 1 2 0.30 x 2 2 + 393.33 x 3 2   ( R 2 = 0 . 965 )

4.2. Effects and Mechanistic Analysis of Factors and Their Interactions on Flocculation and Settling Indicators

4.2.1. Effect of Factors and Their Interactions on the Flocculation and Settling Indicators

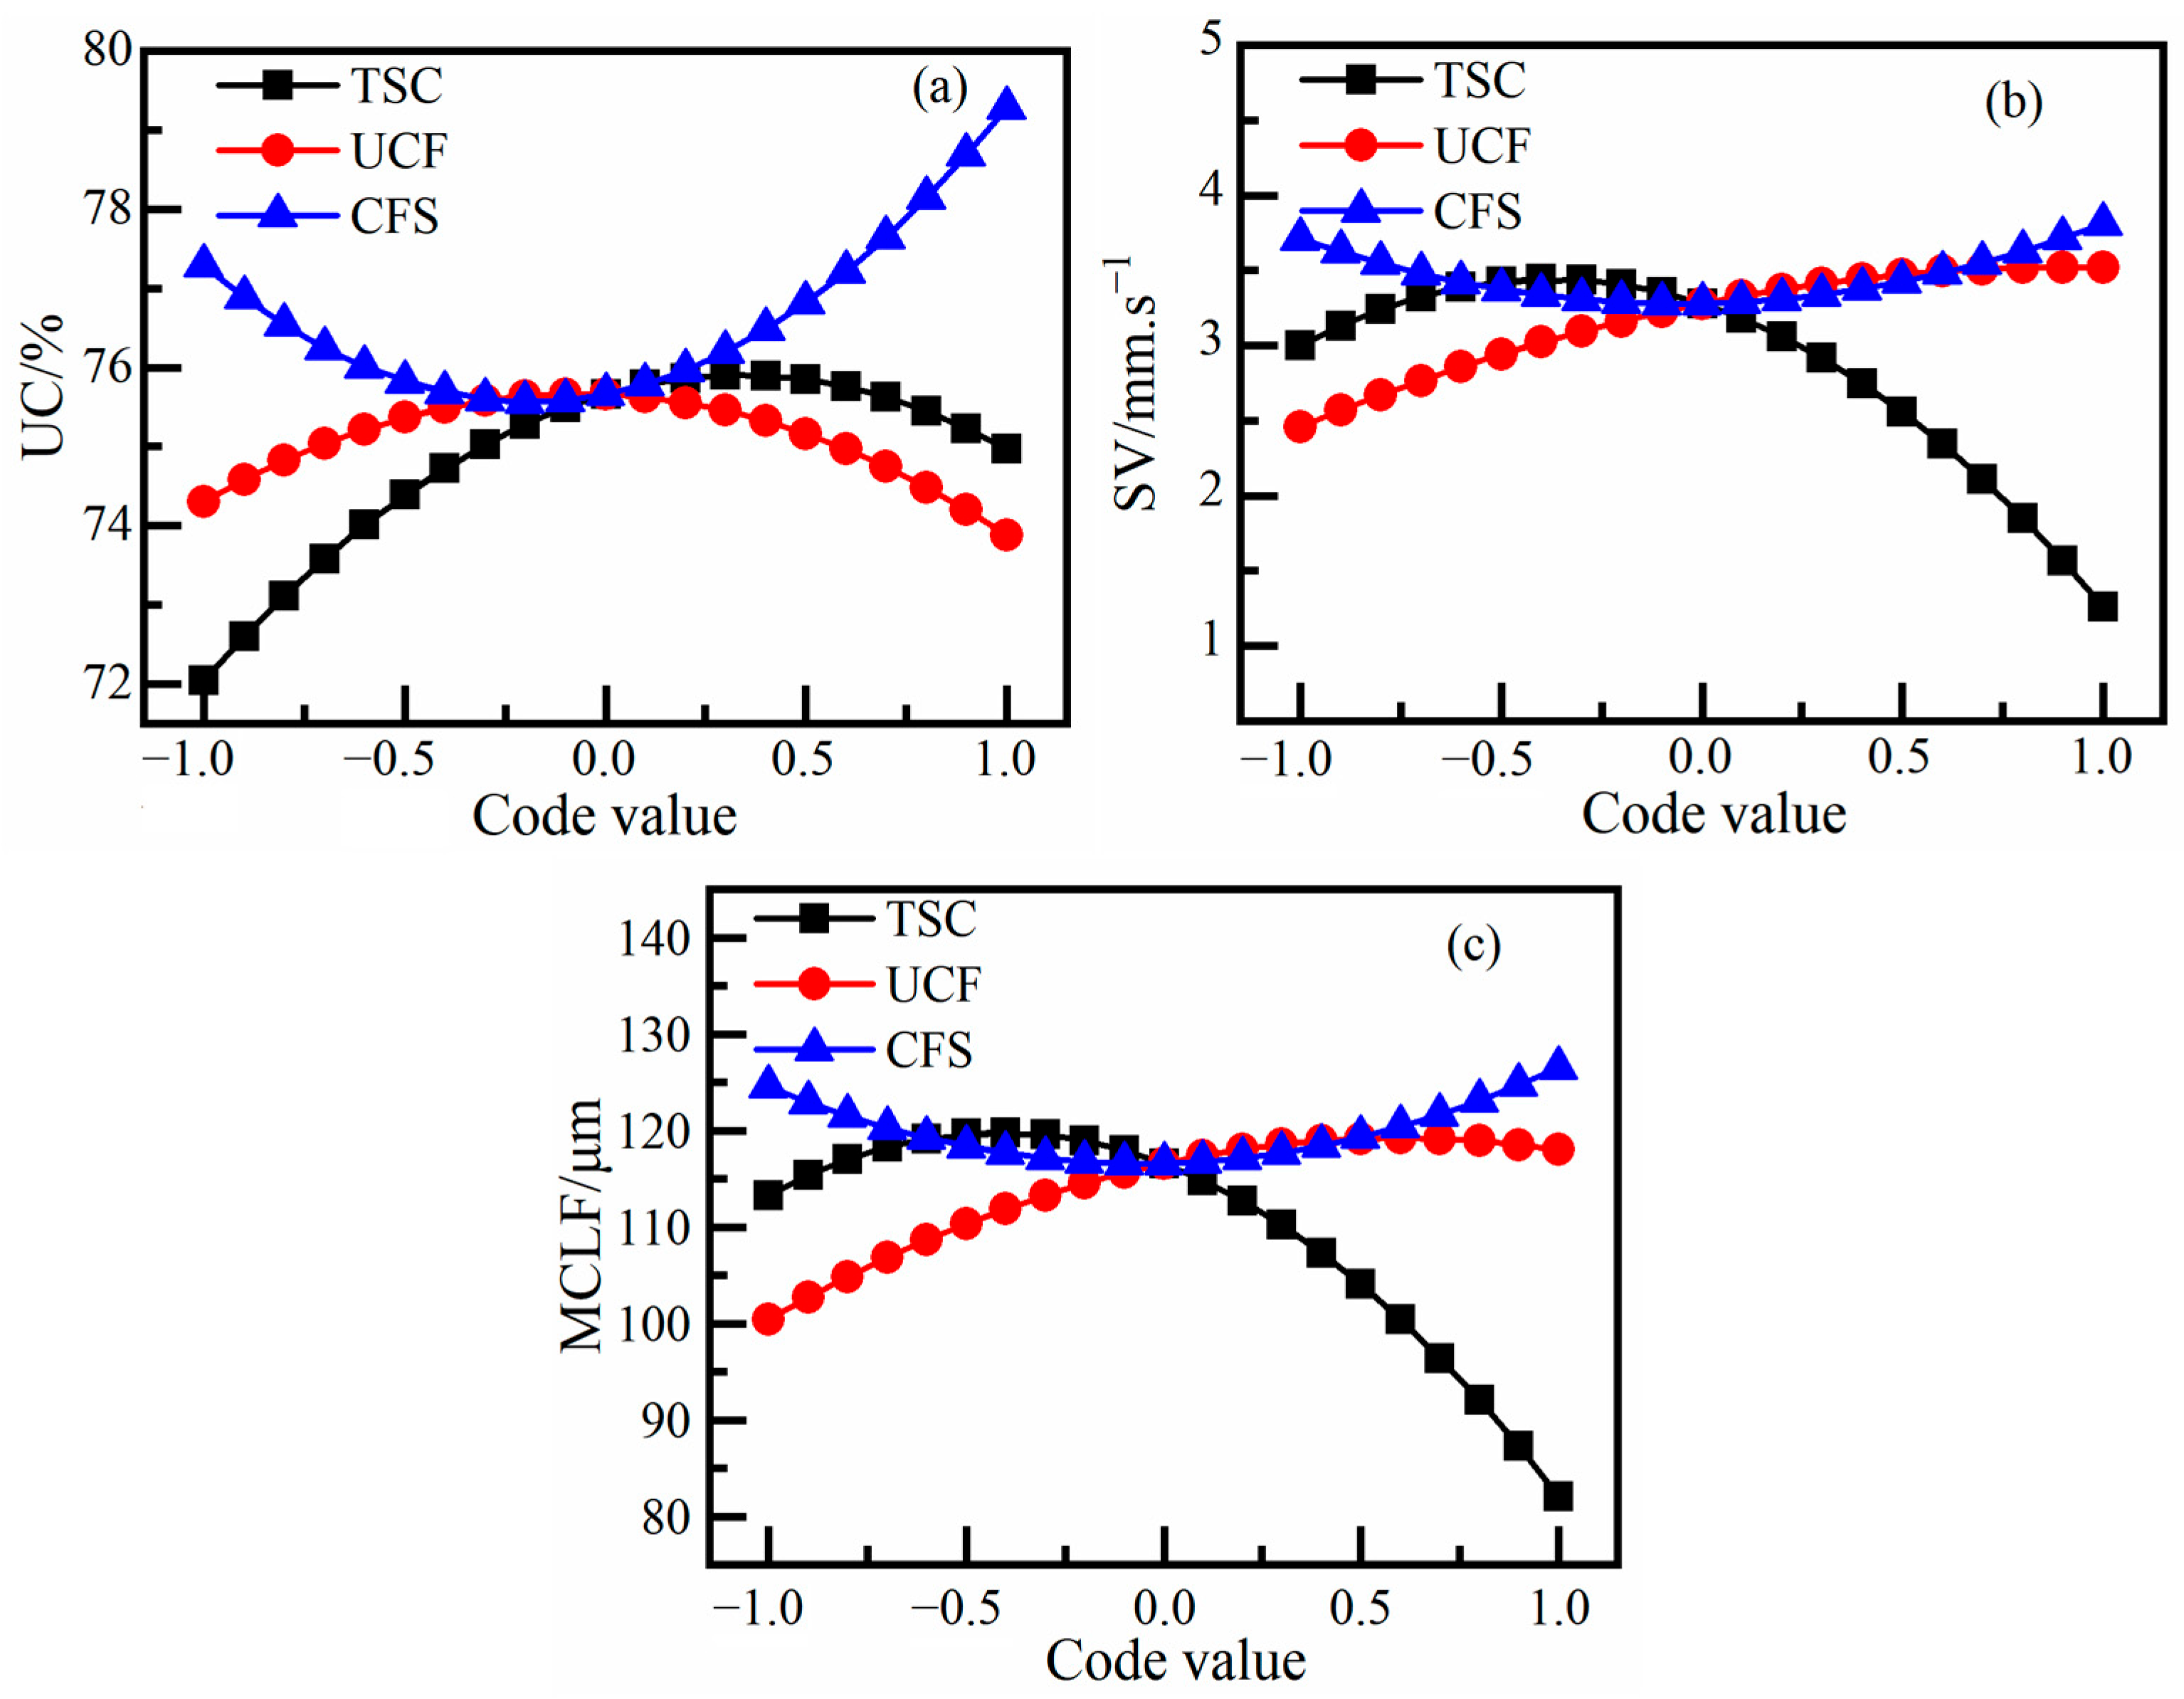
The experimental results and variance analysis of the response surface regression models reveal that the flocculation and settling indicators are not only affected by single factors but also by the factor interactions. In particular, a single factor has a significant impact on each flocculation and settling indicator. Additionally, the UC, SV and MCLF are, respectively, affected by the interaction between the TSC and UCF, UCF and CFS, and TSC and CFS. The influence patterns were analyzed, and the results are shown in Figure 6 and Figure 7. It should be noted that when analyzing the effect of a single factor or an interaction on the flocculation and settling indicators, the other factors were fixed at the 0 coding level.
Figure 6 shows that the UC, SV, and MCLF initially increase and then decrease with increasing TSC. The flocculation and settling effect of tailings is gradually enhanced with increasing TSC. Furthermore, as the TSC approaches the optimal concentration, the UC, SV, and floc structure all increase progressively. At this stage, the floc structure, strength, and spacing of tailings are relatively appropriate, allowing the flocs to be easily disrupted. Slurry viscosity remains low, facilitating the release of water trapped both between and within the flocs. When the TSC exceeds the optimal concentration, the interaction force between the tailings particles is enhanced and the viscosity is also greatly increased, making it more difficult to remove water. Thus, the change in UC becomes less noticeable, while the SV decreases significantly. The high concentration also reduces particle spacing, which enhances shear effects and restricts further floc growth, resulting in smaller flocs [29]. The UC exhibits an initially increasing and then decreasing trend with rising UCF. In addition, the SV and MCLF increase with the UCF, but the rate of increase gradually slows and eventually levels off. This is because the added flocculant enhances inter-floc adhesion and promotes bridging, leading to the formation of large and dense flocs that accelerate sedimentation. However, excessive flocculants can alter the surface properties of flocs, compromising the thickening and dewatering of the tailings slurry [30]. The UC, SV, and MCLF initially increase with rising CFS but subsequently decline. This is because at a higher CFS level, the increase in slurry viscosity hinders the uniform dispersion of the flocculant, resulting in weakened flocculation and sedimentation effects. However, with a further increase in CFS, the increased flocculant content per unit volume overcomes this hindrance, thereby improving flocculation and settling [31].
Meanwhile, Figure 7 shows that at low TSC, the UCF has a pronounced effect on UC, which initially increases and then decreases with rising UCF. In contrast, this influence is diminished at high TSC. This occurs because the ample inter-particle spacing at low TSC allows increased UCF to effectively promote floc formation. However, at high TSC, the particles themselves are prone to collision, and the gain effect of UCF is limited [29,30]. At low CFS, the increase in UCF has a more significant effect on the improvement of SV; however, the effect of UCF on SV is weakened at high CFS. This is because the flocculant disperses more effectively at low CFS, enabling optimal bridging. In contrast, a high CFS can cause localized over-flocculation, which forms unstable settling structures and thereby mitigates the effectiveness of additional UCF [29,30,31]. The MCLF exhibits a trend of first decreasing and then increasing with the rising CFS, and this effect is attenuated at higher TSC. This is because as the CFS increases, the dispersion of the flocculant gradually deteriorates and the bridging efficiency decreases, leading to smaller flocs. However, when the CFS exceeds a critical value, localized over-flocculation forms larger flocs. Meanwhile, at high TSC, the particles become denser and impose a stronger shear that restricts floc growth, resulting in a reduction in floc size [29,30].

4.2.2. Exploration of Flocculation and Settling Mechanism of Superfine Tailings

Based on the flocculation and settling test, and the analysis of influencing factors and influencing laws, this study explored the mechanism of flocculation and settling process of superfine tailings under the action of flocculants. The flocculation and settling is an extremely complex physicochemical process, which is currently widely categorized into three primary types: (a) charge neutralization, (b) bridging flocculation, and (c) enmeshment and sweep flocculation [32,33]. The appropriate flocculant captures and aggregates fine particles, followed by adsorption by high-molecular chains and neutralization in the tailings slurry. The flocs formed by the bridging are interlocked and linked to a network structure, which has a sweeping effect on suspended particles during their settling process, further enhancing the settling effect [20,34]. As the flocs continue to grow and accelerate the sedimentation of tailings, the water between the flocs is constantly squeezed out, and the underflow concentration keeps increasing, achieving solid–liquid separation [35]. The flocculation and settling process of superfine tailings is shown in Figure 8.

4.3. Verification and Predictive Analysis of RSM Models

To evaluate the universality and prediction accuracy of the established RSM model, validation experiments were carried out based on reliability analysis. The experimental design scope was set according to the multi-objective optimization ratio determined by Design-Expert, namely, a TSC of 19.58%, a UCF of 15.98 g/t, and a CFS of 0.4%. A comparison between the test results and the model prediction results is shown in Table 7.
The comparison between test values and model prediction values revealed relative errors of less than 3%. This demonstrates that the established RSM model possesses high accuracy and reliable predictive capability, making it suitable for optimizing and predicting the flocculation sedimentation parameters of superfine tailings.

4.4. Multi-Objective Desirability Optimization of Flocculation and Settling Parameters

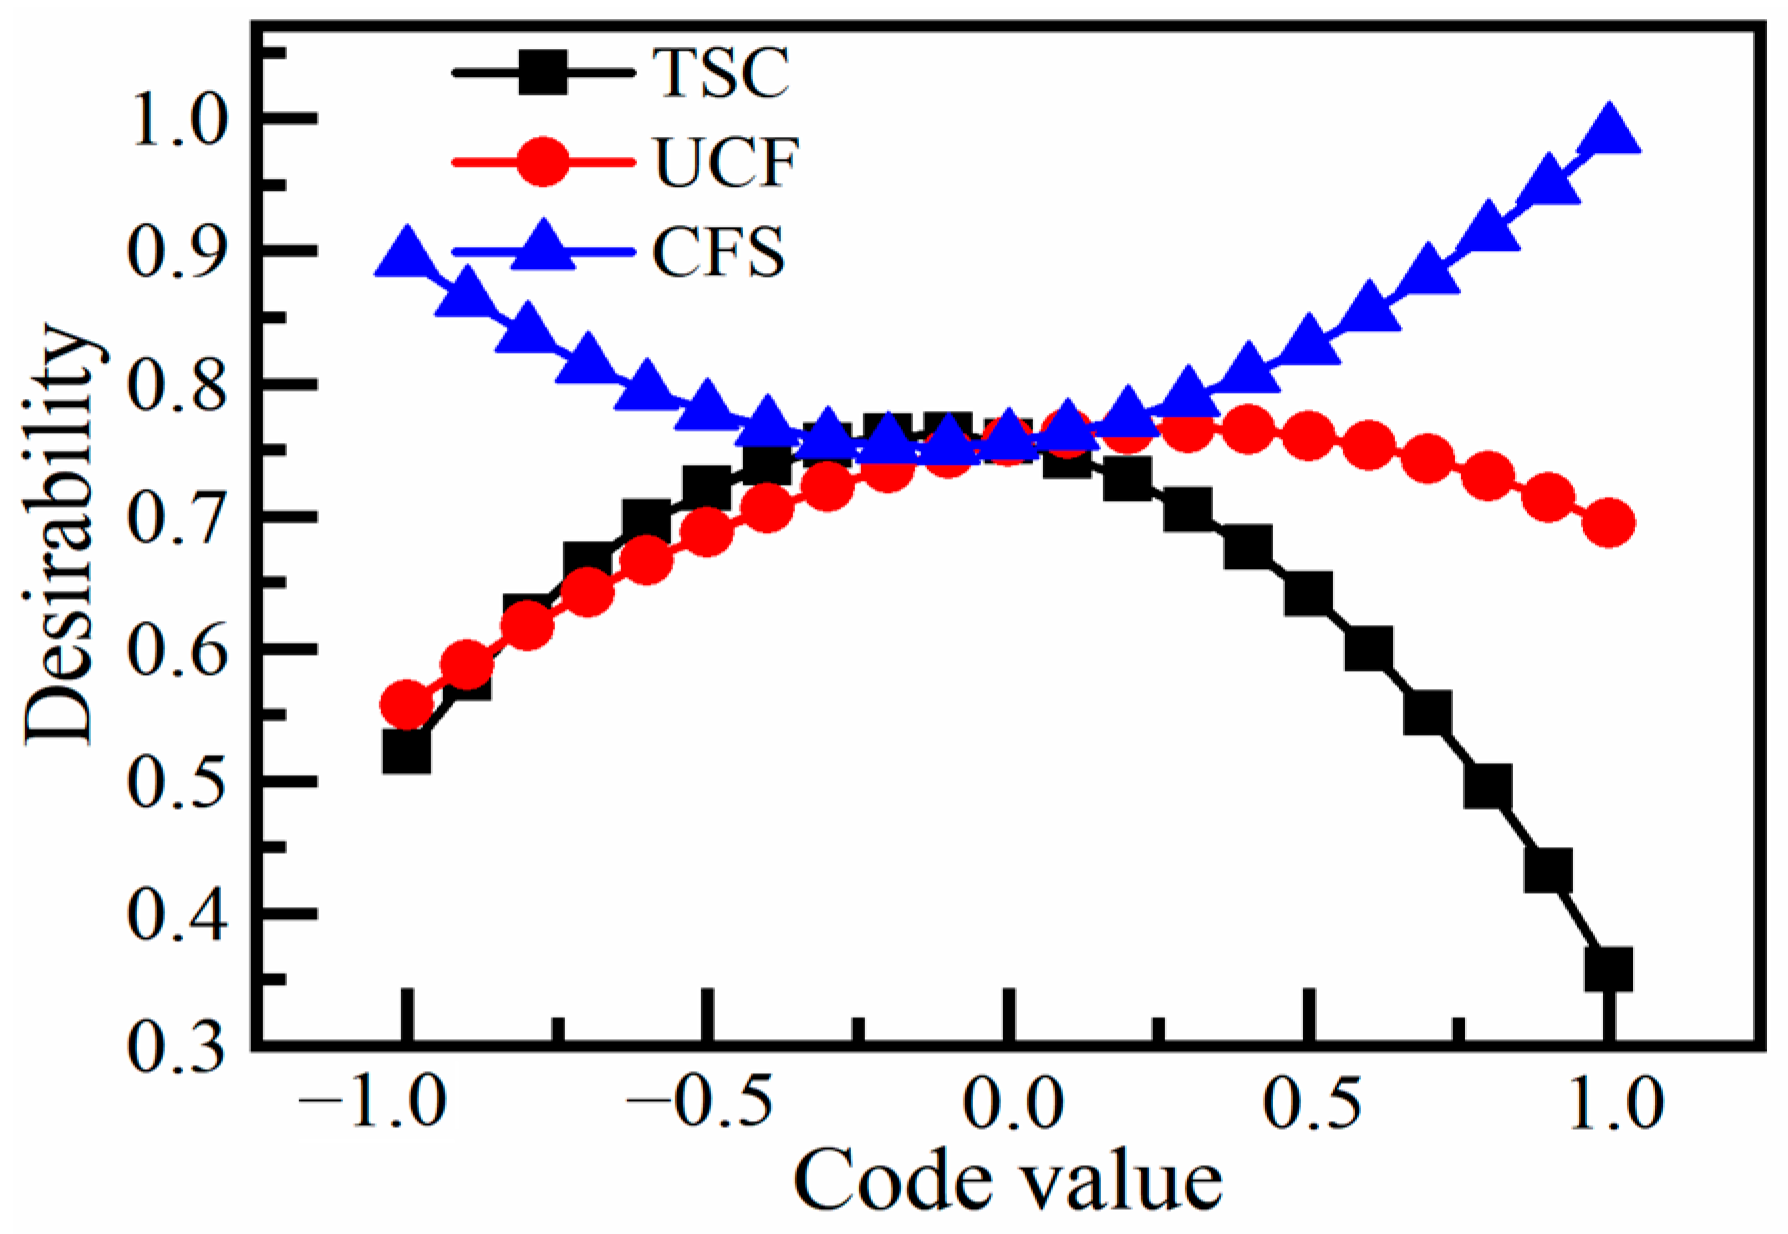
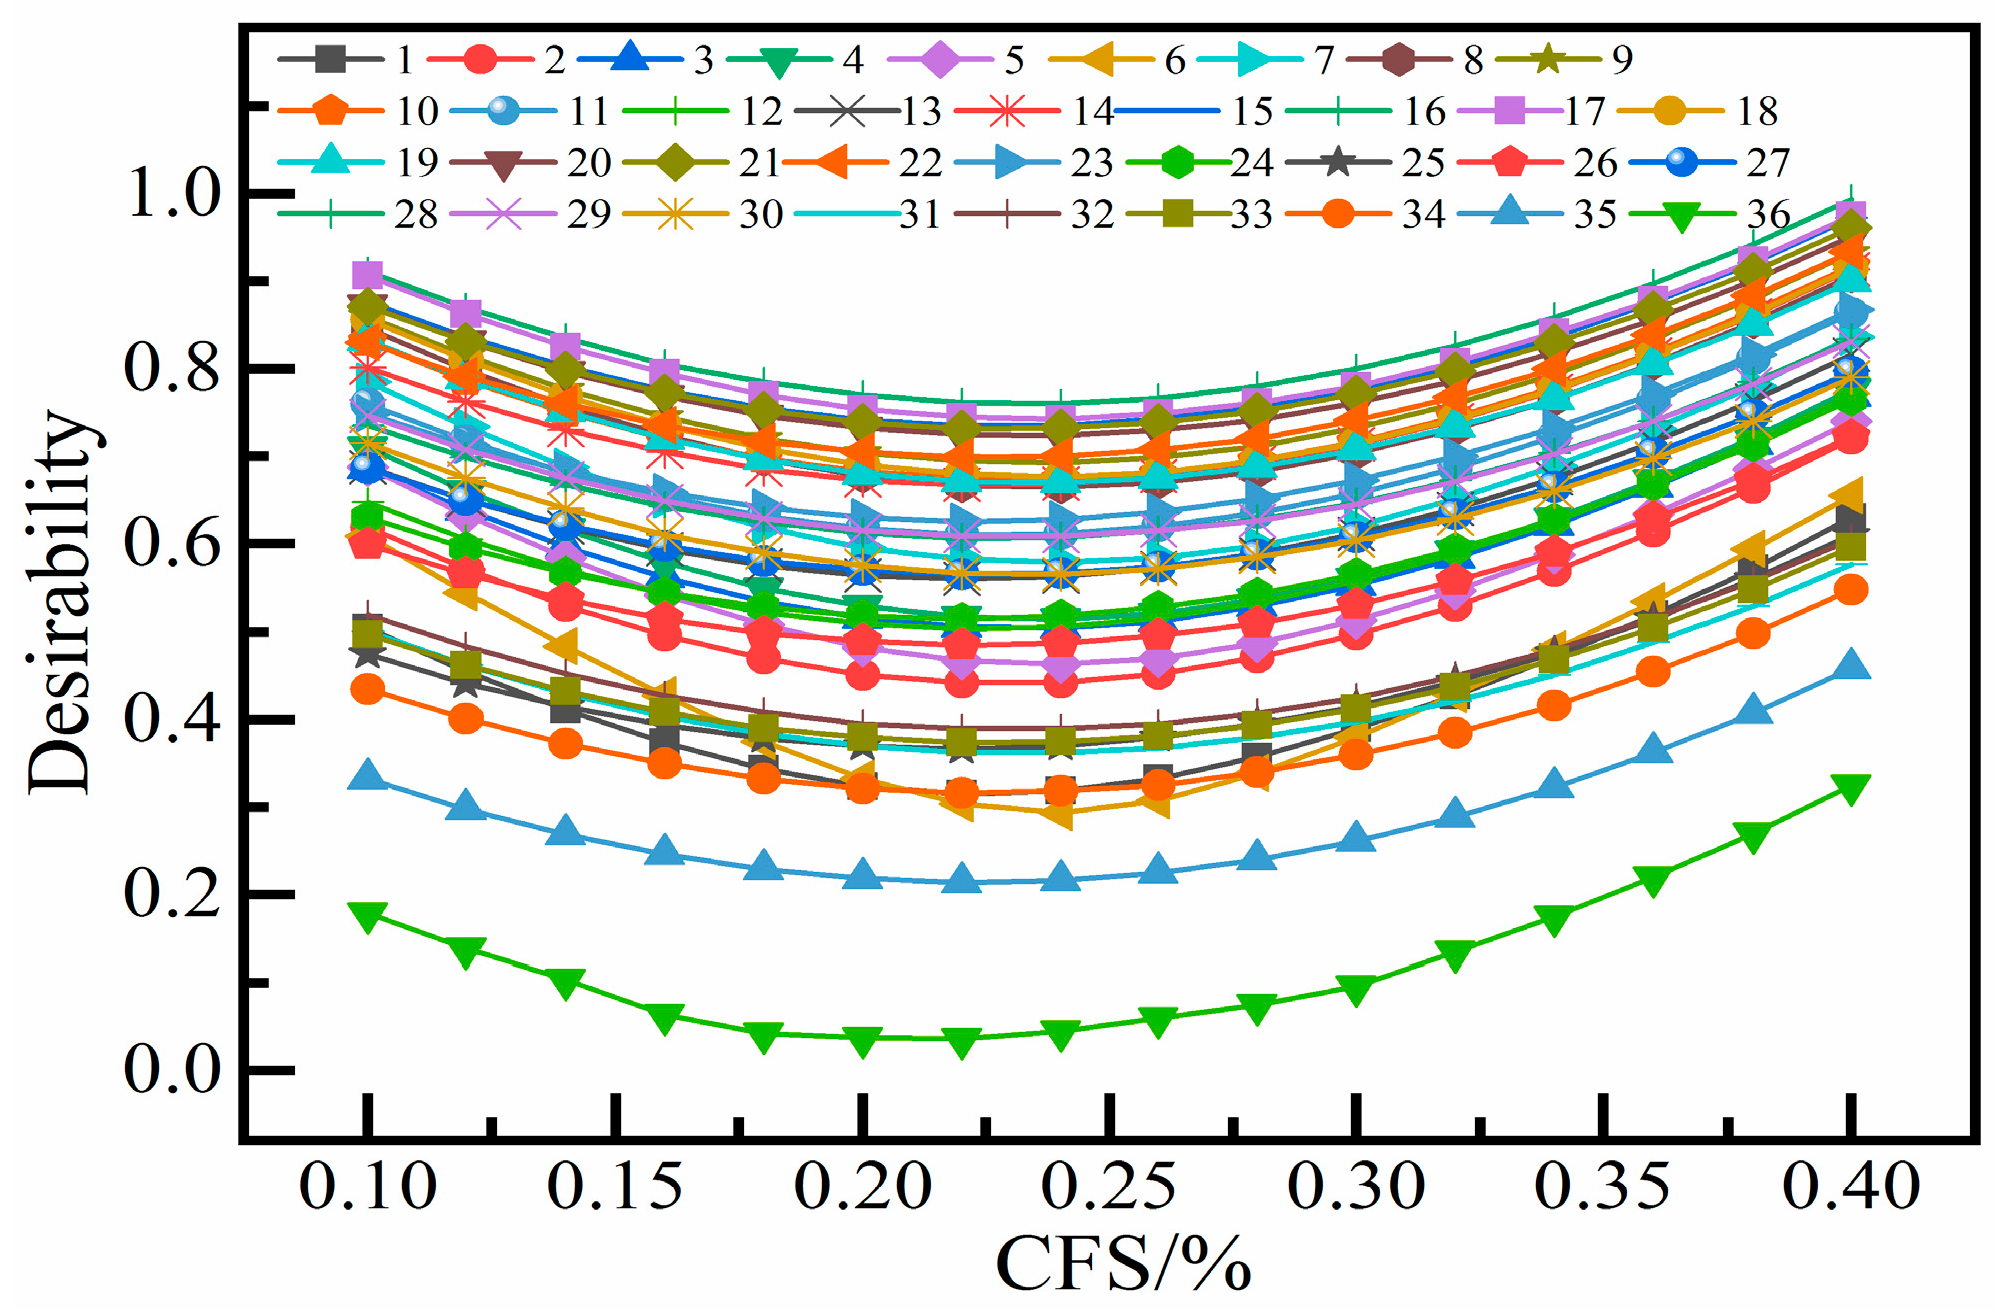
To obtain the optimal flocculation and settling effect, the ratios of the TSC, UCF, and CFS were optimized using a desirability function. Since higher values of UC, SV, and MCLF are more desirable, a single desirability function is established based on the response surface regression model described in Equation (2a), as shown in Equation (6a, c). The desirability of each response is first quantified, and their weighted geometric average is then calculated to form a composite function, termed the overall desirability, which serves as the multi-objective optimization function [21,26,36]. Each response weight was set equal to 1 (e1 = e2 = e3 = 1; Equation (7)). Figure 9 and Figure 10 illustrate the individual and interactive effects of the factors on the overall desirability of the flocculation and settling effect, respectively. The overall desirability of the flocculation and settling effect initially increases and then decreases with rising TSC, peaking between 19% and 20%. The same trend is observed for UCF, reaching a maximum at approximately 16 g/t. In contrast, the desirability decreases with increasing CFS, peaking at approximately 0.4%. The 16th set (TSC=19%; UCF=16 g/t; CFS= 0.4%) achieved an overall desirability of 0.994, identifying it as the optimum. This close agreement with the optimal ratio generated by Design-Expert (TSC=19.58%; UCF=15.98 g/t; CFS=0.4%) further verifies the models accuracy.
d y 1 = 0   if   y 1 < 69.78   y 1 69.78 78.96 69.78   if   69 . 78 y 1 78.96 1   if   y 1 > 78.96
d y 2 = 0   if   y 2 < 0.53   y 2 0.53 4.15 0.53   if   0.53 y 2 4.15 1   if   y 2 > 4.15
d y 3 = 0   if   y 3 < 53.6 y 3 53.6 124.6 53.6   if   53 . 6 y 3 124.6 1   if   y 3 > 124.6
D = i = 1 k d y i e i 1 e i = d y 1 × d y 2 × d y 3 1 3
A comprehensive analysis shows that the established RSM model has high reliability. Meanwhile, the model is used to predict the overall optimal ratio, corresponding to UC, SC, and MCLF values of 78.71%, 4.26 mm/s, and 127.8 μm, respectively. Compared to the current thickening parameters of Zhongguan Iron Mine, the optimization not only reduces the flocculant consumption from 25 g/t to 16 g/t, but also increases the underflow concentration from about 75% to about 78%. The optimized parameters provide a practical guideline for flocculation and settling of superfine tailings at the Zhongguan Iron Mine, while also informing the optimization of thickening processes in similar mines.

5. Conclusions

To address the poor solid–liquid separation effect of superfine tailings, this study optimized the flocculation and settling parameters in order to improve the flocculation and settling effect. The response surface method was implemented to design and perform experiments related to the impacts of the TSC, UCF, CFS, and their interactions on the UC, SV, and MCLF. The response surface regression models of UC, SV, and MCLF were established based on 17 test group results, and their statistical significance and predictive accuracy were analyzed and experimentally validated. Subsequently, the desirability function method was used to establish the single-factor desirability function and the overall desirability function. The optimal flocculation and settling parameters and the corresponding responses were determined as follows: a TSC of 19%, a UCF of 16 g/t, and a CFS of 0.4%, corresponding to UC, SV, and MCLF values of 78.71%, 4.26 mm/s, and 127.8 μm, respectively. The determined optimal parameters can be directly applicable for improving the tailings thickening efficiency at Zhongguan Iron Mine. More importantly, the proposed models can provide valuable information for the optimization of thickening processes in similar mines.

Author Contributions

Conceptualization, Z.W. and S.S.; methodology, Z.W., S.S. and B.G.; software, Z.W., J.F. and H.Z.; validation, Z.W. and H.Z.; investigation, Z.W. and S.S.; resources, S.S., J.F. and S.H.; data curation, Z.W. and H.Z.; writing—original draft, Z.W. and B.G.; writing—review and editing, Z.W., J.F. and B.G.; visualization, Z.W.; supervision, S.S., J.F. and S.H.; project administration, S.S., J.F. and S.H.; formal analysis, Z.W. and S.S.; funding acquisition, S.S. All authors have read and agreed to the published version of the manuscript.

Funding

This research was funded by the National Key Research and Development Program Funding Project Plan of China, grant number: 2023YFC2907203; the 2022 Shandong Provincial Key R&D Plan (Major Scientific and Technological Innovation Project) Project Plan of China, grant number: 2022CXPT032; and the National Key S &T Special Project of China on Deep Earth, grant number: 2025ZD1010703.

Data Availability Statement

The data presented in this study are available from the corresponding author upon request.

Acknowledgments

The authors are grateful for the help and support of Hebei Iron & Steel Group Shahe Zhongguan Iron Ore Co., Ltd., in providing the tailings and flocculants. The authors gratefully acknowledge the funding support of the Ministry of Science and Technology of the Peoples Republic of China and the Department of Science and Technology of Shandong Province, China.

Conflicts of Interest

Zhenjiang Wen, Shihu Shi, Biyao Geng, Jianxun Fu, Si Huo, and Huan Zhang are employees of China ENFI Engineering Corporation. The paper reflects the views of the scientists and not the company.

References

  1. Avadiar, L.; Leong, Y.K.; Fourie, A. Effects of polyethylenimine dosages and molecular weights on flocculation, rheology and consolidation behaviors of kaolin slurries. Powder Technol. 2014, 254, 364–372. [Google Scholar] [CrossRef]
  2. Qi, C.; Fourie, A. Cemented paste backfill for mineral tailings management: Review and future perspectives. Min. Eng. 2019, 144, 106025. [Google Scholar] [CrossRef]
  3. Jiao, H.Z.; Wang, S.F.; Yang, Y.X.; Chen, X.M. Water recovery improvement by shearing of gravity-thickened tailings for cemented paste backfill. J. Clean. Prod. 2020, 245, 118882. [Google Scholar] [CrossRef]
  4. Arjmand, R.; Massinaei, M.; Behnamfard, A. Improving flocculation and dewatering performance of iron tailings thickeners. J. Water Process Eng. 2019, 31, 100873. [Google Scholar] [CrossRef]
  5. Lu, Q.; Yan, B.; Xie, L.; Huang, J.; Liu, Y.; Zeng, H. A two-step flocculation process on oil sands tailings treatment using oppositely charged polymer flocculants. Sci. Total Environ. 2016, 565, 369–375. [Google Scholar] [CrossRef]
  6. Tanguay, M.; Fawell, P.; Adkins, S. Modelling the impact of two different flocculants on the performance of a thickener feedwell. Appl. Math. Model. 2014, 38, 4262–4267. [Google Scholar] [CrossRef]
  7. Jiao, H.; Wang, H.; Wu, A.; Ji, X.; Yan, Q.; Li, X. Rule and mechanism of flocculation sedimentation of unclassified tailings. J. Univ. Sci. Technol. Beijing 2010, 32, 702–707. [Google Scholar]
  8. Nguyen, T.P.; Hankins, N.P.; Hilal, N. Effect of chemical composition on the flocculation dynamics of latex-based synthetic activated sludge. J. Hazard. Mater. 2007, 139, 265–274. [Google Scholar] [CrossRef]
  9. Botha, L.; Soares, J.B.P. The influence of tailings composition on flocculation. Can. J. Chem. Eng. 2015, 93, 1514–1523. [Google Scholar] [CrossRef]
  10. Konduri, M.K.R.; Fatehi, P. Influence of pH and ionic strength on flocculation of clay suspensions with cationic xylan copolymer. Colloid. Surf. A 2017, 530, 20–32. [Google Scholar] [CrossRef]
  11. Li, S.; Gao, L.; Cao, Y.; Gui, X.; Li, Z. Effect of pH on the flocculation behaviors of kaolin using a pH-sensitive copolymer. Water Sci. Technol. 2016, 74, 729–737. [Google Scholar] [CrossRef] [PubMed]
  12. Wang, X.; Zhao, J. Optimal flocculating sedimentation parameters of unclassified tailings slurry. J. Cent. South Univ. 2016, 47, 1675–1681. [Google Scholar] [CrossRef]
  13. Wang, X.; Zhao, J.; Zhang, D. Optimal prediction model of flocculating sedimentation velocity of unclassified tailings. Chin. J. Nonferrous Met. 2015, 25, 793–798. [Google Scholar]
  14. Önal, G.; Özer, M.; Arslan, F. Sedimentation of clay in ultrasonic medium. Miner. Eng. 2003, 16, 129–134. [Google Scholar] [CrossRef]
  15. Heath, A.R.; Fawell, P.D.; Bahri, P.A.; Swift, J.D. Estimating average particle size by focused beam reflectance measurement (FBRM). Part. Part. Syst. Charact. 2015, 19, 84–95. [Google Scholar] [CrossRef]
  16. Senaputra, A.; Jones, F.; Fawell, P.D.; Smith, P.G. Focused beam reflectance measurement for monitoring the extent and efficiency of flocculation in mineral systems. AIChE J. 2014, 60, 251. [Google Scholar] [CrossRef]
  17. Yu, R. Selection research of filling materials. In Theory and Engineering Practice of Cemented Filling in Metal Mines; Metallurgical Industry Press: Beijing, China, 2020; pp. 17–18. [Google Scholar]
  18. Wang, H.; Yang, Y.; Guo, J. Thickening dehydration performance and flocculation mechanism of ultrafine tailings based on dual flocculation. J. Cent. South Univ. (Sci. Technol.) 2023, 54, 3597–3608. [Google Scholar]
  19. GB/T 51450-2022; Technical Standard for Metal and Non-metal Mine Filling Engineering. China Planning Press: Beijing, China, 2022.
  20. Ruan, Z.; Wu, A.; Wang, J.; Yin, S.; .Wang, Y. Flocculation and settling behavior of unclassified tailings based on measurement of floc chord length. Chin. J. Eng. 2020, 42, 980–987. [Google Scholar]
  21. Wu, A.; Ruan, Z.; Bürger, R.; Yin, S.; Wang, J.; Wang, Y. Optimization of flocculation and settling parameters of tailings slurry by response surface methodology. Miner. Eng. 2020, 156, 106488. [Google Scholar] [CrossRef]
  22. Mason, R.L.; Gunst, R.F.; Hess, J.L. Statistical Design and Analysis of Experiments with Applications to Engineering and Science, 2nd ed.; Wiley-Interscience: Hoboken, NJ, USA, 2003. [Google Scholar]
  23. Zhang, L. Study for Multiple Response Optimization Based on Robust Parameter Design. Ph.D. Thesis, Nanjing University of Science and Technology, Nanjing, China, 2015. [Google Scholar]
  24. Zhao, G.; Ma, J.; Peng, K.; Yang, Q.; Zhou, L. Mix ratio optimization of alpine mine backfill based on response surface method. J. Univ. Sci. Technol. Beijing 2013, 35, 559–565. [Google Scholar]
  25. Candioti, L.V.; De Zan, M.M.; Cámara, M.S.; Goicoechea, H.C. Experimental design and multiple response optimization. Using the desirability function in analytical methods development. Talanta 2014, 124, 123–138. [Google Scholar] [CrossRef] [PubMed]
  26. Wu, H.; Zhao, G.; Chen, Y. Multi-objective optimization for mix proportioning of mine filling materials. J. Harbin Inst. Technol. 2017, 49, 101–108. [Google Scholar] [CrossRef]
  27. Wu, H.; Zhao, G.; Chen, Y.; Zhang, H. Optimization of Mix Proportioning of Mine Filling Materials Using RSM-DF Experiments Design Method. J. Basic. Sci. Eng. 2019, 27, 453–461. [Google Scholar]
  28. Wen, Z.; Yang, X.; Li, L.; Gao, Q.; Wang, Z. Selection and optimization of flocculation sedimentation parameters of unclassified tailings slurry based on RSM-BBD. Chin. J. Nonferrous Met. 2020, 30, 1437–1445. [Google Scholar]
  29. Yang, L.; Wang, H.; Wu, A.; Li, H.; Chen, C.; Huo, C. Effect of flocculation settling on rheological characteristics of full tailing slurry. J. Cent. South Univ. 2016, 47, 3523–3529. [Google Scholar] [CrossRef]
  30. Murthy, S.N.; Novak, J.T. Influence of cations on activated-sludge effluent quality. Water Environ. Res. 2001, 73, 30–36. [Google Scholar] [CrossRef]
  31. Peng, N.; Wu, A.; Wang, H.; Sun, W.; Chen, H. Research on Flocculation Sedimentation Technology of Unclassified-tailings. Min. Res. Dev. 2015, 35, 35–38. [Google Scholar]
  32. Cong, J.; Peng, J.; Tu, B.; Liu, Y.; Wang, H.; Ji, X.; Feng, J. Effect and mechanism of sodium hexametaphosphate on the flocculation sedimentation behaviors of ultrafine iron tailings. Met. Mine 2022, 08, 138–145. [Google Scholar]
  33. Yang, Y.; Wu, A.; Klein, B.; Wang, H. Effect of primary flocculant type on a two-step flocculation process on iron ore fine tailings under alkaline environment. Miner. Eng. 2019, 132, 14–21. [Google Scholar] [CrossRef]
  34. Sui, C.; Wang, X.J.; Wang, X.M.; Zeng, Q.; Wang, H.; Liu, J. Study on the flocculation law and mechanism of APAM unit consumption to different particle size in the flocculation and sedimentation of tailings. Min. Res. Dev. 2020, 40, 67–74. [Google Scholar]
  35. Pang, J.; Li, S.; Peng, L.; Fan, J. Flocculation and settlement characteristics and thickening mechanism of difficult-to-settle fine tailings. Min. Res. Dev. 2025, 45, 43–51. [Google Scholar]
  36. Wang, Y.; Wang, M.; Wang, L.; Yuan, Z. Optimizing complex enzymatic extraction of Chaenomeles cathayensisjuice by response surface methodology combined with desirability function analysis. China Brew. 2011, 9, 88–92. [Google Scholar]
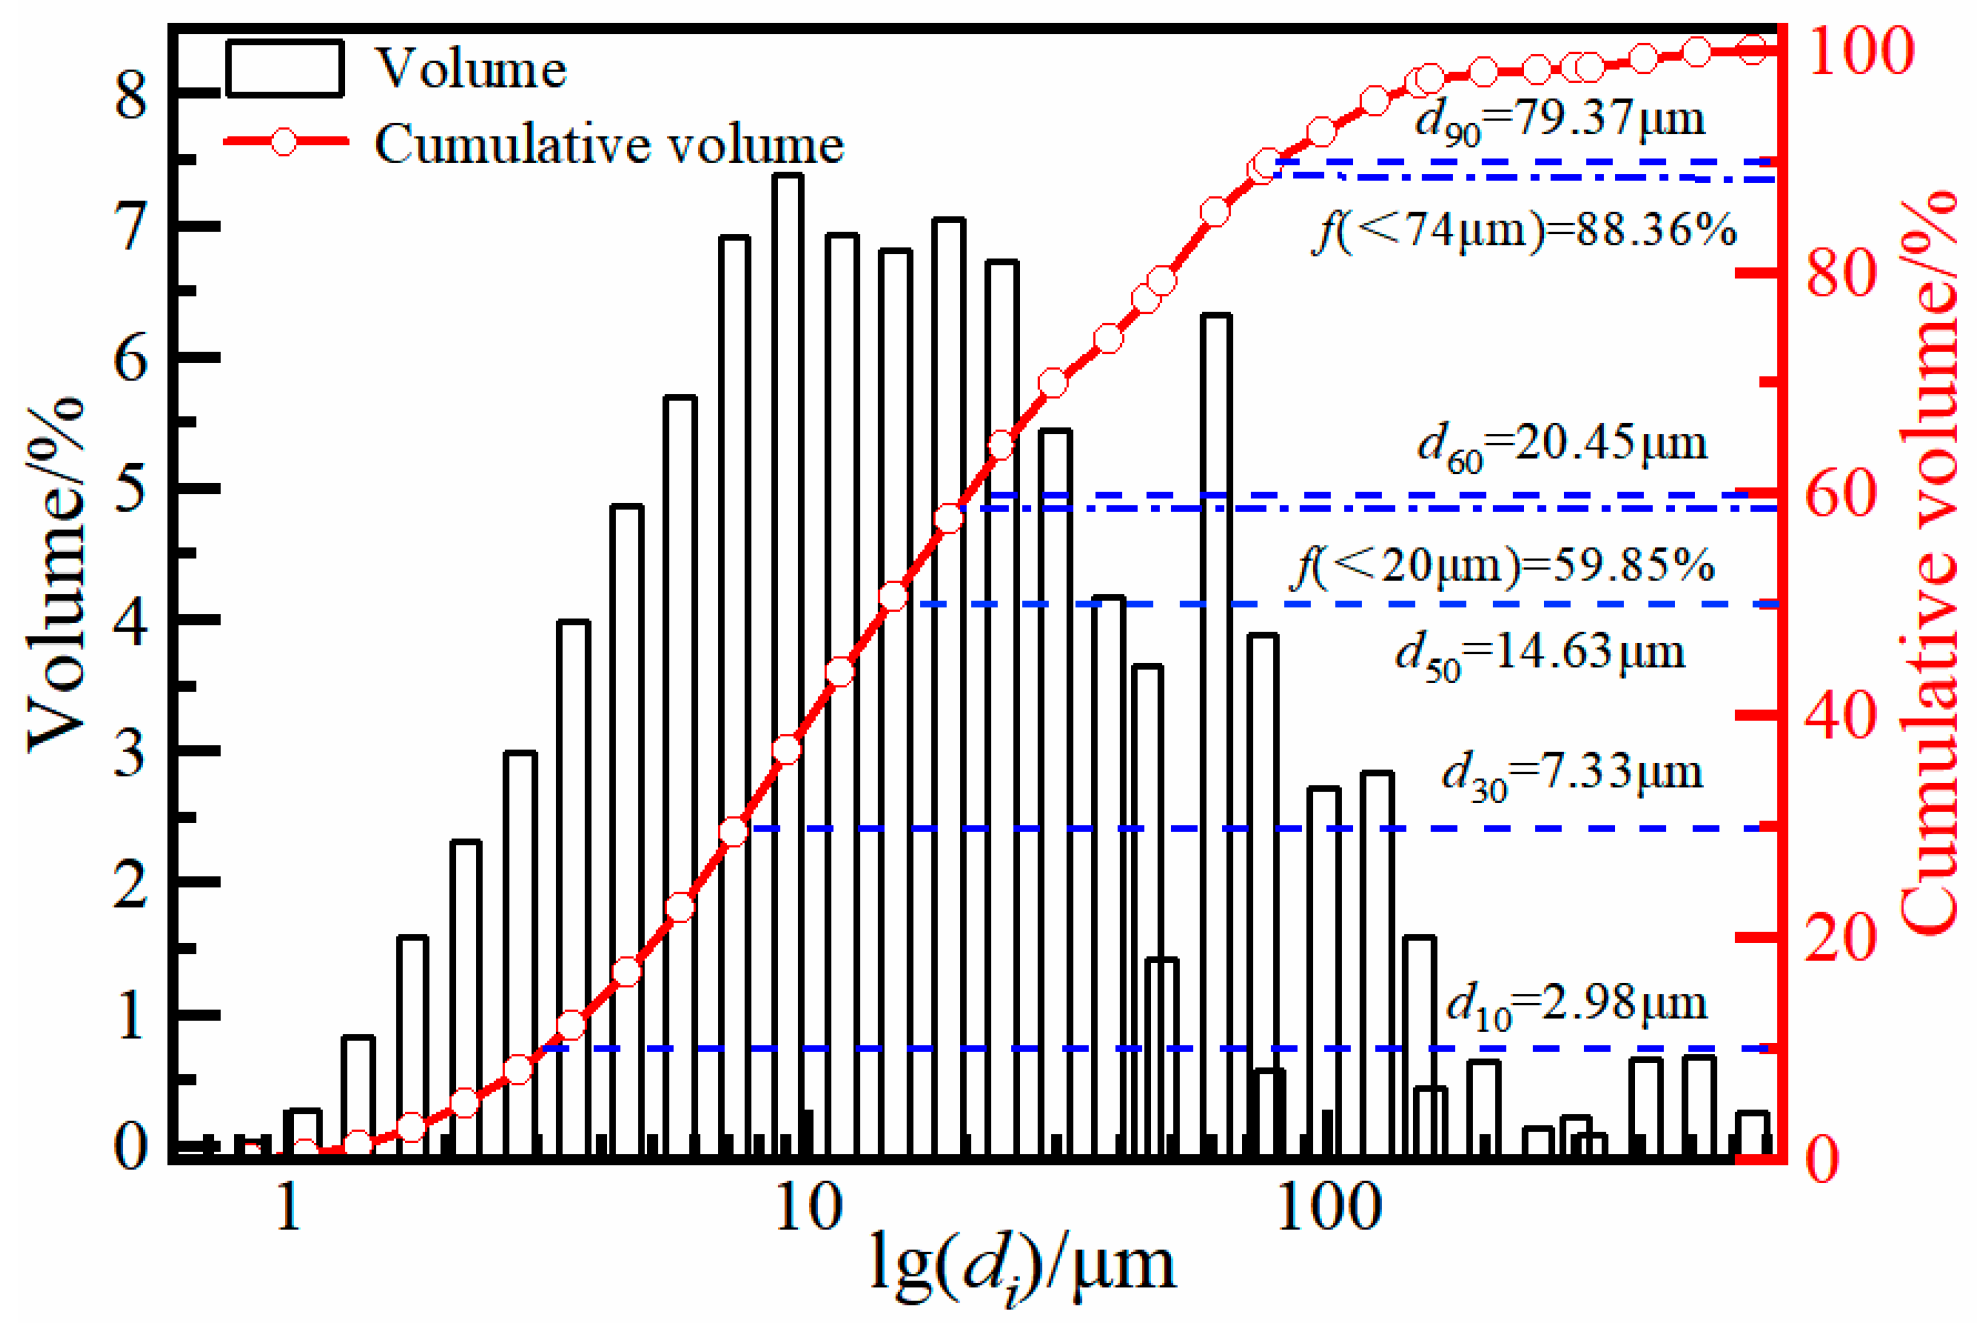
Figure 1. The PSD of the tailings samples.
Minerals 15 01216 g001
Figure 2. The process of flocculation and settling test: (a) preparation of flocculant solution and tailings slurry; (b) add flocculant to the tailings slurry and stir to mix evenly; (c) standing and settling of tailings slurry; (d) observe and record the CIH, and measure the UC.
Minerals 15 01216 g002
Figure 3. Schematic diagram of the FRBM test device and chord length test principle.
Minerals 15 01216 g003
Figure 4. Settling curves of the tailings slurry under different flocculants.
Minerals 15 01216 g004
Figure 5. Three-dimensional relative error diagram of the response surface model.
Minerals 15 01216 g005
Figure 6. Effect of single factors on the response: (a) UC; (b) SV; (c)MCLF.
Minerals 15 01216 g006
Figure 7. Effect of factor interactions on the response: (a) effect of TSC-UCF interaction on UC; (b) effect of UCF-CFS interaction on SV; (c) effect of TSC-CFS interaction on MCLF.
Minerals 15 01216 g007
Figure 8. Schematic diagram of the flocculation and settling process of superfine tailings.
Minerals 15 01216 g008
Figure 9. Overall desirability of the flocculation and settling effect under a single factor.
Minerals 15 01216 g009
Figure 10. Overall desirability of the flocculation and settling effect under all factors.
Minerals 15 01216 g010
Table 1. Test results of physical properties of tailings.
Physical PropertiesDensity/(t·m−3)Loose Bulk Density/(t·m−3)Tamped Bulk Density/%Void Fraction/%
Test result 2.951.592.0846.10
Table 2. Test results of the main chemical components of tailings.
Chemical CompositionCaOSiO2Fe2O3MgOAl2O3Na2OK2OP2O5Other
Content/% 35.8834.5210.606.284.870.660.520.296.38
Table 3. Experimental results of flocculation and settling of the three flocculant types.
TypeTSC */%UCF/(g·t−1)CFS */%UC */%
APAM-1500 20150.277.86
CPAM-6067.39
NPAM-1000 75.62
* TSC, CFS, and UC all refer to the corresponding mass concentrations; the same below.
Table 4. Response variable factors and variables.
Influence FactorCode ValueCode Level
−101
TSC/%x1152025
UCF/g·t−1x2101520
CFS/%x30.10.20.4
Table 5. Experimental design and results.
No.Code ValueTest ResultsPrediction Results
TSC
x1/%
UCF
x2/g·t−1
CFS
x3/%
UC
y1/%
SV
y2/mm·s−1
MCLF
y3/μm
UC
y1/%
SV
y2/mm·s−1
MCLF
y3/μm
101177.153.96123.0078.563.97123.61
200075.663.28116.6176.623.26116.50
3−11069.783.17115.4270.813.24110.93
40−1177.672.96113.1178.383.02112.82
511073.231.4688.9071.211.4989.20
601−176.274.15124.6373.764.08123.61
7−1−1070.742.21103.1469.732.18102.80
810−175.771.5691.2276.681.6190.63
900075.663.28116.6176.623.26116.52
10−10−173.883.42118.0173.963.46119.41
1100075.663.28116.6076.623.26116.53
12−10175.883.57119.5275.373.49121.72
131−1073.990.5353.6373.550.5155.31
1410178.961.8797.4275.991.8396.62
1500075.663.28116.6076.623.26116.54
160−1−175.732.82111.4173.552.81111.31
1700075.663.28116.6476.623.26116.50
Table 6. Analysis of variance using the regression model of the different response surfaces.
SourceSum of SquaresMean SquareF Valuep-Value Prob > F
y1y2y3y1y2y3y1y2y3y1y2y3
Model82.1515.1347.619.131.685.2943.9220021.28<10−4<10−43 × 10−4
x117.026.0619.517.026.0619.581.9272178.42<10−4<10−4<10−4
x20.362.246.250.362.246.251.7426625.13<10−4<10−4<10−4
x38.020.020.088.020.020.0838.592.500.314 × 10−43 × 10−4<10−4
x1219.535.6015.819.535.6015.0893.9966760.65<10−4<10−41 × 10−4
x2210.40.352.3210.40.352.3250.0241.139.342 × 10−40.00040.0184
x3228.820.973.3028.820.973.30138.711512.36<10−4<10−40.0083
x1 × 20.011 × 10−41.320.011 × 10−41.320.050.015.325 × 10−40.91620.8326
x1x30.356 × 10−30.060.356 × 10−30.061.700.760.220.65180.84182 × 10−4
x2x30.280.030.030.280.030.031.353.240.110.28318 × 10−40.7504
Residual1.450.061.740.218 × 10−30.25
Pure Error000000
Table 7. Results of model validation test.
No.FactorsUC y1/%SV y2/mm.s−1MCLF y3/μm
TSC/%UCF
/g·t−1
CFS
/%
TRPRRE/%TRPRRE/%TRPRRE/%
V117140.375.4474.601.123.593.531.58119.11117.511.36
V217120.272.6073.591.343.193.151.36113.99112.731.12
V319.5815.980.479.9578.991.224.244.200.87125.40126.851.14
V421160.176.5977.411.063.923.861.43121.91120.191.43
V521180.477.0278.732.224.094.080.24123.8123.380.34
Notes: TR, PR, and RE are test value, prediction value, and relative error, respectively.
Disclaimer/Publisher’s Note: The statements, opinions and data contained in all publications are solely those of the individual author(s) and contributor(s) and not of MDPI and/or the editor(s). MDPI and/or the editor(s) disclaim responsibility for any injury to people or property resulting from any ideas, methods, instructions or products referred to in the content.