Article

Correlation Analysis Between Pore Structure and Mechanical Strength of Mine Filling Materials Based on Low-Field NMR and Fractal Theory

1
School of Resources and Environmental Engineering, Wuhan University of Technology, Wuhan 430070, China
2
Tibet Huatailong Mining Development Co., Ltd., Lhasa 850200, China
3
Changsha Institute of Mining Research Co., Ltd., Changsha 410012, China
4
State Key Laboratory of Metal Mine Safety Technology, Changsha 410012, China
5
Department of Project Management, Hunan Vocational College of Engineering, Changsha 410151, China
6
School of Resources and Safety Engineering, Central South University, Changsha 410083, China
*
Author to whom correspondence should be addressed.
Minerals 2025, 15(11), 1211; https://doi.org/10.3390/min15111211
Submission received: 19 October 2025 / Revised: 10 November 2025 / Accepted: 15 November 2025 / Published: 17 November 2025
(This article belongs to the Special Issue Advances in Mine Backfilling Technology and Materials, 2nd Edition)

Abstract

Filling mining offers significant technical advantages in controlling rock mass movement and preventing disasters. Investigating the correlation between the macro- and micro-scale characteristics of filling materials will help optimize this process. The paper analyzes the variation patterns and mechanisms of the pore structure and mechanical strength characteristics of the filling body based on low-field nuclear magnetic resonance (NMR) technology and fractal theory, exploring the relationship between microstructure and macroscopic features. Results indicate that as the cement-to-sand ratio or mass concentration decreases, the total pore structure count in the filling material increases, predominantly consisting of micropores that account for over 76%. The complexity of total pores, micropores, mesopores, and macropores progressively decreases. Mechanical strength exhibits a positive correlation with both the cement-to-sand ratio and mass concentration. A reduced cement-to-sand ratio diminishes hydration products, lowering the cohesive strength of tailings particles. As mass concentration increases, the internal structure of the filling body becomes denser, enhancing its mechanical properties. An increase in pore number progressively improves pore connectivity, reducing fluid flow resistance. The porosity of the pore structure exhibits a strong correlation with fractal dimension, mechanical strength, and permeability coefficient, with a coefficient of determination ranging from 0.631 to 0.996. The strength prediction model constructed using mesopore porosity and material intrinsic characteristics also demonstrated excellent accuracy.

1. Introduction

Filling mining technology is a typical green mining technique capable of harmonizing with the mining environment. It offers distinct technical advantages in the control of rock mass movement and disaster prevention, subsidence mitigation, the treatment of waste rock and other solid wastes, and ecological conservation [1,2,3,4]. Analyzing the variation patterns and mechanisms of the pore structure and mechanical strength of filling materials, along with examining the correlation between macro- and micro-scale characteristics, will help optimize the mechanical properties of filling materials. This will prevent surface subsidence and catastrophic events, providing crucial safeguards for safe mining operations [5,6,7,8].
The microporous structure characteristics are crucial factors determining the mechanical properties and permeability characteristics of filling materials [9,10]. Currently, the primary methods for examining the microstructure of filling materials include NMR technology, scanning electron microscopy (SEM), mercury intrusion porosimetry (MIP), and X-ray diffraction (XRD) [11,12,13,14]. For example, Zhao, FW. [15] utilized NMR and SEM to examine the microstructural characteristics of lime-modified phosphogypsum cementitious backfill. Ouellet, S [14] employed MIP to evaluate the microstructural evolution of different silica-based cementitious backfill (CPB) specimens. The description of pore structure characteristics primarily encompasses porosity, pore size, and pore connectivity. For instance, Fridjonsson, EO [16] identified three distinct, reproducible peaks in the pore size distribution of cement paste backfill (CPB), which progressively shifted toward smaller pore sizes over hydration time and showed a positive correlation with sample permeability. Liu, Y [17] et al. classified pore structures based on pore size and dual T2 cutoff values into either micropores, mesopores, and macropores or clay-bound, capillary-bound and mobile-fluid pores. Furthermore, fractal theory has been extensively applied to the quantitative characterization of pore structure complexity. By introducing the concept of fractal dimension, it compensates for the limitations of traditional pore structure parameters, thereby establishing a general relationship between porosity and fractal dimension [18,19,20]. For example, Zhao, K [20] et al. investigated the pore fractal characteristics of fiber-reinforced filling bodies, finding that the fractal dimension values for micropores ranged from 0.30 to 1.00, while those for mesopores and macropores fell within the range of 2.96 to 3.00. Deng, HW [21] employed fractal geometry to quantify the pore network of tailings cement tailing backfill (CTB). Subsequently, a predictive model for CTB uniaxial compressive strength was established using dual indicators: “harmless porosity” and “harmful pore fractal dimension.” Additionally, the slurry mix ratio (mass concentration, cement-to-sand ratio, etc.) [22,23], curing conditions (temperature, humidity, etc.) [24,25], and hydration time [26] are all critical factors influencing the formation of pore structure characteristics.
Filling materials are primarily used to support the surrounding rock mass in mining areas, thereby mitigating deformation and rockfall in the surrounding rock. Mechanical strength is one of their key performance indicators [27,28]. Current research on the mechanical strength characteristics of filling materials has mainly focused on uniaxial compressive strength, tensile strength, triaxial strength, shear strength, and other properties [29,30,31,32]. For example, Zheng, JR [33] investigated the development pattern of unconfined compressive strength (UCS) in cement-cemented filling materials using sulfide-bearing lead–zinc tailings. The study found that higher ordinary Portland cement (OPC) content resulted in higher UCS values. Under identical conditions, a finer tailings size reduced the UCS of the backfill at all ages; strength began to decline within short curing periods. Fall, M [34] investigated the effects of curing temperature and the synergistic interaction between temperature and CPB components on the primary mechanical properties of CPB (strength, elastic modulus, and stress–strain behavior). The study revealed that curing temperature significantly influences CPB mechanical properties, with the temperature effect jointly controlled by the cement-to-sand ratio, binder type, tailings mineralogy and curing time. Tu [35] found that under lateral confinement, the triaxial compressive strength of CTB is approximately twice that of uniaxial compressive strength, while its deformation capacity is about four times greater. When the grout fails, crack propagation occurs at the tips of internal pore structures, forming through cracks. This indicates a correlation between pore structure characteristics and mechanical strength. Addressing this phenomenon, Shao, XP [36] further reported that moderate silica fume promotes calcium–silicate–hydrate formation in a ternary slurry, fills micro-voids, refines the pore network, and thereby enhances strength and durability. Additionally, factors such as tailings particle size, cement properties, cement-to-sand ratio, mass concentration, curing conditions, and additives [37,38,39,40,41] significantly influence the mechanical strength variations in the filling material.
In recent years, machine learning (ML) algorithms have also seen rapid development in predicting the pore structure and mechanical properties of grout. Qiu, JH [42] employed a population optimization algorithm combined with the CatBoost algorithm to study grout strength prediction, revealing that changes in micro-level pore structure are a key factor driving macro-level mechanical variations. Under adequate curing conditions and reasonable parameter ratios, lower pore volume in grout correlates with higher grout strength. Yin, SH [43] employed a Long Short-Term Memory (LSTM) prediction model optimized by a Genetic Algorithm (GA). Using cement content, solid content, waste rock content, and curing age as input variables, the model accurately predicted the trend of Unconfined Compressive Strength (UCS) (R2 > 0.996). Niu Yonghui [44] constructed a yield stress prediction model for backfill slurry based on BOP-Stacking ensemble learning. Using 12 variables, including tailings, basic properties, and mix design parameters as the original dataset, the model accurately predicted the variation trend of backfill yield strength. Results indicate that the BOP-Stacking model significantly improved the R2 values between predicted and actual values compared to individual models, with the highest improvement reaching 82.97%. This demonstrates that incorporating machine learning algorithms provides more comprehensive support for predicting the pore structure and mechanical properties of backfill materials.
In summary, this paper analyzes the effects of different cement-to-sand ratios on the porosity, fractal dimension, and connectivity of the pore structure in filling materials using nuclear magnetic resonance (NMR) technology and fractal theory. It identifies the variation characteristics of the mechanical strength of the filling materials and investigates their permeability coefficients. The correlations between pore structure, porosity, fractal dimension, mechanical strength, and permeability coefficient are explored, establishing an analytical model linking micro-pore structure to mechanical strength.

2. Methods and Theory

2.1. Raw Materials

Cement (from Anhui Conch Cement Co., Ltd., Wuhu, China), tailings (from a tin mine in Hechi, China), fly ash (from China Huadian Corporation Limited, Xiong’an New Area, China), and water were used as experimental raw materials. The tailings originated from a mine’s filling station’s whole tailings, where larger particles served as aggregate for structural support, while finer particles assisted cement in its cementitious function. The tailings primarily contained chemical components such as SiO2, CaCO3 and Ca(SO4)(H2O)2, with a coefficient of uniformity Cu of 5.32 and a coefficient of curvature Cc of 1.25, exhibiting good particle size distribution. The cementitious material selected was Conch brand P.O. 42.5 ordinary Portland cement, primarily containing Ca3SiO5, Ca2SiO4, CaCO3, Ca2FeAlO5, and other chemical components. It exhibited a Cu of 6.30, a Cc of 1.15, and good particle size distribution. The fly ash used was solid waste from a coal-fired power plant, offering advantages such as low cost and good cementitious properties. The fly ash primarily contained chemical components such as SiO3, Al2O3, and CaO, with a Cu value of 10.78 and a Cc value of 1.35, exhibiting good particle size distribution. Tap water from the laboratory was used for testing. The particle size distribution characteristics and XRD chemical composition test results of the experimental raw materials are shown in Figure 1 (Experimental Flow Chart).

2.2. Specimen Preparation

Experimental designs involved grout mixtures with varying mass concentrations (68%, 70%) and cement-to-sand ratios (1/3, 1/4, 1/5, 1/6, 1/8) to observe their effects on the strength and pore structure characteristics of the filling material [45,46]. The material mix ratios are shown in Table 1. In accordance with the “Standard Test Methods for Properties of Ordinary Concrete Mix (GB/T 50080-2016)” [47], specimens were fabricated into cylindrical specimens measuring Φ50 mm × 100 mm and Φ50 mm × 25 mm, designated as Groups A1 to A5 and Groups B1 to B5. Each group of specimens consists of 6 specimens, with 3 specimens each of the Φ50 mm × 100 mm and Φ50 mm × 25 mm specifications, totaling 60 specimens. During specimen preparation, the recovered tailings were dried and screened to remove excess impurities. Test molds were retrieved, thoroughly cleaned, dried, and coated with lubricant on their inner walls. According to the material ratios in Table 1, the required quantities of tailings, cement, and water were weighed. The weighed raw materials were thoroughly mixed, loaded into the molds, and then compacted. After scraping and demolding, the filled specimens were placed in a curing chamber for 28 days at 20 °C and 98% humidity, as shown in Figure 1.

2.3. Experimental Test

Based on the test plan scheme, the testing of the filling material primarily included compressive strength, tensile strength, and pore structure distribution characteristics (obtained via NMR technology). According to the specimen preparation specifications, Φ50 mm × 100 mm specimens were utilized for NMR testing and uniaxial compressive strength testing, while Φ50 mm × 25 mm specimens were employed for tensile strength testing.
Specimens that had reached the required curing age were removed from the curing chamber for NMR (Ain-iMR-150, Suzhou Nuomai Analytical Instruments Co., Ltd. Suzhou, China) testing. During the NMR testing process, specimens were first subjected to vacuum saturation treatment with a saturation vacuum pressure of 0.1 MPa for 24 h [21,48]. The CPMG sequence parameters for the NMR test were set as follows: echo time, 0.35 ms; echo number, 2048; wait time, 3000 ms; radio frequency delay, 0.08 ms; digital gain, 3; analog gain, 20; accumulation, 16. After the NMR test, the samples were subjected to centrifugation treatment using a TD-4 centrifuge (Changsha Xiangzhi Centrifuge Instrument Co., Ltd. Changsha, China). The centrifugation speed was set at 1000 rpm/min, the centrifugation time was 60 min, and the centrifugal force was approximately 672.5 g. This process separated free water from the internal pore structure of the filling material. The centrifuged sample was then subjected to another NMR test to obtain its T2 cutoff value characteristics and permeability performance.
Mechanical tests included compressive strength tests and tensile strength tests. Among them, the tensile strength test was obtained through the Brazilian splitting test. The samples after NMR were dried and then subjected to uniaxial compressive strength tests to obtain the uniaxial strength (σc) and compressive modulus (Ec) of the filling body. Displacement control loading was adopted, with the rate set at 0.1 mm/min. The Brazilian splitting test yielded the tensile strength (σt) and tensile modulus (Et) of the filling body. Displacement control loading was adopted, with the rate set at 0.1 mm/min. The specific process is shown in Figure 1.

2.4. Pore Structure Division, Fractal Dimension and Permeability Calculation

2.4.1. Pore Structure Division

NMR technology primarily analyzes the development of a sample’s pore structure based on the response signals of hydrogen (H) atoms in the pore water within porous materials. It then derives the relaxation parameters of the porous material through inversion of the decaying signals. Typically, the pore radius of a porous medium is proportional to the T2 relaxation time value; a longer relaxation time indicates larger pore diameters. The filling material was studied by Liu and Deng et al. [17,21], yielding ρ2 (relaxation strength value) = 0.012 µm/ms and FS (pore shape factor) = 3. The specific pore radius calculation results are as follows:
r = 0.036 T 2
Based on Equation (1), the pore radius distribution characteristics within the filler material were calculated, and the pore structures were classified according to different pore sizes. According to the classification framework proposed by Jiang Z et al. [49], pores in porous media can be categorized into three size ranges based on their diameter: micropores (r < 0.1 µm), mesopores (0.1 µm ≤ r ≤ 1.0 µm), and macropores (r > 1.0 µm). The corresponding size ranges are illustrated in Figure 2a. It should be noted that this classification of pore structures is based on existing literature findings and has not been supplemented by other verification methods, potentially introducing certain limitations. The porosities of micropores, mesopores, and macropores are denoted as Φmi, Φme, and Φma, respectively, while the total porosity is denoted as Φtotal.

2.4.2. Fractal Dimension Calculation

The fractal dimension primarily reflects the complexity and homogeneity of the pore structure. Based on the principles of NMR technology, the calculation process of the fractal dimension can be described as follows:
lg ( V ) = ( 3 D N M R ) lg r + ( D N M R 3 ) lg r max
According to Equation (2), linear fitting was applied to each pore size region with a straight-line model to yield the slope 3-DNMR. The fractal dimension DNMR is then obtained by simple calculation, as shown in Figure 2b. For convenience of expression, the fractal dimensions of micropores, mesopores, macropores, and total pores are denoted as Dmi, Dme, Dma and Dtotal, respectively.

2.4.3. Permeability Coefficient Calculation

Typically, pore structure characteristics encompass porosity, pore size, and pore connectivity. To understand the changes in pore connectivity in the filling material, this paper introduces the parameter permeability coefficient K to quantify this phenomenon. The permeability values of the filling material were calculated using the Coates model, as shown below:
K = Φ total C M F F I B V I N
In the equation, Φtotal represents the total porosity of the specimen, expressed as a percentage; FFI denotes the free water pore volume parameter; BVI denotes the bound water pore volume parameter; C, M, and N are model parameters with values of 10, 4, and 2, respectively. It should be noted that C, M, and N are empirical values, so K is an estimated value.

3. Analysis of Test Results

Based on the experimental design and procedure, the evolution characteristics of the void structure and the mechanical strength of the backfill material were obtained. The specific results are shown in Table 2 and Table 3.

3.1. Evolution Characteristics of Pore Structure

3.1.1. T2 Spectral Characteristics and Pore Distribution

As a non-destructive technique, NMR is widely used to monitor microstructural evolution in porous media, including rock, soil, backfill and concrete. According to the experimental design, T2 spectrum characteristics and pore structure distributions of the filling material under saturated and centrifuged conditions were measured; the results are plotted in Figure 3.
It can be observed that at a constant mass concentration, the T2 spectrum under saturated water conditions gradually transitions from a single main peak to a double main peak pattern as the cement-to-sand ratio increases. The relaxation time T2 values corresponding to the main peaks show no significant change (range is less than 5%), while the corresponding porosity increments increase markedly. This indicates that increasing the cement-to-sand ratio reduces the number of pore structures within the material, as evidenced by the cumulative porosity values. When the cement sand ratio decreases from 1:3 to 1:8, the average Φtotal of Groups A1–A5 increases from 17.528% to 25.054%, while that of Groups B1–B5 increases from 15.832% to 23.356%, indicating a significant increase in pore count. The primary reasons are as follows: As the cement-to-sand ratio decreases, the cement content gradually diminishes while the tailings content increases. This reduction in cement hydration products prevents effective filling of voids between tailings particles, leading to the formation of numerous pore structures. At the same cement-to-sand ratio, a higher mass concentration results in a significant reduction in the number of pore structures. This occurs because an increase in mass concentration leads to higher cement and tailings content, creating a denser internal structure within the filling material. Simultaneously, the amount of cementitious product gradually increases. These products fill the original pore spaces, reducing the number of pore structures and decreasing pore diameters, thereby enhancing the overall density. Additionally, centrifugal force drives free water out of the filling body, resulting in a sharp decrease in hydrogen atom content and a corresponding reduction in detectable relaxation signals in NMR. Compared to the saturated state, the porosity component corresponding to the T2 spectrum after centrifugation is significantly reduced and primarily exhibits a single peak distribution. This indicates that free water in relatively larger pores has been expelled from the filling material. Overall, the relaxation times corresponding to the main peak in both saturated and centrifuged states range approximately from 0.04~10 ms, corresponding to pore sizes between 0.00144~0.36 μm. This corresponds to the distribution range of micropores and mesopores.
By examining the pore structure distribution characteristics diagram, it is evident that the filling material primarily consists of Φmi, followed by Φme, with the least amount being Φma. The Φmi values for the fillings in Groups A1 to A5 were 16.009%, 16.641%, 16.999%, 18.459%, and 19.909%, respectively, and their porosity ratio exceeded 76%, each exceeding 79%. The Φmi values for the fillings in Groups B1–B5 were 14.206%, 14.598%, 15.100%, 15.779%, and 17.650%, respectively, and their porosity ratio exceeded 76%. Φtotal, Φmi, Φme, and Φma all inversely correlate with the cement-to-sand ratio. As the cement-to-sand ratio decreases, the quantity of hydration products generated by cement hydration diminishes, while the usage of tailings gradually increases. This facilitates the formation of pore structures, leading to an increase in their number. As mass concentration increases, Φtotal and Φmi gradually decrease, resulting in a denser internal structure of the filler and reduced pore space.
When the material’s Φtotal increases, Φmi, Φme, and Φma also gradually increase. As the cement-to-sand ratio decreases, the proportion of Φmi in both Group A and Group B fillings gradually diminishes, while the proportions of Φme and Φma progressively increase. At cement-to-sand ratios ranging from 1/3 to 1/8, the Φmi proportion in Group A fillings decreased from 91% to 79%, the Φme proportion increased from 8% to 19%, and the Φma proportion rose from 1% to 2%. For Group B fillings, the Φmi proportion decreased from 90% to 76%, while the Φme proportion increased from 9% to 22% and the Φma proportion rose from 1% to 2%. The reduced cement-to-sand ratio led to a gradual decrease in cementitious products, and the increasing tailings content resulted in a greater number of larger pore structures.

3.1.2. Fractal Dimension of Pore Structure

The fractal dimension of pores serves as a primary indicator for describing the homogeneity and complexity of pore structures. Generally, a higher fractal dimension indicates greater complexity in the pore structure. Based on the fractal dimension calculation formula, the values of Dtotal, Dmi, Dme and Dma were obtained for fillings with different cement-to-sand ratios, as shown in Table 4, and fractal dimension fitting coefficients are all higher than 0.8.
It can be observed that Dtotal ranges from 2.855 to 2.883, Dmi from 2.161 to 2.345, Dme from 2.934 to 2.990, and Dma from 2.994 to 2.997. As the cement-to-sand ratio decreases, Dtotal, Dmi, Dme and Dma all decrease gradually, indicating reduced homogeneity and complexity of the total pores, mesopores, and macropores within the fillings. For Group B fillings, Dtotal ranged from 2.746 to 2.841, Dmi from 2.147 to 2.268, Dme from 2.914 to 2.982, and Dma from 2.992 to 2.999. Dtotal, Dmi, Dme and Dma all showed positive correlations with the cement-to-sand ratio. As mass concentration increased, Dtotal, Dmi, Dme and Dma generally exhibited a decreasing trend, indicating that a reduction in pore structure quantity promotes the formation of a more homogeneous internal structure within the filling material.

3.2. The Evolution Characteristics of the Mechanical Strength of Filling Materials

Mechanical strength is one of the key characteristics of filling materials. According to the experimental design, the mechanical strength properties (σc, Ec, σt, Et) of filling materials with different cement-to-sand ratios were obtained, as shown in Figure 4.
As shown in Figure 4, as the cement-to-sand ratio decreases, σc, Ec, σt and Et all gradually decrease. For Groups A1 to A5, σc ranges from 2.107 to 8.321 MPa, Ec from 0.535 to 1.715 GPa, σt from 0.356 to 1.458 MPa, and Et from 0.115 to 0.257 GPa. For Groups B1 to B5, σc ranges from 2.231 to 9.131 MPa, Ec from 0.655 to 1.885 GPa, σt from 0.405 to 1.628 MPa, and Et from 0.132 to 0.293 GPa. As the cement-to-sand ratio decreases, cement usage gradually declines while tailings content increases. The hydration products generated by cement fail to effectively fill the voids between tailings particles, leading to a gradual reduction in the bonding strength between tailings. This, in turn, affects the material’s σc, Ec, σt and Et. Furthermore, an increase in Φtotal accelerates this process. As the number of pores increases, the solid skeleton area gradually decreases, leading to a reduction in the pressure the material can withstand under load. Simultaneously, the increased number of pore structures also increases the number of pore tip expansions, further deteriorating the material’s strength. As mass concentration increases, the formation of hydration products from cement hydration progressively rises. This leads to a denser internal structure within the filling material, with gradually enhanced bonding strength between particles. Under load conditions, the number of pore tip expansions decreases, resulting in increased filling strength. The consistent trend in strength and modulus changes indicates that both reflect alterations in the material’s internal structural integrity and micro-mechanical properties.

3.3. Multi-Scale Characteristic Analysis of Filling Materials

3.3.1. Porosity Fractal Dimension Correlation

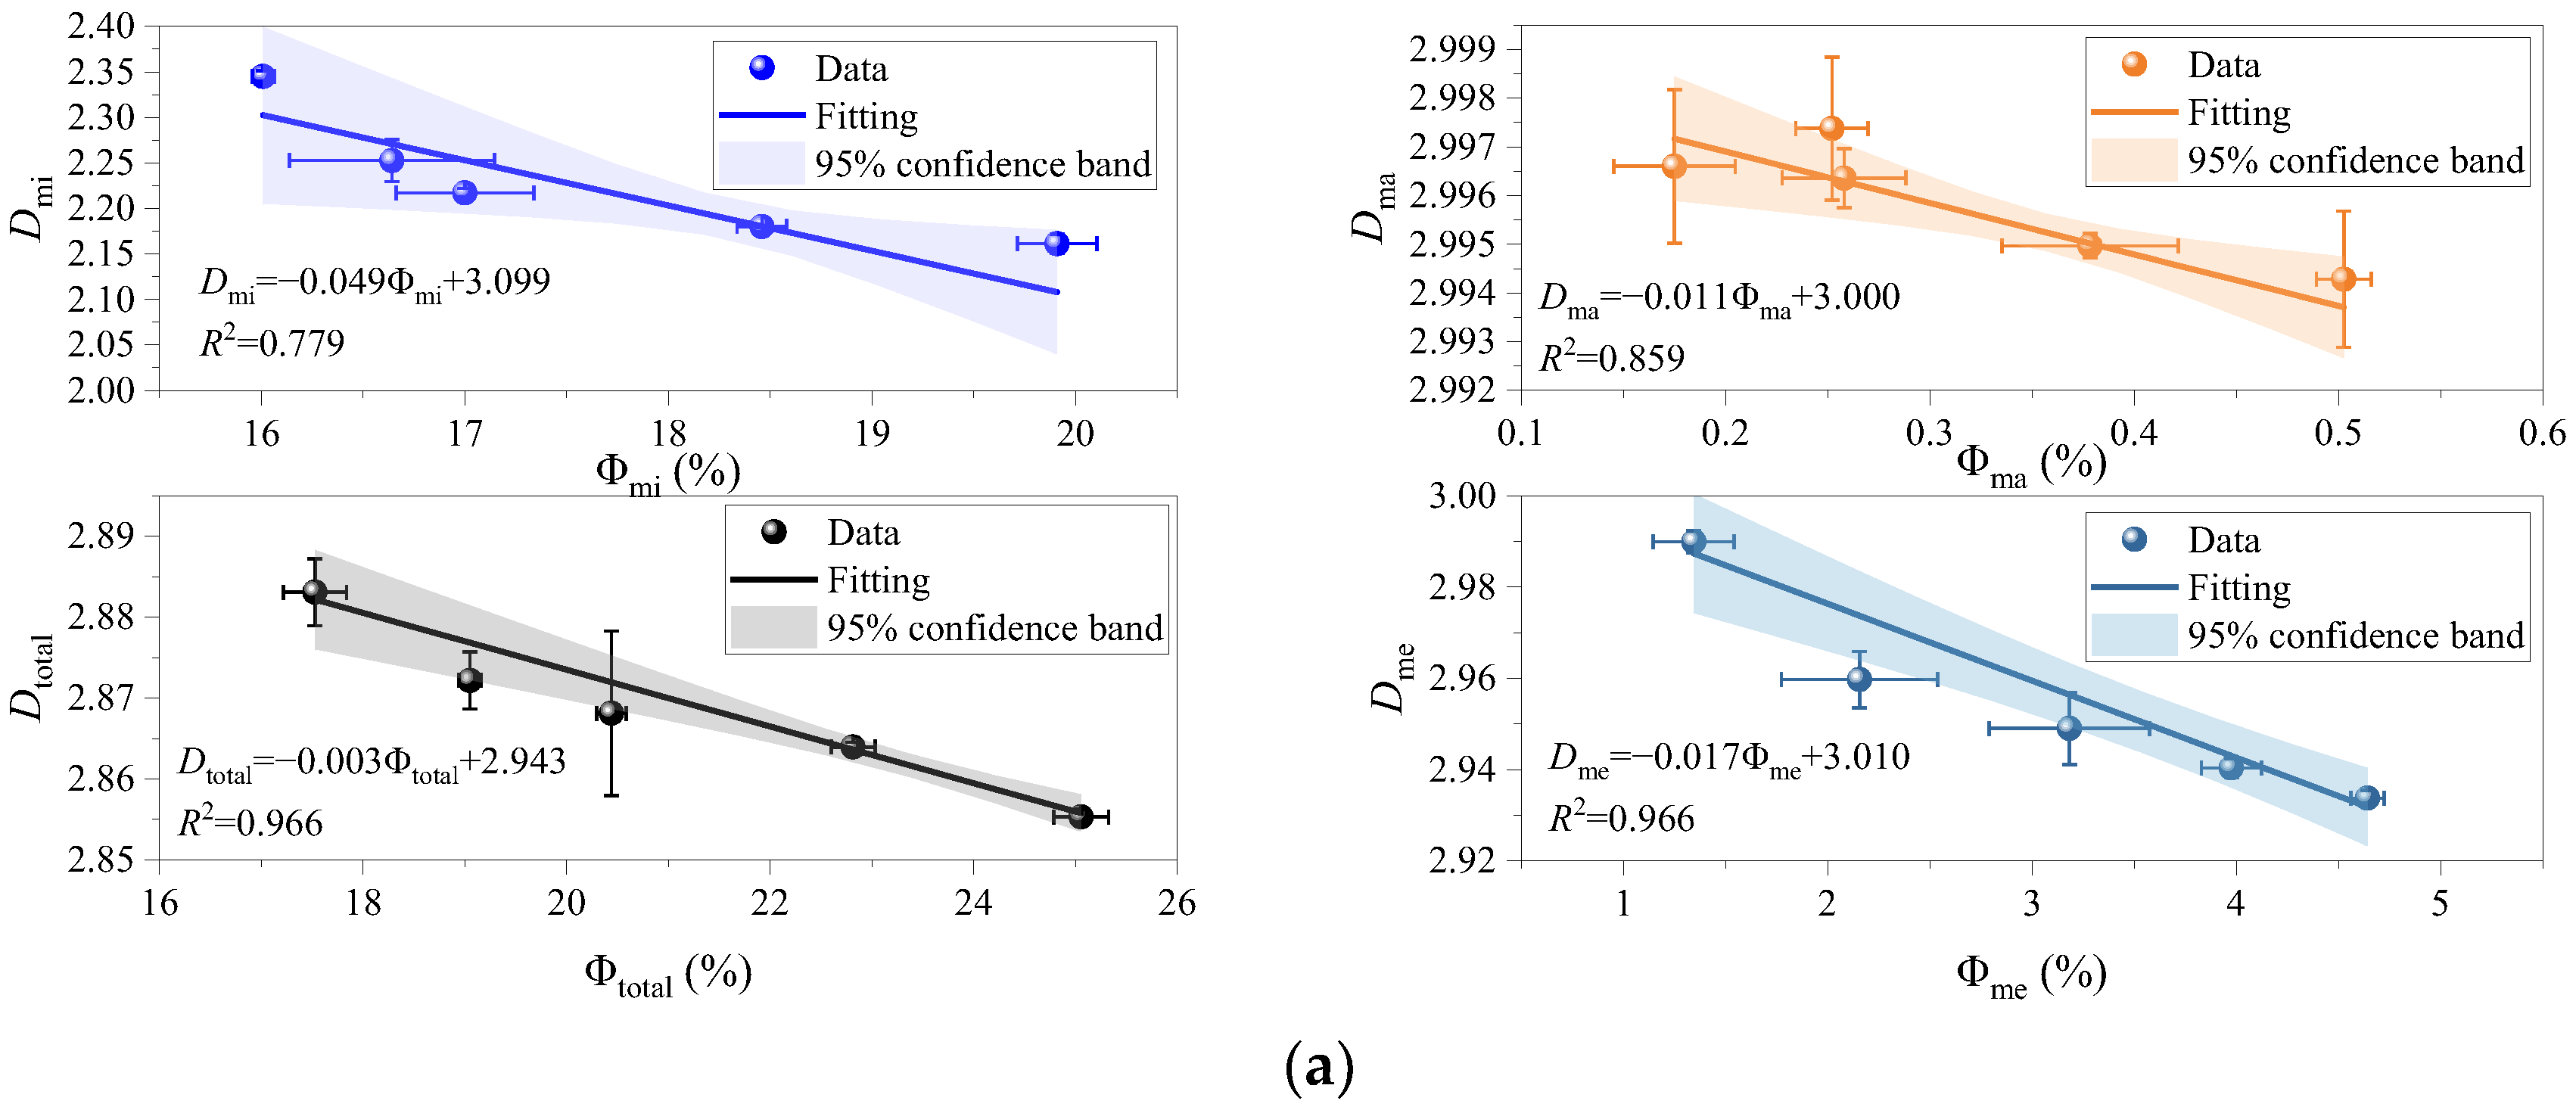
The correlation characteristics between the pores of the filling material and the fractal dimension are shown in Figure 5. It can be observed that there is a good correlation between the porosity of the pore structure and its fractal dimension. The coefficient of determination for Group A fillings is higher than 0.777, while that for Group B fillings is higher than 0.631.
Specifically, the parameters Φtotal, Φmi, Φme, and Φma in Groups A and B exhibit negative correlations with Dtotal, Dmi, Dme, and Dma. This primarily stems from the following mechanism: as the cement-to-sand ratio decreases, Φtotal increases, enhancing pore connectivity and expanding pore space. Consequently, the structure transitions from complex and dense to sparse and simple, leading to a gradual reduction in Dtotal. Additionally, as Φtotal increases, Φmi, Φme, and Φma all gradually increase. Due to the larger pore radius of mesopores and macropores, an increase in their quantity effectively expands pore space, gradually reducing the degree of pore structure complexity. Micropores serve to connect larger pore structures; when their quantity increases, the interconnectivity between pore structures strengthens, leading to a gradual decrease in Dmi.

3.3.2. Analysis of the Correlation Between Pore Structure, Porosity and Mechanical Strength

The microscopic structure determines macroscopic mechanical behavior. Analyzing the correlation between macro- and mesoscopic characteristics and establishing models is crucial for predicting material properties and optimizing designs. Therefore, the correlation between pore structure and mechanical strength is illustrated in Figure 6 and Figure 7.
The figure demonstrates that Φtotal of Group A exhibits strong correlations with σc, Ec, σt and Et, with correlation coefficients exceeding 0.922. This indicates that the formation of filling strength is closely linked to the quantity of pore structures. As internal defects within the material, pore structures readily create stress concentration zones around them. When subjected to loading, these stress concentration zones become susceptible to crack initiation and propagation, thereby reducing the material’s load-bearing capacity. Increased void structure quantity also reduces the effective cross-sectional area bearing external forces, leading to higher stress per unit area. Furthermore, interconnected voids disrupt internal structural continuity, weaken interparticle bonding in tailings, create pathways for crack propagation, and accelerate damage evolution. Consequently, Φtotal exhibits negative correlations with σc, Ec, σt and Et.
Dtotal also exhibits strong correlations with σc, Ec, σt and Et, with fitting coefficients all exceeding 0.927. As the overall porosity structure gradually increases in complexity, the network-like interconnections between pore structures become more intricate, strengthening the associations between individual pores and between pores and tailings particles. This characteristic disrupts the linear propagation path of cracks, forcing them to “detour,” “deflect,” or “branch,” thereby increasing the energy required for crack propagation (enhancing fracture toughness) and manifesting as improved macroscopic strength. Additionally, complex pores (e.g., micropores, reticular pores) can distribute stress over a larger area, effectively mitigating stress concentration and thereby promoting the development of material mechanical strength. Among the pore structure–mechanical strength correlation features, Φmi, Φme, and Φma exhibit strong correlations with σc, Ec, σt and Et, respectively, with fitting coefficients all exceeding 0.825. Dmi, Dme, and Dma also showed good correlations with σc, Ec, σt and Et, respectively, with fitting coefficients all exceeding 0.753. This indicates that the development of mechanical strength results from the combined effects of pores with different diameters within the material.
As Φmi increases, the specific surface area of pores expands, making it prone to becoming a micro-defect concentration zone. Mesopores typically constitute the primary component of capillary pores; their increased quantity significantly reduces the material’s density and strength. Macropores represent the weakest structural defects within the material, readily becoming stress concentration points and crack initiation sites under loading. In Figure 3, as the cement-to-sand ratio increases, the pore volume fractions of mesopores and macropores gradually rise, while that of micropores decreases. This indicates that mesopores and macropores progressively become the key microstructures governing the mechanical evolution of the filling material. It should be noted that a single pore structure cannot explain the cause of mechanical changes; the evolution characteristics of mechanical strength are often the result of the combined effects of micropores, mesopores, and macropores.
Figure 7 shows that a strong correlation also exists between the pore structure and mechanical strength of Group B fillings, with correlation coefficients all exceeding 0.757. Specifically, Φtotal exhibits negative correlations with σc, Ec, σt, and Et, while Dtotal shows positive correlations with σc, Ec, σt, and Et. As the number of pores increases, the complexity of the pore structure gradually decreases, reducing the effective skeletal support area within the material. When specimens are loaded, stress concentration tends to occur at pore tips, leading to a gradual decrease in strength. However, as pore complexity increases, pores form a dense network structure that effectively disperses and disrupts crack propagation paths, resulting in a gradual increase in material strength. This trend aligns with the changes observed in Figure 6. Furthermore, Φmi, Φme, and Φma exhibit strong correlations with σc, Ec, σt, and Et, with fitting coefficients exceeding 0.757. Similarly, Dmi, Dme, and Dma demonstrate correlation coefficients above 0.804 with these mechanical properties. Similar to the formation mechanism of a mass concentration of 68%, the development of mechanical strength also stems from the combined effect of pores with different diameters within the material.

3.3.3. The Correlation Between Pore Structure Characteristics and Permeability Coefficient

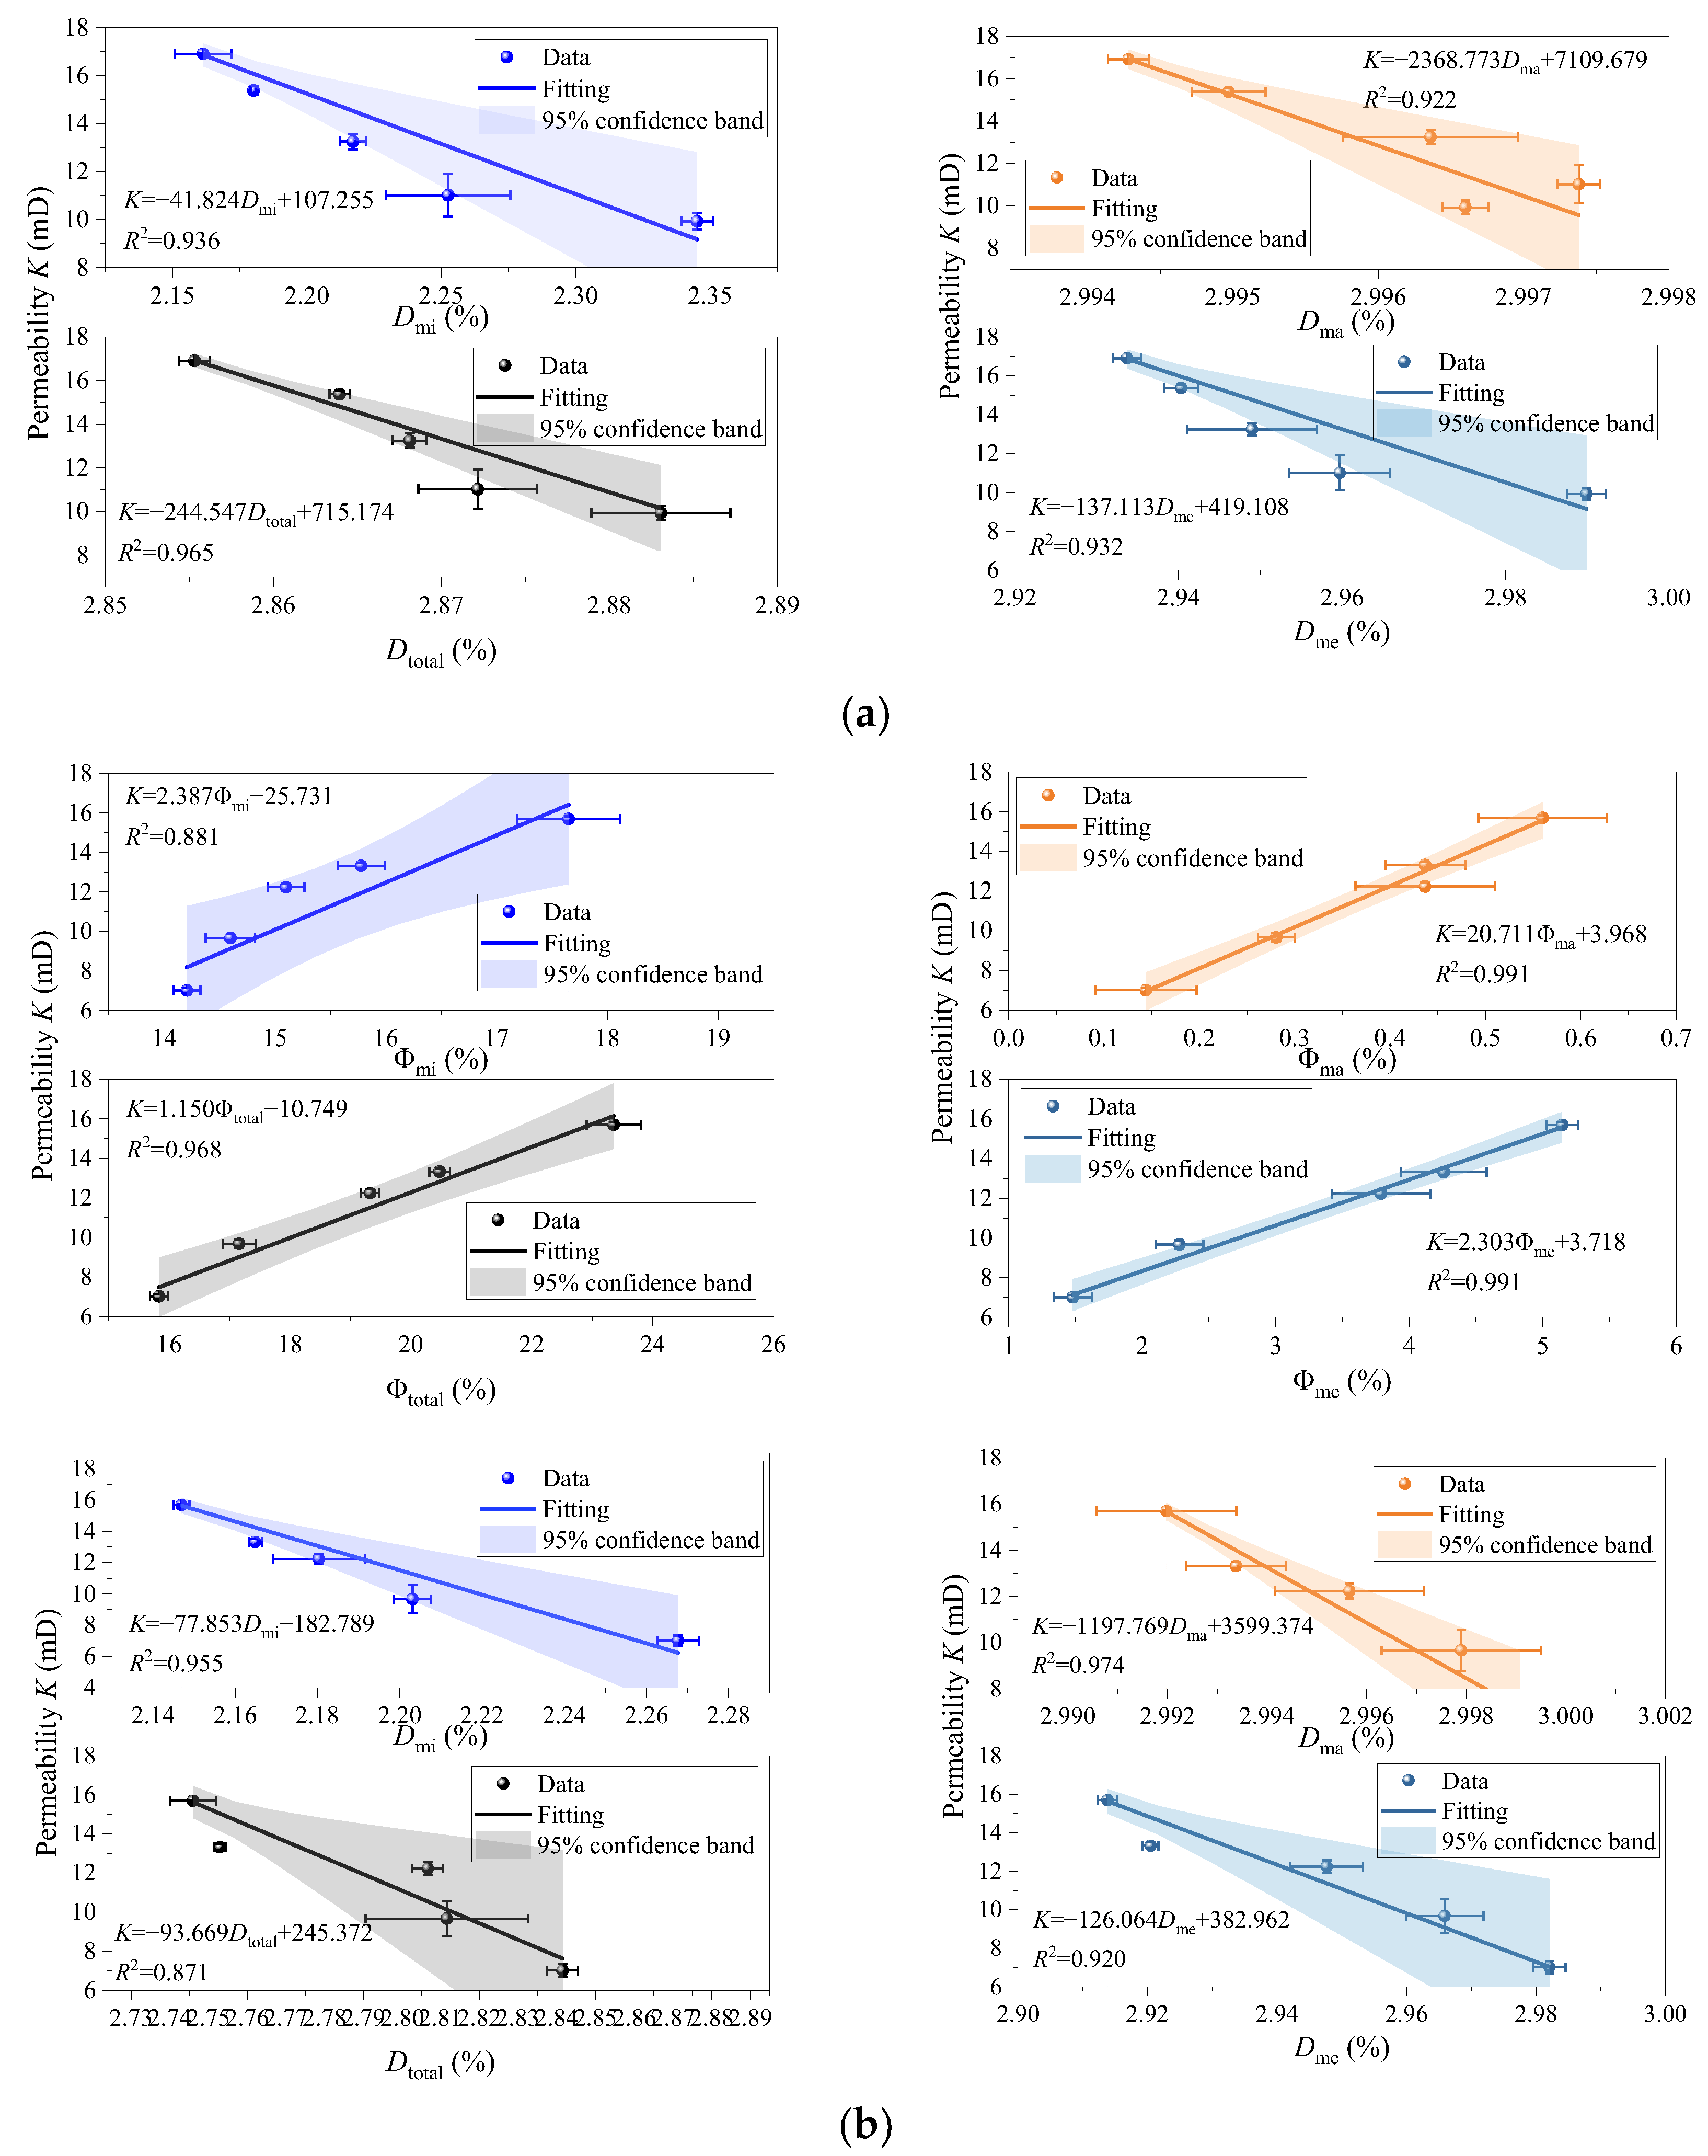
According to Equation (3), the permeability coefficient K of Group A filling material ranges from 9.926 to 16.903 mD, while that of Group B filling material ranges from 7.014 to 15.691 mD. Both gradually increase as the cement-to-sand ratio decreases, indicating enhanced pore connectivity. As mass concentration increases, the permeability coefficient gradually decreases. This indicates that a smaller number of pore structures results in a relatively lower permeability coefficient. The correlation between pore structure characteristics and permeability coefficient is illustrated in Figure 8. It can be observed that in Group A, Φtotal, Φmi, Φme, and Φma all exhibit strong correlations with K (coefficients > 0.932). Similarly, in Group B, Φtotal, Φmi, Φme, and Φma also demonstrate strong correlations with K (coefficients > 0.881). As the number of pores increases, the pore volume gradually expands and the connectivity between pores progressively strengthens, facilitating the formation of flow pathways. Simultaneously, the increased pore volume reduces the flow resistance of fluids through the material and lowers viscous resistance, leading to a gradual increase in the permeability coefficient K. Therefore, Φtotal, Φmi, Φme, and Φma all exhibit positive correlations with permeability coefficient K. Groups A and B also show strong correlations between Dtotal, Dmi, Dme, and Dma with the permeability coefficient K, with fitting coefficients exceeding 0.871. Notably, Dtotal, Dmi, Dme, and Dma all exhibit negative correlations with K. As the overall pore structure complexity increases, fluid flow paths lengthen, and the friction surface area along flow channels expands. This reduces the number of effective permeation pathways, causing the permeability coefficient to gradually decrease. Additionally, micropores serve to connect larger pores. As the number of pores increases, pore volume expands and inter-pore connectivity strengthens, facilitating flow pathways. When the complexity of micropores increases, their networked interlacing structure also contributes to an increase in permeability.

4. Discussion

Based on the analysis results of the correlation between pore structure characteristics and mechanical strength, a correlation analysis model linking microstructure and mechanical strength was established. In Figure 6 and Figure 7, due to the differences in σc and σt exhibited by the 68% and 70% mass concentration fillers, the correlation between pore structure and mechanical strength for fillings of different mass concentrations was considered separately, without comprehensive consideration. This section addresses this limitation by discussing the process of establishing strength prediction models for fillings with varying mass concentrations and cement sand ratios, while also analyzing the reliability of these prediction models.
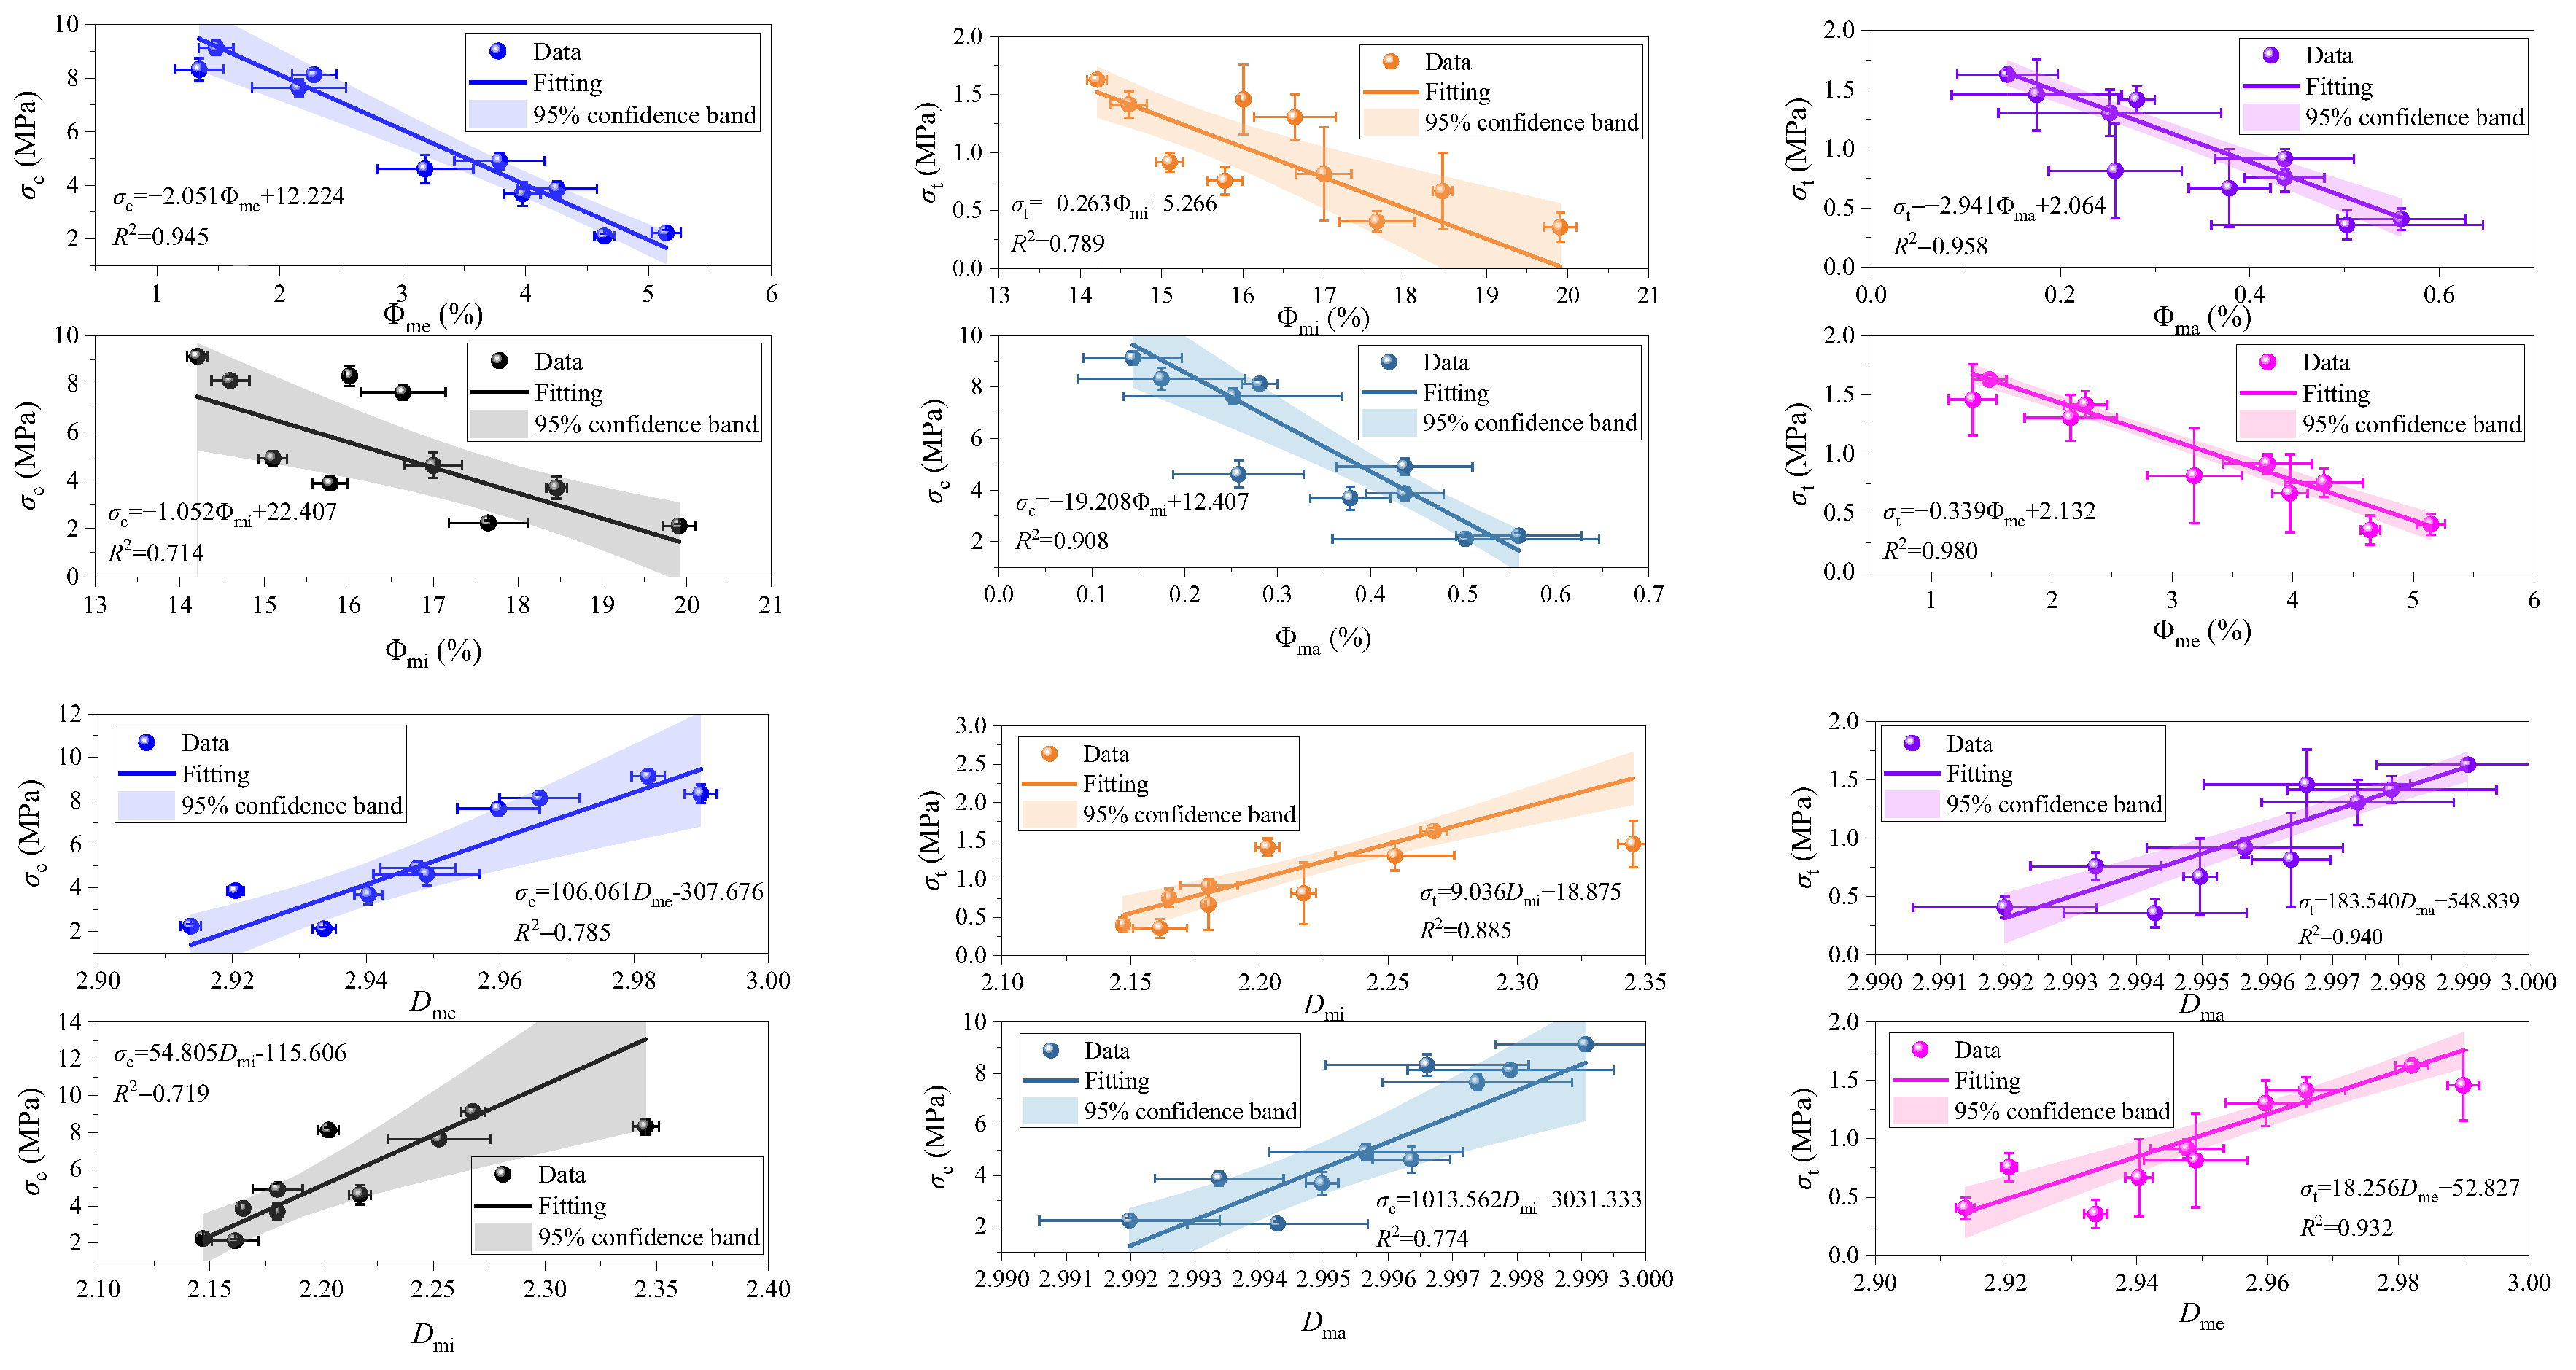
Figure 9 displays the correlation between pore structure and σc for fillings with different mass concentrations and cement sand ratios. It can be observed that Φmi, Φme, Φma, Dmi, Dme, and Dma for fillings with varying mass concentrations and cement-to-sand ratios all exhibit good correlations with σc and σt. Among these, Φme yields the best fitting results with both σc and σt, with fitting coefficients of 0.945 and 0.980, respectively. Therefore, when constructing the strength prediction model, Φme is selected as the pore structure parameter.
Simultaneously, parameters representing the inherent characteristics of the filling material itself are denoted as Ec and Et, respectively. A predictive model for the mechanical strength of filling materials with varying mass concentrations and cement-to-sand ratios is established, as shown in Equations (4) and (5). In these models, Φme is an independent variable with respect to both Ec and Et. It should be noted that Ec and Et characterize the characteristics of the filling body itself (such as aggregate particles, etc.), while Φₘₑ is selected for the characterization of pore structure characteristics; the introduction of Φₘₑ × Ec and Φₘₑ × Et explains the combined effect of macroscopic and microscopic parameters. Both Ec and Et models are constructed using average values. After obtaining the fundamental parameters, the validity of the models will be cross-validated using data from parallel samples.
σ c = α 0 + α 1 Φ m e + α 2 E c + α 3 ( Φ m e × E c )
σ t = β 0 + β 1 Φ m e + β 2 E c + β 3 ( Φ m e × E t )
In the equation, α0, α1, α2, α3 and β0, β1, β2, β3 are model parameters.
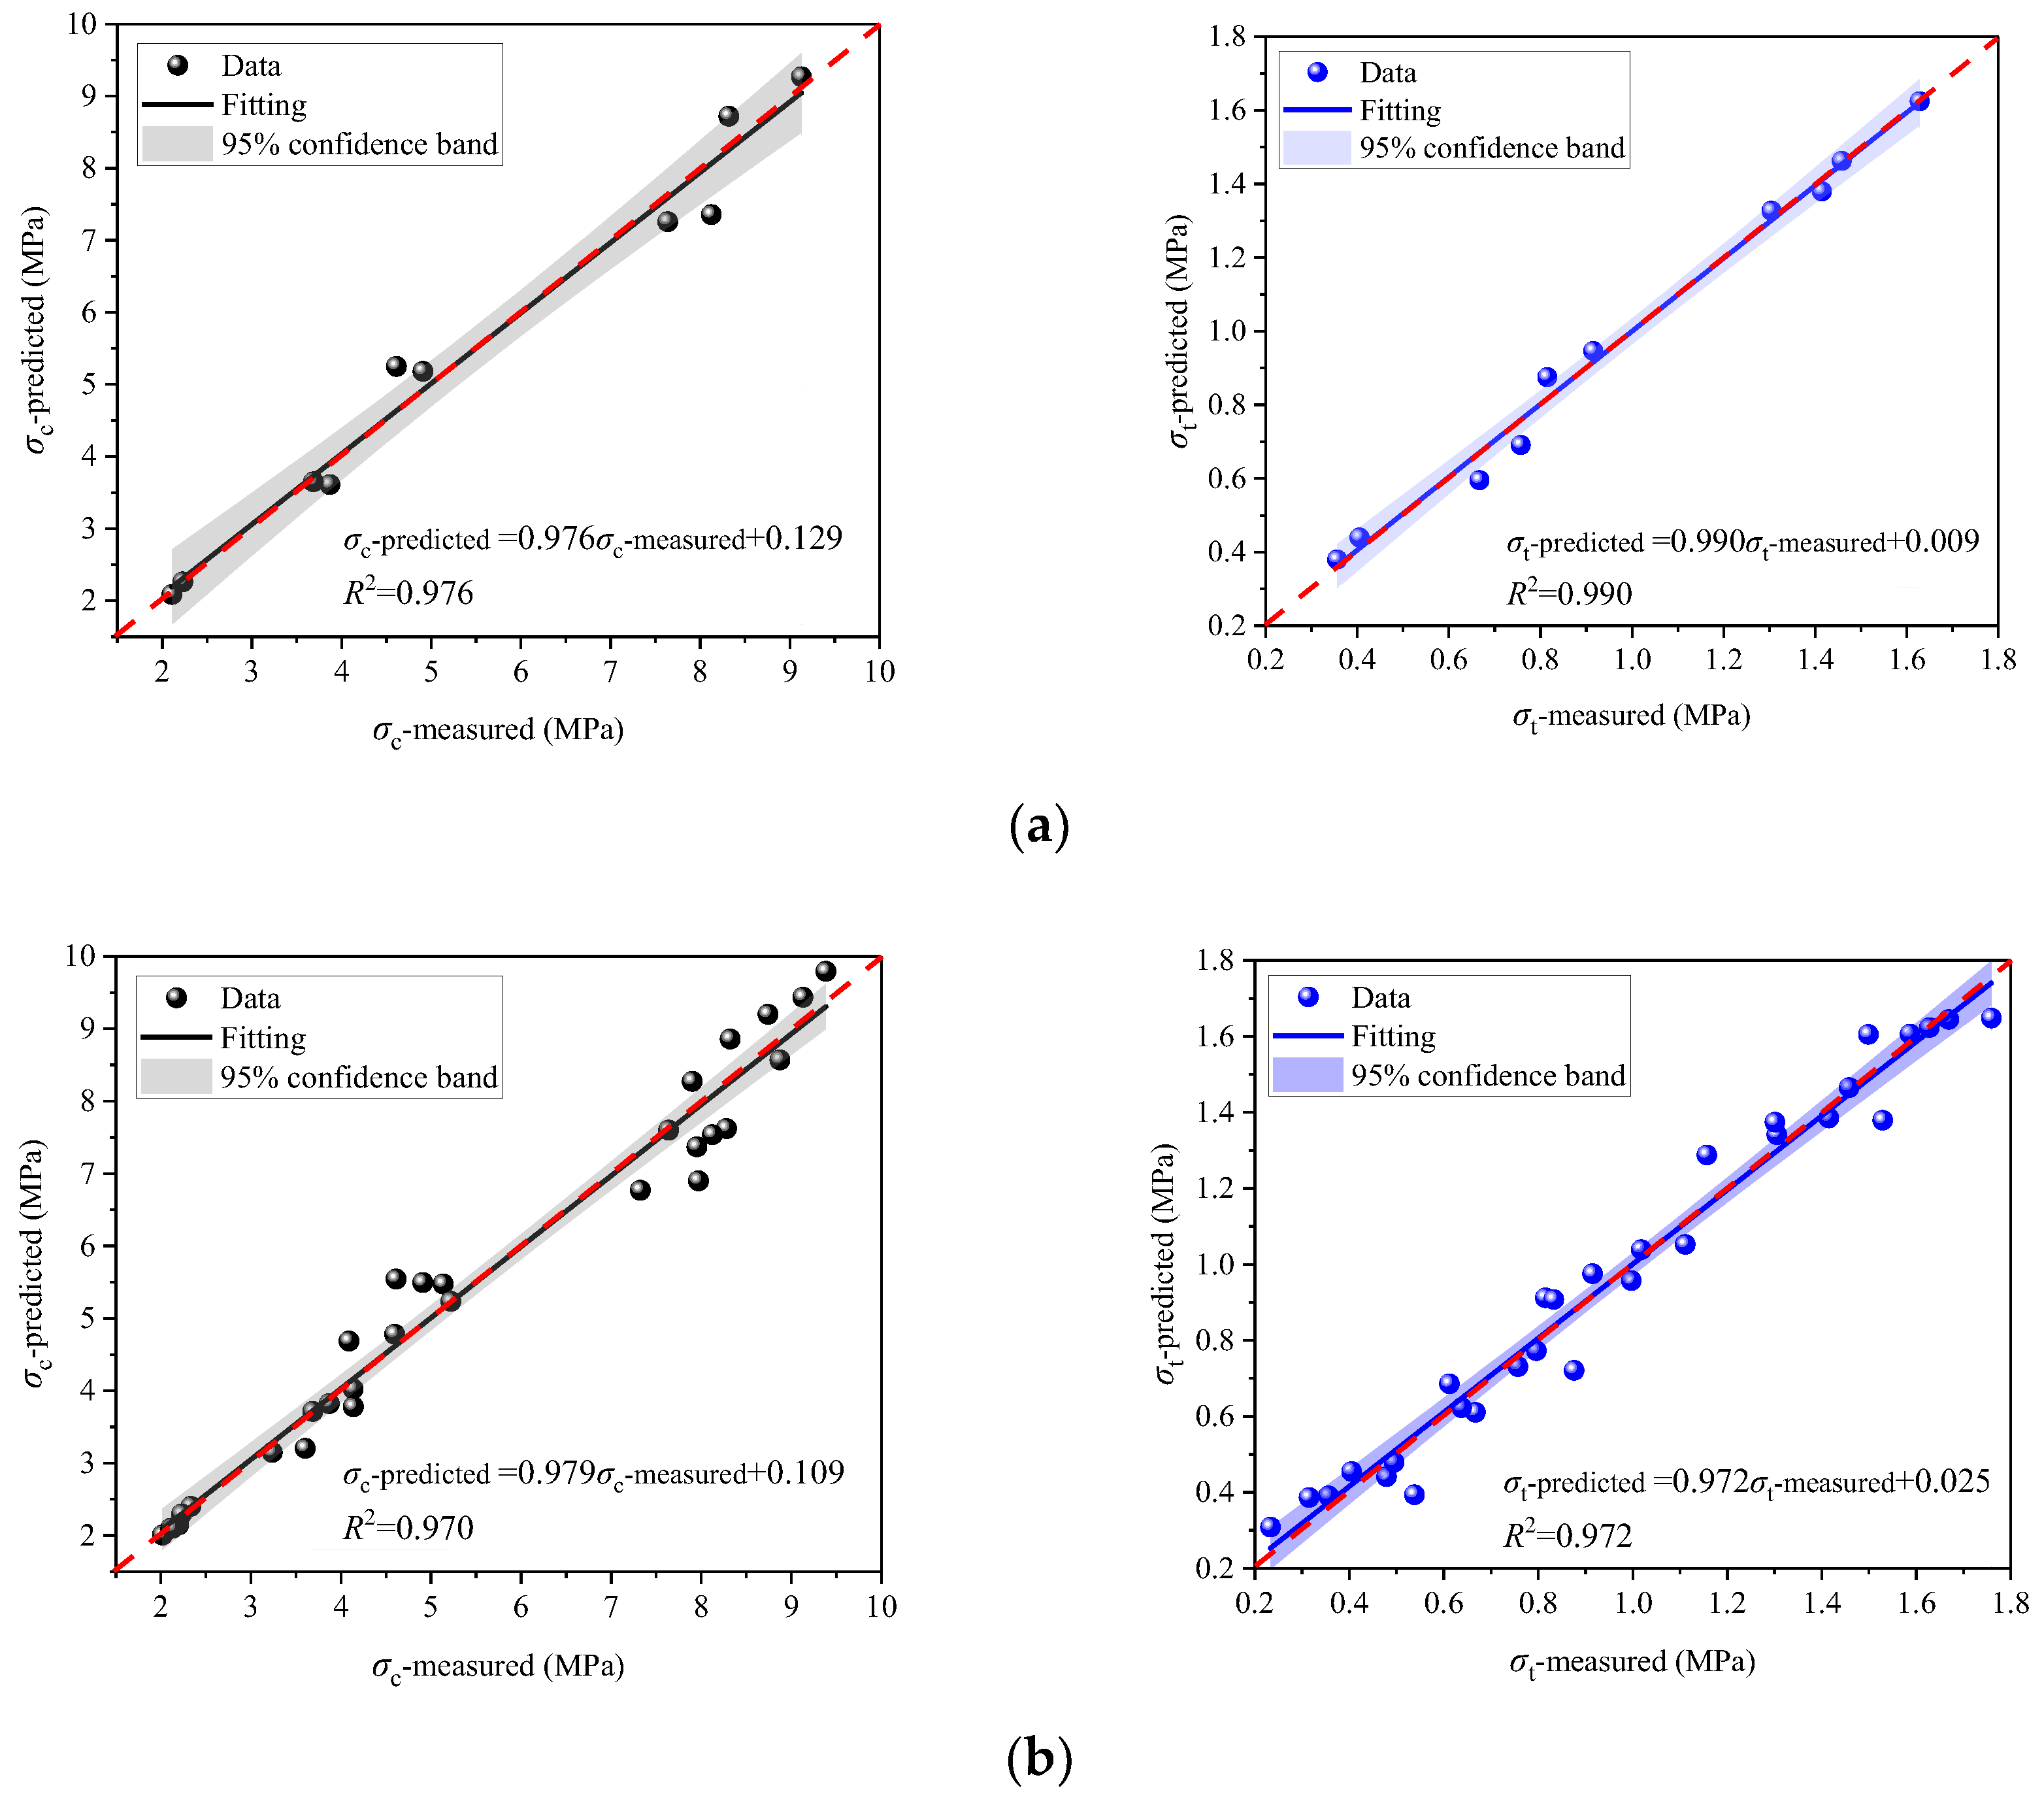
Figure 10 presents the fitting analysis of measured versus predicted values for the strength of the filling. Here, σc-predicted denotes the value calculated using Equation (4) and the parameters from Table 5, while σc-measured represents the value obtained from experimental testing. Similarly, σt-predicted indicates the value calculated using Equation (5) and the parameters from Table 5, and σt-measured denotes the value obtained from experimental testing. It can be observed that the coefficient of determination for both the measured and predicted values of the filling strength in Figure 10a,b exceeds 0.976, indicating that the established strength prediction model effectively represents the relationship between measured and predicted values. Compared to Figure 6 and Figure 7, the prediction model effectively addresses the strength prediction relationship for filling materials with varying mass concentrations and cement-to-sand ratios, demonstrating superior predictive capability. Furthermore, when filling materials exhibit differences in mass concentration and cement-to-sand ratio, establishing a strength model should comprehensively consider the combined effects of pore structure and material-specific characteristics. The results of cross-validation using parallel sample data for model fitting parameters also demonstrate good correlation. It can be observed that the fitting coefficients all exceed 0.972, and the slopes of the fitted lines are all close to 1, further validating the rationality of the strength prediction model.

5. Conclusions

The main conclusions of this paper are as follows:
(1)
The Φtotal gradually increases as the cement-to-sand ratio decreases, with Φmi dominating over 79% of the total. The porosity component corresponding to the T2 spectrum of centrifugal specimens shows a significant reduction, indicating substantial free water separation from the filling material. As the cement-to-sand ratio decreases, hydration products gradually diminish, leaving voids between tailings particles unfilled. Consequently, Φtotal, Φmi, Φme, and Φma progressively increase. As mass concentration increases, the filling material becomes denser, resulting in more hydration products and reduced pore space, thereby decreasing Φtotal.
(2)
As the cement-to-sand ratio decreases or the mass concentration diminishes, the complexity of total pores, micropores, mesopores, and macropores progressively increases, revealing a strong correlation between porosity and fractal dimension. σc, Ec, σt and Et are positively correlated with the cement-to-sand ratio. The reduction in hydration products lowers the bonding strength between tailings particles, accelerating the expansion of pore tips under loading. As mass concentration increases, the internal structure of the filling material becomes denser, resulting in enhanced bonding strength. Under load conditions, the number of pore tip expansions decreases, leading to increased strength.
(3)
Pore structure characteristics exhibit strong correlations with mechanical strength, confirmed by strength prediction models. As Φtotal increases, the solid skeleton area gradually decreases, the number of expanding pore tips increases, and the pressure resistance under loading gradually decreases. When Dtotal increases, the networked interlacing structure between pores also becomes more complex, which helps mitigate stress concentration phenomena.
(4)
The K of Group A filling material is located between 9.926 and 16.903 mD, while the K of Group B is located between 7.014 and 15.691 mD. It gradually increases as the cement-to-sand ratio decreases and gradually decreases as the mass concentration increases. A strong correlation also exists between pore structure characteristics and K. As pore quantity increases, pore connectivity gradually enhances, reducing fluid flow resistance. However, increased pore complexity lengthens seepage pathways, diminishing the number of effective permeable channels and thereby decreasing K values.

Author Contributions

Conceptualization, W.W., S.Z. and Y.L.; Methodology, W.W., S.Z. and Y.L.; Validation, W.W., S.Z. and Y.L.; Formal analysis, W.W. and Y.L.; Investigation, Y.W. (Yajun Wang), W.L., L.D., D.L. and Y.W. (Yuding Wang); Data curation, W.W. and Y.L.; Writing—original draft, W.W., S.Z. and Y.L.; Writing—review & editing, W.W., S.Z. and Y.L.; Supervision, Y.W. (Yajun Wang), W.L., L.D., D.L. and Y.W. (Yuding Wang); Project administration, S.Z.; Funding acquisition, S.Z. All authors have read and agreed to the published version of the manuscript.

Funding

This research was funded by Natural Science Foundation of Changsha City (Grant No. kq2502056); National Key R&D Program “Three-Dimensional Differentiated Backfilling Management of Abandoned Mine Areas and Regional Rock Pressure Coordination Control Technology” (Project No. 2024ZD1003804); National Key R&D Program of China during the 14th Five-Year Plan Period: “Large-Scale Intelligent Rock Drilling and Blasting Technology and Equipment for Metal Mines under High Stress Conditions” (Project No. 2023YFC2907202).

Data Availability Statement

The dataset is available on request from the authors; the raw data supporting the conclusions of this article will be made available by the authors on request.

Conflicts of Interest

Author Wei Wang was employed by the company Tibet Huatailong Mining Development Co., Ltd. Authors Yajun Wang, Weixing Lin, Long Dou, Dongrui Liu and Yuding Wang were employed by the company Changsha Institute of Mining Research Co., Ltd. The remaining authors declare that the research was conducted in the absence of any commercial or financial relationships that could be construed as a potential conflict of interest.

References

  1. Xue, G.; Yilmaz, E.; Wang, Y. Progress and Prospects of Mining with Backfill in Metal Mines in China. Int. J. Min. Met. Mater. 2023, 30, 1455–1473. [Google Scholar] [CrossRef]
  2. Zhang, C.; Chen, Y.; Ren, Z.; Wang, F. Compaction and Seepage Characteristics of Broken Coal and Rock Masses in Coal Mining: A Review in Laboratory Tests. Rock Mech. Bull. 2024, 3, 100102. [Google Scholar] [CrossRef]
  3. Golik, V.I. Vibroactivation of Hardening Backfill Mixtures during Transportation over Extended Distances. Russ. Metall. Met. 2024, 2024, 1974–1979. [Google Scholar] [CrossRef]
  4. Huang, D.; Xing, D.; Chang, X.; Zhu, Y.; Gao, C. Analysis and Application of Filling Mining Technology in China’s Mining Area: A Case Study of YuXi Coal Mine. Arch. Min. Sci. 2021, 66, 611–624. [Google Scholar] [CrossRef]
  5. Sari, M.; Yilmaz, E.; Kasap, T.; Karasu, S. Exploring the Link Between Ultrasonic and Strength Behavior of Cementitious Mine Backfill by Considering Pore Structure. Constr. Build. Mater. 2023, 370, 130588. [Google Scholar] [CrossRef]
  6. Falah, M.; Ohenoja, K.; Obenaus-Emler, R.; Kinnunen, P.; Illikainen, M. Improvement of Mechanical Strength of Alkali-activated Materials Using Micro Low-alumina Mine Tailings. Constr. Build. Mater. 2020, 248, 118659. [Google Scholar] [CrossRef]
  7. Yaya, N.S.; Cao, S.; Yilmaz, E. Effect of 3D Printed Skeleton Shapes on Strength Behavior, Stress Evolution and Microstructural Response of Cement-based Tailings Backfills. Constr. Build. Mater. 2024, 432, 14. [Google Scholar] [CrossRef]
  8. Liu, S.; Shi, G.; Xu, Y.; Bao, X. Experimental Study of a Self-expanding Filling Material for Mine-sealing Walls. Adv. Cem. Res. 2023, 35, 70–80. [Google Scholar] [CrossRef]
  9. Hu, J.; Ren, Q.; Ma, S.; Jiang, Q.; Jiang, Y.; Shang, J.; Luo, Z. Macroscopic and Microscopic Trans-scale Characteristics of Pore Structure of Mine Grouting Materials. Trans. Nonferrous Met. Soc. China 2019, 29, 1067–1081. [Google Scholar] [CrossRef]
  10. Hefni, M.; Hassani, F. Experimental Development of a Novel Mine Backfill Material: Foam Mine Fill. Minerals 2020, 10, 564. [Google Scholar] [CrossRef]
  11. Cheng, K.; Tu, B.; Liu, L.; Zhang, B.; Qiu, H. Damage Strengthening Constitutive Model of Cemented Paste Backfill. Adv. Civ. Eng. 2021, 2021, 5593983. [Google Scholar] [CrossRef]
  12. Cetinta, S. Investigation of Pore and Filling Material Bond in Filled Travertine Used as a Building Material. Period. Polytech. Civ. Eng. 2023, 67, 80–92. [Google Scholar] [CrossRef]
  13. Majou, H.A.; Bruand, A.; Rozenbaum, O.; Le Trong, E. Evaluation of the Impact of Freezing Technique on Pore-structure Characteristics of Highly Decomposed Peat Using X-ray Micro-computed Tomography. Int. Agrophys. 2022, 36, 223–233. [Google Scholar] [CrossRef] [PubMed]
  14. Ouellet, S.; Bussiere, B.; Aubertin, M.; Benzaazoua, M. Microstructural Evolution of Cemented Paste Backfill: Mercury Intrusion Porosimetry Test Results. Cem. Concr. Res. 2007, 37, 1654–1665. [Google Scholar] [CrossRef]
  15. Zhao, F.; Hu, J.; Yang, Y.; Xiao, H.; Ma, F. Cross-Scale Study on Lime Modified Phosphogypsum Cemented Backfill by Fractal Theory. Minerals 2022, 12, 403. [Google Scholar] [CrossRef]
  16. Fridjonsson, E.O.; Hasan, A.; Fourie, A.B.; Johns, M.L. Pore Structure in a Gold Mine Cemented Paste Backfill. Miner. Eng. 2013, 53, 144–151. [Google Scholar] [CrossRef]
  17. Liu, Y.; Deng, H.; Jiang, Z.; Lei, Y.; Wang, P.; Yu, S. Multi-scale Correlation Analysis of Filling Materials. Powder Technol. 2025, 465, 121364. [Google Scholar] [CrossRef]
  18. Qiu, J.; Xiong, X.; Zhou, K. Fractal Characterization and NMR Analysis of Curing-Dependent Pore Structures in Cemented Tailings Waste RockBackfill. Fractal Fract. 2025, 9, 367. [Google Scholar] [CrossRef]
  19. Yang, P.; Liu, L.; Suo, Y.; Zhu, M.; Xie, G.; Deng, S. Mechanical Properties, Pore Characteristics and Microstructure of Modified Magnesium Slag Cemented Coal-based Solid Waste Backfill Materials: Affected by Fly Ash Addition and Curing Temperature. Process Saf. Environ. 2023, 176, 1007–1020. [Google Scholar] [CrossRef]
  20. Zhao, K.; Ma, C.; Yang, J.; Wu, J.; Yan, Y.; Lai, Y.; Ao, W.; Tian, Y. Pore Fractal Characteristics of Fiber-reinforced Backfill Based on Nuclear Magnetic Resonance. Powder Technol. 2023, 426, 118678. [Google Scholar] [CrossRef]
  21. Deng, H.; Duan, T.; Tian, G.; Liu, Y.; Zhang, W. Research on Strength Prediction Model and Microscopic Analysis of Mechanical Characteristics of Cemented Tailings Backfill under Fractal Theory. Minerals 2021, 11, 886. [Google Scholar] [CrossRef]
  22. Zhang, M.; Wang, Y.; Wu, A.; Ruan, Z.; Wang, Z.; Liu, S. Study on Mechanical Strength, Volume Stability, and Hydration Mechanism of Cemented Tailings Backfill with Plastic Expansive Agent. Min. Metall. Explor. 2025, 19, 899–917. [Google Scholar] [CrossRef]
  23. Kasap, T.; Yilmaz, E.; Sari, M. Effects of Mineral Additives and Age on Microstructure Evolution and Durability Properties of Sand-reinforced Cementitious Mine Backfills. Constr. Build. Mater. 2022, 352, 129079. [Google Scholar] [CrossRef]
  24. Gao, R.; Wang, W.; Xiong, X.; Li, J.; Xu, C. Effect of Curing Temperature on the Mechanical Properties and Pore Structure of Cemented Backfill Materials with Waste Rock-tailings. Constr. Build. Mater. 2023, 409, 133850. [Google Scholar] [CrossRef]
  25. Yilmaz, E.; Benzaazoua, M.; Belem, T.; Bussiere, B. Effect of Curing under Pressure on Compressive Strength Development of Cemented Paste Backfill. Miner. Eng. 2009, 22, 772–785. [Google Scholar] [CrossRef]
  26. Liu, L.; Xin, J.; Qi, C.; Jia, H.; Song, K. Experimental Investigation of Mechanical, Hydration, Microstructure and Electrical Properties of Cemented Paste Backfill. Constr. Build. Mater. 2020, 263, 120137. [Google Scholar] [CrossRef]
  27. Tuylu, S. Effect of Different Particle Size Distribution of Zeolite on the Strength of Cemented Paste Backfill. Int. J. Environ. Sci. Technol. 2022, 19, 131–140. [Google Scholar] [CrossRef]
  28. Kesimal, A.; Yilmaz, E.; Ercikdi, B. Evaluation of Paste Backfill Mixtures Consisting of Sulphide-rich Mill Tailings and Varying Cement Contents. Cem. Concr. Res. 2004, 34, 1817–1822. [Google Scholar] [CrossRef]
  29. Gan, D.Q.; Li, H.B.; Chen, C.; Lu, H.J.; Zhang, Y.Z. An Experimental Study on Strength Characteristics and Hydration Mechanism of Cemented Ultra-Fine Tailings Backfill. Front. Mater. 2021, 8, 723878. [Google Scholar] [CrossRef]
  30. Tan, Y.; Yu, X.; Elmo, D.; Xu, L.; Song, W. Experimental Study on Dynamic Mechanical Property of Cemented Tailings Backfill Under SHPB Impact Loading. Int. J. Min. Met. Mater. 2019, 26, 404–416. [Google Scholar] [CrossRef]
  31. Zhang, Y.; Xu, W.; Chen, W. The Investigation into the Mechanical Properties and Failure Mechanisms of Stratified Cemented Tailings Backfill with Enhancement Layer under Triaxial Compression. Eng. Fail. Anal. 2025, 182, 110128. [Google Scholar] [CrossRef]
  32. Chen, X.; Shi, X.; Zhou, J.; Yu, Z. Influence of Polypropylene Fiber Reinforcement on Tensile Behavior and Failure Mode of Tailings Cemented Paste Backfill. IEEE Access 2019, 7, 69015–69026. [Google Scholar] [CrossRef]
  33. Zheng, J.; Guo, L.; Sun, X.; Li, W.; Jia, Q. Study on the Strength Development of Cemented Backfill Body from Lead-Zinc Mine Tailings with Sulphide. Adv. Mater. Sci. Eng. 2018, 2018, 7278014. [Google Scholar] [CrossRef]
  34. Fall, M.; Celestin, J.C.; Pokharel, M.; Toure, M. A Contribution to Understanding the Effects of Curing Temperature on the Mechanical Properties of Mine Cemented Tailings Backfill. Eng. Geol. 2010, 114, 397–413. [Google Scholar] [CrossRef]
  35. Tu, B.; He, H.; Liu, L.; Ding, X.; Yang, Q. Comparative Analysis of Uniaxial and Triaxial Compression Characteristics of Cement Tailings Backfill. Min. Metall. Explor. 2025, 42, 335–345. [Google Scholar] [CrossRef]
  36. Shao, X.; Wang, Z.; Tang, R.; Zhao, B.; Ning, J.; Tian, C.; Wang, W.; Zhang, Y.; Du, X. Enhancing Mid-Term Strength and Microstructure of Fly Ash-Cement Paste Backfill with Silica Fume for Continuous Mining and Backfilling Operations. Materials 2024, 17, 6037. [Google Scholar] [CrossRef]
  37. Fall, M.; Benzaazoua, M.; Ouellet, S. Experimental Characterization of the Influence of Tailings Fineness and Density on the Quality of Cemented Paste Backfill. Miner. Eng. 2005, 18, 41–44. [Google Scholar] [CrossRef]
  38. Kesimal, A.; Yilmaz, E.; Ercikdi, B.; Alp, I.; Deveci, H. Effect of Properties of Tailings and Binder on the Short-and Long-term Strength and Stability of Cemented Paste Backfill. Mater. Lett. 2005, 59, 3703–3709. [Google Scholar] [CrossRef]
  39. Eker, H.; Bascetin, A. Influence of Silica Fume on Mechanical Property of Cemented Paste Backfill. Constr. Build. Mater. 2022, 317, 126089. [Google Scholar] [CrossRef]
  40. Hefni, M.; Ali, M.A. The Potential to Replace Cement with Nano-Calcium Carbonate and Natural Pozzolans in Cemented Mine Backfill. Adv. Civ. Eng. 2021, 2021, 5574761. [Google Scholar] [CrossRef]
  41. Li, Y.; Fu, J.; Wang, K.; He, Z. Influence of Shell Ash on Pore Structure and Mechanical Characteristics of Cemented Tailings Backfill. Constr. Build. Mater. 2024, 411, 134473. [Google Scholar] [CrossRef]
  42. Qiu, J.; Li, J.; Xiong, X.; Zhou, K. Application of a Multi-Algorithm-Optimized CatBoost Model in Predicting the Strength of Multi-Source Solid Waste Backfilling Materials. Big Data Cogn. Comput. 2025, 9, 203. [Google Scholar] [CrossRef]
  43. Yin, S.; Yan, Z.; Chen, X.; Yan, R.; Chen, D.; Chen, J. Mechanical Properties of Cemented Tailings and Waste-rock Backfill (CTWB) Materials: Laboratory tests and deep learning modeling. Constr. Build. Mater. 2023, 369, 130610. [Google Scholar] [CrossRef]
  44. Niu, Y. Research on the Construction and Optimization of a Multi-Parameter Yield Stress Prediction Model for Filling Slurry Based on Machine Learning. Master’s Thesis, Kunming University of Science and Technology, Kunming, China, 2020. [Google Scholar] [CrossRef]
  45. Cai, F.; Sun, W.; Zhang, S.; Zhu, A.; Ding, F.; Zhang, P.; Wen, Y.; Wang, S.; Xiao, Y. Strength and Crack Propagation Analysis of Layered Backfill Based on Energy Theory. Arch. Min. Sci. 2024, 69, 175–190. [Google Scholar] [CrossRef]
  46. Zhao, K.; Li, Q.; Yan, Y.; Zhou, K.; Gu, S.; Zhu, S. Numerical Calculation Analysis of the Structural Stability of Cemented Fill under Different Cement-Sand Ratios and Concentration Conditions. Adv. Civ. Eng. 2018, 2018, 1260787. [Google Scholar] [CrossRef]
  47. Jiang, Z.; Cai, G.; He, H.; Tian, G.; Liu, Y.; Wu, M. Pore Structure Evolution of Mortars with Manufactured Sand Aggregate under the Influence of Aggregate Size and Water Saturation Environment. Measurement 2025, 241, 115736. [Google Scholar] [CrossRef]
  48. GB/T 50080-2016; Standard Test Methods for Properties of Normal Concrete Mix. Ministry of Housing and Urban-Rural Development: Beijing, China, 2016. Available online: http://std.muren-it.com/web/detail?id=1106 (accessed on 14 November 2025).
  49. Jiang, Z.; Cai, G.; Liu, Y.; Wang, P.; Yu, S. Pore Structure and Mechanical Characteristics of CRS Mortar Based on NMR and Fractal Theory. Constr. Build. Mater. 2024, 457, 139459. [Google Scholar] [CrossRef]
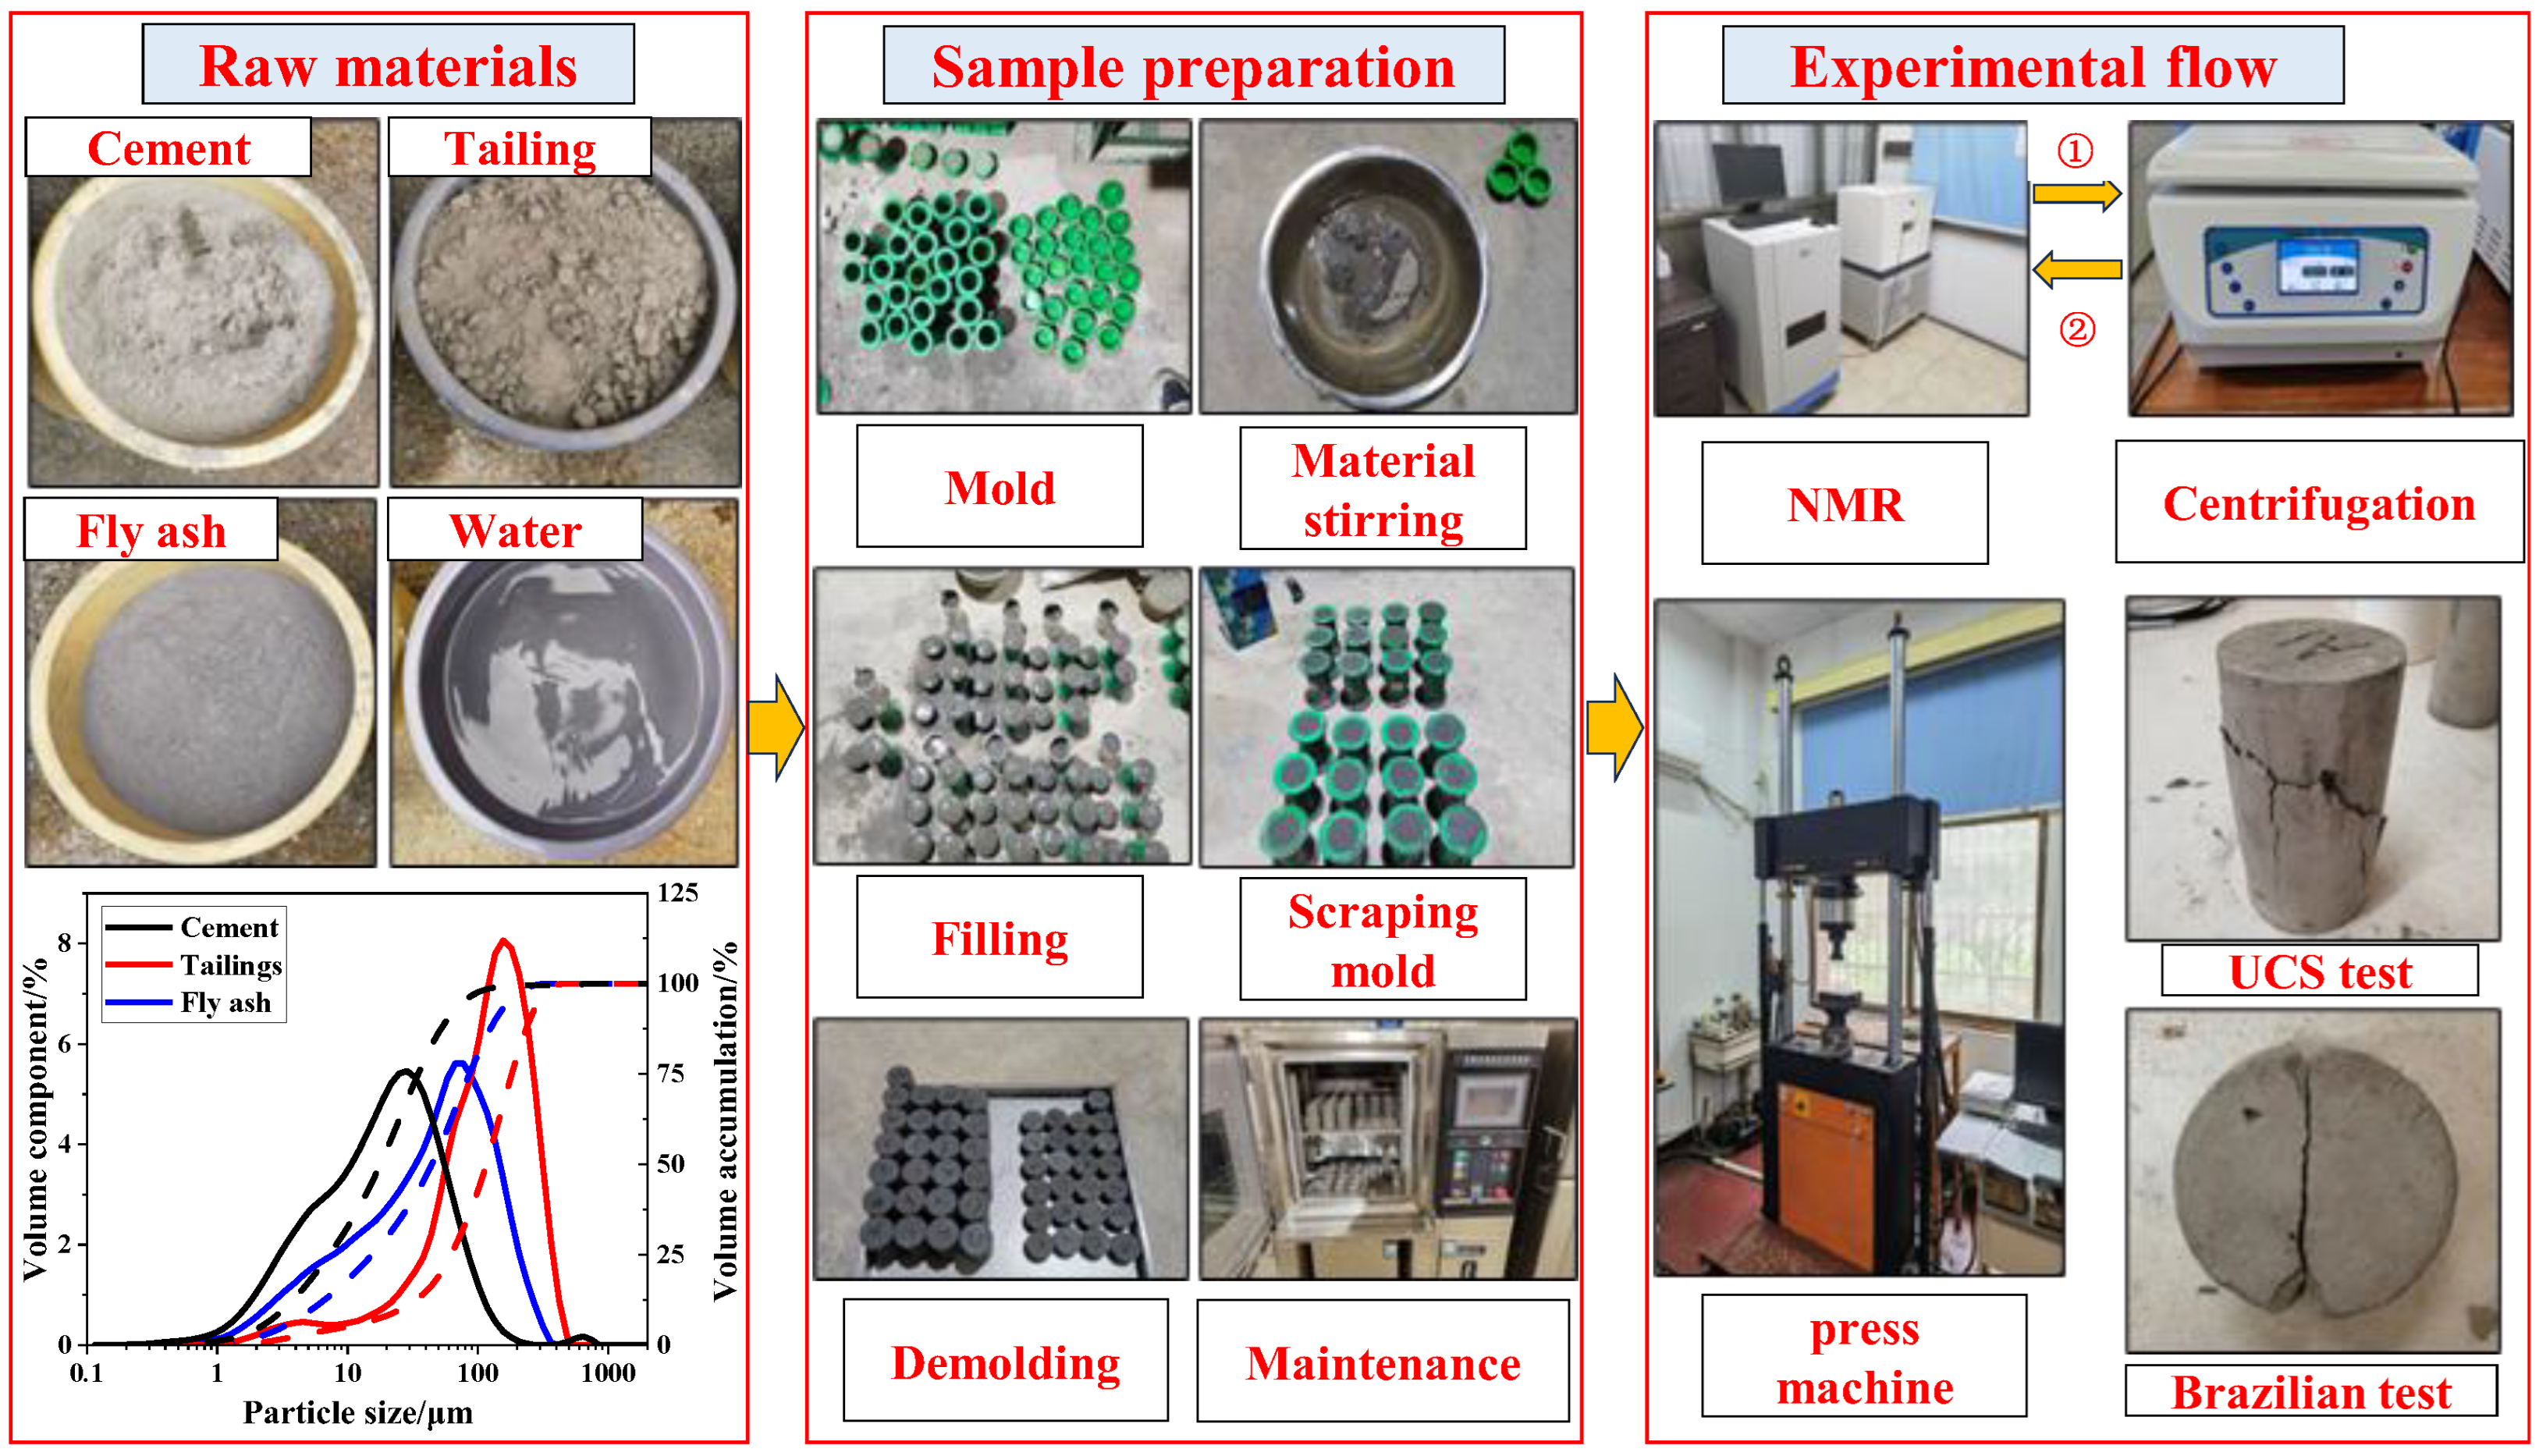
Figure 1. Test flowchart.
Minerals 15 01211 g001
Figure 2. Pore structure division and fractal dimension calculation.
Minerals 15 01211 g002
Figure 3. NMR T2 spectra and pore structure distribution.
Minerals 15 01211 g003aMinerals 15 01211 g003b
Figure 4. Evolution characteristics of the mechanical strength of backfill materials.
Minerals 15 01211 g004aMinerals 15 01211 g004b
Figure 5. The relationship between porosity and fractal dimension. (a) Mass concentration 68%; (b) mass concentration 70%.
Minerals 15 01211 g005aMinerals 15 01211 g005b
Figure 6. Pore structure–strength correlation analysis (mass concentration 68%).
Minerals 15 01211 g006
Figure 7. Pore structure–strength correlation analysis (mass concentration 70%).
Minerals 15 01211 g007
Figure 8. Pore structure–permeability correlation analysis. (a) Mass concentration 68%; (b) Mass concentration 70%.
Minerals 15 01211 g008aMinerals 15 01211 g008b
Figure 9. Pore structure–strength correlation analysis.
Minerals 15 01211 g009
Figure 10. Fitting results of measured and predicted strength values. (a) The model fitting result using the average strength value. (b) Cross-validation of strength prediction models.
Minerals 15 01211 g010
Table 1. Design of test scheme for filling specimens.
GroupsMass ConcentrationCement Tailings RatioFly AshCement PasteTailings SlurryWaterNumber
A168%1/310%14.50%43.50%32%6
A268%1/410%11.60%46.40%32%6
A368%1/510%9.67%48.30%32%6
A468%1/610%8.29%49.70%32%6
A568%1/810%6.44%51.60%32%6
B170%1/310%15.00%45.00%30%6
B270%1/410%12.00%48.00%30%6
B370%1/510%10.00%50.00%30%6
B470%1/610%8.57%51.43%30%6
B570%1/810%6.67%53.33%30%6
Table 2. Calculated results for porosity.
GroupsΦtotal-AVE/%±SDΦmi-AVE/%±SDΦme-AVE/%±SDΦma-AVE/%±SD
A117.5280.31016.0090.0541.3440.1990.1750.030
A219.0490.10616.6420.5032.1560.3830.2520.018
A320.4400.14317.0000.3393.1830.3920.2580.030
A422.8130.21618.4590.1223.9760.1470.3780.043
A525.0540.27119.9100.1964.6420.0820.5030.013
B115.8320.14914.2060.1221.4820.1410.1440.053
B217.1590.27014.5980.2242.2800.1790.2810.019
B319.3260.15115.1000.1663.7900.3680.4370.073
B420.4750.17115.7790.2124.2590.3220.4370.042
B523.3560.44917.6500.4675.1460.1180.5600.067
Table 3. Calculated results for strength and permeability coefficient.
Groupsσc-AVE/MPa±SDEc-AVE/GPa±SDσt-AVE/MPa±SDEt-AVE/GPa±SDK/mD±SD
A18.3220.4211.7150.1211.4580.3010.2570.0419.9260.325
A27.6390.3141.5810.1141.3050.1940.2340.05411.0130.901
A34.6130.5231.3080.1520.8150.2030.1650.03213.2480.326
A43.6860.4490.9910.1490.6670.1290.1340.02915.3750.178
A52.1080.0900.5350.0300.3560.1230.1150.01016.9030.040
B19.1310.2561.8550.1411.6280.0410.2930.0047.0140.120
B28.1260.1561.6310.1041.4150.1140.2450.0019.6700.210
B34.9090.3121.4280.1220.9150.0820.1850.00612.2370.190
B43.8710.2671.0290.1290.7570.1190.1530.00913.3200.156
B52.2310.1020.6550.0800.4050.0900.1320.00715.6910.132
Table 4. The calculation result of fractal dimension.
Fractal DimensionDtotal-AVE±SDDmi-AVE±SDDme-AVE±SDDma-AVE±SD
Group A12.8830.0042.3450.0062.9900.0022.9970.002
Group A22.8720.0042.2530.0232.9600.0062.9970.001
Group A32.8680.0102.2170.0052.9490.0082.9960.001
Group A42.8640.0012.1800.0012.9400.0022.9950.000
Group A52.8550.0012.1610.0112.9340.0022.9940.001
Group B12.8410.0042.2680.0052.9820.0032.9990.001
Group B22.8120.0212.2030.0052.9660.0062.9970.002
Group B32.8070.0042.1800.0112.9480.0062.9960.002
Group B42.7530.0022.1650.0022.9200.0012.9930.001
Group B52.7460.0062.1470.0022.9140.0022.9920.001
Table 5. Values of model parameters.
Strength/α0α1α2α3
CompressionValue−0.2610.1996.068−0.735
Equationσc = −0.261 + 0.199Φme + 6.068Ec − 0.735 (Φme·Ec)      R2 = 0.964    p < 0.0001
Strength/β0β1β2β3
TensileValue0.618−0.2283.3980.803
Equationσt = 0.618 − 0.228Φme + 3.398Ec + 0.803 (Φme·Et)      R2 = 0.985    p < 0.0001
Disclaimer/Publisher’s Note: The statements, opinions and data contained in all publications are solely those of the individual author(s) and contributor(s) and not of MDPI and/or the editor(s). MDPI and/or the editor(s) disclaim responsibility for any injury to people or property resulting from any ideas, methods, instructions or products referred to in the content.