Article

Integrated Bioprocess and Response Surface Methodology-Based Design for Hydraulic Conductivity Reduction Using Sporosarcina pasteurii

1
Department of Industrial Engineering, Faculty of Engineering and Nature Science, KTO Karatay University, Konya 42020, Türkiye
2
Department of Civil Engineering, Faculty of Engineering, Necmettin Erbakan University, Konya 42140, Türkiye
3
Department of Civil Engineering, Graduate School of Engineering, Nagoya University, Nagoya 464-8601, Japan
*
Author to whom correspondence should be addressed.
Minerals 2025, 15(11), 1215; https://doi.org/10.3390/min15111215
Submission received: 17 October 2025 / Revised: 9 November 2025 / Accepted: 14 November 2025 / Published: 18 November 2025
(This article belongs to the Section Biomineralization and Biominerals)

Abstract

This study examines key bioprocess parameters influencing the reduction in hydraulic conductivity in porous media via Microbially-Induced Calcite Precipitation (MICP), highlighting its relevance to environmental engineering applications such as bio-barriers and landfill liners. Sporosarcina pasteurii was utilized as the ureolytic bacterium to induce calcium carbonate precipitation under controlled laboratory conditions. Experimental variables included bacterial cell density (OD600), diameter of glass beads, concentrations of precipitation solution, bentonite, and yeast extract. A total of 42 experimental runs were conducted based on a custom design in Design-Expert software. Hydraulic conductivity was selected as the response variable to evaluate treatment performance. Response surface methodology (RSM) was applied to develop a second-order polynomial model, with statistical analyses indicating a strong model fit (R2 = 0.948, adjusted R2 = 0.929, predicted R2 = 0.868). ANOVA confirmed the significance of the main effects and interactions, particularly those involving glass bead diameter and OD600. Among the tested factors, the precipitation solution exhibited the strongest individual effect, while bentonite and yeast extract demonstrated supportive roles. Optimization revealed that a balanced combination of microbial density and chemical inputs minimized hydraulic conductivity to 0.0399 cm/s (≈95% reduction), with an overall desirability score of 1.000. Laboratory-scale experiments demonstrated field-scale applicability, underscoring the potential of biotechnological soil treatment and empirical modeling for developing sustainable low-permeability barriers.

1. Introduction

A viable and sustainable method of ground improvement, Microbially-Induced Calcite Precipitation (MICP) uses the metabolic activity of ureolytic bacteria, especially Sporosarcina pasteurii, to precipitate calcium carbonate (CaCO3) in soil pores. The method relies on the bacteria’s metabolic activities. Sporosarcina pasteurii uses urease to hydrolyze the urea to produce ammonia and carbon dioxide, and when calcium ions are present, the ammonia production raises the pH of the surrounding solution, causing calcite to precipitate [1]. The majority of the studies used the hydrolysis of urea in a calcium chloride solution to produce Ca++ [2,3,4]. The steps in the reaction and the final result can be recognized as [5]
N H 2 C O N H 2 + H 2 O u r e a s e 2 N H 3 + C O 2
    2 N H 3 + 2 H 2 O 2 N H 4 + + 2 O H
    C O 2 + O H H C O 3
  C a C l 2 C a 2 + + 2 C l
      C a 2 + + H C O 3 + O H C a C O 3 + H 2 O
Net reaction
      N H 2 C O N H 2 + C a C l 2 + 2 H 2 O 2 N H 4 + + 2 C l + C a C O 3
This biologically driven mineralization process was used as biotechnology technique to improve the strength, stiffness, and permeability of the soil [6,7,8], enhancing building supplies [9], sealing cracks [10], making a physical barrier to prevent the intrusion of seawater [11]. Because of its potential to handle geotechnical and environmental issues, such as liquefaction mitigation, erosion management, and permeability adjustment in soil-based hydraulic barriers, MICP has drawn a lot of interest recently [12,13,14,15].
Among the most important uses of MICP is the decrease in hydraulic conductivity in granular and sandy soils [7]. The accumulation of calcite crystals in pore spaces caused by the MICP process reduces flow path connectivity and, consequently, permeability [15,16]. For uses including landfill liner enhancement, groundwater contamination containment, and seepage management in earth constructions, MICP has become a desirable technique [17,18,19]. However, bacterial cell concentration, cementation solution composition, injection volume and rate, treatment cycles, and curing duration are some of the connected elements that affect how well permeability is reduced [20,21,22].
Empirical modeling is crucial to better understand the impact of particle size, supporting material, cell density, and nutrient source, and to enhance treatment procedures because of the intricacy and nonlinear nature of MICP processes. Multiple regression models, machine learning techniques, and response surface methodology (RSM) are examples of empirical approaches that have been successfully used to optimize the MICP treatment process [11,23,24]. By determining the best circumstances for reaching desired permeability levels and offering insights into dominating parameters and their interactions, these models aid in the reduction in experimental effort and expenses.
Although Microbially-Induced Calcite Precipitation (MICP) using S. pasteurii has been widely investigated, its combined optimization through multivariable response surface modeling remains limited. The present study introduces a systematic integration of biological (OD600), chemical (precipitation solution and nutrient composition), and physical (particle size and bentonite content) factors within a customized RSM framework. This design enables simultaneous evaluation of multiple interactive effects on hydraulic conductivity reduction. Furthermore, the environmental and ethical advantages of MICP—such as reduced chemical waste, biocompatibility, and potential field scalability—underscore its relevance as an eco-efficient soil treatment technology. Hence, this study hypothesizes that a balanced combination of microbial activity and chemical input can achieve a measurable and reproducible reduction in hydraulic conductivity, contributing novel insights into the optimization of bio-mediated permeability control.

2. Materials and Methods

In this study, 42 experiments were carried out in a randomized order based on a custom design, offering a flexible framework that accommodates specific models, categorical factors, and both constrained and irregular design spaces. All analysis and optimization tasks were performed using Design-Expert v11.0.5.0 [25]. The independent variables—also known as operational parameters—were OD600, diameter of glass beads, precipitation solution, bentonite, and yeast extract. The dependent variable, or response, was the square root of the hydraulic conductivity (Y). The effectiveness of the experimental design was evaluated based on the degree of hydraulic conductivity reduction achieved.

2.1. Experimental Design and Parameters

Clogging tests were conducted at 22 °C using S. pasteurii (ATCC 11859) to induce calcium carbonate precipitation. The Tris-YE medium (pH 9.0), containing Tris buffer, ammonium sulfate, and yeast extract, was prepared and sterilized separately for bacterial cultivation. The cultures were harvested at the late exponential phase, corresponding to the highest urease activity as determined from preliminary trials. The cells were grown overnight, centrifuged, washed, and resuspended in distilled water to reach an optical density of 2.25 at 600 nm (OD600 = 2.25 ≈ 2.15 × 10⁹ cells mL−1), measured using a spectrophotometer (Hitachi U-1900, Tokyo, Japan). The OD600 values were converted to viable cell concentrations through a calibration curve established via plate counting. Plastic syringes (50 mL) (Terumo SS-50ESZ, Terumo Corporation, Tokyo, Japan) were used to make a column with an internal diameter of 3 cm and height of 10 cm, packed with glass beads of varying sizes (0.05, 0.25, 1.0, 2.0, and 3.0 mm; Potters-Ballotini Co. Ltd., Ibaraki, Japan), denoted as GB0.05 to GB3.0. The pore volume of the columns was 25 mL [16]. The setup followed previously validated MICP column studies [16,19] to ensure comparability, and the experiments were terminated when the hydraulic conductivity variation between consecutive measurements was below 5%, confirming reproducibility and consistent endpoint conditions.
The bacterial suspension (100 mL, equivalent to four pore volumes) containing S. pasteurii at a density of 2.15 × 10⁹ cells/mL was added at a rate of 2 mL/min in the experiments which included bacteria by employing a peristaltic pump. The suspension was kept consistent throughout the 50 min period using a magnetic stirrer. A sterilized precipitation solution (0.5 M CaCl2 and 0.5 M urea, pH 6.8) was then continuously fed into the column at a rate of 3 mL/min until the hydraulic conductivity became stable in the experiments using precipitation solution without nutrient source. The hydraulic conductivity was determined using a manometer [16].
The effect of bentonite on decreasing hydraulic conductivity was evaluated by preparing a bentonite suspension in distilled water with extensive magnetic stirring, including 4.5 g of bentonite (5% of the bead weight) in 25 mL. Only 0.12% of the bentonite (Wako Pure Chemical Industries, Ltd., Osaka, Japan) had particles smaller than 0.45 µm, and the mean particle size was 5.0 µm. It also had a low calcium concentration. Following the previously mentioned bacterial suspension and precipitation solution, this suspension was injected into the column at a rate of 2 mL/min. Then, the change in hydraulic conductivity was measured [19].
Yeast extract was also added to the precipitation solution at 2% w/v (pH 6.8) in order to examine its nutritional impact. The peristaltic pump was used to introduce the solution at a rate of 3 mL/min.
The experiment was stopped before all of the solution had been injected when the low hydraulic conductivity and high internal pressure caused leaking at the column joints [19].

2.2. Overview of Experimental Design (DoE)

The main objective of planning and conducting experiments is to obtain accurate and unbiased results. In this regard, Design of Experiments (DoE) offers a structured and efficient method for organizing experiments while maintaining scientific integrity. It involves using a predefined experimental framework and applying statistical analysis to gain meaningful conclusions from a minimal number of trials. DoE allows for the simultaneous assessment of several factors, helping to lower experimental costs and uncover interactions between variables. The process usually starts with a broad analysis of many parameters and gradually narrows down to focus on the most significant ones [26]. A summary of the factors, coded levels, and actual values used in the experimental design has been included in Table 1 to facilitate reproducibility and cross-comparison with future studies.

2.3. Explanation of Response Surface Methodology

Response surface methodology (RSM), originally proposed by Box and Wilson in 1951, is a mathematical and statistical tool used to build empirical models and optimize outcomes. It investigates how multiple input variables influence one or more output responses, aiming to enhance the latter [27]. RSM involves applying polynomial models—most often second-order (quadratic) equations—to data obtained through carefully structured experiments. These models effectively represent curved relationships in complex systems, though higher-order equations may be used when needed. In this method, independent variables are represented as xi (where i ≥ 1), and the response variable, Y, signifies the measurable output being optimized. The relationship between xi and Y is typically modeled using a polynomial function assessed across various input levels.
y = f(x1, x2, x3,…, xi,…, xk) + ɛ
The term ε denotes the error or random noise in the response Y, representing the unexplained variation within the system. xi stands for the ith independent variable, and k is the total count of input variables incorporated in the model. The expected or predicted response, called the response surface, is expressed as a function of these variables and is typically written as
E(y) = f(x1, x2, x3, …, xi, …, xk)
In many applications of response surface methodology, the precise relationship between the input variables and the response is not known at the outset. As a result, the initial phase of RSM focuses on analyzing the system to identify an appropriate approximation that captures how the response variable Y interacts with the input variables. When the relationship among the inputs is purely linear, a first-order (linear) polynomial model is sufficient to describe the system [9].
y = β0 + β1 × 1 + β2 x2+… + βi xi +… + βk xk + ɛ
If the system exhibits curvature, a linear model is insufficient to describe the response accurately. In these situations, a higher-order polynomial—most commonly a second-order model—is used. This model includes linear, quadratic (nonlinear), and interaction terms for the independent variables xi, enabling a more precise representation of the system’s complexity and capturing the influence of interactions between variable pairs.
y = β 0 + i = 1 k β i x i + i = 1 k β i i   x i 2 + i < j β i j x i x j + ε
Analysis of Variance (ANOVA) is a statistical technique used to separate the total variation in a dataset into components linked to specific sources of variability. It plays a crucial role in evaluating the accuracy and significance of fitted models in experimental studies. The ANOVA table summarizes this analysis through several key metrics:
  • Sum of Squares (SS): Measures the total variation in the data, dividing it into contributions from different sources, such as treatments and error.
  • Degrees of Freedom (df): Represents the number of independent values available to estimate parameters, indicating the amount of usable information in the analysis.
  • Mean Square (MS): Obtained by dividing each sum of squares by its associated degrees of freedom; it reflects the variance for each source. The treatment mean square indicates differences between group means and helps test the significance of model factors.
  • F-ratio (F value): The ratio of the treatment mean square to the error mean square. This statistic is used to test hypotheses and is compared against a critical value from the F-distribution based on a chosen significance level (typically α = 0.05).
  • p-value: Indicates the probability that the observed results occurred under the null hypothesis. A p-value below 0.05 generally suggests that the observed effects are statistically significant and not due to random variation.
Together, these components form the foundation for assessing model performance and determining the reliability of conclusions drawn from experimental data.
An essential tool in response surface methodology is the desirability function, originally proposed recently [27]. It serves as an objective function in multi-response optimization, converting each response into a standardized scale from 0 (least desirable) to 1 (most desirable), represented by di. The overall desirability is commonly calculated as the geometric mean of the individual desirability values across all responses. This combined metric yields a single value that can be maximized to identify the optimal operating conditions during numerical optimization.
  D = d 1 × d 2 × ×   d n 1 n = i = 1 n d i 1 n  

3. Results and Discussion

Table 2 summarizes the experimental runs generated by the response surface methodology (RSM) design and the resulting hydraulic conductivity values. Each run represents a unique combination of optical density (OD600), glass bead diameter, bentonite content, yeast-extract concentration, and precipitation-solution ratio. The data illustrate how variations in these biological and physicochemical factors influence permeability reduction, providing the basis for the statistical analysis and model development presented in the subsequent sections.

3.1. Normal Probability Plot of Residuals

To evaluate the statistical validity of the regression model, a normal probability plot of externally studentized residuals was constructed (Figure 1). This plot compares the distribution of the residuals to a theoretical normal distribution, where alignment along the reference line indicates that the residuals are normally distributed.
As shown in Figure 1, the majority of the residuals align closely with the reference line, suggesting that the model satisfies the assumption of normality. Only a few data points deviate slightly at the tails, potentially indicating outliers or marginally influential observations. However, the number and extent of these deviations are minimal and do not significantly impact the overall validity of the model. Consequently, the assumption of normally distributed residuals is considered to be met, affirming the reliability of the statistical inferences drawn from the model.

3.2. Perturbation Analysis

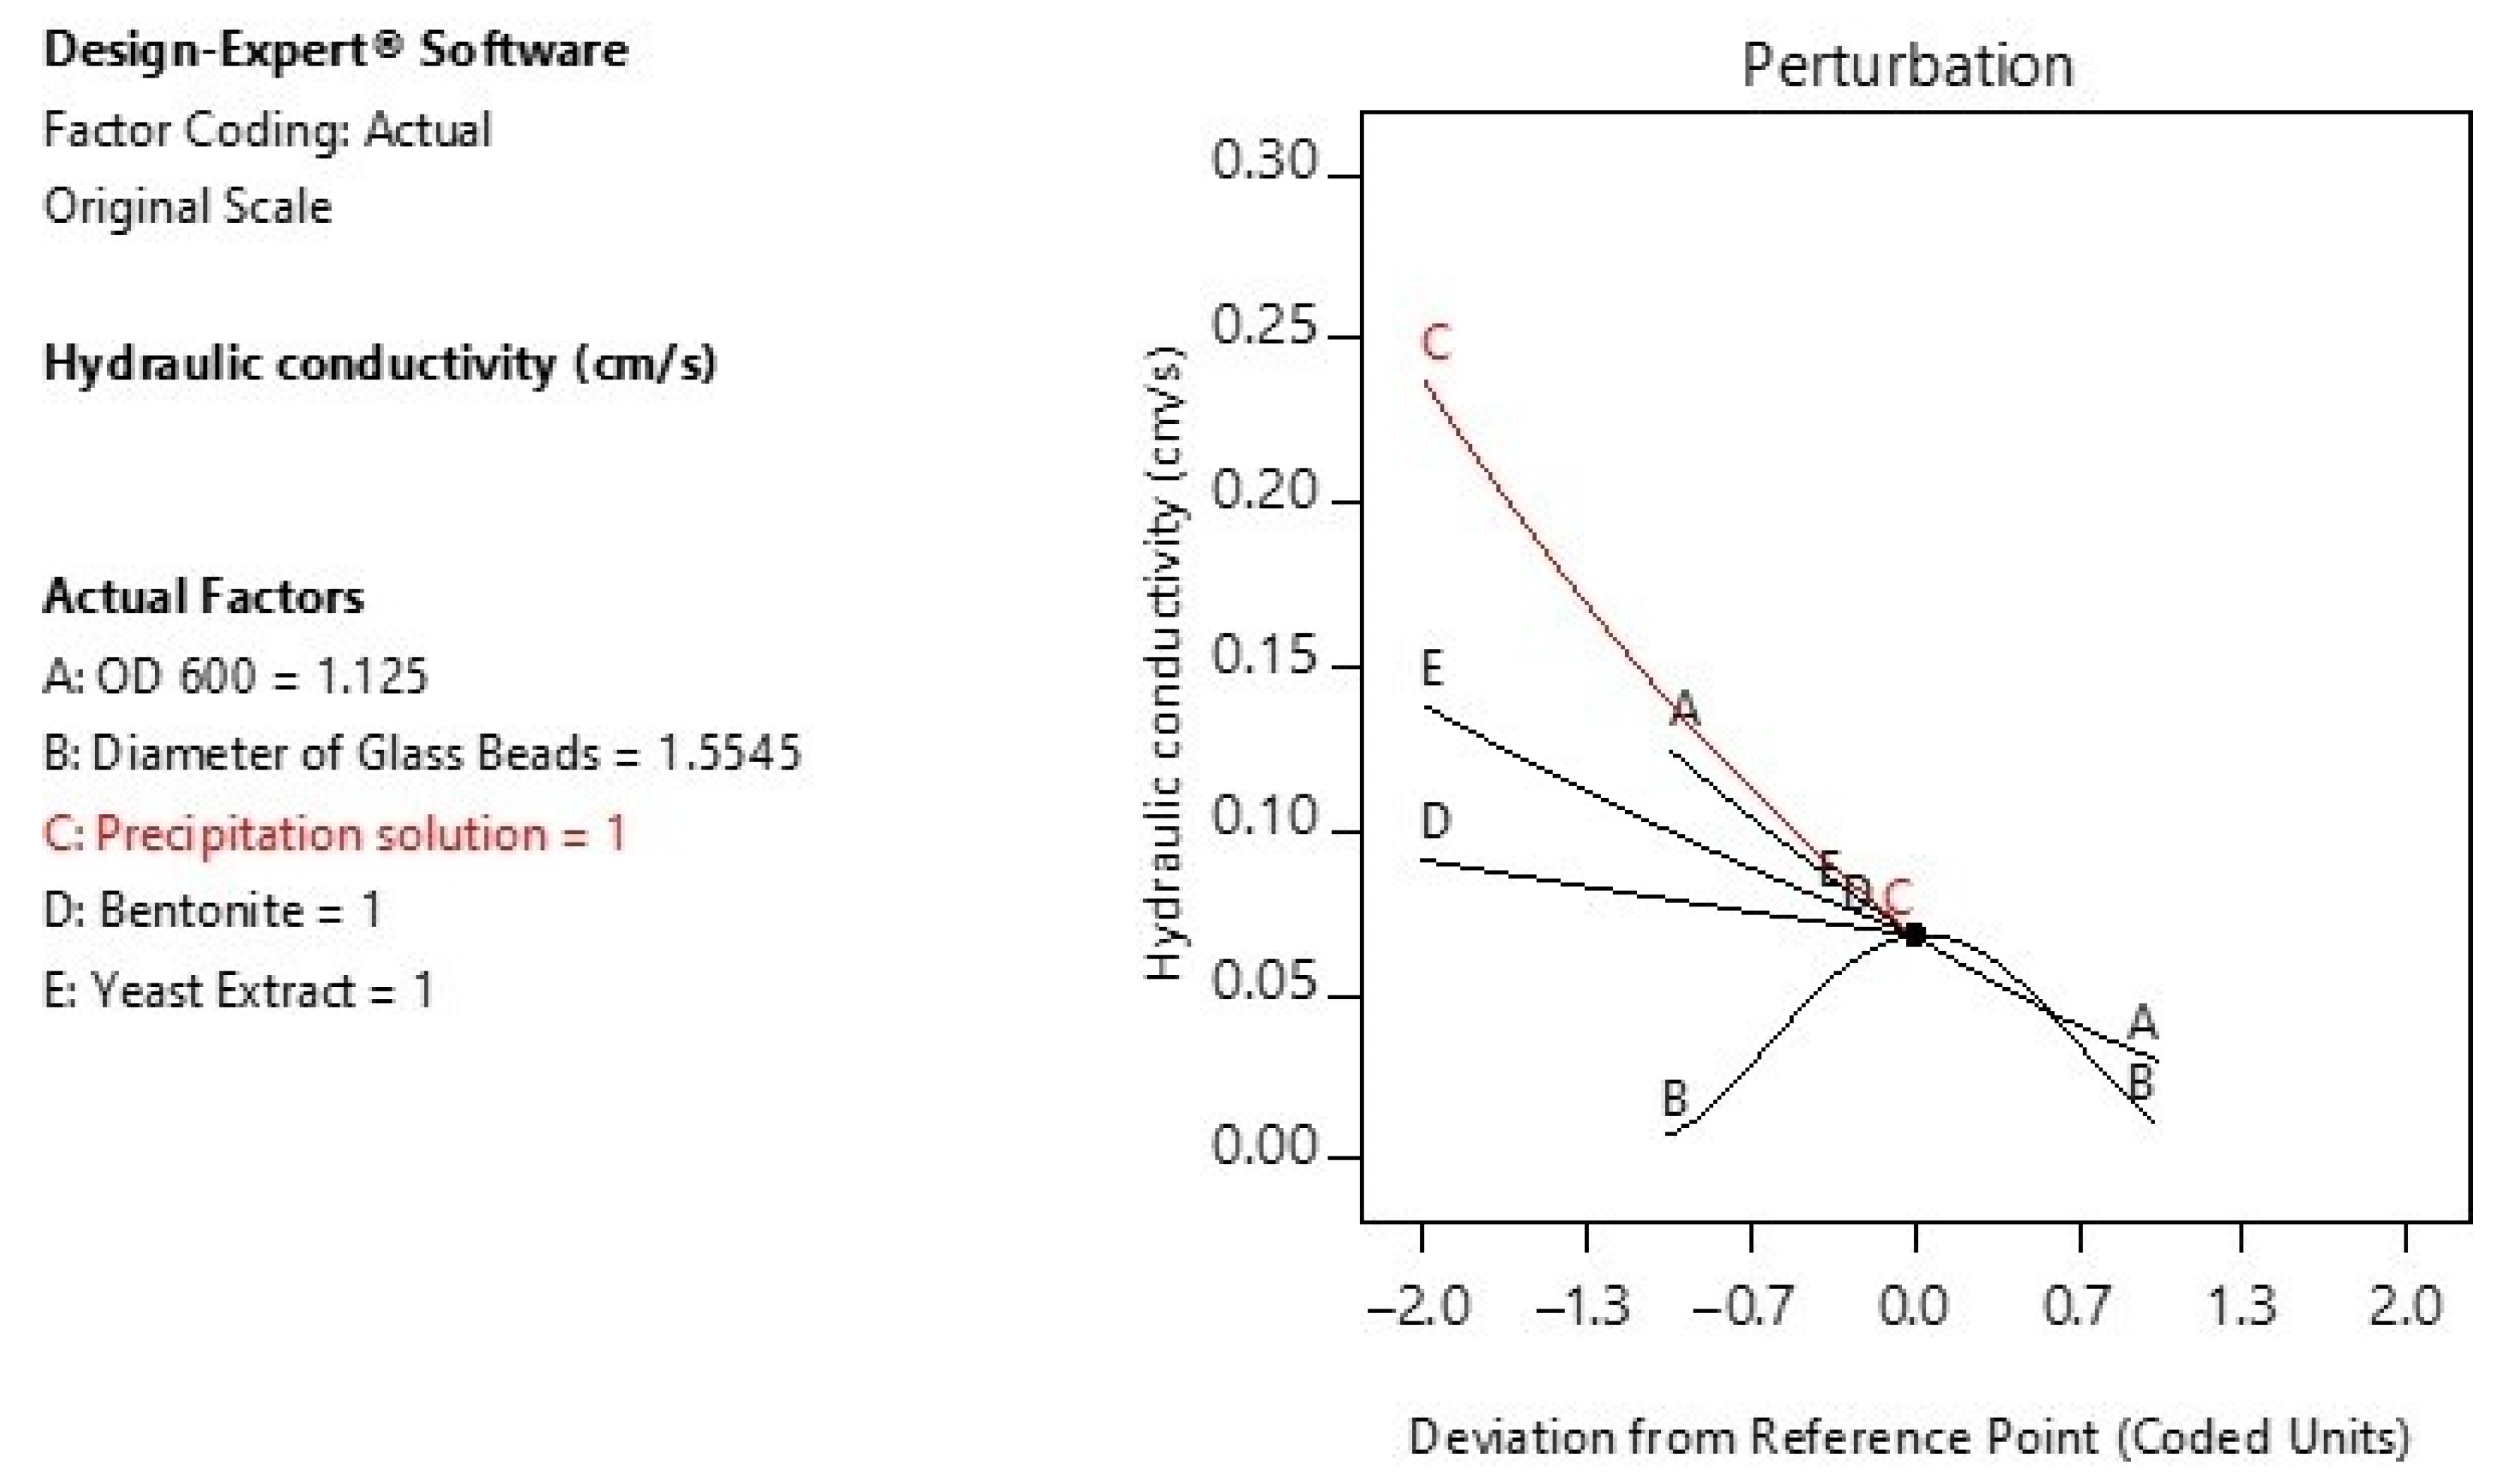
To determine the relative sensitivity of hydraulic conductivity to changes in each independent variable, a perturbation plot was generated (Figure 2). This plot shows the effect of varying one factor at a time from the reference point, while keeping all others constant.
The analysis reveals that variable C (Precipitation solution) exhibits the greatest influence on hydraulic conductivity, as indicated by the steepest slope in the perturbation curve. Variables A (OD600) and B (Diameter of Glass Beads) also show moderate effects. Conversely, factors D (Bentonite) and E (Yeast Extract) have nearly flat curves, indicating that variations in these parameters have negligible impact on the response within the studied range. These results suggest that efforts to optimize hydraulic conductivity should prioritize adjustment of the precipitation solution, followed by OD600 and glass bead diameter.
The statistical and graphical analyses confirm that the developed regression model for hydraulic conductivity is valid, with residuals demonstrating approximate normality. Among the five factors studied, the precipitation solution (C) emerges as the most influential variable, followed by OD600 (A) and glass bead diameter (B). Bentonite (D) and yeast extract (E) show minimal individual effects within the tested range. However, interaction warnings suggest the need for multivariate optimization approaches that consider potential synergies between variables. These findings provide a strong foundation for further process optimization and predictive modeling of permeability behavior in engineered systems.

3.3. Main Effects of Individual Factors

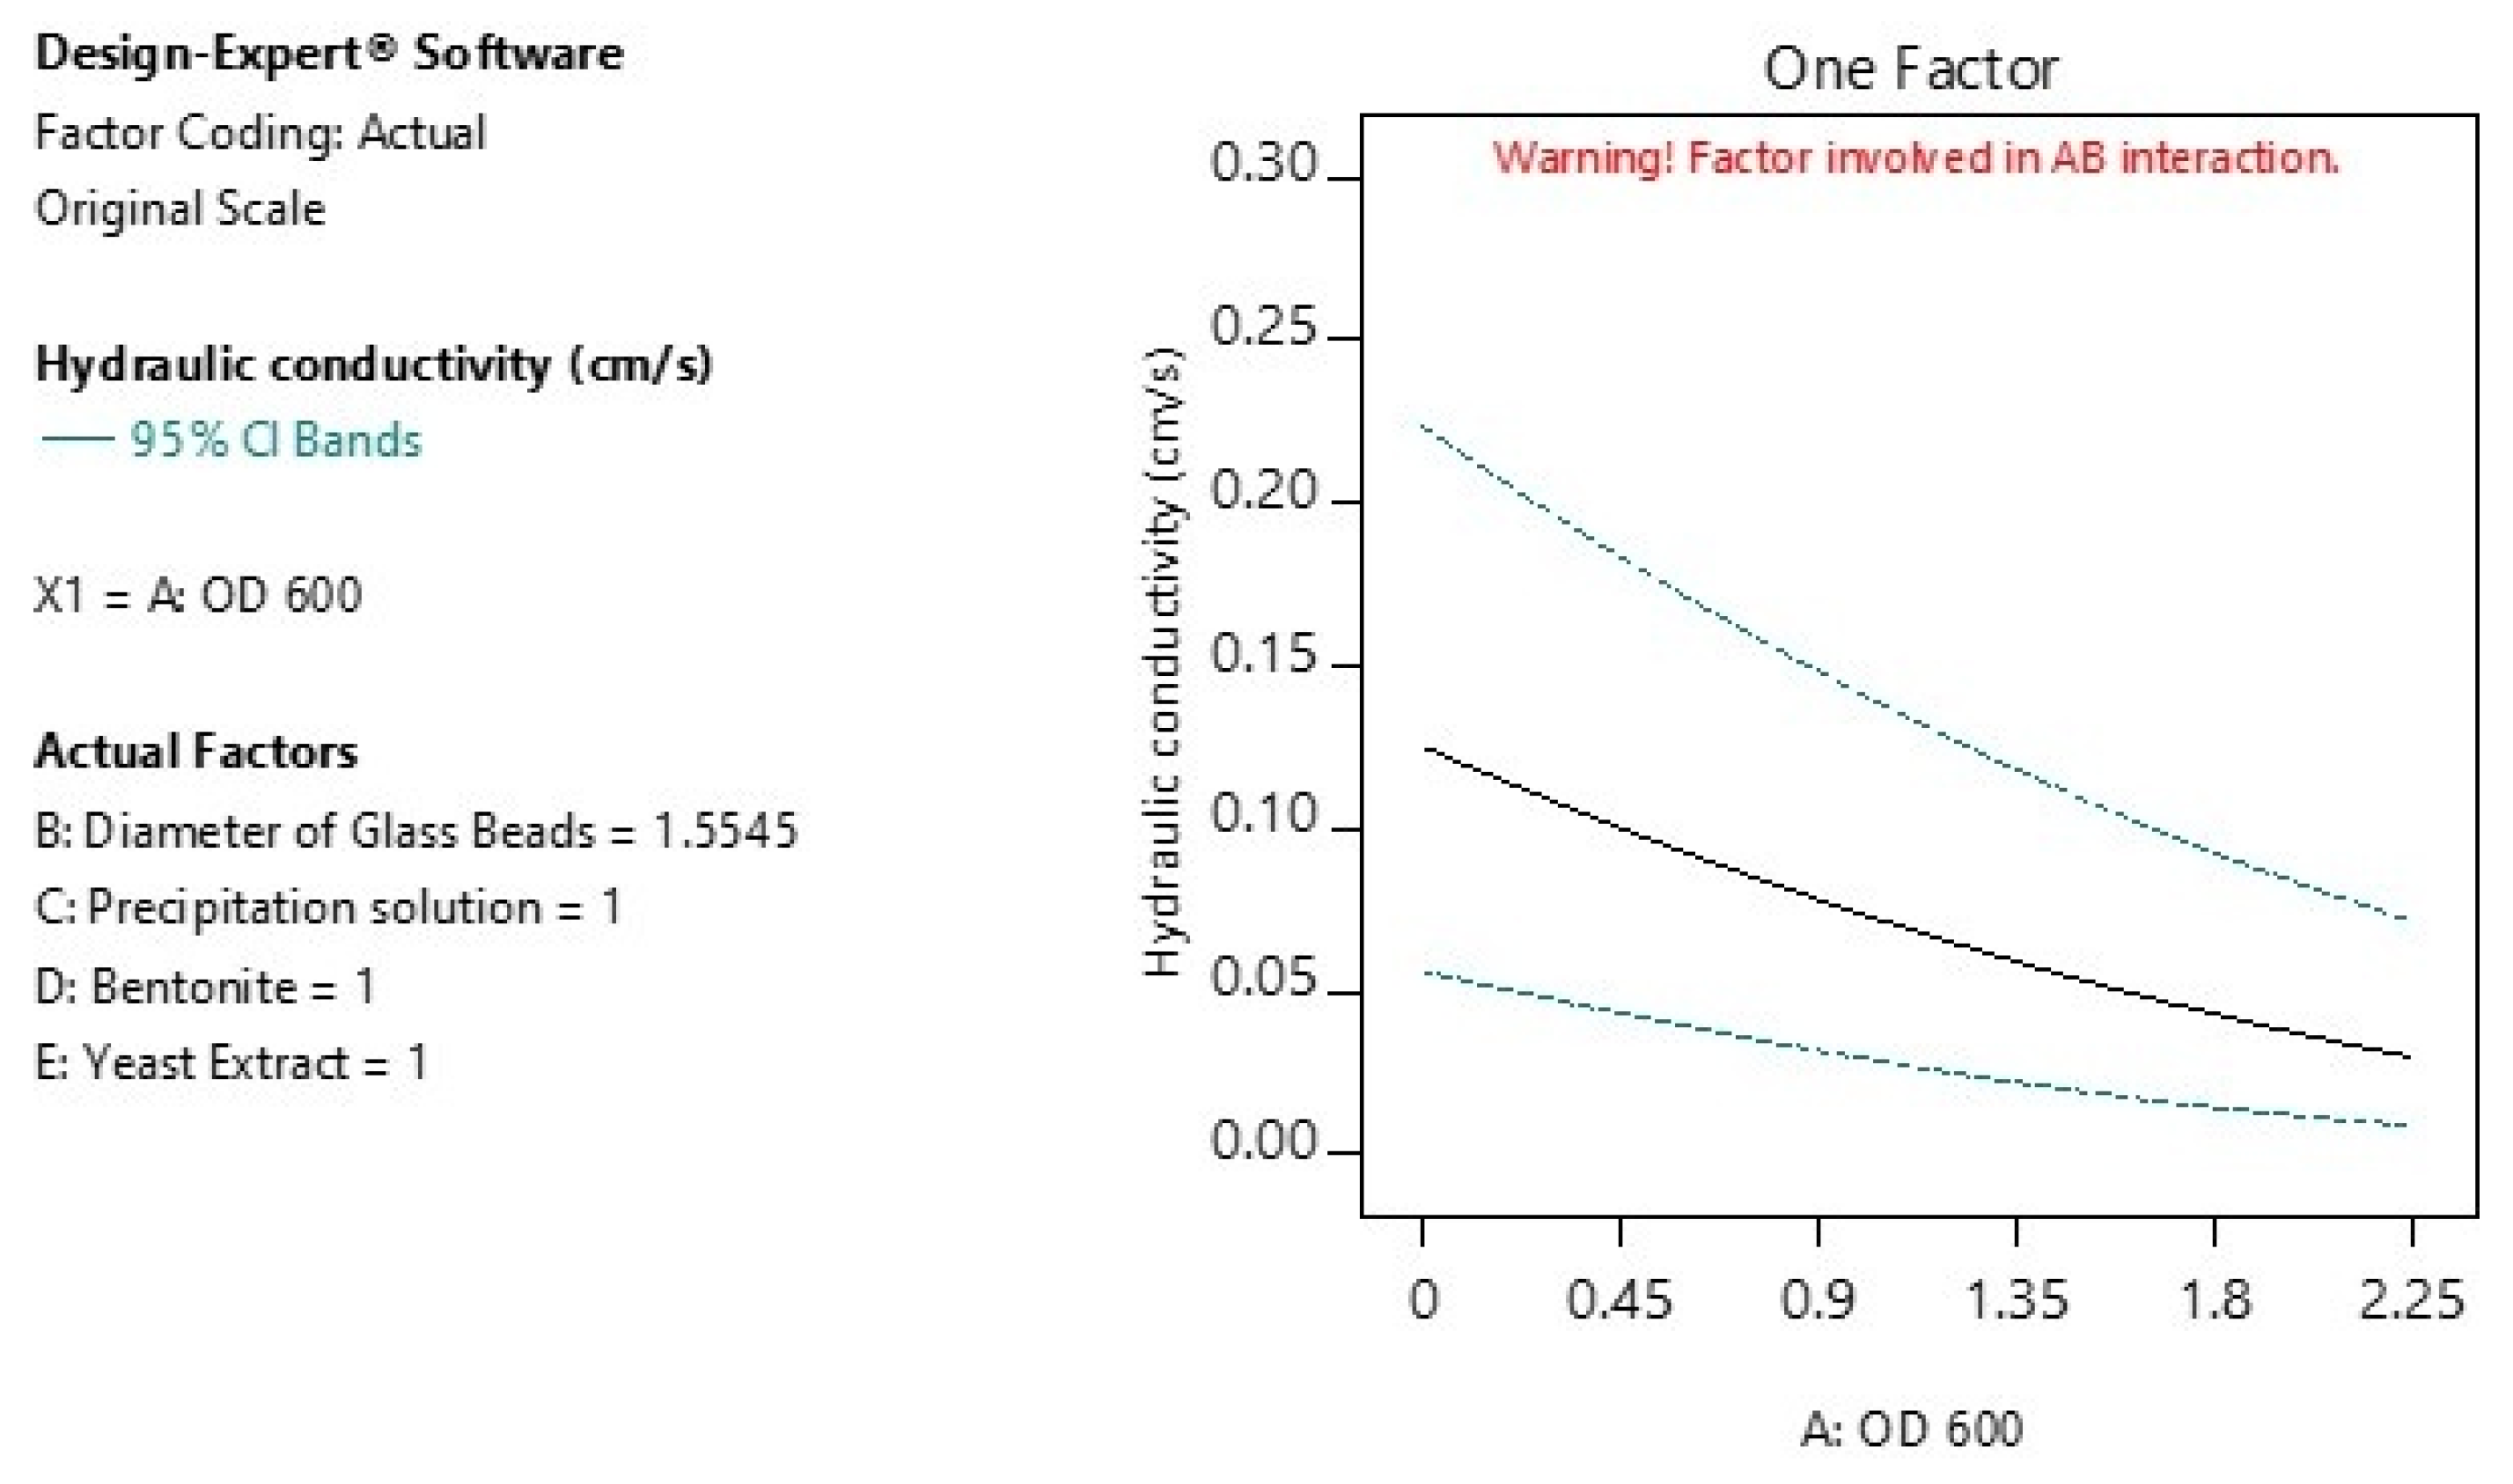
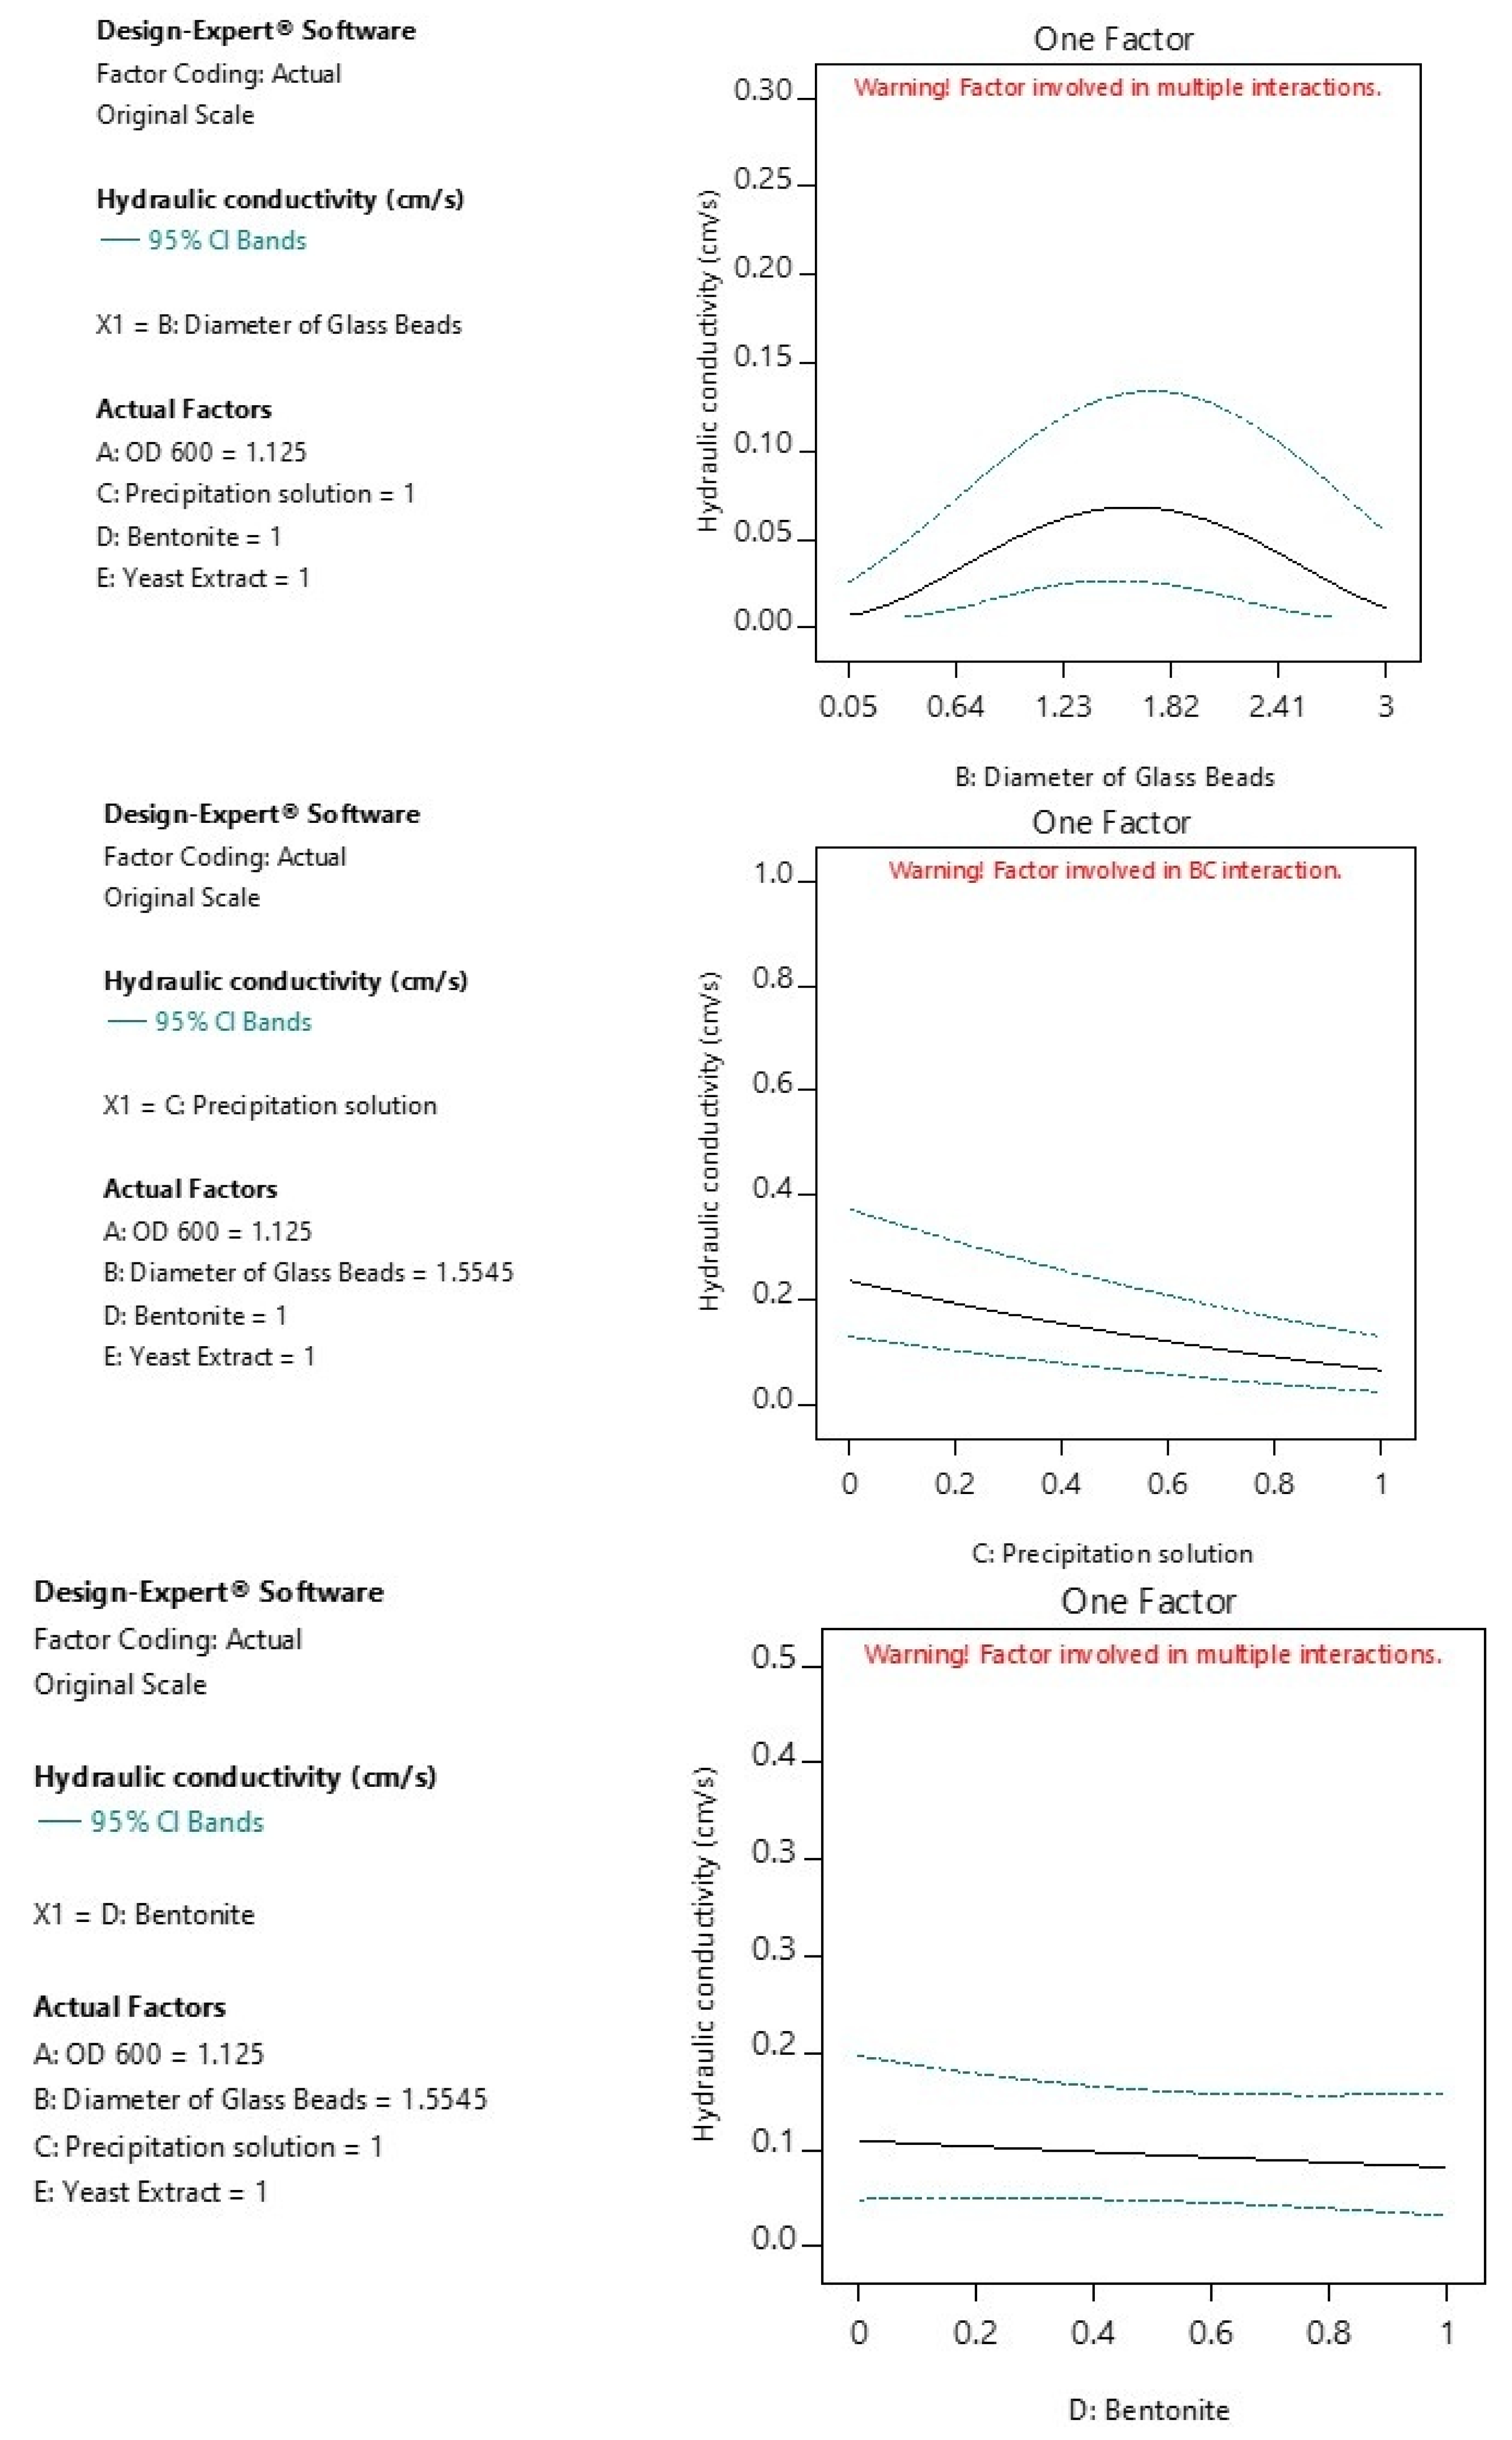
Figure 3 displays the main effects plots for all five experimental variables. Each graph illustrates the isolated effect of a single factor on hydraulic conductivity while holding the others constant. The dashed blue lines represent 95% confidence intervals, and the red vertical lines indicate the levels used in the actual experimental run.
  • Factor A—OD600: Shows a moderate negative effect on hydraulic conductivity with increasing values, but the impact remains small.
  • Factor B—Diameter of Glass Beads: Exhibits minimal influence, with a shallow curvature suggesting a weak interaction with other variables.
  • Factor C—Precipitation Solution: Demonstrates the most significant effect, showing a strong inverse relationship with hydraulic conductivity. The broader CI bands reflect some variability.
  • Factor D—Bentonite and E—Yeast Extract: Both display negligible effects, with nearly flat slopes and narrow confidence bands. While bentonite and yeast extract exhibited minimal main effects (p < 0.05), their significance emerged through interaction terms.
Interactions between BE and BD were identified as compensatory effects, suggesting that the limited individual influence of bentonite and yeast extract is offset when combined with glass bead diameter.
All factors are flagged as being involved in multiple interactions, as indicated by the software warnings. This implies that although the main effects for certain variables may appear limited, their role in higher-order interactions could still be significant and should be considered in model refinement and process optimization.
In general, larger particle sizes are expected to result in higher hydraulic conductivity due to increased pore spaces. However, in our experiments, a nonlinear trend was observed because of the combined effects of microbial activity and calcium carbonate precipitation. At larger bead diameters, localized CaCO3 deposition tended to occur preferentially at pore throats, leading to partial clogging and a reduction in effective permeability.
Figure 4 presents a scatter plot of predicted versus actual values for the response variable square root of hydraulic conductivity (√K, cm/s). The solid diagonal line represents the ideal 1:1 relationship, indicating perfect model predictions. Data points are color-coded based on the magnitude of the response variable, ranging from blue (low √K, 0.001 cm/s) to red (high √K, 0.915 cm/s).
The clustering of data points closely along the diagonal line suggests a strong agreement between predicted and observed values, demonstrating the high predictive accuracy of the model. Additionally, the smooth transition in color along the gradient confirms the model’s capacity to capture the variation in hydraulic conductivity across the entire response range. There is no evident systematic bias, and the residuals appear to be randomly distributed, supporting the validity of the regression model used. This diagnostic plot confirms the model’s robustness and suitability for estimating the square root of hydraulic conductivity under the experimental conditions studied.
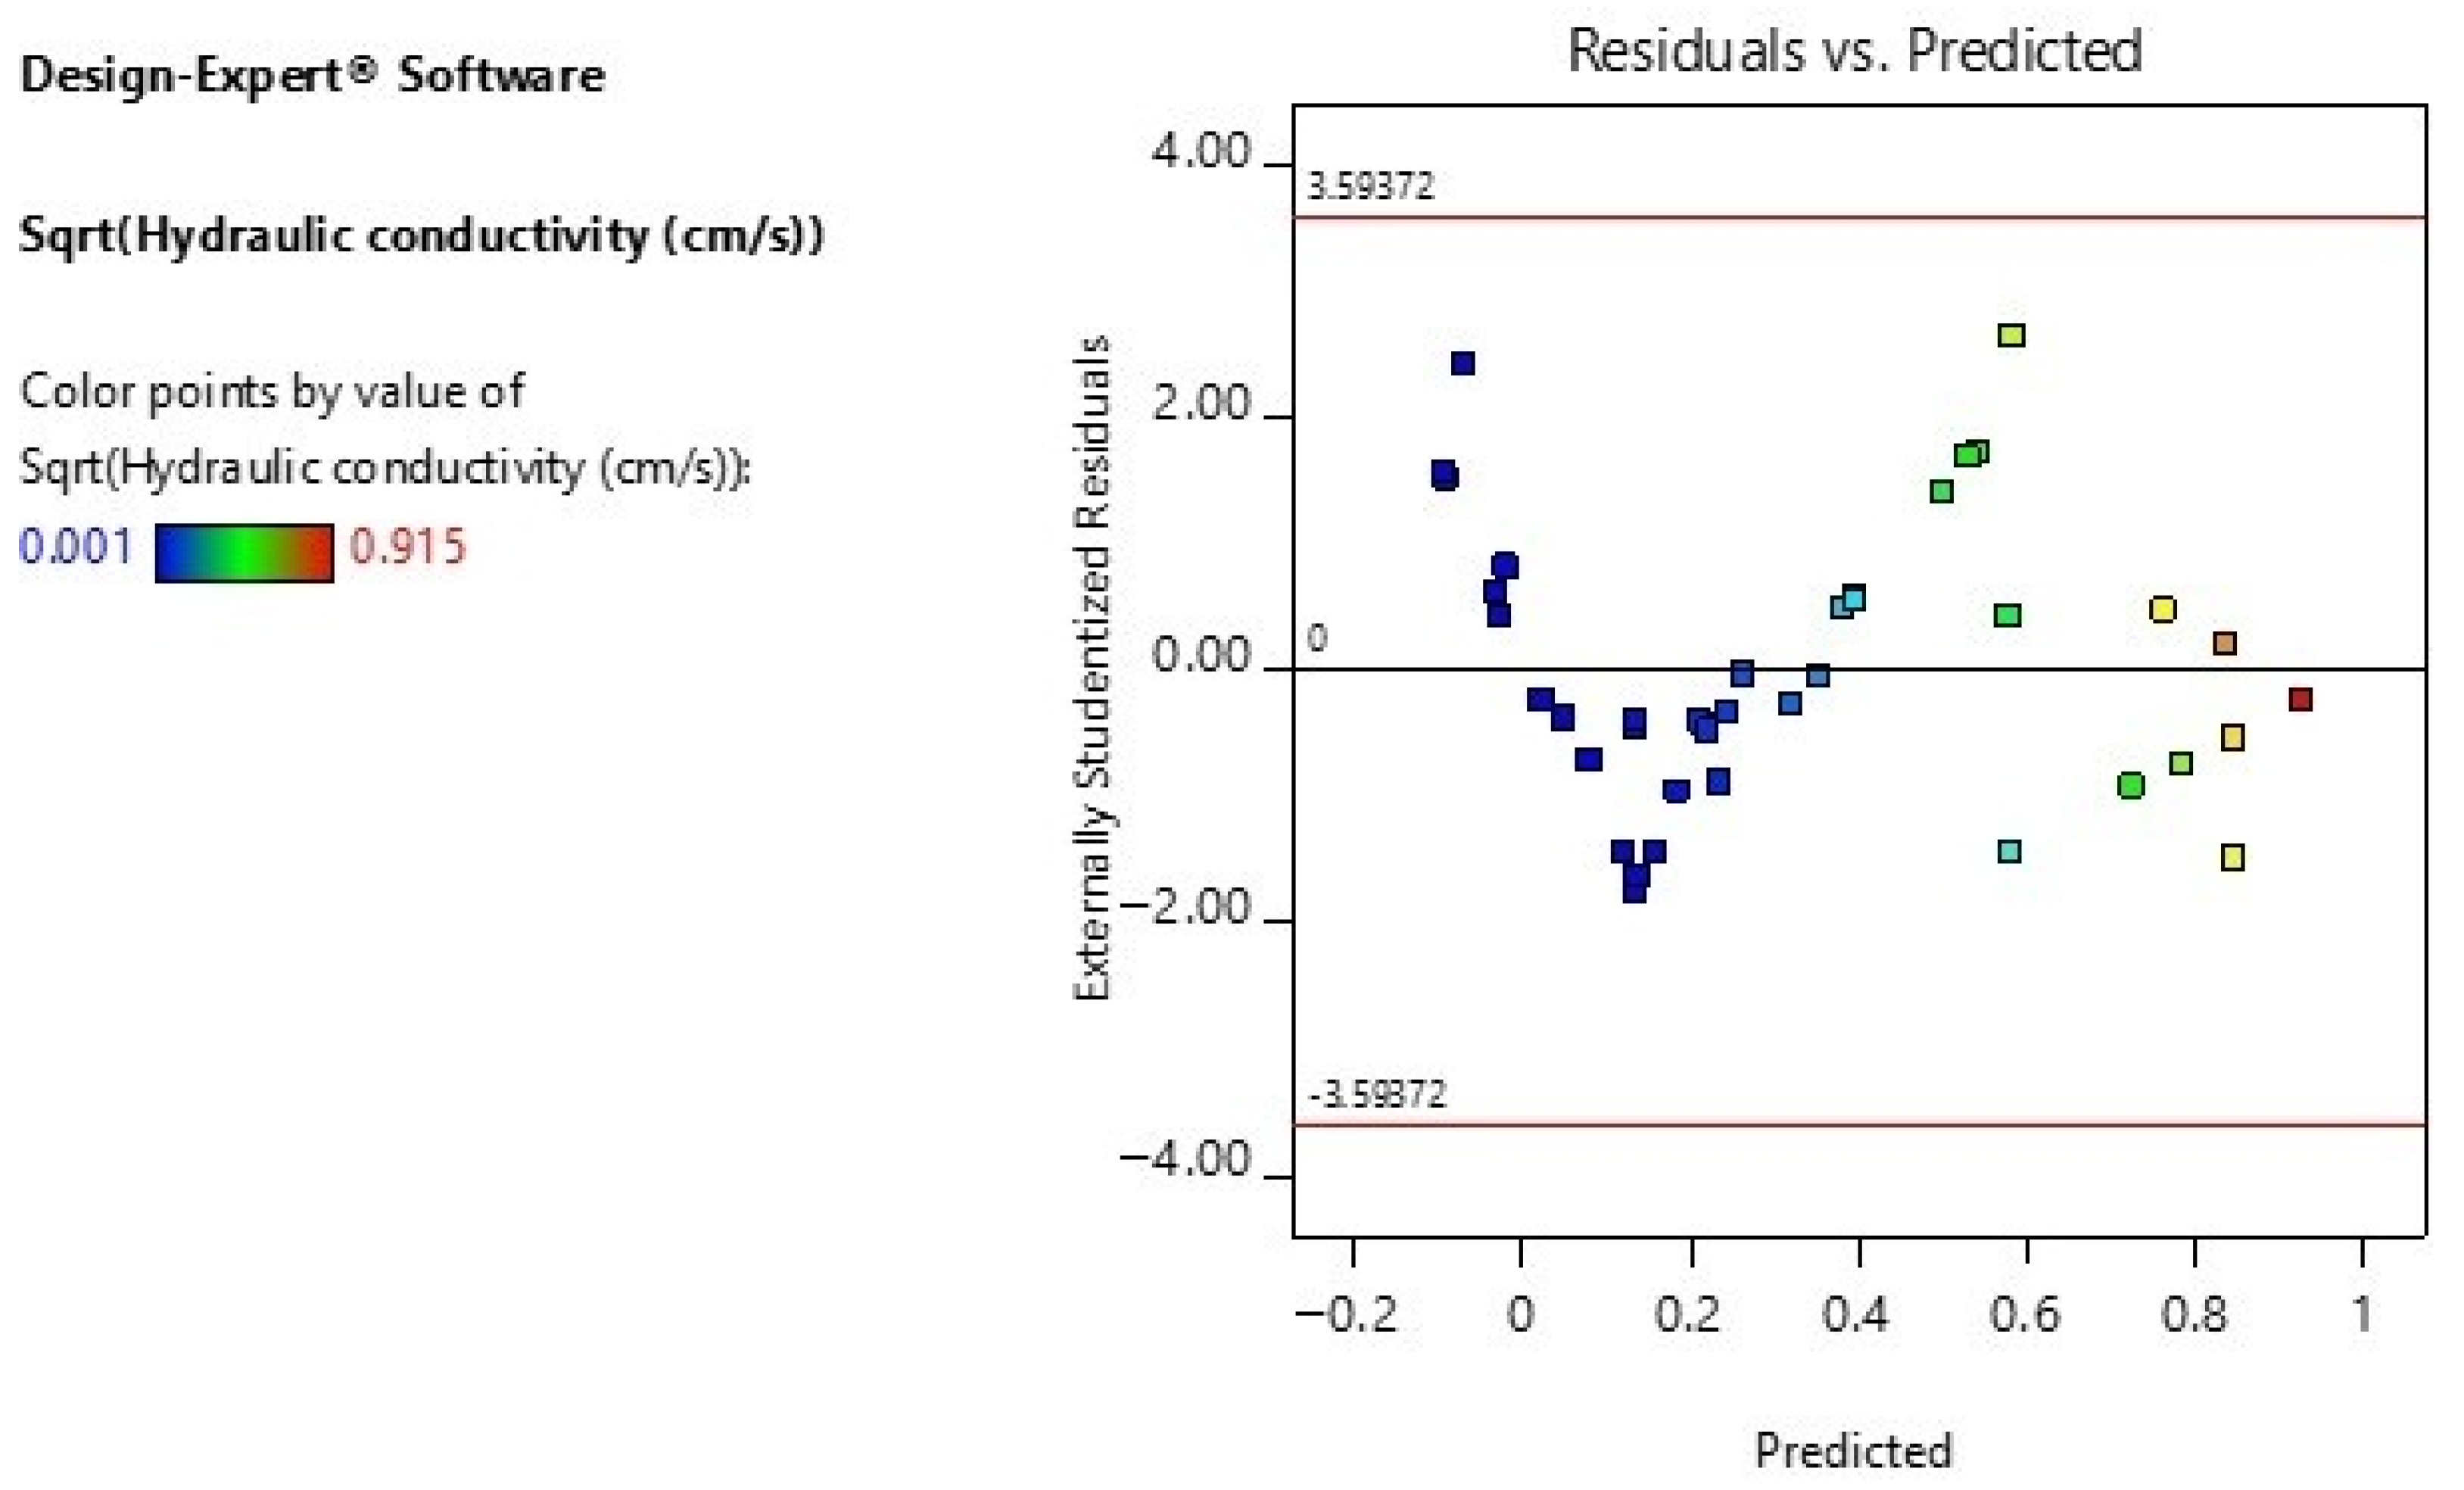
Figure 5 illustrates the distribution of externally studentized residuals against the predicted values of √K (cm/s), providing insight into the model adequacy and assumption validity.
The residuals are color-coded based on the magnitude of the predicted square root of hydraulic conductivity, ranging from blue (low values) to red (high values). The red horizontal lines at ±3.59372 mark the critical values for outlier detection; points lying beyond these thresholds would typically be considered potential outliers.
The majority of residuals are confined within the ±3.59 limits, indicating no significant outliers and that the model fits the data reasonably well. The distribution of residuals appears relatively homoscedastic (i.e., constant variance), although a slight funnel-shaped pattern may be emerging, suggesting a potential increase in variance with larger predicted values. Residuals are scattered around the zero line without any clear systematic trend, which supports the assumption of independence and linearity. The absence of clustering or curvature in the residual pattern confirms that no major model mis-specification exists. Overall, Figure 5 provides supporting evidence for the reliability and robustness of the regression model used to predict the square root of hydraulic conductivity.
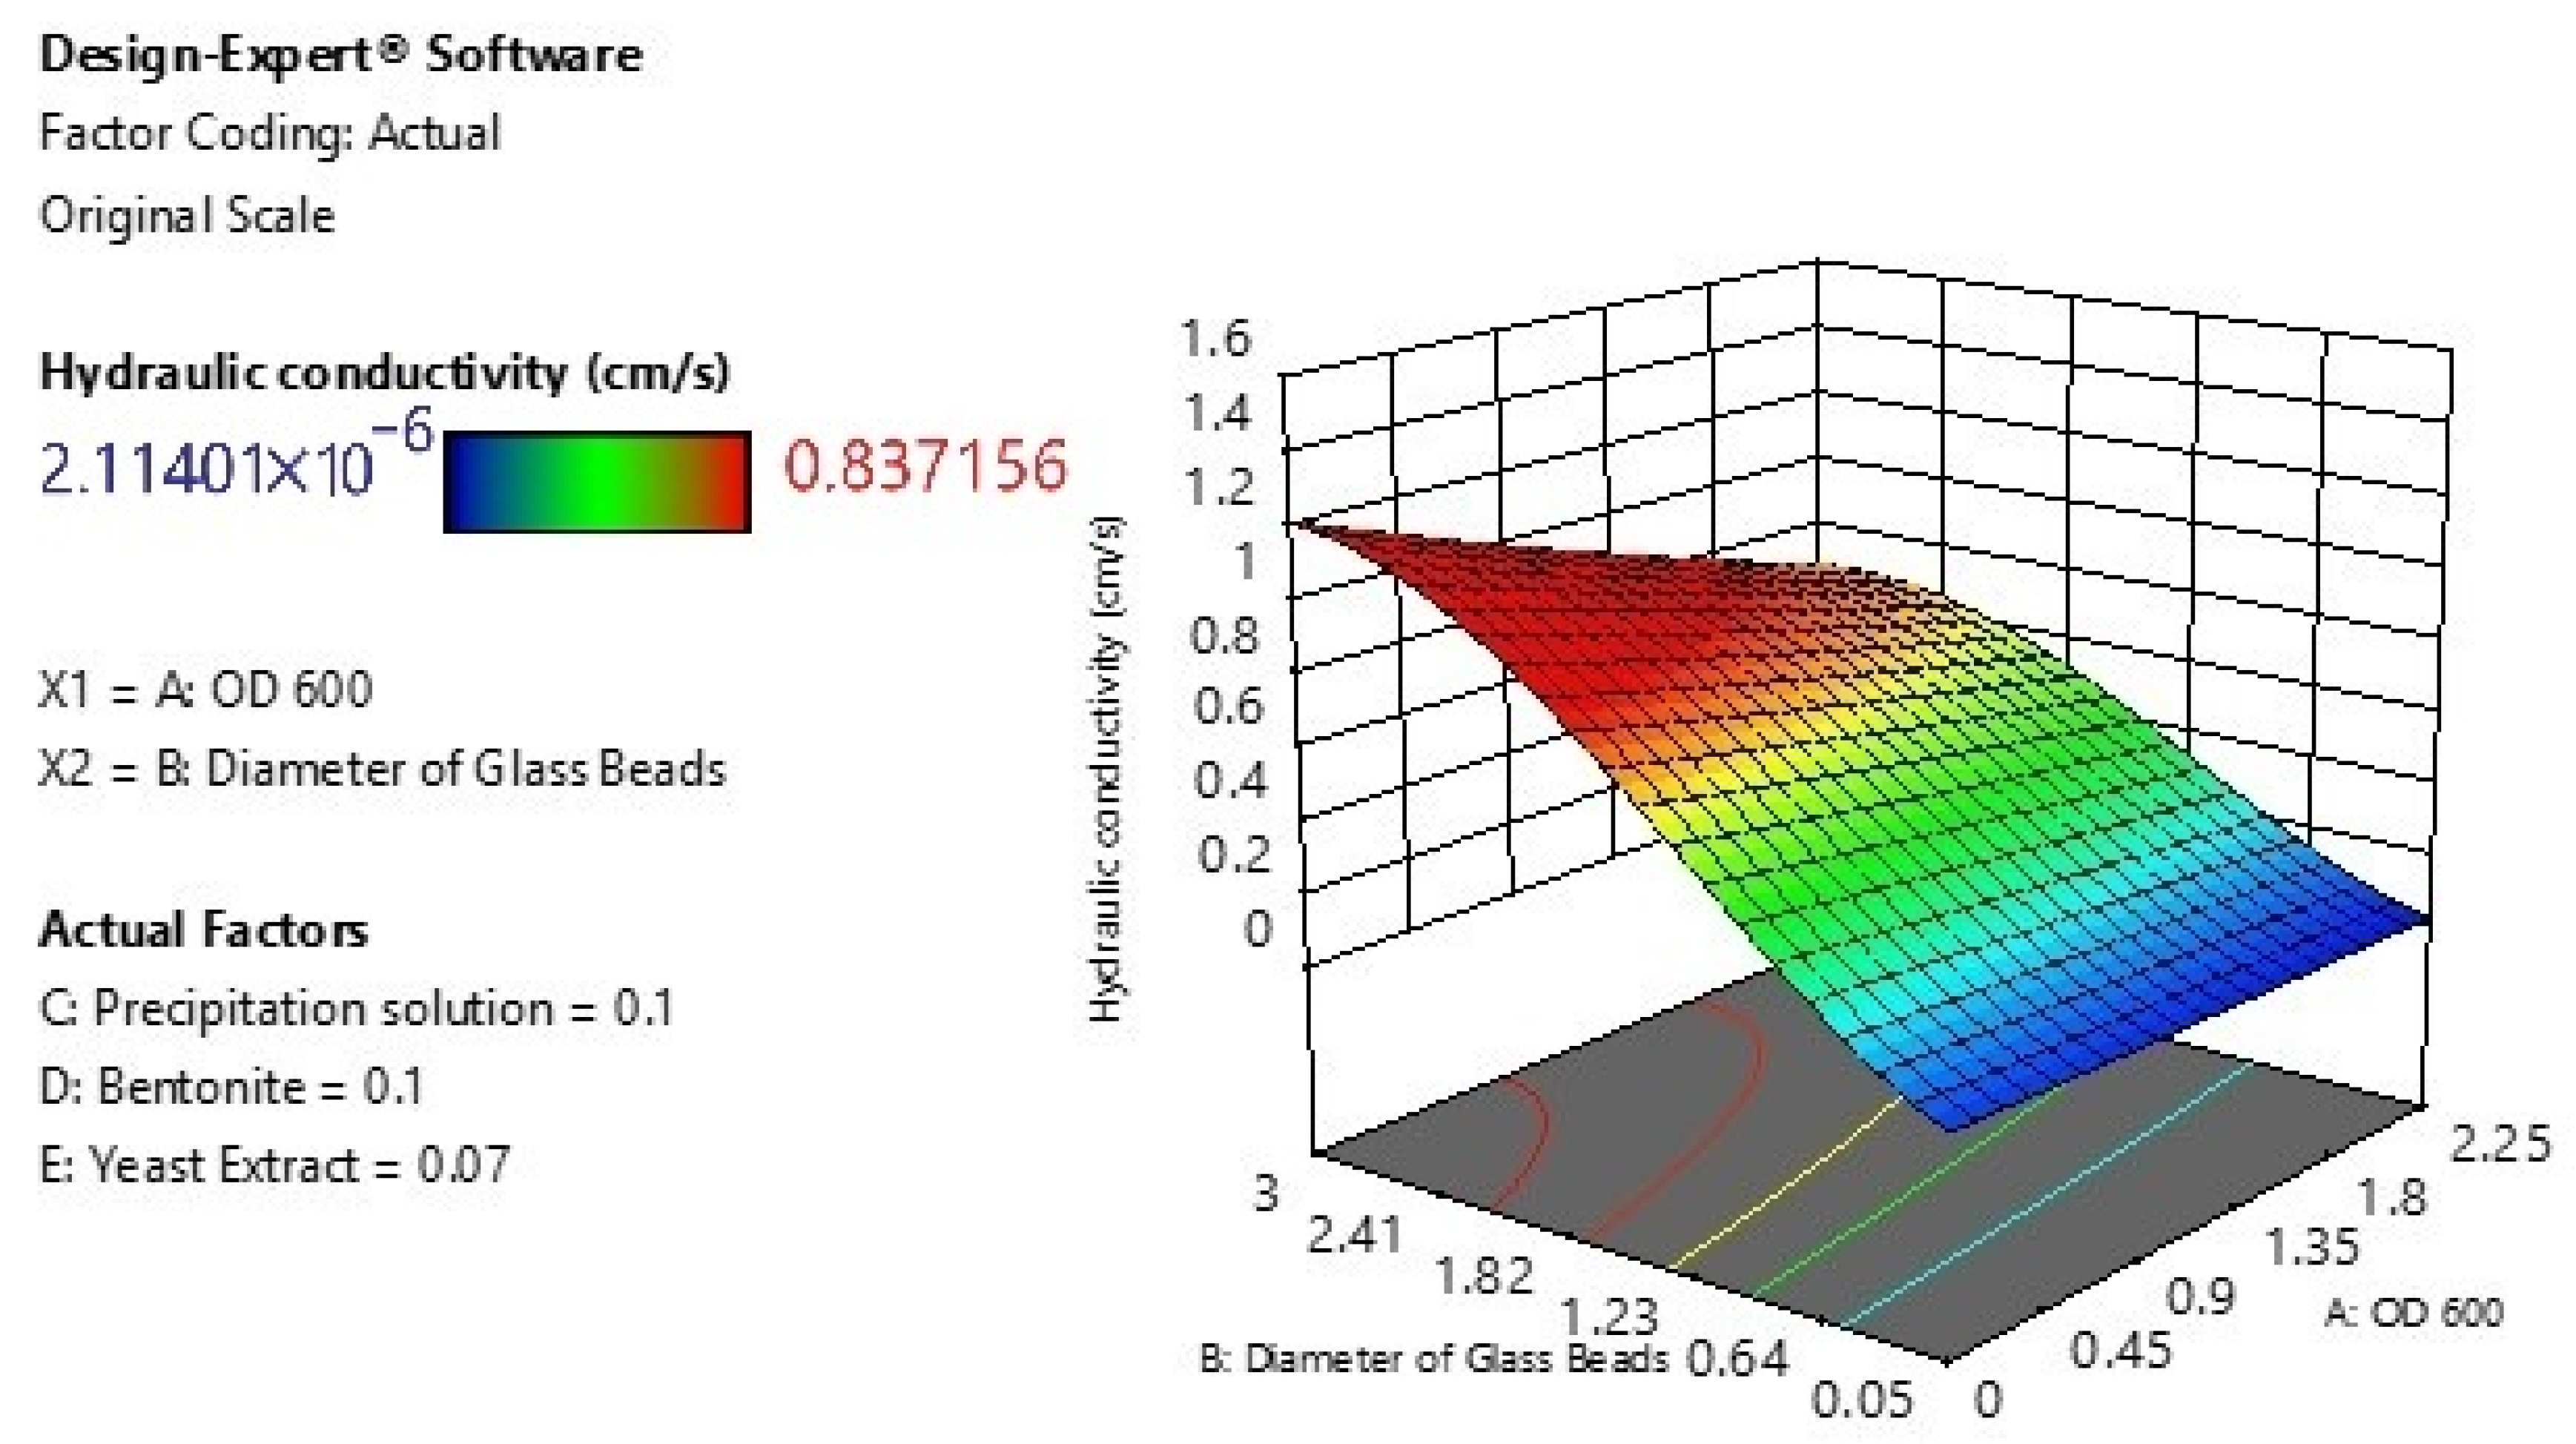
Figure 6 illustrates the interactive effects of OD600 (A) and diameter of glass beads (B) on hydraulic conductivity (cm/s), under fixed levels of the other experimental factors (Precipitation solution = 0, Bentonite = 0, Yeast Extract = 0).
The surface is colored according to the predicted hydraulic conductivity values, ranging from blue (low conductivity) to red (high conductivity). The data points are overlaid and color-coded to show their deviation from predicted values; solid red points represent observations where the actual conductivity was greater than predicted, while hollow pink points indicate lower than predicted values.
A decreasing trend in hydraulic conductivity is observed with increasing OD600 and decreasing glass bead diameter. The surface curvature suggests a strong interaction effect between OD600 and glass bead diameter on the response. The contour lines on the base plane provide further evidence of this interaction, showing a nonlinear relationship. The relatively good alignment between actual data points and the surface indicates a well-fitting model, with minor deviations for a few runs.
Figure 6 provides critical insight into how microbial density (OD600) and media structure (glass bead size) jointly influence the permeability of the system, which is essential for optimizing hydraulic conductivity in practical applications such as bio-barrier systems or porous media engineering.
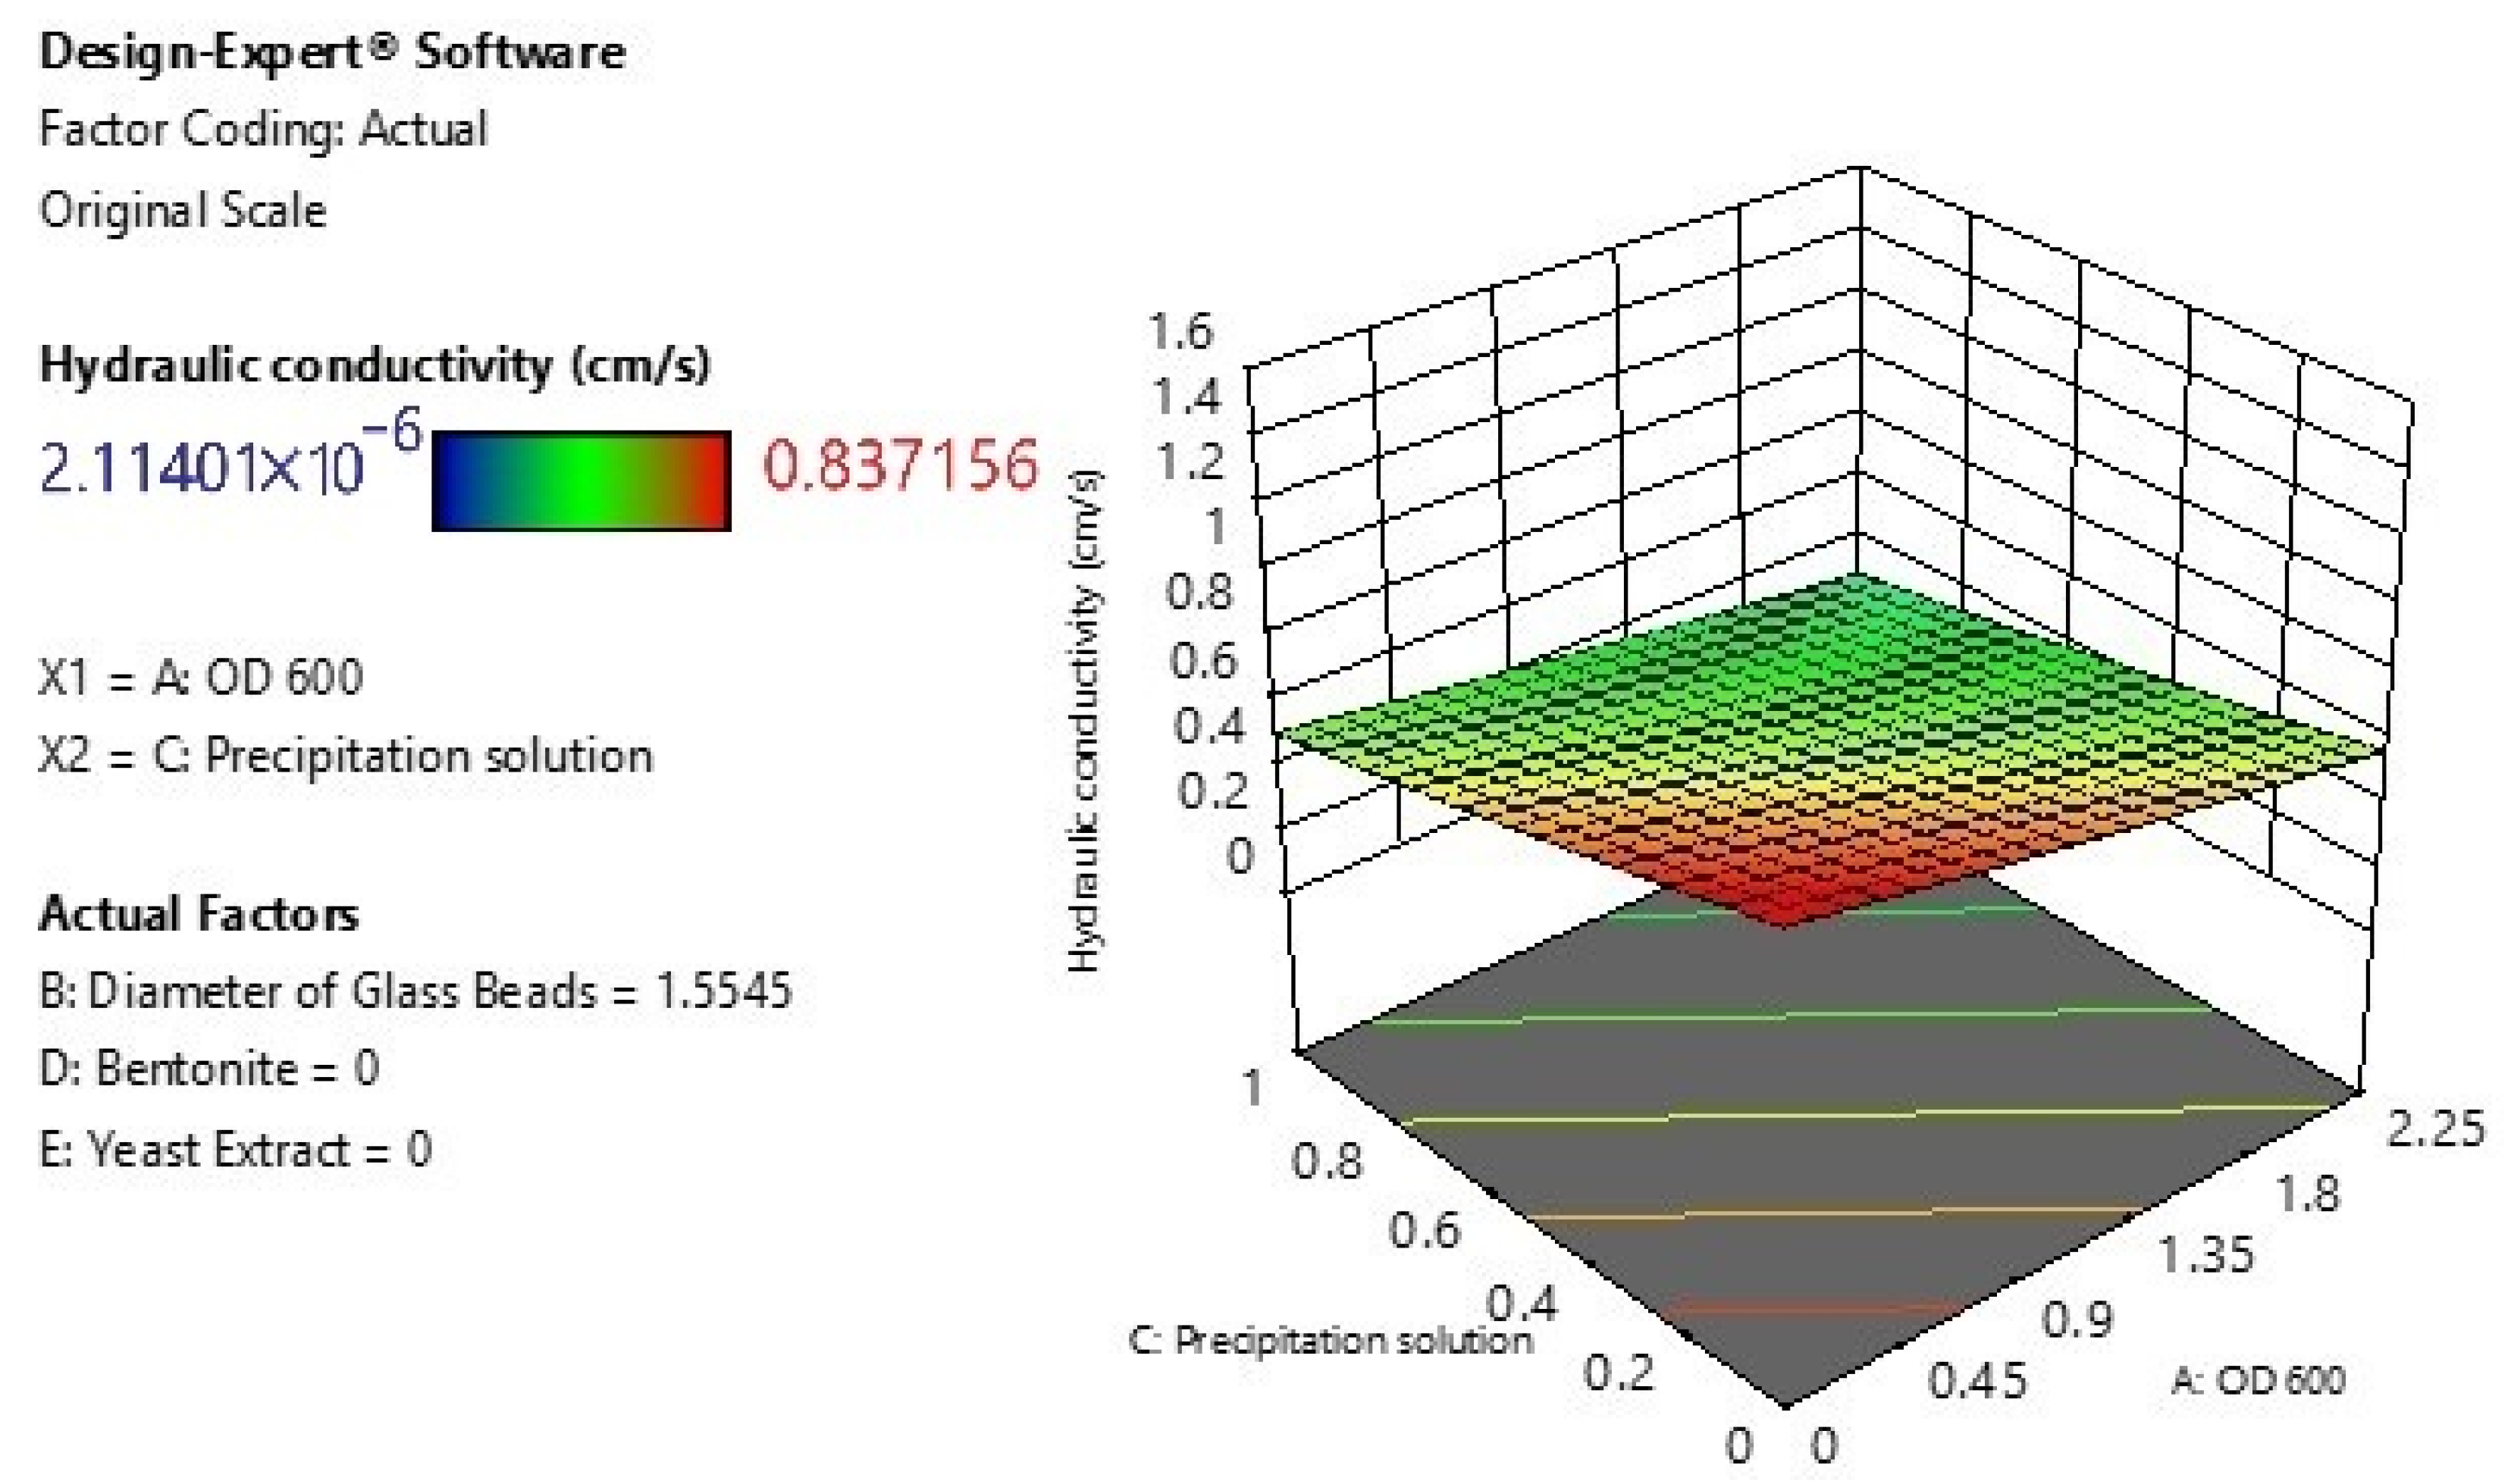
Figure 7 displays the interaction effect of optical density at 600 nm (OD600, denoted as factor A) and precipitation solution concentration (factor C) on the hydraulic conductivity (cm/s) of the treated porous media. The color gradient ranges from blue (2.11401 × 10⁻⁶ cm/s) to red (0.837156 cm/s), indicating the minimum and maximum values of hydraulic conductivity, respectively.
As the OD600 increases from 0.25 to approximately 2.25, there is a noticeable decrease in hydraulic conductivity, especially at lower levels of precipitation solution. This suggests that higher bacterial density significantly enhances the precipitation of calcium carbonate, leading to more effective pore plugging. An inverse relationship is also observed between the concentration of the precipitation solution and hydraulic conductivity. As the precipitation solution increases, the hydraulic conductivity tends to decrease slightly, particularly at moderate OD600 levels. The interaction surface demonstrates that the lowest hydraulic conductivity (blue region) is achieved when both the OD600 and precipitation solution are at their maximum levels. Conversely, the highest hydraulic conductivity (red region) occurs at the lowest OD600 and precipitation solution values, where microbial activity and calcite formation are minimal. The diameter of glass beads was fixed at 1.525 mm, and both bentonite and yeast extract were excluded (set to zero), thus isolating the effects of OD600 and precipitation solution. This figure provides strong visual and quantitative evidence that microbial density (OD600) and precipitation solution concentration play crucial roles in reducing hydraulic conductivity through microbially induced calcium carbonate precipitation (MICP). These findings support the potential of optimizing biological and chemical inputs to achieve desirable permeability reductions in geoengineering applications.
Figure 8 shows the interaction between OD600 (A)—representing bacterial cell density—and bentonite content (D) on the hydraulic conductivity of a porous medium. Hydraulic conductivity (cm/s) is presented as the response variable, with values visualized using a color gradient ranging from the minimum (2.11401 × 10⁻⁶ cm/s, blue) to the maximum (0.837156 cm/s, red) (Figure 8).
Similarly to previous findings, an increase in OD600 results in a significant reduction in hydraulic conductivity. This trend is attributed to the enhanced microbial activity and subsequent calcium carbonate precipitation, which reduces pore spaces and permeability. Increasing bentonite content alone does not show a steep change in hydraulic conductivity, indicating that bentonite at the levels studied has a relatively moderate effect on permeability compared to OD600. The lowest hydraulic conductivity values are observed at high OD600 and high bentonite content, implying a synergistic effect where both biological (MICP) and physical (bentonite filling) mechanisms contribute to pore clogging and permeability reduction. However, the effect of bentonite is less pronounced when OD600 is low. To isolate the effects of OD600 and bentonite, the diameter of glass beads was fixed at 1.525 mm, and both the precipitation solution and yeast extract were excluded (set to zero). This figure underscores the dominant influence of microbial concentration (OD600) on hydraulic conductivity, while bentonite shows a secondary, supportive role. The interaction suggests that the combination of microbial precipitation and fine particle inclusion (bentonite) may enhance sealing efficiency in subsurface applications such as biobarriers or groundwater control systems.
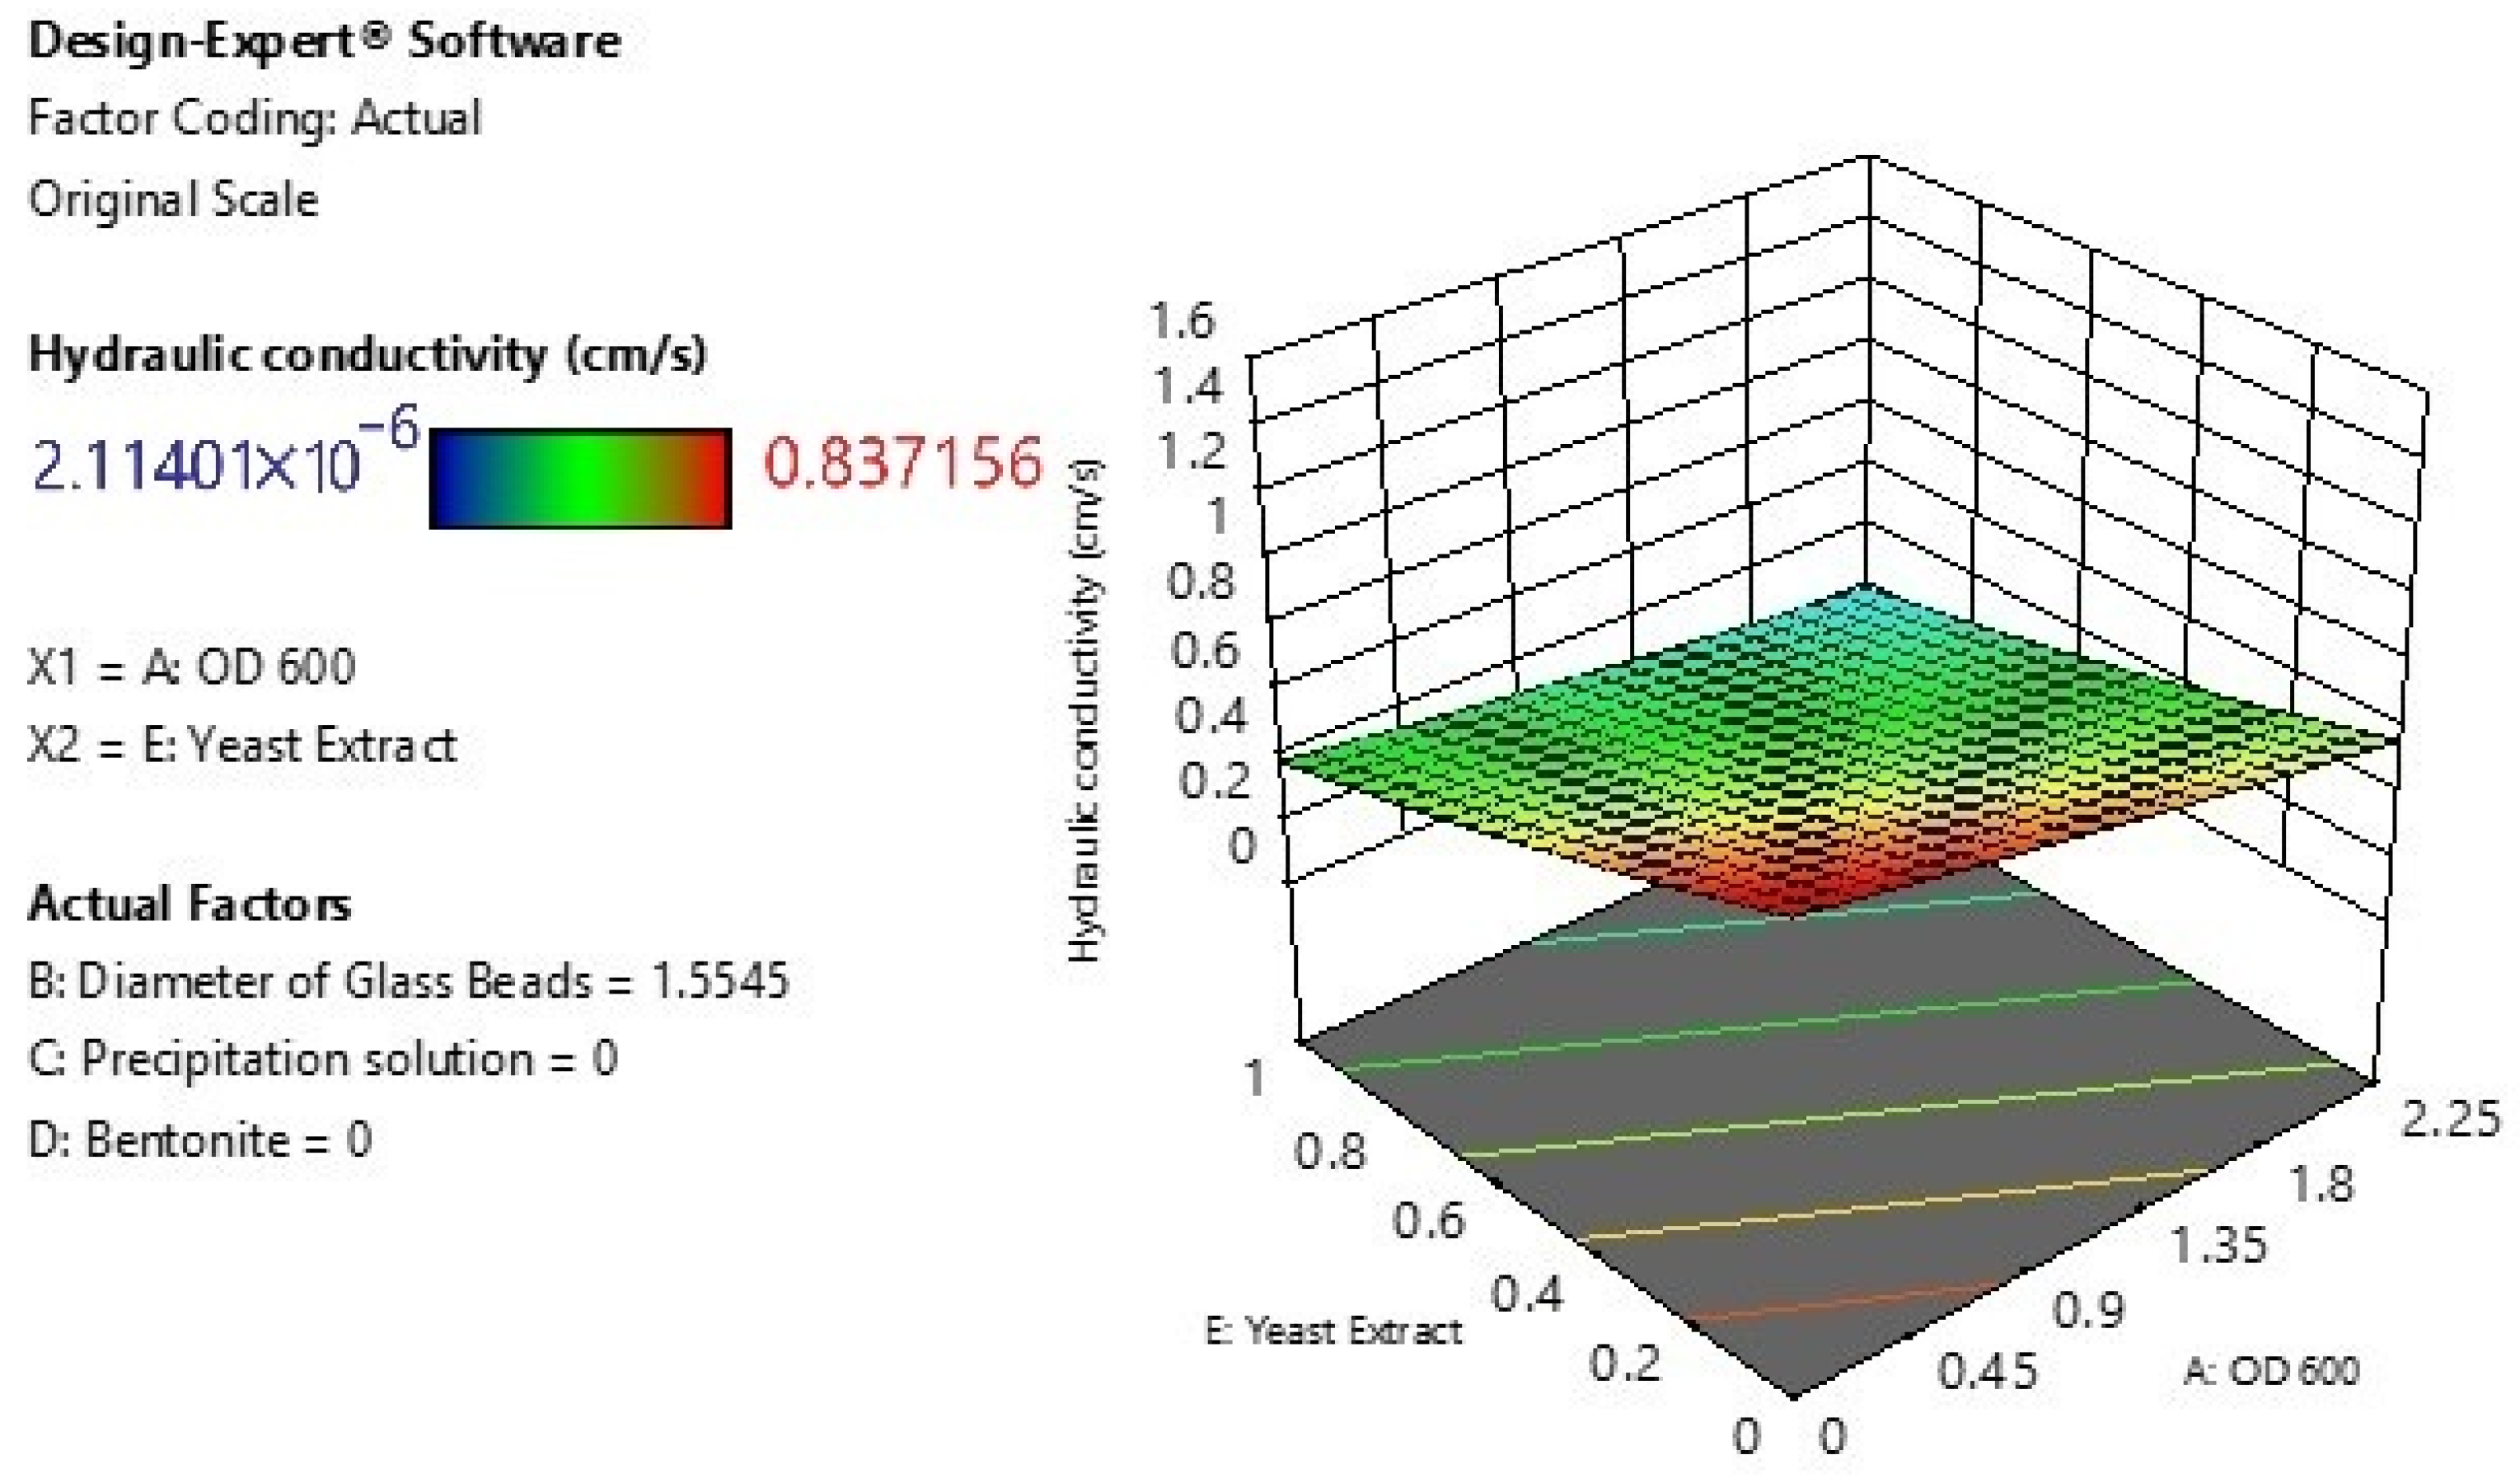
Figure 9 illustrates the interactive effects of OD600 (A)—indicating bacterial cell density—and yeast extract concentration (E) on the hydraulic conductivity (cm/s) of a granular porous medium. The color-coded surface represents the variation in hydraulic conductivity, ranging from 2.11401 × 10⁻⁶ cm/s (blue) to 0.837156 cm/s (red).
A clear and consistent decrease in hydraulic conductivity is observed with increasing OD600. This indicates that higher microbial density leads to greater microbially induced calcium carbonate precipitation (MICP), which contributes to the clogging of pore spaces and reduced permeability. The influence of yeast extract, a key nutrient source for bacterial growth, appears to be less pronounced when compared to OD600. However, a slight downward trend in hydraulic conductivity is observed with increasing yeast extract, suggesting a supportive role in enhancing microbial activity. The lowest values of hydraulic conductivity are found at the highest levels of both OD600 and yeast extract, implying a potential synergistic effect where nutrient availability enhances bacterial performance, thus increasing calcium carbonate precipitation. Nevertheless, the primary driver remains OD600. The experimental design maintained constant values for other factors—glass bead diameter at 1.525 mm, precipitation solution at 0, and bentonite at 0—thereby isolating the effects of the two studied variables (OD600 and yeast extract). This figure confirms the dominant role of OD600 in reducing hydraulic conductivity through MICP, while highlighting that nutrient availability (yeast extract) may further enhance microbial performance, albeit to a lesser extent. These findings suggest that microbial density is the key factor, but optimizing nutrient levels may further improve treatment efficiency in permeability reduction strategies.
The presented ANOVA table (Table 3) assesses the statistical significance of a regression model developed to predict hydraulic conductivity (cm/s) as a function of five factors and their interactions. The overall model is highly significant (F = 49.72, p = 3.47 × 10⁻¹⁶), indicating that the independent variables jointly explain a significant portion of the variability in the response. The model has 11 degrees of freedom (df) and a very low residual mean square error (MSE = 0.00655), which implies a good fit.
All five main factors significantly influence hydraulic conductivity. Among them, Factor B (Diameter of Glass Beads) exerts the strongest individual influence on the response variable. Several two-factor interactions are also statistically significant. These interactions suggest that the effect of one factor depends on the level of another, especially those involving glass bead diameter (B). B2(Quadratic effect of Diameter of Glass Beads) is also significant (F = 33.21, p = 2.71 × 10⁻⁶), indicating nonlinear behavior in this factor’s influence on hydraulic conductivity.
Model Summary Statistics for Hydraulic Conductivity Prediction
The statistical metrics below further evaluate the goodness-of-fit, predictive capability, and model adequacy (Table 4).
Taken together with the ANOVA results, these metrics confirm that the developed model is highly significant, fits the data well, is capable of accurate prediction, and is suitable for optimization and further analysis.
The resulting mathematical model is expressed as follows:
y = 0.230181–0.043946 × OD600 + 0.602170 × Diameter of Glass Beads − 0.105562 × Precipitation solution −
0.136384 × Bentonite − 0.137911 × Yeast Extract − 0.026521 × OD600 * Diameter of Glass Beads − 0.081325 ×
Diameter of Glass Beads × Precipitation solution − 0.074226 × Diameter of Glass Beads × Bentonite −
0.119793 × Diameter of Glass Beads × Yeast Extract + 0.209455 × Bentonite × Yeast Extract − 0.092460 ×
Diameter of Glass Beads2
where y denotes the square root of hydraulic conductivity.
The intercept (0.230181) represents the predicted square root of hydraulic conductivity when all factors are at their baseline levels (typically the lowest or central values in the experimental design). The coefficient for Diameter of Glass Beads (+0.602170) is substantially larger than for other variables, indicating it has the strongest positive effect on increasing hydraulic conductivity. Conversely, all other main effect coefficients (OD600, precipitation solution, bentonite, and yeast extract) are negative, showing that increases in these parameters tend to decrease conductivity. Interaction terms involving the diameter of glass beads (e.g., with precipitation solution, bentonite, yeast extract) are all negative, suggesting that when the diameter increases alongside these factors, the combined effect suppresses the increase in conductivity. The interaction between bentonite and yeast extract is positive (+0.209455), implying a synergistic effect, possibly due to changes in matrix structure or microbial behavior. The negative quadratic term for the diameter of glass beads (−0.092460) reflects a nonlinear relationship, suggesting that after a certain size, further increase in bead diameter causes a reduction in conductivity.
Equation (12) provides a comprehensive model in actual units, making it suitable for practical application and interpretation. It allows direct estimation of hydraulic conductivity based on real-world parameter settings. The strong influence of glass bead diameter, including both linear and nonlinear effects, indicates that media structure is the dominant control of overflow characteristics in the tested system. The model also highlights the importance of interaction effects, especially those involving bentonite and yeast extract.
The calculations were performed by using the coded scale for the coefficients of regression model computations. How coded levels are calculated is expressed by the formula below. Both the coded and actual scale models for factors were provided and are shown in Table 1.
C o d e d = 2 · ( A c t u a l   s e t t i n g A v e r a g e   a c t u a l   s e t t i n g ) ( R a n g e   b e t w e e n   l o w   a n d   h i g h   a c t u a l   s e t t i n g s )
The coded form of the mathematical model is expressed as follows:
y = 0.4910 − 0.0949 × A + 0.2252 × B − 0.1148 × C − 0.0724 × D − 0.1079 × E − 0.0440 × A × B − 0.0600 × B × C −
0.0547 × B × D − 0.0883 × B × E + 0.0524 × D × E − 0.2012 × B2
where y denotes the square root of hydraulic conductivity and A is OD600, B is the diameter of glass beads, C is the precipitation solution, D is bentonite, and E is yeast extract, as mentioned previously.
The intercept (0.4910) represents the predicted value of the square root of hydraulic conductivity when all factors are at their central (coded = 0) levels.
Among the linear terms, B (diameter of glass beads) exhibits the highest positive coefficient (+0.2252), indicating a strong direct effect on increasing hydraulic conductivity. C (precipitation solution) and E (yeast extract) have notable negative coefficients, suggesting that increasing these variables reduces hydraulic conductivity. Several interaction terms (e.g., AB, BC, BD, BE, DE) are included, reflecting the model’s ability to account for the combined effects of factor pairs. For instance, the negative coefficient of BE (−0.0883) suggests that the joint increase in glass bead diameter and yeast extract has a diminishing effect on the response. The quadratic term B2 with a large negative coefficient (−0.2012) indicates a nonlinear (concave) relationship between glass bead diameter and the response, revealing that very high or very low bead sizes reduce conductivity.
This coded model offers a comprehensive and interpretable representation of how each factor and their interactions influence the hydraulic conductivity. The use of coded variables standardizes the model, allowing for direct comparison of the relative importance of each term. Among all terms, B and its squared effect B2 dominate the model behavior, highlighting the critical role of media structure (bead size) in controlling flow properties.
The coded model equation can be used to predict responses at specified levels of each factor. Additionally, the coefficients in the coded equation allow for assessing the relative influence of individual factors on the response.
Figure 10 indicates the optimization results for six experimental parameters affecting hydraulic conductivity, aiming to achieve the highest possible desirability value, which is indicated as 1.000. This suggests that the optimal combination of factors successfully meets the target criteria defined for the response variable (hydraulic conductivity).
Each panel in the figure represents one of the input variables, showing the selected optimal level (red dot) within its respective range:
A: OD600 = 0.22051
This variable likely represents the optical density of a microbial suspension, possibly related to biomass concentration. The chosen value is at the lower end of the range (0 to 2.25), suggesting that minimal microbial concentration is optimal under these conditions.
B: Diameter of Glass Beads = 0.283826
This parameter affects the porosity and structure of the medium. The optimal value is relatively low on the scale (0.05 to 3 mm), indicating that smaller bead sizes improve system performance.
C: Precipitation Solution = 0.552884
This variable is within a normalized scale (0 to 1), with the selected value close to the midpoint. It may represent the concentration or presence of a chemical precipitant affecting hydraulic sealing or particle aggregation.
D: Bentonite = 0.400235
Bentonite, a swelling clay often used to reduce permeability, shows an optimal level around 0.4 (on a 0 to 1 scale), suggesting a moderate amount contributes effectively to lowering hydraulic conductivity.
E: Yeast Extract = 0.550387
This nutrient supplement, often used to stimulate microbial activity, is also optimized at a moderate level, indicating its balanced contribution to microbial processes or biofilm formation that affect permeability.
Hydraulic Conductivity (cm/s) = 0.0398694
The response variable is shown on the bottom right. The optimal input parameters yield a relatively low hydraulic conductivity value, which may be desired for applications such as biobarrier formation, sealing, or filtration.
The desirability function approach used in this optimization reveals that a specific combination of moderate microbial, chemical, and physical parameters results in the lowest feasible hydraulic conductivity. The desirability value of 1.000 confirms that the solution fully satisfies the predefined criteria, making it the most suitable among 100 evaluated combinations. This figure serves as a valuable summary for experimental decision-making and further validation.
The results confirm that the combined biological and physicochemical variables significantly influence hydraulic conductivity. The dominance of glass bead diameter aligns with findings by Tan et al. [28] and Sham et al. [29], who demonstrated that media gradation governs the distribution and retention of precipitated CaCO3, thereby directly affecting permeability. The moderate yet synergistic effects of nutrient-related variables observed in this study are consistent with reports by Eryürük et al. [19] and Liu et al. [30], highlighting that bacterial cell density and pore structure jointly govern CaCO3 precipitation and permeability reduction. Similar nutrient–matrix interactions were also noted by Wang&Sun [31], confirming the biogeochemical coupling mechanisms underlying MICP performance and pore clogging efficiency.
Compared with other optimization and modeling approaches—such as neural-network-based predictions [32] or numerical and factorial designs [24,33]—the present RSM-based experimental framework provides a transparent and statistically robust analytical method capable of quantifying both main and interaction effects. The high determination coefficient (R2 = 0.948) and Adequate Precision values confirm the model’s predictive reliability and its applicability for design optimization in biocementation-based hydraulic barrier systems.
Nevertheless, several limitations must be acknowledged. The experiments were performed under controlled, laboratory-scale static conditions; therefore, natural heterogeneity, mineralogical variability, and field-scale hydraulic gradients were not fully represented. Future research should address these limitations by performing large-scale column or pilot-scale field trials with various soil types and flow conditions to evaluate long-term performance, mechanical stability, and environmental resilience. Furthermore, integrating in situ monitoring and life-cycle assessment (LCA) approaches, as emphasized by Raymond et al. [34], Omoregie et al. [35], and Deng et al. [36], will enhance the sustainability, scalability, and real-world implementation potential of MICP-based soil improvement techniques.

4. Conclusions

This study presents an investigation into the optimization of hydraulic conductivity reduction using Microbially-Induced Calcite Precipitation (MICP), with a focus on understanding and modeling the effects of key bioprocess variables. The findings reinforce the potential of MICP as a bio-mediated ground improvement technique for enhancing impermeability in porous media. The influence of bacterial cell density (OD600), glass bead diameter, precipitation solution, bentonite, and yeast extract on the permeability of treated samples was systematically evaluated using statistical modeling through response surface methodology (RSM).
The experimental results indicate that the diameter of glass beads is the most influential physical parameter affecting hydraulic conductivity, both individually and through interaction effects. Smaller bead sizes provided a tighter pore network, which, when combined with microbial activity, significantly reduced permeability. Additionally, OD600 emerged as a crucial biological parameter, confirming that microbial density directly enhances calcium carbonate precipitation and thus pore clogging efficiency. The precipitation solution, a chemical input containing urea and calcium chloride, also had a major impact, underscoring the importance of chemical conditions in facilitating biomineralization.
While bentonite and yeast extract had limited main effects within the experimental range, their contributions were amplified through interactions. Bentonite, as a fine-grained mineral, likely enhanced particle retention and pore obstruction, especially when microbial and chemical conditions were favorable. Yeast extract, serving as a nutrient source, supported microbial metabolism and may have indirectly influenced calcite precipitation rates. These synergistic effects highlight the complexity of the MICP process and the value of multivariate modeling in capturing such relationships.
The statistical model developed through RSM exhibited high predictive performance (R2 = 0.948), indicating that the selected variables and design approach successfully captured the system’s behavior. The use of desirability function analysis enabled the identification of an optimal set of parameters, yielding a remarkably low hydraulic conductivity of 0.0399 cm/s and achieving a maximum desirability score of 1.000. This demonstrates the practical feasibility of tailoring MICP treatments to achieve permeability control in engineered systems.
From an engineering standpoint, these findings offer valuable insights for the design and implementation of bio-barriers, landfill liners, and subsurface containment systems. The integration of biological, chemical, and physical mechanisms through empirical optimization provides a cost-effective and sustainable alternative to traditional impermeability solutions. Furthermore, the approach is scalable and adaptable to site-specific conditions, making it suitable for a range of geotechnical and environmental applications.
Overall, this research establishes a validated bioprocess framework that effectively integrates experimental design and response surface modeling to minimize hydraulic conductivity through MICP. The optimized parameter combination achieved a hydraulic conductivity of 0.0399 cm/s, representing a ~96% reduction relative to the untreated control. The results provide both theoretical and practical insights into the multivariable interactions among biological, chemical, and physical factors governing bio-cementation.
The proposed approach not only advances academic understanding but also holds direct implications for real-world applications in biobarriers, groundwater protection, and sustainable infrastructure development. Limitations concerning scale dependency, mineralogical variability, and long-term performance highlight avenues for future research, including pilot-scale validation, monitoring of CaCO3 distribution, and coupling with numerical simulations for predictive field implementation.

Author Contributions

Conceptualization, Ş.E. and K.E.; methodology, Ş.E. and K.E.; software, K.E.; validation, Ş.E.; formal analysis, Ş.E. and K.E.; investigation, Ş.E. and K.E.; resources, Ş.E. and K.E.; data curation, Ş.E. and K.E.; writing—original draft preparation, Ş.E. and K.E.; writing—review and editing, Ş.E. and K.E.; visualization, Ş.E. and K.E.; supervision, A.K. All authors have read and agreed to the published version of the manuscript.

Funding

This research received no external funding.

Data Availability Statement

Data related to this study can be made available upon request.

Conflicts of Interest

The authors declare no competing interests.

References

  1. Taharia, M.d.; Dey, D.; Das, K.; Sukul, U.; Chen, J.-S.; Banerjee, P.; Dey, G.; Sharma, R.K.; Lin, P.-Y.; Chen, C.-Y. Microbial Induced Carbonate Precipitation for Remediation of Heavy Metals, Ions and Radioactive Elements: A Comprehensive Exploration of Prospective Applications in Water and Soil Treatment. Ecotoxicol. Environ. Saf. 2024, 271, 115990. [Google Scholar] [CrossRef]
  2. Spencer, C.A.; Sass, H.; Van Paassen, L. Increased Microbially Induced Calcium Carbonate Precipitation (MICP) Efficiency in Multiple Treatment Sand Biocementation Processes by Augmentation of Cementation Medium with Ammonium Chloride. Geotechnics 2023, 3, 1047–1068. [Google Scholar] [CrossRef]
  3. Erdmann, N.; Strieth, D. Influencing Factors on Ureolytic Microbiologically Induced Calcium Carbonate Precipitation for Biocementation. World J. Microbiol. Biotechnol. 2023, 39, 61. [Google Scholar] [CrossRef]
  4. Chittoori, B.C.S.; Rahman, T.; Burbank, M. Microbial-Facilitated Calcium Carbonate Precipitation as a Shallow Stabilization Alternative for Expansive Soil Treatment. Geotechnics 2021, 1, 558–572. [Google Scholar] [CrossRef]
  5. Song, M.; Ju, T.; Meng, Y.; Han, S.; Lin, L.; Jiang, J. A Review on the Applications of Microbially Induced Calcium Carbonate Precipitation in Solid Waste Treatment and Soil Remediation. Chemosphere 2022, 290, 133229. [Google Scholar] [CrossRef] [PubMed]
  6. Gao, X.; Han, S.; Yang, Y.; Zhang, W.; Zou, T.; Cheng, L. Mechanical Behavior and Microstructural Study of Biocemented Sand under Various Treatment Methods. Geofluids 2022, 2022, 6015335. [Google Scholar] [CrossRef]
  7. Eryürük, K.; Suzuki, D.; Mizuno, S.; Akatsuka, T.; Tsuchiya, T.; Yang, S.; Kitano, H.; Katayama, A. Decrease in Hydraulic Conductivity of a Paddy Field Using Biocalcification in Situ. Geomicrobiol. J. 2016, 33, 690–698. [Google Scholar] [CrossRef]
  8. Achal, V.; Mukherjee, A.; Kumari, D.; Zhang, Q. Biomineralization for Sustainable Construction–A Review of Processes and Applications. Earth-Sci. Rev. 2015, 148, 1–17. [Google Scholar] [CrossRef]
  9. Phillips, A.J.; Troyer, E.; Hiebert, R.; Kirkland, C.; Gerlach, R.; Cunningham, A.B.; Spangler, L.; Kirksey, J.; Rowe, W.; Esposito, R. Enhancing Wellbore Cement Integrity with Microbially Induced Calcite Precipitation (MICP): A Field Scale Demonstration. J. Pet. Sci. Eng. 2018, 171, 1141–1148. [Google Scholar] [CrossRef]
  10. Chen, B.; Sun, W.; Sun, X.; Cui, C.; Lai, J.; Wang, Y.; Feng, J. Crack Sealing Evaluation of Self-Healing Mortar with Sporosarcina Pasteurii: Influence of Bacterial Concentration and Air-Entraining Agent. Process. Biochem. 2021, 107, 100–111. [Google Scholar] [CrossRef]
  11. Konstantinou, C.; Wang, Y. Statistical and Machine Learning Analysis for the Application of Microbially Induced Carbonate Precipitation as a Physical Barrier to Control Seawater Intrusion. J. Contam. Hydrol. 2024, 263, 104337. [Google Scholar] [CrossRef]
  12. Alam, M.K.; Motamed, R. Role of MICP Treatment Area in Mitigating Liquefaction-Induced Settlements for Shallow Foundation. Biogeotechnics 2025, 100187. [Google Scholar] [CrossRef]
  13. Guo, L.; Wang, B.; Guo, J.; Guo, H.; Jiang, Y.; Zhang, M.; Dai, Q. Experimental Study on Improving Hydraulic Characteristics of Sand Via Microbially Induced Calcium Carbonate Precipitation. Geomech. Energy Environ. 2024, 37, 100519. [Google Scholar] [CrossRef]
  14. Wang, Y.; Sun, X.; Miao, L.; Wang, H.; Wu, L.; Shi, W.; Kawasaki, S. State-of-the-Art Review of Soil Erosion Control by MICP and EICP Techniques: Problems, Applications, and Prospects. Sci. Total Environ. 2024, 912, 169016. [Google Scholar] [CrossRef]
  15. Li, Y.; Chen, J. Experimental Study on the Permeability of Microbial-Solidified Calcareous Sand Based on MICP. Appl. Sci. 2022, 12, 11447. [Google Scholar] [CrossRef]
  16. Eryürük, K.; Yang, S.; Suzuki, D.; Sakaguchi, I.; Akatsuka, T.; Tsuchiya, T.; Katayama, A. Reducing Hydraulic Conductivity of Porous Media Using CaCO3 Precipitation Induced by Sporosarcina pasteurii. J. Biosci. Bioeng. 2015, 119, 331–336. [Google Scholar] [CrossRef] [PubMed]
  17. Rajasekar, A.; Wilkinson, S.; Moy, C.K.S. MICP as a Potential Sustainable Technique to Treat or Entrap Contaminants in the Natural Environment: A Review. Environ. Sci. Ecotechnology 2021, 6, 100096. [Google Scholar] [CrossRef]
  18. Yang, Y.; Chu, J.; Xiao, Y.; Liu, H.; Cheng, L. Seepage Control in Sand Using Bioslurry. Constr. Build. Mater. 2019, 212, 342–349. [Google Scholar] [CrossRef]
  19. Eryürük, K.; Yang, S.; Suzuki, D.; Sakaguchi, I.; Katayama, A. Effects of Bentonite and Yeast Extract as Nutrient on Decrease in Hydraulic Conductivity of Porous Media Due to CaCO3 Precipitation Induced by Sporosarcina pasteurii. J. Biosci. Bioeng. 2015, 120, 411–418. [Google Scholar] [CrossRef]
  20. Shan, Y.; Liufu, Z.; Yuan, J.; Li, Y.; Tong, H.; Cui, J. Liquefaction Resistance of MICP-Treated Calcareous Sand with Different Particle Size and Gradation. Biogeotechnics 2025, 100181. [Google Scholar] [CrossRef]
  21. Jhuo, Y.-S.; Wong, H.-E.; Tung, H.-H.; Ge, L. Effectiveness of Microbial Induced Carbonate Precipitation Treatment Strategies for Sand. Environ. Technol. Innov. 2025, 38, 104132. [Google Scholar] [CrossRef]
  22. Eryürük, K. Effect of Cell Density on Decrease in Hydraulic Conductivity by Microbial Calcite Precipitation. AMB Express 2022, 12, 104. [Google Scholar] [CrossRef]
  23. Erdmann, N.; De Payrebrune, K.M.; Ulber, R.; Strieth, D. Optimizing Compressive Strength of Sand Treated with MICP Using Response Surface Methodology. SN Appl. Sci. 2022, 4, 282. [Google Scholar] [CrossRef]
  24. Amarakoon, G.G.N.N.; Kawasaki, S. Factors Affecting Sand Solidification Using MICP with Pararhodobacter sp. Mater. Trans. 2018, 59, 72–81. [Google Scholar] [CrossRef]
  25. Design-Expert; Stat-Ease Inc.: Minneapolis, MN, USA, 2025.
  26. Tague, N.R. The Quality Toolbox, 2nd ed.; ASQ Quality Press: Milwaukee, WI, USA, 2005; ISBN 978-0-87389-639-9. [Google Scholar]
  27. Myers, R.H.; Montgomery, D.C.; Anderson-Cook, C.M. Response Surface Methodology: Process and Product Optimization Using Designed Experiments, 4th ed.; John Wiley & Sons: Hoboken, NJ, USA, 2016; ISBN 978-1-118-91601-8. [Google Scholar]
  28. Tan, Y.; Xie, X.; Wu, S.; Wu, T. Microbially Induced CaCO3 Precipitation: Hydraulic Response and Micro-Scale Mechanism in Porous Media. ScienceAsia 2017, 43, 1–7. [Google Scholar] [CrossRef]
  29. Sham, E.; Mantle, M.D.; Mitchell, J.; Tobler, D.J.; Phoenix, V.R.; Johns, M.L. Monitoring Bacterially Induced Calcite Precipitation in Porous Media Using Magnetic Resonance Imaging and Flow Measurements. J. Contam. Hydrol. 2013, 152, 35–43. [Google Scholar] [CrossRef]
  30. Liu, Z.; Beng, J.; Wu, Y.; Nie, K.; Dang, Y.; Yao, Y.; Li, J.; Fang, M. Microbial Induced Calcite Precipitation for Improving Low-Cohesive Soil: Mechanisms, Methods and Macroscopic Properties. Low-Carbon Mater. Green Constr. 2024, 2, 30. [Google Scholar] [CrossRef]
  31. Wang, X.; Sun, H. Synergistic Effect of Microbial-Induced Carbonate Precipitation Modified with Hydroxypropyl Methylcellulose on Improving Loess Disintegration and Seepage Resistance. Polymers 2025, 17, 548. [Google Scholar] [CrossRef]
  32. Pacheco, V.L.; Bragagnolo, L.; Dalla Rosa, F.; Thomé, A. Optimization of Biocementation Responses by Artificial Neural Network and Random Forest in Comparison to Response Surface Methodology. Environ. Sci. Pollut. Res. 2023, 30, 61863–61887. [Google Scholar] [CrossRef]
  33. Wang, L.; Shao, H.; Yi, C.; Huang, Y.; Feng, D. Optimization of Injection Methods in the Microbially Induced Calcite Precipitation Process by Using a Field Scale Numerical Model. Water 2023, 16, 82. [Google Scholar] [CrossRef]
  34. Raymond, A.J.; DeJong, J.T.; Gomez, M.G.; Kendall, A.; San Pablo, A.C.M.; Lee, M.; Graddy, C.M.R.; Nelson, D.C. Life Cycle Sustainability Assessment of Microbially Induced Calcium Carbonate Precipitation (MICP) Soil Improvement Techniques. Appl. Sci. 2025, 15, 1059. [Google Scholar] [CrossRef]
  35. Omoregie, A.I.; Ouahbi, T.; Kan, F.-K.; Sirat, Q.A.; Raheem, H.O.; Rajasekar, A. Advancing Slope Stability and Hydrological Solutions Through Biocementation: A Bibliometric Review. Hydrology 2025, 12, 14. [Google Scholar] [CrossRef]
  36. Deng, X.; Li, Y.; Liu, H.; Zhao, Y.; Yang, Y.; Xu, X.; Cheng, X.; Wit, B.D. Examining Energy Consumption and Carbon Emissions of Microbial Induced Carbonate Precipitation Using the Life Cycle Assessment Method. Sustainability 2021, 13, 4856. [Google Scholar] [CrossRef]
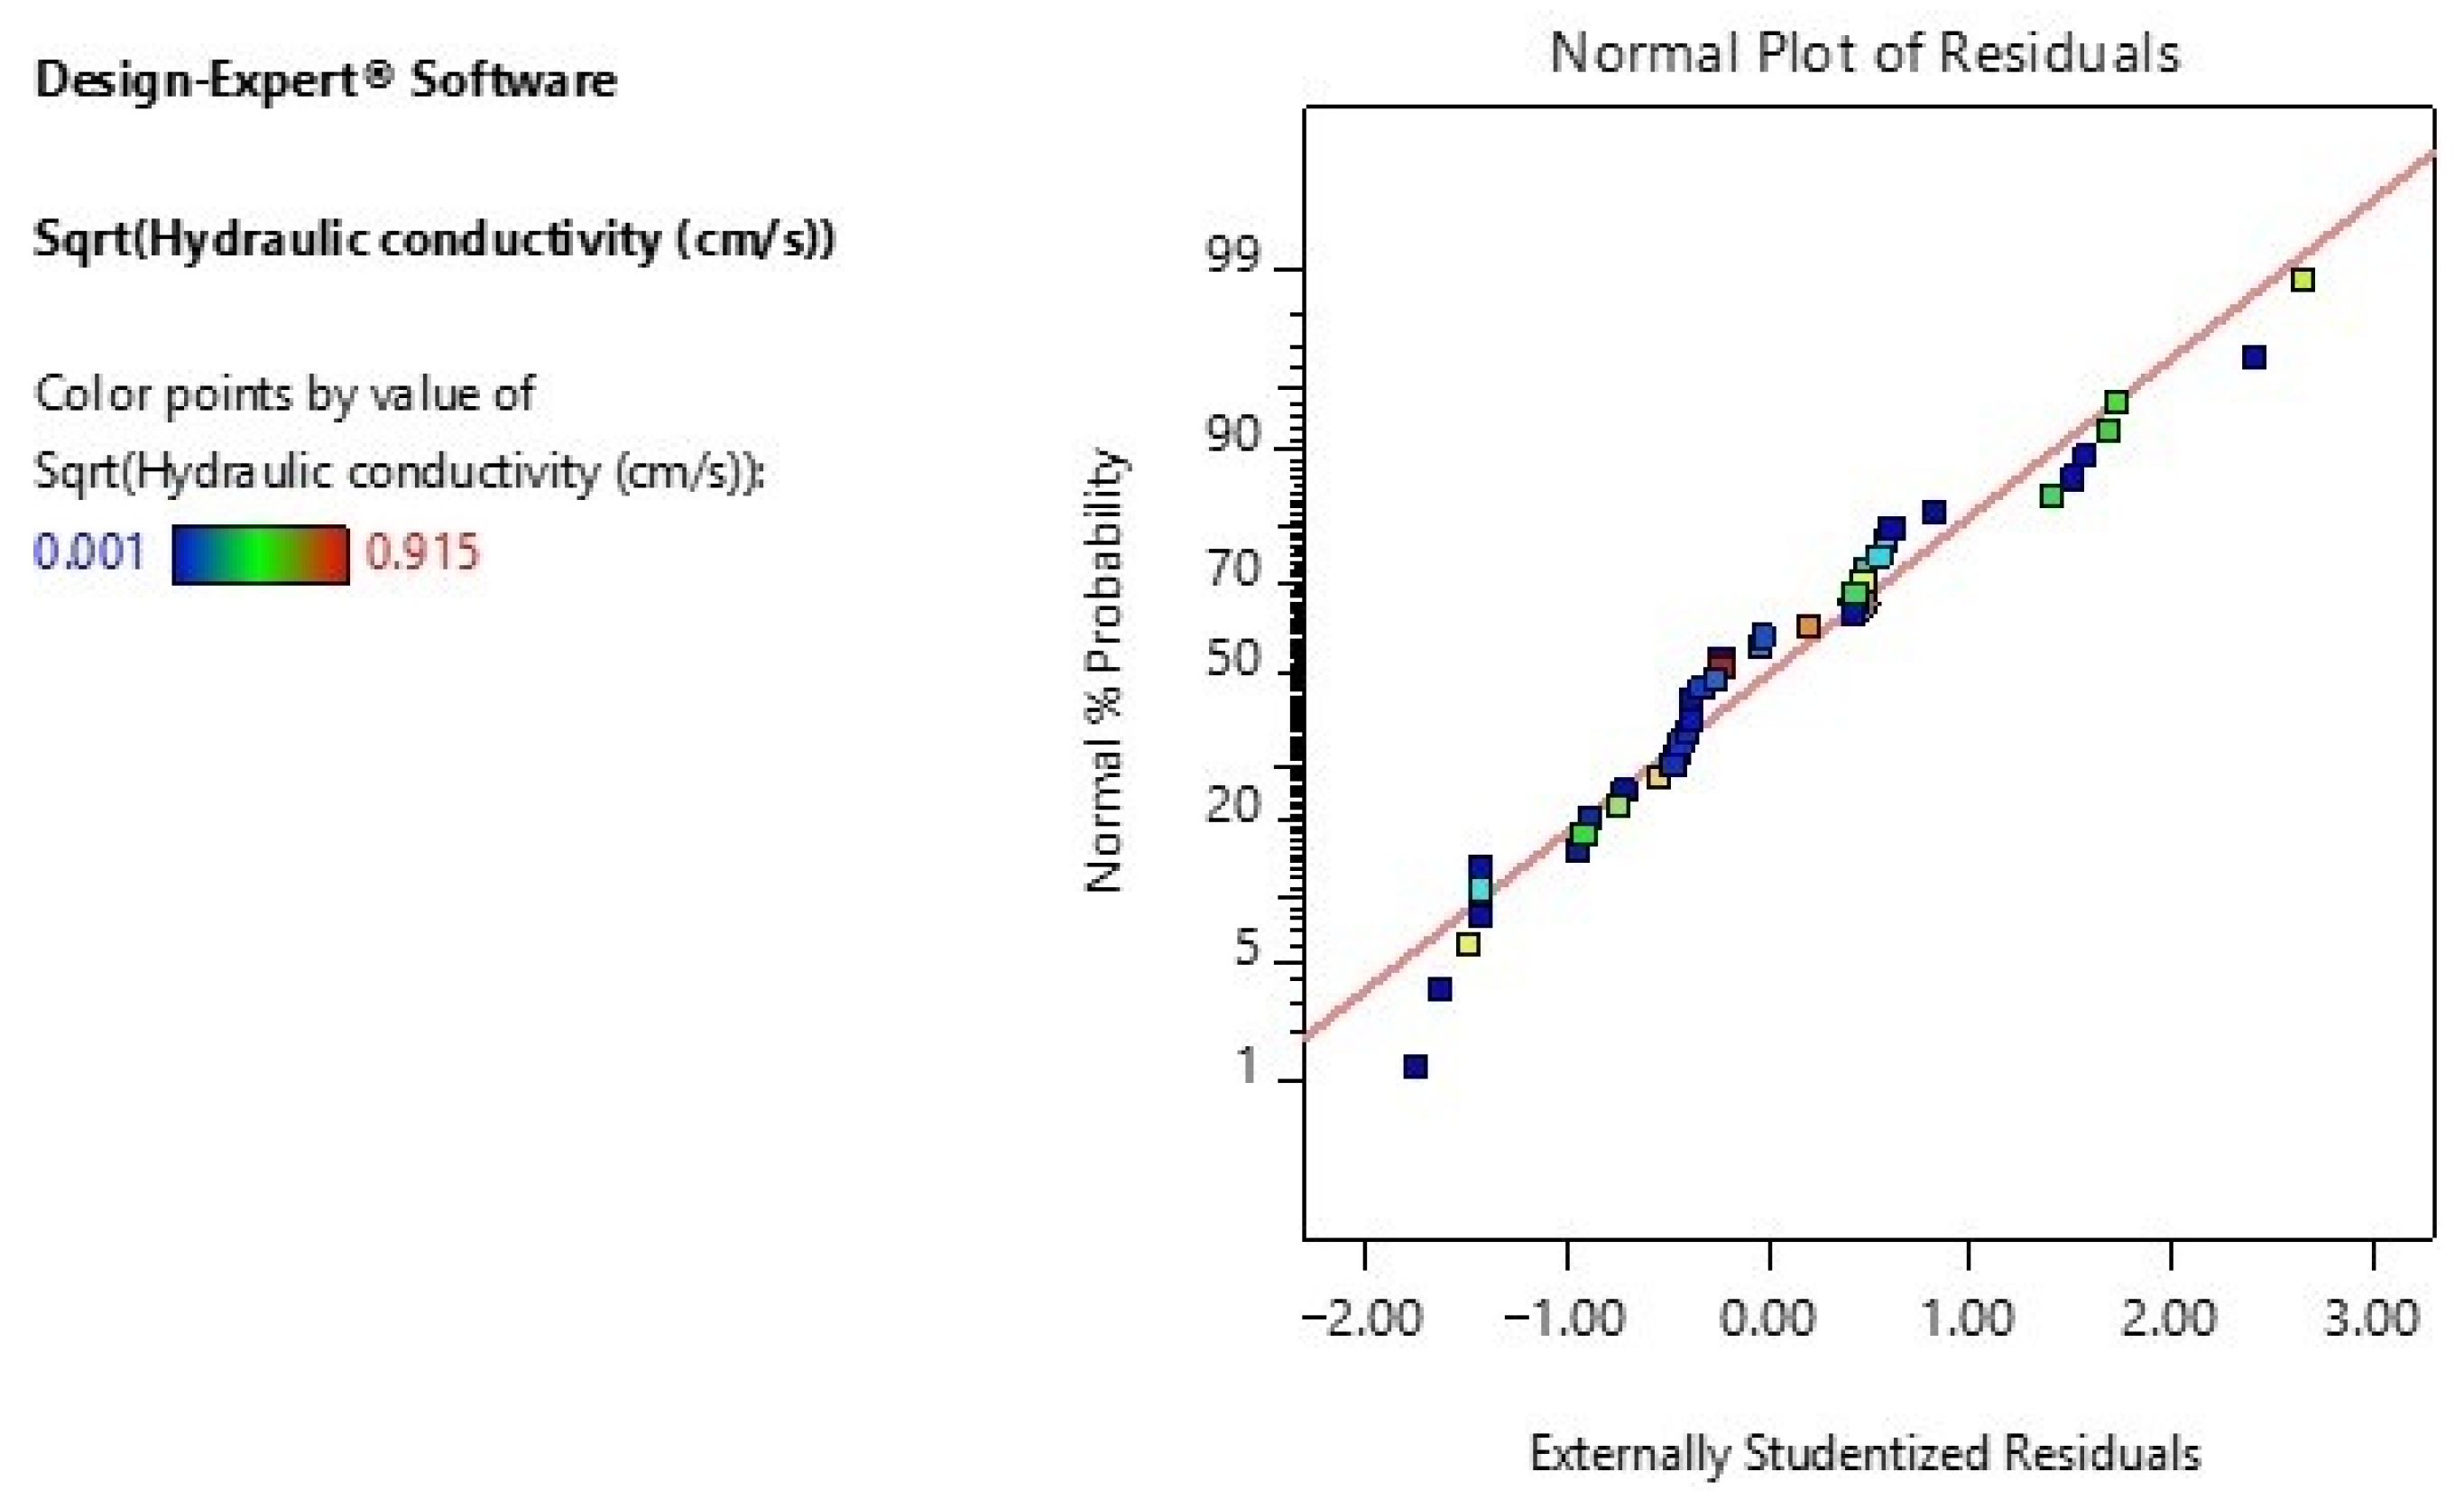
Figure 1. Normal probability plot of studentized residuals, color-coded by the square root of hydraulic conductivity √K (cm/s) (this confirms that residuals are normally distributed and validates the assumption of model normality).
Minerals 15 01215 g001
Figure 2. Perturbation plot illustrating the effect of individual factors (A–E) on hydraulic conductivity (cm/s), where each factor is varied individually while others remain fixed at their reference (coded zero) level (this figure shows that precipitation solution (C) has the strongest individual effect, followed by OD600 and glass bead diameter).
Minerals 15 01215 g002
Figure 3. Main effects of factors A–E on hydraulic conductivity (cm/s), with 95% confidence intervals. Each plot shows the isolated effect of one factor, holding others constant. All factor levels are expressed as coded values unless otherwise stated (as shown, precipitation solution exhibits the steepest decline in hydraulic conductivity, confirming its dominant effect).
Minerals 15 01215 g003aMinerals 15 01215 g003bMinerals 15 01215 g003c
Figure 4. Predicted vs. actual plot for the square root of hydraulic conductivity (√K, cm/s) colored by response magnitude (the close clustering of points along the 1:1 line indicates excellent agreement between predicted and observed values).
Minerals 15 01215 g004
Figure 5. Residuals vs. predicted plot for the square root of hydraulic conductivity (√K, cm/s) colored by response magnitude (residuals are randomly distributed around zero, confirming model adequacy).
Minerals 15 01215 g005
Figure 6. Three-dimensional response surface plot showing the effect of OD600 and glass bead diameter on hydraulic conductivity (cm/s) (increased bacterial density and smaller bead size synergistically reduce permeability).
Minerals 15 01215 g006
Figure 7. Three-dimensional surface plot showing the interactive effect of OD600 (A) and precipitation solution concentration (C) on hydraulic conductivity (cm/s), glass bead diameter fixed at 1.525 mm, and both bentonite and yeast extract set to zero (a strong nonlinear relationship appears between microbial density and precipitation solution concentration, confirming their combined control over CaCO3 precipitation).
Minerals 15 01215 g007
Figure 8. Three-dimensional surface plot showing the interaction between OD600 (A) and bentonite content (D) on hydraulic conductivity (cm/s) with constant conditions: glass bead diameter = 1.525 mm, precipitation solution = 0, and yeast extract = 0 (results show a synergistic but secondary contribution of bentonite compared to OD600, supporting its role as a physical pore-filling agent).
Minerals 15 01215 g008
Figure 9. Three-dimensional response surface illustrating the effects of OD600 (A) and yeast extract concentration (E) on hydraulic conductivity (cm/s), with constant conditions: glass bead diameter = 1.525 mm, precipitation solution = 0, and bentonite = 0 (nutrient availability enhances microbial activity, though OD600 remains the dominant factor governing hydraulic conductivity).
Minerals 15 01215 g009
Figure 10. Optimization of hydraulic conductivity using desirability function analysis. Red dots indicate optimal values for factors A–E, with a desirability score of 1.000 achieved for minimizing conductivity (Solution 1 of 100). (This confirms that residuals are normally distributed and validates the assumption of model normality. The desirability value of 1.000 confirms that the RSM model successfully identified the optimal parameter combination minimizing hydraulic conductivity).
Minerals 15 01215 g010
Table 1. Actual and coded levels of independent variables used in the experimental design.
L1L2L3L4L5L6
OD60000.150.752.25
Coded−0.7−0.56667−0.033331.3
Diameter of glass beads0.050.250.5123
Coded−0.27119−0.135590.03390.372881.050851.72881
Precipitation Solution01
Coded−11
Bentonite01
Coded−11
Yeast Extract01
Coded−11
Table 2. Experimental design matrix showing combinations of microbial, chemical, and physical factors and their corresponding measured hydraulic conductivity values obtained from MICP treatment under different test conditions.
OD600Diameter of Glass Beads (mm)Precipitation SolutionBentoniteYeast ExtractHydraulic Conductivity (cm/s)
2.250.051.000.000.000.00041
2.250.251.000.000.000.01008
2.250.501.000.000.000.02709
2.251.001.000.000.000.19334
2.252.001.000.000.000.22401
2.253.001.000.000.000.36925
0.750.251.000.000.000.03255
0.750.501.000.000.000.08915
0.751.001.000.000.000.36856
0.752.001.000.000.000.42898
0.753.001.000.000.000.63324
0.150.251.000.000.000.04755
0.150.501.000.000.000.12277
0.151.001.000.000.000.44610
0.152.001.000.000.000.52876
0.153.001.000.000.000.72205
2.250.051.000.000.000.00041
0.000.050.001.000.000.00095
2.250.051.001.000.000.00003
2.250.051.000.001.000.00000
2.250.051.001.001.000.00000
2.250.251.000.000.000.01110
0.000.250.001.000.000.03525
2.250.251.001.000.000.00135
2.250.251.000.001.000.00008
2.250.251.001.001.000.00004
2.251.001.000.000.000.19152
0.001.000.001.000.000.41443
2.251.001.001.000.000.01400
2.251.001.000.001.000.00093
2.251.001.001.001.000.00050
2.253.001.000.000.000.36925
0.003.000.001.000.000.61620
2.253.001.001.000.000.03899
2.253.001.000.001.000.00226
2.253.001.001.001.000.00099
2.250.050.000.000.000.00414
2.250.250.000.000.000.06726
2.250.500.000.000.000.17225
2.251.000.000.000.000.57387
2.252.000.000.000.000.65504
2.253.000.000.000.000.83716
Table 3. ANOVA table interpretation for the model on hydraulic conductivity.
SourceSum ofdfMeanF-Valuep-Value
Model3.58426110.32584249.7206<0.0001significant
A-OD 6000.20013510.20013530.53886<0.0001
B-Diameter of Glass Beads0.42835110.42835165.36267<0.0001
C-Precipitation solution0.3089210.3089247.13851<0.0001
D-Bentonite0.11010510.11010516.801010.0003
E-Yeast Extract0.19234210.19234229.34969<0.0001
AB0.02545810.0254583.8847340.0580
BC0.05180210.0518027.9044970.0086
BD0.05420910.0542098.2718440.0073
BE0.0937610.0937614.306920.0007
DE0.06385510.0638559.7436380.0040
B20.21764410.21764433.2106<0.0001
Residual0.196604300.006553
Lack of Fit0.196589260.0075612105.2534.86 × 10−7 significant
Pure Error1.44× 10−5 43.59 × 10⁻⁶
Cor Total3.78086341
Table 4. Statistical metrics evaluating the goodness-of-fit, predictive capability, and adequacy of the regression model for hydraulic conductivity.
MetricValueInterpretation
R20.948Indicates that 94.8% of the variability in hydraulic conductivity is explained by the model. This demonstrates an excellent fit to the experimental data.
Adjusted R20.929Adjusts for the number of predictors in the model. The high value suggests that the model is not overfitted and retains strong explanatory power even after penalizing for additional terms.
Predicted R20.868Reflects the model’s ability to predict new or unseen data. A predicted R2 above 0.80 indicates very good predictive performance. The reasonable closeness between Adjusted R2 and Predicted R2(< 0.2 difference) supports model reliability and consistency.
Adequate Precision23.62Measures the signal-to-noise ratio. A value > 4 is desirable; here, the value far exceeds this threshold, indicating a strong model signal and that the model can be used to navigate the design space confidently.
Disclaimer/Publisher’s Note: The statements, opinions and data contained in all publications are solely those of the individual author(s) and contributor(s) and not of MDPI and/or the editor(s). MDPI and/or the editor(s) disclaim responsibility for any injury to people or property resulting from any ideas, methods, instructions or products referred to in the content.