Article

Simultaneous Adsorption of Copper, Zinc, and Sulfate in a Mixture of Activated Carbon and Barite

Department of Engineering in Metallurgy, University of Atacama, Copiapó 1530000, Chile
*
Author to whom correspondence should be addressed.
Minerals 2025, 15(11), 1214; https://doi.org/10.3390/min15111214
Submission received: 30 September 2025 / Revised: 4 November 2025 / Accepted: 13 November 2025 / Published: 18 November 2025
(This article belongs to the Section Environmental Mineralogy and Biogeochemistry)

Abstract

Liquid effluents generated during mineral processing are usually contaminated with heavy metals and oxyanions, requiring an effective technique for their simultaneous removal. This study evaluated adsorption as a method to remove ions from an artificial acid effluent containing Cu2+, Zn2+, and S O 4 2 , using a mixture of activated carbon and barite as adsorbents. Adsorbent particles were prepared by grinding in a ring pulverizer for 120 s, using equal proportions of activated carbon and barite concentrate. The pH, contact time, and adsorbent particle mass were investigated. The results indicated that the adsorption efficiency depends on pH and adsorbent particle concentration: with increasing pH, the adsorption of Cu2+ and Zn2+ improves, while that of S O 4 2 decreases. As the particle mass increases, the adsorption efficiency also increases. The maximum efficiency of simultaneous adsorption of ions of 55 ± 2.6% was achieved at pH 3 with an adsorbent particle concentration of 40 g·L−1. The experimental data best fit the pseudo-1st-order kinetic model, suggesting that the limiting stage is external or internal diffusion and that the predominant adsorption mechanism is physisorption. Furthermore, the results were best fitted to the Freundlich isotherm, indicating heterogeneous and multilayer adsorption. In conclusion, the mixture of activated carbon and barite is presented as a potential adsorbent for acid effluent treatment with heavy metals and oxyanions.

1. Introduction

Liquid effluent is generated during the metal-extracting process from ores such as copper, iron, and zinc. This effluent has a complex chemical composition, containing heavy metal ions, oxyanions, and colloidal and suspended solids. Various treatment techniques have been developed to remove these contaminants from the effluent, such as chemical precipitation, coagulation–flocculation, sedimentation, filtration, flotation, adsorption, and ion exchange [1,2,3,4,5,6,7].
According to several researchers, adsorption is widely considered one of the most effective methods for removing ions from liquid effluents. This matter is due to its simplicity, low energy consumption, and absence of secondary pollution, making it compatible with sustainable development [2,8,9].
The removal of ions from a liquid effluent largely depends on the surface characteristics of the adsorbent and its adsorption capacity [10,11]. Therefore, adsorbents must possess high adsorption capacity, good transport kinetics, high selectivity for rapid separation, thermal, chemical, and mechanical stability, resistance to fouling, ability to regenerate, low solubility in the liquid effluent, high surface area, appropriate pore size and volume, low cost, and low environmental impact [12,13]. Adsorbents, unmodified or chemically modified adsorbents, activated carbon, zeolites, minerals, or mineral processing residues, among others, have been utilized to remove heavy metal ions and oxyanions [2,14,15]. Activated carbon is the most widely used adsorbent for heavy metal ion removal from liquid effluents in various industries [16]. Ma et al. [17] reported 15.3 mg·g−1 adsorption capacity for Cu2+ and 13.6 mg·g−1 for Zn2+ using multi-walled activated carbon nanotubes functionalized with sulfuric and nitric acids. Conversely, Hong et al. [18] utilized polypyrrole-modified activated carbon to eliminate sulfate from acidic mine drainage water. They found that polypyrrole-modified hardwood-based activated carbon removed 44.7 mg·g−1 of sulfate, five times higher than the removal capacity of unmodified hardwood-based activated carbon.
Several studies have demonstrated the efficacy of activated carbon in adsorbing heavy metal ions [19]. However, it has been observed that this material exhibits a low adsorption capacity for sulfate ions [20].
Despite the literature review on the simultaneous removal of heavy metal ions and sulfate ions, no specific studies were found. However, since effluents generated in industrial processes often contain both types of ions, it is of great interest to investigate the feasibility of removing them together.
A novel solution for the simultaneous removal of copper, zinc, and sulfate ions is proposed in this study using a mixture of adsorbent particles prepared by co-grinding activated carbon and barite as adsorbent particles [21]. During milling, particle breakup generates new surfaces and crystalline defects, such as vacancies and dislocations, which increase the material surface area, reactivity, and surface energy. The combination of activated carbon and barite generates a hybrid material with synergistic properties. Activated carbon offers a high surface area and oxygenated functional groups responsible for the physical adsorption and surface complexation of metals. Barite, chemically stable in acidic pH, acts as an inert phase that improves the structural stability of activated carbon, increases density, and facilitates the recovery of the adsorbent by sedimentation and/or filtration. In addition, its B a 2 + / S O 4 2 surface sites contribute to ion retention and possible surface coprecipitation of metal sulfates. Overall, the activated carbon/barite mixture is an economical, stable, and environmentally safe alternative to the individual use of activated carbon for ion removal from acidic effluents.

2. Materials and Methods

2.1. Materials

The study used synthetic solutions contaminated with 0.058–0.079 mmol·L−1 copper ions, 0.060–0.077 mmol·L−1 zinc ions, and 0.448–0.652 mmol·L−1 sulfate ions prepared by dissolving copper sulfate pentahydrate (CuSO4·5H2O), zinc sulfate heptahydrate (ZnSO4·7H2O), and sodium sulfate (Na2SO4) in acidified demineralized water at pH 2. The pH was adjusted using hydrochloric acid (HCl) 37% w/w or a solution of sodium hydroxide (NaOH) 2% w/v and recorded with a Thermo SCIENTIFIC pH meter, model ORION STAR A221 (Thermo Fisher, Waltham, MA, USA). All the chemical reagents used in the experiments are of analytical grade.
Adsorbent particles were prepared by grinding a mixture of 50% activated carbon and 50% barite concentrate with a purity of 97.7% for 120 s in a ring pulverizer manufactured by TM Engineering (TM Engineering Ltd., Surrey, BC, Canada). Before grinding, the activated carbon and barite concentrate were conditioned by leaching with a hydrochloric acid solution at pH 2 for 24 h at an agitation speed of 270 rpm to remove possible soluble impurities. Subsequently, they were separated from the acid solution using vacuum filtration, washed twice with demineralized water, and dried at 80 °C.
The adsorbent particle mixture was characterized by determining the distribution of particle sizes using the Malvern Mastersizer 2000 laser particle size analyzer (Malvern Panalytical Ltd., Malvern, UK). In addition, the zeta potential was measured using the microelectrophoresis technique in the Zeta Meter System 4.0 equipment (Zeta Meter, Inc., San Antonio, TX, USA). Therefore, a specific chemical analysis was performed using a scanning electron microscope (SEM, Scanning electron microscopy on a Zeiss EVO MA-10, manufactured in Oberkochen, Germany) with an energy-dispersive X-ray analyzer. Similarly, the specific surface area was determined using the BET method (Brunauer–Emmett–Teller), employing an Anton Paar Nova 600 adsorption analyzer (Anton Paar, Graz, Austria). Finally, the mineralogical composition was determined using X-ray diffraction (XRD) in a Shimadzu diffractometer, model XRD6100 (Shimadzu Corporation, Kyoto, Japan).

2.2. Adsorption Tests

Adsorption tests were carried out with 200 mL of synthetic effluent at a stirring speed of 380 rpm in a ZHCHENG model ZHWY-200D orbital shaker (Shanghai Zhicheng Analytical Instrument Co., Ltd., Shanghai, China) and at a room temperature of 25 °C. The pH effect ranges from 2 to 12, the contact time ranges from 0.25 to 24 h, and the adsorbent particle mass ranges from 2.5 to 40 g·L−1 were evaluated. After completing the agitation process, the adsorbent particles, loaded with Cu2+, Zn2+, and S O 4 2 ions, were separated from the solution through vacuum filtration and centrifugation. A system composed of a glass Kitasato with a porcelain Büchner funnel and a 220 V Arquimed vacuum pump, model No. 617CD32 (Thermo Fisher Scientific, Waltham, MA, USA), was used for filtration. A Whatman N°2 filter paper with a pore size of 8 µm and a diameter of 150 mm was used as the filter medium. An IEC CENTRA CL2 centrifuge (Thermo Fisher Scientific, Waltham, MA, USA) was used for centrifugation. Finally, an aliquot of the clarified liquid was collected for chemical analysis. The concentration of copper and zinc ions before and after adsorption was determined using a PerkinElmer PinAAcle 900 F atomic absorption spectrometer (PerkinElmer, Inc., Waltham, MA, USA). The concentration of sulfate ions was determined using the gravimetric method.
The efficiency and adsorption capacity of the adsorbent particles were evaluated using two Equations (1) and (2).
E = C i C f C f · 100
q t = C i C f · V m
In this context, Ci and Cf represent the initial and final concentrations of Cu2+, Zn2+, and S O 4 2 ions or total ions in the effluent, V is the effluent volume, and m is the mass of adsorbent particles. The total ion concentration was calculated by summing the concentrations of Cu2+, Zn2+, and S O 4 2 ions, expressed in mmol·L−1.

2.3. Data Analysis

The results of the effect of contact time on adsorption capacity were fitted to pseudo-first-order and pseudo-second-order kinetic models in order to determine which mechanism predominates in the simultaneous adsorption of Cu2+, Zn2+, and S O 4 2 ions. Additionally, in order to evaluate the possible contribution of the intraparticle diffusion mechanism in the adsorption process, the experimental results were fitted to the model proposed by Weber and Morris.
The pseudo-1st-order model, also known as the Lagergren Velocity Equation, posits that the driving force is the difference between the concentration of the adsorbed solute at equilibrium and the concentration of the adsorbed solute at a given time. Consequently, the adsorption velocity is determined using the following equation [22]:
d q t d t = k 1 · q e q t
The pseudo-2nd-order model assumes that the adsorption capacity is proportional to the number of active sites of the adsorbent and that the adsorption rate is controlled by chemical adsorption [22].
d q t d t = k 2 · q e q t 2
where k1 (min−1) is the pseudo-1st-order velocity, k2 (g·mg−1·min−1) is the pseudo-2nd-order velocity constant, qe and qt (mg·g−1) correspond to the amount of solute adsorbed at equilibrium and adsorbed at time t, respectively.
The Weber–Morris intraparticle diffusion model assumes that, after overcoming the resistance to external transport in the liquid film surrounding the adsorbent, the diffusion of the solute into the pores may constitute the limiting step in the adsorption process. It is expressed by the following equation [23].
q t = k i · t 0.5 + C
where ki is the intraparticle diffusion constant (mg·g−1·min−1/2) and C represents the effect of the boundary layer thickness (mg·g−1).
The results regarding the effect of the adsorbent particle concentration were fitted to the models proposed by Langmuir, Freundlich, Dubinin–Astakhov, and the multilayer adsorption model.
The Langmuir isotherm assumes monolayer adsorption, which occurs at finite localized sites. Each adsorption site has the same affinity for the adsorbate. The adsorption energy is constant and does not depend on the adsorption coverage, and the adsorbed molecules cannot move laterally on the surface once bound to an adsorption site. It is expressed by the following equation [24].
q e = q 0 b C e 1 + b C e
The Freundlich isotherm is an empirical model applied to multilayer adsorption with non-uniform adsorption heat distribution and affinities on the heterogeneous surface. The slope, ranging between 0 and 1, indicates the measure of adsorption intensity or surface heterogeneity, which will be more heterogeneous the closer its slope value is to zero and is expressed by the following equation [24].
q e = K F C e 1 / n
The Dubinin–Astakhov model has been used widely for fitting adsorption isotherm data, particularly for adsorbents with micropores. Micropores are pores with a diameter of less than 2 nm, macropores are pores with a diameter greater than 50 nm, and mesopores are those between 2 and 50 nm. This model is the distribution function of the filling degree of the adsorption space concerning the adsorption potential ε [25].
q e = q 0 E X P ε 2 E η D
ε = R T l n 1 + 1 C e
where qe is the equilibrium adsorption capacity (mg·g−1), q0 is the maximum adsorption capacity (mg·g−1), b is the Langmuir isotherm constant (L·mg−1), KF is the Freundlich isotherm constant (mg·g−1) (L·g−1) related to adsorption capacity, n is the adsorption intensity, Ce is the equilibrium of concentration (mg·L−1), η D is a fitting parameter of the Dubinin–Astakhov model, ε is the adsorption potential (kJ·mol−1), E is the characteristic adsorption energy of a given system (kJ·mol−1), and Ce represents the equilibrium concentration of adsorbate (mg·L−1).
The multilayer adsorption model, MLA, can be represented by the following equation, [26].
Γ = Γ m · K 1 · C e 1 K 2 · C e · 1 + K 1 K 2 · C e
where Γ is the adsorption capacity of the monolayer (mg·g−1), Ce is the equilibrium adsorbate concentration (mg·L−1), and K1 and K2 are the equilibrium adsorption constants of the first and second layers (L·mg−1).
The fit quality of the models was evaluated using the following statistical parameters: coefficient of variation CV, coefficient of determination R2, and standard error of estimation SEE, determined utilizing Equations (11)–(13).
C V = σ X ¯
R 2 = Y ^ i Y ¯ 2 Y i Y ¯
S E E = Y i Y ^ i n 2

3. Results and Discussion

3.1. Characterization of Adsorbent Particles

3.1.1. Size Distribution and Specific Surface Area of the Adsorbent Particle

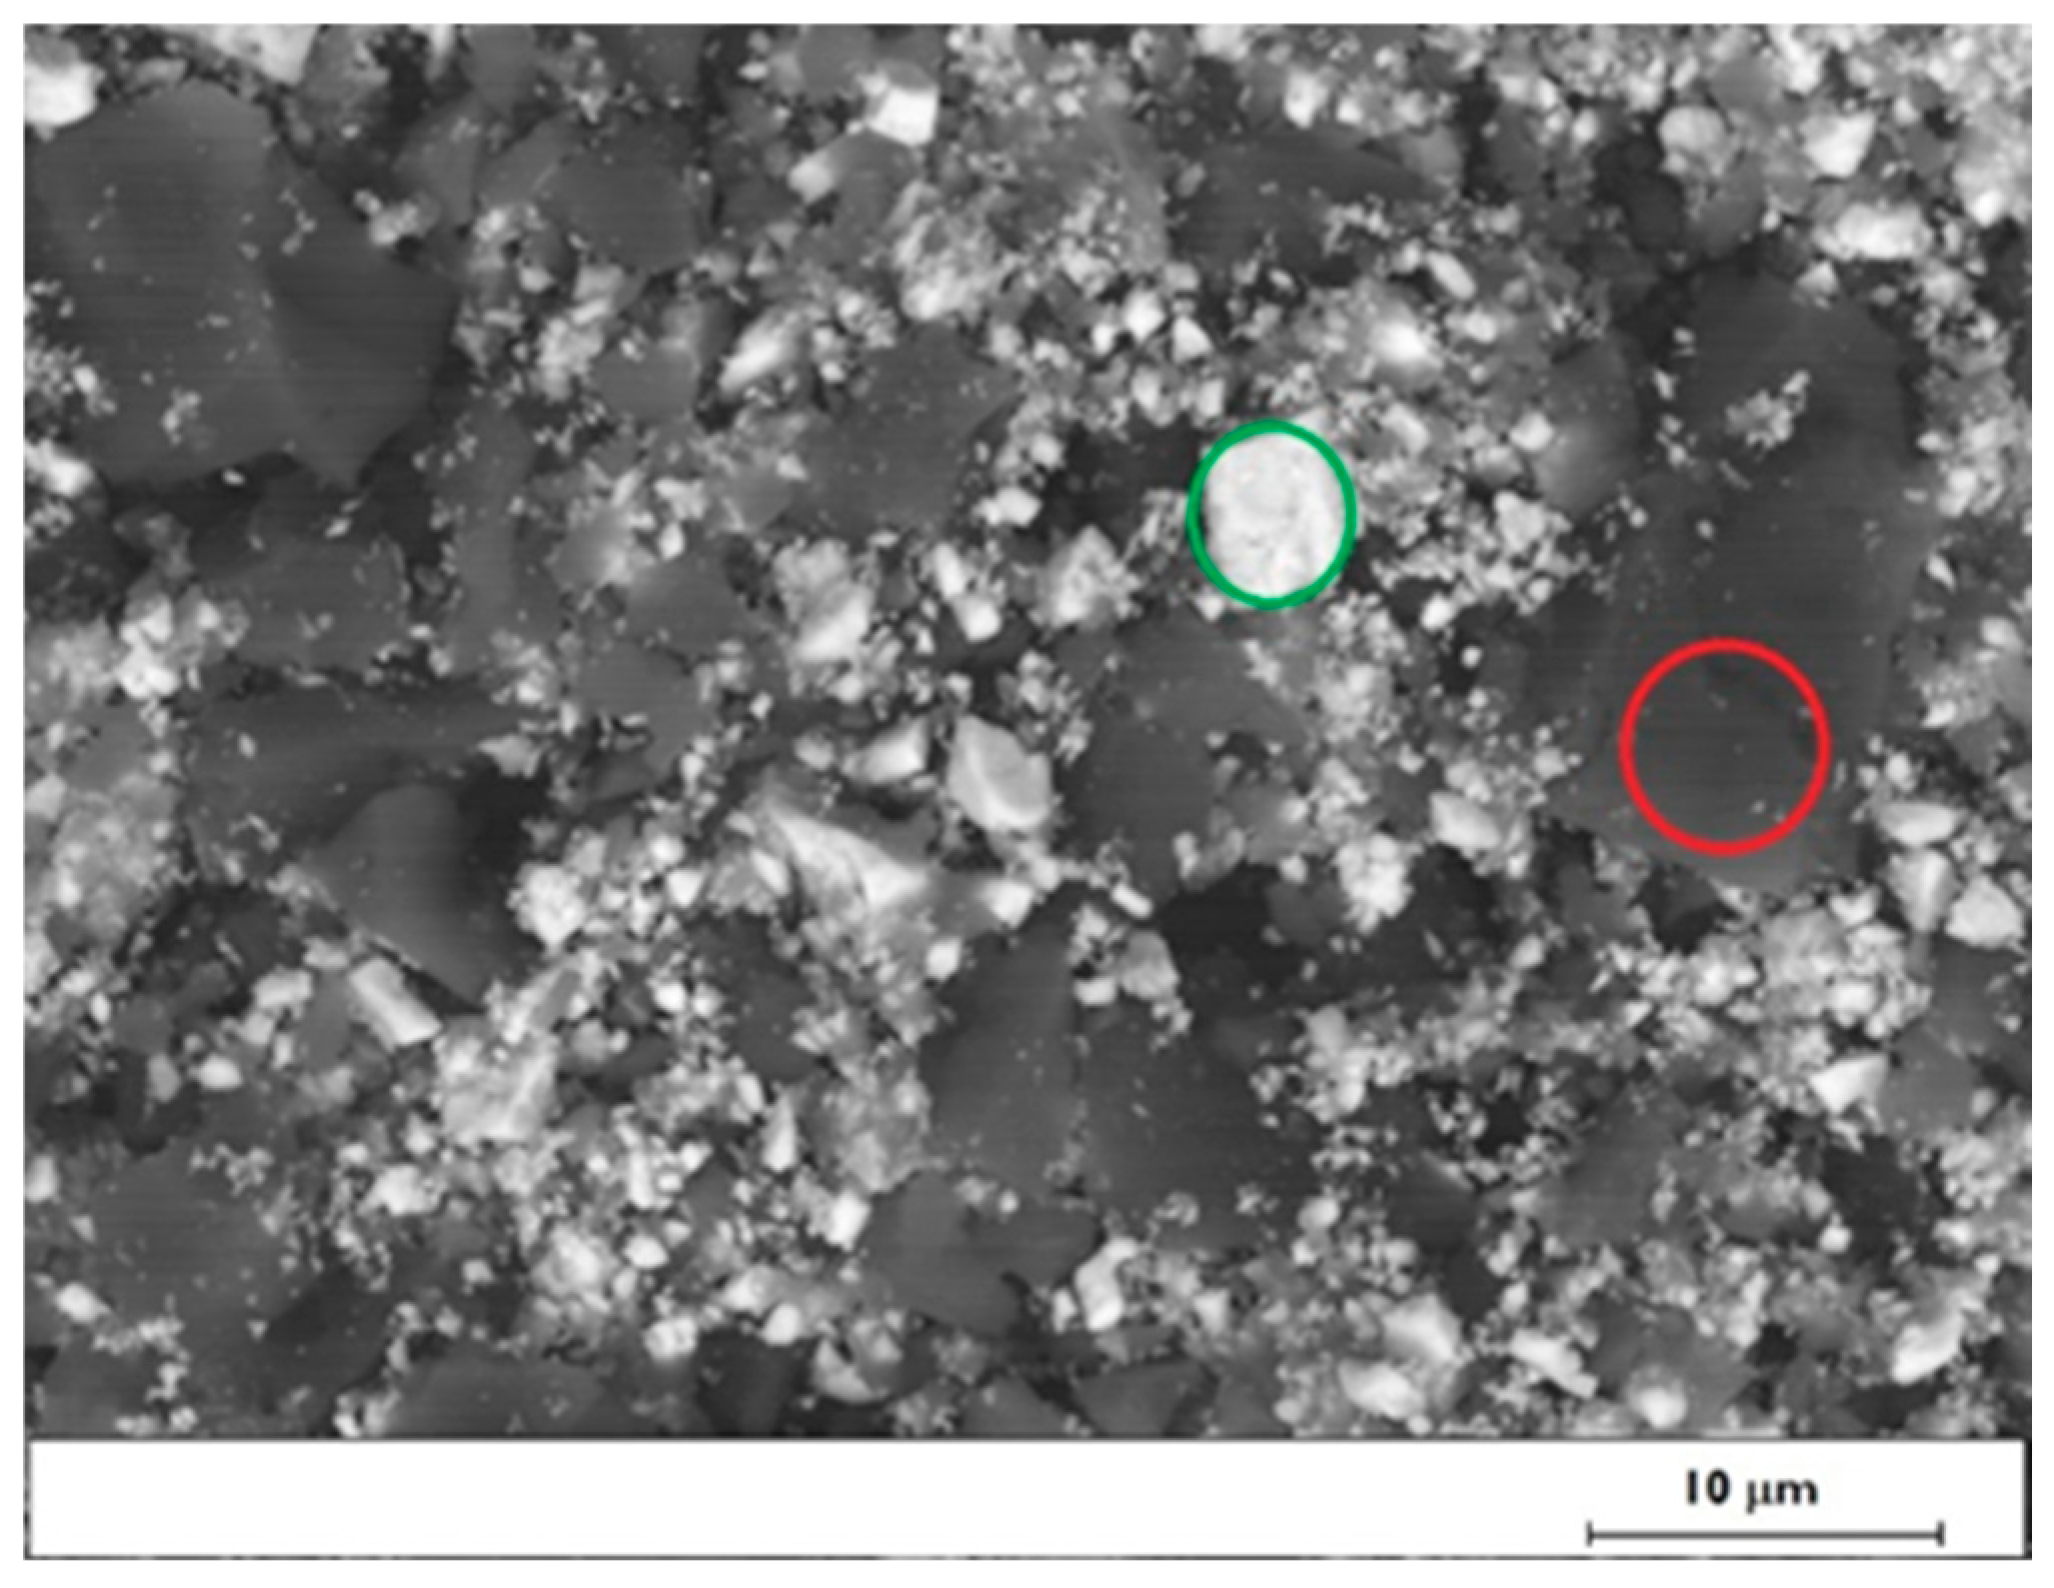
Figure 1 shows that after a grinding time of 120 s, the average size of the adsorbent particles is 8.56 ± 0.78 μm, and 100% have a size less than 60 μm. Figure 2 shows a scanning electron microscope (SEM) backscattered electron image of the adsorbent particles. In this mode of operation, particles with higher atomic weight appear white, while particles with lower atomic weight appear dark. The figure shows that the white particles’ size (barite) is smaller than that of the dark particles (activated carbon). This issue is probably due to differences in the physical properties of the two materials, with barite being more brittle than activated carbon.
The activated carbon/barite mixture had a specific surface area of 742.4 m2·g−1 and a pore volume of 0.198 cm3·g−1.

3.1.2. Chemical and Mineralogical Analyses

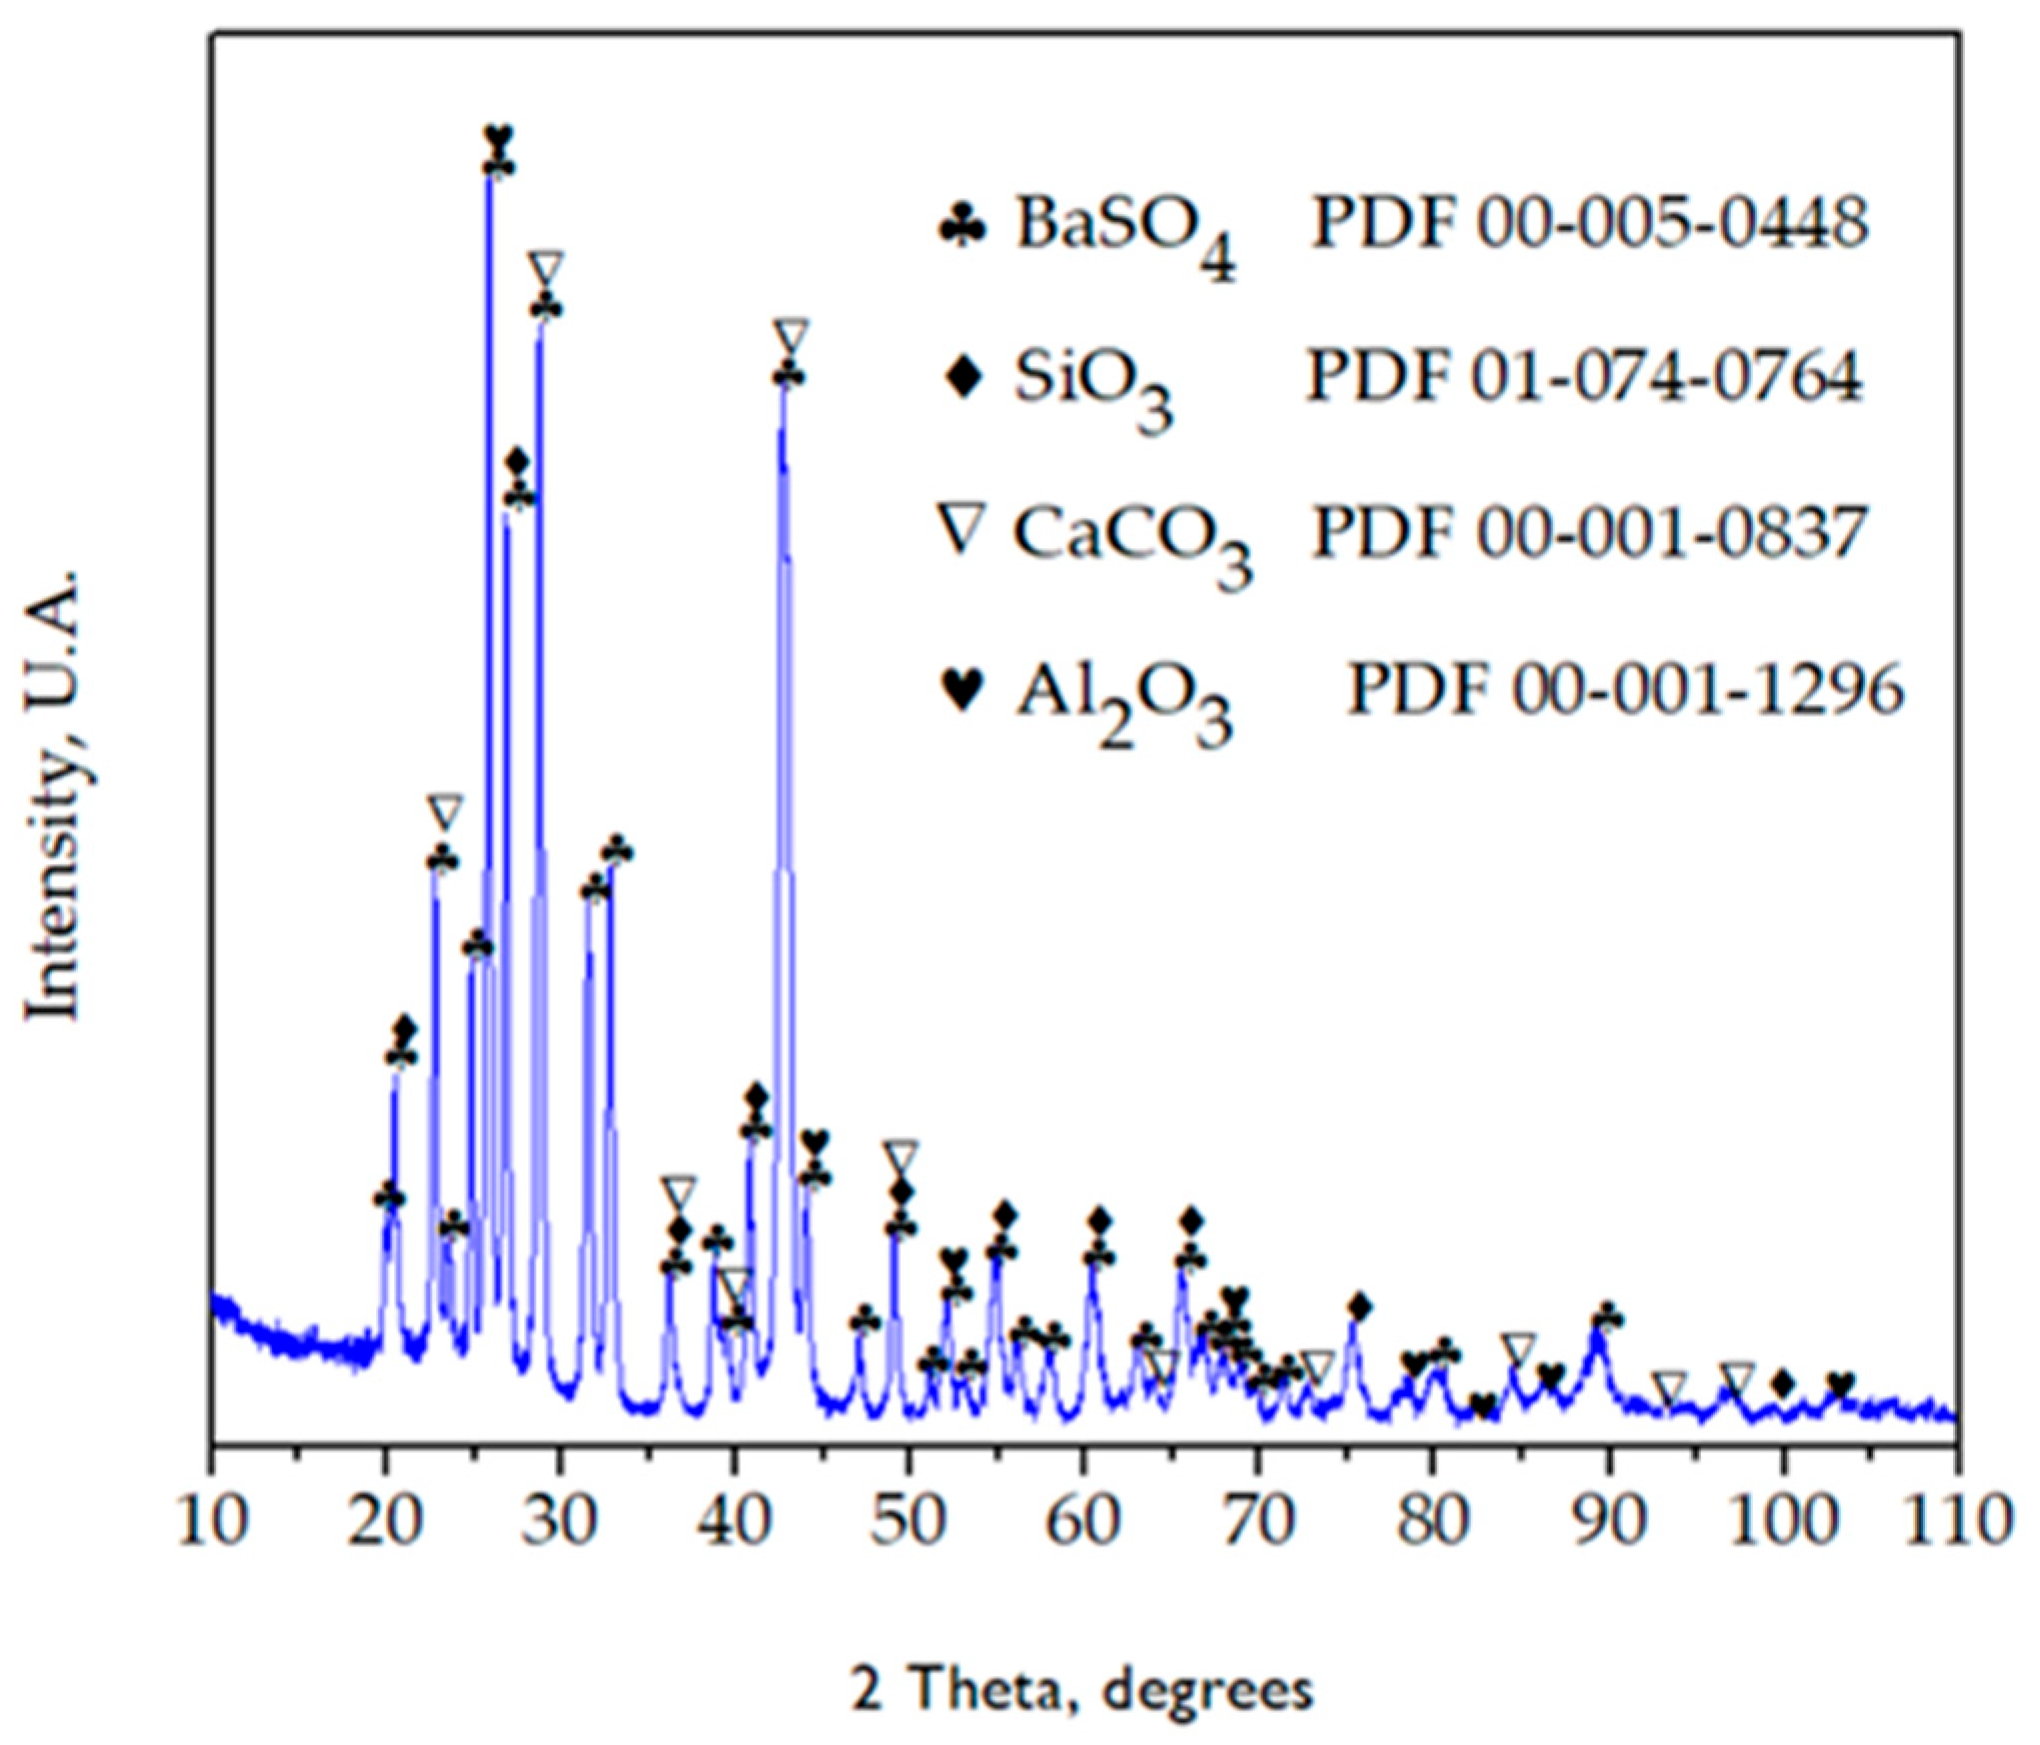
Figure 3 shows the XRD pattern of the adsorbent particles. It illustrates that the adsorbent particles are mainly composed of barite (BaSO4), with small amounts of alumina (Al2O3), quartz (SIO2), and calcite (CaCO3). Since the activated carbon lacks an ordered crystalline arrangement, it does not present peaks characteristic of crystalline phases. Employing energy dispersive X-ray spectroscopy (EDS) applied to a white particle (green circle, Figure 2), the elements that make up the barite, barium (60.7%), oxygen (21.2%), sulfur (11.8%), carbon (5.8%), and silicon (0.5%), were mainly identified. On the other hand, EDS analysis performed on a dark particle (red circle, Figure 2) reveals the presence of carbon, 92.3%, oxygen 6.6%, potassium 0.3%, iron 0.2%, sulfur 0.2%, silicon 0.1, and chlorine 0.1%.

3.1.3. Zeta Potential

Figure 4 shows that the adsorbent particles’ isoelectric point (IP) occurs at pH 2.34. Therefore, at pH < PI, the particles have a positive surface charge, which would favor the adsorption of S O 4 2 ions. Meanwhile, at pH > PI, the particles have a negative surface charge, which would promote the adsorption of Cu2+ and Zn2+ ions.

3.2. Adsorption of Ions

3.2.1. Effect of pH

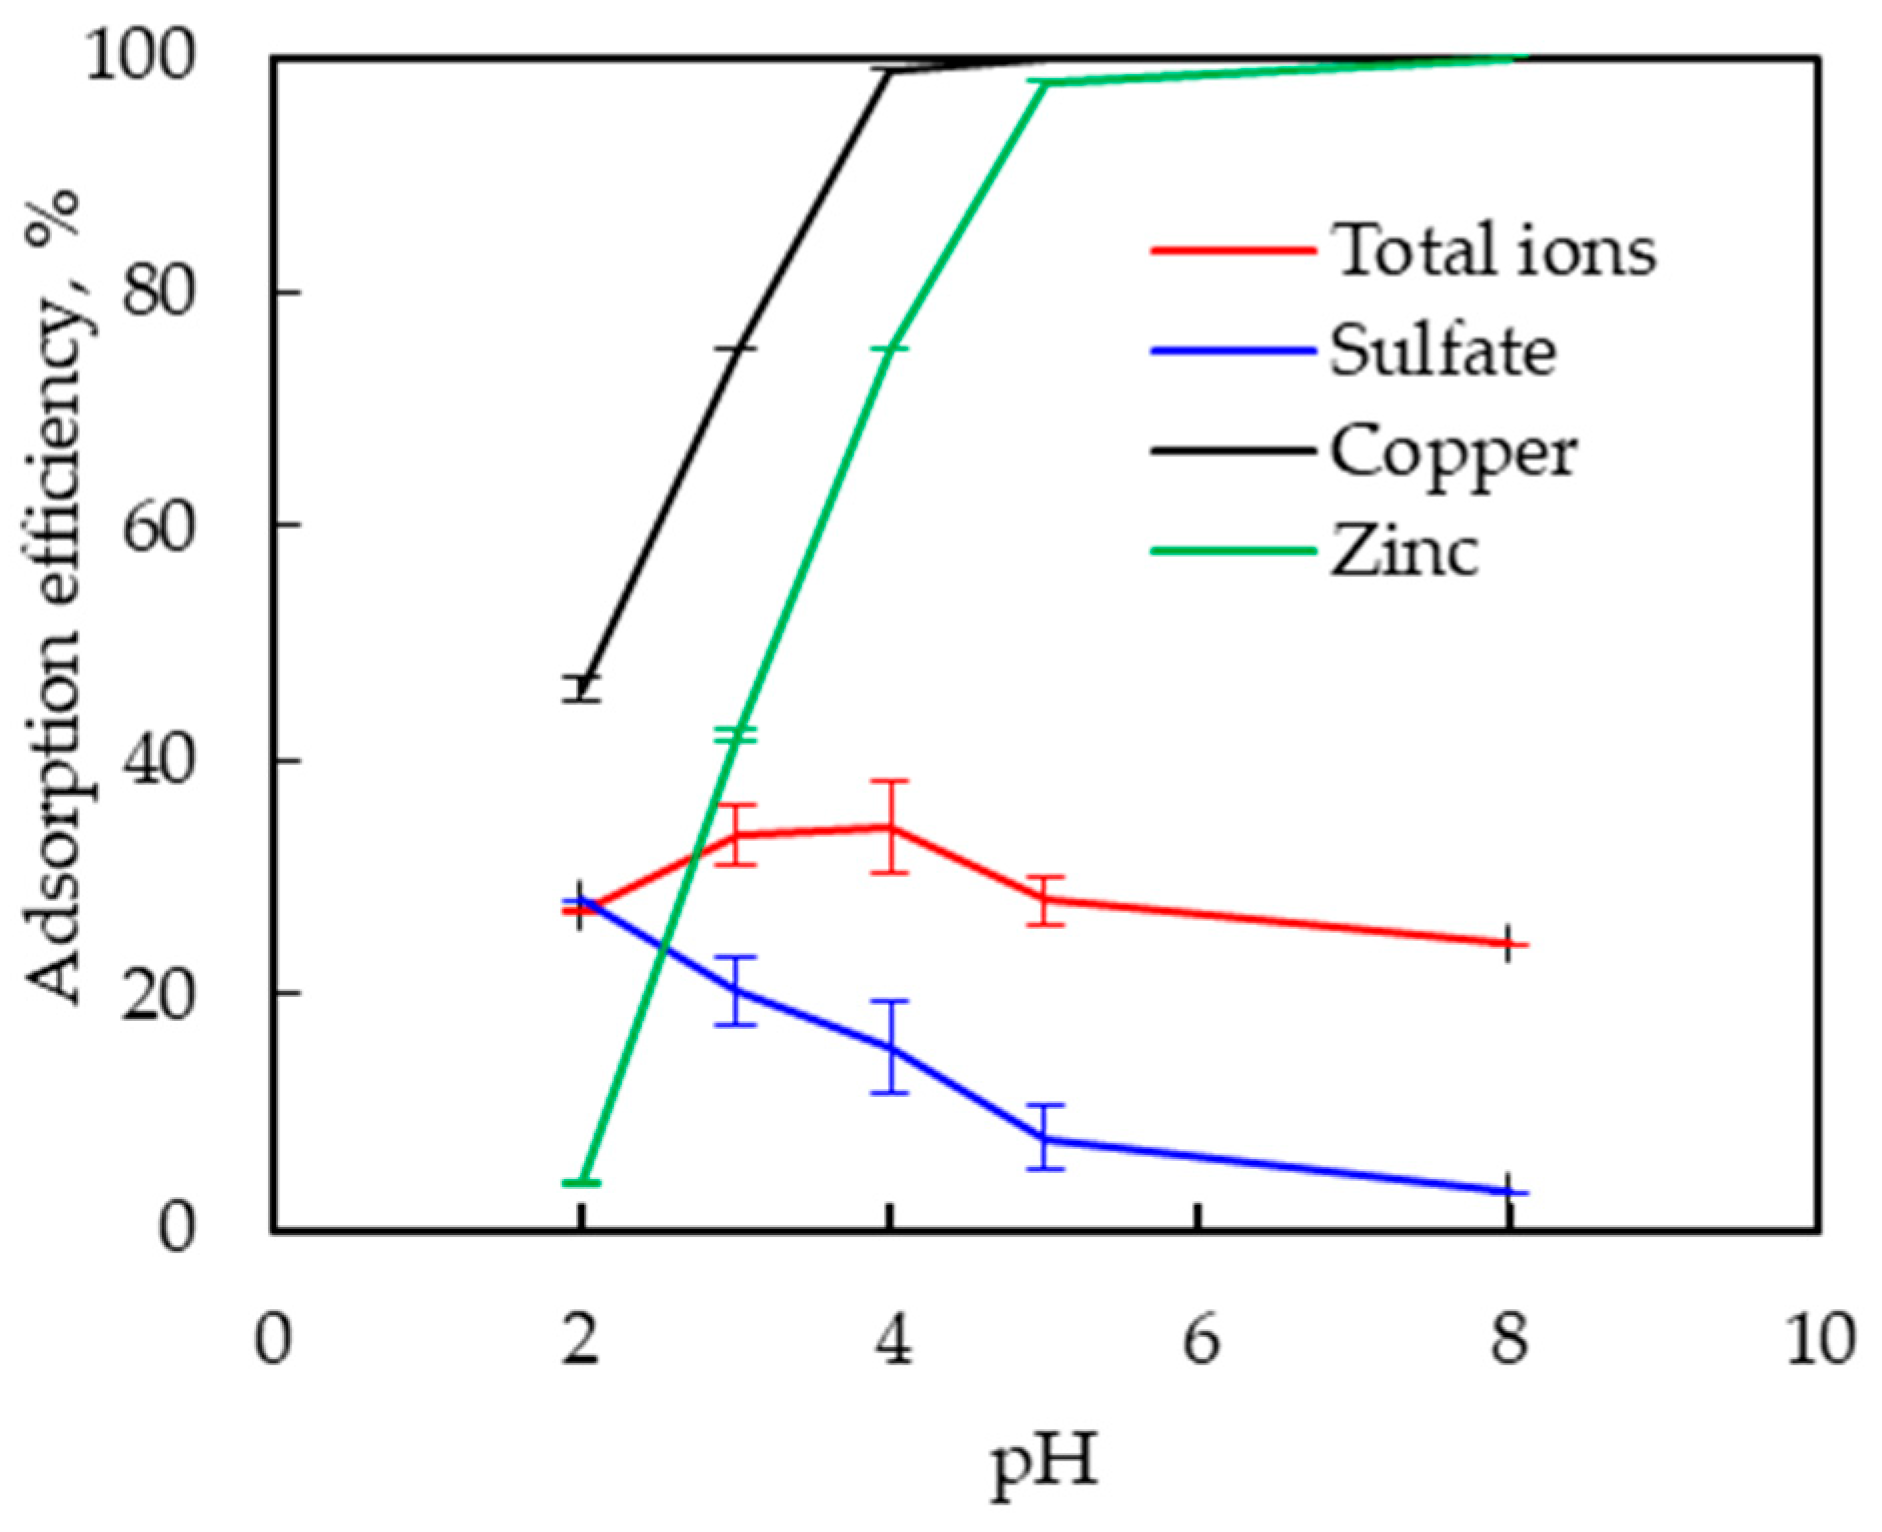
Figure 5 shows the effect of pH on the adsorption efficiency of Cu2+, Zn2+, and S O 4 2 ions individually and on the total ion adsorption efficiency. The experiments were conducted using 20 g·L−1 of adsorbent particles, a temperature of 25 °C, a contact time of 180 min, and initial concentrations of 0.0788 mmol·L−1 of Cu2+, 0.0765 mmol·L−1 of Zn2+, and 0.525 mmol·L−1 of S O 4 2 .
Figure 5 shows that the adsorption efficiency of Cu2+ and Zn2+ increases with increasing pH. However, the adsorption efficiency of S O 4 2 presents an inverse effect: with increasing pH, the adsorption efficiency of S O 4 2 ions decreases. The maximum adsorption efficiency of Cu2+ and Zn2+ is 100% at pH > 4, while the maximum adsorption efficiency of S O 4 2 is 28.1% at pH 2.
The lower adsorption efficiency of Cu2+ and Zn2+ at pH below 4 is mainly due to the high concentration of H+ ions, which compete with the cations for the available adsorption sites on the adsorbent surface.
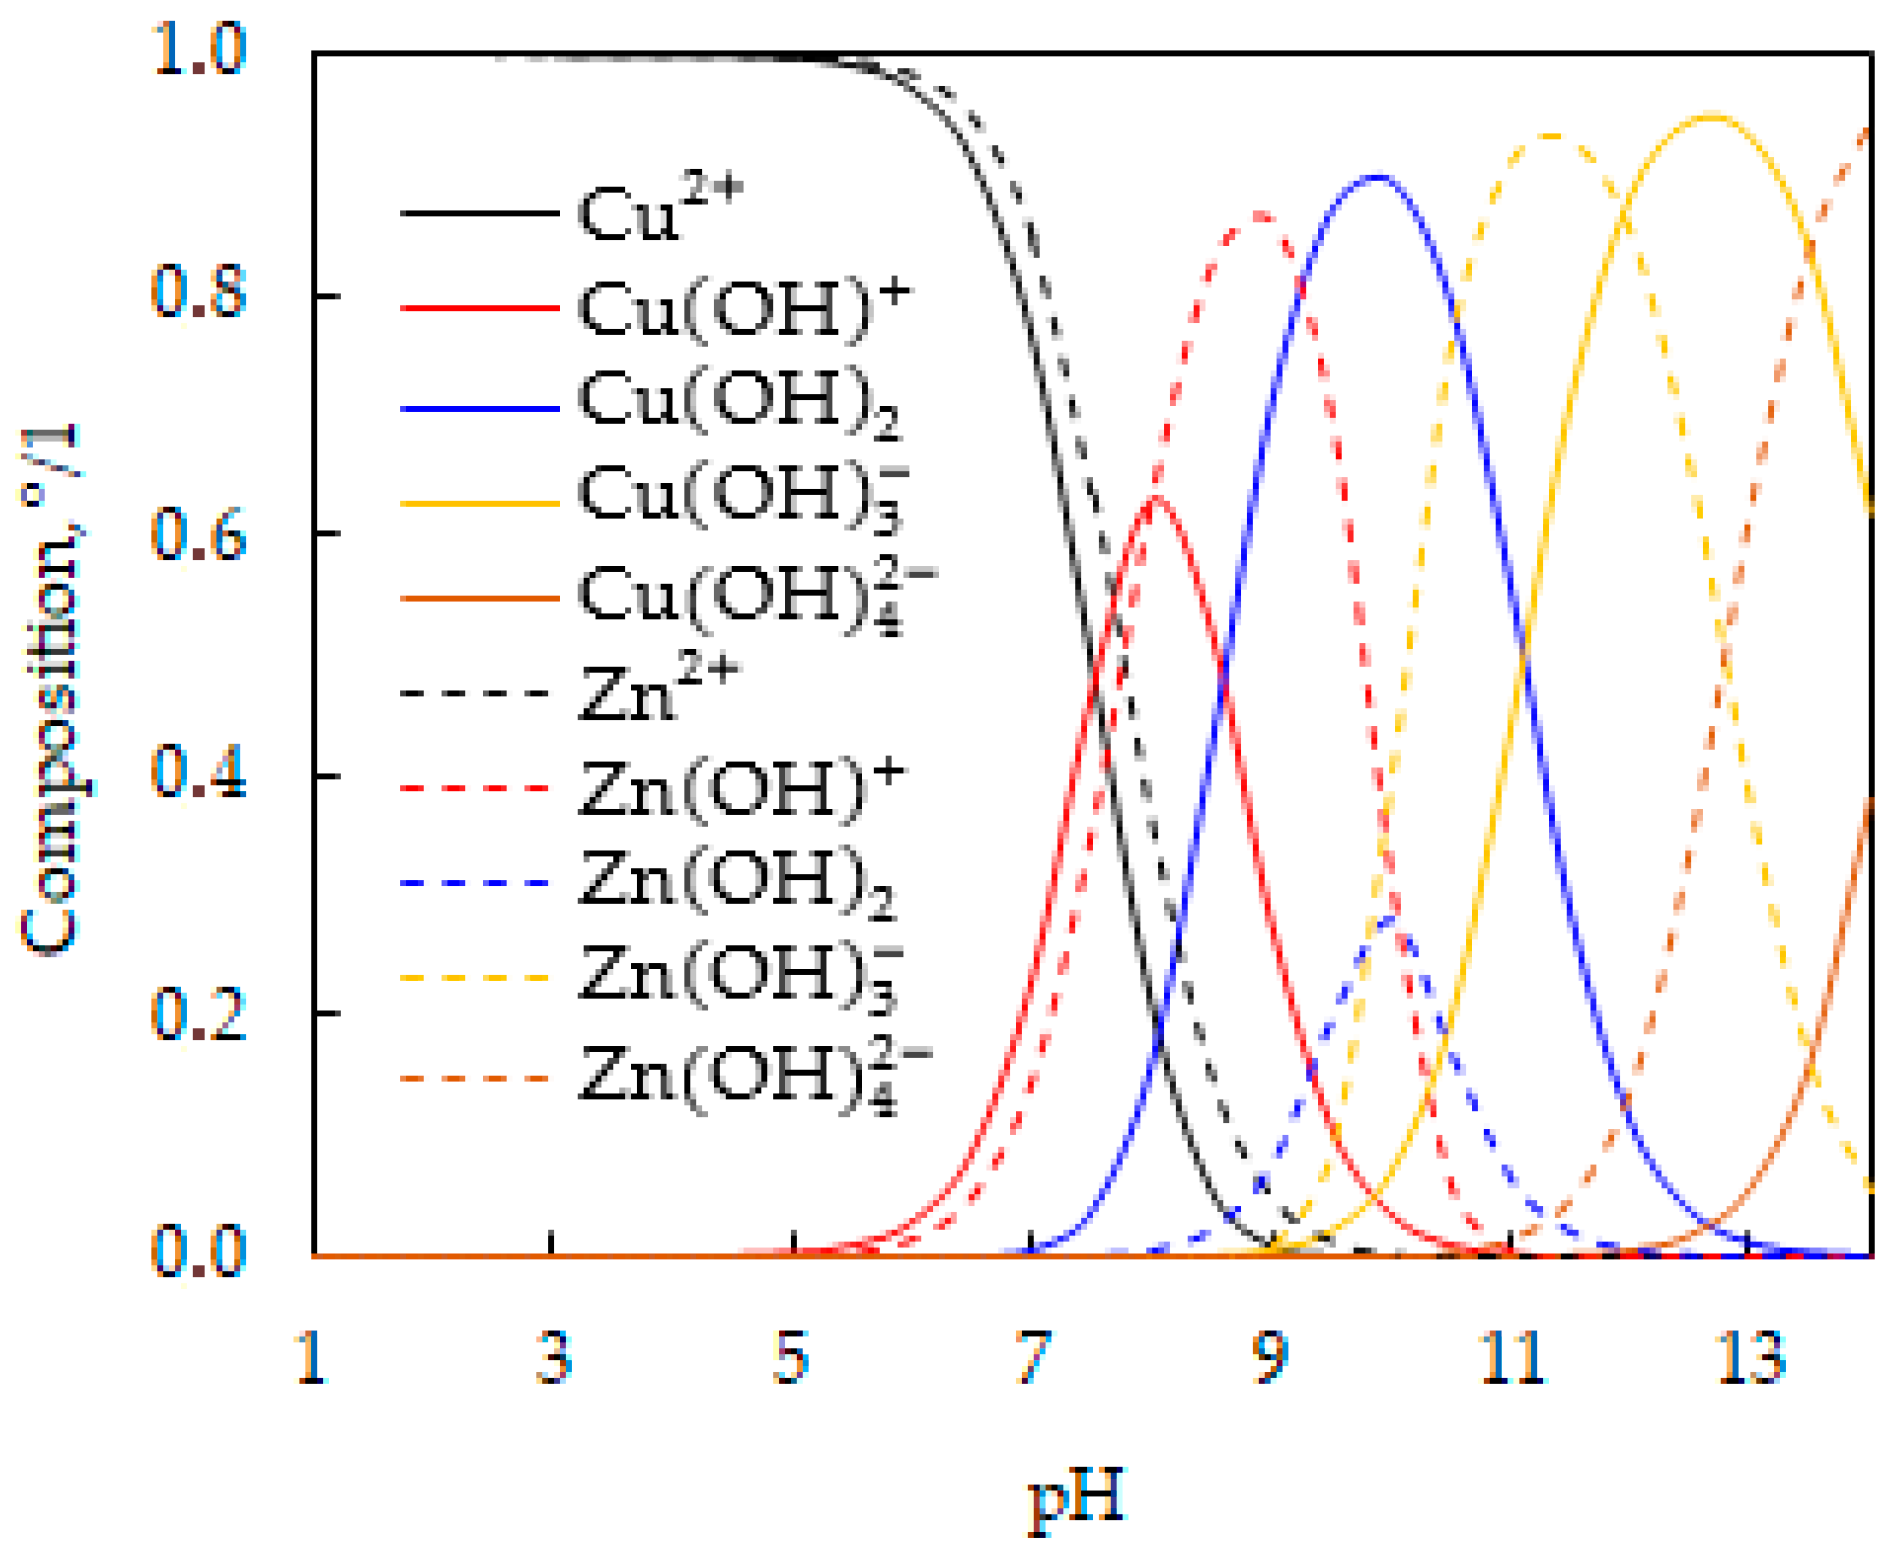
Most researchers agree that cation adsorption is influenced strongly by pH since it determines the degree of ionization of copper and zinc species in solution and the surface charge of the adsorbent [27]. The distribution diagram of copper and zinc species as a function of pH exhibited in Figure 6 was plotted using the same concentration of copper and zinc used for the preparation of the synthetic effluents 0.0788 mmol·L−1 copper and 0.0765 mmol·L−1 zinc (5 mg·L−1 copper and 5 mg·L−1 zinc), and employing the equilibrium constants of the Cu2+ and Zn2+ hydrolysis reactions reported by Weng et al. [28] and Olivia et al. [29], respectively. The diagram indicates that at pH < 5.5, the only ionic species in the solution are Cu2+ and Zn2+. Meanwhile, at pH between 5.5 and 10, the predominant ionic species are Cu2+, Cu(OH)+, Cu(OH)2, Zn2+, Zn(OH)+ and Zn(OH)2. Meanwhile, at pH > 10, the predominant ionic species are Cu(OH)2, C u ( O H ) 3 , Zn(OH)2, and Z n ( O H ) 3 . Zeta potential measurements performed on the adsorbent particles showed that their surface charge is negative at pH > PI. It is important to note that in all tests, the final pH after adsorption was higher than the initial pH. When the adsorption tests were carried out at pH 4, the final pH after adsorption was 5.5. At this pH value, the only copper and zinc species present are Cu2+ and Zn2+. Therefore, the adsorption of Cu2+ and Zn2+ ions can be attributed to ion exchange between Cu2+ and Zn2+ and the H+ ions present at the adsorption sites of the composite. At pH between 2.34 and 5.5, the adsorbent particles exhibit a negative surface charge, likely balanced by H+ ions, which can be exchanged for Cu2+ and Zn2+ ions. When the adsorption tests were carried out at pH > 5, the final pH after adsorption varied between 6 and 7. In this pH range, the ion species present are Cu2+ and Zn2+ and hydrolyzed Cu(OH)+ and Zn(OH)+ ions. For this reason, the most feasible adsorption mechanism is the cation exchange of non-hydrolyzed ions, Cu2+ and Zn2+, and hydrolyzed Cu(OH)+ and Zn(OH)+ ions with H+ ions.
At pH 2, the adsorbent particles present a positive surface charge. Therefore, the S O 4 2 adsorption can be attributed to physical adsorption by the electrostatic attraction mechanism. At pH > PI, the adsorbent particles present a negative surface charge. Therefore, it is suggested that the possible mechanism of S O 4 2 adsorption is an electrostatic attraction on the previously adsorbed Cu2+ or Zn2+ layer. The decrease in the percentage of S O 4 2 adsorption as the pH increases is possibly due to the rise in the concentration of OH- ions, which compete with the anions to adsorb on the previously adsorbed cation layer on the active sites of the adsorbent particles.

3.2.2. Effect of Contact Time

The effect of contact time on the adsorption capacity of Cu2+, Zn2+, and S O 4 2 ions was investigated using 5 g·L−1 of adsorbent particles, a temperature of 25 °C, and initial concentrations of 0.0791 mmol·L−1 of Cu2+, 0.0798 mmol·L−1 of Zn2+, and 0.652 mmol·L−1 of S O 4 2 at pH 3. This pH value adequately reproduces the conditions characteristic of acid mine drainage (AMD), in which Cu2+ and Zn2+ ions remain completely soluble in a strongly acidic medium [30]. Furthermore, according to pH effect tests, it has been observed that increasing the pH decreases the adsorption of S O 4 2 ions, given that the isoelectric point (IP) of the adsorbent particles is 2.34, and when the pH is increased above this value, the surface of the material becomes more negative, decreasing the adsorption of sulfate anions. Therefore, working in acidic conditions favors the simultaneous removal of cations and anions, maximizing the total ion adsorption efficiency.
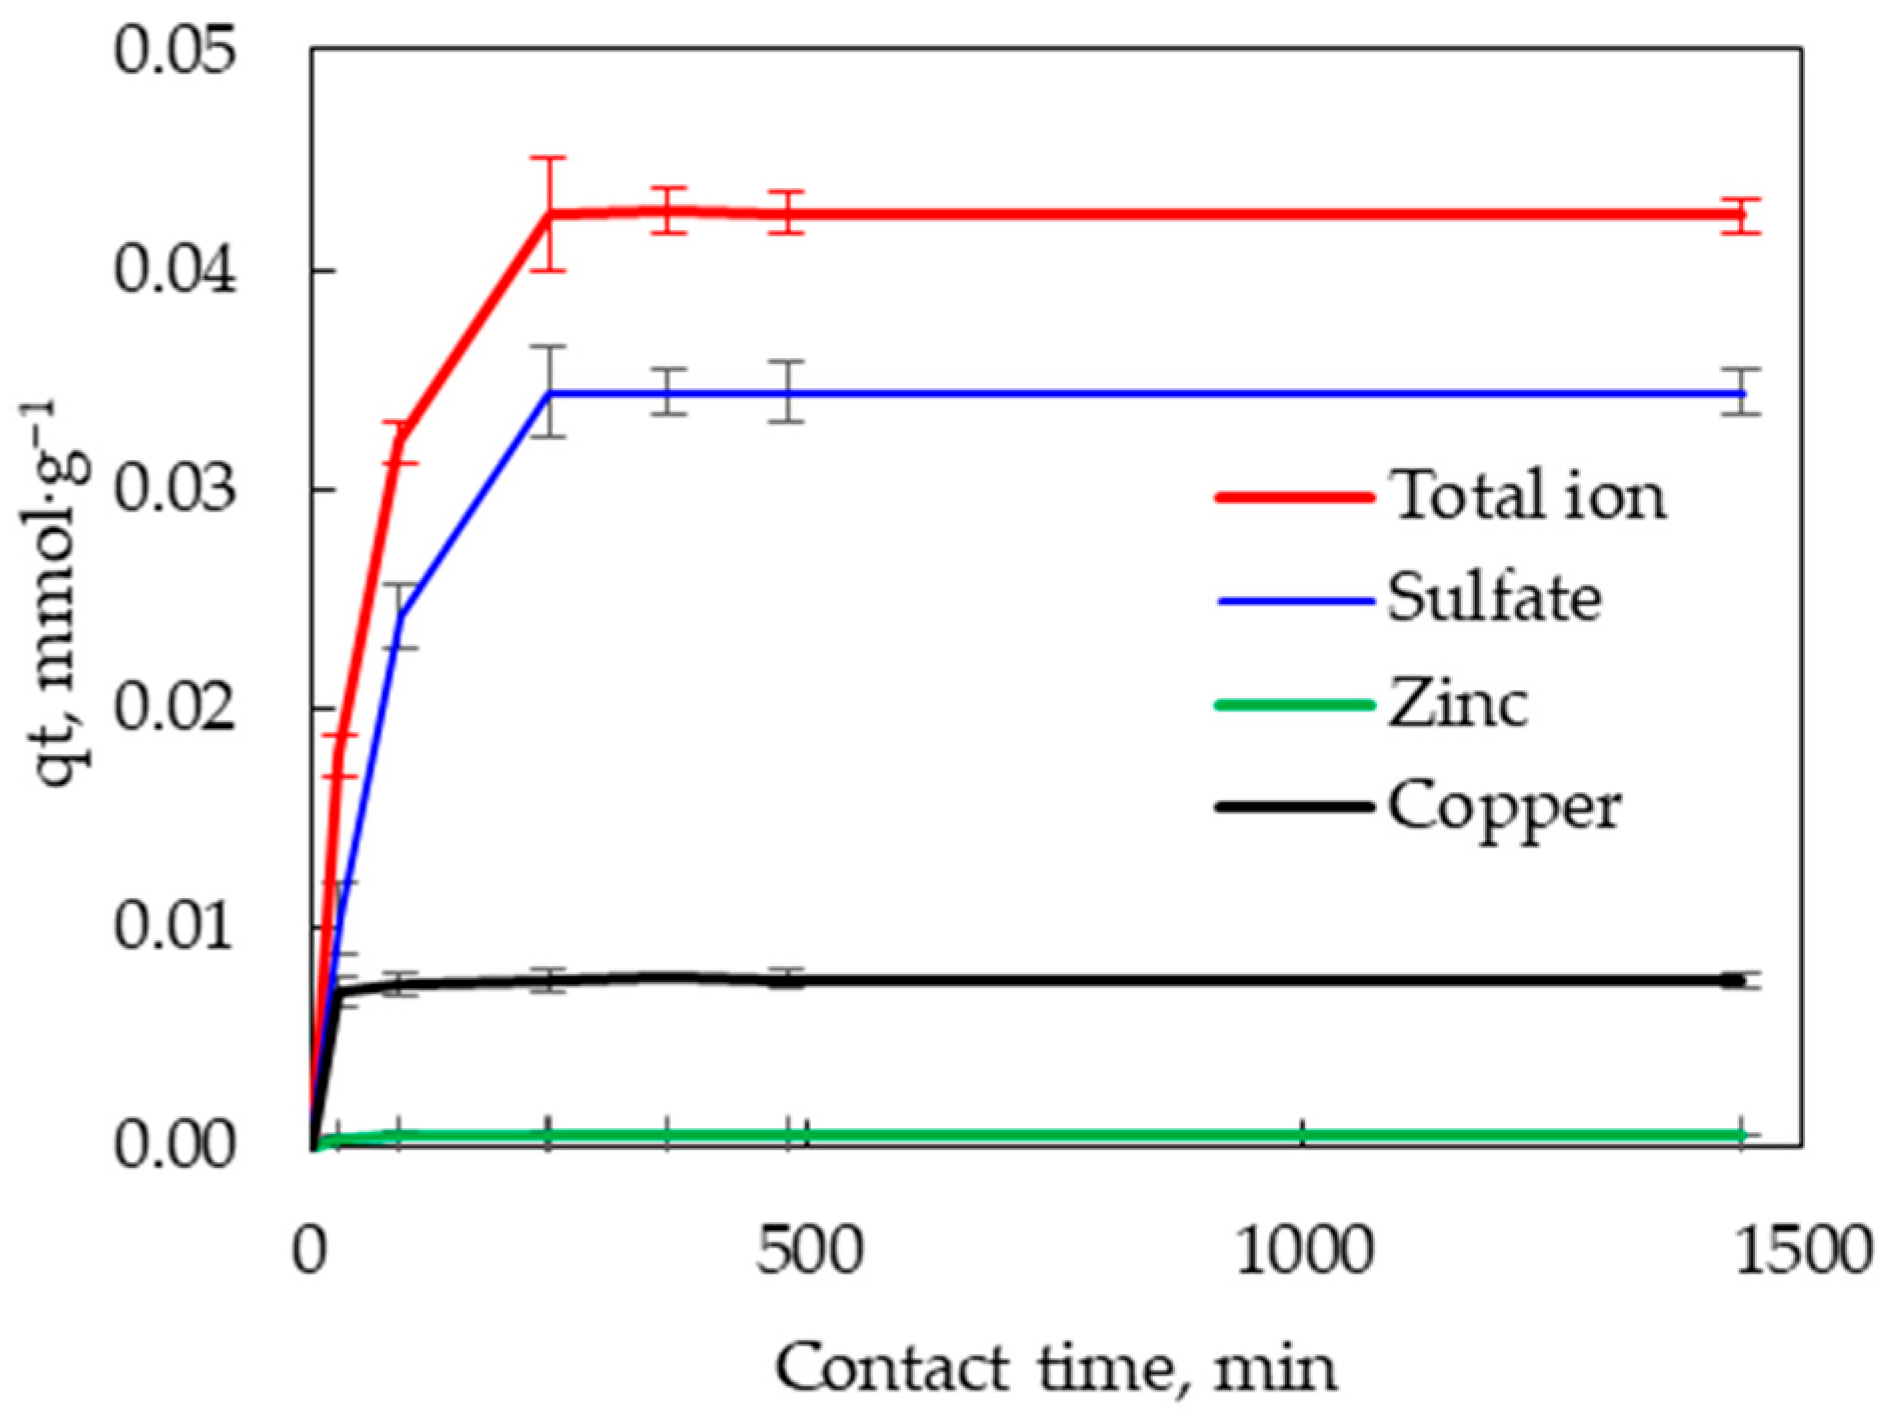
In Figure 7, the total ion adsorption capacity (red line) and the individual adsorption capacity for each of the ions contained in the synthetic effluent are plotted for Cu2+ (black line), for Zn2+ (green line), and for S O 4 2 (blue line).
The figure initially shows that the amount of adsorbed ions increases rapidly until it gradually reaches equilibrium at 240 min, reaching a total ion adsorption capacity of 0.042 mmol·g−1. The figure also shows that the adsorption capacity is higher for S O 4 2 ions, reaching an adsorption capacity at equilibrium on the order of 0.034 mmol·g−1, followed by Cu2+ ions, with an adsorption capacity at equilibrium on the order of 0.008 mmol·g−1, and the lowest adsorption capacity is for Zn2+ ions, with an adsorption capacity at equilibrium on the order of 0.0005 mmol·g−1.
Figure 8 shows that the total ion concentration decreases from 0.81 mmol·L−1 to 0.60 mmol·L−1 while the adsorption efficiency gradually increases with time, reaching a value of 26% at 240 min. On the other hand, the final pH after adsorption varied between 3 and 3.2. At these pH values, the principal cation species present in the effluent are Cu2+ and Zn2+. Therefore, as suggested when analyzing the effect of pH, the adsorption mechanism is physical.
The contact time results on the total ion adsorption capacity were fitted using the 1st and 2nd-order kinetic models to determine which mechanism predominates in the simultaneous adsorption of Cu2+, Zn2+, and S O 4 2 ions. The results of the adjustment are shown in Figure 9. Based on the kinetic values and statistical parameters of the models presented in Table 1, the pseudo-1st-order model best represents the kinetic data. These results also coincide with Wang and Guo [31], who point out that the adsorption kinetics fit better to the pseudo-1st-order model when the adsorbate concentration is high and when the adsorbent has few active sites. Therefore, external or internal diffusion is the stage that controls the adsorption rate. On the other hand, according to Agbovi and Wilson [32], when external or internal diffusion is the stage controlling the adsorption kinetics, the adsorption mechanism is physisorption.
The physisorption mechanism is the most likely mechanism for the simultaneous adsorption of ions, considering that the tests were carried out at pH 3. At this pH value, the adsorbent particles present a negative surface charge balanced by H+, which was exchanged probably by Cu2+ mainly, and on the adsorbed layer of copper ions, the S O 4 2 was adsorbed.
In order to evaluate the possible contribution of the intraparticle diffusion mechanism in the adsorption process, the experimental results were fitted to the model proposed by Weber and Morris [33]. The parameters obtained from the adjustment are presented in Table 2. The low value of the intraparticle diffusion rate constant (ki = 0.0062 mmol·g−1 min0.5) indicates that the transfer of the solute into the pores is slow, so the adsorption process is partially limited by the diffusive resistance within the particles. In turn, the low value of the intersection (C = 0.0254 mmol g−1) reflects that the resistance associated with the external boundary layer or liquid film is minimal. As a result, ions can easily reach the adsorbent surface without significant accumulation of solute before entering the pores [34]. However, the low coefficient of determination obtained (R2 = 0.4831) indicates that the Weber–Morris model does not adequately describe the overall kinetics, suggesting the involvement of additional mechanisms such as surface diffusion, diffusion in the outer film, or rapid surface adsorption, which could dominate the process. Consequently, although the intraparticle diffusion model provides valuable information on the nature of internal transport, it should not be considered the sole controlling mechanism, but rather a complementary component within a comprehensive kinetic analysis [35].

3.2.3. Effect of Concentration

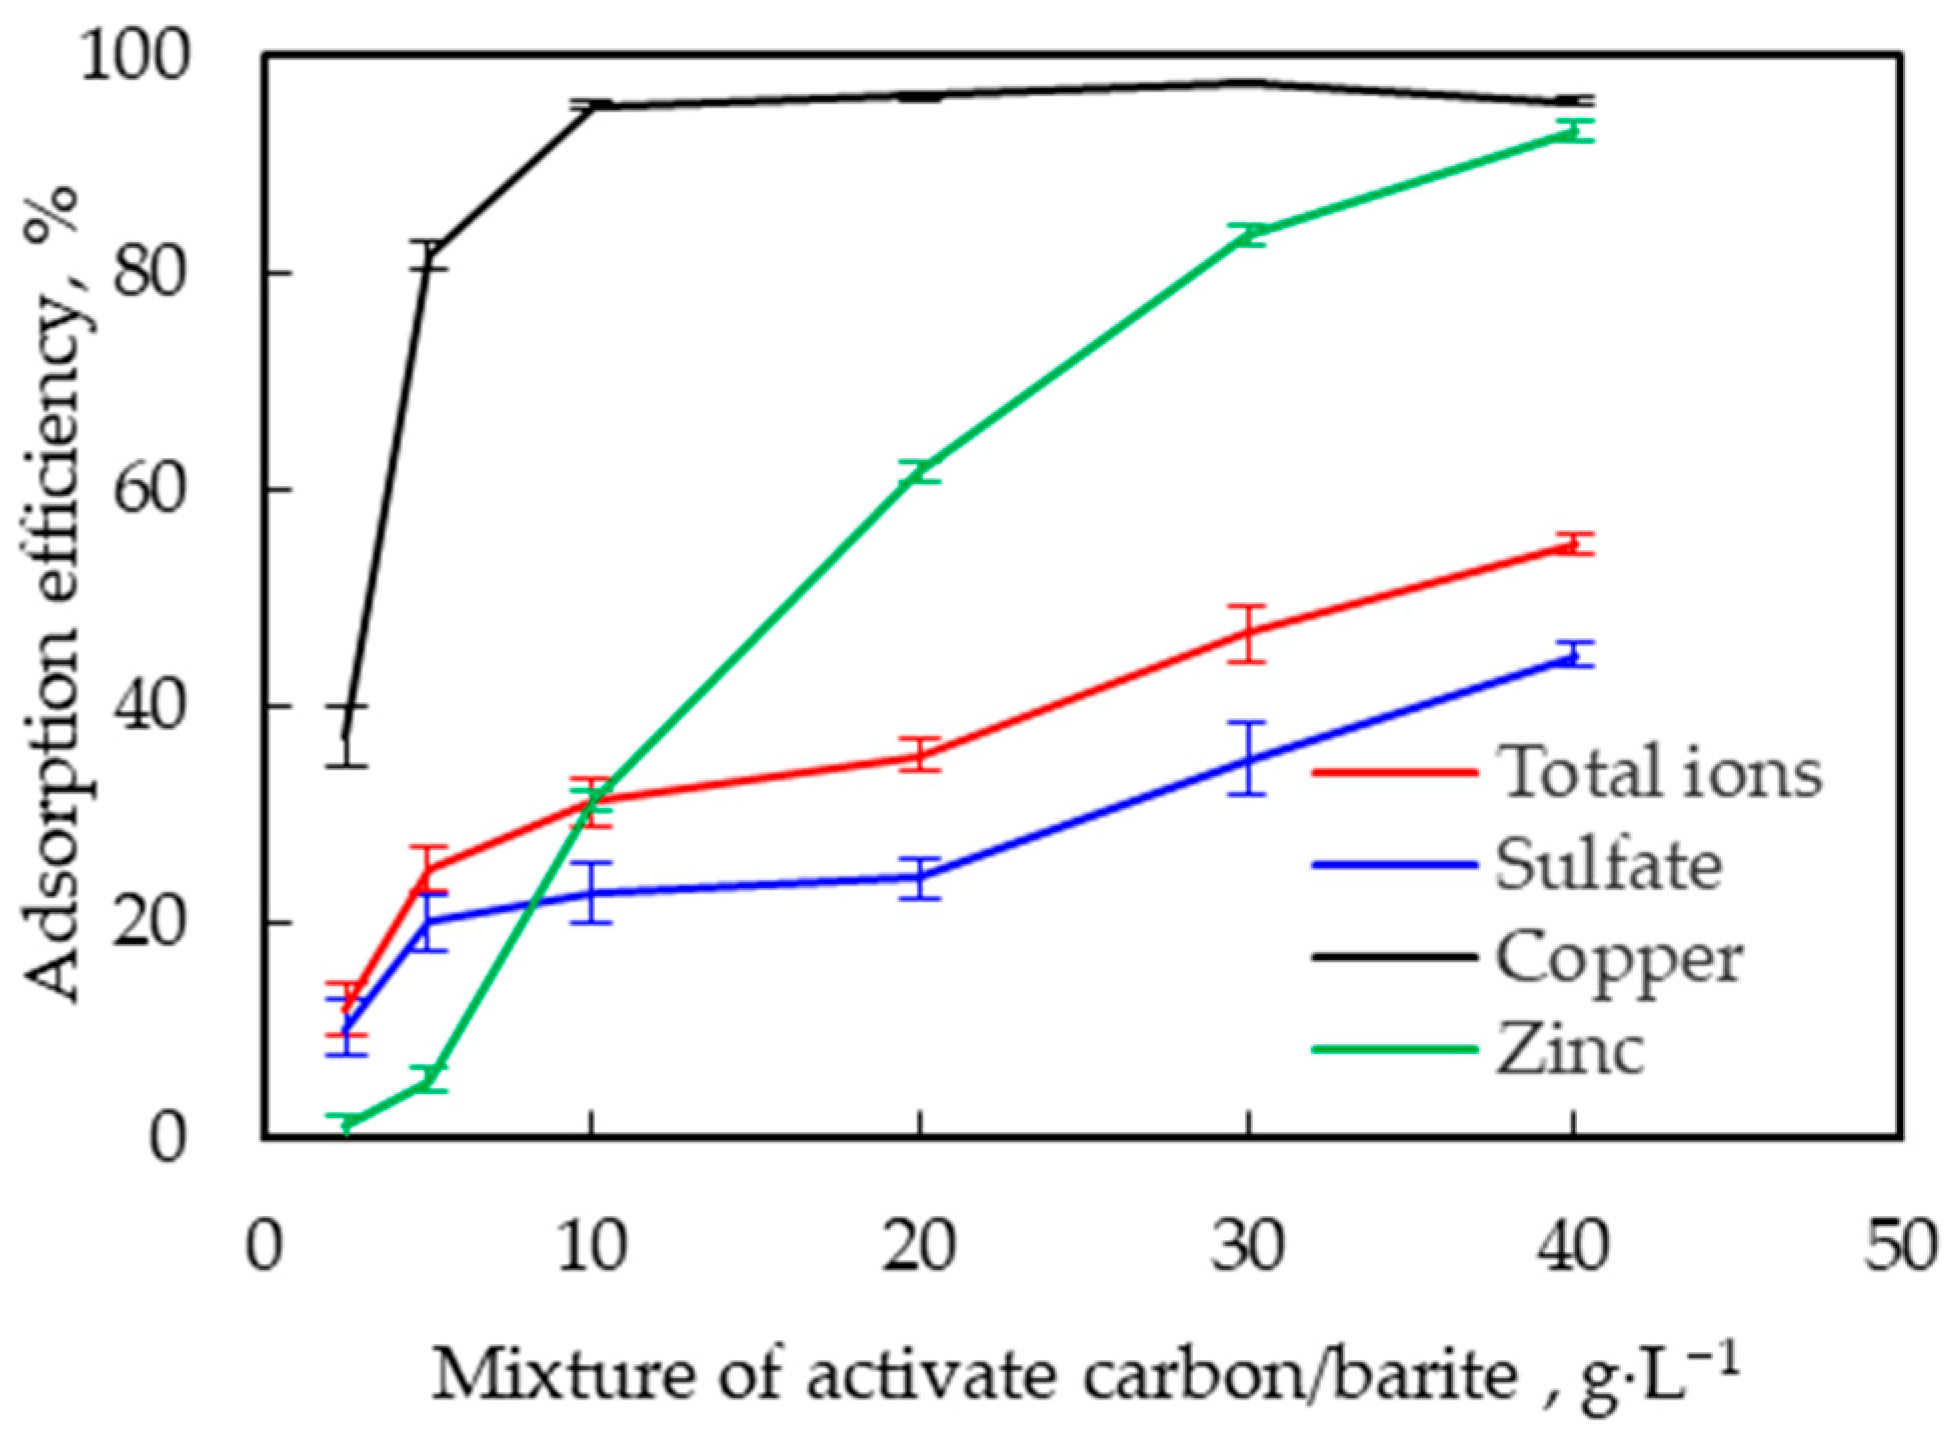
The effect of adsorbent particle concentration, shown in Figure 10, was evaluated at pH 3 and 25 °C. The total ion adsorption efficiency (red line) and the adsorption efficiency for individual ions, Cu2+ (black line), Zn2+ (green line), and S O 4 2 (blue line), were plotted in the figure.
Figure 10 shows that an increase in the concentration of adsorbent particles increases the adsorption efficiency of all the ions contained in the effluent. The adsorption of Cu2+ increases rapidly as the particle concentration increases, reaching a maximum of 97.5% when the adsorbent particle concentration is equal to 30 g·L−1. However, with a concentration of 40 g·L−1, it decreases slightly to 96.7%. The adsorption efficiency of Zn2+ increases more slowly than Cu2+ and does not stabilize on a flat plateau as the adsorbent particle concentration increases. When the adsorbent particle concentration is equal to 30 g·L−1, an adsorption efficiency of 83.5% is reached, and when it is equal to 40 g·L−1, the adsorption efficiency increases to 92.9%, suggesting that higher concentrations of adsorbent particles should increase their adsorption efficiency. A similar effect occurs for the adsorption of S O 4 2 ; the adsorption efficiency increases steadily as the concentration of adsorbent particles increases. However, the adsorption efficiency is lower than that for Cu2+ and Zn2+, reaching 46% with 40 g·L−1 of adsorbent particles. It is important to note that although the adsorption efficiency of S O 4 2 is lower, the adsorption capacity, expressed in mmol·g−1, is higher than the adsorption capacity for copper or zinc. When 40 g·L−1 adsorbent particles were used, the adsorption capacity for S O 4 2 was 0.005 mmol·g−1, and for Cu2+ and Zn2+, the adsorption capacity was 0.0012 mmol·g−1 and 0.0011 mmol·L−1, respectively. As expected, the total ion adsorption efficiency also increases progressively as the adsorbent particle concentration increases, reaching a maximum adsorption efficiency equal to 55 ± 2.6% when a concentration of adsorbent particles equal to 40 g·L−1 is used.
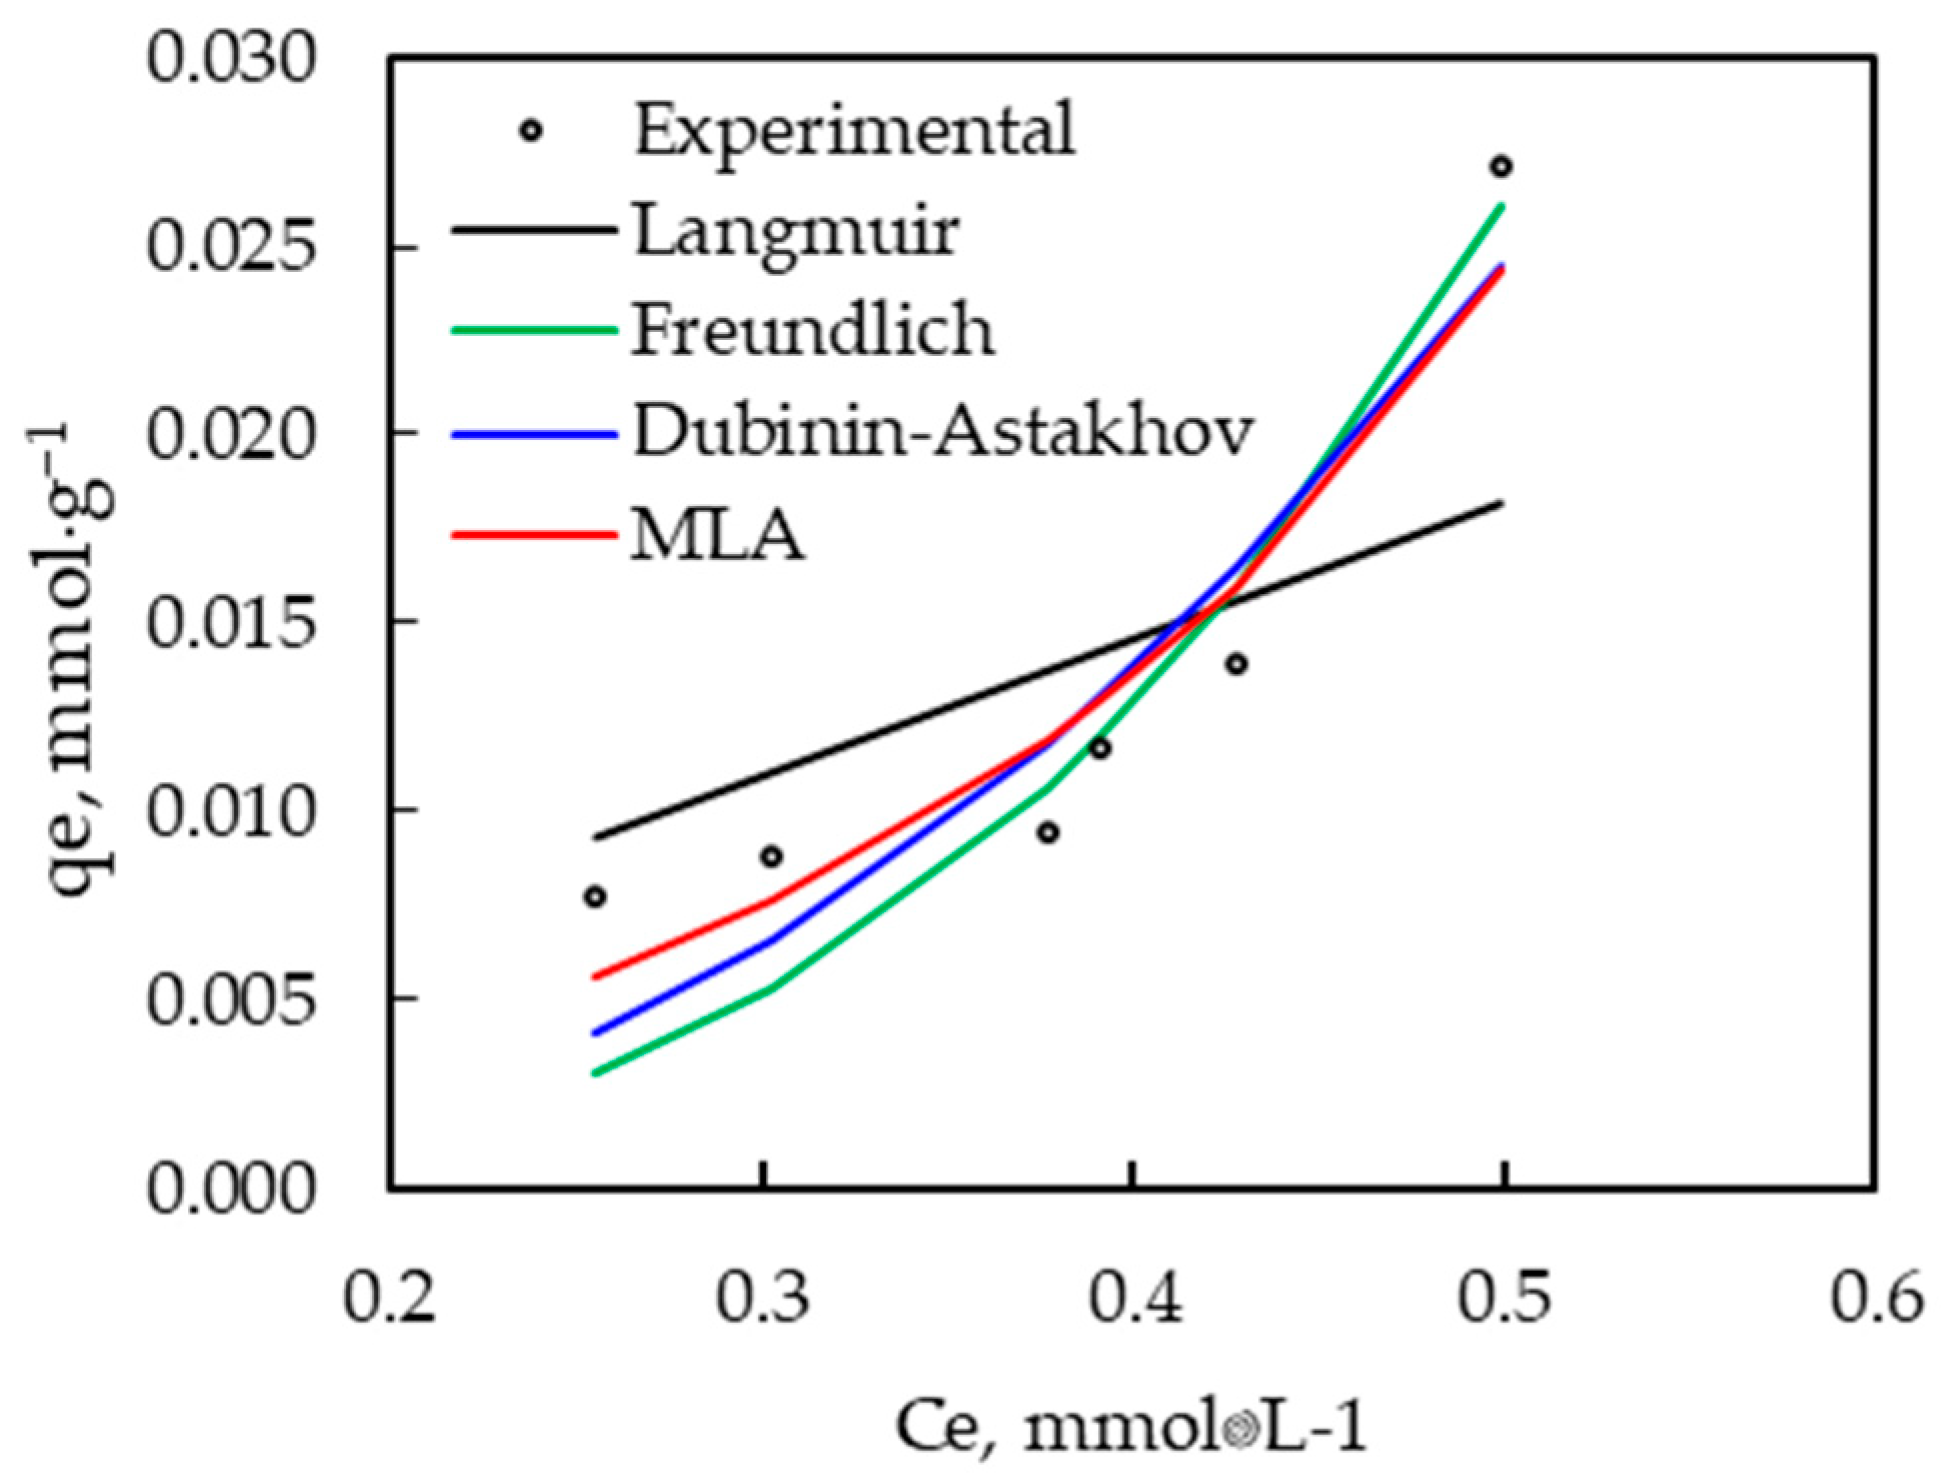
The results of the effect of the adsorbent particle concentration on the total ion adsorption were adjusted to the models proposed by Langmuir, Freundlich, Dubinin–Astakhov, and the Multilayer Adsorption model, considering that the adsorption isotherms allow predicting the adsorption capacity of the adsorbent material. The results are presented in Figure 11. The model constants of the adsorption isotherms, the correlation coefficient (R2), the standard error of the estimation (SEE), and the confidence interval for a significance level of 95% (CI) shown in Table 3 were determined using the Solver function and statistics of the Microsoft Excel spreadsheet.
Table 3 indicates that the Freundlich model fits better than the Langmuir model, which can be verified by comparing the correlation coefficients for both models, whose values are 0.856 and 0.556, respectively. This finding suggests that the simultaneous adsorption of ions onto the adsorbent particles was a heterogeneous adsorption and multilayer adsorption process, which again confirms the previous explanation regarding the effect of pH; that is, copper and zinc ions are adsorbed in a first layer on the surface active sites of the composite, exchanging for protons that are balanced by their negative surface charge. Subsequently, the sulfate anions are adsorbed on the cation layer through electrostatic interaction.
On the other hand, the values obtained for the parameters k1 and k2 of the Multilayer Adsorption Model, presented in Table 3, whose values are 0.003 L·mmol−1 and 1.0 L·mmol−1, respectively, allow ratifying that the adsorption of multiple ions on the adsorbent particles occurs in multilayers. According to El-Khaiary et al. [36], if the value of the parameter k2 of the second adsorption layer differs from zero, the adsorption process occurs effectively in multilayers. On the contrary, the adsorption energy value, E, determined with the Dubinin–Astakhov model, whose value is equal to 0.239 kJ·mol−1, indicates that the adsorption mechanism is physical. The value of E helps predict the adsorption mechanism. If the value is less than 8 kJ·mol−1, the adsorption is of a physical nature, whereas if the value is between 8 kJ·mol−1 and 16 kJ·mol−1, the adsorption is of a chemical nature. In this study, the value of E is less than 8 k·mol−1, which confirms that the adsorption mechanism is physical.
The adsorption capacity (KF, mmol·g−1) and adsorption intensity (n) determined using the Freundlich isotherm were compared with those reported for other activated carbon-based adsorbents used in the removal of Cu2+, Zn2+, and S O 4 2 , as shown in Table 4. The activated carbon/barite mixture had a specific surface area of 742.4 m2∙g−1 and a pore volume of 0.198 cm3·g−1, values intermediate between commercial activated carbons (≈768–1465 m2·g−1; 0.61–1.17 cm3·g−1) and modified biochar (≈21.8–51.0 m2·g−1; very low pore volumes, not reported) [37,38,39,40,41,42,43]. This relationship suggests an adequate textural structure that favors both surface adsorption and intraparticle diffusion, but with a lower contribution of macropores compared to high-porosity carbons [44]. Despite its smaller surface area compared to wood-based activated carbons, the activated carbon/barite mixture showed the highest total adsorption capacity (KF = 0.237 mmol∙g−1), demonstrating a positive synergy between the two phases. This synergy can be attributed to the complementarity between the carbon phase, rich in active sites and oxygenated functional groups, and the barite phase, which contributes to ion retention and possible surface coprecipitation of S O 4 2 ions. Although the low value of n = 0.315 indicates heterogeneous and partially unfavorable adsorption, it is likely influenced by competition among Cu2+, Zn2+, and S O 4 2 ions; the overall removal capacity was higher than that of the comparative materials. This confirms the high potential of the activated carbon/barite mixture for the simultaneous adsorption of cations and anions present in acidic effluents.

4. Conclusions

The results of this study confirm the following:
The mixture of activated carbon and barite is presented as a potential adsorbent for acid effluent treatment with heavy metals and oxyanions.
The adsorption efficiency depends on pH and adsorbent particle concentration: with increasing pH, the adsorption of Cu2+ and Zn2+ increases, while that of S O 4 2 decreases. As the particle concentration increases, the adsorption efficiency also increases. The maximum efficiency of simultaneous adsorption of ions, of 55 ± 2.6%, was achieved at pH 3 with an adsorbent particle concentration of 40 g·L−1.
The pseudo-1st-order kinetic model best represents the experimental data, suggesting that the limiting stage is external or internal diffusion and that the predominant adsorption mechanism is physisorption. Additionally, the analysis using the Weber–Morris model showed that adsorption is partially controlled by intraparticle diffusion. However, the low fit obtained indicates the involvement of additional mechanisms. The contribution of surface diffusion and rapid adsorption at external sites suggests multistep kinetic behavior, a characteristic of heterogeneous porous materials.
The Freundlich model provides the best fit, indicating a heterogeneous and multilayer adsorption process, probably a first layer of Cu2+ and Zn2+, and, on this first layer, the adsorption layer of S O 4 2 ions. The parameter values of the Multilayer Adsorption model confirm that adsorption occurs in multilayers, while the adsorption energy calculated with the Dubinin–Astakhov model confirms that the predominant mechanism is physisorption.
In summary, the activated carbon/barite mixture offers a balanced textural structure and compositional synergy that enhances the simultaneous adsorption of cationic and anionic species in acidic media, demonstrating high potential as an adsorbent for the treatment of effluents contaminated with multiple ions.

Author Contributions

Conceptualization, M.S.; methodology, M.S., D.G. and L.V.; software, H.A.; validation, M.S., D.G. and L.V.; formal analysis, H.A.; investigation, M.S. and H.A.; resources, M.S. and H.A.; data curation, M.S. and H.A.; writing—original draft preparation, M.S. and E.C.; writing—review and editing, M.S. and E.C.; visualization, M.S., H.A. and D.G.; project administration, M.S.; funding acquisition, M.S. All authors have read and agreed to the published version of the manuscript.

Funding

This research was funded by the Directorate of Research of the University of Atacama through the funding of the DIUDA-22343 research project.

Data Availability Statement

Data are contained within the article.

Acknowledgments

The authors also thank Bruno Zazzali for his support in the experimental development of this work. Hugo Aravena thanks the Universidad de Atacama for the postgraduate scholarship.

Conflicts of Interest

The authors declare no conflict of interest.

References

  1. Mashhadikhan, S.; Amooghin, A.; Sanaeepur, H.; Shirazi, M. A critical review on cadmium recovery from wastewater towards environmental sustainability. Desalination 2022, 535, 115815. [Google Scholar] [CrossRef]
  2. Feng, X.; Long, R.; Wang, L.; Liu, C.; Bai, Z.; Liu, X. A review on heavy metal ions adsorption from water by layered double hydroxide and its composites. Sep. Purif. Technol. 2022, 284, 120099. [Google Scholar] [CrossRef]
  3. Pooja, G.; Kumar, P.; Indraganti, S. Recent advancements in the removal/recovery of toxic metals from aquatic system using flotation techniques. Chemosphere 2022, 287, 132231. [Google Scholar] [CrossRef] [PubMed]
  4. McCarthy, T. The impact of acid mine drainage in South Africa. S. Afr. J. Sci. 2011, 107, 1–7. [Google Scholar] [CrossRef]
  5. Khorasanipour, M.; Moore, F.; Naseh, R. Lime Treatment of Mine Drainage at the Sarcheshmeh Porphyry Copper Mine, Iran. Mine Water Environ. 2011, 30, 216–230. [Google Scholar] [CrossRef]
  6. Fu, F.; Wang, Q. Removal of heavy metal ions from wastewaters: A review. J. Environ. Manag. 2011, 92, 407–418. [Google Scholar] [CrossRef]
  7. Özdemir, G.; Yapar, S. Adsorption and desorption behavior of copper ions on Na-montmorillonite: Effect of rhamnolipids and pH. J. Hazard. Mater. 2009, 166, 1307–1313. [Google Scholar] [CrossRef]
  8. Hu, M.; Wu, W.; Lin, D.; Yang, K. Adsorption of fulvic acid on mesopore-rich activated carbon with high surface area. Sci. Total Environ. 2022, 838, 155918. [Google Scholar] [CrossRef]
  9. Chen, J.; Hsu, K.; Chang, Y. Surface modification of hydrophobic resin with tricaprylmethylammonium chloride for the removal of trace hexavalent chromium. Ind. Eng. Chem. Res. 2013, 52, 11685–11694. [Google Scholar] [CrossRef]
  10. Mi, H.; Yi, L.; Wu, Q.; Xia, J.; Zhang, B. Preparation and optimization of a low-cost adsorbent for heavy metal ions from red mud using fraction factorial design and Box-Behnken response methodology. Colloids Surf. A Physicochem. Eng. Asp. 2021, 627, 127198. [Google Scholar] [CrossRef]
  11. Santander, M.; Valderrama, L. Dissolved Air Flotation of arsenic adsorbent particles. Ing. Investig. 2015, 35, 36–42. [Google Scholar] [CrossRef]
  12. Chaudhari, V.; Patkar, M. Removal of nickel from aqueous solution by using corncob as adsorbent. Mater. Today Proc. 2022, 61, 307–314. [Google Scholar] [CrossRef]
  13. Gupta, G.; Khan, J.; Singh, N. Application and efficacy of low-cost adsorbents for metal removal from contaminated water: A review. Mater. Today Proc. 2021, 43, 2958–2964. [Google Scholar] [CrossRef]
  14. Sadeghalvad, B.; Khorshidi, N.; Azadmehr, A.; Sillanpää, M. Sorption, mechanism, and behavior of sulfate on various adsorbents: A critical review. Chemosphere 2021, 263, 128064. [Google Scholar] [CrossRef]
  15. Mehta, D.; Mazumdar, S.; Singh, S. Magnetic adsorbents for the treatment of water/wastewate—A review. J. Water Process Eng. 2015, 7, 244–265. [Google Scholar] [CrossRef]
  16. Melliti, A.; Yılmaz, M.; Sillanpää, M.; Hamrouni, B.; Vurm, R. Low-cost date palm fiber activated carbon for effective and fast heavy metal adsorption from water: Characterization, equilibrium, and kinetics studies. Colloids Surf. A Physicochem. Eng. Asp. 2023, 672, 131775. [Google Scholar] [CrossRef]
  17. Ma, X.; Yang, S.; Tang, H.; Liu, Y.; Wang, H. Competitive adsorption of heavy metal ions on carbon nanotubes and the desorption in simulated biofluids. J. Colloid Interface Sci. 2015, 448, 347–355. [Google Scholar] [CrossRef]
  18. Hong, S.; Cannon, F.; Hou, P.; Byrne, T.; Nieto-Delgado, C. Adsorptive removal of sulfate from acid mine drainage by polypyrrole modified activated carbons: Effects of polypyrrole deposition protocols and activated carbon source. Chemosphere 2017, 184, 429–437. [Google Scholar] [CrossRef]
  19. Yang, X.; Wan, Y.; Zheng, Y.; He, F.; Yu, Z.; Huang, J.; Wang, H.; Ok, Y.S.; Jiang, Y.; Gao, B. Surface functional groups of carbon-based adsorbents and their roles in the removal of heavy metals from aqueous solutions: A critical review. Chem. Eng. J. 2019, 366, 608–621. [Google Scholar] [CrossRef]
  20. Hong, S.; Cannon, F.; Hou, P.; Byrne, T.; Nieto-Delgado, C. Sulfate removal from acid mine drainage using polypyrrole-grafted granular activated carbon. Carbon 2014, 73, 51–60. [Google Scholar] [CrossRef]
  21. Aravena, H. Remoción de Iones Cobre, Zinc y Sulfato Mediante Flotación por Partícula Adsorbente Utilizando un Composite de Carbón Activado/Baritina Generado Mediante Molienda. Master’s Thesis, University of Atacama, Copiapó, Chile, 2024. [Google Scholar]
  22. Ho, Y.; Mckay, G. Kinetics of pollutant sorption by bio sorbents: A Review. Sep. Purif. Methods 2000, 29, 189–232. [Google Scholar] [CrossRef]
  23. An, B. Cu (II) and As (V) Adsorption Kinetic Characteristic of the Multifunctional Amino Groups in Chitosan. Processes 2020, 8, 1194. [Google Scholar] [CrossRef]
  24. Foo, K.; Hameed, B. Insights into the modeling of adsorption isotherm systems. Chem. Eng. J. 2010, 156, 2–10. [Google Scholar] [CrossRef]
  25. Yan, B.; Niu, C.H. Adsorption behavior of norfloxacin and site energy distribution based on the Dubinin-Astakhov isotherm. Sci. Total Environ. 2018, 631, 1525–1533. [Google Scholar] [CrossRef] [PubMed]
  26. El-Khaiary, M.I. Least-squares regression of adsorption equilibrium data: Comparing the options. J. Hazard. Mater. 2008, 158, 73–87. [Google Scholar] [CrossRef]
  27. Kavand, M.; Eslami, P.; Razeh, L. The adsorption of cadmium and lead ions from the synthesis wastewater with the activated carbon: Optimization of the single and binary Systems. J. Water Process Eng. 2020, 34, 101151. [Google Scholar] [CrossRef]
  28. Weng, C.H.; Tsai, C.Z.; Chu, S.H.; Sharma, Y.C. Adsorption characteristics of copper (II) onto spent activated clay. Sep. Purif. Technol. 2007, 54, 187–197. [Google Scholar] [CrossRef]
  29. Oliva, A.; Martín-Varguez, P.; González-Panzo, I.; González-Chan, I. Papel del diagrama de distribución de especies en el depósito de capas delgadas semiconductoras por baño químico. Rev. Mex. Ing. Quim. 2016, 15, 209–220. [Google Scholar]
  30. Yuan, J.; Ding, Z.; Bi, Y.; Li, J.; Wen, S.; Bai, S. Resource Utilization of Acid Mine Drainage (AMD): A Review. Water 2022, 14, 2385. [Google Scholar] [CrossRef]
  31. Wang, J.; Guo, X. Adsorption kinetic models: Physical meanings, applications, and solving methods. J. Hazard. Mater. 2020, 390, 122156. [Google Scholar] [CrossRef]
  32. Agbovi, H.K.; Wilson, L.D. Adsorption Processes in Biopolymer Systems: Fundamentals to Practical Applications. In Natural Polymers-Based Green Adsorbents for Water Treatment; Elsevier: Amsterdam, The Netherlands, 2021; pp. 1–51. [Google Scholar] [CrossRef]
  33. Andelescu, A.; Nistor, M.A.; Muntean, S.G.; Rădulescu-Grad, M.E. Adsorption Studies on Copper, Cadmium, and Zinc Ion Removal from Aqueous Solution Using Magnetite/Carbon Nanocomposites. Sep. Sci. Technol. 2018, 53, 2352–2364. [Google Scholar] [CrossRef]
  34. Nasser, S.M.; Abbas, M.; Trari, M. Understanding the Rate-Limiting Step Adsorption Kinetics onto Biomaterials for Mechanism Adsorption Control. Prog. React. Kinet. Mech. 2024, 49, 6858. [Google Scholar] [CrossRef]
  35. Hasani, N.; Selimi, T.; Mele, A.; Thaçi, V.; Halili, J.; Berisha, A.; Sadiku, M. Theoretical, Equilibrium, Kinetics and Thermodynamic Investigations of Methylene Blue Adsorption onto Lignite Coal. Molecules 2022, 27, 1856. [Google Scholar] [CrossRef] [PubMed]
  36. El-Khaiary, M.I.; Malash, G.F.; Ho, Y.S. On the use of linearized pseudo-second-order kinetic equations for modeling adsorption systems. Desalination 2010, 257, 93–101. [Google Scholar] [CrossRef]
  37. Chen, W.-S.; Chen, Y.-C.; Lee, C.-H. Modified Activated Carbon for Copper Ion Removal from Aqueous Solution. Processes 2022, 10, 150. [Google Scholar] [CrossRef]
  38. Demiral, H.; Güngör, C. Adsorption of Copper(II) from Aqueous Solutions on Activated Carbon Prepared from Grape Bagasse. J. Clean. Prod. 2016, 124, 103–113. [Google Scholar] [CrossRef]
  39. Tuomikoski, S.; Tanskanen, J.; Runtti, H.; Kangas, T.; Romar, H.; Lassi, U. Zinc Adsorption by Activated Carbon from Waste Fishing Nets. Appl. Sci. 2019, 9, 4583. [Google Scholar] [CrossRef]
  40. Leyva-Ramos, R.; Bernal-Jacome, L.A.; Mendoza-Barron, J.; Fuentes-Rubio, L.; Guerrero-Coronado, R.M. Adsorption of Zinc (II) from an Aqueous Solution onto Activated Carbon. J. Hazard. Mater. 2002, 90, 27–38. [Google Scholar] [CrossRef]
  41. Tejada-Tovar, C.; Villabona-Ortíz, Á.; Gonzalez-Delgado, A.D.; Herrera, A.; Viera De la Voz, A. Efficient Sulfate Adsorption on Modified Adsorbents Prepared from Zea mays Stems. Appl. Sci. 2021, 11, 1596. [Google Scholar] [CrossRef]
  42. Ao, H.; Cao, W.; Hong, Y.; Wu, J.; Wei, L. Adsorption of Sulfate Ion from Water by Zirconium Oxide-Modified Biochar Derived from Pomelo Peel. Sci. Total Environ. 2020, 708, 135092. [Google Scholar] [CrossRef]
  43. Rahmati, M.; Yeganeh, G.; Esmaeili, H. Sulfate Ion Removal from Water Using Activated Carbon Powder Prepared by Ziziphus spina-christi Lotus Leaf. Acta Chim. Slov. 2019, 66, 888–898. [Google Scholar] [CrossRef]
  44. Hsieh, C.-T.; Teng, H. Influence of mesopore volume and adsorbate size on adsorption capacities of activated carbons in aqueous solutions. Carbon 2000, 38, 863–869. [Google Scholar] [CrossRef]
Figure 1. Particle size distribution of adsorbent particles.
Minerals 15 01214 g001
Figure 2. SEM image of adsorbent particles (the green circle corresponds to a barite particle and the red circle corresponds to an activated carbon particle.
Minerals 15 01214 g002
Figure 3. XRD pattern of adsorbent particles.
Minerals 15 01214 g003
Figure 4. Z-Potential of adsorbent particles.
Minerals 15 01214 g004
Figure 5. Effect of pH on adsorption efficiency using 20 g·L−1 of adsorbent particles, at 25 °C, a contact time of 180 min, and initial concentrations of 0.0788 mmol·L−1 of Cu2+, 0.0765 mmol·L−1 of Zn2+, and 0.525 mmol·L−1 of S O 4 2 .
Minerals 15 01214 g005
Figure 6. Distribution of Cu2+ and Zn2+ species as a function of pH.
Minerals 15 01214 g006
Figure 7. Effect of contact time on the adsorption of Cu2+, Zn2+ and S O 4 2 ions, single and total ions at pH, 3 using 5 g·L−1 of adsorbent particles, at 25 °C, a contact time of 180 min, and initial concentrations of 0.0791 mmol·L−1 of Cu2+, 0.0798 mmol·L−1 of Zn2+, and 0.652 mmol·L−1 of S O 4 2 .
Minerals 15 01214 g007
Figure 8. Effect of contact time on the final concentration and total ion adsorption efficiency at pH 3, using 5 g·L−1 of adsorbent particles, at 25 °C, a contact time of 180 min, and initial concentrations of 0.0791 mmol·L−1 of Cu2+, 0.0798 mmol·L−1 of Zn2+, and 0.652 mmol·L−1 of S O 4 2 .
Minerals 15 01214 g008
Figure 9. Fitted of the contact time effect to the pseudo-1st- and 2nd-order kinetic models at pH 3, using 5 g·L−1 of adsorbent particles, at 25 °C, a contact time of 180 min, and initial concentrations of 0.0791 mmol·L−1 of Cu2+, 0.0798 mmol·L−1 of Zn2+, and 0. 0.652 mmol·L−1 of S O 4 2 .
Minerals 15 01214 g009
Figure 10. Effect of adsorbent particle concentration on adsorption efficiency at pH 3, at 25 °C, a contact time of 1440 min, and initial concentrations of 0.058 mmol·L−1 of Cu2+, 0.060 mmol·L−1 of Zn2+, and 0.0.448 mmol·L−1 of S O 4 2 .
Minerals 15 01214 g010
Figure 11. Fit of the adsorbent particle concentration effect to the adsorption model at pH 3, at 25 °C, a contact time of 1440 min, and initial concentrations of 0.058 mmol·L−1 of Cu2+, 0.060 mmol·L−1 of Zn2+, and 0.0.448 mmol·L−1 of S O 4 2 .
Minerals 15 01214 g011
Table 1. Kinetic and statistical parameters of the pseudo-1st- and 2nd-order models for total ion adsorption.
Pseudo-1st-Order Kinetic Model
qe, mmol·g−1k1, min−1R2ICSEE
0.04260.0170.9950.0020.037
Pseudo-2nd-order kinetic model
qe, mmol·g−1k2, g·mmol−1·min−1R2ICSEE
0.04630.5790.9590.0050.002
Table 2. Kinetic and statistical parameters of the intraparticle diffusion kinetic model for total ion adsorption.
Intraparticle Diffusion Kinetic Model
ki, mmol·g−1·min0.5C, mmol·g−1R2ICSEE
0.00620.02540.4830.0180.007
Table 3. Comparison of adsorption model constants and statistical parameters.
LangmuirValueFreundlichValue
Qmax, mmol·g−13.262KF, mmol·g−10.237
kL, L·mmol−10.011n, adimensional0.315
R20.556R20.856
SEE0.005SEE0.003
IC0.013IC0.007
Dubinin–AstakhovValueMultilayer adsorptionValue
q0, mmol·g−14.541Γ, mmol·g−14.459
ηD, adimensional0.792k1, L·mmol−10.003
E, kJ·mol−10.239k2, L·mmol−11.000
R20.848R20.842
SEE0.003SEE0.003
IC0.011IC0.007
Table 4. Adsorption capacity and intensity, as well as the Freundlich isotherm, for various activated carbon-based adsorbents.
AdsorbentBET
Specific Surface Area, m2·g−1
Pore Volume, cm3·g−1IonsKF, mmol·g−1nReference
Activated carbon
(waste wood-based)
1464.01.173Cu2+0.16334.76[37]
Activated carbon
(grape bagasse)
1465.00.660Cu2+0.08922.03[38]
Activated carbon
(biomass-based)
860.00.610Zn2+0.13005.88[39]
Activated carbon (commercial)768.0NRZn2+0.03095.47[40]
Biochar
(modified H2SO4)
NRNR S O 4 2 0.00230.96[41]
Biochar
(modified ZrO2)
21.8NR S O 4 2 0.08840.28[42]
Activated carbon
(Leaves of Ziziphus spina-christi)
51.0NR S O 4 2 0.02080.61[43]
NR = Not reported.
Disclaimer/Publisher’s Note: The statements, opinions and data contained in all publications are solely those of the individual author(s) and contributor(s) and not of MDPI and/or the editor(s). MDPI and/or the editor(s) disclaim responsibility for any injury to people or property resulting from any ideas, methods, instructions or products referred to in the content.