Article

Waste Quartz Crucible Crystallization-Induced Purification to Prepare High-Purity Cristobalite Sand

1
Key Laboratory of Solid Waste Treatment and Resource Recycle of Ministry of Education, Southwest University of Science and Technology, Mianyang 621010, China
2
Institute of Mineral Materials and Applications, Southwest University of Science and Technology, Mianyang 621010, China
3
Henan Institute of Ultrapure Mineral Materials, Zhengzhou 450016, China
*
Author to whom correspondence should be addressed.
Minerals 2025, 15(11), 1184; https://doi.org/10.3390/min15111184
Submission received: 15 October 2025 / Revised: 2 November 2025 / Accepted: 7 November 2025 / Published: 10 November 2025
(This article belongs to the Special Issue Mineralogical Characteristics and Purification Process of Quartz)

Abstract

Waste quartz crucibles (WQCs), produced as by-products in the fabrication of monocrystalline silicon rods, have become a significant recycling target due to the rapid growth of the photovoltaic industry. WQCs serve as an excellent precursor for synthesizing high-purity cristobalite sand, with an SiO2 content exceeding 99.995%. This study introduces a novel approach that integrates high-temperature crystallization-induced purification with acid leaching to convert WQCs into cristobalite. We systematically investigated the effects of calcination parameters (temperature and time) on cristobalite formation and characterized the distribution of aluminum and titanium (Al/Ti) in pre- and post-crystallization samples using depth profiling techniques. The results indicate that WQCs can be completely transformed into cristobalite after calcination at 1600 °C for 6 h. Employing these optimized conditions (1600 °C for 6 h) not only achieves a rapid crystallization rate but also effectively drives the migration of Al and Ti impurities to the surface and crack regions of the cristobalite matrix. The crystallization process enhances the purification of WQCs by redistributing impurities during the phase transformation. Consequently, the resulting cristobalite sand achieves an SiO2 content exceeding 99.998% after acid leaching. Therefore, this work offers a dual solution to both enhancing the value of WQCs and mitigating the scarcity of high-purity quartz sand raw materials.

1. Introduction

The energy consumption mode is enduring a rapid transformation in the context of the global energy crisis, environmental crisis, and pursuit of dual-carbon goals. Solar energy, which is one of the most advantageous renewable energy sources, is initiating a new phase of development [1]. Presently, the global photovoltaic market is dominated by monocrystalline photovoltaic cells with a high conversion rate and high stability, accounting for approximately 92% of the market share [2,3]. In recent years, there has been a considerable increase in demand for monocrystalline silicon cells, resulting in a significant tightening of the supply of raw materials for production. This has given rise to an urgent need for the effective management of the waste generated during the production process. The quartz crucible represents the most stringent technical criterion for high-purity quartz. The photovoltaic quartz crucible is fabricated from quartz sand with an SiO2 content exceeding 99.998%, exhibiting attributes of exceptional purity, excellent thermal stability, and a minimal thermal expansion coefficient. It serves as an essential vessel in the production of monocrystalline silicon through the Czochralski method [2,4]. The quartz crucible will be discarded after a certain period of time because of bubble expansion and softening, and the collapse of the crucible body, leading to rupture in the process [5]. Upon annealing to 275 °C, the surface cristobalite layer undergoes a phase transition; the associated volumetric change induces cracking that propagates into the molten layer, resulting in crucible failure [6,7].
Waste quartz crucibles (WQCs) are predominantly composed of quartz glass, an amorphous solid comprising disordered silica–oxygen tetrahedra [8]. Unlike crystalline materials, these amorphous solids lack a distinct melting point, potentially leading to issues such as non-uniform melting during reuse and remolding. Cristobalite offers superior structural, optical, and morphological stability, making it ideal for high-end fields such as aerospace [9]. Currently, the research on quartz glass crystallization at elevated temperatures mostly focuses on the impact of material properties (e.g., purity, particle size) and crystallization circumstances on the process. As the crystallization temperature exceeds 1200 °C, there is a substantial increase in the content of cristobalite [10]. Furthermore, an increase in calcination time results in an increase in cristobalite content [11]. The addition of nucleating agents has been demonstrated to promote the formation of cristobalite in quartz glass [12]. However, two critical aspects remain poorly understood: the migration behavior of impurity ions (e.g., Al, Ti) during crystallization and, more importantly, the properties of the final cristobalite product. This lack of performance evaluation severely hinders the assessment of its practical application value.
High-purity quartz serves as a crucial fundamental raw material for vital growing industries, including photovoltaic, electronic information, aerospace, and semiconductors, with its application efficiency closely linked to its purity metrics. In high-end applications, the SiO2 content of high-purity quartz sand must be strictly controlled above 99.998%, and its market price exhibits exponential growth with increasing purity [13]. Currently, global high-quality quartz resources are depleted, with the high-purity quartz deposits predominantly controlled by the U.S.’s Sibelco and Norway’s The Quartz Corp. Such high-purity quartz sand materials are primarily used in preparing quartz crucibles for the Czochralski method of monocrystalline silicon production [14]. To address the industry’s pain point of insufficient supply of the high-purity quartz products, the scientific community has conducted systematic research across dimensions, including geological exploration technology innovation, optimal selection of raw material sources, and breakthroughs in purification and processing techniques [15,16,17]. The current research framework in resource recycling, specifically for high-purity quartz products post-service cycle, lacks sufficient exploration of the regeneration process to convert them into reusable high-purity quartz sand raw materials and has yet to establish a comprehensive closed-loop resource utilization technology system.
Inspired by the geological concept of “crystallization-induced purification”—a process that separates pure minerals from a melt [18,19]—this study investigates the phase transformation of quartz glass in waste quartz crucibles (WQCs) into high-purity cristobalite. By systematically investigating calcination parameters (time and temperature) for cristobalite formation and characterizing the distribution of Al/Ti impurities via depth profiling, high-purity cristobalite sand was subsequently obtained via acid leaching. This work offers a dual solution to both enhancing the value of WQCs and mitigating the scarcity of high-purity quartz sand raw materials.

2. Material and Experiment

2.1. Material and Pretreatment

Raw waste quartz crucibles (WQCs) were obtained from a Czochralski monocrystalline silicon rod manufacturing plant. Figure 1 illustrates the macroscopic morphology and phase composition of the as-received WQCs material. The crucible wall exhibits a distinct tri-layer structure with a total thickness ranging from 10 to 18 mm, comprising an outer crystalline layer (OC), a middle quartz glass layer (MG), and an inner crystalline layer (IC). XRD analysis (Figure 1b) confirmed that both crystalline layers (OC and IC) consist exclusively of cristobalite. The thickness of each crystalline layer was consistently measured to be below 2 mm (Figure 1a). Elemental impurity analysis of each layer is presented in Table 1. Notably, the MG layer exhibits higher purity than the OC and IC layers. This disparity is attributed to the contamination of the crystalline layers during service, as they were directly exposed to the molten silicon charge and the furnace environment.
Given its significantly higher purity (Table 1) and dominant mass fraction within the WQCs, the middle quartz glass layer (MG) was selected as the primary feedstock for cristobalite synthesis. Separation of the distinct layers (OC, MG, IC) was achieved through a thermal shock treatment involving controlled calcination followed by water quenching. This method exploits the pronounced mismatch in thermal expansion behavior between the phases: amorphous quartz glass exhibits negligible thermal expansion (4.9 × 10⁻⁷ K−1 to 5.5 × 10⁻⁷ K−1), while cristobalite undergoes an abrupt ~5% volume change during its α-β phase transition near 270 °C [5]. Controlled calcination at 300 °C for 30 min induces this phase transition in the crystalline layers (OC, IC), generating significant interfacial stresses with the adjacent MG layer due to the differential strain. Subsequent water quenching exacerbates these stresses, leading to extensive microcracking and effective delamination at the cristobalite–glass interfaces. This process enabled the recovery of the purified MG fraction with a high yield exceeding 80%. The separated MG fraction was then mechanically processed by crushing, grinding, and sieving to obtain a particle size fraction of 70–150 mesh (106–212 μm), hereafter designated as the MG70–150 feedstock for crystallization experiments.

2.2. Crystallization and Impurity Distribution Analysis

The MG70–150 raw material was loaded into a high-purity cristobalite crucible to prevent exogenous contamination and was subjected to calcination in a high-temperature furnace under an ambient atmosphere. Samples were heated to target temperatures ranging from 1300 to 1600 °C at a rate of 10 °C min−1, held for 6 to 8 h, and then allowed to furnace-cool to room temperature. To investigate the behavior and distribution of impurities during the phase transformation, samples were calcined at the optimal temperature of 1600 °C for extended durations ranging from 6 to 24 h. The crystallographic evolution of the resulting specimens, including the 6 h sample (designated MG-C), was analyzed by X-ray diffraction (XRD) with Rietveld refinement to quantify phase purity and determine unit cell parameters.

2.3. Acid Leaching for Impurity Removal Assessment

The distribution of key impurity elements (Al, Ti) in the amorphous precursor (MG70–150) and the crystallized product (MG-C) was characterized by controlled acid leaching.
HF Leaching Procedure: Samples (5.0000 g) were treated with hydrofluoric acid solutions (concentrations ranging from 2 to 10 mol L−1 in 2 mol L−1 increments) at a solid-to-liquid ratio of 1:5 (w/v). The leaching was conducted at 90 °C for 4 h under reflux. Subsequently, the leached solids were washed with deionized water, vacuum-filtered, dried at 110 °C, and weighed for subsequent analysis.
Mixed-Acid Leaching Procedure: To evaluate the efficacy of purification before and after crystallization, a comparative leaching was performed using a mixed-acid solution (0.5 mol L−1 HF + 1.0 mol L−1 HNO3) at a solid-to-liquid ratio of 1:3 (w/v). This process was also carried out at 90 °C for 4 h. The post-leaching solids were similarly washed, filtered, dried, weighed, and then prepared for compositional and microstructural analysis.

2.4. Analytical Characterization Phase

Phase identification was performed by X-ray diffraction (XRD) using an Empyrean diffractometer (PANalytical, Almelo, The Netherlands ) with Cu-Kα radiation. Data were collected over a 2θ range of 3–80° with a step size of 0.02°. Phase quantification was conducted via Rietveld refinement using the HighScore Plus (4. x) software. The quantification of cristobalite content was calibrated using a synthetic, pure cristobalite standard, which was prepared by grinding quartz glass and calcining it at 1600 °C for 24 h in air [20]. Calibration curves (Figure 2) correlating phase composition with XRD intensity were generated using mixtures of cristobalite and quartz glass in varying proportions [21]. The quantitative analysis was based on the intensity of the strongest diffraction peak (d101 = 4.041 Å).
Elemental analysis was performed using two complementary techniques. Bulk impurity concentrations were quantified by inductively coupled plasma optical emission spectrometry (ICP-OES) on an iCAP 7400 instrument (Thermo Scientific, Waltham, MA, USA). Ultra-trace elements were analyzed by inductively coupled plasma mass spectrometry (ICP-MS) using a NexION 300X system (PerkinElmer, Waltham, MA, USA) operated in He/KED mode.
Microstructural characterization was performed to examine the surface morphology and crack distribution using polarized light microscopy (PLM) with a BK-POL microscope (OPTEC, Chongqing, China) in reflected light mode.

3. Results and Discussion

3.1. Effect of Calcination Temperature on Crystallization

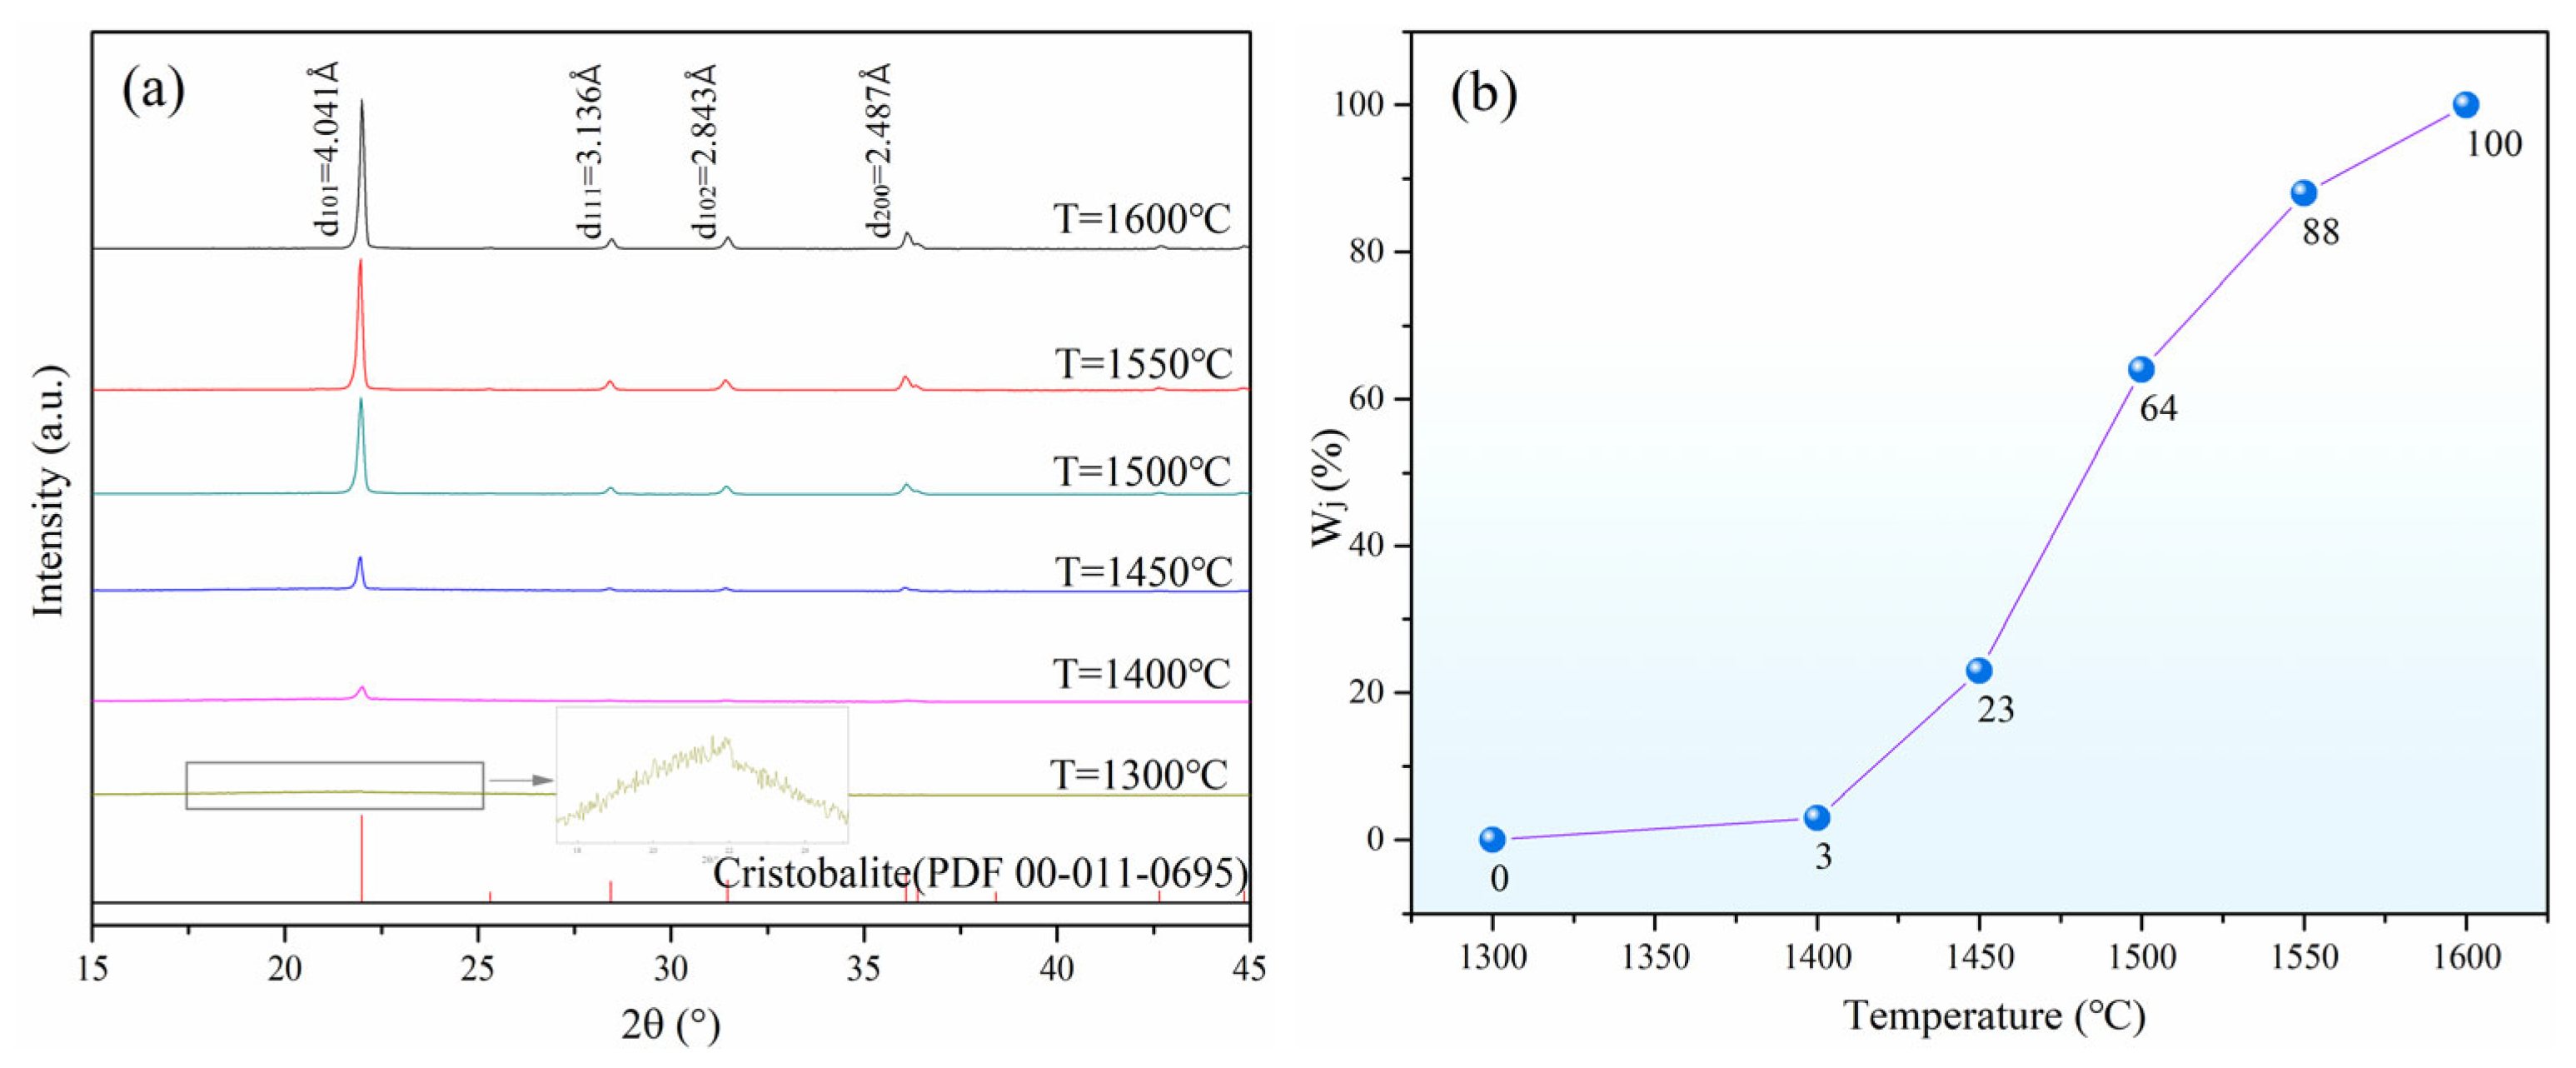
Figure 3a shows the XRD pattern of MG70–150 after calcination at temperatures ranging from 1300 to 1600 °C for 6 h. Cristobalite content was quantified using the integrated area of the (101) peak (d = 4.041 Å) referenced against the calibration curve in Figure 2. The results, plotted in Figure 3b, reveal distinct stages of crystallization.
As shown in Figure 3a, samples calcined at 1300 °C exhibited only broad amorphous halos in their XRD patterns, indicating no detectable cristobalite formation. When the calcination temperature was increased to 1400 °C, the characteristic cristobalite diffraction peak (d101 = 4.041 Å) appeared and gradually intensified. Upon further increasing the temperature to 1450 °C, a series of characteristic cristobalite diffraction peaks, corresponding to d111 = 4.041 Å, d102 = 2.843 Å, and d200 = 2.487 Å, were observed. These results confirm that the crystal development process was strongly temperature-dependent. The experimental data establish that the calcination temperature is the key factor governing cristobalite crystallization kinetics, with the crystallization rate generally increasing with temperature [18].
Figure 3b quantitatively reveals the temperature-dependent behavior of the phase transformation process: cristobalite nucleation initiates at 1400 °C with a content of approximately 3 wt%. Within the temperature range of 1400–1500 °C, the cristobalite content increases nonlinearly, initially accelerating and then decelerating. Above 1500 °C, the crystallization rate decreases markedly, which is likely due to thermodynamic equilibrium limitations at high temperatures. Consequently, 1600 °C was selected as the optimal calcination temperature for subsequent experiments.

3.2. Effect of Calcination Time on Crystallization

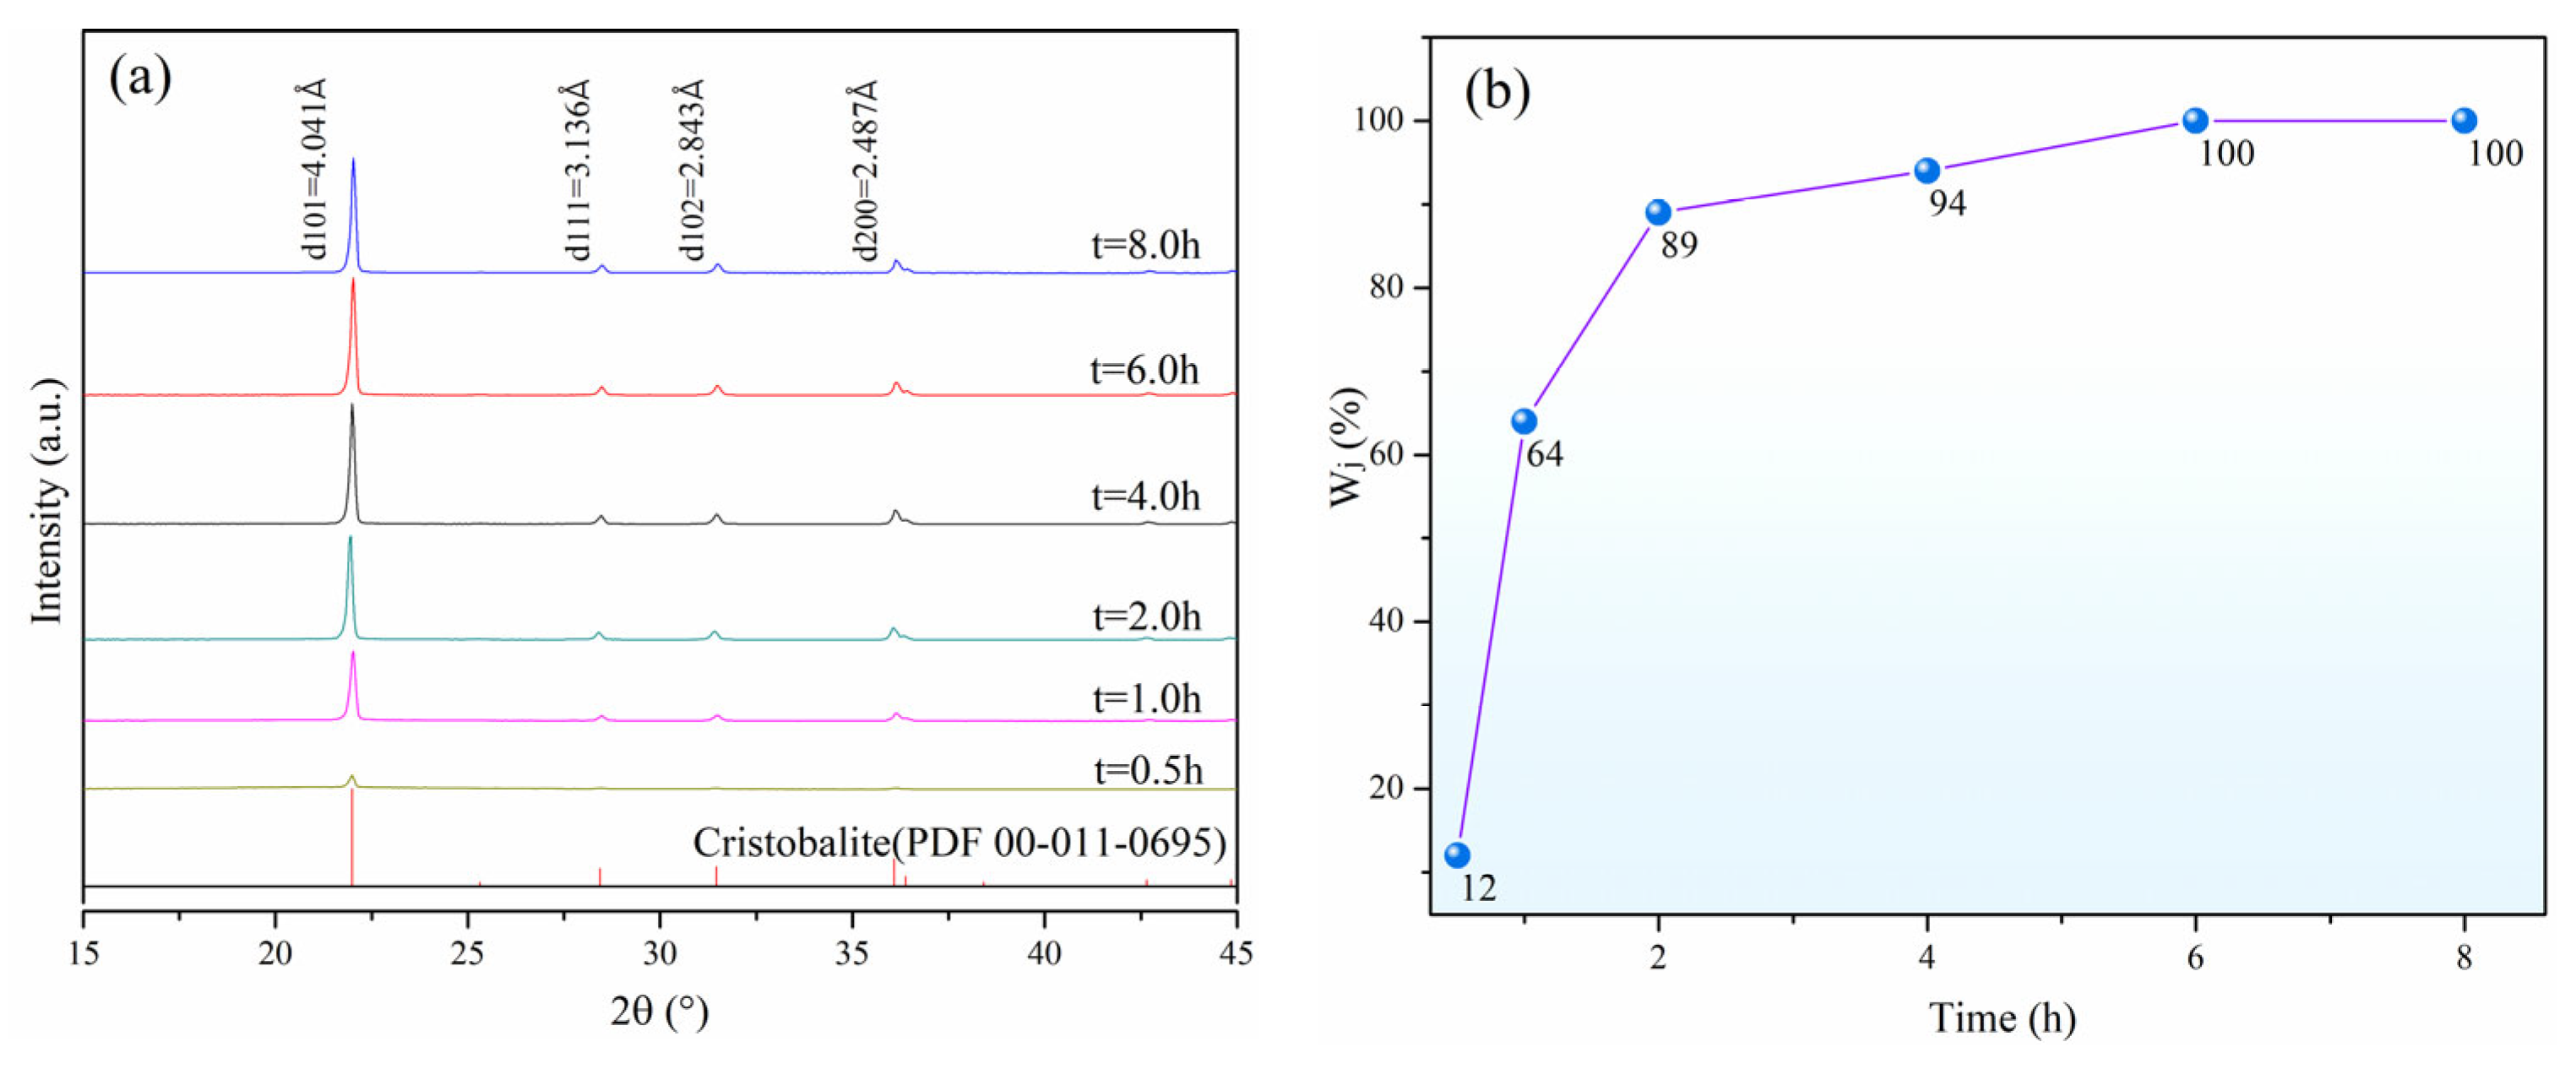
Figure 4a shows the XRD patterns of the MG70–150 after calcination at 1600 °C for varying durations (0 to 24 h). The cristobalite content was quantified through Rietveld refinement of the dominant (101) peak (2θ ≈ 21.9°, d101 = 4.041 Å), based on the calibration curve established in Figure 2. The crystallization kinetics, as plotted in Figure 4b, reveal three distinct stages.
XRD analysis of MG70–150 samples calcined at 1600 °C reveals a three-stage crystallization process (Figure 4). During the initial nucleation phase (0–0.5 h), cristobalite content remains below 64 wt% as evidenced by weak characteristic peaks (d101 = 4.041 Å, d111 = 3.136 Å, d102 = 2.843 Å, and d200 = 2.487 Å), indicating nucleation-limited kinetics. The system then enters a rapid growth phase (0.5–1 h) where peak intensities increase non-monotonically, reaching maximum enhancement rates at 0.5–1.0 h as the quartz glass phase undergoes sharp depletion. The system then enters a rapid growth phase (0.5–6 h) where peak intensities increase non-monotonically, reaching maximum enhancement rates at 0.5–1.0 h as the quartz glass phase undergoes sharp depletion [22]. Beyond 4 h, peak intensities stabilize as the transformation approaches equilibrium, with complete crystallization (≥99.9% cristobalite) achieved by 6 h (Figure 4b). The observed kinetics demonstrate initial nucleation barriers followed by autocatalytic growth and final saturation, characteristic of solid-state phase transformations in silica systems.
XRD analysis of MG70–150 samples calcined at 1600 °C reveals a three-stage crystallization process (Figure 4). During the initial nucleation-dominated stage (0–0.5 h), cristobalite content increases slowly, as evidenced by the weak intensity of characteristic peaks (d101 = 4.041 Å, d111 = 4.041 Å, d102 = 2.843 Å, and d200 = 2.487 Å). The system then transitions into a rapid growth stage (0.5–1 h), where the crystallization rate reaches its maximum and the quartz glass phase is rapidly consumed. This is followed by a deceleration stage (1–6 h), during which cristobalite content continues to increase but at a progressively diminishing rate until the transformation approaches equilibrium. Complete crystallization (cristobalite content ≥ 99.9%) is achieved after 6 h of calcination (Figure 4b) [22]. The observed kinetics, which demonstrate initial nucleation barriers, subsequent autocatalytic growth, and final saturation, are characteristic of solid-state phase transformations in silica systems.
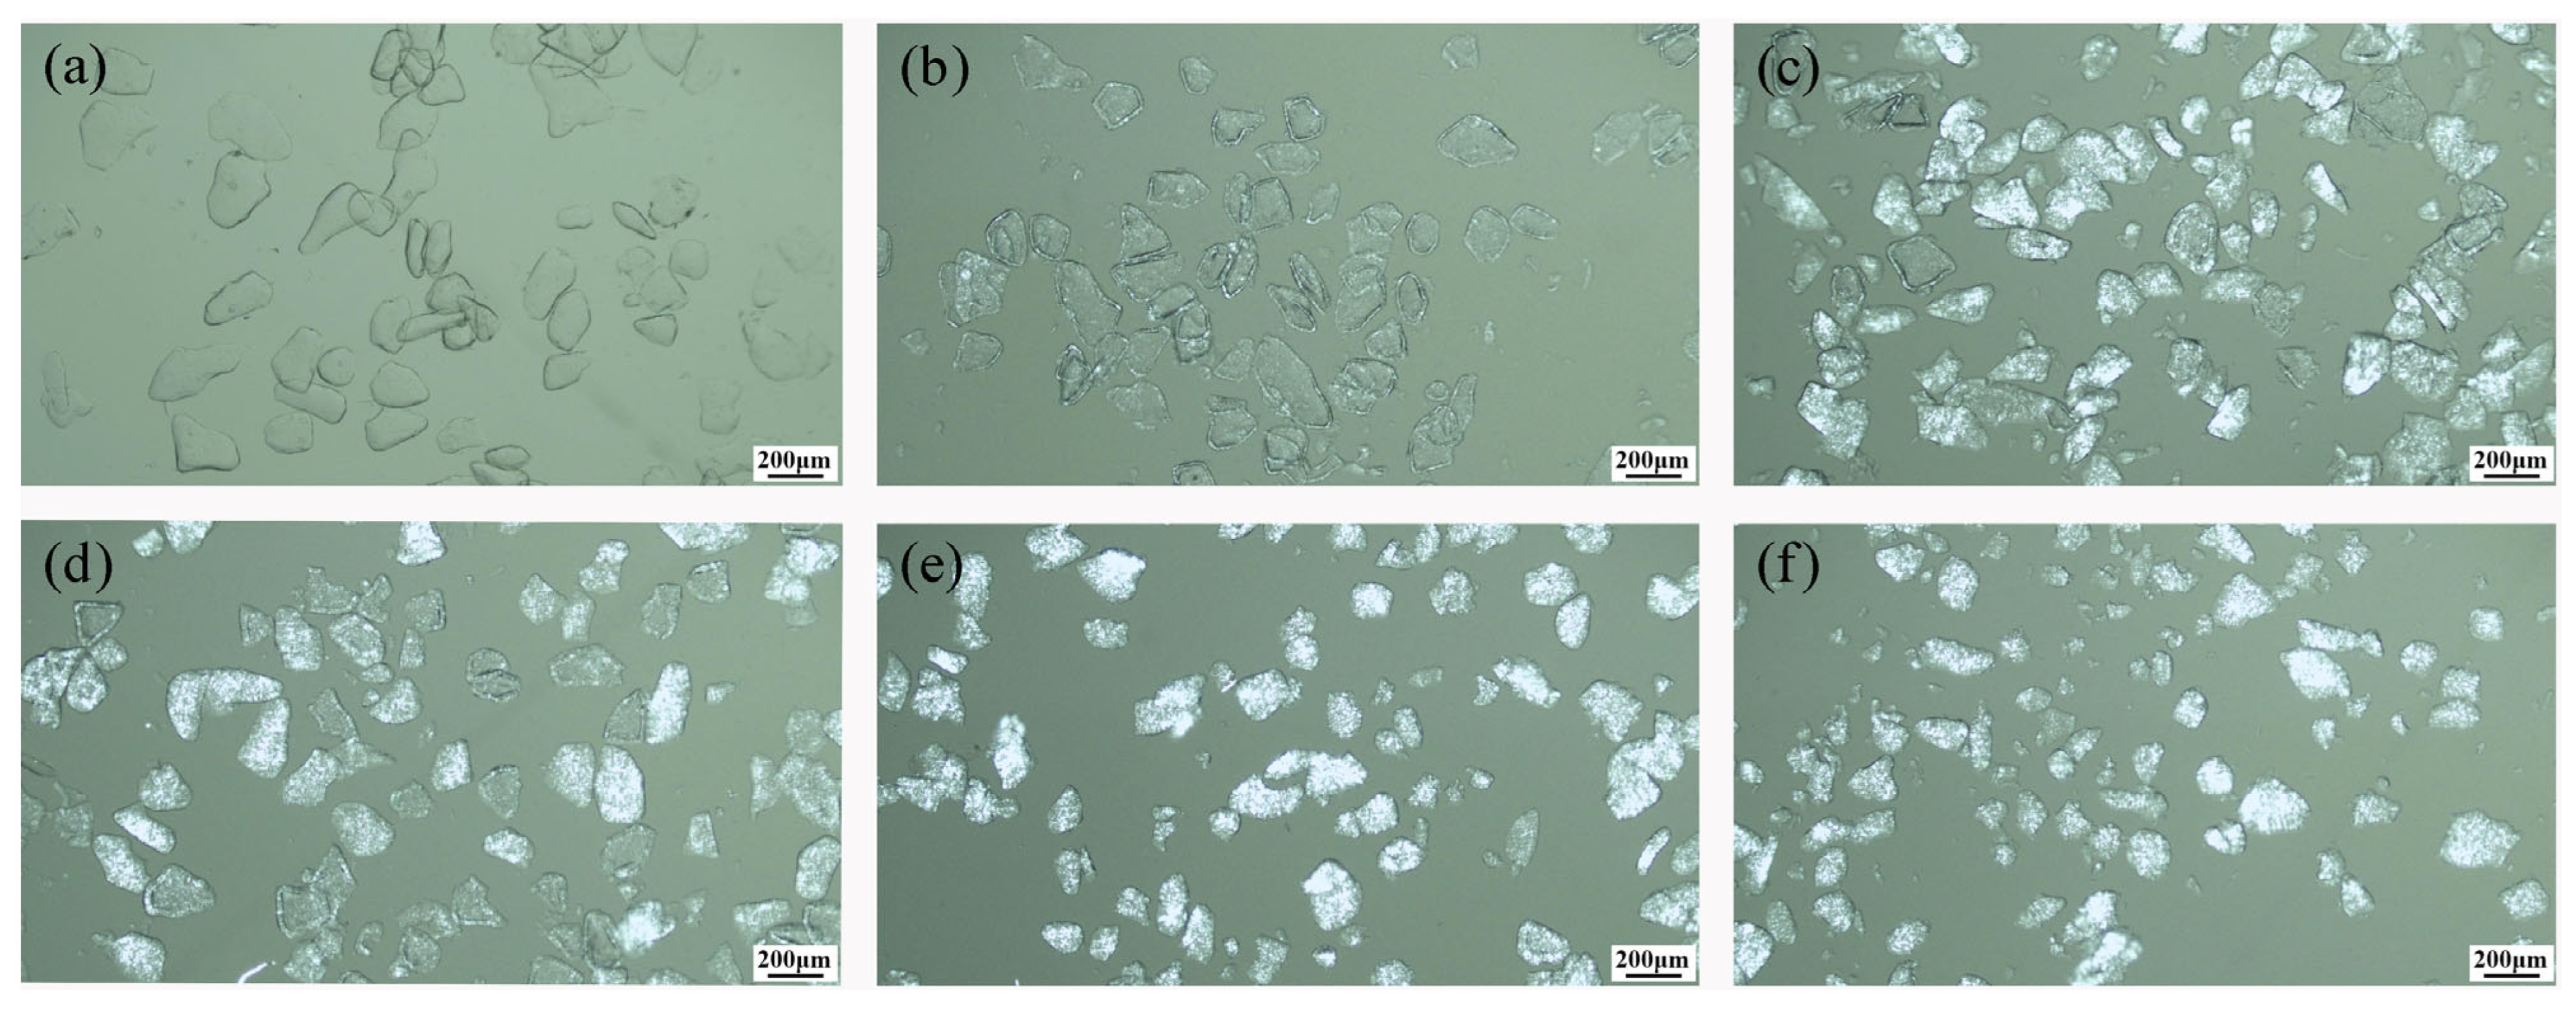
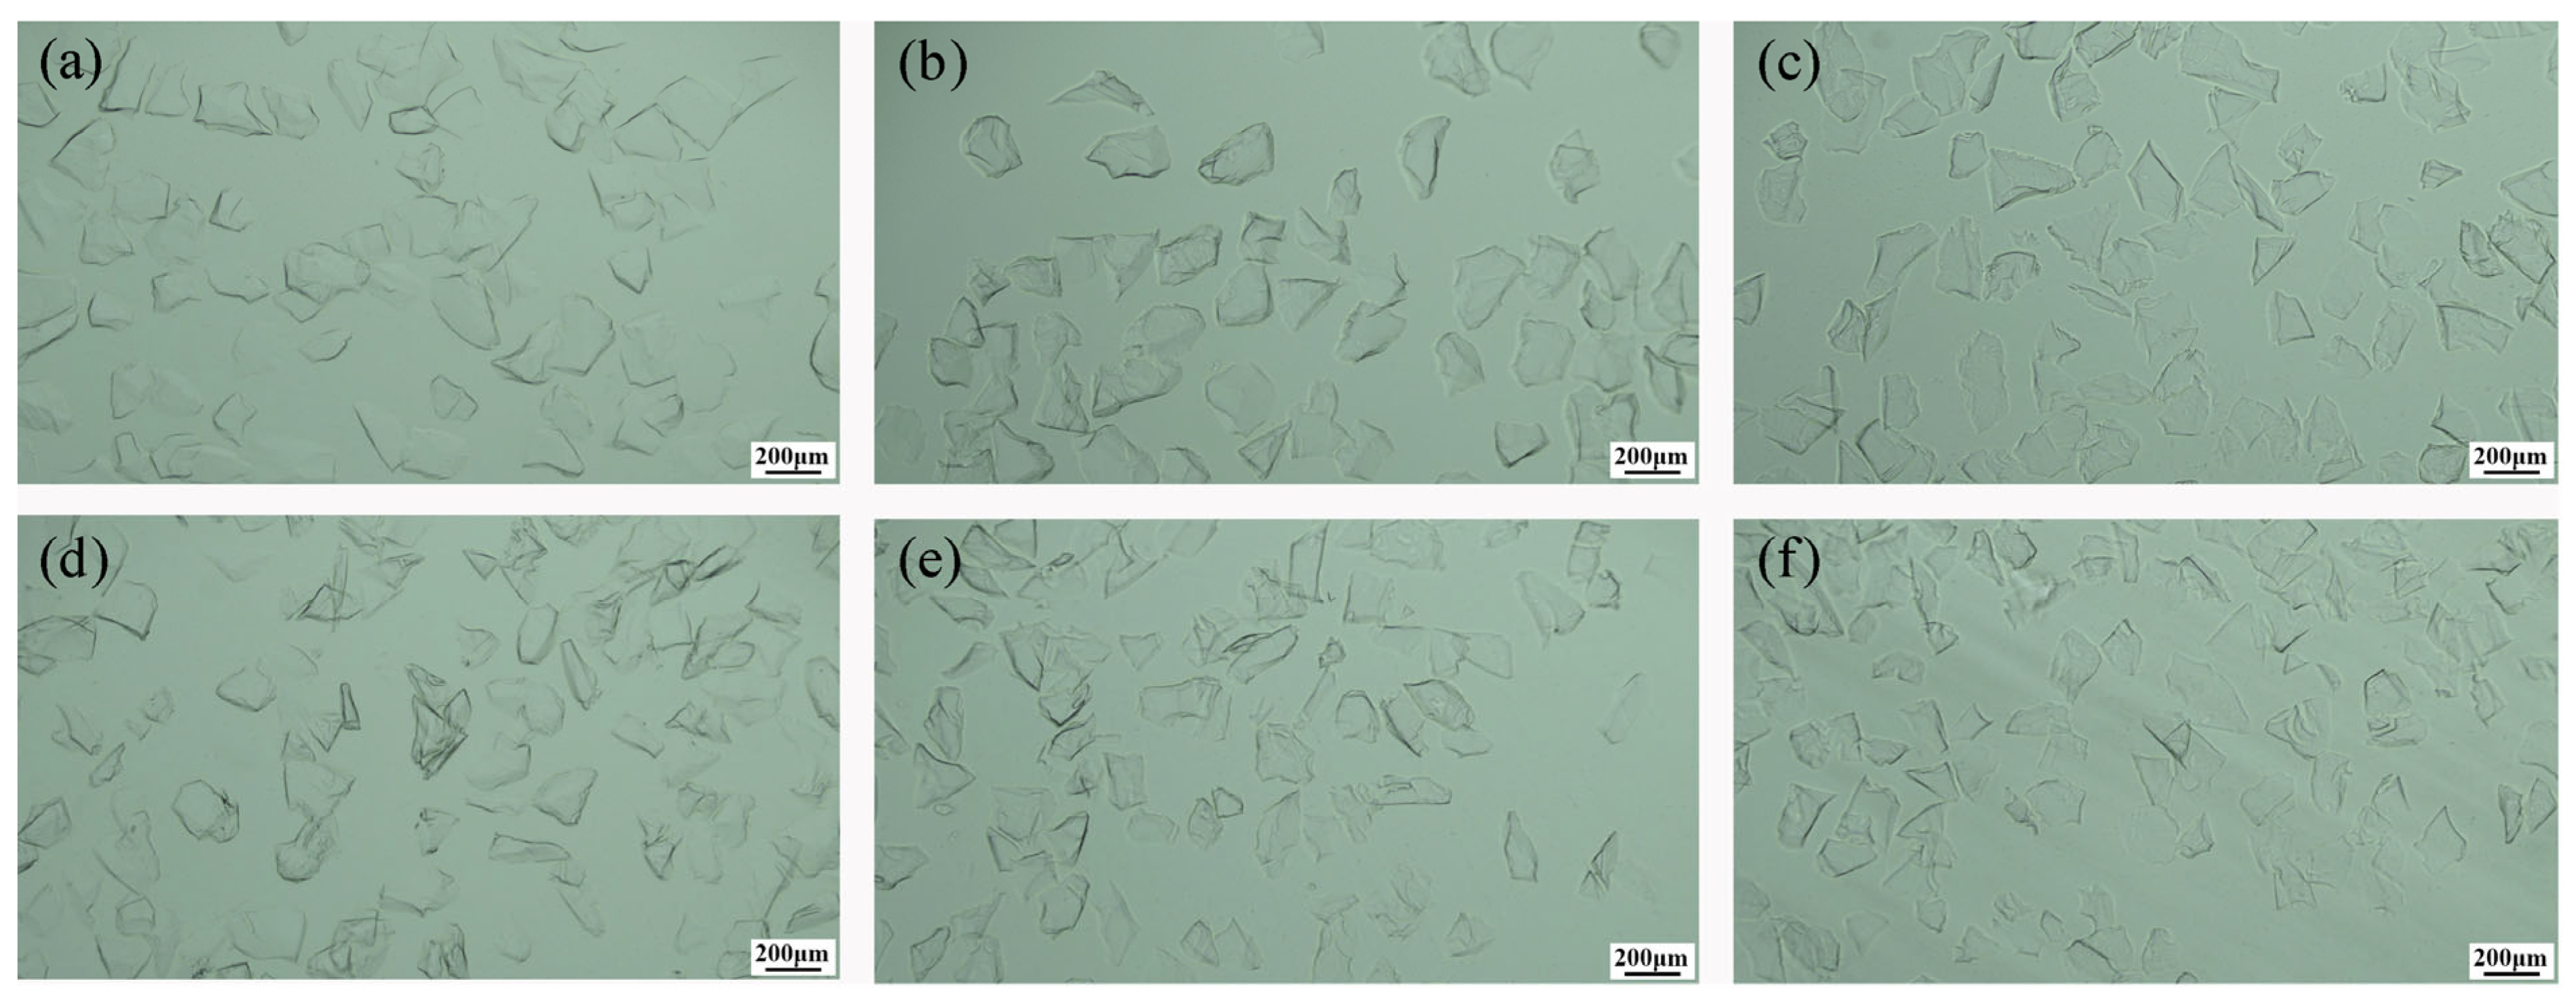
The crystallization process was further characterized through polarized light microscopy, which leverages cristobalite’s intrinsic birefringence in contrast to the isotropic quartz glass matrix [23,24]. As demonstrated in Figure 5, samples calcined for 0.5 h showed no birefringence, a finding consistent with the XRD-determined cristobalite content (Figure 4b) being below optical detection limits. Extending the calcination time to 1 h led to the formation of an approximately continuous crystalline layer on the sample surface, indicating surface enrichment of cristobalite. Bulk crystallization was observed after 2 h, evidenced by dispersed birefringent spots (89% conversion), with residual glassy phases concentrated at grain boundaries. Progressive crystallization reduced the amorphous phase to 6% by 4 h (94% completeness), ultimately achieving full transformation (≥99.9%) with uniform birefringence after 6–8 h. This spatiotemporal progression, from surface nucleation to bulk crystallization, confirms defect-mediated, surface-dominant kinetics [25], whereby the reduced activation energy at surface sites initiates the transformation before it propagates inward.

3.3. Crystalline Kinetics and Impurity Redistribution Mechanism

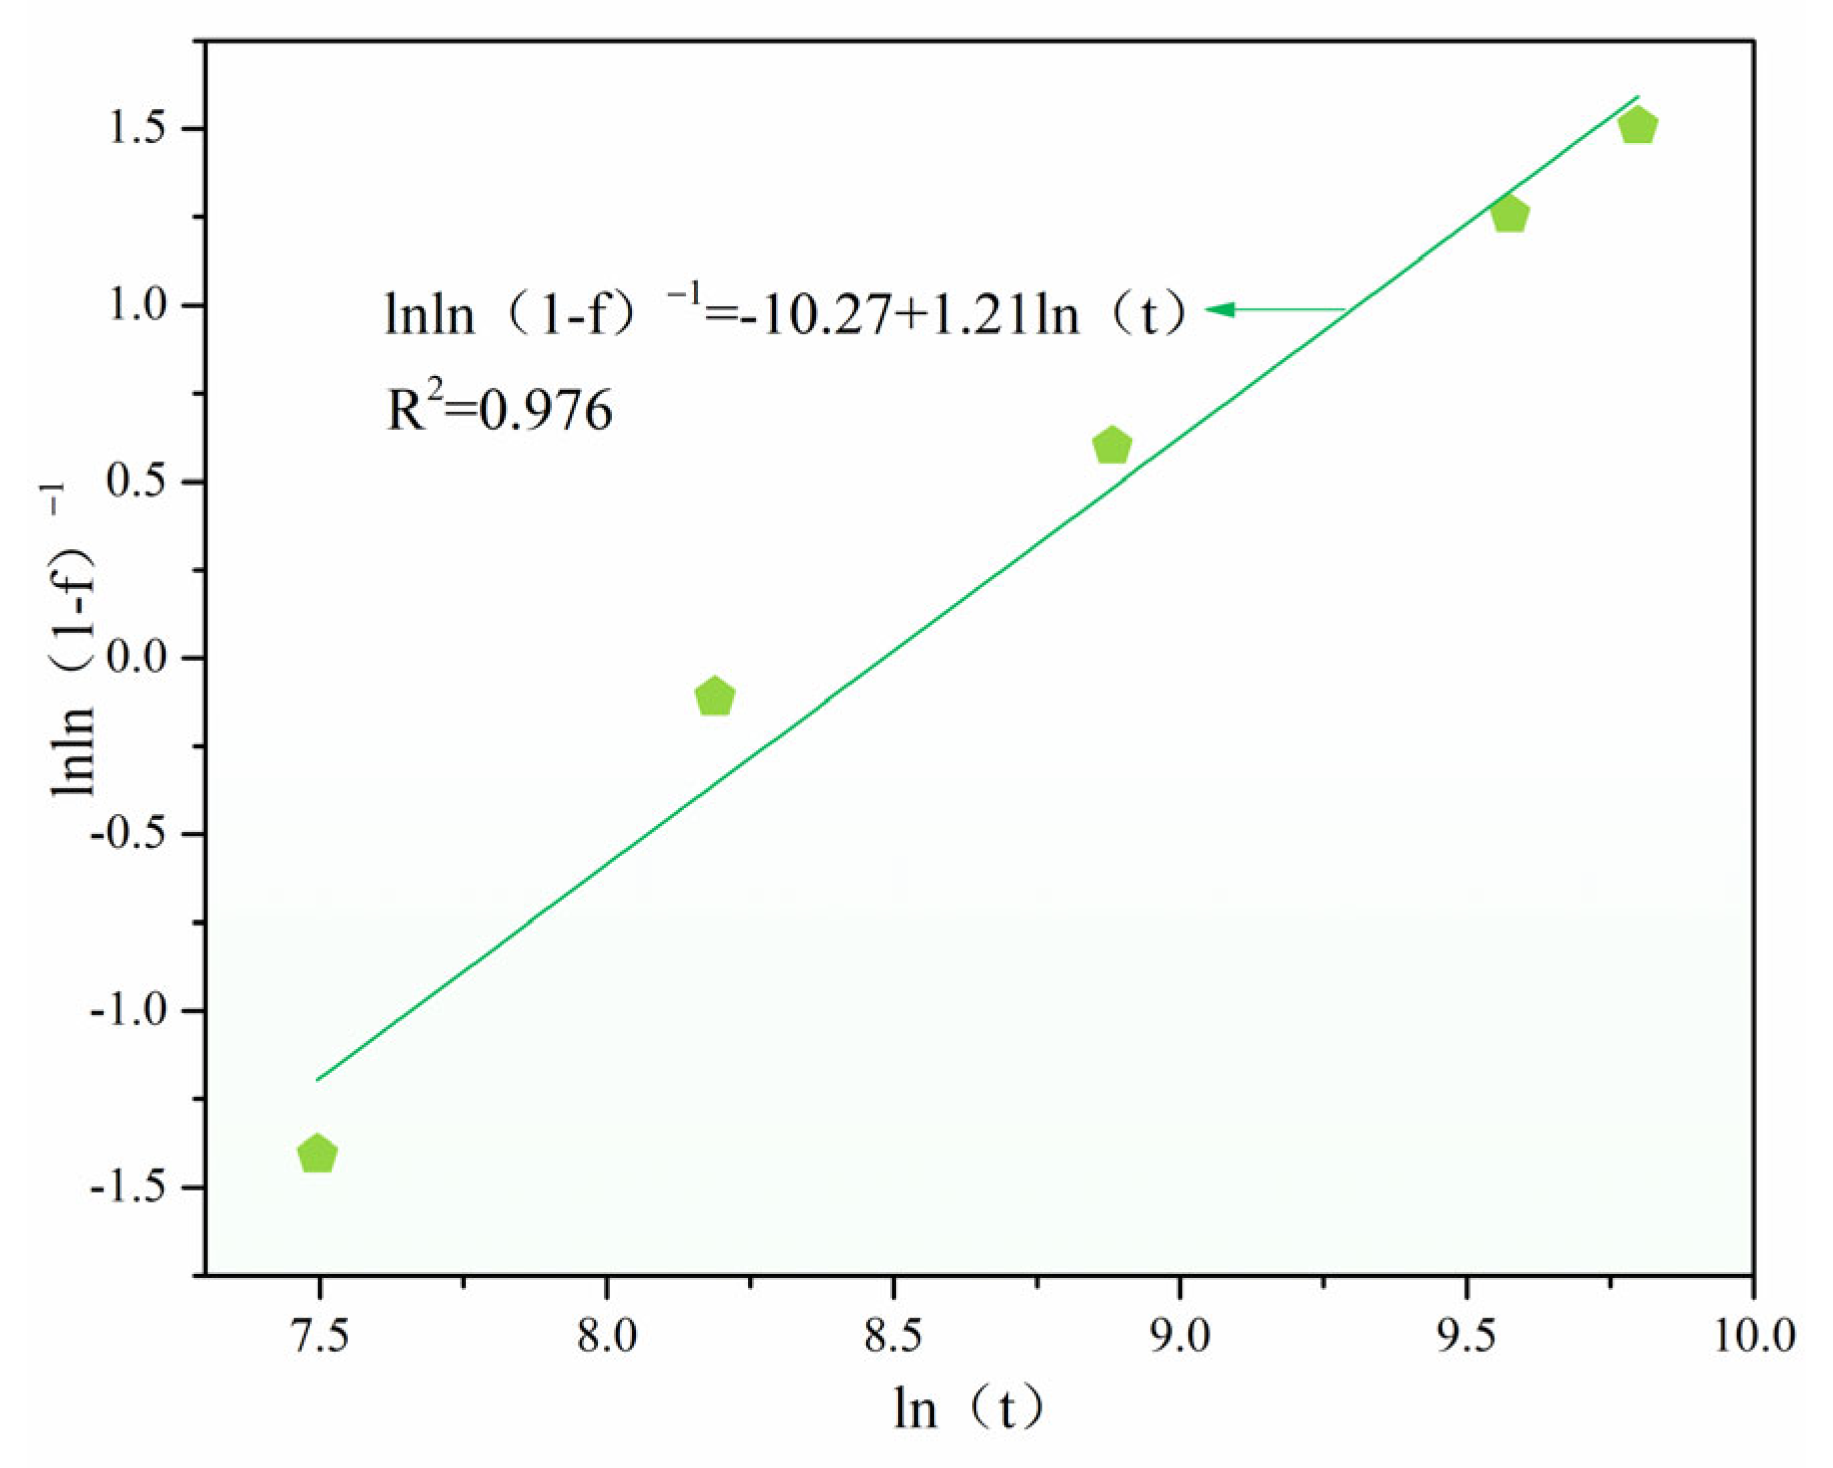
Cristobalite crystallization kinetics at 1600 °C (Figure 4b) were modeled using the Avrami equation:
ln[−ln(1 − f)] = lnK + nlnt
where f is transformed fraction (time-dependent), t is calcination time (h), K is rate constant incorporating nucleation barrier and activation energy, n is dimensionality exponent reflecting nucleation mechanism and growth geometry.
Kinetic analysis of cristobalite formation (Figure 4b) via the Avrami model revealed a linear relationship between ln[−ln(1 − f)] and lnt. Kinetic analysis of cristobalite formation (Figure 4b) via the Avrami model revealed a linear relationship between ln[−ln(1 − f)] and lnt (Figure 6), yielding an Avrami exponent (n) for quartz glass sand MG70–150 of 1.21. This value signifies two-dimensional plate growth governed by long-range diffusion [26,27], indicating surface-mediated crystallization where lateral expansion dominates nucleation. Initial crystallization was observed to preferentially occur at the sample surface, which is consistent with the findings presented in Figure 5.
Complementary structural characterization of fully crystallized samples (10–24 h) through Rietveld-refined XRD (Figure 7) and unit cell parameter analysis (Table 2) confirmed progressive lattice expansion under extended calcination. To elucidate impurity redistribution mechanisms, controlled HF etching of amorphous (MG70–150) and crystallized (MG-C) samples was performed across concentration gradients. Comparative micrographs (Figure 8 and Figure 9) document distinct morphological evolution during acid treatment, while Figure 10 quantitatively correlates etching rates with Al/Ti impurity profiles before and after crystallization, demonstrating the purification-enhancing effect of phase transformation.
Table 2 presents the unit cell parameters of fully crystallized cristobalite obtained after different calcination durations. A systematic expansion of these parameters is observed with increasing calcination time. This expansion provides direct evidence for the high-temperature incorporation of larger-radius impurity ions (Al3+, Ti4+), which substitute for Si4+ in the cristobalite structure. This incorporation process is driven by vacancy-mediated diffusion under concentration gradients [28].
Crucially, during the initial 6 h crystallization, calcination leads to the surface enrichment of impurities (Figure 10) while maintaining higher purity in the grain interiors. This process establishes radial concentration gradients within the cristobalite grains. Extended calcination beyond 6 h promotes the progressive diffusion of impurities into the crystal lattice, as evidenced by a systematic increase in the unit cell volume (ΔV/V0 = 0.158% → 0.205%). Therefore, employing a calcination temperature of 1600 °C for 6 h as the optimal crystallization condition for WQCs not only achieves a rapid crystallization rate but also yields cristobalite with minimal lattice impurities.
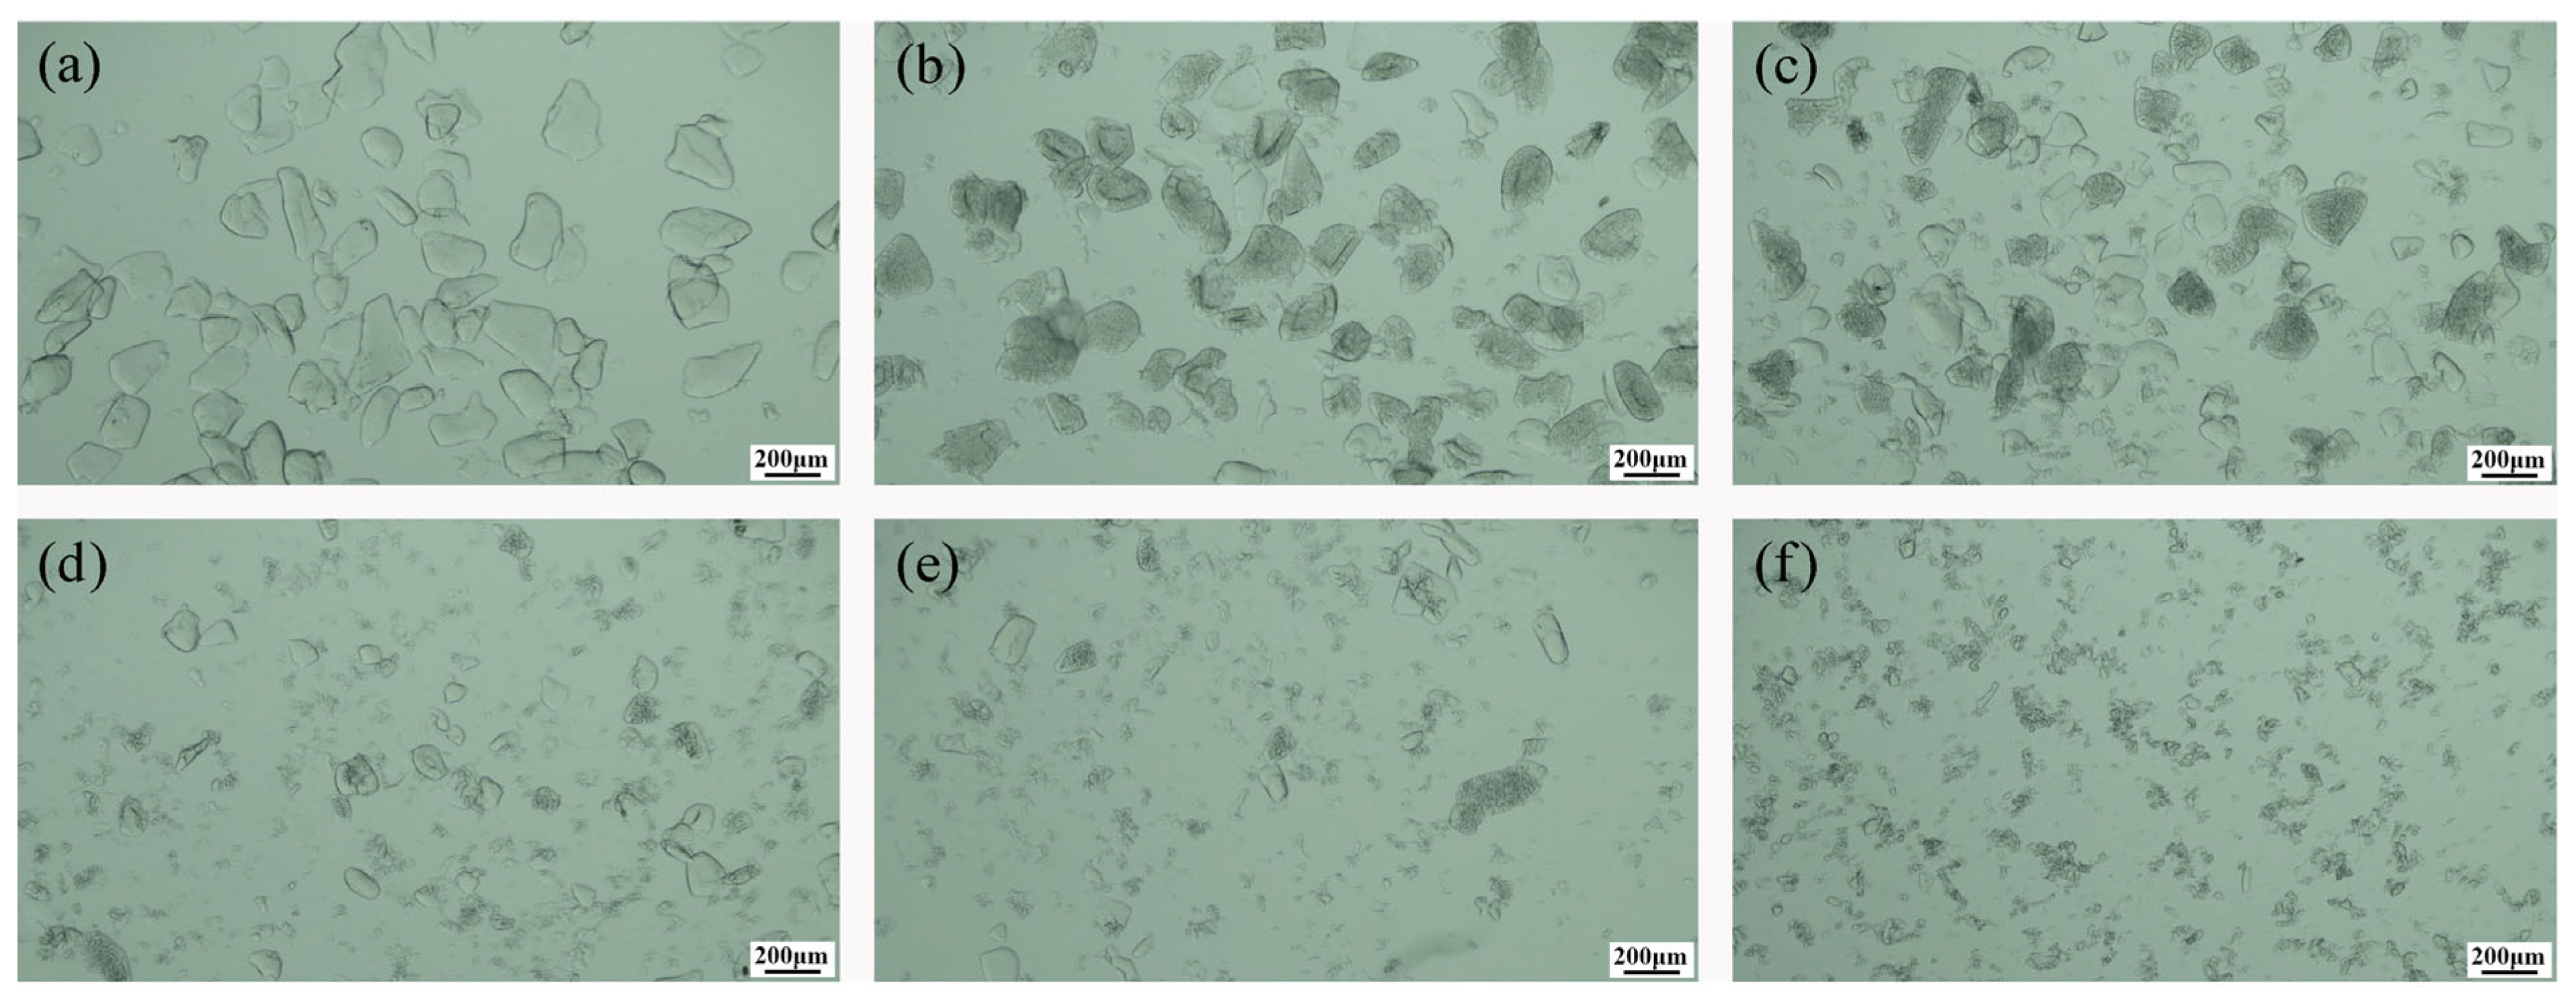
Figure 8 illustrates the micro-morphology of the MG70–150 material before and after HF etching. The attack by hydrofluoric acid proceeds via a combination of longitudinal and surface etching, reflecting an isotropic etching behavior. As the acid concentration increases, the sample particle size gradually decreases. Some particles exhibit deepened inward HF etching traces, with the etching depth progressively increasing. Figure 9 reveals a fundamentally different etching behavior in the crystallized MG-C samples. During annealing, when the cristobalite phase transition temperature is reached, the transformation from the β-phase to the α-phase induces the formation of internal cracks. HF predominantly etches the cristobalite from these crack defects. With increasing HF concentration, the surface microcracks deepen, and an increase in cristobalite fine-grains is observed; most cristobalite samples fracture at an HF concentration of 10 mol/L. Collectively, these observations indicate that during acid leaching, the abundant microcracks in cristobalite provide a larger specific surface area, enabling a more thorough reaction with the leaching solution.
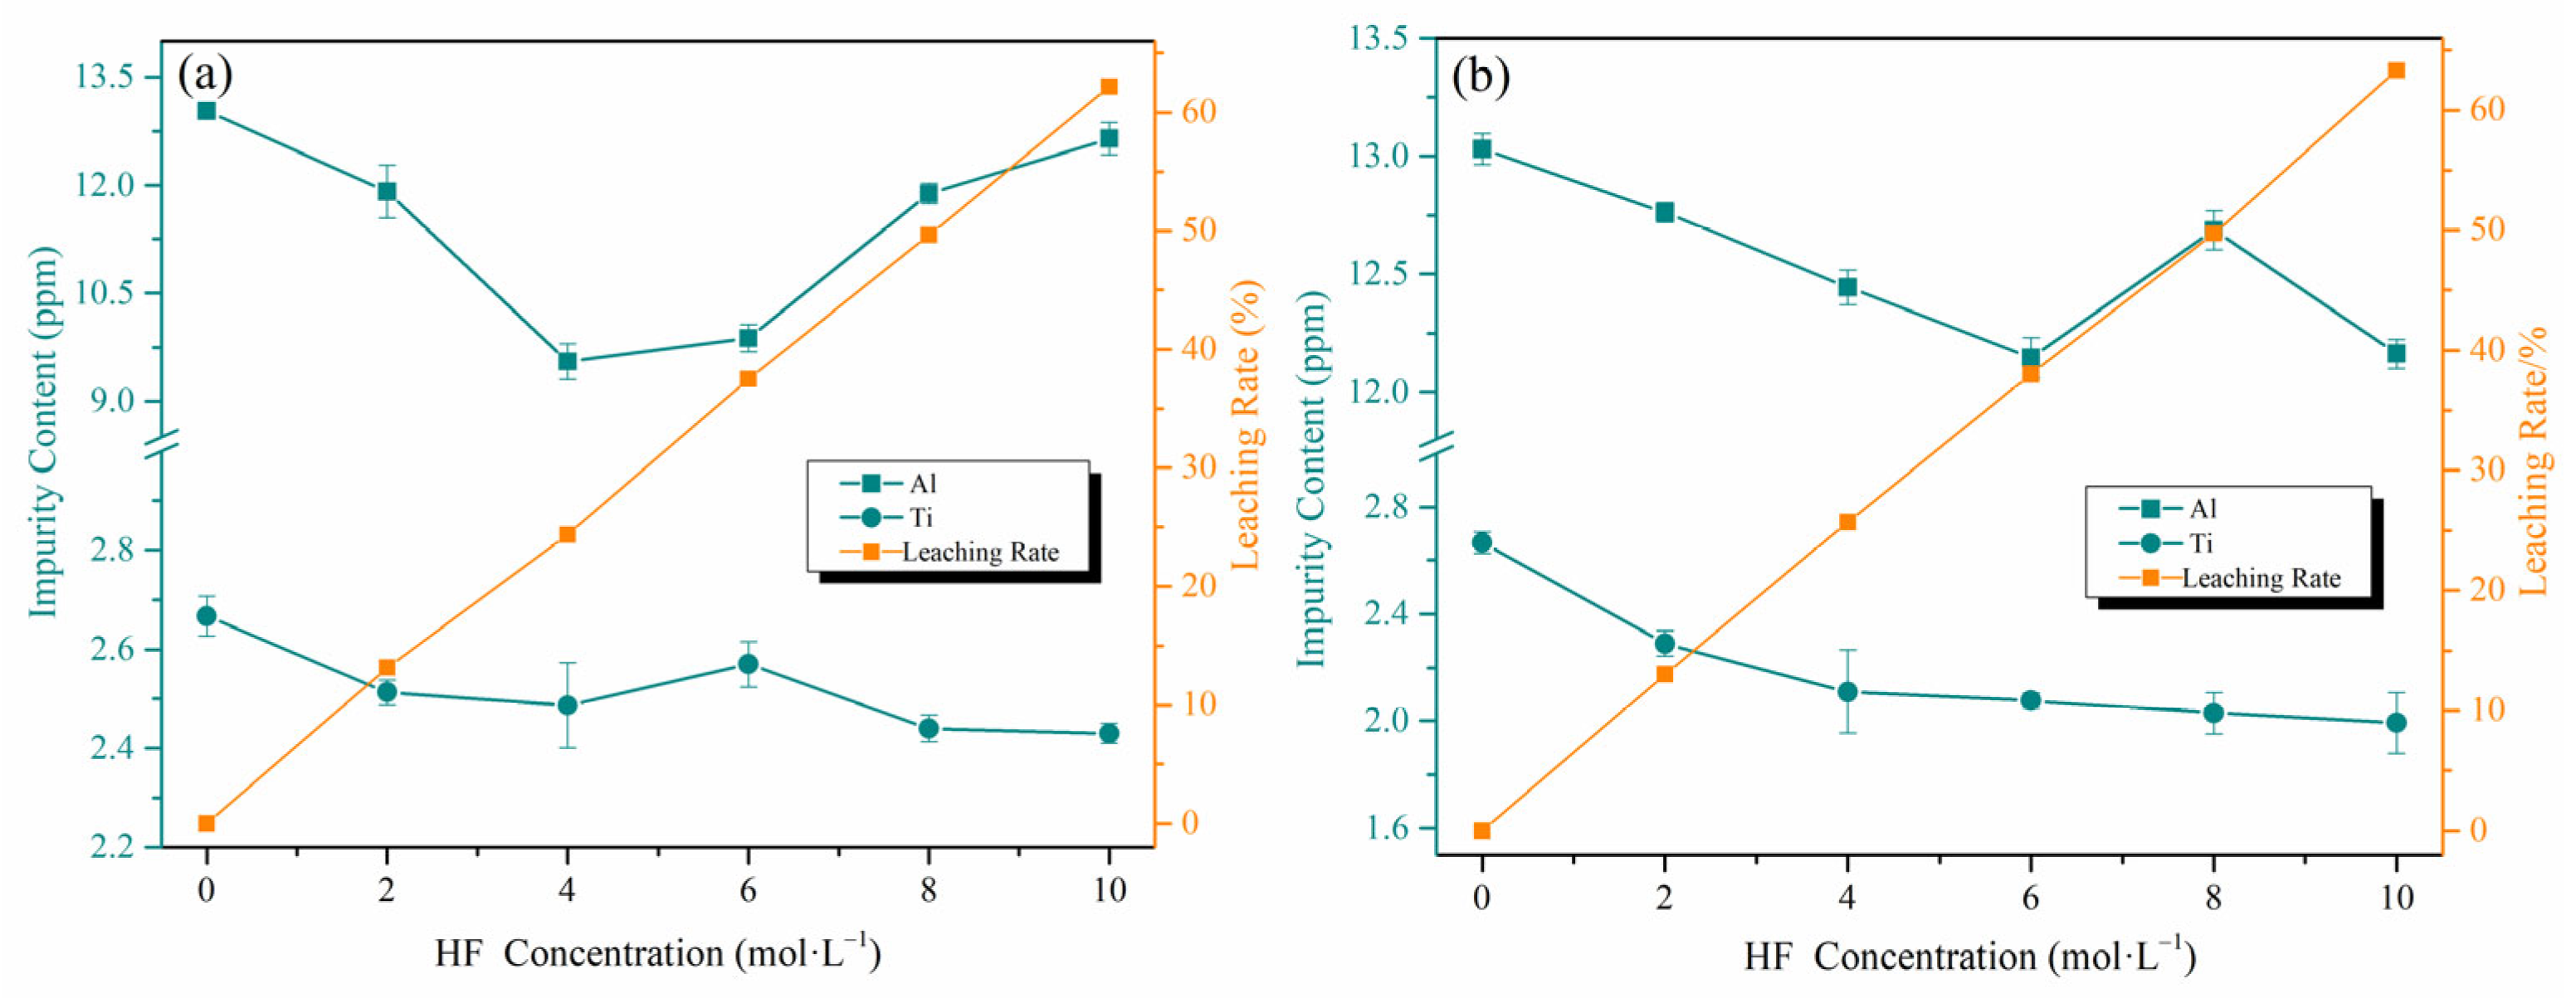
Figure 10a reveals a strong positive correlation (R2 = 0.998) between the leaching rate of the MG70–150 samples and the hydrofluoric acid (HF) concentration. As the leaching rate increases, the aluminum (Al) content initially decreases and then increases, whereas the titanium (Ti) impurity level remains relatively uniform, fluctuating between 2.4 and 2.7 ppm. This V-shaped Al leaching behavior stems from the preferential dissolution of Al-O bonds versus Si-O bonds, which is attributed to the higher bond dissociation energy of Si-O [29]. Mechanically crushed surfaces, which are enriched with Al-O bonds, undergo selective attack [30,31]. Concurrently, the surrounding low-Al regions, possessing a more stable structure, effectively form protective barriers around the Al-rich cores. These barriers restrict acid penetration, leading to increased Al retention in the particle cores as leaching progresses. Since both Al and Ti impurities are predominantly located within the internal structure of the MG70–150 particles, achieving high leaching rates requires excessive HF, which significantly reduces the particle size. This internal sequestration of impurities fundamentally limits the ultimate purification potential of the WQCs.
Figure 10b reveals a strong positive correlation (R2 = 0.997) between the leaching rate of the MG-C samples and the HF concentration. For MG-C, the concentrations of impurity elements Al and Ti decrease with increasing leaching rate before stabilizing. Correlating these results with Figure 9 indicates that crystallographic differentiation and diffusion processes lead to the enrichment of Al and Ti within the surface regions and microcracks of MG-C. Consequently, the impurity content in the particle interior is lower and exhibits a more uniform distribution.
In summary, cristobalite and quartz glass exhibit similar leaching rates when treated with HF at identical concentrations. However, the dense, non-porous surface of quartz glass provides a limited reactive area during acid contact, which constrains the ultimate purification efficiency for WQCs. In contrast, cristobalite possesses higher concentrations of Al and Ti impurities that are concentrated in its surface regions and microcracks. These readily accessible impurities are preferentially removed by HF, thereby significantly enhancing the overall acid leaching efficiency. Consequently, converting WQCs into cristobalite through high-temperature calcination represents an effective strategy for obtaining a purified crystalline product with enhanced leachability.

3.4. Purity Enhancement via Crystallization: Post-Treatment Comparison

Table 3 summarizes the impurity element contents in the MG70–150 precursor and the MG-C product after identical acid leaching treatments. The results demonstrate that the concentrations of major impurity elements (Al, Ti, Zr, and Ge) in the crystallized MG-C are significantly lower than those in the amorphous MG70–150 precursor under equivalent conditions. This disparity confirms that the phase transformation from quartz glass to cristobalite via calcination actively facilitates the removal of impurities during subsequent acid leaching.
Notably, compared to the conventional purification of natural quartz for high-purity quartz, our method utilizing waste quartz crucibles eliminates the need for complex physical separation steps [13,17]. Furthermore, it achieves an exceptional SiO2 purity exceeding 99.998% with the use of a remarkably low acid concentration, underscoring its efficiency and practicality [14,15,16].

4. Conclusions

This work presents a method for converting vitreous waste quartz crucibles into high-purity cristobalite sand through a systematic investigation of their crystallization behavior, beginning with an examination of calcination parameters (temperature and time). The results demonstrate that the surface-initiated crystallization of quartz glass proceeds via a two-dimensional plate growth mechanism governed by long-range diffusion. Our results show that cristobalite formation commences at 1400 °C, with the crystallization rate initially increasing but then declining as the temperature rises further to 1600 °C. At the optimized temperature of 1600 °C, the process exhibited distinct kinetic stages: the rate accelerated, peaking between 0.5 and 1 h, before decelerating and culminating in complete transformation after 6 h. Furthermore, the crystallization process effectively drives the migration of impurity elements (Al, Ti) to the surfaces and microcracks of the cristobalite particles, creating a critical structural prerequisite for subsequent purification. Consequently, acid leaching of the resulting cristobalite yields a high-purity product with an SiO2 content of 99.998%. This work not only demonstrates an efficient upcycling pathway for silica-based waste but also establishes a technological foundation for advancing circular economy practices in the photovoltaic industry.

Author Contributions

T.Z.: Conceptualization, Methodology, Software, Investigation, Formal Analysis, Writing—Original Draft. Y.H.: Resources, Writing—Original Draft, Funding Acquisition. H.S.: Data Curation, Project Administration, Writing—Original Draft, Funding Acquisition. Y.T.: Visualization, Investigation. T.P.: Resources, Supervision, Validation. All authors have read and agreed to the published version of the manuscript.

Funding

This work was supported by the National Key Research and Development Program of China (2024YFC3907602), the Sichuan Provincial Intellectual Property Office Intellectual Property Special Project (2024-ZS-00016), and Henan Province Major Science and Technology Special Funding (241100320100).

Data Availability Statement

Data are contained within the article.

Conflicts of Interest

The authors declare no conflict of interest.

References

  1. Lv, R.D.; Zha, X.D.; Hu, H.W.; Niu, C. A review on the influencing factors of solar pavement power generation efficiency. Appl. Energy 2025, 379, 124897. [Google Scholar] [CrossRef]
  2. Koichi, K.; Gao, B.; Liu, X.; Nakano, S. Growth of semiconductor silicon crystals. Prog. Cryst. Growth Charact. Mater. 2016, 62, 273–285. [Google Scholar] [CrossRef]
  3. Yang, S.C.; Han, S.F.; Chen, J.; Wei, K.X.; Ma, W.H. A sustainable mineral process for silicon and quartz recovery from quartz crucible waste ash via electrical separation. Miner. Eng. 2024, 216, 108887. [Google Scholar] [CrossRef]
  4. Warden, G.K.; Juel, M.; Gawet, B.A.; Sabatino, M.D. Recent developments on manufacturing and characterization of fused quartz crucibles for monocrystalline silicon for photovoltaic applications. Open Ceram. 2023, 13, 100321. [Google Scholar] [CrossRef]
  5. Breneman, R.C.; JOHN, W.; Sglao, V. Effect of cristobalite on the strength of sintered fused silica above and below the cristobalite transformation. J. Am. Ceram. Soc. 2015, 98, 1611–1617. [Google Scholar] [CrossRef]
  6. Huang, X.M.; Kishi, H.; Oishi, S.; Watanabe, H.; Sanpei, K.; Sakai, S.; Hoshikawa, K. Expansion behavior of bubbles in silica glass concerning Czochralski (CZ) Si Growth. Jpn. J. Appl. Phys. 1999, 38, 353–355. [Google Scholar] [CrossRef]
  7. Hatch, D.M.; Subrata, G. The α-β phase transition in cristobalite, SiO2. Phys. Chem. Miner. 1991, 17, 554–562. [Google Scholar] [CrossRef]
  8. Wang, Y.F.; Liu, L.C. Quartz Glass; Chemical Industry Press: Beijing, China, 2007. [Google Scholar]
  9. Aswathappa, S.; Dai, L.D.; Martin, B.D.; Raju, S.K.; Vasanthi, T. Assessment of acoustic shock wave resistance of SiO2 (α-cristobalite): A potential material for aerospace and defense industry applications. Ceram. Int. 2024, 50, 35647–35656. [Google Scholar] [CrossRef]
  10. Lucia, P.; Monica, D.; Alessandro, P.; Fernando, F. A kinetic study of the quartz–cristobalite phase transition. J. Eur. Ceram. Soc. 2013, 33, 3403–3410. [Google Scholar] [CrossRef]
  11. Huang, X.M.; Kon, S.; Wu, K.H.; Chen, M.G.; Hoshikawa, T.; Hoshikawa, K.; Uda, S. Reaction at the interface between Si melt and a Ba-doped silica crucible. J. Cryst. Growth 2005, 277, 154–161. [Google Scholar] [CrossRef]
  12. Antje, H.; Manuel, S.; Felix, S.; Matthias, T.; Christian, R.; Jochen, F. Factors influencing the gas bubble evolution and the cristobalite formation in quartz glass Cz crucibles for Czochralski growth of silicon crystals. J. Cryst. Growth 2021, 570, 126231. [Google Scholar] [CrossRef]
  13. Pan, X.D.; Li, S.Q.; Li, Y.K.; Guo, P.H.; Zhao, X.; Cai, Y.S. Resource, characteristic, purification and application of quartz: A review. Miner. Eng. 2022, 183, 107600. [Google Scholar] [CrossRef]
  14. Wang, Z.H.; Xi, W.; Wang, L. Mineral material science characteristics of high quality raw material of granite pegmatite high purity quartz from Spruce Pine, United States. Mineral. Petrol. 2025, 16, 10. [Google Scholar]
  15. Wang, D.H.; Wang, Y.; Chen, Z.H. Discussion on the Prospecting Direction of High-purity Quartz Deposit. Acta Geosci. Sin. 2025, 46, 8–14. [Google Scholar]
  16. Zhang, W.F.; Zhang, G.L.; Xie, G.G. Genesis and prospecting potential of the Haoping hydrothermal vein-type high-purity quartz deposit in the Wudang Uplift, South Qinling. Geol. China 2024, 8, 1–25. [Google Scholar]
  17. Liu, M.; Wang, G.; Zhao, F.; Li, W.; Zhu, G.; Liang, G.; Jian, W.; Liao, L.; Lv, G. Advances in purification technologies and applications of high-purity quartz resource. Prog. Nat. Sci. Mater. Int. 2025, 35, 51–64. [Google Scholar] [CrossRef]
  18. Sang, L.K.; Ma, C.Q. Petrology; Geological Press: Beijing, China, 2001. [Google Scholar]
  19. Amir, R.; Zary, A. Adjustment of oxygen transport phenomena for Czochralski silicon crystal growth. Heliyon 2024, 10, e29346. [Google Scholar] [CrossRef]
  20. Wang, L.Y.; Hon, M.H. The effect of cristobalite seed on the crystallization of fused silica based ceramic core—A kinetic study. Ceram. Int. 1995, 21, 187–193. [Google Scholar] [CrossRef]
  21. Hurst, V.J.; Schroeder, P.A.; Styron, R.W. Accurate quantification of quartz and other phases by powder X-ray diffractometry. Anal. Chim. Acta 1997, 337, 233–252. [Google Scholar] [CrossRef]
  22. Müller, R.; Zanotto, E.D.; Fokin, V.M. Surface crystallization of silicate glasses: Nucleation sites and kinetics. J. Non-Cryst. Solids 2013, 274, 208–231. [Google Scholar] [CrossRef]
  23. Oldenbourg, R. Polarized Light Microscopy: Principles and Practice; Cold Spring Harbor Protocols: New York, NY, USA, 2013. [Google Scholar]
  24. Gomes, O.D.; Iglesias, J.C.A.; Paciornik, S.; Vieira, M.B. Classification of hematite types in iron ores through circularly polarized light microscopy and image analysis. Miner. Eng. 2013, 52, 191–197. [Google Scholar] [CrossRef]
  25. Wagstaff, F.E.; Richards, K.J. Kinetics of Crystallization of Stoichiometric SiO2 Glass in H2O Atmospheres. J. Am. Ceram. Soc. 1966, 49, 118–121. [Google Scholar] [CrossRef]
  26. Cantor, B. The Avrami equation: Phase transformations. Equ. Mater. 2020, 07, 180–206. [Google Scholar]
  27. Shirzand, K.; Christopher, V.A. A critical review on applications of the Avrami equation beyond materials science. J. R. Soc. Interface 2023, 20, 230242. [Google Scholar] [CrossRef] [PubMed]
  28. Zhang, Q.T. Fundamentals of Inprganic Materials Science; Chemical Industry Press: Beijing, China, 2006. [Google Scholar]
  29. Wang, L. Principles of Mineral Materal Science; Geological Press: Beijing, China, 2021. [Google Scholar]
  30. Xv, L.H.; Tian, J.; Wu, H.Q. New insights into the oleate flotation response of feldspar particles of different sizes: Anisotropic adsorption model. J. Colloid Interface Sci. 2017, 505, 500–508. [Google Scholar] [CrossRef] [PubMed]
  31. Jiang, X.S.; Chen, J.; Wei, M.N.; Li, F.F.; Ban, B.; Li, J.W. Effect of impurity content difference between quartz particles on flotation behavior and its mechanism. Powder Technol. 2020, 375, 504–512. [Google Scholar] [CrossRef]
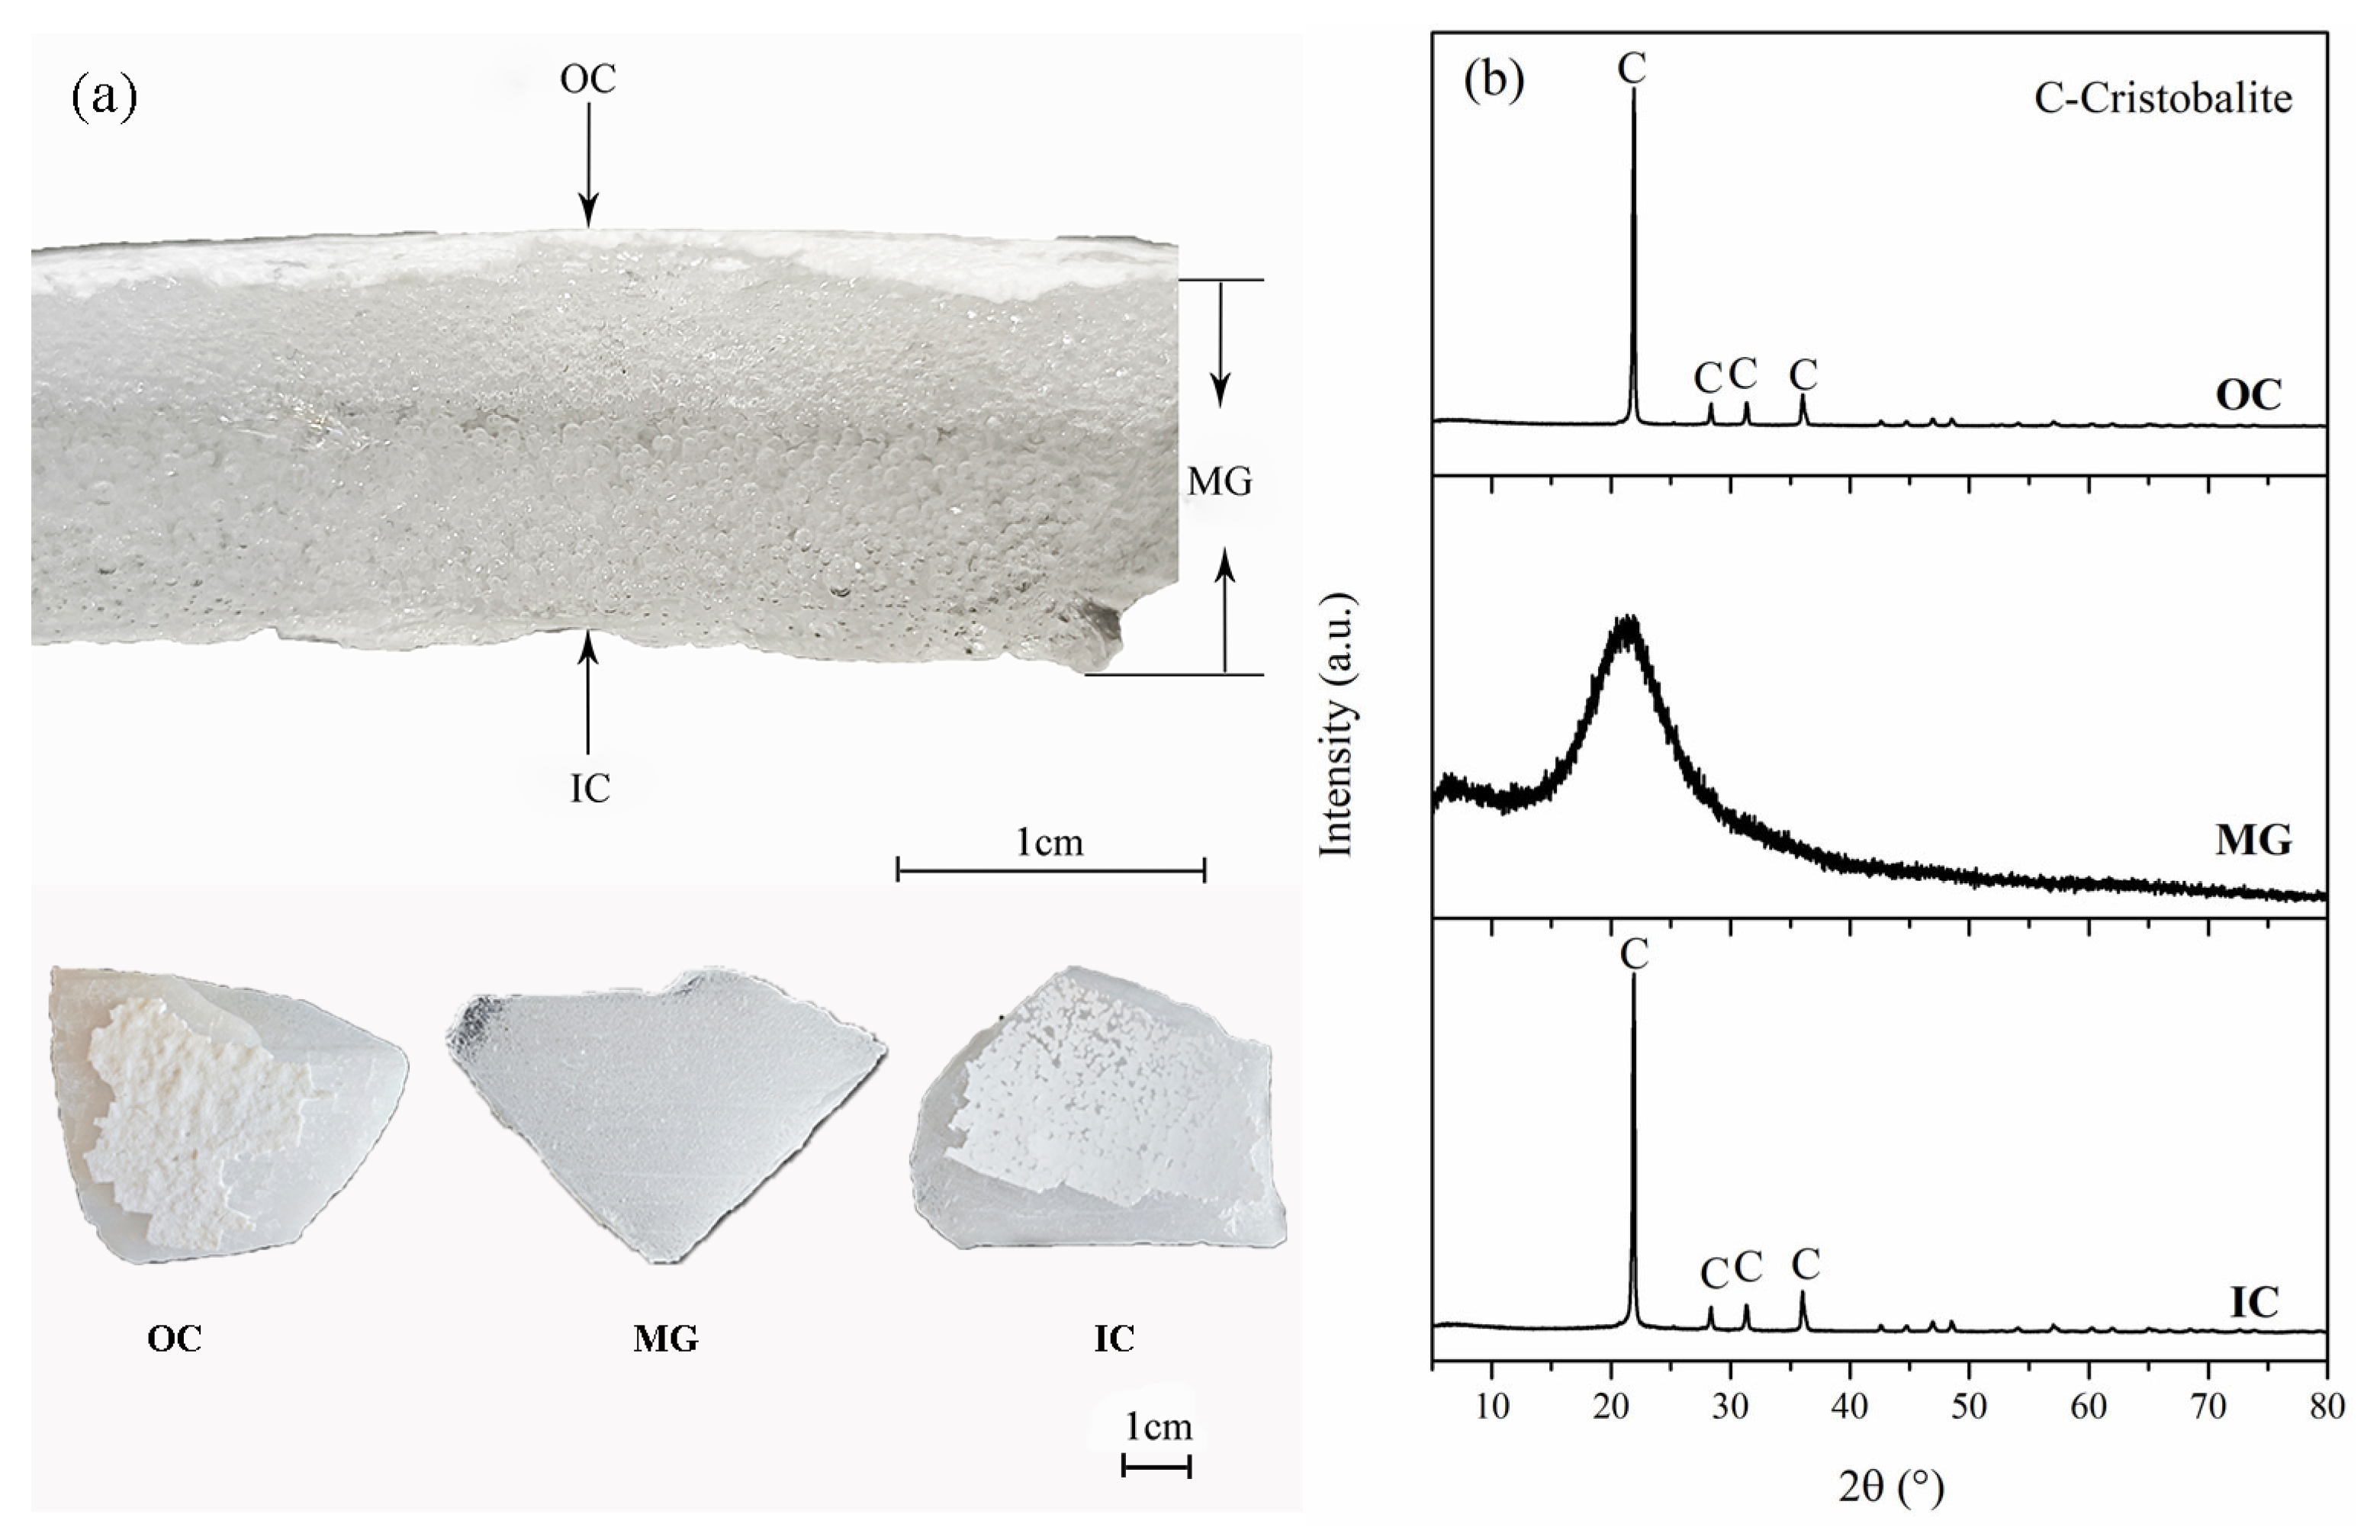
Figure 1. The image and XRD phase analysis result of raw WQC. (a) the image, (b) XRD patterns.
Minerals 15 01184 g001
Figure 2. The crystallinity calibration curve for cristobalite.
Minerals 15 01184 g002
Figure 3. (a) XRD patterns of MG70–150 calcined at different temperatures for 6 h, (b) cristobalite content in the samples.
Minerals 15 01184 g003
Figure 4. (a) XRD patterns of MG70–150 calcined at 1600 °C for different times, (b) cristobalite content in the samples.
Minerals 15 01184 g004
Figure 5. Polarized light micrograph of MG70–150 and samples after calcination at 1600 °C for different times. (a) 0.5 h, (b) 1.0 h, (c) 2.0 h, (d) 4.0 h, (e) 6.0 h, (f) 8.0 h.
Minerals 15 01184 g005
Figure 6. Calculation of crystal precipitation constant for MG70–15 calcined at 1600 °C.
Minerals 15 01184 g006
Figure 7. XRD patterns of MG70–150 samples at 1600 °C for different calcination times.
Minerals 15 01184 g007
Figure 8. Micrographs of MG70–150 before and after HF etching. (a) Before, (b) 2 mol/L, (c) 4 mol/L, (d) 6 mol/L, (e) 8 mol/L, (f) 10 mol/L.
Minerals 15 01184 g008
Figure 9. Micrographs of MG-C before and after HF etching. (a) Before, (b) 2 mol/L, (c) 4 mol/L, (d) 6 mol/L, (e) 8 mol/L, (f) 10 mol/L.
Minerals 15 01184 g009
Figure 10. Contents of impurity elements Al/Ti in samples and leaching rate of samples before and after HF etching. (a) MG70–150, (b) MG-C.
Minerals 15 01184 g010
Table 1. Contents of main impurity elements in various parts of the waste quartz crucible (μg/g).
Sample NameAlTiFeKLiNaMgMnNiBaZrCrGe
OC19.455.092.533.470.072.571.350.010.010.111.800.060.02
MG12.962.861.230.430.52-0.410.020.05-0.400.051.01
IC13.211.441.961.57--0.150.080.032.830.860.030.23
Note: - indicates below detection limit.
Table 2. Cellular parameters of MG70–150 samples calcined at 1600 °C for different times.
Calcination Time (h)a (Å)b (Å)c (Å)V (Å3)ΔV/V0 (%)
PDF 00-011-06954.97104.97106.9180170.950
64.97224.97226.9257171.220.158
104.97234.97236.9260171.230.164
164.97284.97286.9256171.260.181
244.97244.97246.9280171.30 0.205
Table 3. Contents of main impurity elements in MG70–150 and MG-C after acid leaching (μg/g).
SampleAlTiFeKLiNaMgMnNiBaZrCrGe
MG70–15013.012.850.51-0.60-----0.80-0.89
MG-C10.402.200.54-0.51--0.01--0.44-0.41
Note: - indicates below detection limit.
Disclaimer/Publisher’s Note: The statements, opinions and data contained in all publications are solely those of the individual author(s) and contributor(s) and not of MDPI and/or the editor(s). MDPI and/or the editor(s) disclaim responsibility for any injury to people or property resulting from any ideas, methods, instructions or products referred to in the content.