Article

Mineral Prospectivity Maps for Critical Metals in the Clean Energy Transition: Examples for Hydrothermal Copper and Nickel Systems in the Carajás Province

by
Luiz Fernandes Dutra
1,
Lena Virgínia Soares Monteiro
2,*,
Marco Antonio Couto, Jr.
2 and
Cleyton de Carneiro Carneiro
3
1
Departamento de Geologia, Escola de Minas, Universidade Federal de Ouro Preto, Rua Nove, S/N, Morro do Cruzeiro, Ouro Preto 35402-163, MG, Brazil
2
Instituto de Geociências, Universidade de São Paulo, Rua do Lago, 562, Cidade Universitária, São Paulo 05508-080, SP, Brazil
3
Departamento de Engenharia de Minas e de Petróleo, Escola Politécnica, Universidade de São Paulo, Av. Prof. Mello Moraes, 2373, Cidade Universitária, São Paulo 05508-030, SP, Brazil
*
Author to whom correspondence should be addressed.
Minerals 2025, 15(10), 1086; https://doi.org/10.3390/min15101086 (registering DOI)
Submission received: 28 August 2025 / Revised: 3 October 2025 / Accepted: 15 October 2025 / Published: 18 October 2025

Abstract

Machine learning algorithms are essential tools for developing Mineral Prospectivity Models (MPMs), enabling a data-driven approach to mineral exploration. This study integrated airborne geophysical, topographic, and geological data with a mineral system framework to build MPMs for iron oxide–copper–gold (IOCG) and hydrothermal nickel deposits in the Southern Copper Belt of the Carajás Province, Brazil. Seven machine learning algorithms were tested using stratified 10-fold cross-validation: Logistic Regression, k-Nearest Neighbors, AdaBoost, Support Vector Machine (SVM), Random Forest, XGBoost, and Multilayer Perceptron. SVM delivered the highest classification accuracy and robustness, highlighting new mineralized zones while minimizing false positives and negatives, and accounting for geological complexity. SHapley Additive ExPlanations (SHAP) analysis revealed that structural controls (e.g., faults, shear zones, and geochronological contacts) exert a stronger influence on mineralization patterns than lithological factors. The resulting prospectivity maps identified geologically distinct zones of IOCG and hydrothermal nickel mineralization, with high-probability closely aligned with major structural corridors oriented E–W, NE–SW, and NW–SE. Results also suggest an indirect association with volcanic units, Orosirian A1-type granites and Neoarchean A2-type granites.

1. Introduction

Copper and nickel, critical to the clean energy transition, face supply challenges in the current worldwide production, and the new discoveries are insufficient to meet the growing demand for electrification in transportation and industry [1,2,3]. In this context, Mineral Prospectivity Models (MPMs) play a pivotal role in accelerating mineral discovery by identifying areas with high exploration potential [4]. While MPMs traditionally rely on geophysical, geochemical, and spatial data, manual integration and interpretation make results heavily dependent on the interpreter’s prior knowledge [4,5,6].
The use of Machine Learning Algorithms (MLAs) in geosciences has grown with the rise of big data, advances in data science, improved computational power, and the availability of robust geological datasets [7]. MLAs have become powerful tools for analyzing complex, high-dimensional, and nonlinear parameters, which are common in MPMs. This has enhanced exploration strategies by improving MPM accuracy and reducing interpretative bias [8,9,10]. Given the complexity of geological settings and ore-forming processes, MLAs often outperform traditional exploration models [8]. However, MPM effectiveness depends heavily on the quality and representativeness of training data, understanding of mineral systems, and management of uncertainties [11,12]. Therefore, MPM development requires both methodological innovation and a deep geological insight [13].
The Carajás Province in the Amazonian Craton hosts one of the largest concentrations of iron oxide–copper–gold (IOCG), along with iron sulfide–copper–gold (ISCG) and hydrothermal nickel deposits [14,15,16,17,18,19]. Copper and nickel mineralization developed through Neoarchean to Paleoproterozoic ore-forming processes, linked to the installation and reactivation of translithospheric shear zones. Overprinting metallogenetic processes leaves geological footprints detectable at scales ranging from micro- to craton-scale datasets [20,21,22].
However, identifying these footprints and the controlling factors of hydrothermal mineral systems remains challenging, particularly in tropical and equatorial regions like the Amazonian Craton [6,23], which is characterized by dense rainforest, supergene cover, scarce outcrops, and limited access [6]. Airborne geophysical surveys (e.g., gamma-ray spectrometry, magnetometry, gravimetry) provide spatially continuous data, offering valuable support for structural interpretation, geological–geophysical mapping, and mineral exploration [6,23,24,25].
We integrate multiphysics airborne geophysical data with the mineral systems framework to build a prospectivity model for IOCG and hydrothermal nickel deposits using MLA predictions (Logistic Regression, k-Nearest Neighbors, AdaBoost, Support Vector Machine, Random Forest, XGBoost, and Multilayer Perceptron). Critical mappable components of copper and nickel mineral systems were identified from geophysical data. Prospectivity analysis in the Carajás Province was improved through systematic data integration, model calibration, and validation against known deposits and exploration results.

2. Geologic Setting of the Carajás Province
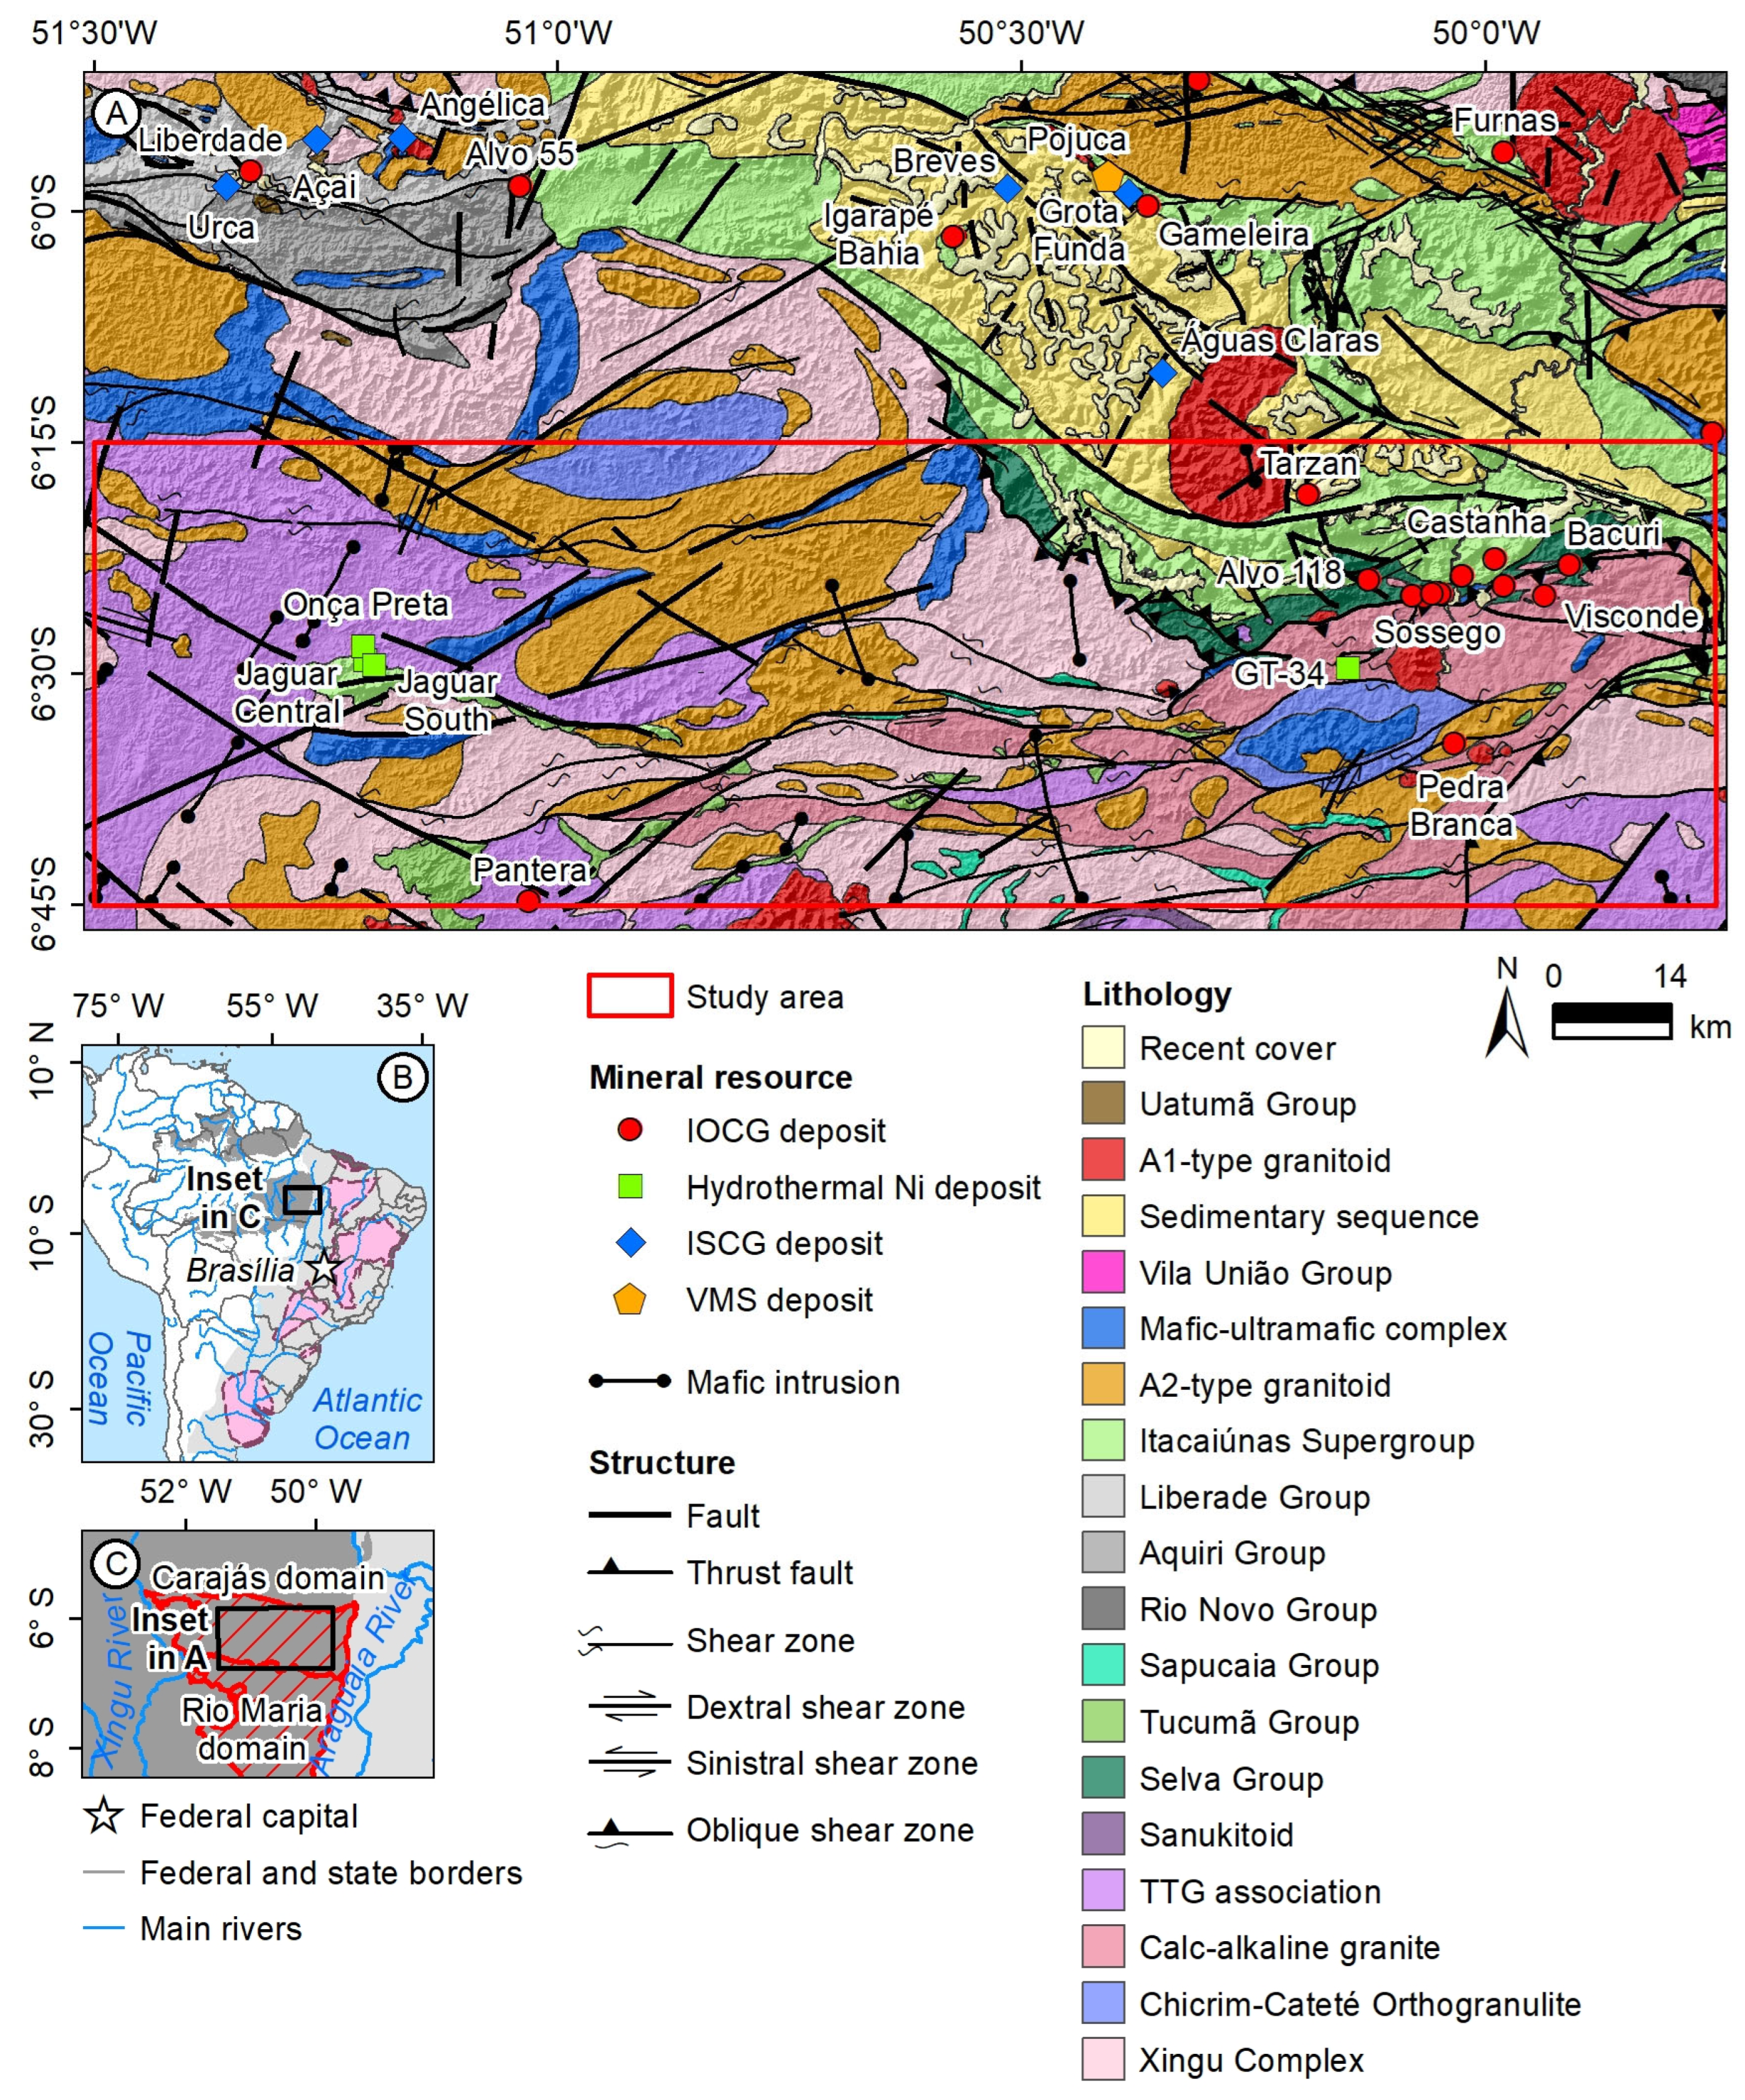
The Carajás Province (Figure 1) is an Archean nucleus in the southeastern Amazonian Craton, divided into two domains, the Rio Maria (south) and Carajás (north) domains. The Rio Maria Domain consists of a Mesoarchean tonalite–trondhjemite–granodiorite (TTG) and greenstone belt sequences, together with Paleoproterozoic A1-type granites and a mafic suite [26,27].
The Carajás Domain (Figure 1) comprises Mesoarchean granite–gneiss complexes (Xingu Complex, Chicrim Cateté Orthogranulite, and correlated units) surrounded by ~3.0–2.9 Ga greenstone belts (Selva, Tucumã, and Sapucaia groups [16,27,28,29]). Several elongate calc–alkaline granitoids (Pantanal, Nova Canadá, Boa Sorte, Bom Jesus, Cruzadão and Serra Dourada) were emplaced at ~2.92–2.83 Ga [30,31,32]. Mesoarchean TTGs (Colorado and Água Fria trondhjemites) and sanukitoid (Água Azul and Água Fria granodiorites) occur along the boundary between the Carajás and Rio Maria domains [30,31,32].
Figure 1. (A) Simplified geological map showing hydrothermal deposits in the Carajás Domain. (B) Location of the Carajás Province in the Amazonian Craton. (C) Tectonic compartmentation of the Carajás Mineral Province (after [33,34]).
Minerals 15 01086 g001
A widespread magmatic event between ~2.76 and 2.72 Ga was controlled by translithospheric discontinuities expressed at the surface as regional shear zones (e.g., Canaã, Cinzento, Carajás) [31,32,35,36,37,38]. The Itacaiúnas Supergroup and correlated units (Rio Novo, Aquiri, Liberdade groups) comprise ca. ~2.76–2.73 Ga metavolcanic–sedimentary sequences that unconformably overlie the granite–gneiss terrain [26,39,40,41,42]. Neoarchean magmatism also includes coeval A2-type granites (e.g., Estrela, Planalto, Velha Canadá, Vila Jussara, Igarapé Gelado, Pedra Branca) and mafic–ultramafic intrusions (e.g., Pium Norite, Serra Leste, Cateté suites).
During the Rhyacian (ca. 2.2–2.0 Ga), the Bacajá Domain and northern Carajás Domain were amalgamated, reactivating regional shear zones [43,44]. Paleoproterozoic basin covers (Águas Claras and Caninana formations) represent sag to syn-orogenic transgressive—regressive sequences deposited at 2.19–2.01 Ga [45,46], unconformably overlying the Itacaiúnas Supergroup. A1-type granites (1.88–1.85 Ga) are widespread in the Carajás and Rio Maria domains [47,48,49] and emplaced contemporaneously with diabase and rhyolite porphyry in the Carajás domain and with Uatumã volcanism and plutonism [26,47,48,49,50]. Laterite, colluvium, and alluvial cover overlie banded iron formation of the Carajás Formation, the mafic–ultramafic complexes, sedimentary rocks of the Águas Claras Formation, and major drainages [33].

3. The IOCG and Hydrothermal Nickel Deposits in the Carajás Domain

In the Carajás Province (Figure 1), IOCG and hydrothermal nickel deposits share several geological features, including volcanic and granitic host, sub-vertical to vertical orebodies, and extensive, multi-stage hydrothermal alteration zones [15,51]. Regionally, both deposit types are associated with the Cinzento and Canaã shear zones, which define the Northern and Southern Copper Belts, respectively [16]. These similarities led to their interpretation as a continuum; however, nickel enrichment may result from leaching of magmatic sulfides in mafic–ultramafic rocks by deep-seated, high-temperature hydrothermal fluids channeled through the shear zones [15,51].
The study area covers the Southern Copper Belt, in the southern Carajás Domain, including IOCG deposits [52,53,54,55,56,57,58] such as Sequeirinho-Sossego (65.1 Mt @ 0.56% Cu and 0.18% Au, [59]), Castanha, Jatobá, Bacuri, Bacaba, Alvo 118 (170 Mt @ 1.0% Cu, 0.3 g/t Au, [60]), Tarzan, and Pedra Branca. Hydrothermal nickel deposits include GT-34 [61] and the Jaguar deposit [51,62], which hosts three orebodies: Jaguar South (47.2 Mt @ 0.93% Ni, 0.05% Cu, 214 ppm Co, [63]), Jaguar Central (11.6 Mt @ 0.84% Ni, 0.05% Cu, 251 ppm Co, [63]), and Onça Preta (23.7 Mt @ 1.05% Ni, 0.07% Cu, 417 ppm Co, [63]) along the Canaã shear zone intercept with the McCandless fault.
In the Southern Copper Belt, IOCG formation is attributed to 2.71–2.68 and 1.90–1.88 Ga [16,54], whereas hydrothermal nickel deposits lack precise geochronological constraints. Rhyacian (ca. 2.2–2.0 Ga) reactivation of regional shear zones [43,44] is also recorded in the IOCG deposits such as Bacuri, Bacaba, and Jatobá [63].
Neoarchean IOCG deposits are spatially associated with regional-scale alkaline hydrothermal alteration (albite-scapolite) along E-W-trending megashear zones (e.g., Canaã, Cinzento). At deposit scale, hydrothermal alteration includes Na-Ca (albite, scapolite), K-Fe (biotite-magnetite, K-feldspar-magnetite), and Ca-Fe (amphibole-magnetite-apatite) assemblages. Paleoproterozoic IOCG deposits are characterized by late K-Fe and Mg-Fe (chlorite), followed by albite–musketovite, epidote, sericite, and carbonate [52,54,55,56,57,58]. Mineralization consists mainly of chalcopyrite, pyrite, and siegenite, with local pyrrhotite, occurring in lens-shaped disseminations, massive replacement bodies, breccias, and vein stockworks [14,16,26,54,64].
Hydrothermal nickel deposits in the Carajás Domain are hosted by granodioritic to tonalitic gneiss (GT-34, Onça Preta), porphyritic felsic subvolcanic rocks, and granite-gneiss (Jaguar Central, Jaguar South). Subordinate mafic–ultramafic rocks occur at GT-34 deposit and Onça Preta [61,65,66]. At GT-34, alteration includes Na (albite), Mg-Na (orthopyroxene–scapolite), Ca (hornblende–actinolite–apatite–magnetite), Mg-K (phlogopite), and late Na-Ca (albite–epidote–K feldspar) assemblages [61,65,66]. Mineralization is dominated by pyrrhotite and pentlandite, with minor pyrite, chalcopyrite, and magnetite.
The Jaguar deposit comprises three main structurally oriented orebodies, Jaguar South, Jaguar Central, and Onça Preta [51,62,65]. Jaguar South and Jaguar Central show K (biotite), Ca-Fe (apatite–magnetite), Ca (actinolite), Mg-Fe (chlorite), and late Ca (calcite) alteration. Onça Preta, hosted in tonalitic granitoid and subordinate ultramafic rocks, is characterized by K (biotite) and Ca-Fe (magnetite I–apatite I) alteration, locally overprinted by late Mg-Ca (talc–tremolite–(chlorite) and Fe (magnetite II) alteration [51,62,65]. Overall, the orebodies consist of pyrite, millerite, magnetite, and apatite, and minor pentlandite, chalcopyrite, pyrrhotite, sphalerite, and quartz.
The Neoarchean IOCG mineral system in the Carajás Province is interpreted to have formed after delamination and foundering of the metasomatized subcontinental lithospheric mantle, which triggered widespread mantle and crustal melting and the widespread ~2.74–2.72 Ga magmatism at Carajás [54]. Upwelling of CO2-rich fluids from the partial melting of the metasomatized mantle likely caused tectonic instability, development of megashear zones, regional albite–scapolite alteration, and ~2.71–2.68 Ga IOCG mineralization [67,68]. Paleoproterozoic IOCG deposits are temporally associated with the emplacement of ~1.88 Ga A1-type granites [16].

4. Conceptual Framework and Dataset

4.1. Conceptual Model and the Mineral System Approach

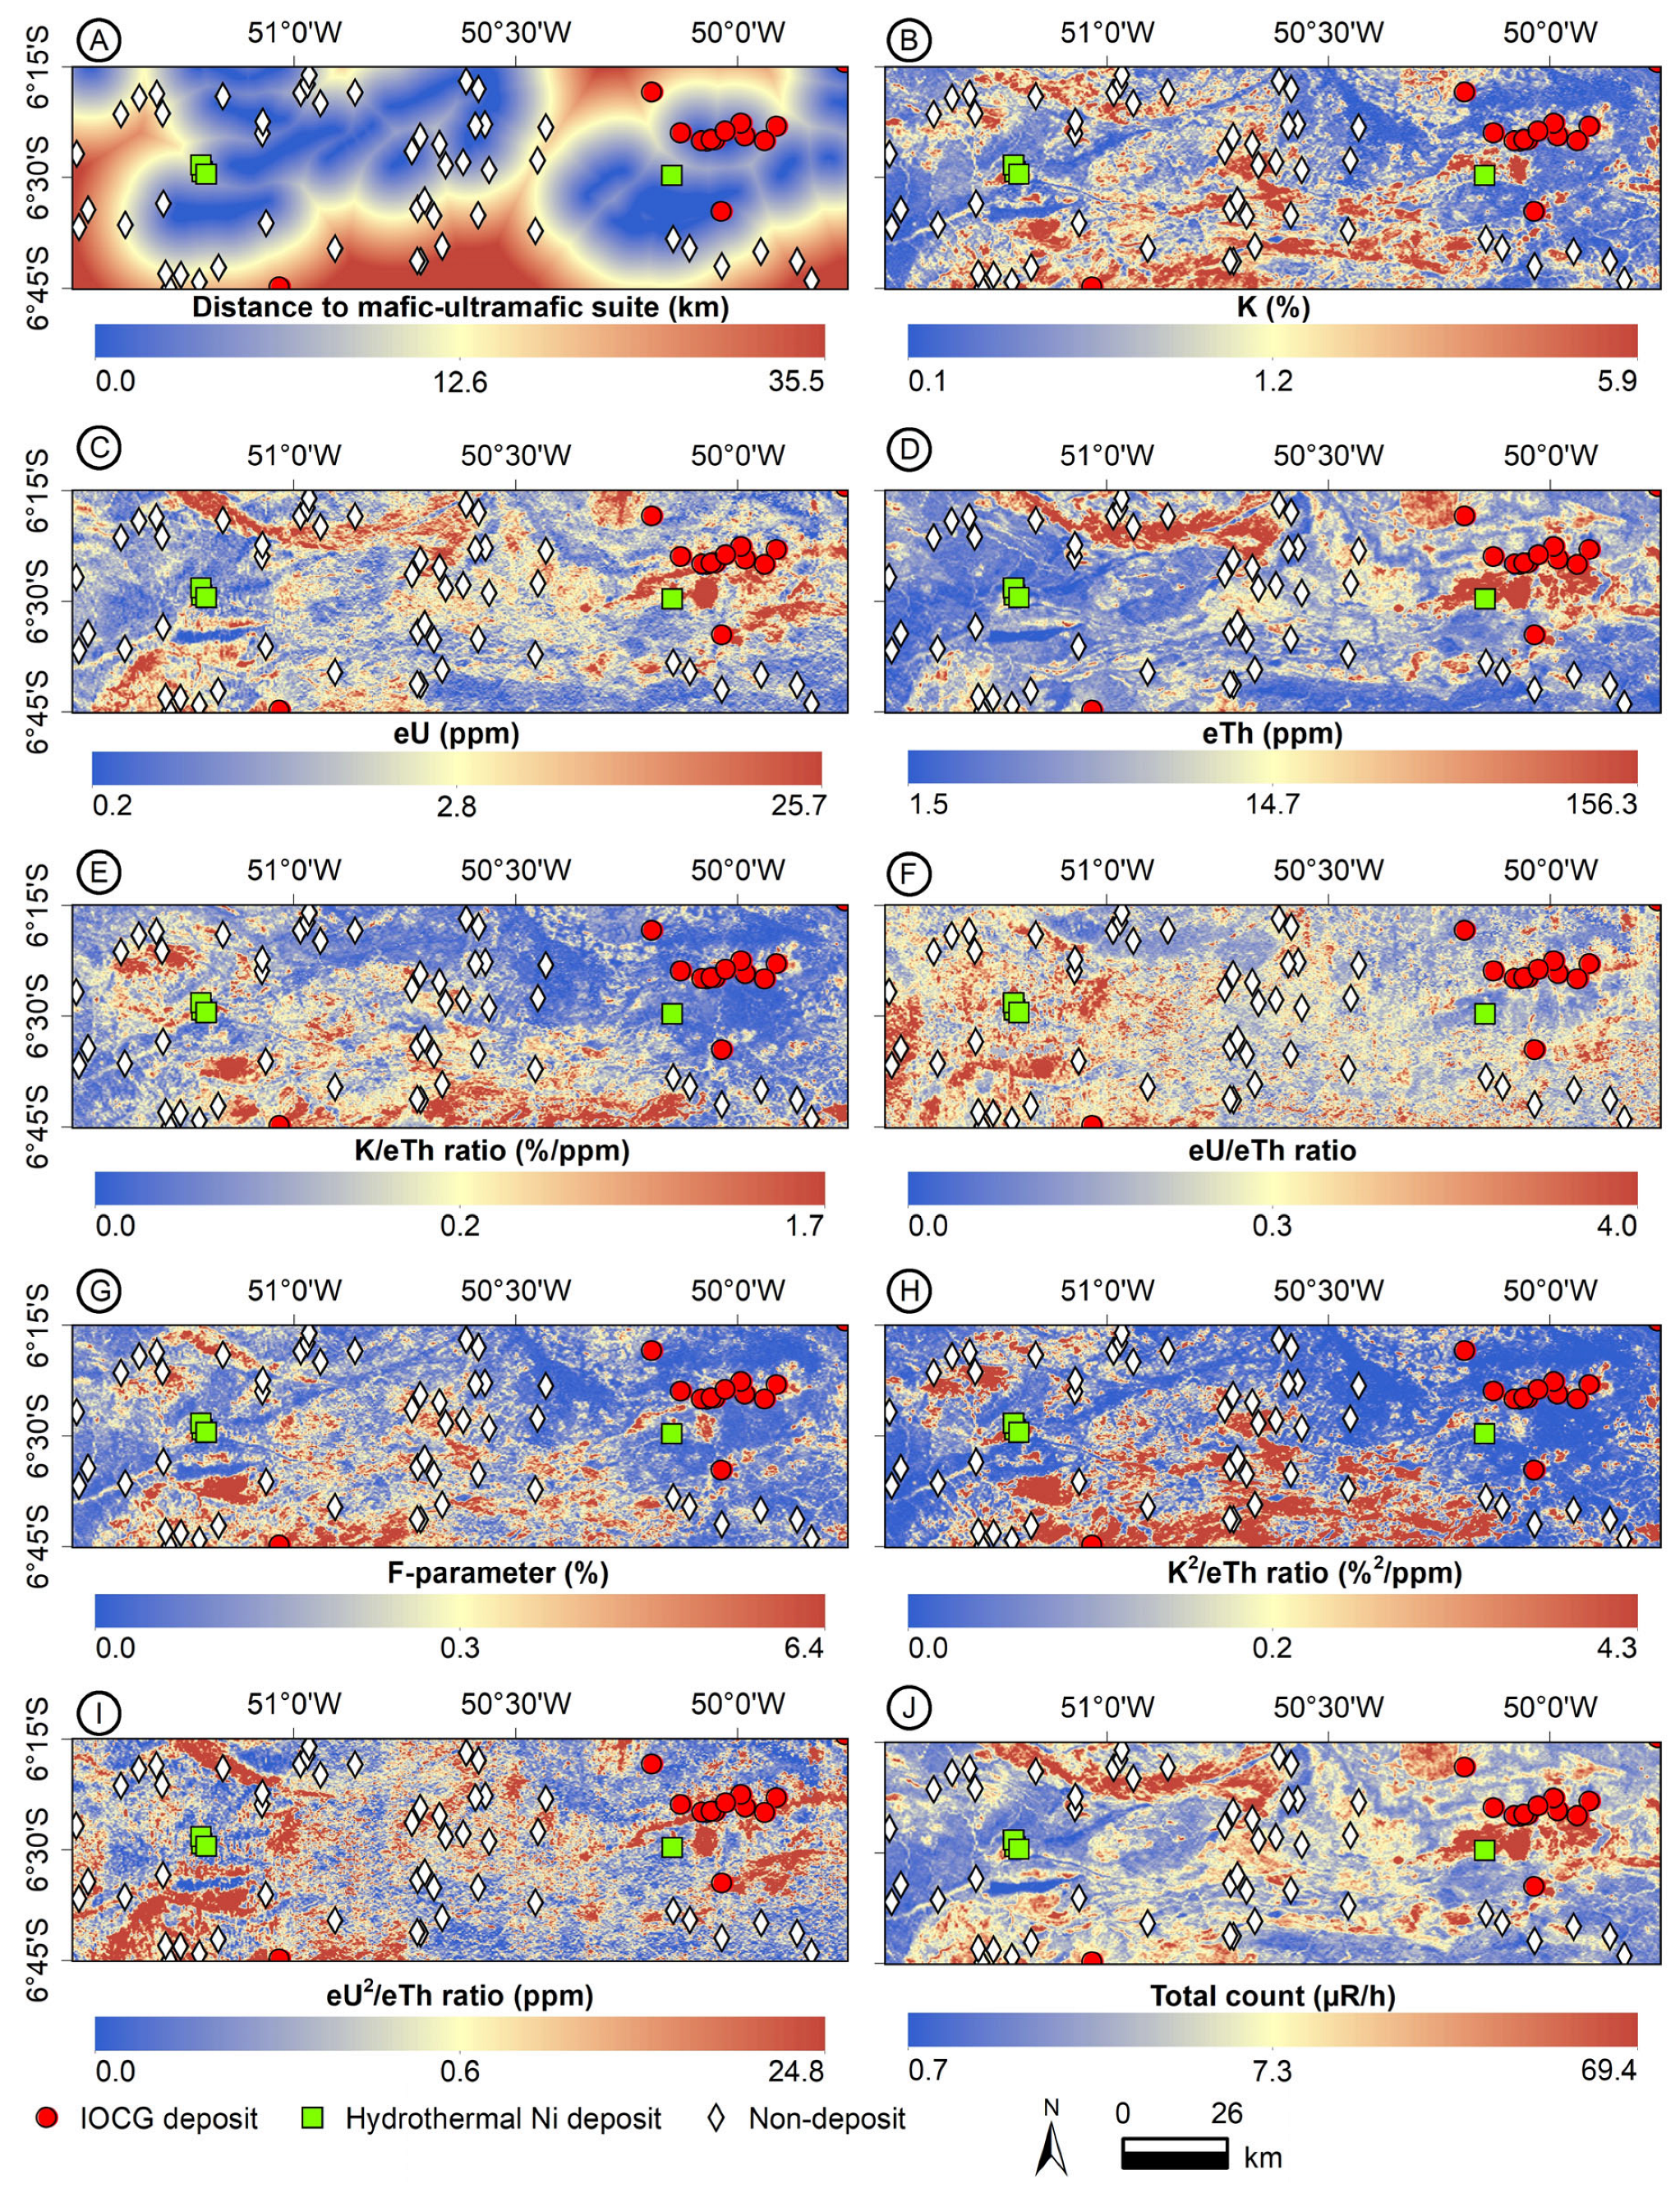
Prospectivity mapping should incorporate multiple genetic models for ore formation targets [21]. In this study, selected proxies correspond to mappable features associated with known IOCG and hydrothermal nickel deposits in the southern Carajás Domain. The workflow proposed by McCuaig et al. [69] and reviewed by Skirrow et al. [21] comprises four steps: (i) identification of ore fluid and metal sources, (ii) delineation of fluid flow pathways, (iii) identification of fluid throttle, and (iv) recognition of ore depositional gradients (Table 1). Accordingly, the exploration database is diverse and includes various geophysical and geological data (Table 1, Figure 2 and Figure 3). Magnetic and gravimetric data are used to infer structures and potential sources linked to fluid pathways and traps [21,24]. Radiometric data highlight hydrothermal alteration zones related to depositional gradient, and geological maps provide the structural and lithological framework [21,24].
The primary metal sources in IOCG and hydrothermal nickel systems are attributed to the metasomatized subcontinental lithospheric mantle (SCLM) and leaching from volcanic and mafic–ultramafic rocks [51,62,70]. Metavolcano–sedimentary units are the main hosts of mineralization and may have provided the initial copper source, with hydrothermal fluids leaching and transporting Cu from these rocks. Likewise, hydrothermal remobilization of metals from mafic–ultramafic intrusion likely contributed to chalcophile and siderophile enrichment in Carajás hydrothermal deposits [51,62]. The occurrence of massive sulfide ore and evidence of remobilization in the Luanga Suite support this interpretation [62,71].
In the Carajás Province, regional shear zones juxtaposing Mesoarchean granite-gneiss, greenstone belts, and Neoarchean metavolcanic–sedimentary sequences may represent inherited translithospheric structures that controlled SCLM metasomatism [24,72]. Likewise, contacts between Archean and Paleoproterozoic granites likely represent metal-enriched zones, spatially correlated with IOCG and hydrothermal nickel mineralization [24,73].
Fluid inclusions and stable isotope data indicate that IOCG ore-forming fluids evolved through unmixing of high-temperature, hypersaline (NaCl-CaCl2-CO2) magmatic–hydrothermal fluids and mixing with surface-derived fluids [52,55,56,74,75]. The magmatic fluids may have originated from partial melting of metasomatized mantle and, subordinately, from exsolution during crystallization of the Neoarchean magmatic units (e.g., A2-type granite, shallow gabbro). Fluorine-rich fluids exsolved from Paleoproterozoic A1-type granites may have contributed to younger IOCG deposits, which show a granitophile signature [54,58,76]. These granites, of alkaline affinity, formed by the partial melting of deep Archean crustal sources ([48] and references therein), and their contribution may also be extended to hydrothermal nickel deposits.
Therefore, distances to contacts among Mesoarchean, Neoarchean, and Paleoproterozoic units (geochronological contacts), as well as volcanic, granitic, and mafic–ultramafic rocks, were used as a criteria in the MPM. A similar approach was applied by Oliveira et al. [77] in the Northern Copper Belt.
Proxies for active pathways include crustal framework structures such as gravity and magnetic lineaments (Table 1). These lineaments, interpreted as deep-to-shallow-seated crustal discontinuities [23,24,77,78,79,80], focus and localize mineralized fluid flow [21]. Long-wavelength gradients are typically associated with deep sources, whereas short-wavelength gradients generally correspond to shallower crustal sources [81]. To assess these structures at different depths, magnetic and gravimetric lineaments were used as proxies (Figure 2D–E).
Fault, shear zone, and morpholineaments were used as criteria for physical throttling of hydrothermal fluids (Table 1). These include mapped and interpreted surface structures that likely acted as conduits, enabling basinal and surface-derived fluids to infiltrate structural weakness and ascend to shallower crustal levels [23]. Mapped structures from Costa et al. [33], including faults, fractures, and shear zones, were incorporated in the MPM. Morpholineaments, interpreted from hillshade topography data, represent linear features associated with structural discontinuities [82,83].
Magnetic and gamma-ray spectrometric data (Table 1) were used as proxies to map zones with anomalous K, U, and magnetic minerals associated with Cu-Au and Ni mineralization [6,24]. IOCG and hydrothermal nickel deposits can display a wide range of physical properties and mineral assemblages, often resulting from intense hydrothermal alteration [51,62,84]. Their geophysical response is controlled by (i) the relative proportions of magnetic (i.e., magnetite) and non-magnetic (i.e., pyrite) minerals, (ii) textures, and (iii) depth of mineralization [85,86].

4.2. Dataset

Geophysical data comprises airborne gamma-ray spectrometric, magnetometric, and gravity surveys provided by the Geological Survey of Brazil (GSB, https://geosgb.sgb.gov.br/ (accessed on 10 May 2025)). Gamma-ray spectrometry and magnetometry include three surveys provided: Oeste de Carajás (1125), Rio Maria (1129), and Tucuruí (1097) [87,88,89,90]. These were conducted and pre-processed by LASA Prospecções S/A between June 2014 and June 2015 (Oeste de Carajás), January 2014 and November 2014 (Rio Maria), and April and July 2010 (Tucuruí). Flight lines were spaced 500 m apart (N–S) with 10 km tie lines (E–W) and a terrain clearance of 100 m. Magnetometry used a Scintrex CS-3 (10 Hz, 0.001 nT resolution), while gamma ray data were collected with a 256-channel Exploranium GR-820 and Pico Envirotec GRS 410 (1 Hz). Aircraft speed averaged 266 km/h, yielding measurements every 7.4 m (magnetometry) and 74 m (gamma-ray). Magnetic data corrections included parallax diurnal variation, International Geomagnetic Reference Field (IGRF) removal, leveling, and micro-leveling. Gamma-ray corrections included dead time, background removal (aircraft, cosmic, atmospheric radon), height, Compton effect, and conversion to elemental concentrations [87,88,89].
Gravity data are from the airborne Carajás gravimetric survey (Project 1123) [91]. N–S flight lines were spaced 3 km apart, with E–W control lines at 12 km. Mean sensor clearance was 900 m above the surface. Two fixed-wing aircraft were used: the western portion was surveyed with a GT-2A gravimeter aboard the PR-FAS aircraft at 275 km/h, and the eastern portion with a GSS3 Graviton-M aboard the PP-AGP at 274 km/h. Measurements were restored every 0.1 and 0.5 s. The used data were corrected for latitude, free air, Eötvös, dynamic acceleration, and Bouguer effects [91].
Data were interpolated with the minimum curvature technique [92] on regular grids of 100 m (magnetometry and gamma-ray) and 600 m (gravimetry) using Geosoft Oasis Montaj 2025.1. Gamma-ray spectrometry data were merged with the grid leveling method of Minty [93], which estimates a base-level shift and scaling factor to align grids to the same absolute level.
Topographic data came from the Brazilian National Institute for Spatial Research’s Topodata (INPE’s Topodata database), derived from refined SRTM (Shuttle Radar Topography Mission) data resampled from 3 arcseconds (~90 m) to 1 arcsecond (~30 m) using geostatistical interpolation [94]. The database is freely available from INPE (http://www.dsr.inpe.br/topodata/ (Accessed on 17 October 2025)).

4.2.1. Gamma-Ray Spectrometry Techniques

Gamma-ray spectrometry data include potassium (K), equivalent uranium (eU), and equivalent thorium (eTh), which display distinct geochemical behavior [95,96]. Potassium and eU enrichment are mainly linked to hydrothermal alteration [95,96], while weathering in tropical and subtropical climates may cause K absorption on clays [96]. Among these radioelements, K is the most mobile, whereas eTh is generally immobile in hydrothermal fluids [95,97].
Radiometric grids (K, eU, eTh) contain negative values that can obscure ratio grids; therefore, values below mean/10 reset to that threshold. Ratio grids enhance geochemical contrasts and reduce environmental artifacts from vegetation and soil moisture [96]. Hydrothermal alteration zones, which enriched K, eU, Fe, and other elements [98], can thus be mapped using radiometric ratios such as K/eTh, K2/eTh, eU/eTh, and the F-parameter [99]. The F-parameter (F = K·eU/eTh) is a robust geochemical index for mapping hydrothermal alteration. It highlights altered areas by comparing K and eU enrichment relative to the eTh/eU and eTh/K ratios [100].

4.2.2. Magnetic and Gravimetric Technique

The Total Gradient Amplitude (TGA) was derived from the total magnetic intensity to centralize anomaly values above their source [101]. This method is widely used in low-latitude regions where reduction to the pole is unstable, such as the Amazonian Craton [86].
A 5000 m upward continuation filter was applied to the total magnetic field and Bouguer anomaly before edge detection to suppress shallow signals and highlight deeper sources and structures [102].
Geologic contacts and structures were then mapped using magnetic and gravimetric data with edge detection techniques. Vertical and horizontal derivatives enhanced responses from both shallow and deep sources [103].
Among these, the Logistics Horizontal Gradient (LTHG) method [104] was applied to delineate magnetic and gravimetric lineaments. LTHG applies a logistic function to the first-order derivative of the total horizontal gradient, equalizing shallow and deep anomalies and maximizing amplitudes along body margins. Even in noisy data or complex settings, it outperforms other methods in edge identification and border definition [104].

4.2.3. Morpholineament

Morpholineaments are linear to slightly curvilinear geomorphological features, reflecting geological structures such as foliation, contact, fault, shear zone, and fold [82,83,105,106]. They are mapped in ArcMap following the procedure of Domingos [80] and Dutra et al. [23], using four hillshade maps derived from SRTM data with a vertical exaggeration factor of 15 and azimuths of 0°, 60°, 90°, and 330°. These illumination angles were selected to be orthogonal to the dominant regional structural trends. Interpretation emphasized major regional topographic features, including valleys, ridgelines, and drainage patterns.

4.2.4. Spatial Orientation of Lineament and Structure

Previous studies in the Carajás Province show that mineralization controls vary with structural azimuth [23,80,107]. Accordingly, structural data (shear zone and fault) from Costa et al. [33] and lineaments (morpholineament, magnetic, and gravimetric lineament) were grouped into four orientations: N–S, NE–SW, E–W, and NW–SE. This classification was used to evaluate the relative importance of each set and to refine prediction models.

5. Pre-Processing Analysis

Pre-processing included data organization and cleaning, feature normalization, dataset sampling, and oversampling. Data were normalized with the z-score method to ensure equal contribution of variables and avoid instability [108,109].

5.1. Spatial Data Input

The spatial dataset includes potential-field, radiometric, geological, and morpholineament data pre-processed in QGIS 3.36.1-Maidenhead, Geosoft Oasis Montaj 2025.1, and Python 3.13.9 libraries to extract proxy variables and structure information (Figure 2 and Figure 3).
Before integrating geological data and interpreted lineaments (magnetic, gravimetric, and morpholineament), categorical features were converted to continuous variables using Euclidean distance. This approach improves prospectivity model performance and reduces uncertainties from discretizing evidential maps [110].
Geological features, including contacts, faults, shear zones, volcanic rocks, mafic–ultramafic suites, and A1- and A2-type granites, were extracted from the geological map and rasterized with Euclidean distance. In the resulting rasters, pixels inside lithological units were set to zero, increasing with distance from the source feature (Figure 2 and Figure 3).

5.2. Data Balancing Based on Augmentation with Synthetic Oversampling Technique

In the Southern Copper Belt, twelve IOCG deposits and four hydrothermal nickel deposits are known. Some occur in close proximity, potentially producing similar values at data resolution. To reduce redundancy, the Pista and Baiano orebodies of the Sossego IOCG complex were excluded from the training dataset.
Mineral prospectivity mapping typically involves far fewer mineralized sites than non-mineralized ones. Such an imbalance can bias MLA models and reduce their ability to detect valuable targets. To improve classification, SMOTE (Synthetic Minority Oversampling Technique) was applied to generate synthetic IOCG and hydrothermal nickel data [8,24,110,111] using Python package imbalanced-learn [112]. This method is widely adopted in mineral prospectivity studies [24].
The distribution and similarity between the original and synthetic datasets were assessed using dimensionality reduction techniques (Principal Component Analysis and t-Distributed Stochastic Neighbor Embedding). Results indicate that the synthetic samples generated by SMOTE preserve the global variance structure of the original deposits while maintaining strong local proximity to their real counterparts. Thus, the data balancing procedure did not distort the underlying structure but rather acted as a local extension of the dataset. A more detailed discussion of these analyses, along with illustrative figures, is provided in the Supplementary Material.

5.3. Data Partition

The training–test dataset comprised mineralized and non-mineralized samples. Non-mineralized samples were randomly selected from regional data, at least 12.5 km from known deposits, following Prado et al. [24]. To address class imbalance and reduce overfitting [24], SMOTE was applied to generate 50 samples per class (non-deposit, IOCG deposit, and hydrothermal nickel deposit). The dataset combined 50 randomly selected non-deposit samples with known deposits (10 IOCG and 4 hydrothermal nickel) plus synthetic samples (40 for IOCG deposits and 46 for hydrothermal nickel deposits) to balance class size. The final dataset was split into training (35 samples per class) and testing (15 samples per class) sets using a fixed random seed for reproducibility.

5.4. Exploration Data Analysis

Exploratory data analysis used boxplots and the Pearson correlation coefficient (ρ) to identify patterns and relationships among parameters [113]. Box-and-whisker diagrams show that the most relevant parameters to differentiate mineralized from non-mineralized areas are Bouguer anomaly, TGA, eU, eU/eTh ratio, F-parameter, eU2/eTh ratio, distance to geochronological contact, magnetic lineaments, faults, and distance to volcanic units (Figure 4).
The IOCG deposits show the highest average values for most selected parameters, notably Bouguer anomaly (−24.2 mGal), TGA (1.6 mT/m), eU (4.2 ppm), and distance to NE–SW gravimetric lineament (19.4 km), E–W magnetic lineaments (5.7 km), NW–SE magnetic lineaments (32.1 km), and NE–SW faults (13.8 km, Figure 4). Hydrothermal nickel deposits have a higher average for distance to geochronological contact (5.8 km) and NW–SE faults (16.6 km), and the lowest average distance to NW–SE shear zones (9.1 km, Figure 4). Both IOCG and hydrothermal nickel deposits recorded the shortest distances to E–W faults, 7.0 km and 6.0 km, respectively, compared to 30.2 km for non-deposit samples (Figure 4).
The Pearson correlation matrix indicates that most parameters are independent, with low correlations (ρ ≤ 0.30, Figure 5). Radiometric features, however, display stronger interdependence (ρ = 0.52 to 0.94). Because highly correlated variables (ρ > 0.80, p < 0.05) often represent the same information, they were excluded to avoid redundancy without reducing model performance [108,114]. Accordingly, total count (TC) and K2/eTh were removed due to strong correlations with eTh (ρ = 0.94, p < 0.001) and K/eTh ratio (ρ = 0.88, p < 0.001; Figure 5). K2/eTh also showed moderate correlations with the F-parameter (ρ = 0.77, p < 0.001) and K (ρ = 0.74, p < 0.001), supporting its exclusion (Figure 5).

6. Processing with Machine Learning Application

Machine learning was implemented in Python within JupyterLab using NumPy [115], pandas [116], scikit-learn [117], and XGBoost [118]. Data visualization employed the Python libraries matplotlib 3.10.7 [119] and Plotly 6.3.1 [120].
Seven MLA predictions were evaluated for MPM using stratified 10-fold cross-validation with shuffled data and a fixed random seed (random_state = 42). The algorithms included Logistic Regression (LR, [121]), k-Nearest Neighbors (KNN, [122]), AdaBoost (ADA, [123]), Support Vector Machine (SVM, [124]), Random Forest (RF, [125]), XGBoost (XGB, [118]), and Multilayer Perceptron (MLP, [126]). Hyperparameters for LR, KNN, and SVM were optimized via grid search, while the others used random search. Parameter values used for the grid search are summarized in Table 2.

7. Prediction Evaluation

Stratified 10-fold cross-validation randomly divides the dataset into 10 disjoint folds with roughly equal instances. In each iteration, one fold serves as the test set and the remaining nine as the training set [127,128,129]. Optimal hyperparameters were chosen based on F1 score from this procedure [24].
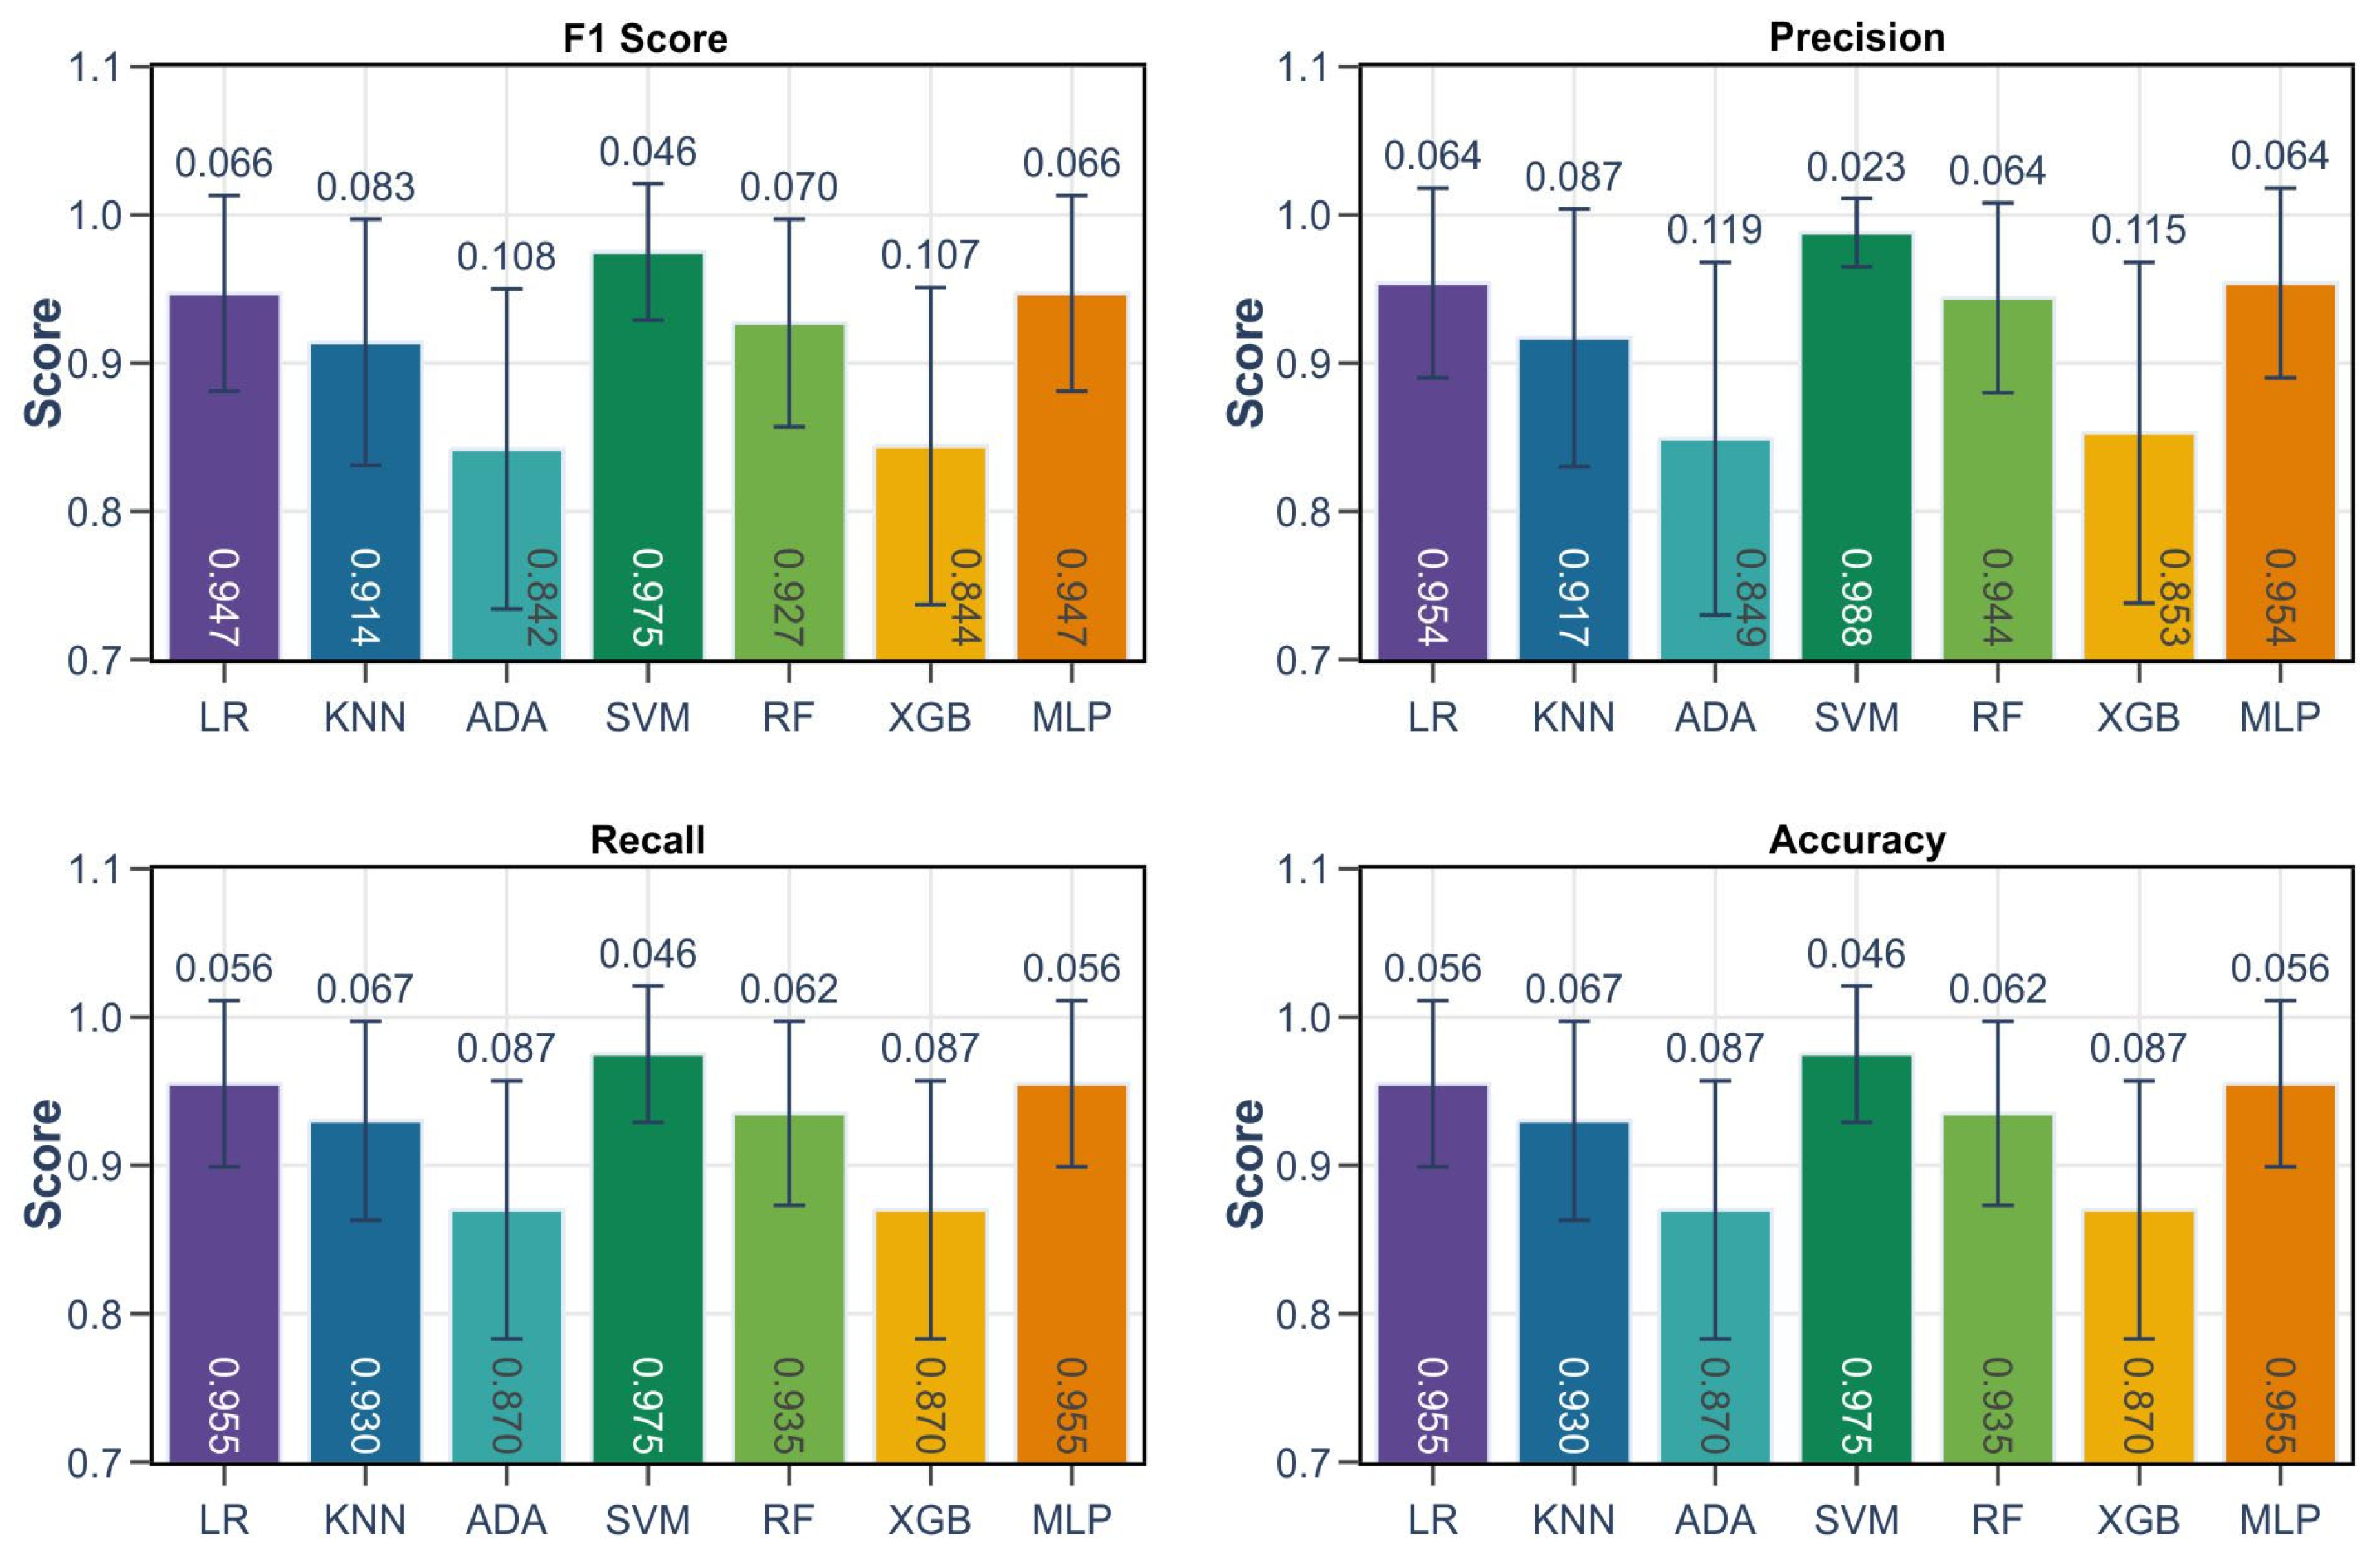
In the training data (Table 2), all algorithms achieved high scores, with several models exceeding 0.91 across all metrics. However, their performance diverged on the test set (Figure 6). Cross-validation showed that SVM outperformed all models, achieving the highest F1 scores in both training (0.991; CI = 0.017; Table 2) and test datasets (0.975; CI = 0.046; Figure 6). RF and XGB also performed strongly (training F1 > 0.980; test F1 > 0.844), while LR and KNN were moderate (training F1 > 0.919; test F1 > 0.914), and ADA had substantially lower and more variable test performance (F1 score < 0.842).
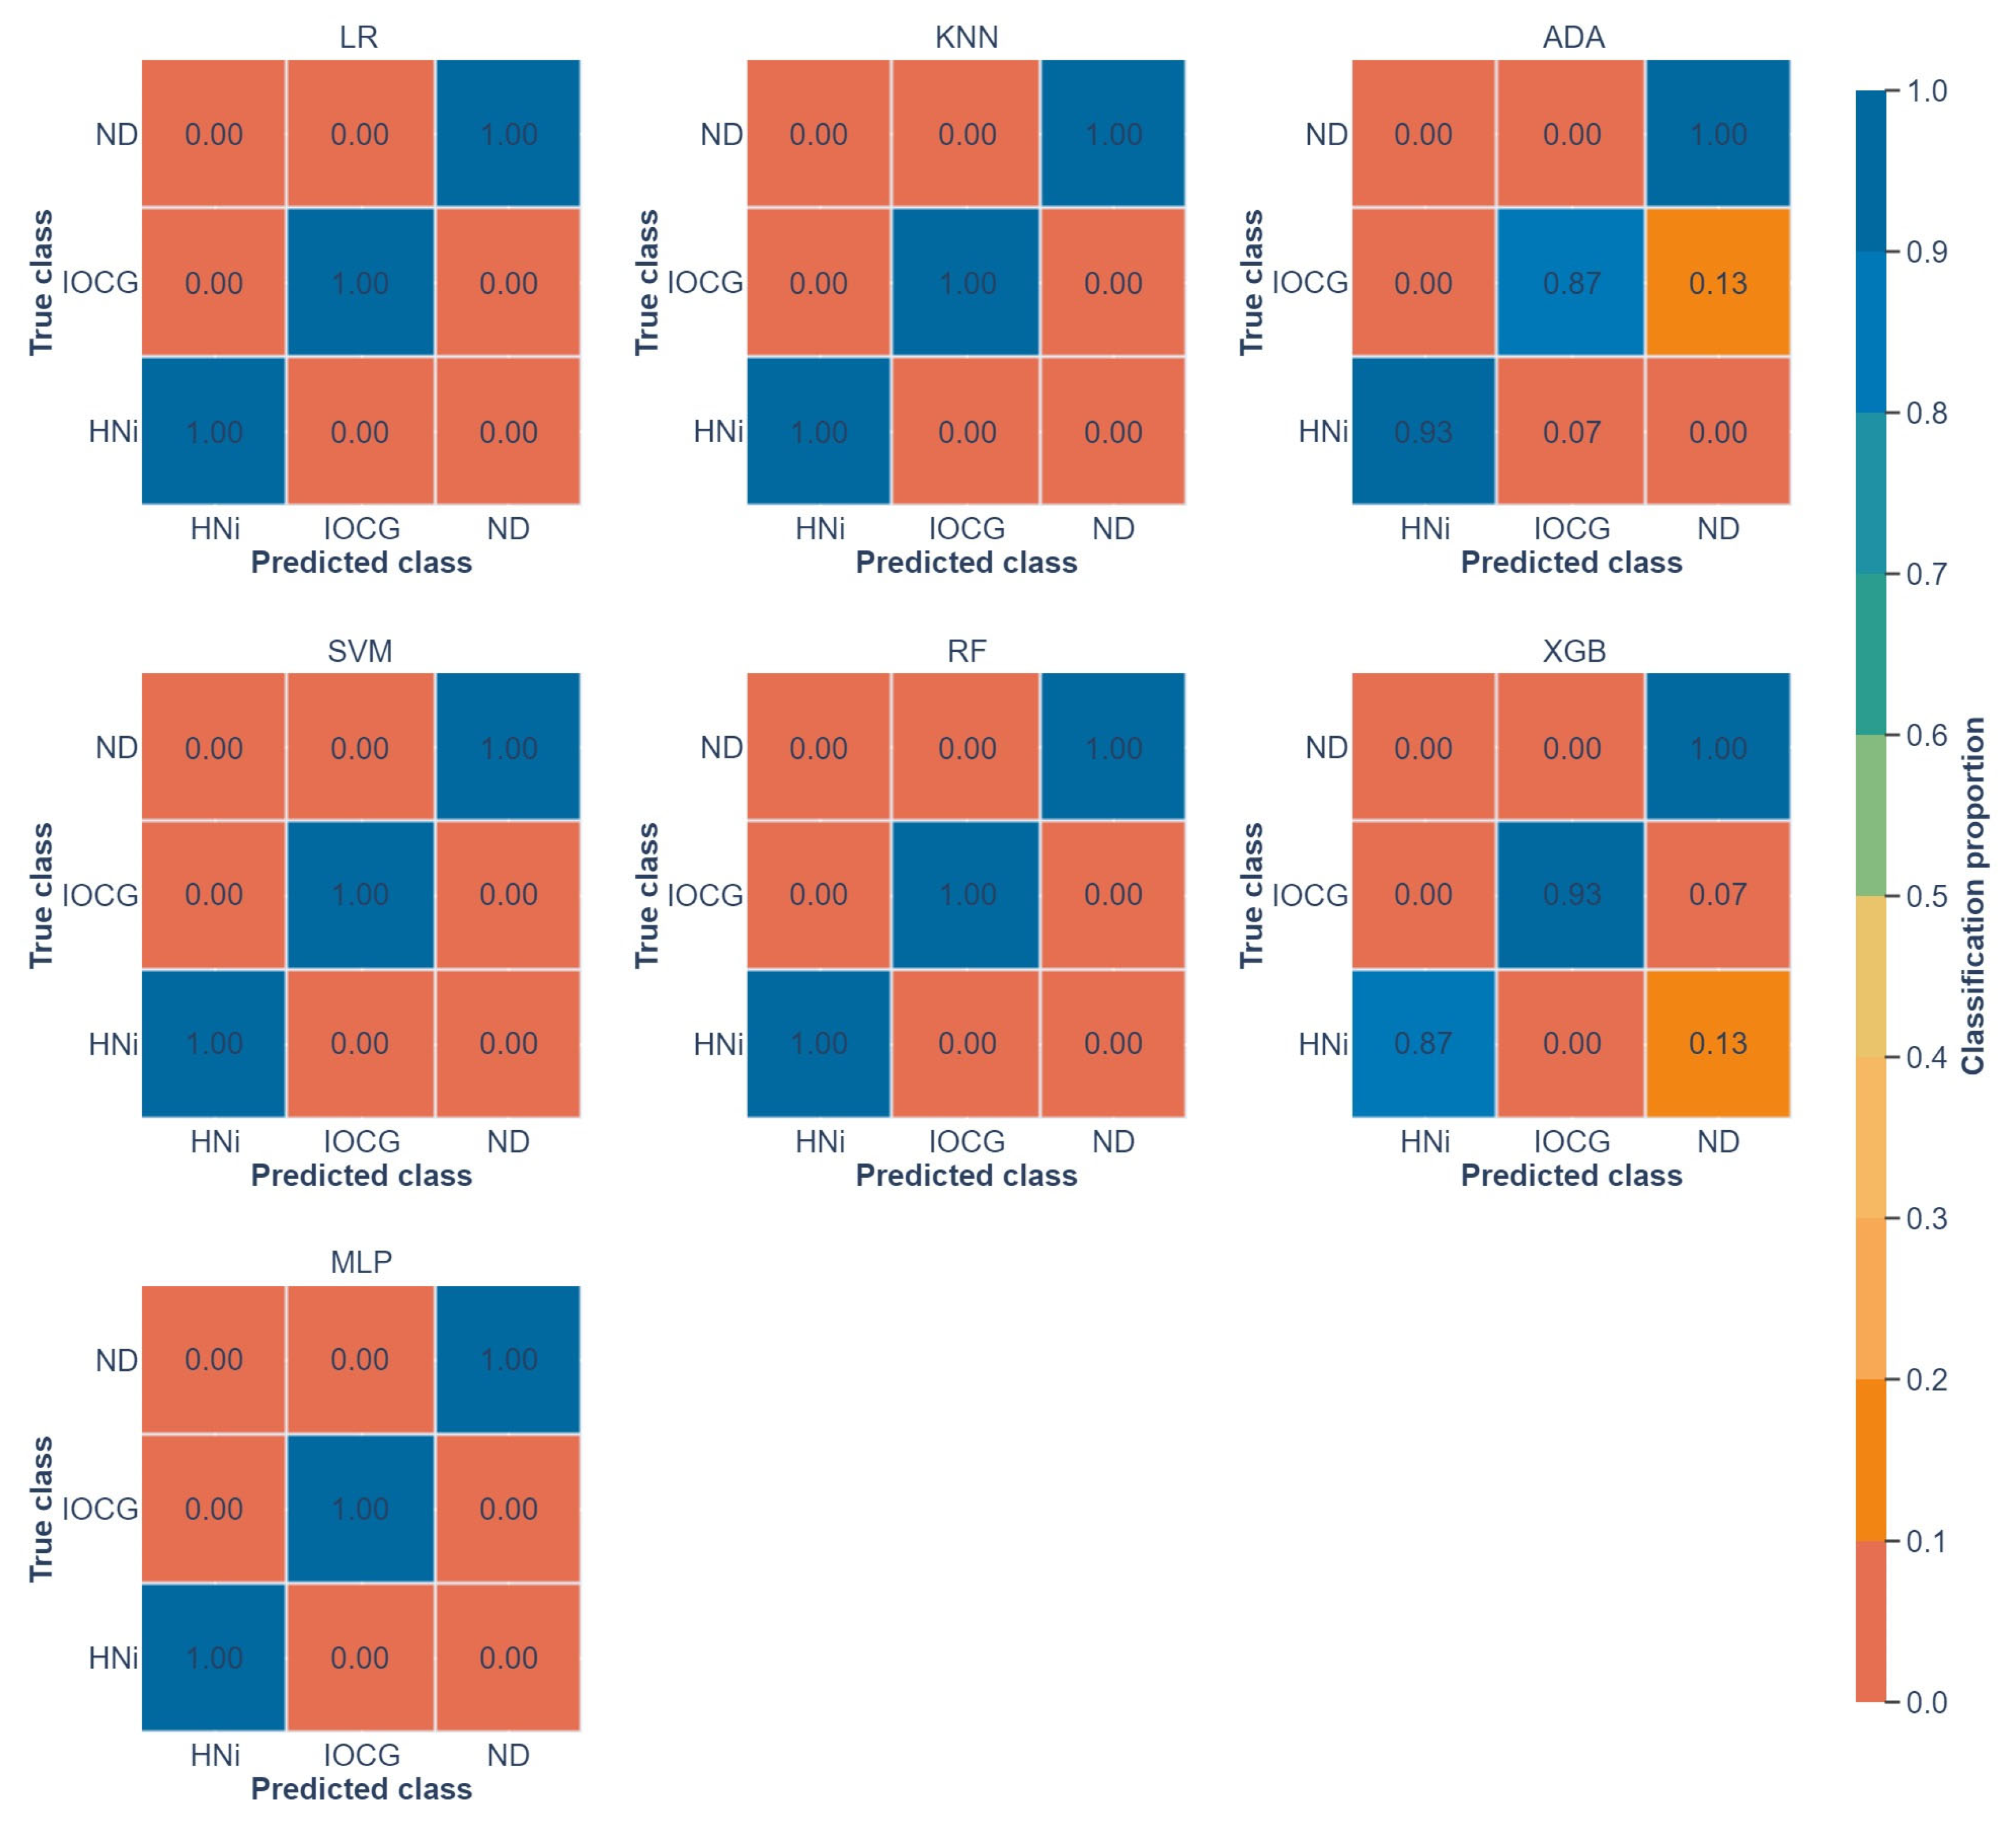
In addition to its high metrics and robustness, SVM outperformed other algorithms in reducing false negatives (i.e., missed deposits). By contrast, 7 to 13% of IOCG or hydrothermal nickel samples were misclassified as non-mineralized samples by ADA and XGB (Figure 7), producing false positives. SVM was therefore chosen for prospectivity prediction, as its superior performance (Figure 6) and low false-positive rate minimize exploration costs by reducing predictions in areas unlikely to host deposits (e.g., [130]).

8. Results

8.1. Variable Ranking

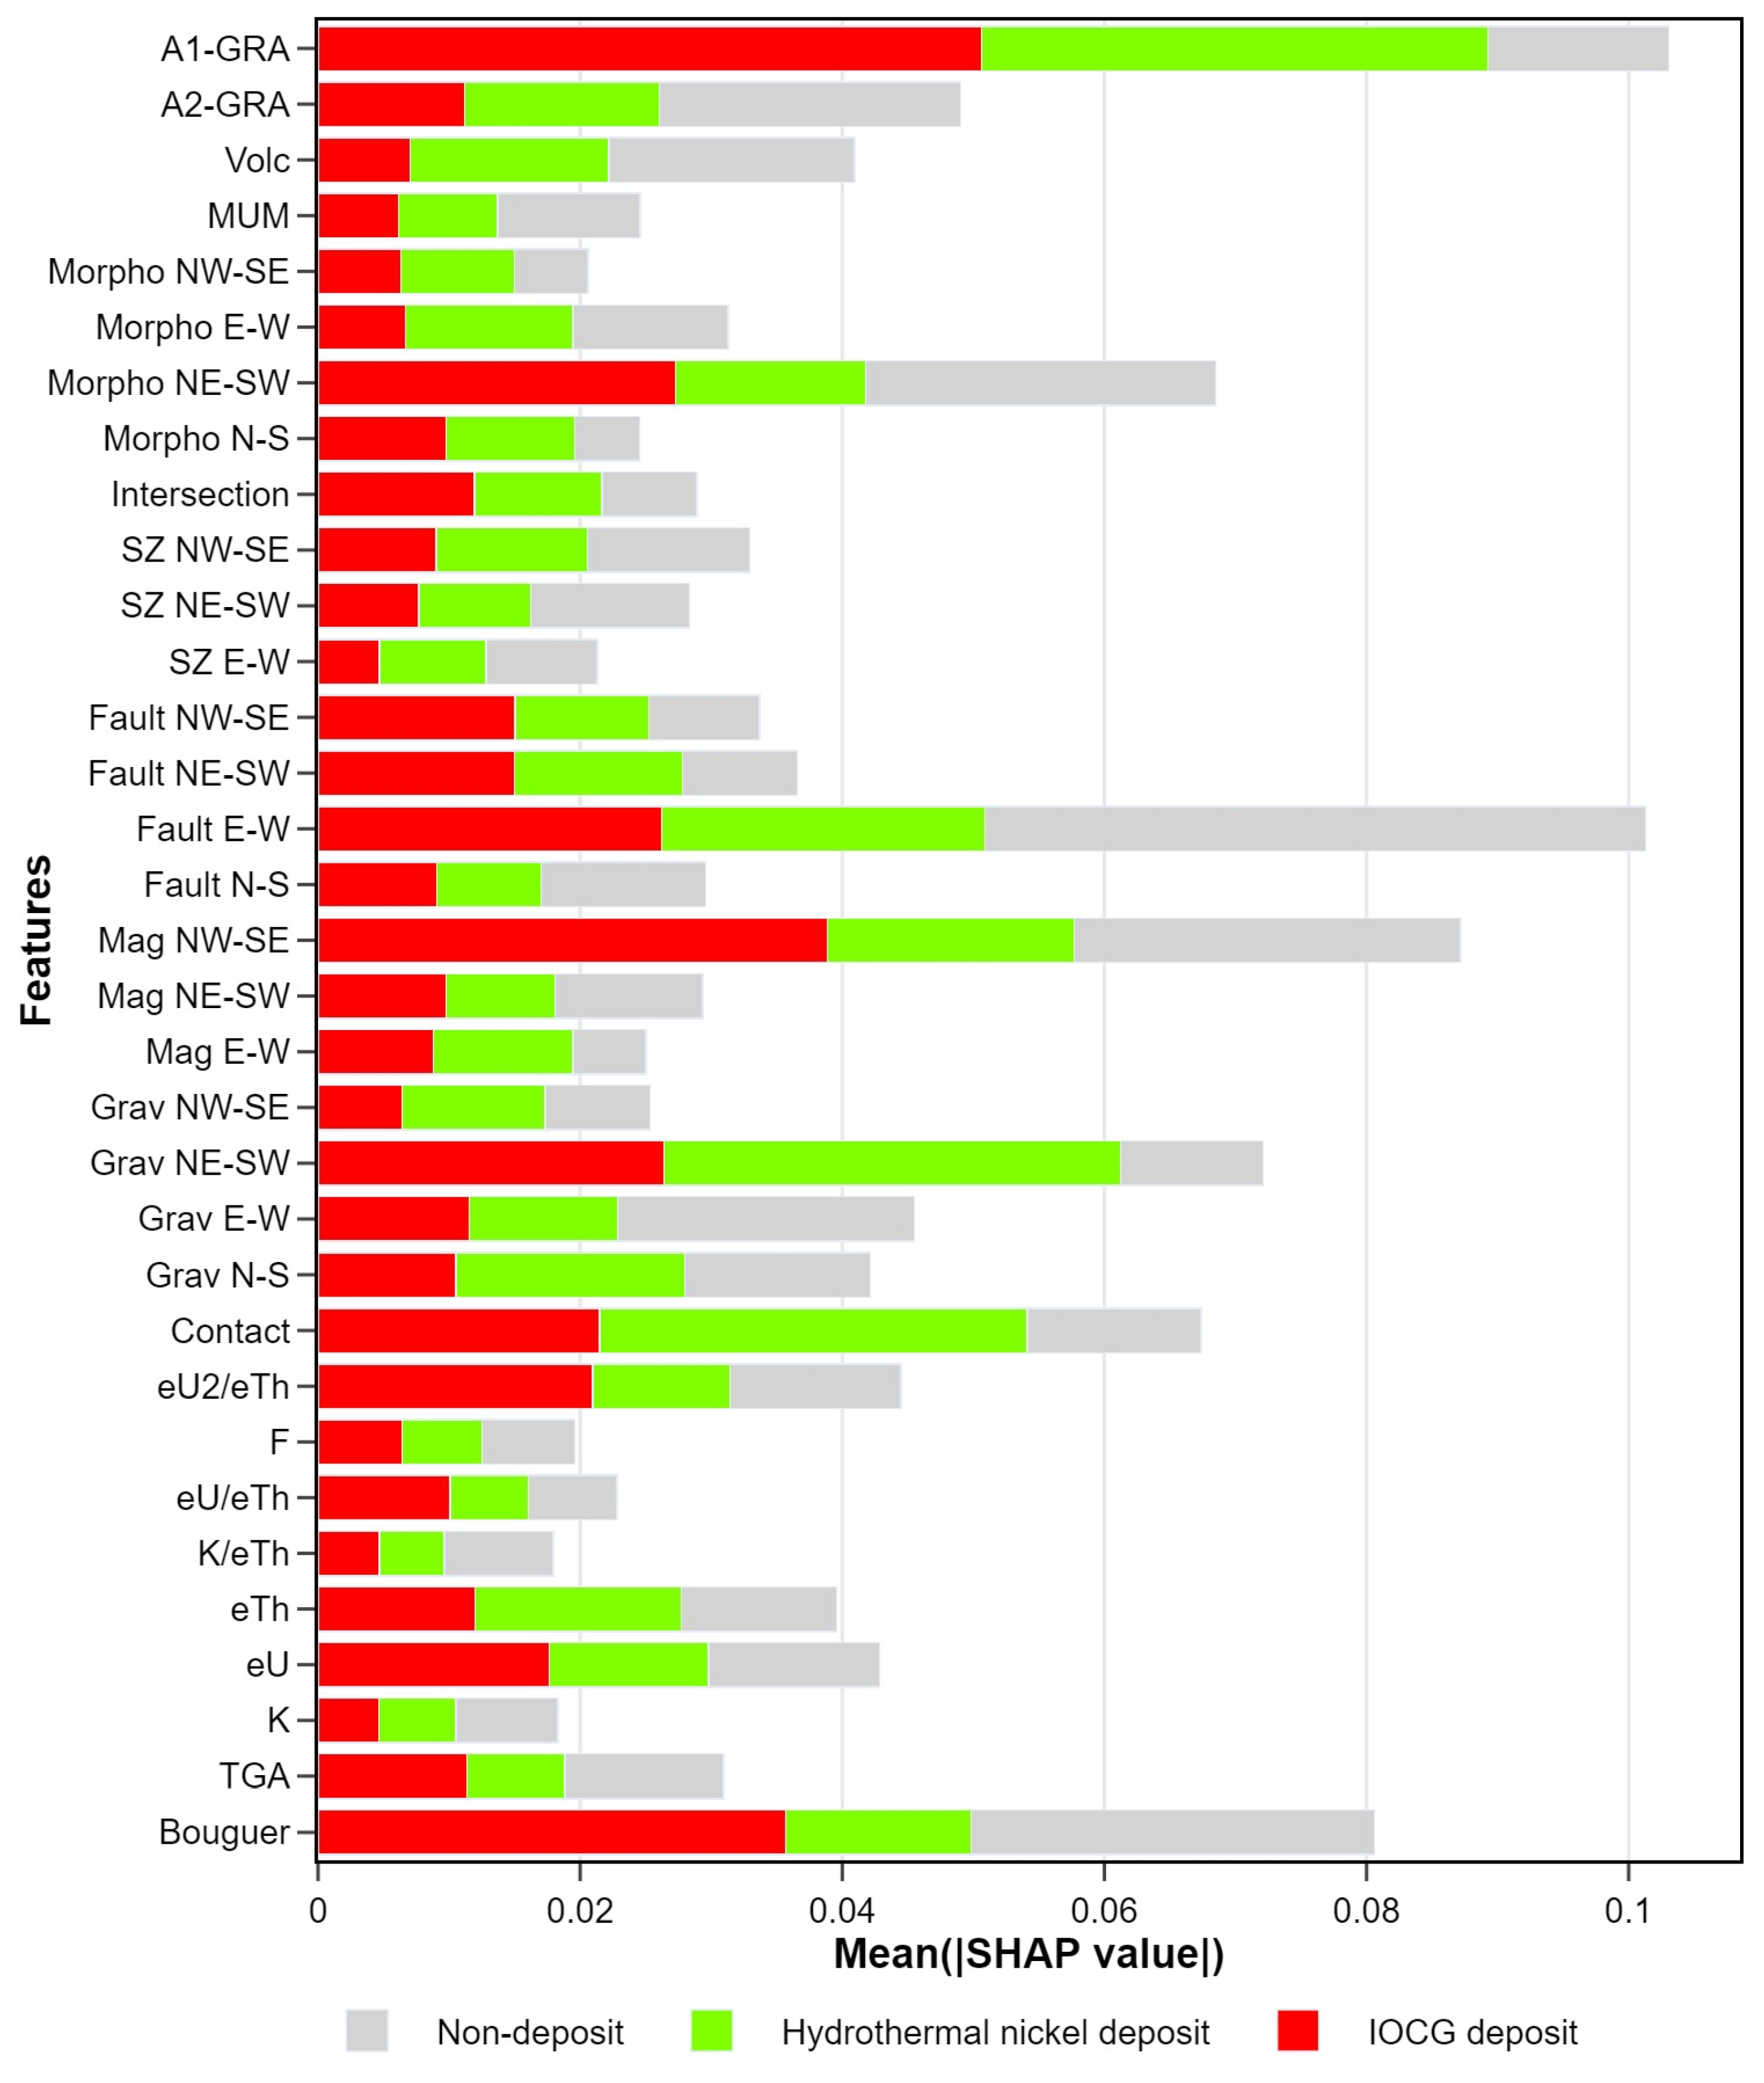
SHapley Additive ExPlanations (SHAP), where used to address the importance and impact of each feature in predictive modeling [131,132]. SHAP quantifies feature contribution for the entire dataset and for specific classes (i.e., IOCG deposit, hydrothermal nickel deposit, and non-deposit). Features were ranked by their mean absolute SHAP values, reflecting overall and class-specific importance. All metrics were calculated using the training datasets.
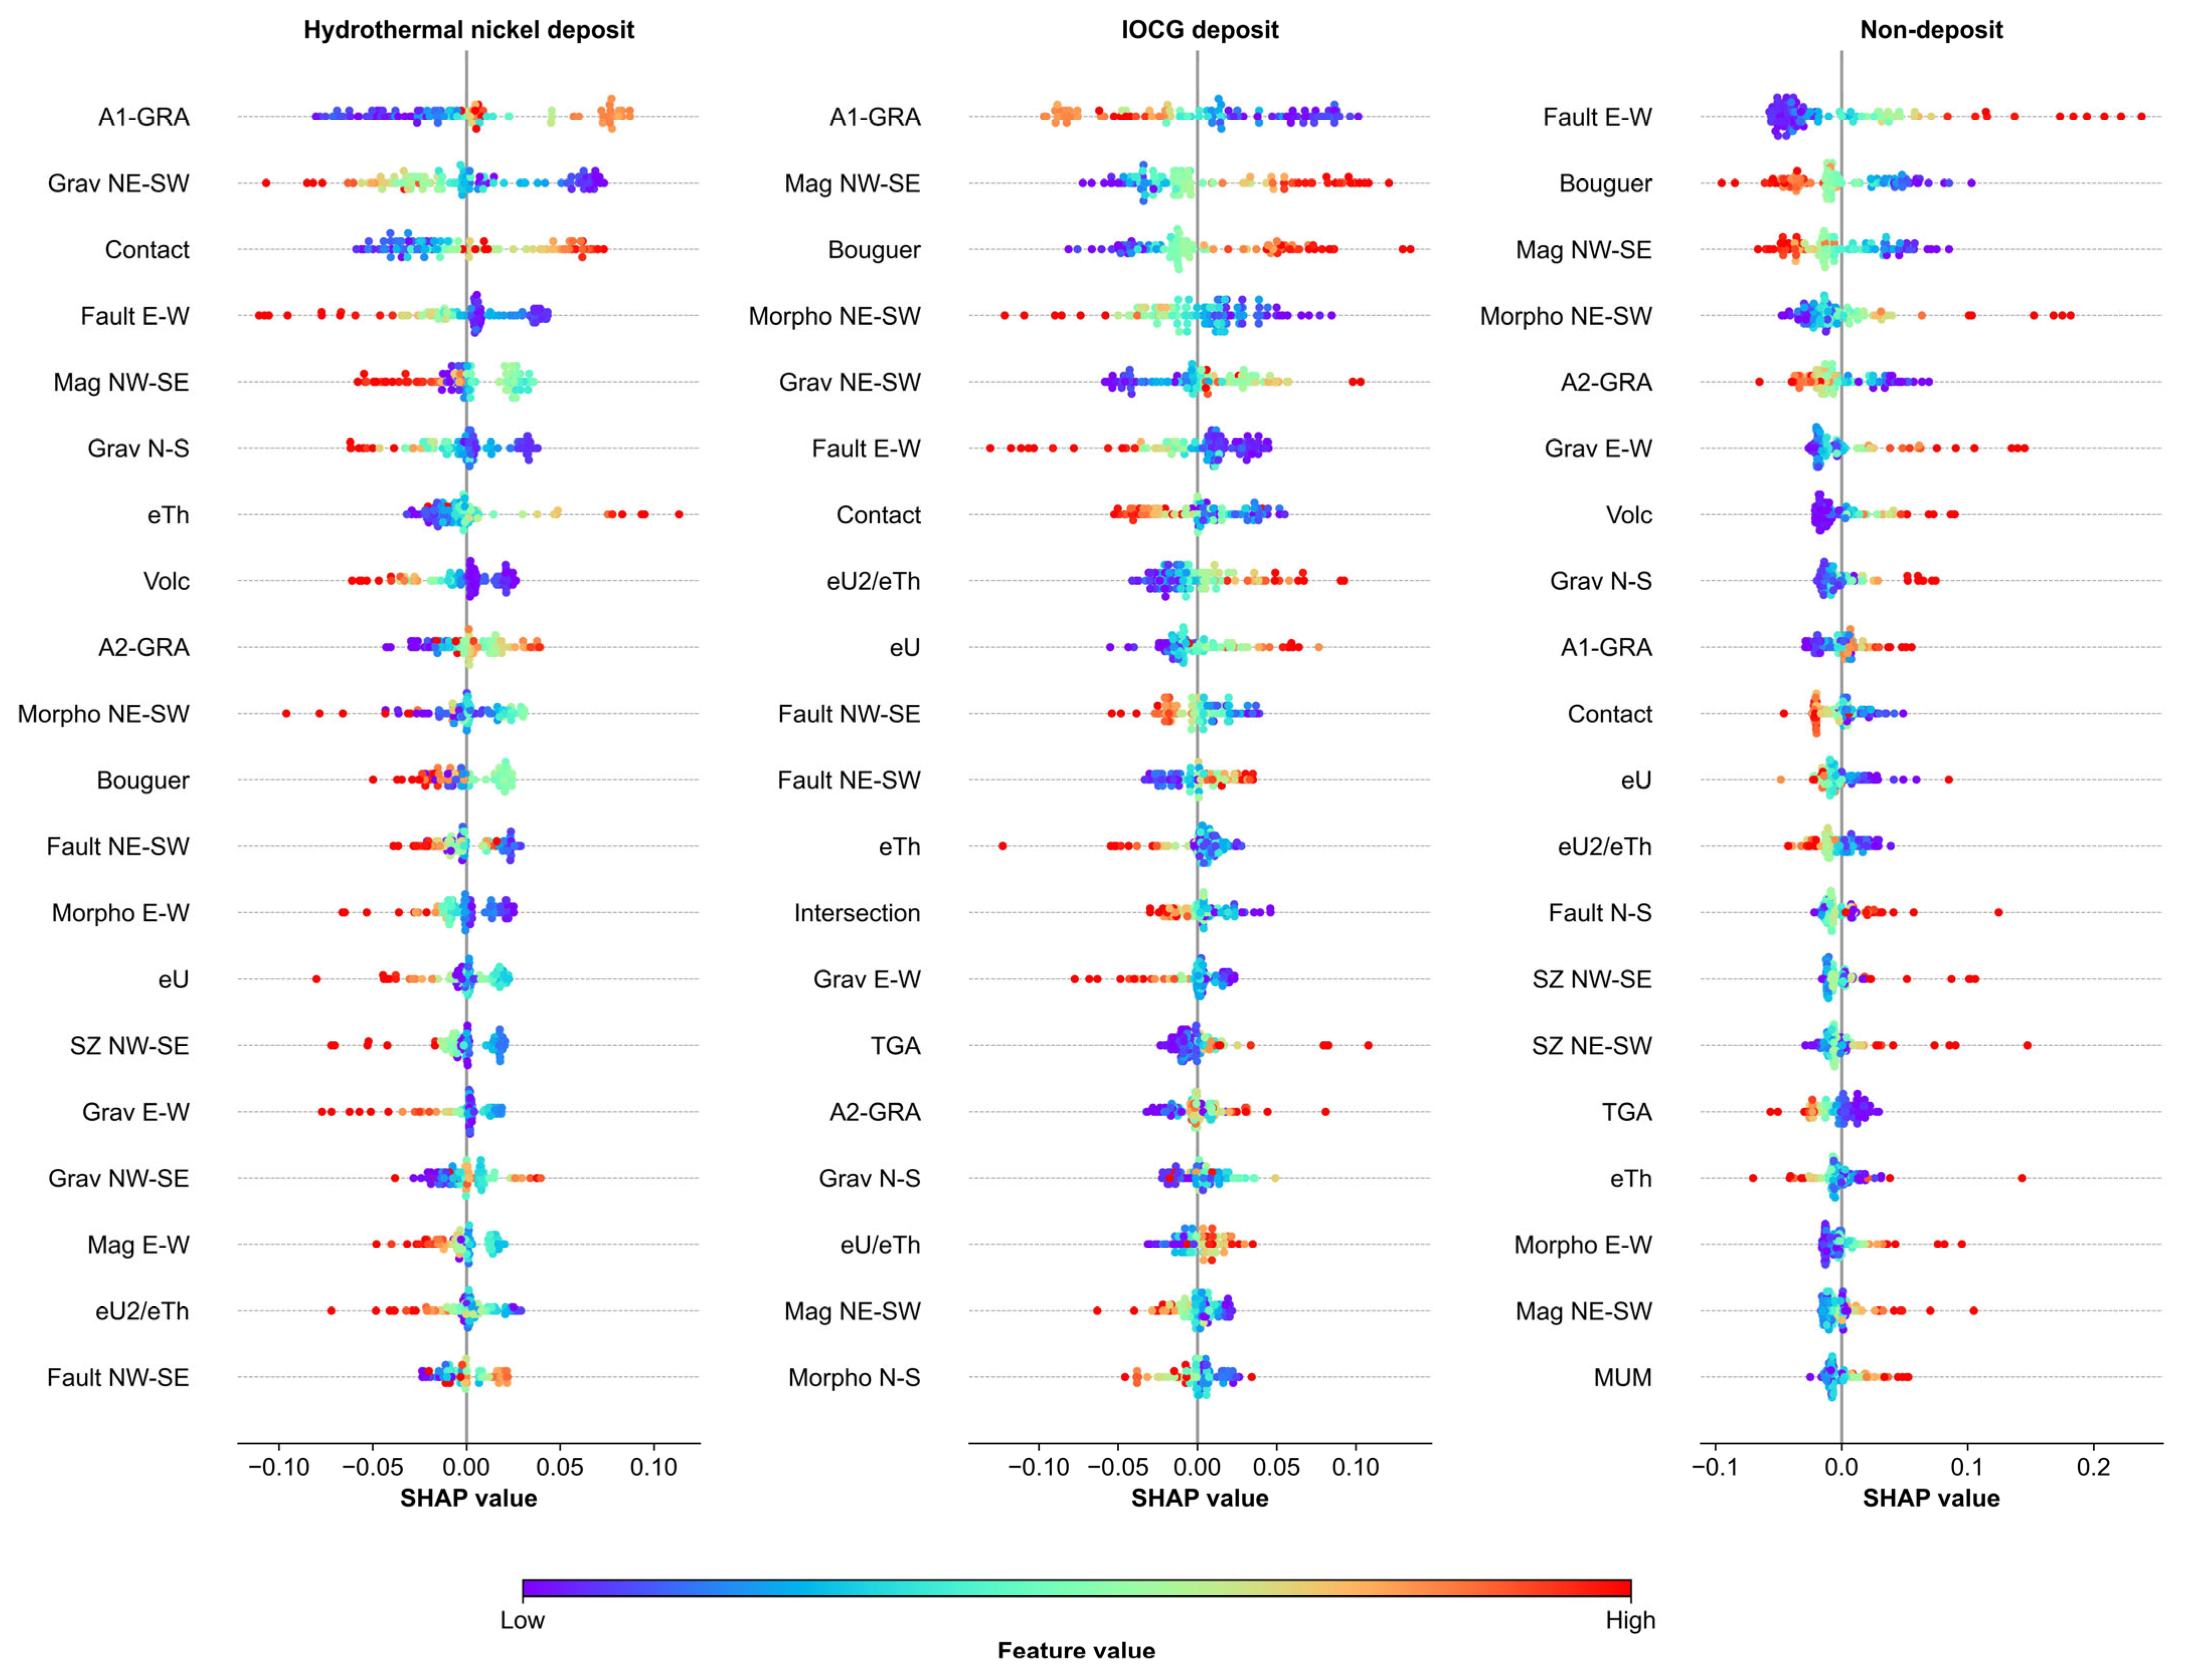
Training data were used to compute SHAP values, highlighting variable importance and their influence on SVM predictions through stratified 10-fold cross-validation (Figure 8). Results show that structural features strongly affect SVM classifications, with varying importance across classes. Key features include Bouguer anomaly, geochronological contact, NE–SW gravimetric lineaments, NW–SE magnetic lineaments, E–W faults, NE–SW morpholineaments, and A1–type granites. Radiometric features, shear zones, structural intersections, and mafic–ultramafic units generally show low importance (Figure 8).
Feature effects are summarized in Figure 9, where variables are ranked by mean absolute SHAP value, reflecting their average impact on model output. Each training sample is represented by a dot, showing its SHAP value with colors indicating feature magnitude: red = high; blue = low value; and green = average.
For the hydrothermal nickel deposits, low values (blue dots) of the NE–SW gravimetric lineament, E–W faults, and volcanic units corresponding to higher SHAP values indicate a positive contribution to predicting potential mineralization (Figure 9). In contrast, medium (green) to high (red) values generally align with negative SHAP values, suggesting a suppressive effect. High values of geochronological contact, and medium-to-high values of the A1- and A2-type granites also show positive associations with hydrothermal nickel deposits.
For IOCG deposits, SVM modeling shows that low values of geochronological contacts, A1-type granites, and E–W and NW–SE faults, along with high values of NW–SE-trending magnetic lineaments and Bouguer anomaly, are positively linked to SHAP values (Figure 9). For non-deposit samples, high values of E–W faults, NE–SW morpholineaments, volcanic units, and E–W gravimetric lineaments, together with low values of Bouguer anomaly and NW–SE magnetic lineaments, contribute positively to their classifications (Figure 9).

8.2. Mineral Prospectivity Map

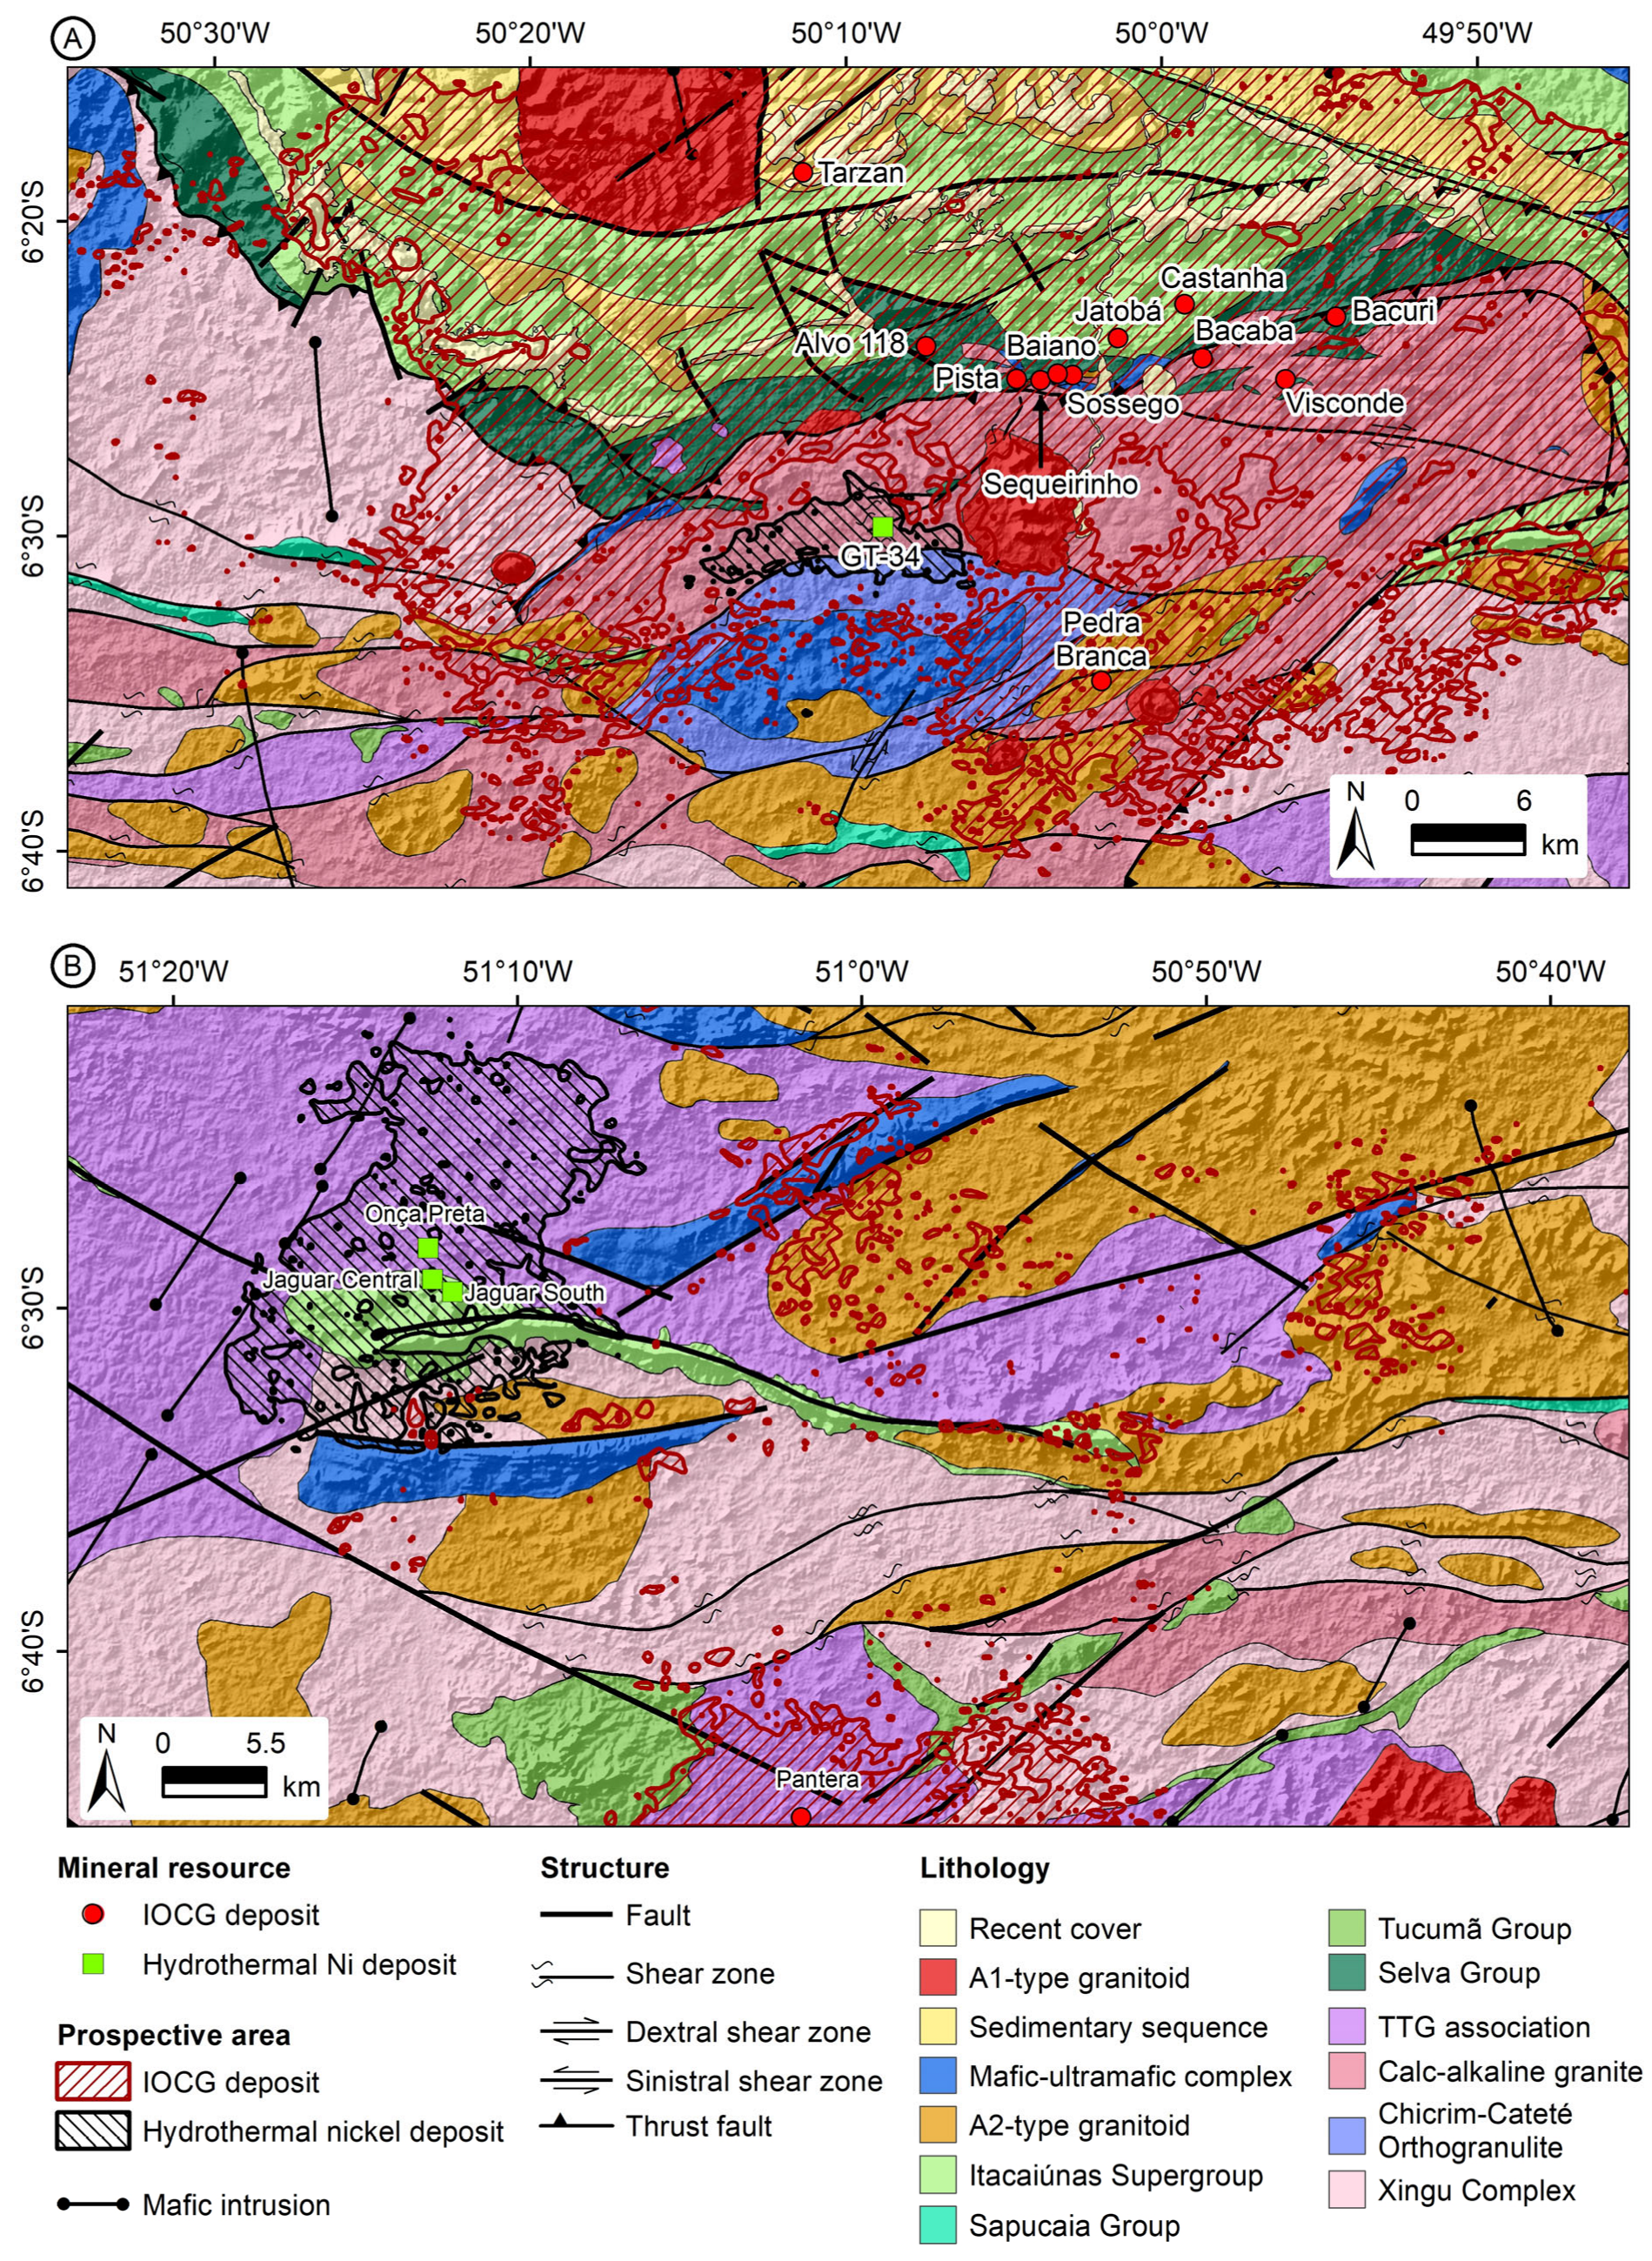
We generated two maps showing SVM predictions for IOCG and hydrothermal nickel deposits (Figure 10). Areas with probability scores > 0.6 were considered high potential for hosting deposits. For both types, the SVM model identified two main prospective regions of the eastern and western Southern Copper Belt.
The eastern region, which hosts the major known IOCG deposits, shows the highest IOCG probability (Figure 10A and Figure 11A). It is spatially associated with the tectonic contact among the basement granite–gneiss terrain, the Mesoarchean Selva Group greenstone belt, and the ENE–WSW volcanic rocks of the Neoarchean Itacaiúnas Supergroup (Figure 11A). High prospectivity also extends around A1-type granites, including the Central de Carajás Granite near the Tarzan deposit, and the Rio Branco Granite, south of Sossego mine, as well as in calc–alkaline granite, mafic–ultramafic complex, Chicrim-Cateté Orthogranulite, and foliated A2-type granites situated south of 6°30′ S parallel (Figure 11A).
For hydrothermal nickel deposits, the SVM model identified one key area in the eastern region (Figure 10B and Figure 11A). The area lies around and to the west of the GT-34 deposit, near the contact between Mesoarchean calc–alkaline granites and the Chicrim-Cateté Orthogranulite.
In the western Southern Copper Belt, prospectivity is dominated by hydrothermal nickel (Figure 10A and Figure 11B). The SVM model predicted a high-prospectivity zone near known hydrothermal nickel deposits, particularly adjacent to the Jaguar deposit, associated with the Mesoarchean TTG units and the Neoarchean Itacaiúnas Supergroup (Figure 11B). The IOCG potential areas are located around the Pantera deposit and near the contacts between A2-type granite and TTG units.
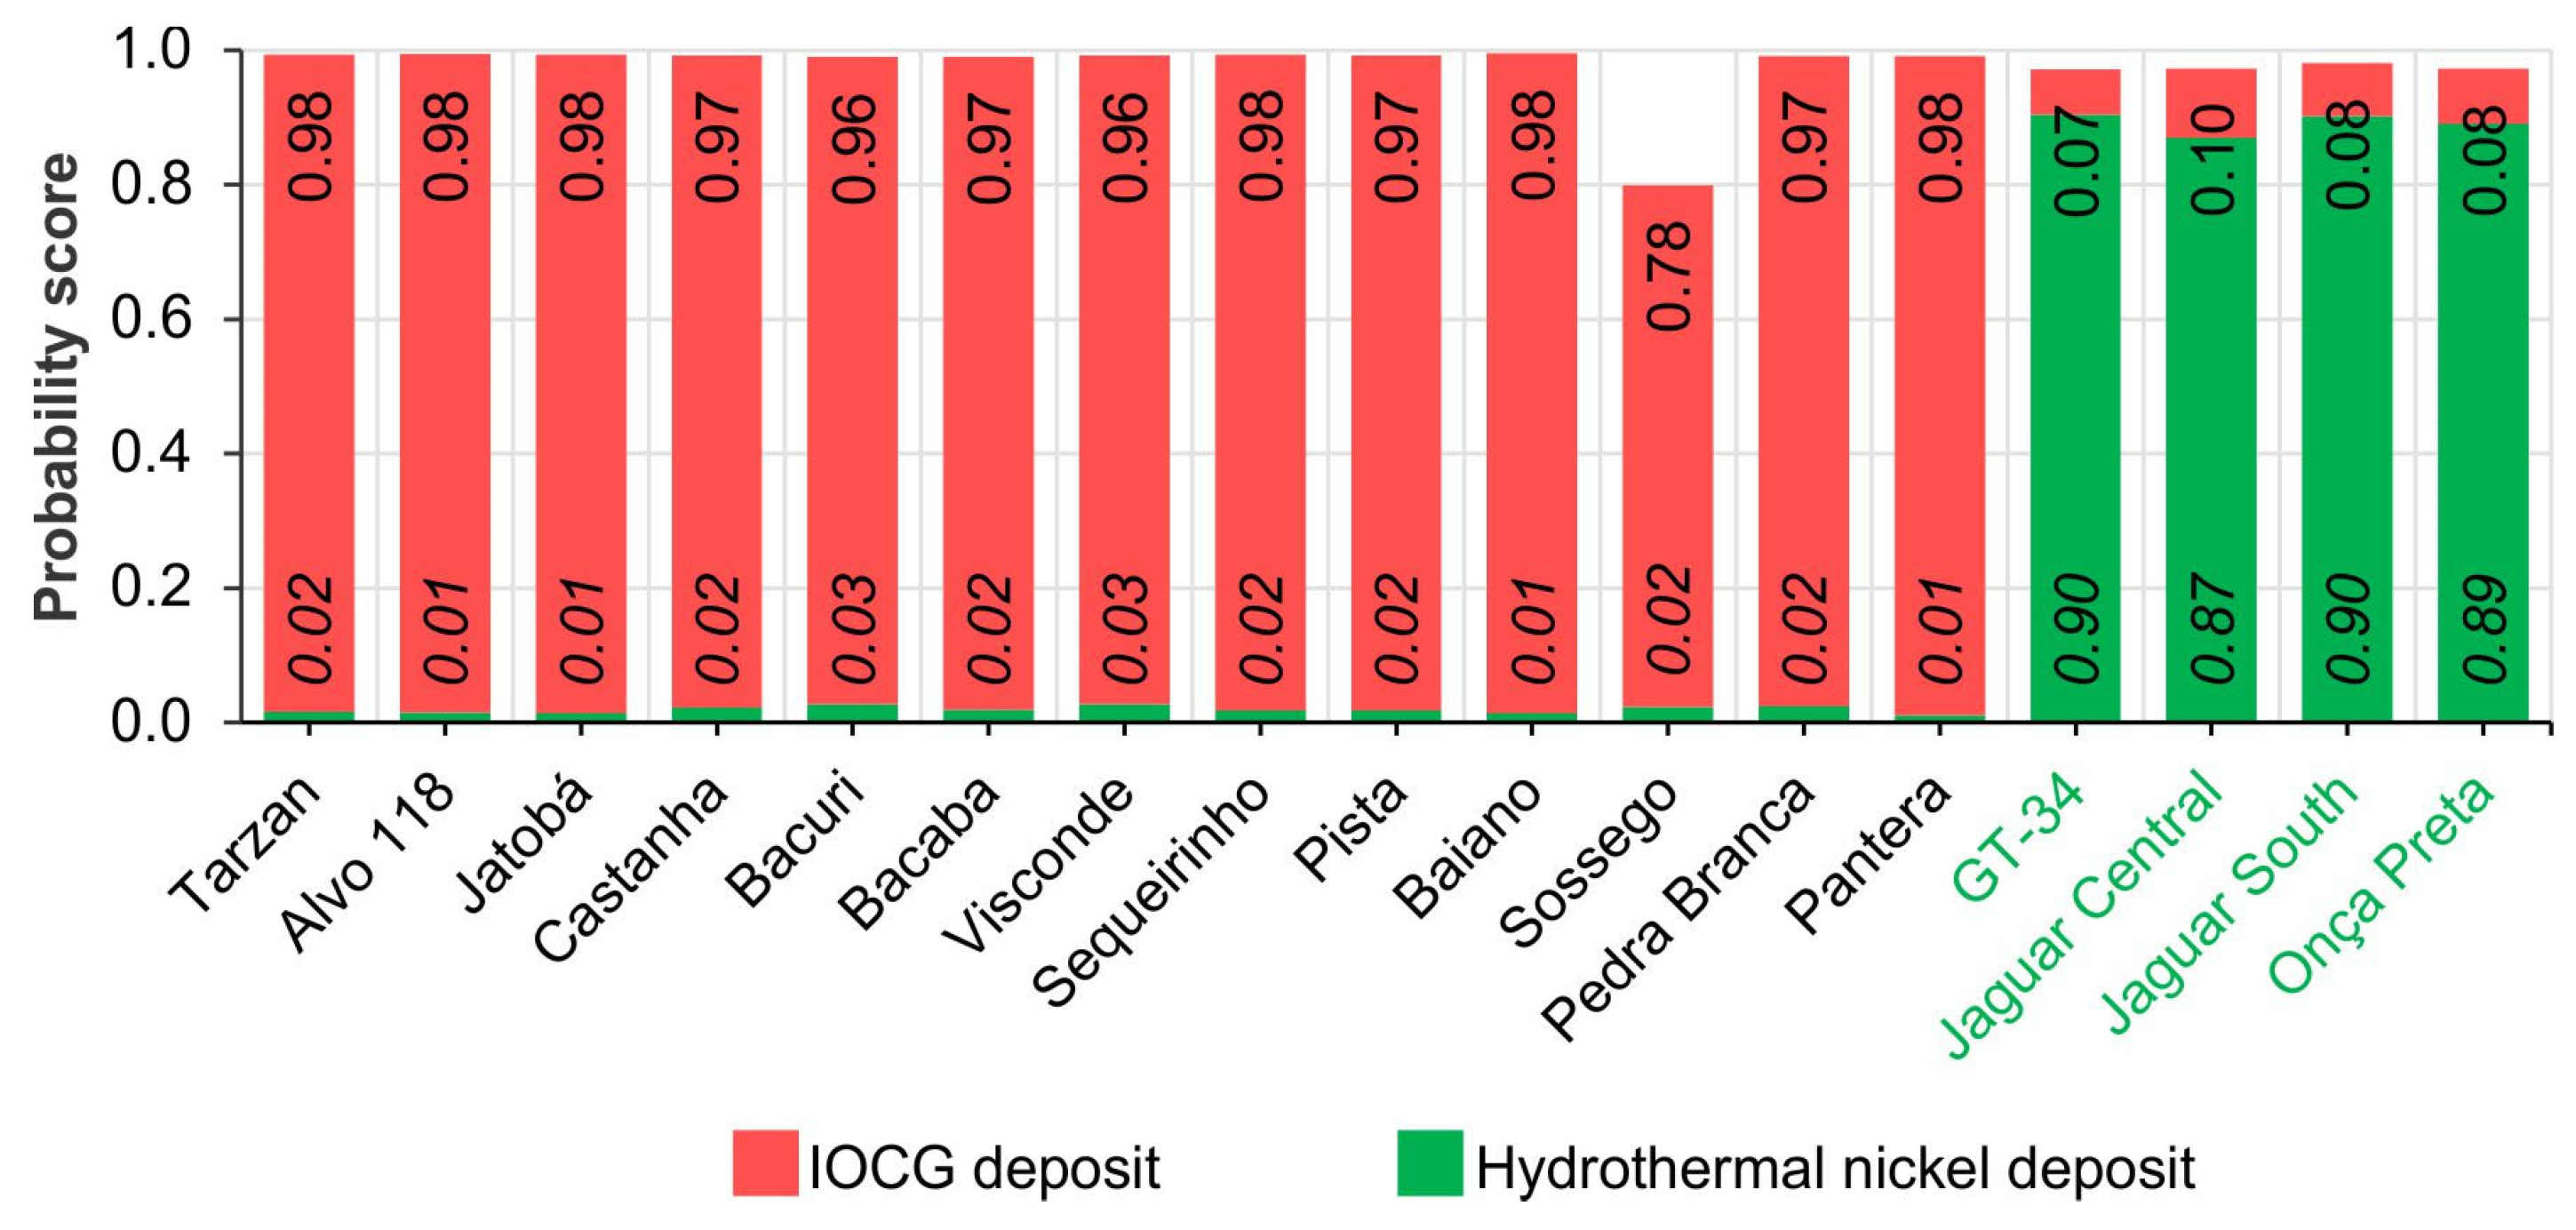
Most known deposits received high prospective scores (Figure 12). IOCG deposits in the Southern Copper Belt were generally classified with probabilities ≥ 0.78. Hydrothermal nickel deposits were also correctly classified, with most scoring ≥0.89 (Figure 12).
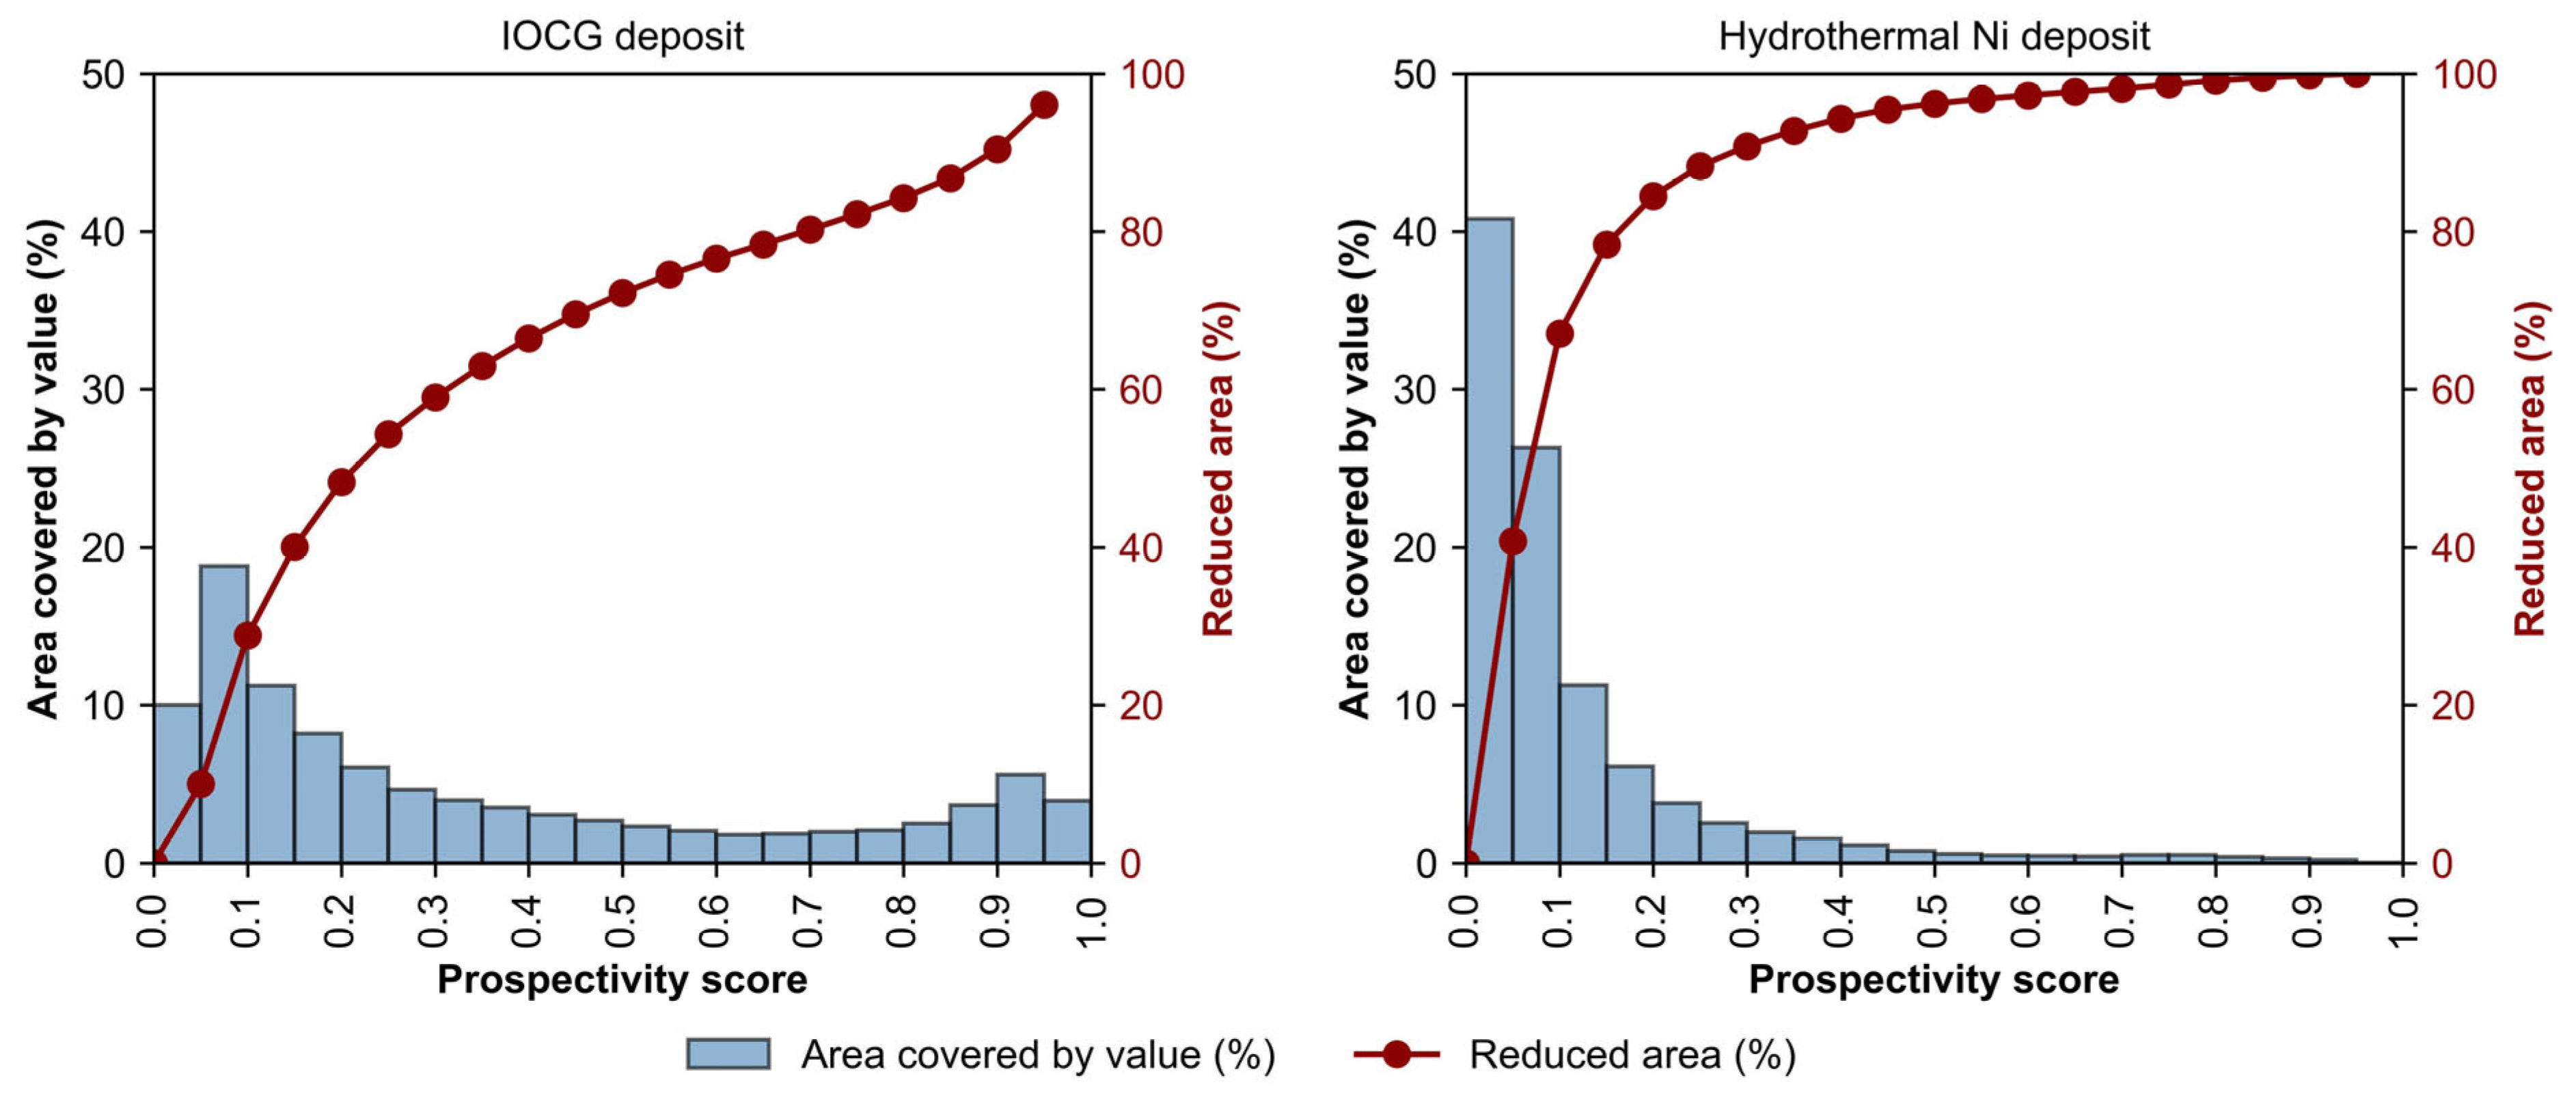
The results were further assessed using a prediction–area plot (Figure 13), which highlights differences in classifying IOCG and hydrothermal nickel deposits. IOCG prospectivity values are widely distributed, producing a gradual cumulative area curve. This suggests high-probability IOCG zones are spatially dispersed, requiring exploration over a larger area to capture most predictions. In contrast, hydrothermal nickel shows a steeper curve, indicating high prospectivity values concentrated in a much smaller portion of the Southern Copper Belt.

9. Discussion

Mineral systems, SVM models, and MPM were integrated to assess Cu and Ni prospectivity in hydrothermal deposits in the Southern Copper Belt. In addition to Cu and Ni, IOCG deposits may host Au, and some hydrothermal nickel deposits contain interesting Co contents [59,60,63].
Within the mineral system framework, features were grouped into four processes: source, active pathway, fluid throttle, and chemical scrubber. Results highlight the role of structural features in IOCG and hydrothermal nickel mineralization, as well as in defining new prospective areas (Figure 8, Figure 9, Figure 10 and Figure 11).
SHAP-based feature importance highlights geochronological contacts, E–W fault, NW–SE magnetic lineaments, Bouguer anomaly, NE–SW gravimetric lineaments, and NE–SW morpholineaments (Figure 8), indicating the structural influence exerted by the lithospheric architecture on fluid migration across multiple crustal levels.
Following Dutra et al. [23], gravimetric and magnetic lineaments reflect deep-to-mid-crustal structures that served as conduits for deep-seated hydrothermal fluids during IOCG and hydrothermal nickel mineralization. In contrast, morpholineaments, faults, and shear zones represent mid-to-shallow-crustal structures that facilitated the influx of externally derived, low temperature, and low salinity fluids, promoting ore precipitation through fluid mixing [23,24,77,78,79,80].
Thus, these structures likely acted as depositional gradients or chemical traps for metal precipitation [22]. The role of deep-to-mid-crustal structures may also extend to geochronological contacts, which preserve records of ancient sutures.
Lithological units used as source proxies show a moderate-to-high role compared to structural and radiometric features (Figure 8 and Figure 9). Proximity to Orosirian A1-type granites and metavolcanic rocks contributes positively to predicting IOCG and hydrothermal nickel mineralization. The emplacement of A1-type granites created a magmatic environment that acted as a regional heat source, driving hydrothermal fluid circulation [16,23]. This interpretation is consistent with Cloutier et al. [22] for Australian IOCG mineral systems. In addition, the dryness and high halogen-rich nature of A1-type magmas favor chloride-complex metal transport.
Orosirian hydrothermal circulation may have formed or remobilized metals in hydrothermal nickel deposits [23]. Dutra et al. [23] proposed this process to explain nickel remobilization from the mafic–ultramafic suite and consequent enrichment of IOCG (Jatobá, Castanha) and hydrothermal nickel (GT-34) deposits in the Southern Copper Belt. Although proximity to mafic–ultramafic outcrops shows little influence on classifying mineralized samples (Figure 8 and Figure 9), deeper mafic–ultramafic bodies may play a greater role in MPM and mineralization processes. Such deep fluid interactions have been suggested by several studies [23,51,61,62,133].
Neoarchean A2-type granites were only relevant for classifying hydrothermal nickel deposits (Figure 9). However, exsolved magmatic fluids or intense rock–fluid interactions with this unit have been proposed in the formation of IOCG deposits [16,54]. This suggests that magmatic–hydrothermal fluids may not have been released during A2-type granite crystallization, but instead were linked to the ascent of deep, mantle-derived CO2-rich hypersaline fluids during the megashear zone development [67,68].
The link between A2-type granites and nickel deposits may reflect their spatial proximity to the Jaguar deposit in the western study area. SHAP-based importance also suggests a temporal connection between Neoarchean magmatism (2.76–2.72 Ga) [32] and the mineralization event at 2.71–2.68 Ga that formed the main IOCG deposits in the Southern Copper Belt [16,54].
SHAP-based feature importance indicates that radiometric features show only weak signatures for IOCG and hydrothermal nickel deposits (Figure 8). Although these deposits are linked to regional, widespread hydrothermal zones [23,51,53,134], the 100 m resolution data were insufficient to resolve or distinguish them from granitic units.
The SVM MPM identified several areas with high probabilities of hosting hydrothermal deposits. Many show E–W, NE–SW, and NW–SE orientations, particularly in the small prospective zones, and are commonly aligned with fault and shear zones, reflecting the strong structural control on IOCG and hydrothermal nickel deposits. This relationship is most evident in the western Southern Copper Belt (Figure 10 and Figure 11). Our IOCG results also agree with Dutra et al. [23], despite their use of traditional statistical methods and fewer parameters.
The most surprising aspect of the hydrothermal nickel prospectivity map is the presence of several small areas with low-to-moderate prospective scores between the two high-prospective regions for IOCG deposits (Figure 10B). These areas exhibit strong structural control, suggesting the Canaã shear zone may have played a key role in hydrothermal nickel formation. This pattern is absent in the IOCG map (Figure 10A). Episodic hydrothermal activity from the Neoarchean to Paleoproterozoic periods repeatedly remobilized metals. Nickel likely precipitated during late ductile-brittle deformation, spatially overlapping earlier IOCG systems, which may explain why Ni-prospective areas occur between IOCG deposits.

10. Conclusions

Seven machine learning algorithms were tested for supervised MPM: Logistic Regression, Gradient Boosting, k-Nearest Neighbors, AdaBoost, Support Vector Machine (SVM), Random Forest, XGBoost, and Multilayer Perceptron. Models were tuned and evaluated with stratified 10-fold cross-validation, where SVM achieved the best classification metrics and robustness. Its stability with high-dimensional, multi-class data makes SVM well-suited for MPM in geologically complex regions, such as the Carajás Province. Moreover, SVM minimized false positives and negatives, a key factor in reducing mineral exploration costs.
Prospectivity modeling in the southern Carajás Province shows a strong link between high Cu and Ni potential and major structural features, including regional faults, shear zones, and geochronological contacts, which likely acted as conduits for hydrothermal fluids at different crustal levels.
The best IOCG prospects occur in the Selva Group, Itacaiúnas Supergroup, A2-type and calc–alkaline granitoids, consistent with known mineralizing events and tectono-magmatic settings. Hydrothermal Ni prospectivity is mainly associated with TTG suites, calc–alkaline granites, and metavolcanic sequences of the Itacaiúnas Supergroup and Selva Group.
The SVM model revealed distinct spatial patterns: IOCG prospectivity is more widespread but lower in intensity, whereas hydrothermal Ni prospectivity is more localized with high-probability zones concentrated around smaller, well-defined mineralized systems.
Structural architecture dominated by E–W, NW–SE, and NE–SW trends was again confirmed visually by SHAP-derived feature importance, highlighting its control on fluid flow and ore deposition along selected corridors. Lithological units played a secondary role, though A1-type granites and volcanic rocks were statistically linked to IOCG and hydrothermal Ni, respectively. These lithologies likely acted as metal sources or thermal engines in the regional hydrothermal system.
Mafic–ultramafic rocks and Neoarchean A2-type granites, though not mineralized, appear to indirectly influence mineralization by promoting deep fluid–rock interactions and magmatic fluid exsolution, especially in the western Southern Copper Belt. These findings suggest that previously unrecognized or inferred subsurface lithospheric features, absent from surface geology, should be integrated into the prospectivity model, enabling a multi-factor approach to establish causality across scale.
To further improve the prospectivity model, datasets with deeper penetrating ability, such as magnetotelluric and seismic tomography, alongside high-resolution geochemical and isotopic data, should be incorporated to develop a holistic view of lithospheric-scale controls on mineral systems, as emphasized by Skirrow et al. [21], Oliveira et al. [77], and Cloutier et al. [22]. In this regard, recent Curie isotherm estimates in the Amazonian Craton provide valuable constraints on lithosphere thermal structure and its correlation with mineral deposits [135]. Integrating thermal models with geophysical and geochemical data may therefore enhance understanding of lithospheric-scale controls on mineral prospectivity.

Supplementary Materials

The following supporting information can be downloaded at: https://www.mdpi.com/article/10.3390/min15101086/s1, Figure S1. Data distribution of original and synthetic samples in PCA and t-SNE spaces for IOCG and hydrothermal nickel deposits. The explained variances are shown in parentheses. The deposits are Alvo 118 (A), Bacaba (B), Bacuri (Bu), Castanha (C), GT-34 (G), Jaguar Central (JC), Jaguar South (JS), Jatobá (J), Onça Preta (OP), Pantera (P), Pedra Branca (PB), Sequeirinho (S), Sossego (So), Tarzan (T), Visconde (V) [108,136,137,138].

Author Contributions

Conceptualization, L.F.D. and L.V.S.M.; Data curation, L.F.D.; Formal analysis, L.F.D.; Investigation, L.F.D.; Methodology, L.F.D., C.d.C.C. and M.A.C.J.; Project administration, L.V.S.M.; Resources, L.F.D.; Software, L.F.D.; Supervision, L.V.S.M., M.A.C.J. and C.d.C.C.; Validation, L.F.D., L.V.S.M., M.A.C.J. and C.d.C.C.; Visualization, L.F.D.; Writing—original draft, L.F.D., L.V.S.M. and M.A.C.J.; Writing—review and editing, L.F.D., L.V.S.M. and M.A.C.J. All authors have read and agreed to the published version of the manuscript.

Funding

This research was funded by the National Council for Scientific and Technological Development (CNPq, Brazil), grant number 310514/2022-3. L.V.S. Monteiro is a Research Fellow of CNPq and acknowledges its continuous support.

Data Availability Statement

The original contributions presented in this study are included in the article/supplementary material. Further inquiries can be directed to the corresponding author(s).

Acknowledgments

The authors are grateful to Rafael Gioria for their guidance and support in developing this project. Special thanks to Iago Costa, Lucas Brito, and Breno Ribeiro for the discussions and support. We thank the Geological Survey of Brazil and the Brazilian National Institute for Spatial Research for making the airborne geophysical and topographic data freely available. We also thank the developers of Python for their efforts in developing a concise and practical programming language that has significantly facilitated data analysis and scientific computing in this study. L.V.S. Monteiro is a Research Fellow of CNPq (Conselho Nacional de Desenvolvimento Científico e Tecnológico—310514/2022-3) and acknowledges the continuous support. Additionally, the authors gratefully acknowledge constructive reviews by anonymous reviewers.

Conflicts of Interest

The authors declare no conflicts of interest.

References

  1. Jowitt, S.M.; McNulty, B.A. Battery and Energy Metals: Future Drivers of the Minerals Industry? SEG Discov. 2021, 11–18. [Google Scholar] [CrossRef]
  2. Müller, M.; Schulze, M.; Schöneich, S. The energy transition and green mineral value chains: Challenges and opportunities for Africa and Latin America. S. Afr. J. Int. Aff. 2023, 30, 169–175. [Google Scholar] [CrossRef]
  3. Simon, A. Critical Mineral Resources for the Green Energy Transition: Are They Available? In Proceedings of the XI Simpósio Brasileiro de Exploração Mineral, Ouro Preto, Brasil, 19–22 May 2024; ADIMB: Ouro Preto, Brasil, 2024. [Google Scholar]
  4. Zuo, R. Geodata Science-Based Mineral Prospectivity Mapping: A Review. Nat. Resour. Res. 2020, 29, 3415–3424. [Google Scholar] [CrossRef]
  5. Costa, I.; Tavares, F.; Oliveira, J. Predictive lithological mapping through machine learning methods: A case study in the Cinzento Lineament, Carajás Province, Brazil. J. Geol. Surv. Brazil 2019, 2, 26–36. [Google Scholar] [CrossRef]
  6. Leite, E.P.; de Souza Filho, C.R. Artificial neural networks applied to mineral potential mapping for copper-gold mineralizations in the Carajás Mineral Province, Brazil. Geophys. Prospect. 2009, 57, 1049–1065. [Google Scholar] [CrossRef]
  7. Karpatne, A.; Ebert-Uphoff, I.; Ravela, S.; Babaie, H.A.; Kumar, V. Machine Learning for the Geosciences: Challenges and Opportunities. IEEE Trans. Knowl. Data Eng. 2019, 31, 1544–1554. [Google Scholar] [CrossRef]
  8. Farahnakian, F.; Sheikh, J.; Zelioli, L.; Nidhi, D.; Seppä, I.; Ilo, R.; Nevalainen, P.; Heikkonen, J. Addressing imbalanced data for machine learning based mineral prospectivity mapping. Ore Geol. Rev. 2024, 174, 106270. [Google Scholar] [CrossRef]
  9. Carranza, E.J.M.; Laborte, A.G. Random forest predictive modeling of mineral prospectivity with small number of prospects and data with missing values in Abra (Philippines). Comput. Geosci. 2015, 74, 60–70. [Google Scholar] [CrossRef]
  10. Chudasama, B.; Torppa, J.; Nykänen, V.; Kinnunen, J.; Lerssi, J.; Salmirinne, H. Target-scale prospectivity modeling for gold mineralization within the Rajapalot Au-Co project area in northern Fennoscandian Shield, Finland. Part 1: Application of knowledge-driven- and machine learning-based-hybrid- expert systems for exploration targe. Ore Geol. Rev. 2022, 147, 104937. [Google Scholar] [CrossRef]
  11. Zhang, Z.; Wang, G.; Carranza, E.J.M.; Du, J.; Li, Y.; Liu, X.; Su, Y. An Uncertainty-Quantification Machine Learning Framework for Data-Driven Three-Dimensional Mineral Prospectivity Mapping. Nat. Resour. Res. 2024, 33, 1393–1411. [Google Scholar] [CrossRef]
  12. Yousefi, M.; Lindsay, M.D.; Kreuzer, O. Mitigating uncertainties in mineral exploration targeting: Majority voting and confidence index approaches in the context of an exploration information system (EIS). Ore Geol. Rev. 2024, 165, 105930. [Google Scholar] [CrossRef]
  13. Qaderi, S.; Maghsoudi, A.; Yousefi, M.; Pour, A.B. Translation of mineral system components into time step-based ore-forming events and evidence maps for mineral exploration: Intelligent mineral prospectivity mapping through adaptation of recurrent neural networks and random forest algorithm. Ore Geol. Rev. 2025, 179, 106537. [Google Scholar] [CrossRef]
  14. Monteiro, L.V.S.; Xavier, R.P.; Roberto Souza Filho, C.; Moreto, C.P.N. Metalogênese da Província Carajás. In Metalogênese das Províncias Tectônicas Brasileiras; da Silva, M.G., da Rocha Neto, M.B., Jost, H., Kuyumjian, R.M., Eds.; CPRM: Belo Horizonte, MG, Brasil, 2014; pp. 43–92. ISBN 9788574992211. [Google Scholar]
  15. Xavier, R.P.; Moreto, C.; de Melo, G.H.C.; Toledo, P.; Hunger, R.; Delinardo, M.; Faustinoni, J.; Lopes, A.; Monteiro, L.V.S.; Previato, M.; et al. Geology and metallogeny of Neoarchean and Paleoproterozoic copper systems of the Carajás Domain, Amazonian Craton, Brazil. In Proceedings of the 14th SGA Biennial Meeting, Mineral Resources to Discover, Volume 3, Society for Geology Applied to Mineral Deposits, Quebec, QC, Canada, 20–23 August 2017; pp. 899–902. [Google Scholar]
  16. Moreto, C.P.N.; Monteiro, L.V.S.; Xavier, R.P.; Creaser, R.A.; DuFrane, S.A.; Melo, G.H.C.; Delinardo da Silva, M.A.; Tassinari, C.C.G.; Sato, K. Timing of multiple hydrothermal events in the iron oxide–copper–gold deposits of the Southern Copper Belt, Carajás Province, Brazil. Miner. Depos. 2015, 50, 517–546. [Google Scholar] [CrossRef]
  17. de Melo, G.H.C.; Monteiro, L.V.S.; Xavier, R.P.; Moreto, C.P.N.; Arquaz, R.M.; Silva, M.A.D. Evolution of the Igarapé Bahia Cu-Au deposit, Carajás Province (Brazil): Early syngenetic chalcopyrite overprinted by IOCG mineralization. Ore Geol. Rev. 2019, 111, 102993. [Google Scholar] [CrossRef]
  18. Hunger, R.B.; de Melo, G.H.C.; Xavier, R.P.; Moreto, C.P.N.; Talavera, C.; Su, Z.K.; Zhao, X.F. The Santa Lúcia Cu-Au deposit, Carajás Mineral Province, Brazil: A Neoarchean (2.68 Ga) member of the granite-related copper-gold systems of Carajás. Miner. Depos. 2021, 56, 1521–1542. [Google Scholar] [CrossRef]
  19. de Toledo, P.I.F.; Moreto, C.P.N.; Monteiro, L.V.S.; de Melo, G.H.C.; Matos, F.M.V.; Xavier, R.P.; Carvalho, J.A.; Filho, C.A.M.; Navarro, M.S.; de Carvalho Lana, C. Breaking up the temporal link between granitic magmatism and iron oxide-copper–gold (IOCG) deposits in the Carajás Mineral Province, NW Brazil. Miner. Depos. 2024, 59, 601–625. [Google Scholar] [CrossRef]
  20. Carranza, E.J.M.; de Souza Filho, C.R.; Haddad-Martim, P.M.; Nagayoshi, K.; Shimizu, I. Macro-scale ore-controlling faults revealed by micro-geochemical anomalies. Sci. Rep. 2019, 9, 4410. [Google Scholar] [CrossRef] [PubMed]
  21. Skirrow, R.G.; Murr, J.; Schofield, A.; Huston, D.L.; van der Wielen, S.; Czarnota, K.; Coghlan, R.; Highet, L.M.; Connolly, D.; Doublier, M.; et al. Mapping iron oxide Cu-Au (IOCG) mineral potential in Australia using a knowledge-driven mineral systems-based approach. Ore Geol. Rev. 2019, 113, 103011. [Google Scholar] [CrossRef]
  22. Cloutier, J.; Ford, A.; Huston, D.; Haynes, M.; Schofield, A.; Doublier, M.; Sanchez, G.; Duan, J.; Goodwin, J.; Beyer, E.; et al. Iron oxide copper–gold potential of Australia using a hybrid data- and knowledge-driven approach and its implications for the formation of IOCG mineral systems. Ore Geol. Rev. 2025, 185, 106802. [Google Scholar] [CrossRef]
  23. Dutra, L.F.; Louro, V.H.A.; Monteiro, L.V.S. The southern IOCG and hydrothermal nickel mineralization trend of the Carajás Mineral Province: Airborne geophysical and remote sensing evidences for structural controls and hydrothermal signature. J. Appl. Geophys. 2023, 213, 105016. [Google Scholar] [CrossRef]
  24. Prado, E.M.G.; de Souza Filho, C.R.; Carranza, E.J.M.; Motta, J.G. Modeling of Cu-Au prospectivity in the Carajás mineral province (Brazil) through machine learning: Dealing with imbalanced training data. Ore Geol. Rev. 2020, 124, 103611. [Google Scholar] [CrossRef]
  25. Occhipinti, S.; Metelka, V.; Lindsay, M.; Aitken, A.; Pirajno, F.; Tyler, I. The evolution from plate margin to intraplate mineral systems in the Capricorn Orogen, links to prospectivity. Ore Geol. Rev. 2020, 127, 103811. [Google Scholar] [CrossRef]
  26. Trunfull, E.F.; Hagemann, S.G.; Xavier, R.P.; Moreto, C.P.N. Critical assessment of geochronological data from the Carajás Mineral Province, Brazil: Implications for metallogeny and tectonic evolution. Ore Geol. Rev. 2020, 121, 103556. [Google Scholar] [CrossRef]
  27. Costa, F.G.; dos Santos, P.A.; de Serafim, I.C.C.O.; Costa, I.S.L.; Roopnarain, S. From Mesoarchean drips to modern–style tectonics in the Carajás Province, Amazonian Craton. J. S. Am. Earth Sci. 2020, 104, 102817. [Google Scholar] [CrossRef]
  28. Pimentel, M.M.; Machado, N. Geocronologia U-Pb dos terrenos granito-greenstone de Rio Maria, Pará. In Proceedings of the Congresso Brasileiro de Geologia, 38, Belo Horizonte, Brazil, 20–27 July 2025; SBG: Camboriú, SC, Brasil, 1994; pp. 390–391. [Google Scholar]
  29. de Avelar, V.G.; Lafon, J.M.; Correia, F.C., Jr.; Macambira, E.M.B. O Magmatismo arqueano aa região de Tucumã-Província Mineral de Carajás: Novos resultados geocronológicos. Rev. Bras. Geociências 1999, 29, 453–460. [Google Scholar] [CrossRef]
  30. Feio, G.R.L.; Dall’Agnol, R.; Dantas, E.L.; Macambira, M.J.B.; Santos, J.O.S.; Althoff, F.J.; Soares, J.E.B. Archean granitoid magmatism in the Canaã dos Carajás area: Implications for crustal evolution of the Carajás province, Amazonian craton, Brazil. Precambrian Res. 2013, 227, 157–185. [Google Scholar] [CrossRef]
  31. da Silva, F.F.; de Oliveira, D.C.; Dall’Agnol, R.; da Silva, L.R.; da Cunha, I.V. Lithological and structural controls on the emplacement of a Neoarchean plutonic complex in the Carajás province, southeastern Amazonian craton (Brazil). J. S. Am. Earth Sci. 2020, 102, 102696. [Google Scholar] [CrossRef]
  32. Marangoanha, B.; de Oliveira, D.C.; Galarza, M.A.; Marques, G.T. Crustal anatexis and mantle-derived magmas forming Neoarchean A-type granitoids in Carajás Province, northern Brazil: Petrological evidence and tectonic control. Precambrian Res. 2020, 338, 105585. [Google Scholar] [CrossRef]
  33. Costa, U.A.P.; de Paula, R.R.; Silva, D.P.B.; de Oliveira, B.J.D.P.; da Silva, C.M.G.; Tavares, F.M.; de Oliveira, J.K.M.; Justo, A.P. Programa Geologia do Brasil-PGB. Mapa de integração Geológico-Geofísica da ARIM Carajás; CPRM-Serviço Geológico do Brasil: Belém, Brazil, 2016. [Google Scholar]
  34. Delinardo-Silva, M.A.; Monteiro, L.V.S.; Moreto, C.P.N.; Faustinoni, J.; Santos, T.J.S.; Sousa, S.D.; Xavier, R.P. From Source to Sink: U-Pb Geochronology and Lithochemistry Unraveling the Missing Link Between Mesoarchean Anatexis and Magmatism in the Carajás Province, Brazil. Minerals 2025, 15, 265. [Google Scholar] [CrossRef]
  35. Lacasse, C.M.; Ganade, C.E.; Mathieu, L.; Teixeira, N.A.; Lopes, L.B.L.; Monteiro, C.F. Restoring original composition of hydrothermally altered Archean metavolcanic rocks of the Carajás Mineral Province (Brazil): Geodynamic implications for the transition from lid to mobile tectonics. Lithos 2020, 372–373, 105647. [Google Scholar] [CrossRef]
  36. Rosa, W.D. Complexos Acamadados da Serra da Onça e Serra do Puma: Geologia e Petrologia de duas Intrusões Máfico-Ultramáficas com Sequência de Cristalização Distinta na Província Arqueana de Carajás, Brasil. Master’s Thesis, Universidade de Brasília, Brasília, Brazil, 2014. [Google Scholar]
  37. Siepierski, L. Geologia, Petrologia e Potencial para Mineralizações Magmáticas dos Corpos Máfico-Ultramáficos da Região de Canaã dos Carajás, Província Mineral de Carajás. Ph.D. Thesis, Universidade de Brasília, Brasilia, Brazil, 2016. [Google Scholar]
  38. Mansur, E.T.; Ferreira Filho, C.F. Magmatic structure and geochemistry of the Luanga Mafic–Ultramafic Complex: Further constraints for the PGE-mineralized magmatism in Carajás, Brazil. Lithos 2016, 266–267, 28–43. [Google Scholar] [CrossRef]
  39. de Melo, G.H.C.; Monteiro, L.V.S.; Xavier, R.P.; Moreto, C.P.N.; Santiago, E.S.B.; Dufrane, S.A.; Aires, B.; Santos, A.F.F. Temporal evolution of the giant Salobo IOCG deposit, Carajás Province (Brazil): Constraints from paragenesis of hydrothermal alteration and U-Pb geochronology. Miner. Depos. 2017, 52, 709–732. [Google Scholar] [CrossRef]
  40. Wirth, K.R.; Gibbs, A.K.; Olszewski, W.J., Jr. U-Pb ages of zircons from the Grão-Pará Group and Serra dos Carajás granite, Pará, Brasil. Rev. Bras. Geociências 1986, 16, 195–200. [Google Scholar] [CrossRef]
  41. Machado, N.; Lindenmayer, Z.; Krogh, T.E.; Lindenmayer, D. U-Pb geochronology of Archean magmatism and basement reactivation in the Carajás area, Amazon shield, Brazil. Precambrian Res. 1991, 49, 329–354. [Google Scholar] [CrossRef]
  42. Trendall, A.F.; Basei, M.A.S.; de Laeter, J.R.; Nelson, D.R. SHRIMP zircon U–Pb constraints on the age of the Carajás formation, Grão Pará Group, Amazon Craton. J. S. Am. Earth Sci. 1998, 11, 265–277. [Google Scholar] [CrossRef]
  43. Tavares, F.M.; Trouw, R.A.J.; da Silva, C.M.G.; Justo, A.P.; Oliveira, J.K.M. The multistage tectonic evolution of the northeastern Carajás Province, Amazonian Craton, Brazil: Revealing complex structural patterns. J. S. Am. Earth Sci. 2018, 88, 238–252. [Google Scholar] [CrossRef]
  44. Vasquez, M.L.; Macambira, M.J.B.; Armstrong, R.A. Zircon geochronology of granitoids from the western Bacajá domain, southeastern Amazonian craton, Brazil: Neoarchean to Orosirian evolution. Precambrian Res. 2008, 161, 279–302. [Google Scholar] [CrossRef]
  45. Pereira, R.M.P. Geologia da Região Sul da Serra Norte e Características do Minério de Ferro do Depósito N8, Província Mineral Carajás. Master’s Thesis, Universidade Federal de Minas Gerais, Belo Horizonte, Brazil, 2009. [Google Scholar]
  46. Araújo Filho, R.C.; Nogueira, A.C.R.; Araújo, R.N. New stratigraphic proposal of a Paleoproterozoic siliciclastic succession: Implications for the evolution of the Carajás Basin, Amazonian craton, Brazil. J. S. Am. Earth Sci. 2020, 102, 102665. [Google Scholar] [CrossRef]
  47. Pinheiro, R.V.L.; Holdsworth, R.E. Reactivation of Archaean strike-slip fault systems, Amazon region, Brazil. J. Geol. Soc. Lond. 1997, 154, 99–103. [Google Scholar] [CrossRef]
  48. Teixeira, M.F.B.; Dall’Agnol, R.; Santos, J.O.S.; Kemp, A.; Evans, N. Petrogenesis of the Paleoproterozoic (Orosirian) A-type granites of Carajás Province, Amazon Craton, Brazil: Combined in situ Hf–O isotopes of zircon. Lithos 2019, 332–333, 1–22. [Google Scholar] [CrossRef]
  49. Teixeira, M.F.B.; Dall’Agnol, R.; Schneider Santos, J.O.; Carvalho de Oliveira, D.; Lamarão, C.N.; McNaughton, N.J. Crystallization ages of Paleoproterozoic A-type granites of Carajás province, Amazon craton: Constraints from U–Pb geochronology of zircon and titanite. J. S. Am. Earth Sci. 2018, 88, 312–331. [Google Scholar] [CrossRef]
  50. Teixeira, W.; Reis, N.J.; Bettencourt, J.S.; Klein, E.L.; Oliveira, D.C. Intraplate Proterozoic Magmatism in the Amazonian Craton Reviewed: Geochronology, Crustal Tectonics and Global Barcode Matches. In Dyke Swarms of the World: A Modern Perspective; Srivastava, R.K., Ernst, R.E., Peng, P., Eds.; Springer: Singapore, 2019; pp. 111–154. [Google Scholar]
  51. Ferreira Filho, C.F.; Ferraz de Oliveira, M.M.; Mansur, E.T.; Rosa, W.D. The Jaguar hydrothermal nickel sulfide deposit: Evidence for a nickel-rich member of IOCG-type deposits in the Carajás Mineral Province, Brazil. J. S. Am. Earth Sci. 2021, 111, 103501. [Google Scholar] [CrossRef]
  52. Monteiro, L.V.S.; Xavier, R.P.; de Carvalho, E.R.; Hitzman, M.W.; Johnson, C.A.; de Souza Filho, C.R.; Torresi, I. Spatial and temporal zoning of hydrothermal alteration and mineralization in the Sossego iron oxide–copper–gold deposit, Carajás Mineral Province, Brazil: Paragenesis and stable isotope constraints. Miner. Depos. 2008, 43, 129–159. [Google Scholar] [CrossRef]
  53. Monteiro, L.V.S.; Xavier, R.P.; Hitzman, M.W.; Juliani, C.; de Souza Filho, C.R.; de Carvalho, E.R. Mineral chemistry of ore and hydrothermal alteration at the Sossego iron oxide–copper–gold deposit, Carajás Mineral Province, Brazil. Ore Geol. Rev. 2008, 34, 317–336. [Google Scholar] [CrossRef]
  54. Moreto, C.P.N.; Monteiro, L.V.S.; Xavier, R.P.; Creaser, R.A.; DuFrane, S.A.; Tassinari, C.C.G.; Sato, K.; Kemp, A.I.S.; Amaral, W.S. Neoarchean and Paleoproterozoic iron oxide-copper-gold events at the Sossego deposit, Carajás Province, Brazil: Re-Os and U-Pb geochronological evidence. Econ. Geol. 2015, 110, 809–835. [Google Scholar] [CrossRef]
  55. Pestilho, A.L.S.; Monteiro, L.V.S.; de Melo, G.H.C.; Moreto, C.P.N.; Juliani, C.; Fallick, A.E.; Xavier, R.P. Stable isotopes and fluid inclusion constraints on the fluid evolution in the Bacaba and Castanha iron oxide-copper-gold deposits, Carajás Mineral Province, Brazil. Ore Geol. Rev. 2020, 126, 103738. [Google Scholar] [CrossRef]
  56. Veloso, A.S.R.; Monteiro, L.V.S.; Juliani, C. The link between hydrothermal nickel mineralization and an iron oxide-copper-gold (IOCG) system: Constraints based on mineral chemistry in the Jatobá deposit, Carajás Province. Ore Geol. Rev. 2020, 121, 103555. [Google Scholar] [CrossRef]
  57. de Melo, G.H.C.; Monteiro, L.V.S.; Moreto, C.P.N.; Xavier, R.P.; da Silva, M.A.D. Paragenesis and evolution of the hydrothermal Bacuri iron oxide–copper–gold deposit, Carajás Province (PA). Braz. J. Geol. 2014, 44, 73–90. [Google Scholar] [CrossRef]
  58. Torresi, I.; Xavier, R.P.; Bortholoto, D.F.A.; Monteiro, L.V.S. Hydrothermal alteration, fluid inclusions and stable isotope systematics of the Alvo 118 iron oxide–copper–gold deposit, Carajás Mineral Province (Brazil): Implications for ore genesis. Miner. Depos. 2012, 47, 299–323. [Google Scholar] [CrossRef]
  59. Vale, S.A. Form 20-F. Available online: https://www.sec.gov/ix?doc=/Archives/edgar/data/0000917851/000129281424001463/valeform20f_2023.htm (accessed on 5 April 2025).
  60. Rigon, J.; Munaro, P.; Santos, L.; Nascimento, J.; Barreira, C. Alvo 118 copper-gold deposit: Geology and mineralization, Serra dos Carajás, Pará, Brazil. In Proceedings of the 31st International Geological Congress, Rio de Janeiro, Brazil, 6–17 August 2000. [Google Scholar]
  61. Garcia, V.B.; Emilia Schutesky, M.; Oliveira, C.G.; Whitehouse, M.J.; Huhn, S.R.B.; Augustin, C.T. The Neoarchean GT-34 Ni deposit, Carajás mineral Province, Brazil: An atypical IOCG-related Ni sulfide mineralization. Ore Geol. Rev. 2020, 127, 103773. [Google Scholar] [CrossRef]
  62. Mansur, E.T.; Dare, S.A.S.; Filho, C.F.F.; Miranda, A.C.R.; Monteiro, L.V.S. The distribution of trace elements in sulfides and magnetite from the Jaguar hydrothermal nickel deposit: Exploring the link with IOA and IOCG deposits within the Carajás Mineral Province, Brazil. Ore Geol. Rev. 2023, 152, 105256. [Google Scholar] [CrossRef]
  63. Centaurus Metals Ltd. Jaguar Roars to 1.20 Mt of Contained Nickel Metal Cementing its Position as a Tier-1 Global Nickel Sulphide Project. Available online: https://www.centaurus.com.au/site/pdf/e3ddcd4f-dae2-4847-bc86-649ebcf0657a/Jaguar-Roars-to-120Mt-of-Contained-Nickel-Metal.pdf (accessed on 18 August 2024).
  64. Xavier, R.P.; Soares Monteiro, L.V.; Moreto, C.P.N.; Pestilho, A.L.S.; de Melo, G.H.C.; Delinardo da Silva, M.A.; Aires, B.; Ribeiro, C.; Freitas e Silva, F.H. The Iron Oxide Copper-Gold Systems of the Carajás Mineral Province, Brazil. In Geology and Genesis of Major Copper Deposits and Districts of the World: A Tribute to Richard H. Sillitoe; Hedenquist, J.W., Harris, M., Camus, F., Eds.; Society of Economic Geologists: Littleton, CO, USA, 2012; Volume 16, ISBN 9781629490410. [Google Scholar]
  65. Dutra, L.F. Evolução do Sistema Mineral IOCG-Níquel Hidrotermal do Cinturão Sul do Cobre, Província Carajás, com Base em Análises de LA-ICP-MS In Situ Aplicadas a Estudos Geocronológicos e de Química Mineral. Ph.D. Thesis, University of São Paulo, São Paulo, Brazil, 2024. [Google Scholar]
  66. Siepierski, L. Geologia e Petrologia do Prospecto GT-34: Evidência de Metassomatismo de Alta Temperatura e Baixa fO2, Província Mineral Carajás. Master’s Thesis, Universidade de Brasília, Brasília, Brazil, 2008. [Google Scholar]
  67. de Melo, G.H.C.; Monteiro, L.V.S.; Xavier, R.P.; Moreto, C.P.N.; Santiago, E. Tracing Fluid Sources for the Salobo and Igarapé Bahia Deposits: Implications for the Genesis of the Iron Oxide Copper-Gold Deposits in the Carajás Province, Brazil. Econ. Geol. 2019, 114, 697–718. [Google Scholar] [CrossRef]
  68. Previato, M.; Monteiro, L.V.S.; da Bello, R.M.S.; Gonçales, L.C.G. Evolution of brines and CO2-rich fluids and hydrothermal overprinting in the genesis of the Borrachudo copper deposit, Carajás Province. Ore Geol. Rev. 2020, 121, 103561. [Google Scholar] [CrossRef]
  69. Mccuaig, T.C.; Beresford, S.; Hronsky, J. Translating the mineral systems approach into an effective exploration targeting system. Ore Geol. Rev. 2010, 38, 128–138. [Google Scholar] [CrossRef]
  70. de Carneiro, L.S.; Moreto, C.P.N.; Monteiro, L.V.S.; Xavier, R.P.; Soares Monteiro, L.V.; Xavier, R.P. Compositional Analysis of the Neoarchean and Paleoproterozoic Copper Systems in the Carajás Mineral Province, Nw Brazil: Implications for Metal Endowment. J. Geochemical Explor. 2023, 254. [Google Scholar] [CrossRef]
  71. Mansur, E.T.; Ferreira Filho, C.F.; Oliveira, D.P.L. The Luanga deposit, Carajás Mineral Province, Brazil: Different styles of PGE mineralization hosted in a medium-size layered intrusion. Ore Geol. Rev. 2020, 118, 103340. [Google Scholar] [CrossRef]
  72. Motta, J.G.; de Souza Filho, C.R.; Carranza, E.J.M.; Braitenberg, C. Archean crust and metallogenic zones in the Amazonian Craton sensed by satellite gravity data. Sci. Rep. 2019, 9, 2565. [Google Scholar] [CrossRef]
  73. Grainger, C.J.; Groves, D.I.; Tallarico, F.H.B.B.; Fletcher, I.R. Metallogenesis of the Carajás Mineral Province, Southern Amazon Craton, Brazil: Varying styles of Archean through Paleoproterozoic to Neoproterozoic base- and precious-metal mineralisation. Ore Geol. Rev. 2008, 33, 451–489. [Google Scholar] [CrossRef]
  74. Veloso, Â.S.R. Evolução Metalogenética do Depósito de Cu-(Ni-Zn) Jatobá, Província Mineral de Carajás. Ph.D. Thesis, Universidade de São Paulo, São Paulo, Brazil, 2017. [Google Scholar]
  75. de Carvalho, E.R. Caracterização Geológica e Gênese das Mineralizações de óxido de Fe-Cu-Au e Metais Associados na Província Mineral de Carajás: Estudo de Caso do Depósito de Sossego. Ph.D. Thesis, Universidade Estadual de Campinas, São Paulo, Brazil, 2009. [Google Scholar]
  76. Tallarico, F.H.B. O Cinturão Cupro-Aurifero de Carajás, Brasil. Ph.D. Thesis, Universidade Estadual de Campinas, São Paulo, Brazil, 2003. [Google Scholar]
  77. de Oliveira, J.K.M.; Silva, A.M.; Tavares, F.M.; Lima Costa, I.S. Mapping Cu–Au mineral potential (IOCG and Cu–Au polymetallic) in the Northern copper belt, Carajás Mineral Province: A data-driven, mineral systems-based approach. Ore Geol. Rev. 2025, 185, 106770. [Google Scholar] [CrossRef]
  78. Haddad-Martim, P.M.; de Souza Filho, C.R.; Carranza, E.J.M. Spatial analysis of mineral deposit distribution: A review of methods and implications for structural controls on iron oxide-copper-gold mineralization in Carajás, Brazil. Ore Geol. Rev. 2017, 81, 230–244. [Google Scholar] [CrossRef]
  79. Haddad-Martim, P.M.; Carranza, E.J.M.; De Souza Filho, C.R. The fractal nature of structural controls on ore formation: The case of the Iron oxide copper-gold deposits in the Carajás mineral province, Brazilian Amazon. Econ. Geol. 2018, 113, 1499–1524. [Google Scholar] [CrossRef]
  80. Domingos, F.H.G. The Structural Setting of the Canaã dos Carajás Region and Sossego-Sequeirinho Deposits, Carajás—Brazil. Ph.D. Thesis, Durham University, Durham, UK, 2009. [Google Scholar]
  81. Austin, J.R.; Blenkinsop, T.G. The Cloncurry Lineament: Geophysical and geological evidence for a deep crustal structure in the Eastern Succession of the Mount Isa Inlier. Precambrian Res. 2008, 163, 50–68. [Google Scholar] [CrossRef]
  82. Florinsky, I.V. Lineaments and Faults. In Digital Terrain Analysis in Soil Science and Geology; Elsevier: Amsterdam, The Netherlands, 2016; pp. 353–376. [Google Scholar]
  83. Šilhavý, J.; Minár, J.; Mentlík, P.; Sládek, J. A new artefacts resistant method for automatic lineament extraction using Multi-Hillshade Hierarchic Clustering (MHHC). Comput. Geosci. 2016, 92, 9–20. [Google Scholar] [CrossRef]
  84. Hayward, N. 3D Magnetic Inversion of Mineral Prospects in the Great Bear Magmatic Zone, Northwest Territories; Geological Survey of Canada: Ottawa, ON, Canada, 2013. [Google Scholar] [CrossRef]
  85. Austin, J.R.; Foss, C.A. Understanding iron oxide copper–gold (IOCG) magnetic targets from the inside out: Case studies from northern Australia. In Proceedings of the Annual Geoscience Exploration Seminar; Northern Territory Geological Survey: Alice Springs, Australia, 2014; pp. 66–72. [Google Scholar]
  86. Melo, A.T.; Li, Y.; Hitzman, M. Is there hidden potential in Carajás? Insights through the geophysical signature of Cristalino deposit. Ore Geol. Rev. 2020, 126, 103735. [Google Scholar] [CrossRef]
  87. GSB—Geological Survey of Brazil. Projeto Aerogeofísico Rio Maria: Relatório Final do Levantamento e Processamento dos Dados Magnetométricos e Gamaespectrométricos; Prospectors Aerolevantamentos e Sistemas: Rio de Janeiro, Brazil, 2015. [Google Scholar]
  88. GSB—Geological Survey of Brazil. Projeto Aerogeofísico Oeste de Carajás: Relatório Final do Levantamento e Processamento dos Dados Magnetométricos e Gamaespectrométricos; Programa Geologia do Brasil—PGB; Lasa Prospecções: Rio de Janeiro, Brazil, 2015. [Google Scholar]
  89. GSB—Geological Survey of Brazil. Projeto Aerogeofísico Tucuruí; Lasa Prospecções: Rio de Janeiro, Brazil, 2010. [Google Scholar]
  90. GSB—Geological Survey of Brazil. Projeto Aerogeofísico Anapu-Tuerê: Relatório Final do Levantamento e Processamento dos Dados Magnetométricos e Gamaespectrométricos; Programa Geologia do Brasil—PGB; Serviço Geológico do Brasil: Lasa Engenharia e Prospecções S.A.: Rio de Janeiro, Brazil, 2004. [Google Scholar]
  91. GSB—Geological Survey of Brazil. Levantamento Aerogravimétrico Carajás: Relatório Final do Levantamento e Processamento dos Dados Magnetométricos e Gravimétricos; Programa Geologia do Brasil—PGB; Lasa Prospecções, Microsurvey Aerogeofísica: Rio de Janeiro, Brazil, 2015. [Google Scholar]
  92. Briggs, I.C. Machine contouring using minimum curvature. Geophysics 1974, 39, 39–48. [Google Scholar] [CrossRef]
  93. Minty, B. Automatic merging of gridded airborne gamma-ray spectrometric surveys. Explor. Geophys. 2000, 31, 47–51. [Google Scholar] [CrossRef]
  94. de Valeriano, M.M.; de Rossetti, D.F. Topodata: Brazilian full coverage refinement of SRTM data. Appl. Geogr. 2012, 32, 300–309. [Google Scholar] [CrossRef]
  95. Dickson, B.L.; Scott, K.M. Interpretation of aerial gamma-ray surveys—Adding the geochemical factors. AGSO J. Aust. Geol. Geophys. 1997, 17, 187–200. [Google Scholar]
  96. Wilford, J.R.; Bierwirth, P.N.; Craig, M.A. Application of airborne gamma-ray spectrometry in soil/regolith mapping and applied geomorphology. AGSO J. Aust. Geol. Geophys. 1997, 17, 201–216. [Google Scholar]
  97. Ribeiro, V.B.; Mantovani, M.; Louro, V.H.A. Aerogamaespectrometria e suas aplicações no mapeamento geológico. Terrae Didat. 2014, 10, 29–51. [Google Scholar] [CrossRef]
  98. Montreuil, J.F.; Potter, E.G.; Corriveau, L.; Davis, W.J. Element mobility patterns in magnetite-group IOCG systems: The Fab IOCG system, Northwest Territories, Canada. Ore Geol. Rev. 2016, 72, 562–584. [Google Scholar] [CrossRef]
  99. Efimov, A.N. Multiplikativnyi Pokazatel dlja Vydelenija Endogennych rud po Aerogamma-Spektromtriceskim Dannym; Naucno-Proizvodatvennoje Objedinenie “Geofizeka”: Leningrad, Russia, 1978. [Google Scholar]
  100. Gnojek, I.; Přichystal, A. A new zinc mineralization detected by airborne gamma-ray spectrometry in northern Moravia (Czechoslovakia). Geoexploration 1985, 23, 491–502. [Google Scholar] [CrossRef]
  101. Roest, W.R.; Verhoef, J.; Pilkington, M. Magnetic interpretation using the 3-D analytic signal. Geophysics 1992, 57, 116–125. [Google Scholar] [CrossRef]
  102. Gabtni, H.; Jallouli, C. Regional-residual separation of potential field: An example from Tunisia. J. Appl. Geophys. 2017, 137, 8–24. [Google Scholar] [CrossRef]
  103. Pilkington, M.; Tschirhart, V. Practical considerations in the use of edge detectors for geologic mapping using magnetic data. Geophysics 2017, 82, J1–J8. [Google Scholar] [CrossRef]
  104. Pham, L.T.; Oksum, E.; Do, T.D. Edge enhancement of potential field data using the logistic function and the total horizontal gradient. Acta Geod. Geophys. 2019, 54, 143–155. [Google Scholar] [CrossRef]
  105. Clark, C.D.; Wilson, C. Spatial analysis of lineaments. Comput. Geosci. 1994, 20, 1237–1258. [Google Scholar] [CrossRef]
  106. Sartorato, G.B. Análise Estatística de Lineamentos Extraidos de Imagem LANDSAT-TM da Porção Norte do Quadrilátero Ferrífero, Minas Gerais. Master’s Thesis, Universidade Estadual de Campinas, São Paulo, Brazil, 1998. [Google Scholar]
  107. Haddad Martim, P.M. Fractais e Implicações Para Mapas de Favorabilidade Mineral: O Exemplo dos Depósitos iron Oxide-copper-Gold de Carajás (PA). Master’s Thesis, Universidade Estadual de Campinas, São Paulo, Brazil, 2017. [Google Scholar]
  108. Kuhn, M.; Johnson, K. Data Pre-processing. In Applied Predictive Modeling; Springer: New York, NY, USA, 2013; pp. 27–59. [Google Scholar]
  109. Kuhn, S.; Cracknell, M.J.; Reading, A.M. Lithologic mapping using Random Forests applied to geophysical and remote-sensing data: A demonstration study from the Eastern Goldfields of Australia. Geophysics 2018, 83, B183–B193. [Google Scholar] [CrossRef]
  110. Li, T.; Xia, Q.; Zhao, M.; Gui, Z.; Leng, S. Prospectivity Mapping for Tungsten Polymetallic Mineral Resources, Nanling Metallogenic Belt, South China: Use of Random Forest Algorithm from a Perspective of Data Imbalance. Nat. Resour. Res. 2020, 29, 203–227. [Google Scholar] [CrossRef]
  111. Chawla, N.V.; Bowyer, K.W.; Hall, L.O.; Kegelmeyer, W.P. SMOTE: Synthetic Minority Over-sampling Technique. J. Artif. Intell. Res. 2002, 16, 321–357. [Google Scholar] [CrossRef]
  112. Lemaître, G.; Nogueira, F.; Aridas, C.K. Imbalanced-learn: A Python Toolbox to Tackle the Curse of Imbalanced Datasets in Machine Learning. J. Mach. Learn. Res. 2017, 18, 1–5. [Google Scholar]
  113. Skiena, S. Data science design. In Texts in Computer Science; Springer International Publishing: Cham, Switzerland, 2017; ISBN 9783319554433. [Google Scholar]
  114. Cracknell, M.J.; Reading, A.M. Geological mapping using remote sensing data: A comparison of five machine learning algorithms, their response to variations in the spatial distribution of training data and the use of explicit spatial information. Comput. Geosci. 2014, 63, 22–33. [Google Scholar] [CrossRef]
  115. Harris, C.R.; Millman, K.J.; van der Walt, S.J.; Gommers, R.; Virtanen, P.; Cournapeau, D.; Wieser, E.; Taylor, J.; Berg, S.; Smith, N.J.; et al. Array programming with NumPy. Nature 2020, 585, 357–362. [Google Scholar] [CrossRef]
  116. McKinney, W. Data Structures for Statistical Computing in Python. In Proceedings of the 9th Python in Science Conference, Austin, TX, USA, 28 June–3 July 2010; van der Walt, S., Millman, J., Eds.; pp. 56–61. [Google Scholar]
  117. Pedregosa, F.; Varoquaux, G.; Gramfort, A.; Michel, V.; Thirion, B.; Grisel, O.; Blondel, M.; Prettenhofer, P.; Weiss, R.; Dubourg, V.; et al. Scikit-learn: Machine Learning in Python. J. Mach. Learn. Res. 2011, 12, 2825–2830. [Google Scholar]
  118. Chen, T.; Guestrin, C. XGBoost. In Proceedings of the 22nd ACM SIGKDD International Conference on Knowledge Discovery and Data Mining, San Francisco, CA, USA, 13–17 August 2016; ACM: New York, NY, USA, 2016; pp. 785–794. [Google Scholar]
  119. Hunter, J.D. Matplotlib: A 2D graphics environment. Comput. Sci. Eng. 2007, 9, 90–95. [Google Scholar] [CrossRef]
  120. Plotly Technologies Inc. Collaborative Data Science. 2015. Available online: https://plot.ly (accessed on 14 October 2025).
  121. Hastie, T.; Tibshirani, R.; Friedman, J. Linear Methods for Classification. In The Elements of Statistical Learning. Springer Series in Statistics; Springer: New York, NY, USA, 2009; pp. 101–137. [Google Scholar]
  122. Cover, T.M.; Hart, P.E. Nearest Neighbor Pattern Classification. IEEE Trans. Inf. Theory 1967, 13, 21–27. [Google Scholar] [CrossRef]
  123. Freund, Y.; Schapire, R.E. A Decision-Theoretic Generalization of On-Line Learning and an Application to Boosting. J. Comput. Syst. Sci. 1997, 55, 119–139. [Google Scholar] [CrossRef]
  124. Vapnik, V.N. Statistical Learning Theory; Wiley: New York, NY, USA, 1998. [Google Scholar]
  125. Breiman, L. Random forests. Mach. Learn. 2001, 45, 5–32. [Google Scholar] [CrossRef]
  126. Gardner, M.W.; Dorling, S.R. Artificial neural networks (the multilayer perceptron)—A review of applications in the atmospheric sciences. Atmos. Environ. 1998, 32, 2627–2636. [Google Scholar] [CrossRef]
  127. Yadav, S.; Shukla, S. Analysis of k-Fold Cross-Validation over Hold-Out Validation on Colossal Datasets for Quality Classification. In Proceedings of the 6th International Advanced Computing Conference, IACC, Bhimavaram, India, 27–28 February 2016; IEEE: Bhimavaram, India, 2016; pp. 78–83. [Google Scholar]
  128. Wong, T.T.; Yang, N.Y. Dependency Analysis of Accuracy Estimates in k-Fold Cross Validation. IEEE Trans. Knowl. Data Eng. 2017, 29, 2417–2427. [Google Scholar] [CrossRef]
  129. Wong, T.T.; Yeh, P.Y. Reliable Accuracy Estimates from k-Fold Cross Validation. IEEE Trans. Knowl. Data Eng. 2020, 32, 1586–1594. [Google Scholar] [CrossRef]
  130. Zuo, R.; Carranza, E.J.M. Support vector machine: A tool for mapping mineral prospectivity. Comput. Geosci. 2011, 37, 1967–1975. [Google Scholar] [CrossRef]
  131. Lundberg, S.; Lee, S.-I. A Unified Approach to Interpreting Model Predictions. In Proceedings of the 31st I Conference on Neural Information Processing Systems (NIPS 2017), Long Beach, CA, USA, 4–9 December 2017; pp. 4768–4777. [Google Scholar]
  132. Fan, M.; Xiao, K.; Sun, L.; Xu, Y. Metallogenic prediction based on geological-model driven and data-driven multisource information fusion: A case study of gold deposits in Xiong’ershan area, Henan Province, China. Ore Geol. Rev. 2023, 156, 105390. [Google Scholar] [CrossRef]
  133. Siepierski, L.; Ferreira Filho, C.F. Magmatic structure and petrology of the Vermelho Complex, Carajás Mineral Province, Brazil: Evidence for magmatic processes at the lower portion of a mafic-ultramafic intrusion. J. S. Am. Earth Sci. 2020, 102, 102700. [Google Scholar] [CrossRef]
  134. Costa, I.S.L.; de Serafim, I.C.C.O.; Tavares, F.M.; de Polo, H.J.O. Uranium anomalies detection through Random Forest regression. Explor. Geophys. 2020, 51, 555–569. [Google Scholar] [CrossRef]
  135. Correa, R.T.; Vidotti, R.M.; Guedes, V.J.C.B.; Scandolara, J.E. Mapping the Thermal Structure of the Amazon Craton to Constrain the Tectonic Domains. J. Geophys. Res. Solid Earth 2022, 127, e2021JB023025. [Google Scholar] [CrossRef]
  136. James, G.; Witten, D.; Hastie, T.; Tibshirani, R. Linear Model Selection and Regularization. In An Introduction to Statistical Learning. Springer Texts in Statistics; Springer: New York, NY, USA, 2021; pp. 225–288. [Google Scholar]
  137. Anowar, F.; Sadaoui, S.; Selim, B. Conceptual and empirical comparison of dimensionality reduction algorithms (PCA, KPCA, LDA, MDS, SVD, LLE, ISOMAP, LE, ICA, t-SNE). Comput. Sci. Rev. 2021, 40, 100378. [Google Scholar] [CrossRef]
  138. Pareek, J.; Jacob, J. Data compression and visualization using PCA and t-SNE. In Lecture Notes in Networks and Systems; Springer: Singapore, 2021; Volume 135, p. 327. [Google Scholar]
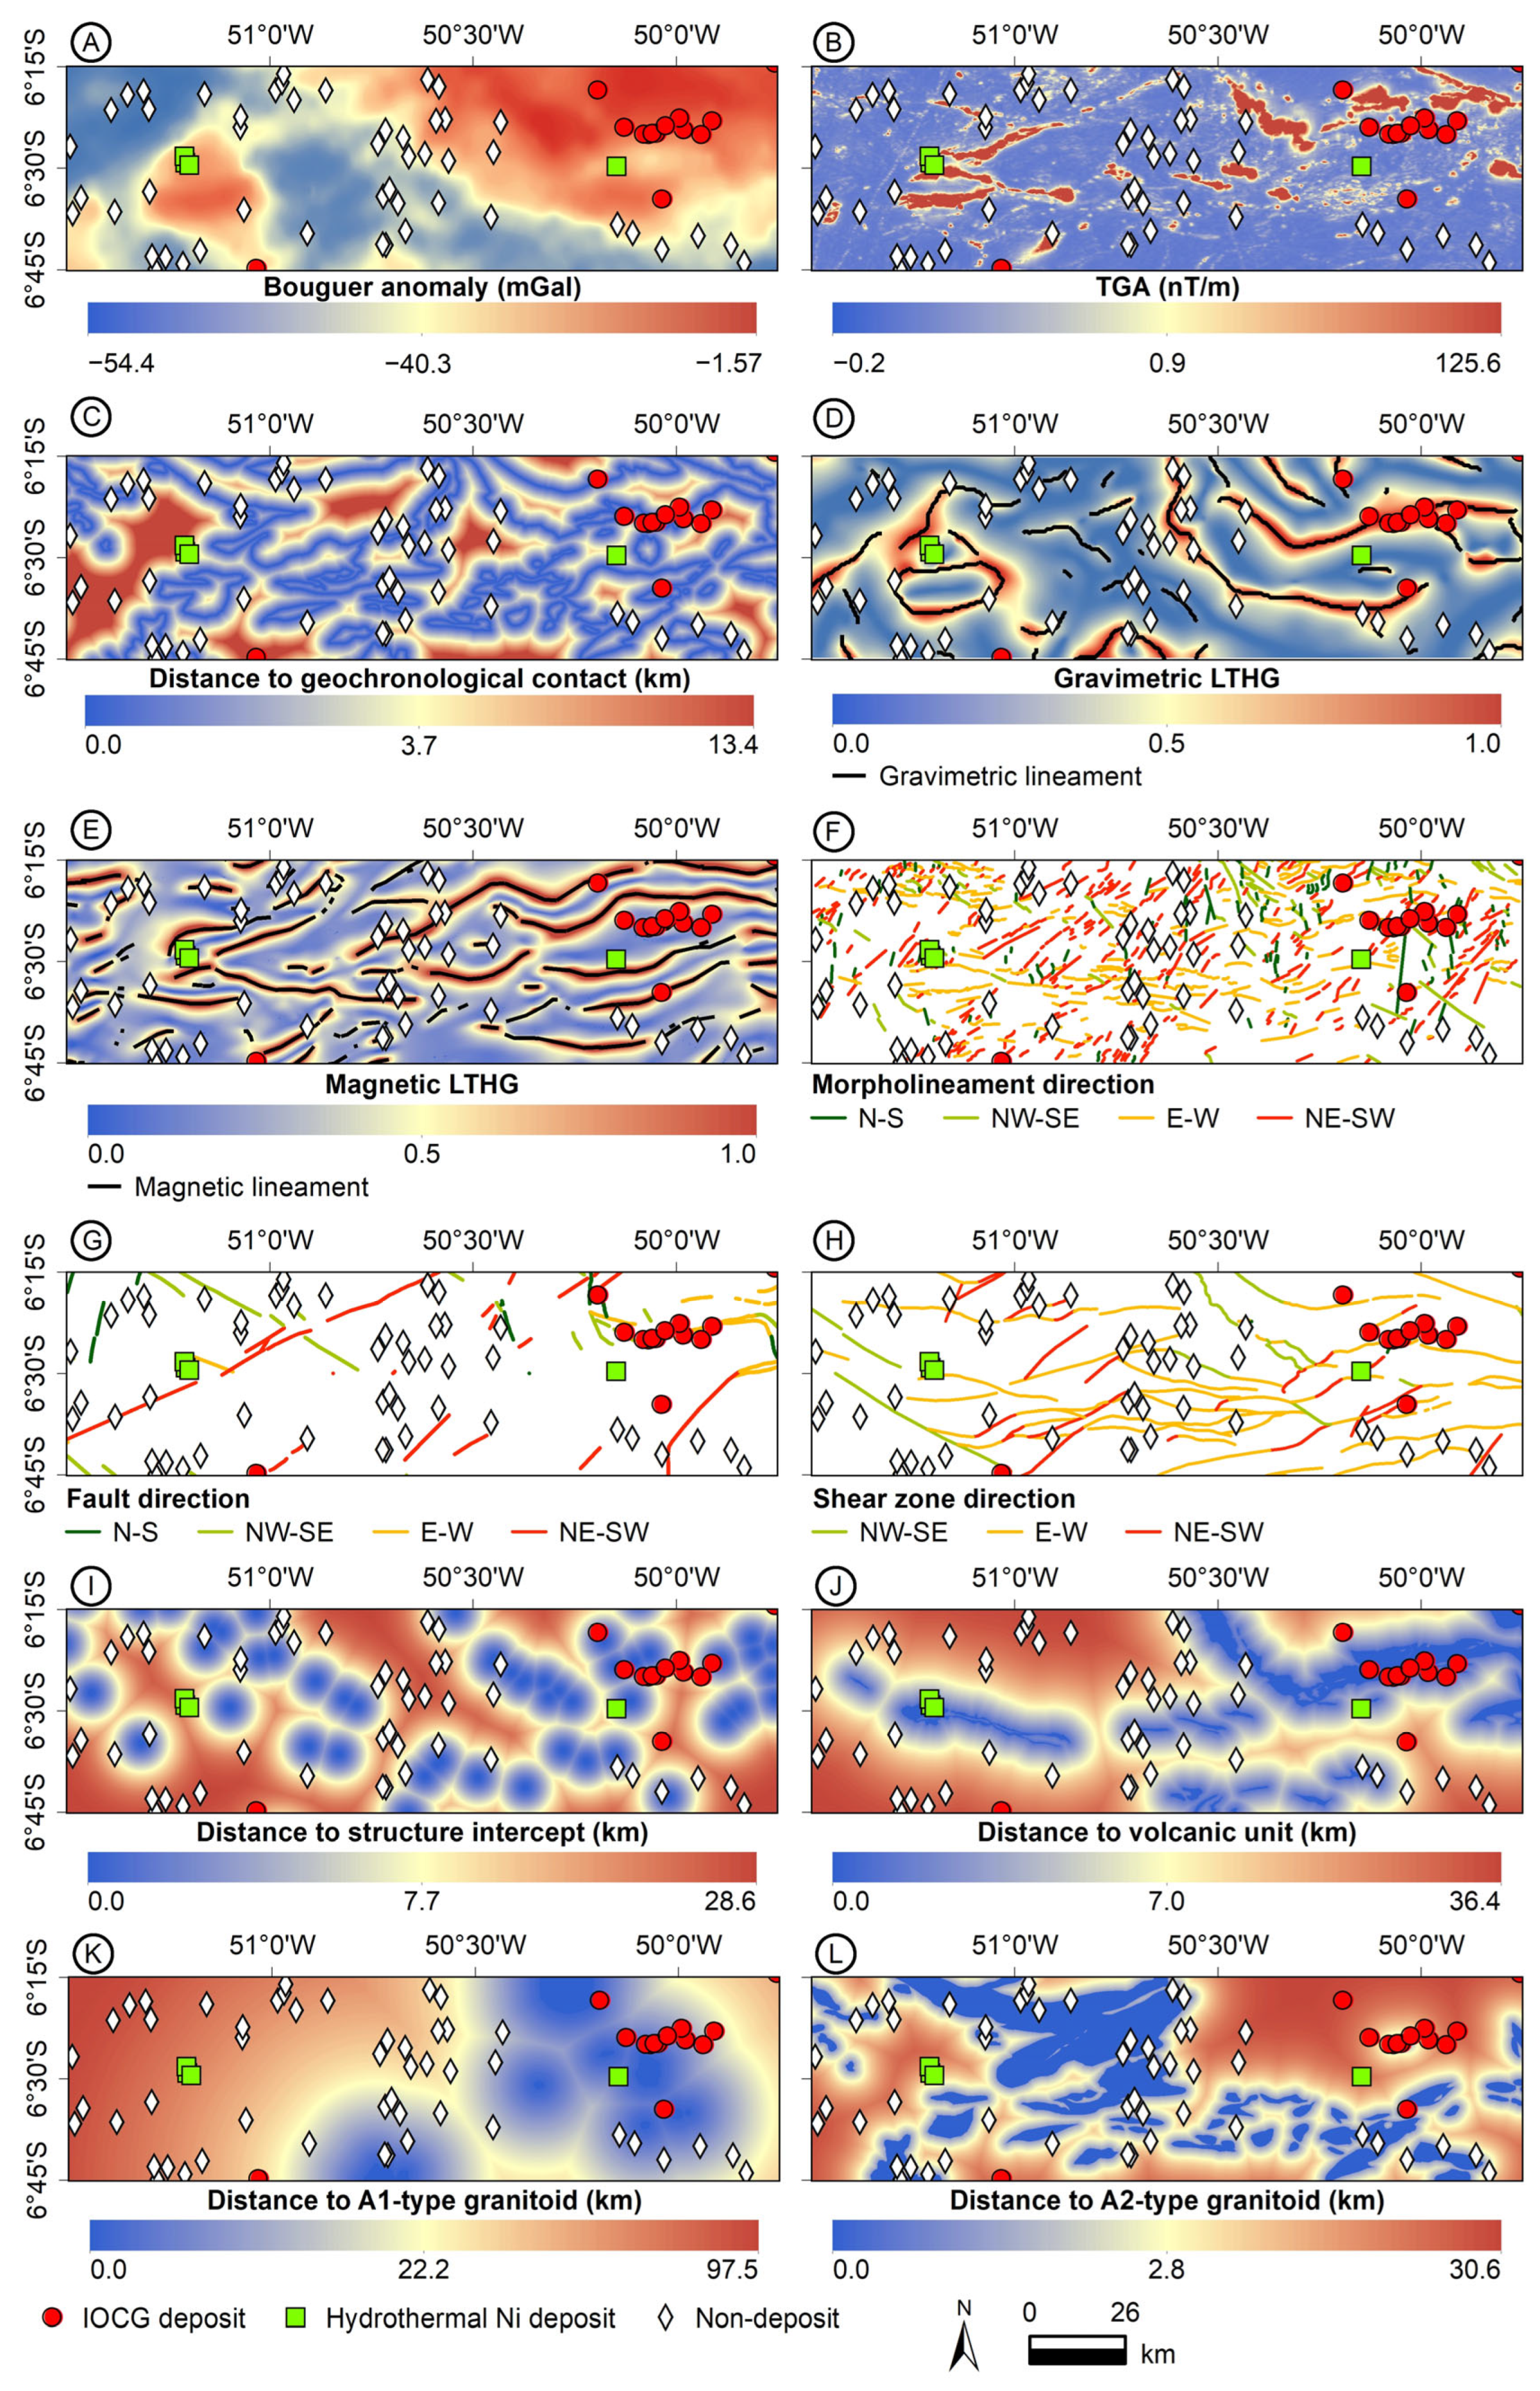
Figure 2. Potential, structural and geological data input for the machine learning predictive study. (A) Bouguer anomaly map. (B) TGA map. (C) Distance to geochronological contact. (D) LTHG in gravimetry data and interpreted gravimetric lineament. (E) Interpreted magnetic lineament from LTHG of total magnetic intensity. (F) Morpholineament, (G) fault, and (H) shear zone classified by direction set. (I) Distance to structure intercept, (J) volcanic unit, (K,L) A1- and A2-type granites.
Minerals 15 01086 g002
Figure 3. Distance to mafic–ultramafic suite (A) and radiometric data (BJ) used in this machine learning predictive study. (B) Total count. (C) Potassium. (D) Equivalent uranium. (E) Equivalent thorium. (F) K/eTh ratio. (G) eU/eTh ratio. (H) F-parameter. (I) K2/eTh ratio. (J) eU2/eTh ratio.
Minerals 15 01086 g003
Figure 4. Box-and-whisker plots of parameters used in mineral prospectivity mapping of the Carajás Province, divided into regional data (Reg), non-deposit samples (ND), IOCG deposits (IOCG), and hydrothermal nickel deposits (HNi). Means are shown by central lines, outliers by circles. Grav = gravimetric lineament, Mag = magnetic lineament, SZ = shear zone, Morpho = morpholineament, MUM = mafic-ultramafic unit, Volc = volcanic unit, A2-GRA = A2-type granite, A1-GRA = A1-type granite. The white circles represent outliers.
Minerals 15 01086 g004
Figure 5. Pearson correlation matrix of parameters. Grav = gravimetric lineament, Mag = magnetic lineament, SZ = shear zone, Morpho = morpholineament, MUM = mafic-ultramafic unit, Volc = volcanic unit, A2-GRA = A2-type granite, A1-GRA = A1-type granite.
Minerals 15 01086 g005
Figure 6. Cross-validation metric values with a 95% confidence interval (CI) for different machine learning algorithms on the test dataset.
Minerals 15 01086 g006
Figure 7. Confusion matrices of machine learning algorithms on the training dataset. Classes are hydrothermal nickel deposits (HNi), IOCG deposits (IOCG), and non-deposit samples (ND).
Minerals 15 01086 g007
Figure 8. SHAP feature importances for the SVM model in mineral prospectivity prediction. Grav = gravimetric lineament, Mag = magnetic lineament, SZ = shear zone, Morpho = morpholineament, MUM = mafic-ultramafic unit, Volc = volcanic unit, A2-GRA = A2-type granite, A1-GRA = A1-type granite.
Minerals 15 01086 g008
Figure 9. SHAP summary plots for the SVM model across three classes (hydrothermal nickel deposit, IOCG deposit, and non-deposit). Features are ranked by mean absolute SHAP value; colors represent the original feature value. Grav = gravimetric lineament, Mag = magnetic lineament, SZ = shear zone, Morpho = morpholineament, MUM = mafic-ultramafic unit, Volc = volcanic unit, A2-GRA = A2-type granite, A1-GRA = A1-type granite.
Minerals 15 01086 g009
Figure 10. SVM-predicted prospective areas for IOCG (A) and hydrothermal nickel (B) deposits in the Southern Copper Belt.
Minerals 15 01086 g010
Figure 11. Geological map of the eastern (A) and western (B) Southern Copper Belt, highlighting high-prospective areas for IOCG and hydrothermal nickel deposits.
Minerals 15 01086 g011
Figure 12. Prediction probabilities for known deposits in the Southern Copper Belt. Probabilities for hydrothermal nickel deposits are shown in italic at the base of each bar, and those for IOCG deposits in regular font at the top.
Minerals 15 01086 g012
Figure 13. Prediction–area plot for the SVM model to IOCG and hydrothermal nickel deposits in the Southern Copper Belt.
Minerals 15 01086 g013
Table 1. Critical processes and proxies of the mineral potential mapping (modified from [24]).
Critical
Process
Source
(Magma, Metals)
Active
Pathway
Fluid ThrottleChemical Scrubber
Constituent processesDeep alkaline magmatic sourceTrans-crustal and craton-scale fault zonesDecompression evidenced by brecciation zonesFluid mixing
Metasomatized subcontinental lithospheric mantle and sources of metals, ligands, and sulfurLithospheric craton margins/older suturesHigh geothermal gradientFluid interaction with wall and host rocks
Targeting ElementsAlkaline magmatism associated with ultrabasic to basic rocksSuture zones between terrains of distinct agesThe occurrence of a large brecciation zoneKey alteration minerals (magnetite, biotite, albite, amphibole, U- and REE-bearing minerals)
Suture zones with multiple orogeny eventsIntense hydrothermal activityRocks with favorable chemistry (magnetite-rich alteration zones)
Mappable Targeting CriteriaContacts between Mesoarchean, Neoarchean, Paleoproterozoic units
(geochronological contacts), occurrences of volcanic, granitic, and mafic–ultramafic rocks
Structures mapped by gravity and magnetic lineamentsMorpholineament, faults and shear zoneRadiometric channels, ratios and magnetic highs
Table 2. Initial and optimal hyperparameters with F1 scores from cross-validation on the training dataset for machine learning algorithms in the prospective study. CI = 95 % confidence intervals.
ModelParameterDescriptionRange/ValuesOptimal ValueF1 ScoreCI
Logistic Regression (LR)penaltyType of regularization appliedL1, L2, elasticnet, noneL10.9620.029
CInverse of regularization strength0.001–1000 (logspace)2.154
solverOptimization algorithmSagaSaga
max_iterMaximum number of iterations100–1000100
K-Nearest Neighbors (KNN)n_neighborsNumber of neighbors to use3–1530.9190.056
weightsThe weight function used in predictionUniform, distanceDistance
metricDistance metricEuclidean, Manhattan, MinkowskiEuclidean
AdaBoost (ADA)n_estimatorsNumber of weak learners50–300500.9610.031
learning_rateControls the contribution of each weak learner0.01–1.00.01
Support Vector Machine (SVM)CPenalty parameter of the error term0.001–1000 (logspace)2.1540.9910.017
gammaDefines the influence of a single training example0.001–100, autoAuto
kernelType of kernel used in the algorithmPoly, RBFRBF
Random Forest (RF)n_estimatorsNumber of trees in the forest25–2005000.9800.024
max_depthMaximum depth of each tree15–30, none25
criterionFunction to measure the quality of a splitGini, entropyGini
min_samples_splitMinimum number of samples required to split2, 5, 101
min_samples_leafMinimum number of samples at a leaf node1, 2, 5, 102
XGBoost (XGB)etaStep size shrinkage0.01–0.10.050.9710.027
learning_rateShrinks feature weights0.1–0.40.35
gammaMinimum loss reduction for further partitioning0.05–1.01.0
max_depthMaximum depth of a tree3–2515
min_child_weightMinimum sum of instance weights in a child1, 3, 5, 71
subsample/colsample_bytreeSubsample ratio of training instances/features0.6–1.00.8/0.6
reg_lambda/alphaL2 and L1 regularization terms0.001–1000 (logscale)1/0.1
Multilayer Perceptron (MLP)hidden_layer_sizesNumber and size of hidden layers(10) to (20,20)(20,20,20)0.9810.024
activationActivation functionLogistic, Tanh, ReluLogistic
solverOptimization algorithmLBFGS, SGD, AdamAdam
alphaL2 penalty (regularization term)0.001–1000 (logscale)0.001
learning_rateLearning rate scheduleConstant, adaptiveAdaptive
learning_rate_initInitial learning rate0.0001–0.30.15
max_iterMaximum number of training iterations50–200100
Disclaimer/Publisher’s Note: The statements, opinions and data contained in all publications are solely those of the individual author(s) and contributor(s) and not of MDPI and/or the editor(s). MDPI and/or the editor(s) disclaim responsibility for any injury to people or property resulting from any ideas, methods, instructions or products referred to in the content.