Article

Hydrometallurgical Recovery of Critical Metal Indium from Scrap LCD Panels

1
Metal Extraction and Recycling Division, CSIR-National Metallurgical Laboratory, Jamshedpur 831007, India
2
Department of Chemistry, National Institute of Technology, Jamshedpur 831014, India
3
Department of Energy and Resources Engineering, Korea Maritime and Ocean University (KMOU), Busan 49112, Republic of Korea
*
Authors to whom correspondence should be addressed.
Minerals 2025, 15(10), 1084; https://doi.org/10.3390/min15101084 (registering DOI)
Submission received: 27 September 2025 / Revised: 11 October 2025 / Accepted: 16 October 2025 / Published: 18 October 2025
(This article belongs to the Special Issue Application of Nanomaterials in Mineral Processing)

Abstract

Indium, widely used in indium–tin oxide (ITO) coatings for liquid crystal displays (LCDs), is a scarce and strategically important metal with increasing demand. Recycling waste LCD panels offers an efficient secondary source to address supply risks and environmental concerns. In this study, a hydrometallurgical flow sheet was developed under mild conditions for indium (In) recovery. Leaching trials with sulphuric acid at varying concentrations, pulp densities, temperatures, and times showed that 5% H2SO4 (v/v) with 100 g/L pulp density at 60 °C for 30 min achieved ~98% dissolution of In, while minimizing the co-leaching of Al and Sn. Kinetic analysis indicated a diffusion-controlled mechanism for In dissolution with an activation energy of 21.2 kJ mol−1. The leached liquor was further purified through solvent extraction by 20% Cyanex 921 (v/v), achieving optimum In extraction at pH 2.5 with an organic-to-aqueous phase ratio of 1/3, reaching equilibrium within 15 min. The McCabe–Thiele plot shown indicates the complete In extraction in two stages. FT-IR studies confirmed the In-extractant bonding at optimized conditions. 10% H2SO4 (v/v) was used for the stripping of In from the loaded organic, ensuring nearly complete back-transfer of indium with excellent phase separation. The integrated process yielded ~97% In recovery in stripping. The pure salt of Indium could be obtained by evaporation/crystallization of pure indium solution. The developed process has the potential to be transferred for commercial exploitation after scale-up and pilot trial.

1. Introduction

The growing demand for advanced display technologies and transparent conductive oxides (TCOs) has significantly increased global indium consumption. Indium has been classified as a critical metal by both the European Union and the United States Geological Survey (USGS) due to its limited primary resources, high economic importance, and supply risk [1,2]. Indium, primarily used in the form of indium–tin oxide (ITO) for flat panel displays, touchscreens, and photovoltaic devices, is recognized as a scarce and strategically important metal. For India, where primary reserves are negligible, dependence on imports creates both economic challenges and supply chain vulnerabilities. In 2023 alone, India imported more than 639,000 kg of specialty metals, including indium under the HS code “gallium, hafnium, indium, niobium, rhenium, or thallium,” valued at over USD 12 million, with the majority sourced from China [3]. This dependence underscores the urgency of developing secondary recovery routes. Recycling offers a distinct advantage, since indium content in ITO coatings on LCD glass often exceeds 0.05%, compared to less than 0.01% in natural ores [4]. Thus, end-of-life LCD panels represent not only an environmentally responsible waste management option but also one of the most promising alternative resources for indium.
Indium recovery from waste LCDs is most often carried out using hydrometallurgical methods. This approach generally involves acid leaching of the ITO layer, followed by separation and purification of indium from the leach liquor. Silveira et al. milled phone-LCD waste, then leached at 1.0 M H2SO4, 90 °C, 1 h, with a solid:liquid ratio of 1:50 and stirring at 500 rpm, and achieved 96.4 wt.% indium dissolution; subsequent precipitation at pH 7.4 with NH4OH yielded 99.8 wt.% indium precipitation [5]. However, precipitation can co-precipitate impurity ions and requires careful pH control. Willner et al. used bioleaching (Acidithiobacillus consortium) in 9 K medium on LCD scrap and obtained 55.6% indium dissolution in 35 days [6]. However, the slow kinetics and incomplete recovery make it less practical. Guan et al. used pyro-chlorination via HCl released from PVC decomposition at ~400–500 °C and achieved 97.5% indium recovery, but high temperatures and gas handling are challenging [7]. Ma and Xu et al. applied vacuum pyrolysis (~300 °C under 50 Pa) followed by chlorination and reported 99.97% indium recovery for fine particle sizes (<0.16 mm) using 50 wt.% NH4Cl at 450 °C also applied vacuum carbon reduction at 1223 K with 30 wt.% carbon under 1 Pa for 30 min, achieving ~90 wt.% indium recovery [8]. Although high recovery was achieved, the pyro-metallurgical route requires elevated temperatures, vacuum conditions, and chlorinating agents, which significantly increase energy consumption and operational costs. Moreover, vacuum pyrolysis and subsequent chlorination generate gaseous effluents containing chlorinated species. These factors contribute to a larger environmental footprint and make the process less sustainable compared to hydrometallurgical techniques, which typically operate under milder conditions, produce fewer hazardous emissions, and have lower overall energy requirements. Fortin-Lecomte et al. leached with 0.2 M H2SO4 (70 °C, 30 min, high pulp) to get ~102 PPM In, then used D2EHPA-impregnated ion-exchange (Lewatit VP OC 1026 (LANXESS GmbH, Cologne, Germany)) with capacity ~34.6 mg g−1; elution in 5 M HCl gave full recovery and final In solution ~242 PPM with low impurities [9]. Lahti et al. leached LCD panels with 1 M H2SO4 at 80 °C and obtained 94.1–99.8% leaching (avg. ~97.4%); but they found high organic loads (>3000 PPM) in leachate impede phase separation in extraction, requiring membrane pre-treatment [10]. Souada et al. used ultrasound-assisted leaching in 18 M H2SO4 at 60 °C, achieving nearly quantitative indium yield in 3–4 min compared to ~70% without ultrasound; the use of very high acid strength and ultrasound infrastructure is a drawback [11]. Luo et al. proposed simultaneous leaching and extraction with acidic ionic liquid (IL) and achieved 99.7% leaching plus 98.6% distribution into the IL phase, but the cost and stability of ILs and scaling remain concerns [12].
A novel flow sheet for indium recovery has been prepared using mild conditions and easily available reagents. In this approach, the LCD panels were manually separated from scrap monitors, then crushed, followed by pulverization. The pulverized LCD panels were then leached in optimized conditions, which ensures rapid dissolution of In while minimizing the co-dissolution of impurities in the leach liquor. The dissolved In was then extracted with 20% Cyanex 921 diluted in kerosene with 2% isodecanol as a modifier at optimized conditions. Finally, stripping with H2SO4 produces a pure solution containing In. The use of dilute acid, moderate temperature, and short leaching time lowers both chemical and energy requirements, while the simplified extraction and stripping steps avoid the need for expensive ionic liquids, complex membranes, or high-temperature operations. This integrated scheme directly addresses the limitations of earlier methods, such as long processing times, costly reagents, or difficult downstream purification, while maintaining high efficiency and product quality. The present work also describes the systematic scientific studies with validation using proven models.

2. Materials and Methods

2.1. Materials

Scrap monitors (HCM 700PA (Dell Inc., Round Rock, USA), Samsung MJ19ASSS/XTP (Samsung Electronics Co. Ltd., Suwon, Republic of Korea), and Belinea 10 17 10 (MAXDATA Computer GmbH, Marl, Germany)) were used as the primary source materials in this study. Sulfuric acid (H2SO4, 98 wt.%), hydrochloric acid (HCl, 37 wt.%), and nitric acid (HNO3, 70 wt.%) were obtained from E. Merck, Mumbai, India. Filtration was carried out using Whatman filter papers (Cytiva, Marlborough, MA, USA) (No. 42). All chemicals employed were of analytical grade.
The pulverized LCD panels were digested in aqua regia, prepared by mixing hydrochloric acid and nitric acid in a 3:1 ratio. This process allowed all the metal components in the sample to dissolve into the solution. The solution was then analyzed to find out the weight percentages of metals it contained. For this, Inductively Coupled Plasma Optical Emission Spectroscopy (ICP-OES, iCAP 7000 Series, ICP-OES (iCAP 7000 Series, Thermo Fisher Scientific, Waltham, MA, USA)) was used. The chemical composition (%) of metals in LCD panels is listed in Table 1. FT-IR spectra of In-loaded Cyanex 921 were obtained using a FT-IR spectrometer (Nicolet 5700, Thermo Fisher Scientific, Waltham, MA, USA) with a KBr pellet.
Ionquest 290 (bis (2, 4, 4-trimethylpentyl) phosphinic acid); density: 0.91 g/mL at 20 °C, D2EHPA (di-2-ethylhexylphosphoric acid); density: 0.97 g/mL at 20 °C, Cyanex 921 (trioctylphosphine oxide); density: 0.88 g/mL at 20 °C sourced from M/s Cognis Corporation, Ireland, from Fluka, AG, Switzerland, were used for separation and purification process. Commercial-grade kerosene oil; density: 0.78 g/mL at 20 °C was used as diluent for extractants, while isodecanol; density: 0.838 g/mL at 20 °C was used as phase modifier to improve the separation of organic and aqueous phases. Distilled water, density: 0.99 g/mL at 20 °C, was used for the experiments.

2.2. Method

2.2.1. Leaching

The pulverized LCD panel samples were subjected to leaching in a three-necked glass reactor fitted with a condenser to prevent the loss of vapors during the process. The reactor setup was placed on a hot plate (Model HLS200, Labquest by Borosil, Mumbai, India) equipped with a built-in temperature sensor and a magnetic stirrer, which ensured precise control of temperature as well as uniform agitation of the slurry at 450 rpm throughout the experiment. Once the leaching process was completed, the resulting suspension was carefully filtered to separate the filtrate, referred to as the leach liquor, from the remaining solid residue. The overall procedure and setup are illustrated schematically in Figure 1.

2.2.2. Solvent Extraction

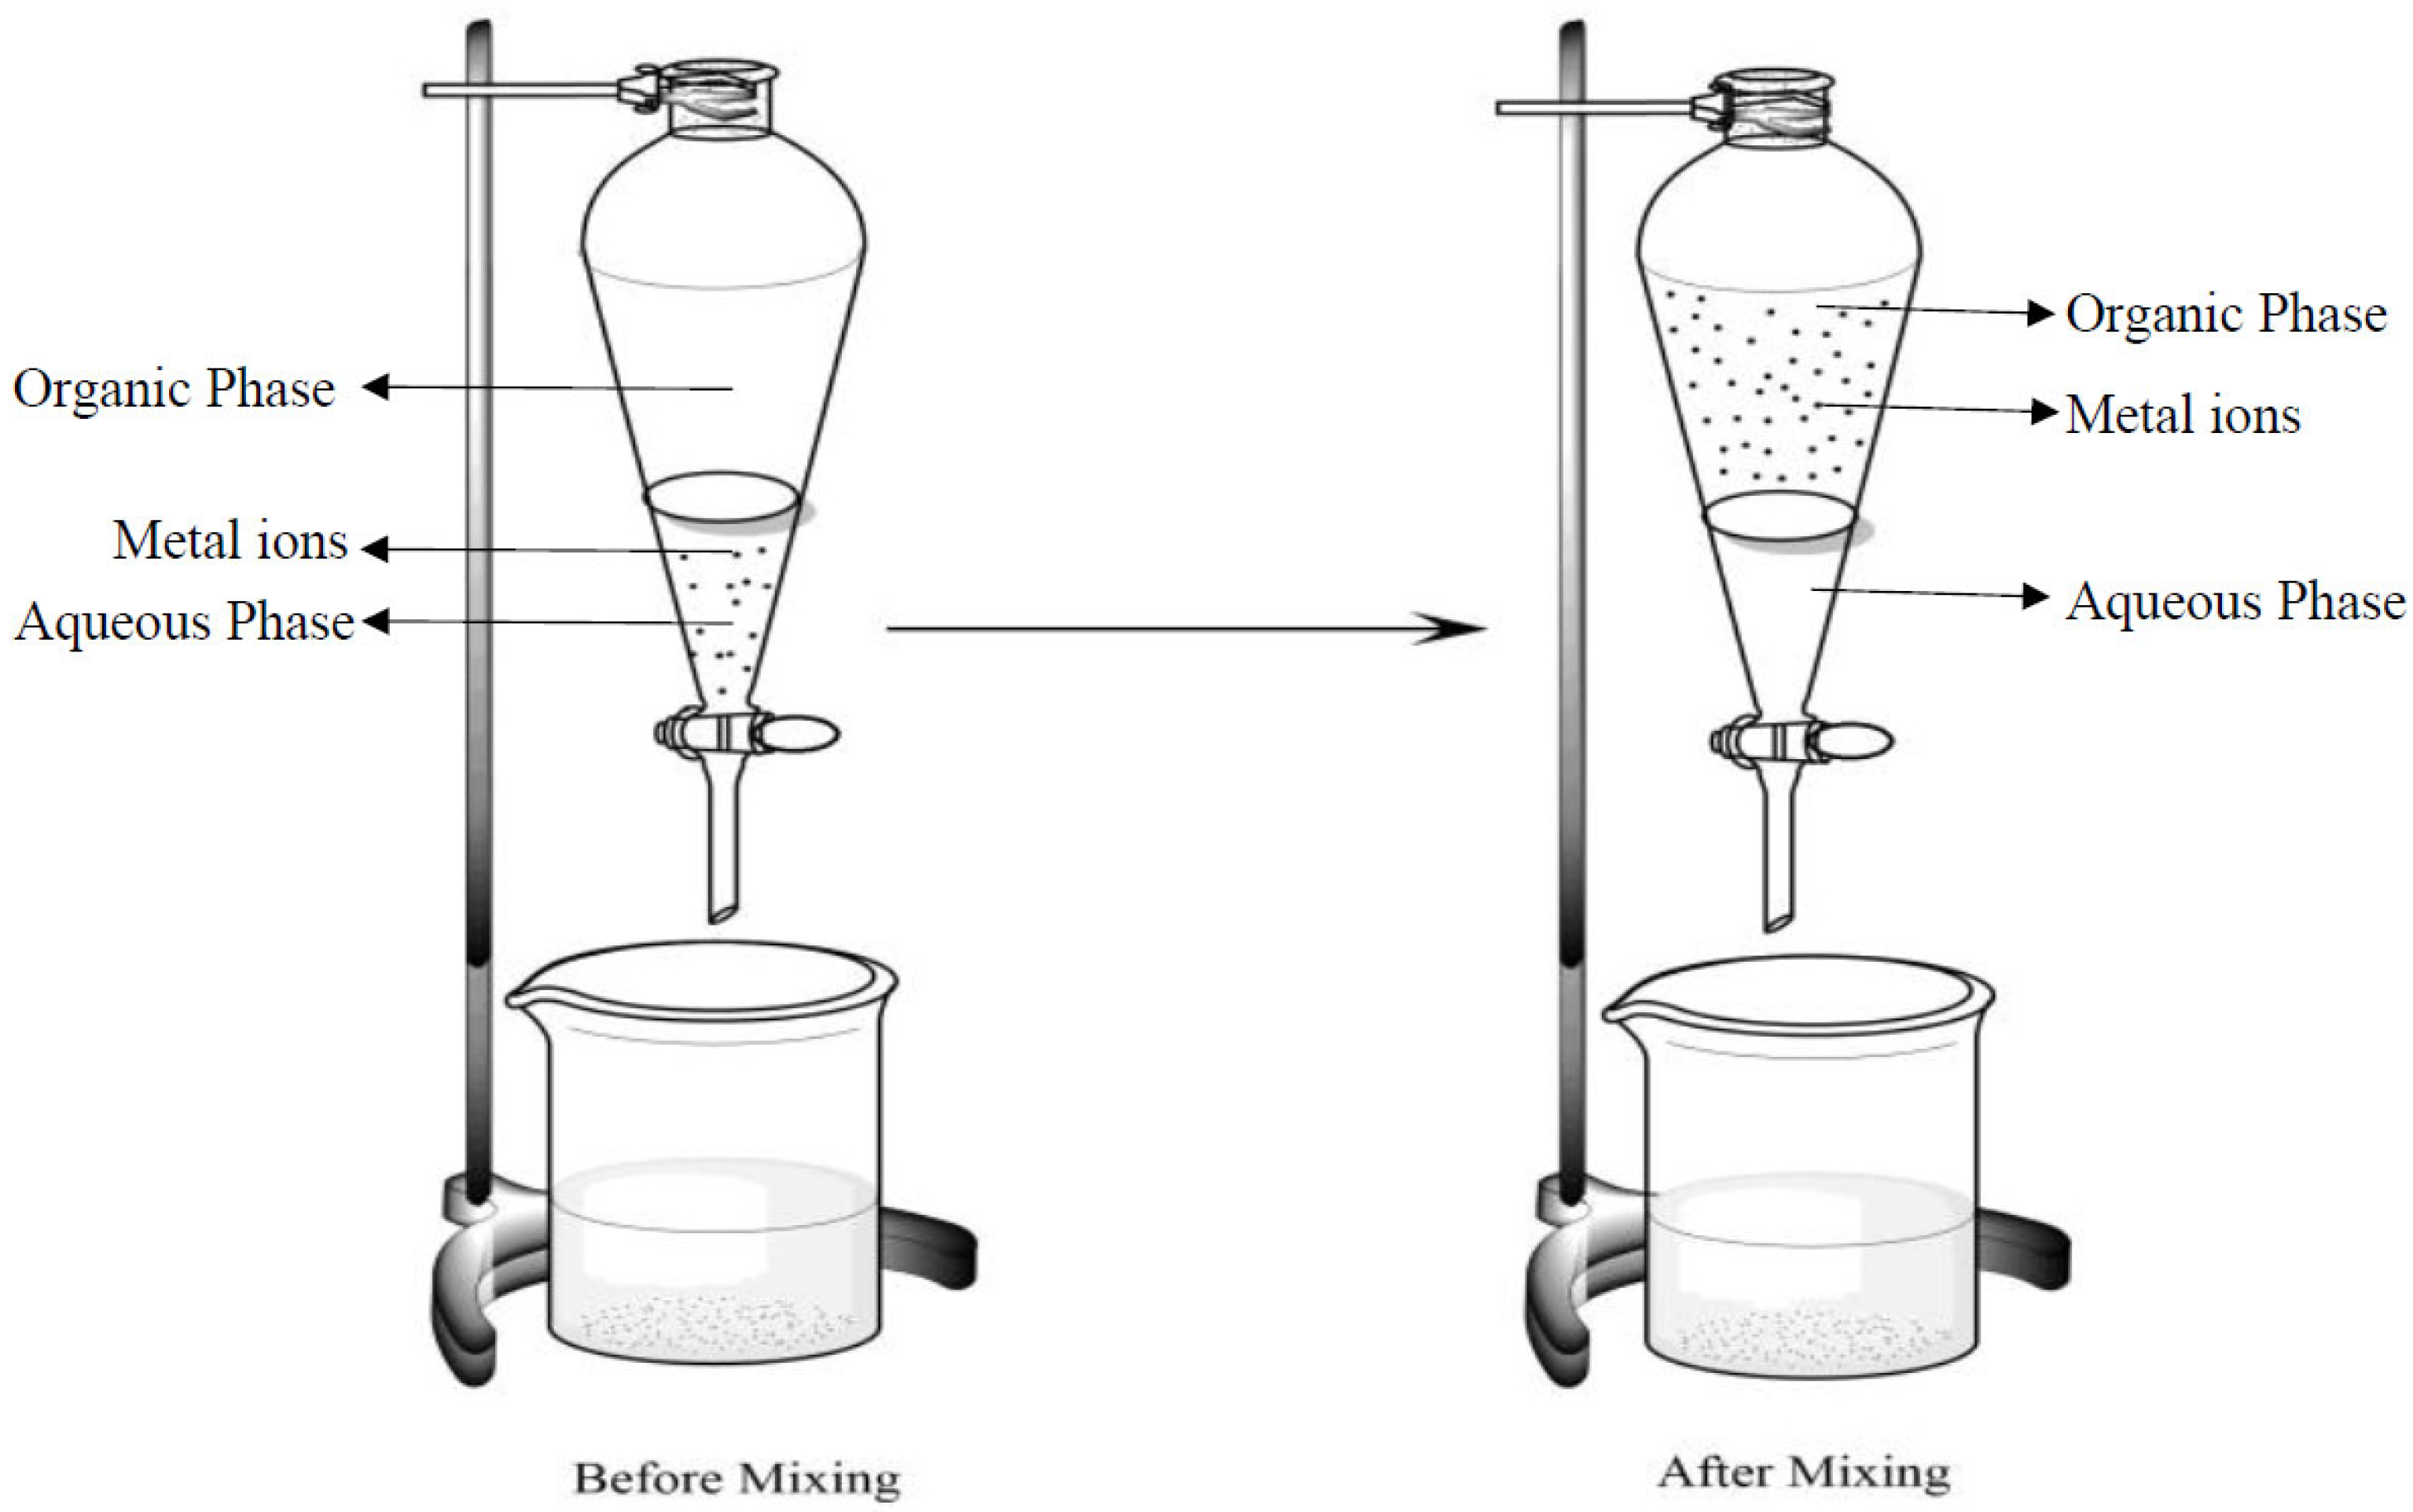
In the solvent extraction process, the organic and the aqueous phases were mixed vigorously inside a beaker that was at room temperature for 15 min. After that, the mixture was poured into the separating funnel. After waiting for some minutes, two layers were formed. The density of the organic phase is lower than that of the aqueous phase, due to which the aqueous phase settles below the organic phase. After that, both layers were separated out. Figure 2 represents the schematic diagram for the solvent extraction process. The organic phase was then scrubbed with warm distilled water to remove impurities. The metal ions were then stripped out from the organic phase by using 10% H2SO4.

3. Result and Discussion

Hydrometallurgical process parameters were systematically investigated to optimize the leaching and extraction of In from LCD panels. The experimental process was carried out using pre-treatment followed by leaching and further solvent extraction. The experimental processes are discussed as follows.

3.1. Pre-Treatment

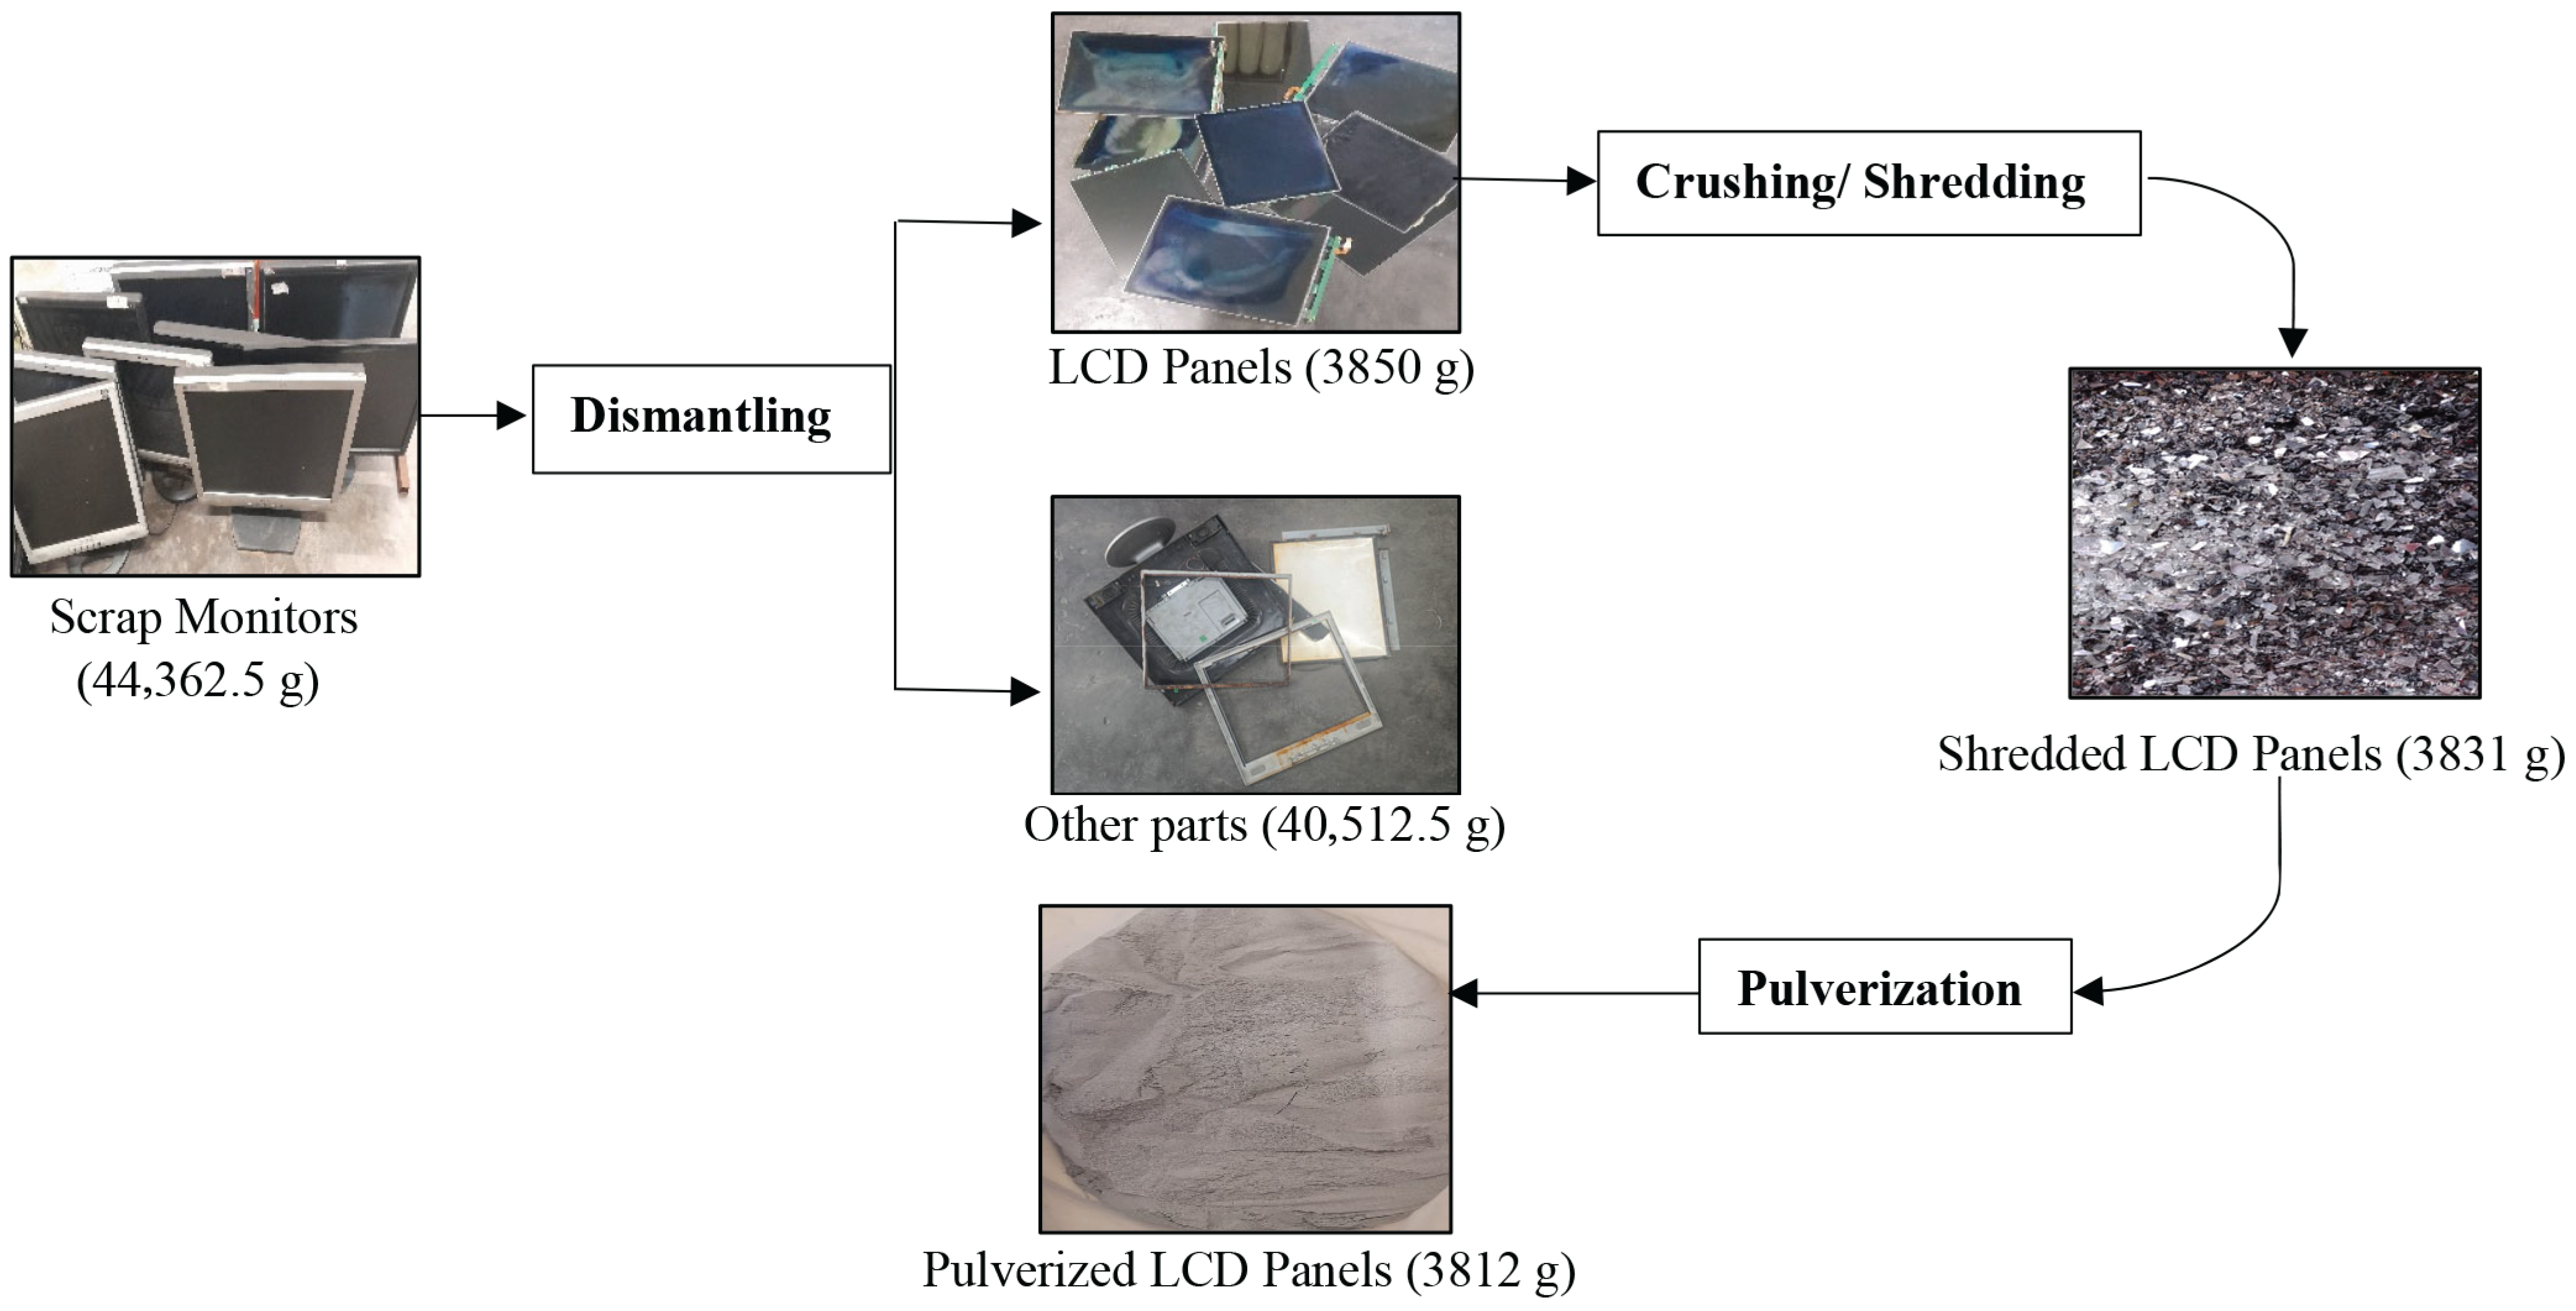
Figure 3 presents a detailed stepwise flowsheet outlining the mechanical pre-treatment of LCD panels obtained from discarded monitors. A bulk quantity of scrap monitors, weighing 44,362.5 g, was first dismantled in order to recover the LCD panels, which accounted for 3850 g of the total weight. These extracted panels were then subjected to crushing and shredding using a shredder machine, a step aimed at reducing their size up to 2–5 mm and increasing the surface area available for subsequent processing. This operation yielded 3831 g of shredded material. The shredded fraction was further pulverized into a fine powder using a pulverizer, resulting in 3812 g of homogenized LCD material. This final stage of pulverization improved the uniformity and reactivity of the sample by reducing the size of the sample up to 0.2–0.4 mm, thereby rendering it suitable for subsequent hydrometallurgical treatment.

3.2. Leaching Studies

To dissolve In, leaching studies were investigated by optimizing various process parameters, viz. selection of leaching agent, effect of acid concentration, effect of time, temperature, pulp density, etc. Based on the obtained results, leaching kinetics were studied, and activation energy was calculated. Each section of the study was developed based on the results obtained from replicating three independent sets of experiments, ensuring the reliability, repeatability, and statistical variability of the observations with ±2% variance.

3.2.1. Selection of Leaching Agent

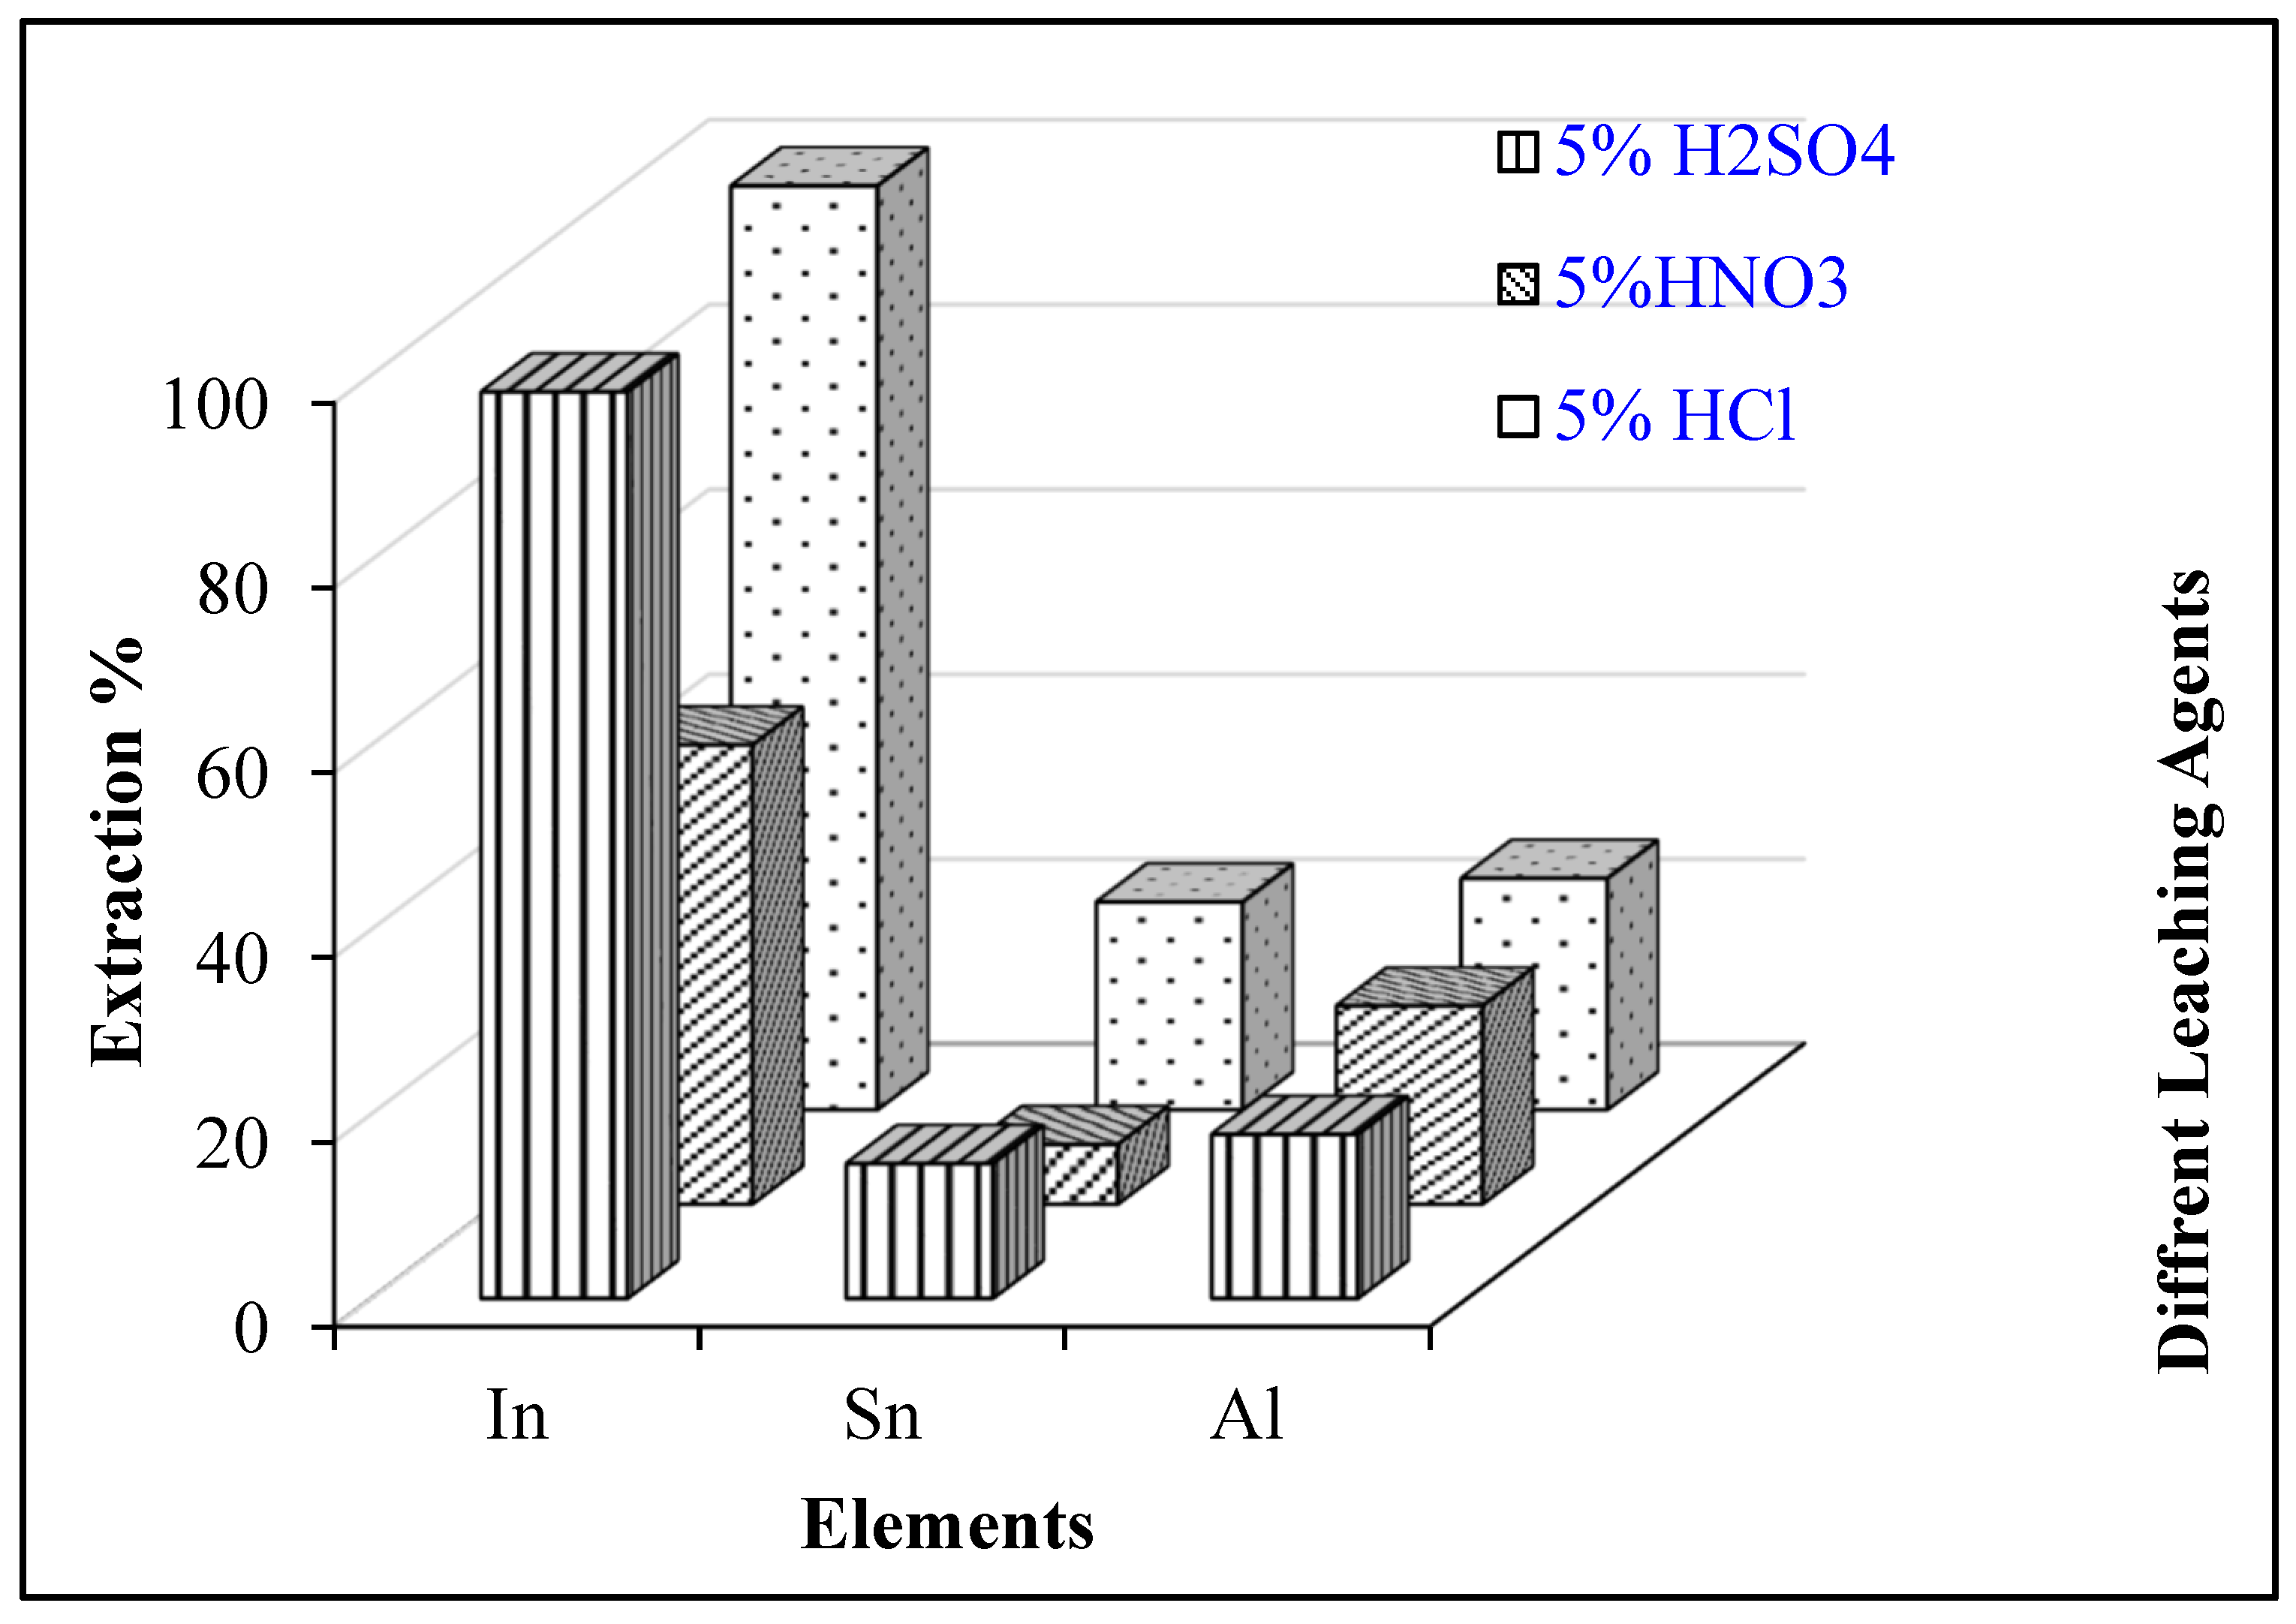
As illustrated in Figure 4, the leaching behavior of In varied significantly with different mineral acids. Both H2SO4 and HCl were highly effective, achieving nearly complete dissolution of In, whereas HNO3 proved far less efficient. Although HCl resulted in the highest In recovery, it simultaneously promoted the extensive co-dissolution of tin (Sn) and aluminum (Al), thereby reducing its selectivity. In contrast, H2SO4 demonstrated a more balanced performance, yielding ~98.1% In dissolution while limiting the dissolution of impurities. Beyond its favorable selectivity, H2SO4 also offers distinct economic and environmental advantages compared to HCl, making it a more sustainable choice for In dissolution.

3.2.2. Effect of Acid Concentration

The effect of H2SO4 concentration on In dissolution is illustrated in Figure 5. As the acid strength was raised from 3% to 10%, indium leaching increased steeply, reaching 98.1% dissolution at 5% acid and remaining constant thereafter. This shows that moderate sulfuric acid concentrations are sufficient to solubilize In effectively, and further increases did not provide additional benefit. In contrast, Al showed very low dissolution. Sn dissolution consistently increases across the range. At optimized conditions, Sn dissolution was found to be 14.6%, which led to a negligible concentration in our leached liquor. These results highlight that In dissolves readily at moderate acid strengths.
Thermodynamic measurements and stability constant studies show that indium sulfate complexes are more stable than some other metal oxide species, so the acid strength needed is not very high [13,14]. In addition, our kinetic analysis (Section 3.2.6 Kinetics Studies) shows that the apparent activation energy for indium dissolution is 21.2 kJ mol−1, which indicates a diffusion-controlled pathway. Together, these thermodynamic and kinetic factors justify effective and selective leaching in mild H2SO4 solutions, while minimizing the dissolution of unwanted impurities.
Based on this trend, 5% H2SO4 was identified as the optimum concentration in this study, as it ensured 98.1% recovery of In while limiting the dissolution of impurities. Operating beyond this point would increase Al and Sn contamination in the leach liquor and escalate acid consumption.

3.2.3. Effect of Pulp Density

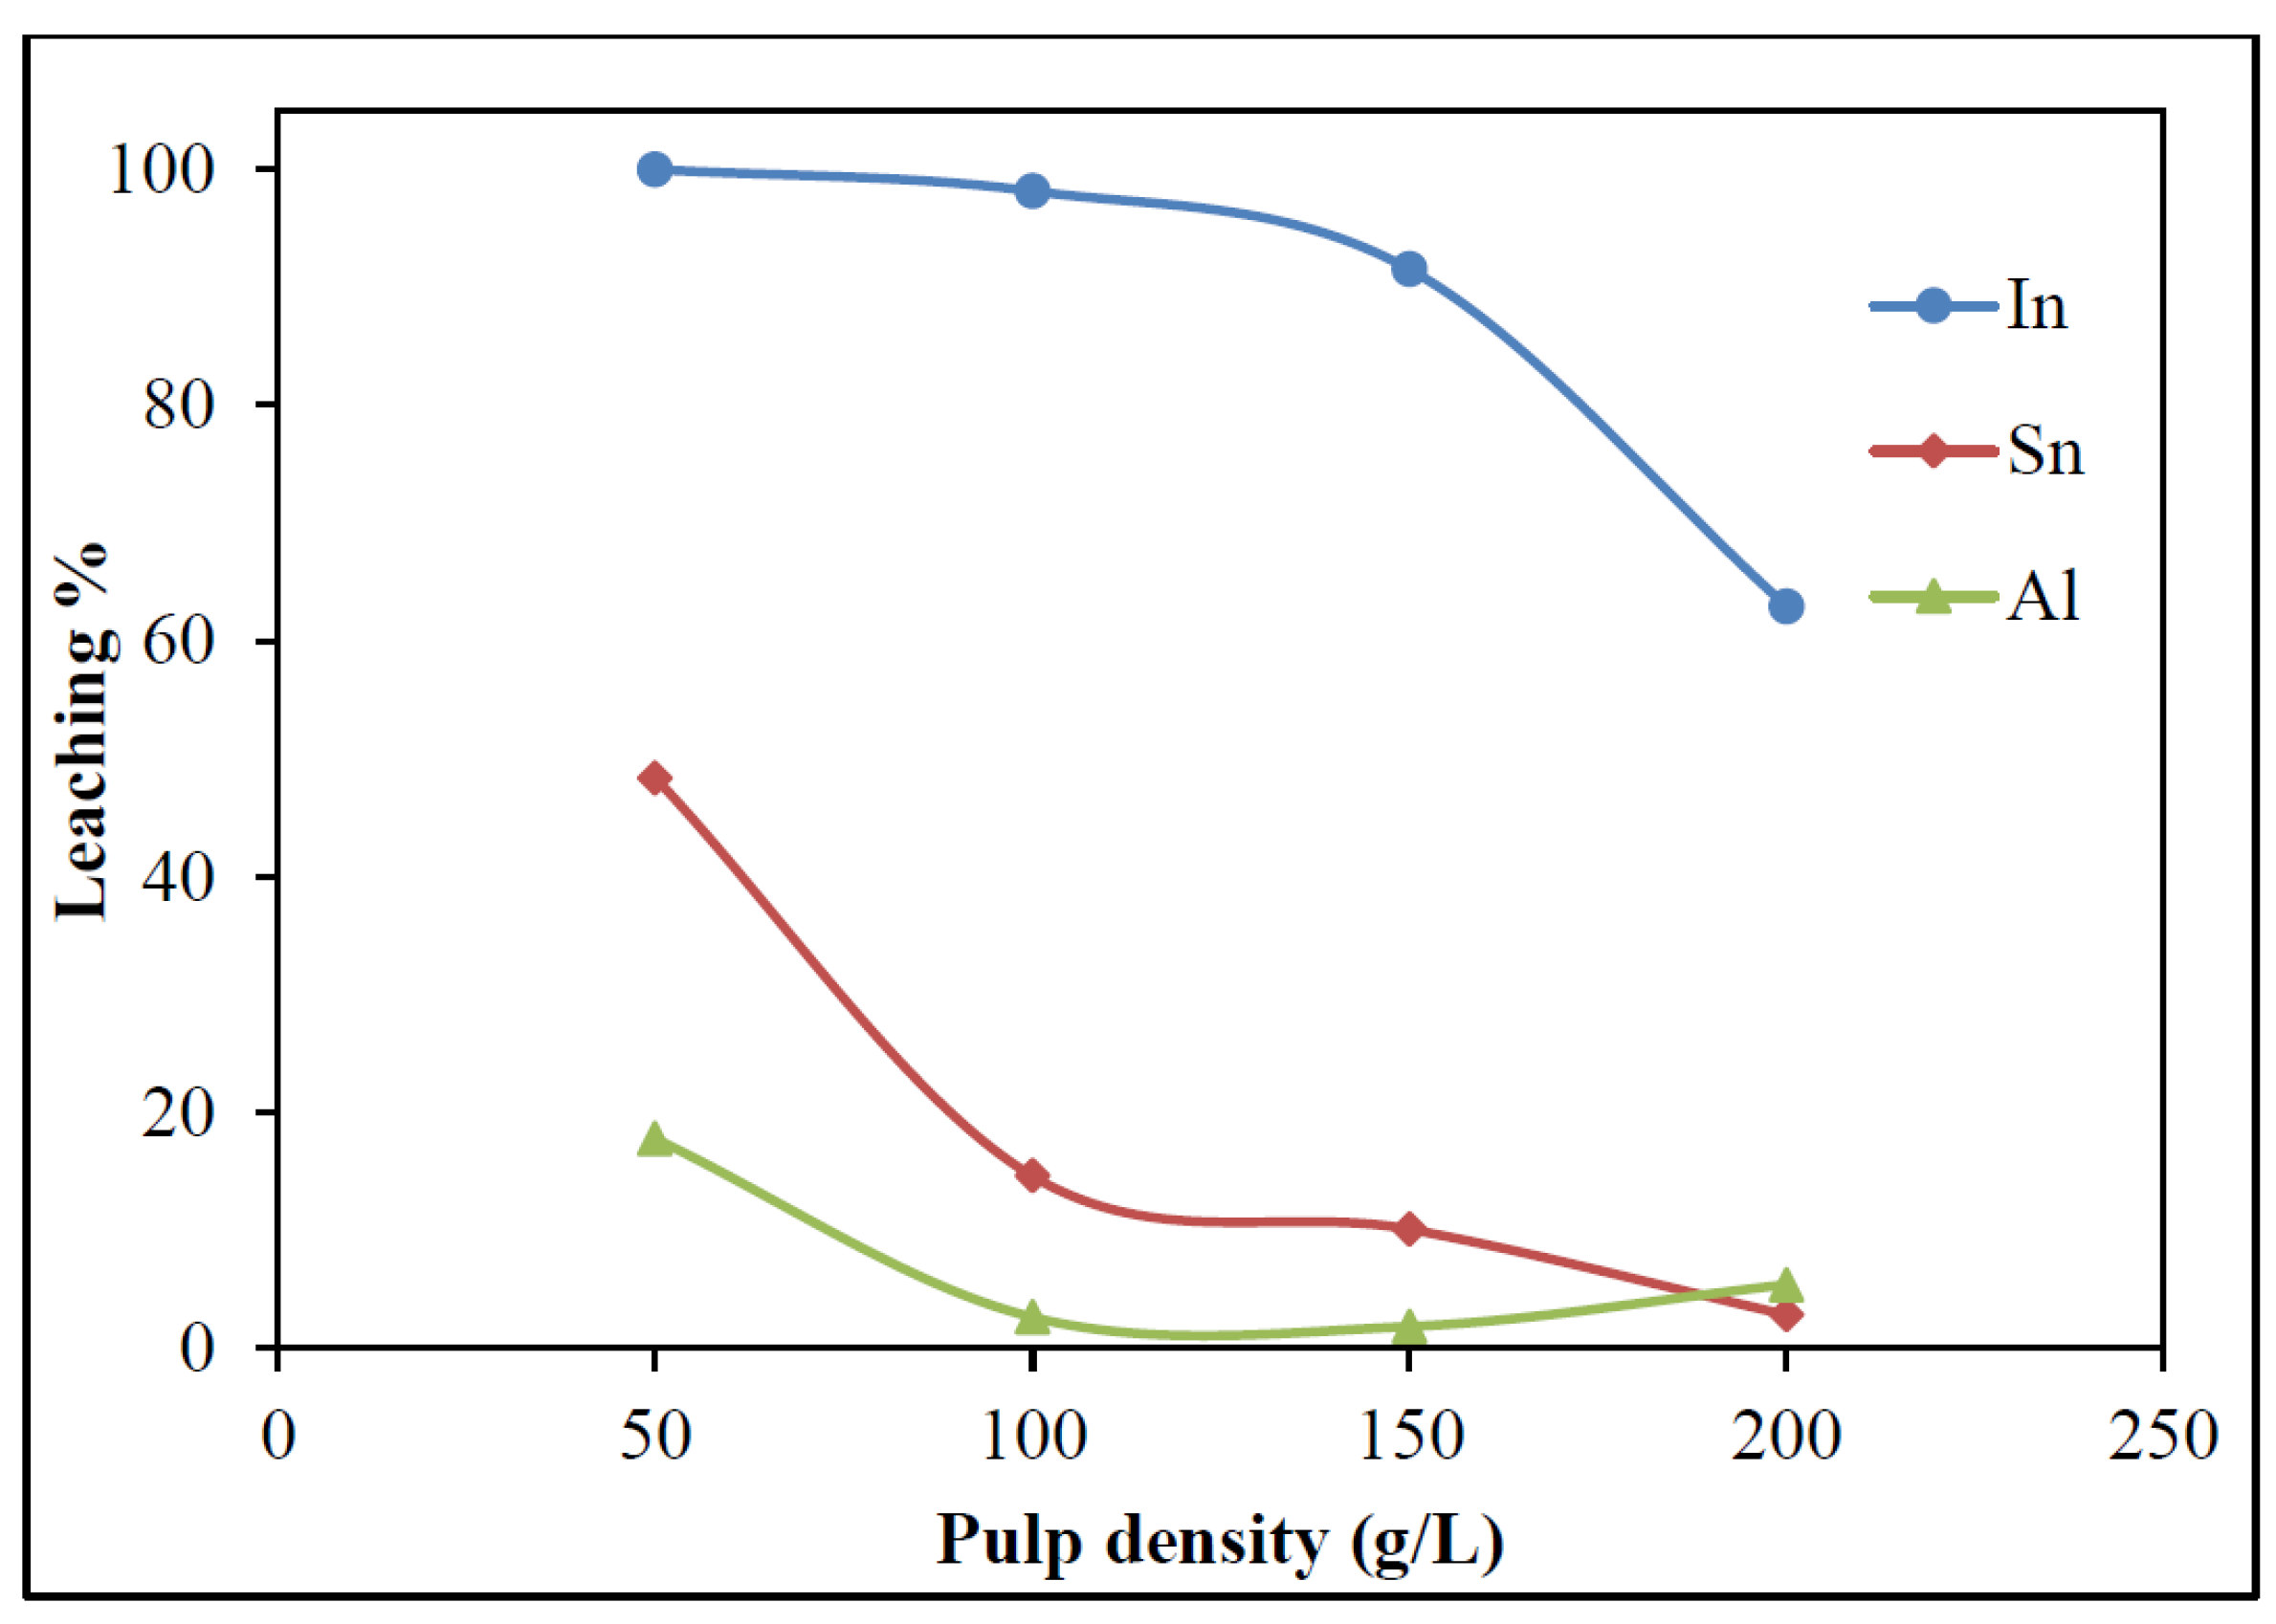
Pulp densities ranging from 50–200 g/L were tested at 5% H2SO4, 60 °C, and 30 min (Figure 6). Between 50 and 100 g/L, In leaching remained almost unchanged at near-complete levels, while the dissolution of Sn and Al decreased, keeping impurity levels low.
However, further increasing pulp density beyond 100 g/L caused a noticeable drop in In dissolution due to reduced acid-to-solid ratio and mass transfer limitations. This may be attributed to local acid depletion, particle crowding, increased slurry viscosity, and the effective reduction of available surface area for reaction at high pulp densities [5,15,16]. Hence, the optimized pulp density was identified as 100 g/L.

3.2.4. Effect of Temperature

Temperature variation from 25 to 60 °C was studied at a constant 5% H2SO4, 100 g/L pulp density, and 30 min. In leaching increased steadily with temperature due to faster reaction kinetics, reaching near-complete recovery at 60 °C (Figure 7). This may be attributed to the fact that higher temperatures accelerate reaction kinetics, but once dissolution equilibrium is reached, additional heating only promotes impurity dissolution and unnecessary energy consumption [7,11].

3.2.5. Effect of Time

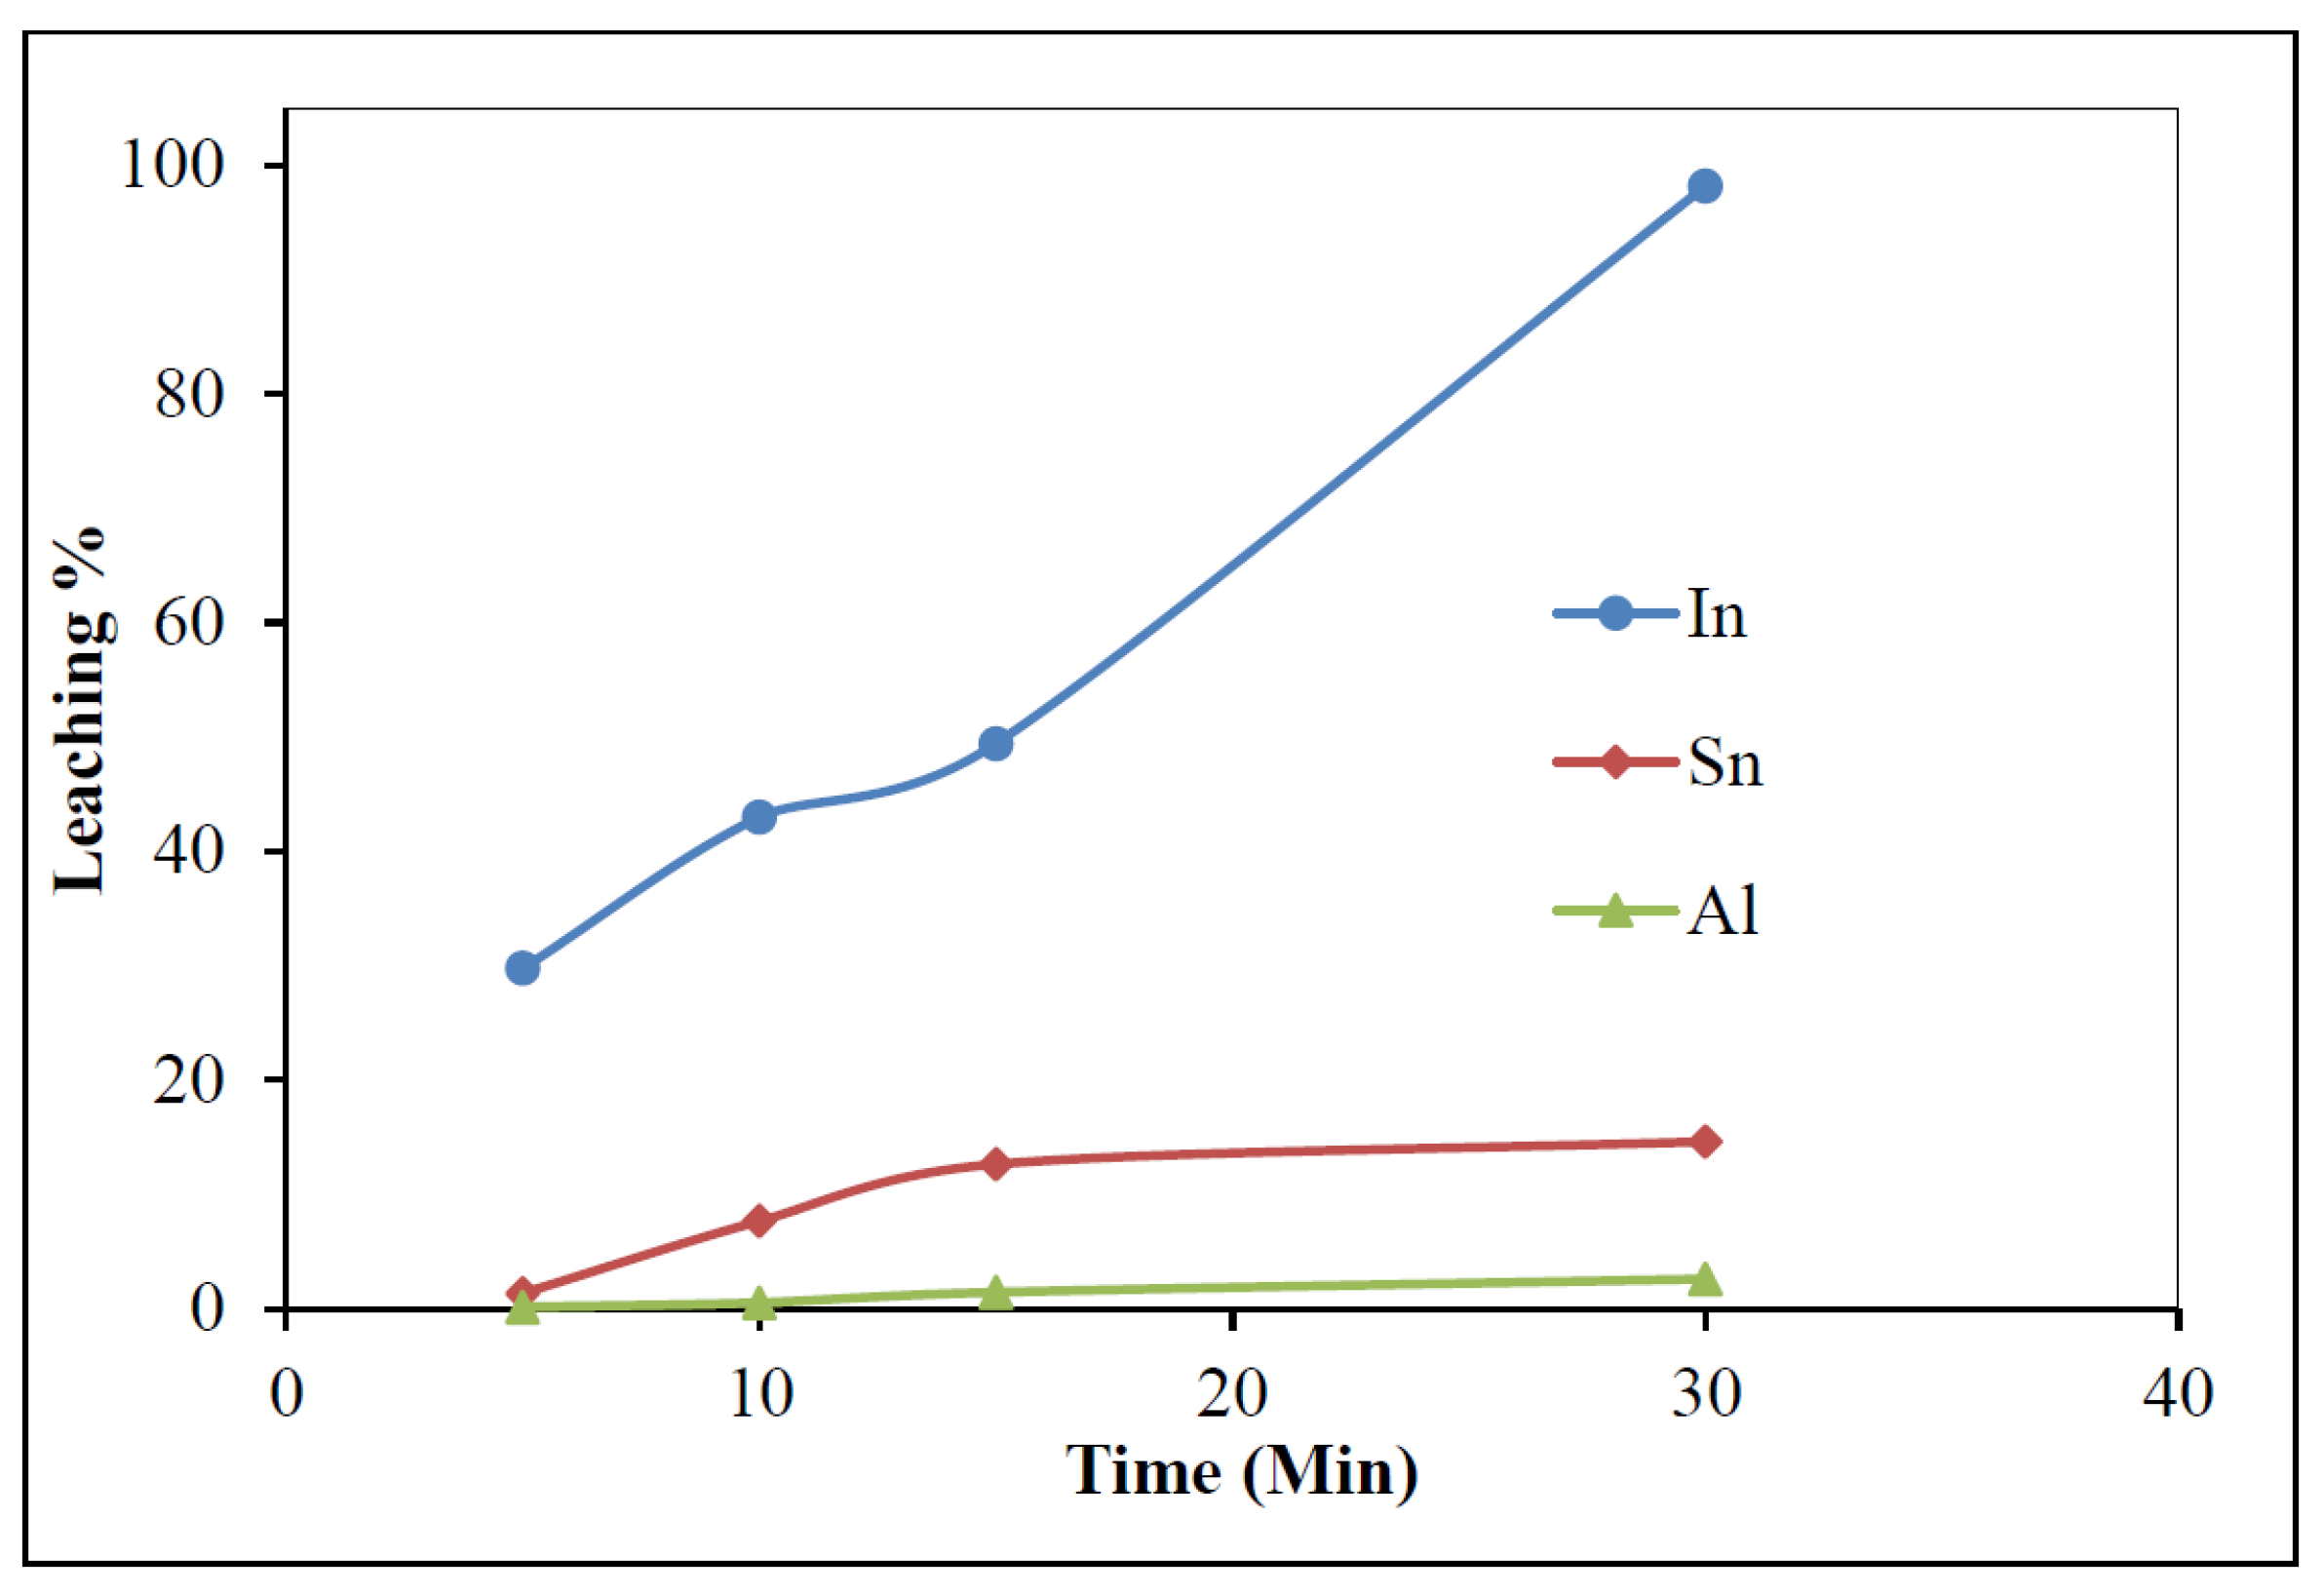
Leaching time was varied from 5 to 30 min at a constant 5% H2SO4, 100 g/L pulp density, and 60 °C. In showed rapid dissolution in the initial 10 min, followed by a slower rise to near-complete recovery at 30 min (Figure 8). This behavior reflects fast surface dissolution at early stages and diffusion-controlled kinetics later. Thus, 30 min was chosen as the optimum leaching time for maximum recovery without excess reagent use.

3.2.6. Kinetics Studies

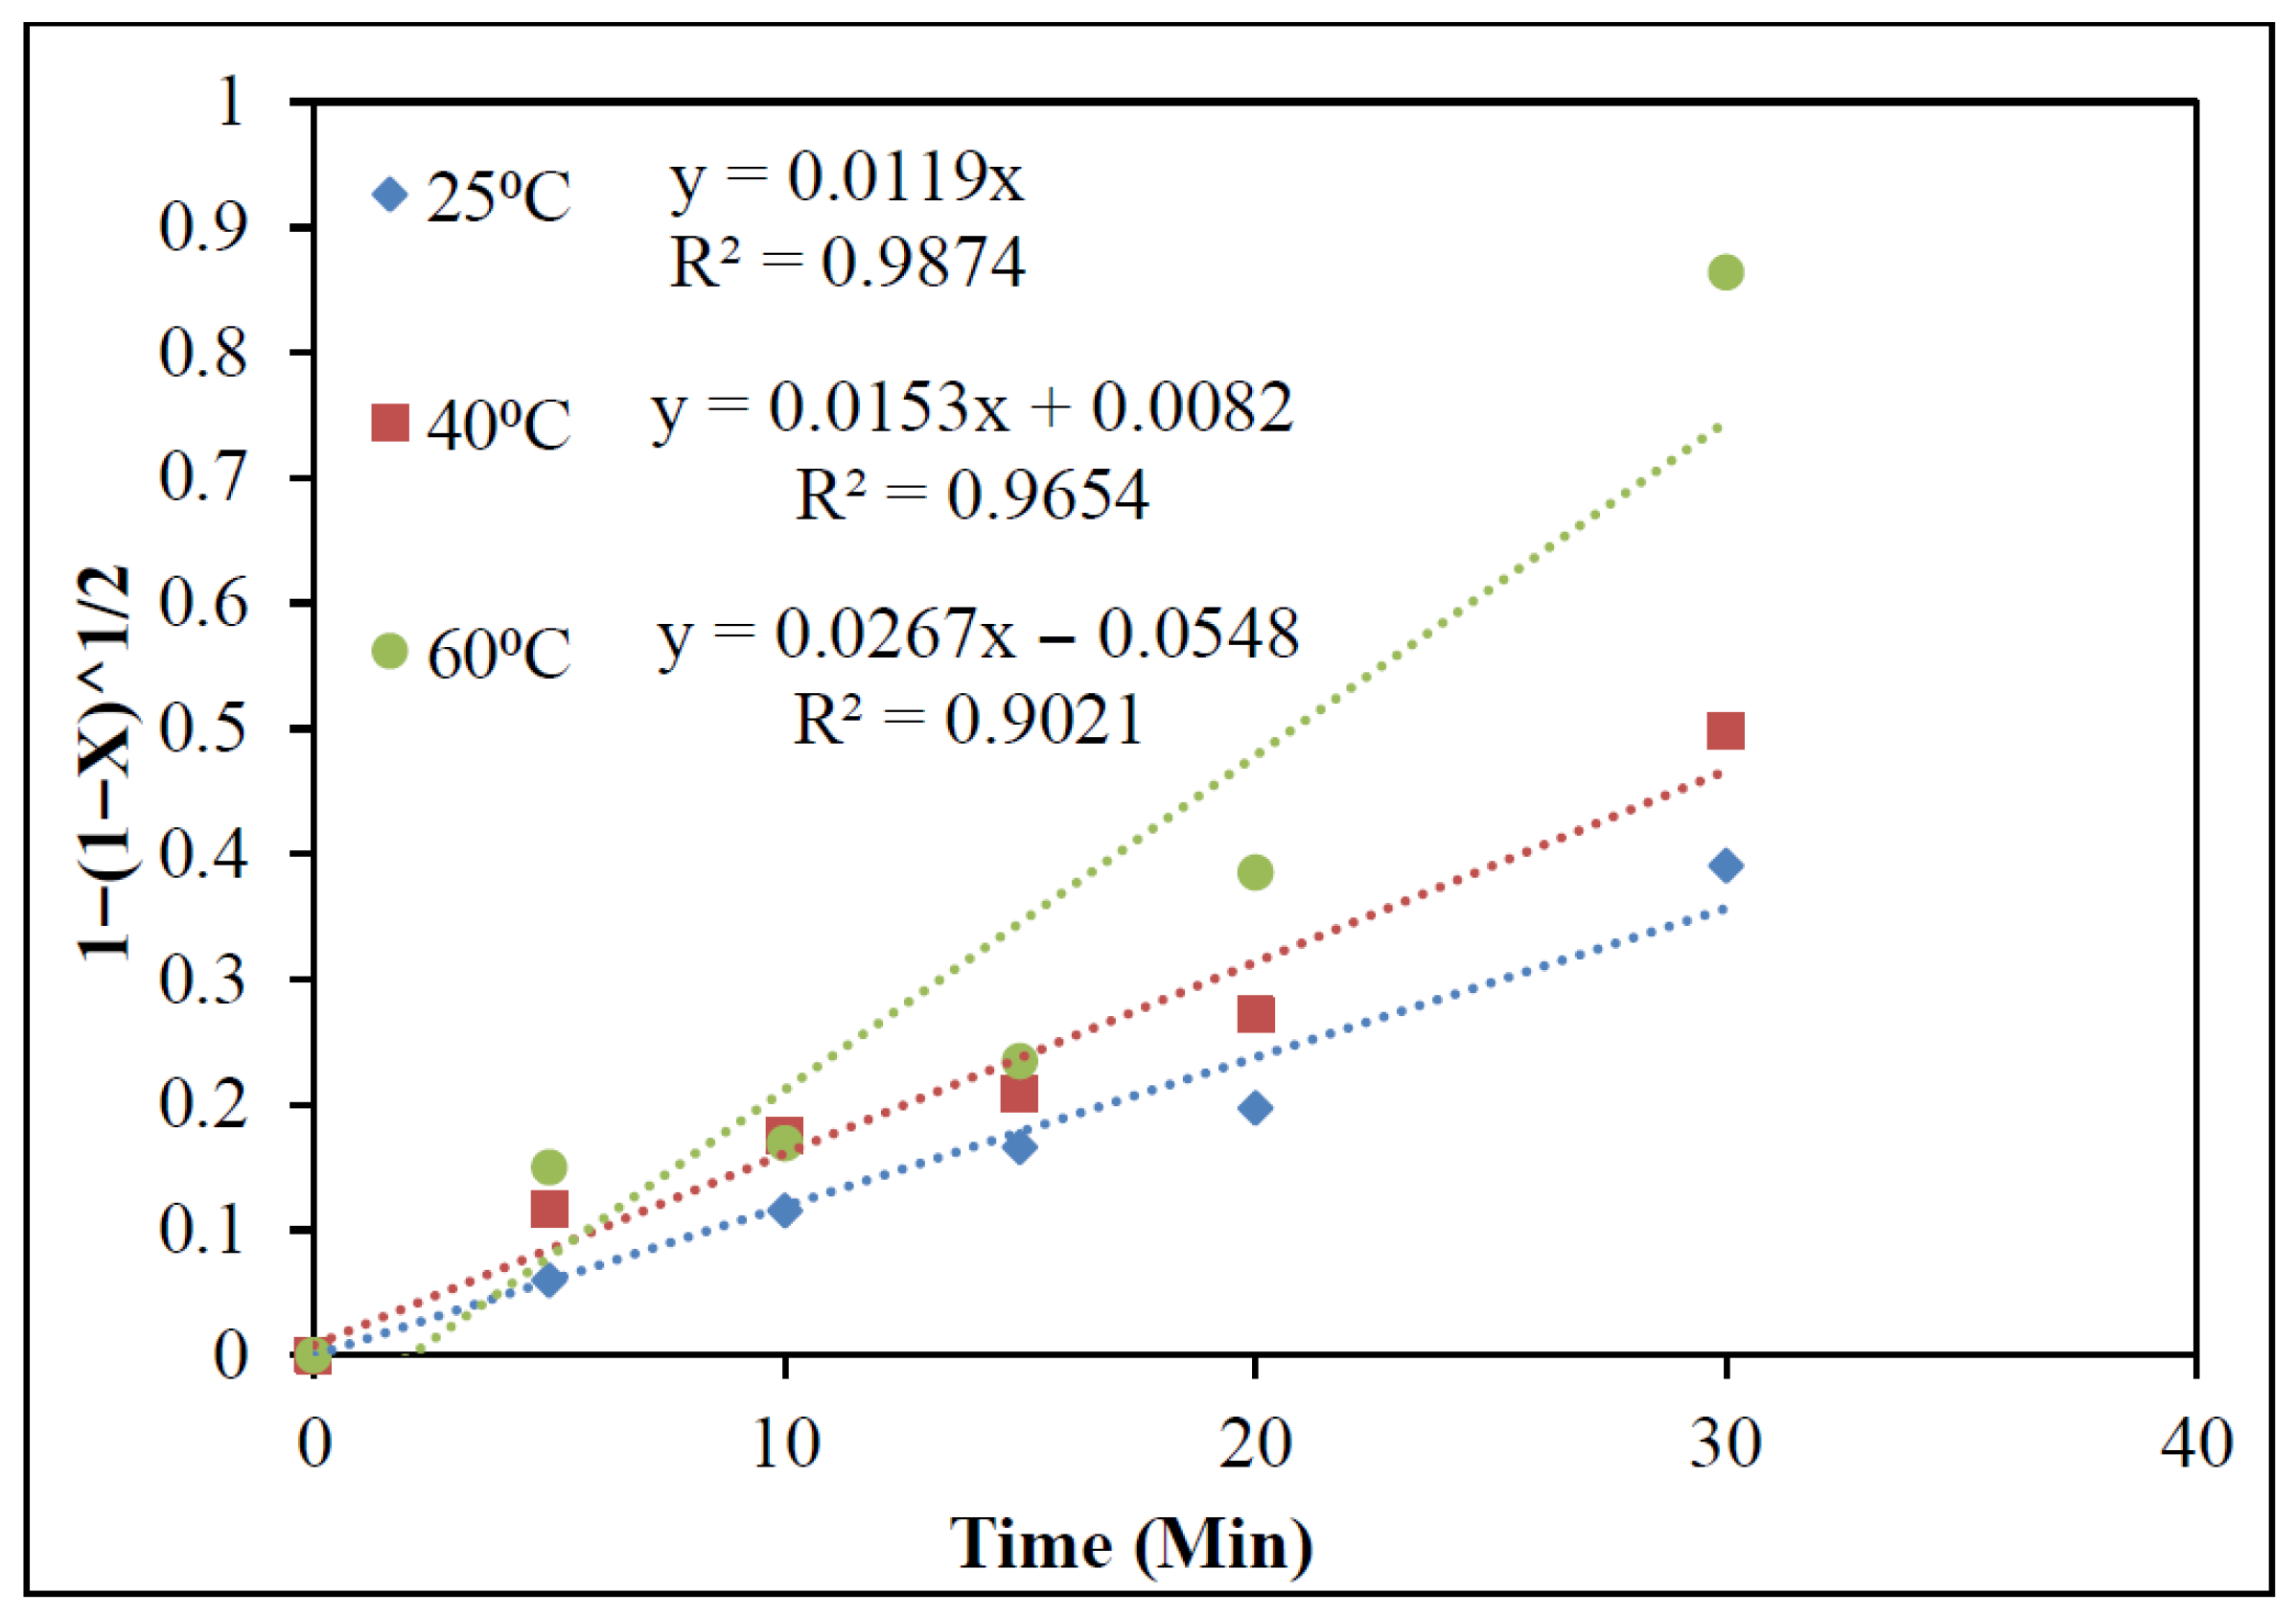
The leaching kinetics of indium were evaluated using various kinetic models. The dissolution was carried out under 5% H2SO4, 60 °C, 30 min mixing time, and 100 g/L pulp density. Among the various models tested, the diffusion-controlled form (Equation (1)) provided the best linear correlation:
1 − (1 − X)1/2 = kct
where, X is the fractional conversion, t is time, and kc is the rate constant.
The plots of 1 − (1 − X)1/2 versus t at different temperatures (25–60 °C) gave excellent linear fits with R2 values between 0.90 and 0.96 (Figure 9). The increasing slopes at higher temperatures show that the diffusion process accelerates with thermal energy, consistent with enhanced ion transport through the product layer.
Additionally, the Arrhenius plot (ln k vs. 1/T) was made to calculate the activation energy (Ea) required for In dissolution from the pulverized sample.
The Arrhenius equation (Equation (2)) is as follows:
K = Ae−(Ea/RT)
where:
  • k = rate constant
  • A = frequency factor (pre-exponential factor)
  • Ea = activation energy (kJ/mol)
  • R = gas constant (8.314 J/mol·K)
  • T = absolute temperature (K)
The calculated activation energy values were found to be 21.2 kJ/mol for In dissolution, as shown in Figure 10. This value lies within the range generally assigned for diffusion-controlled processes (<40 kJ/mol), and is significantly lower than values reported for chemically controlled indium leaching (typically 40–65 kJ/mol) [17].

3.3. Solvent Extraction Studies

After the leaching studies, the leach liquor containing 0.0201 g/L In and 0.0059 g/L Sn was subjected to evaporation to enrich the concentrations of metals. Now the ~10 times enriched leach liquor has 0.2 g/L In and 0.06 g/L Sn. The enriched leach liquor was subsequently subjected to a solvent extraction process to recover indium.

3.3.1. Selection of Extractant

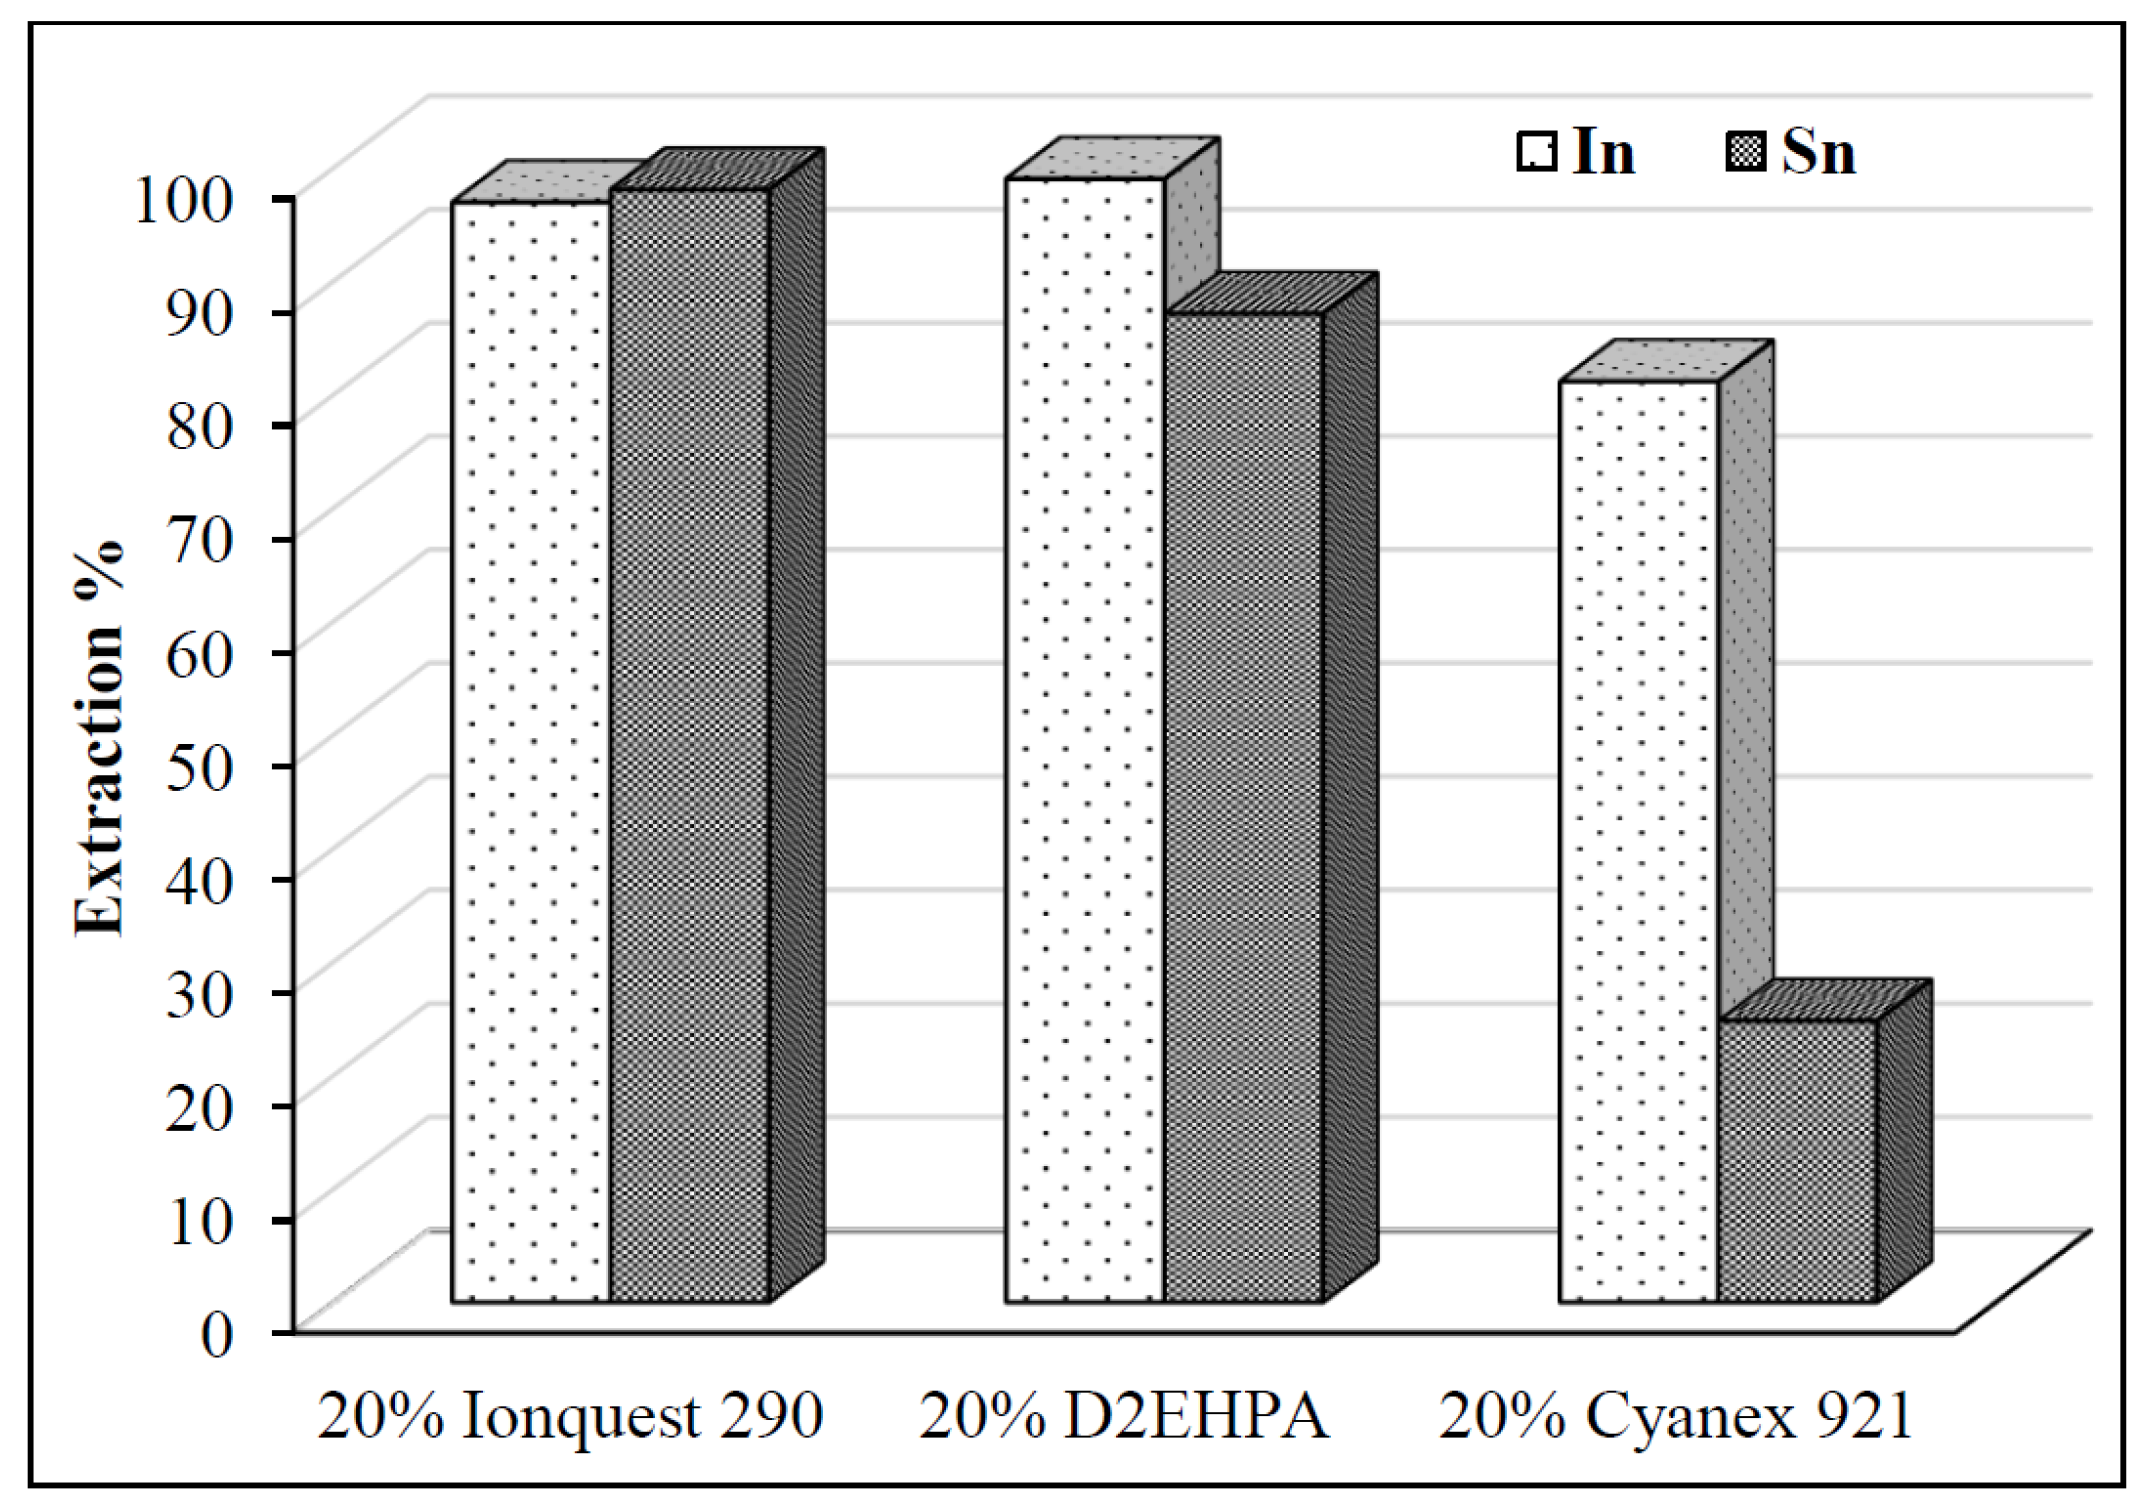
In order to identify a suitable extractant for selective recovery of In from the leach liquor, three common classes of organophosphorus reagents were evaluated: the acidic extractant 20% D2EHPA (v/v) diluted in kerosene oil with 2% Isodecanol (v/v), the neutral extractant 20% Cyanex 921 (v/v) diluted in kerosene oil with 2% Isodecanol, and the acidic phosphinic acid 20% Ionquest 290 (v/v) diluted in kerosene oil with 2% Isodecanol. D2EHPA is widely used in base metal separations due to its strong affinity for trivalent cations; however, the stripping of metals from this organic is very difficult [15]. Ionquest 290 showed great extraction of In with co-extraction of Sn, but Cyanex 921 showed even better extraction efficiencies for indium, with minimal co-extraction of Sn, as shown in Figure 11. Considering these, Cyanex 921 was chosen as the preferred extractant for further studies in this work.

3.3.2. Effect of pH on Extraction

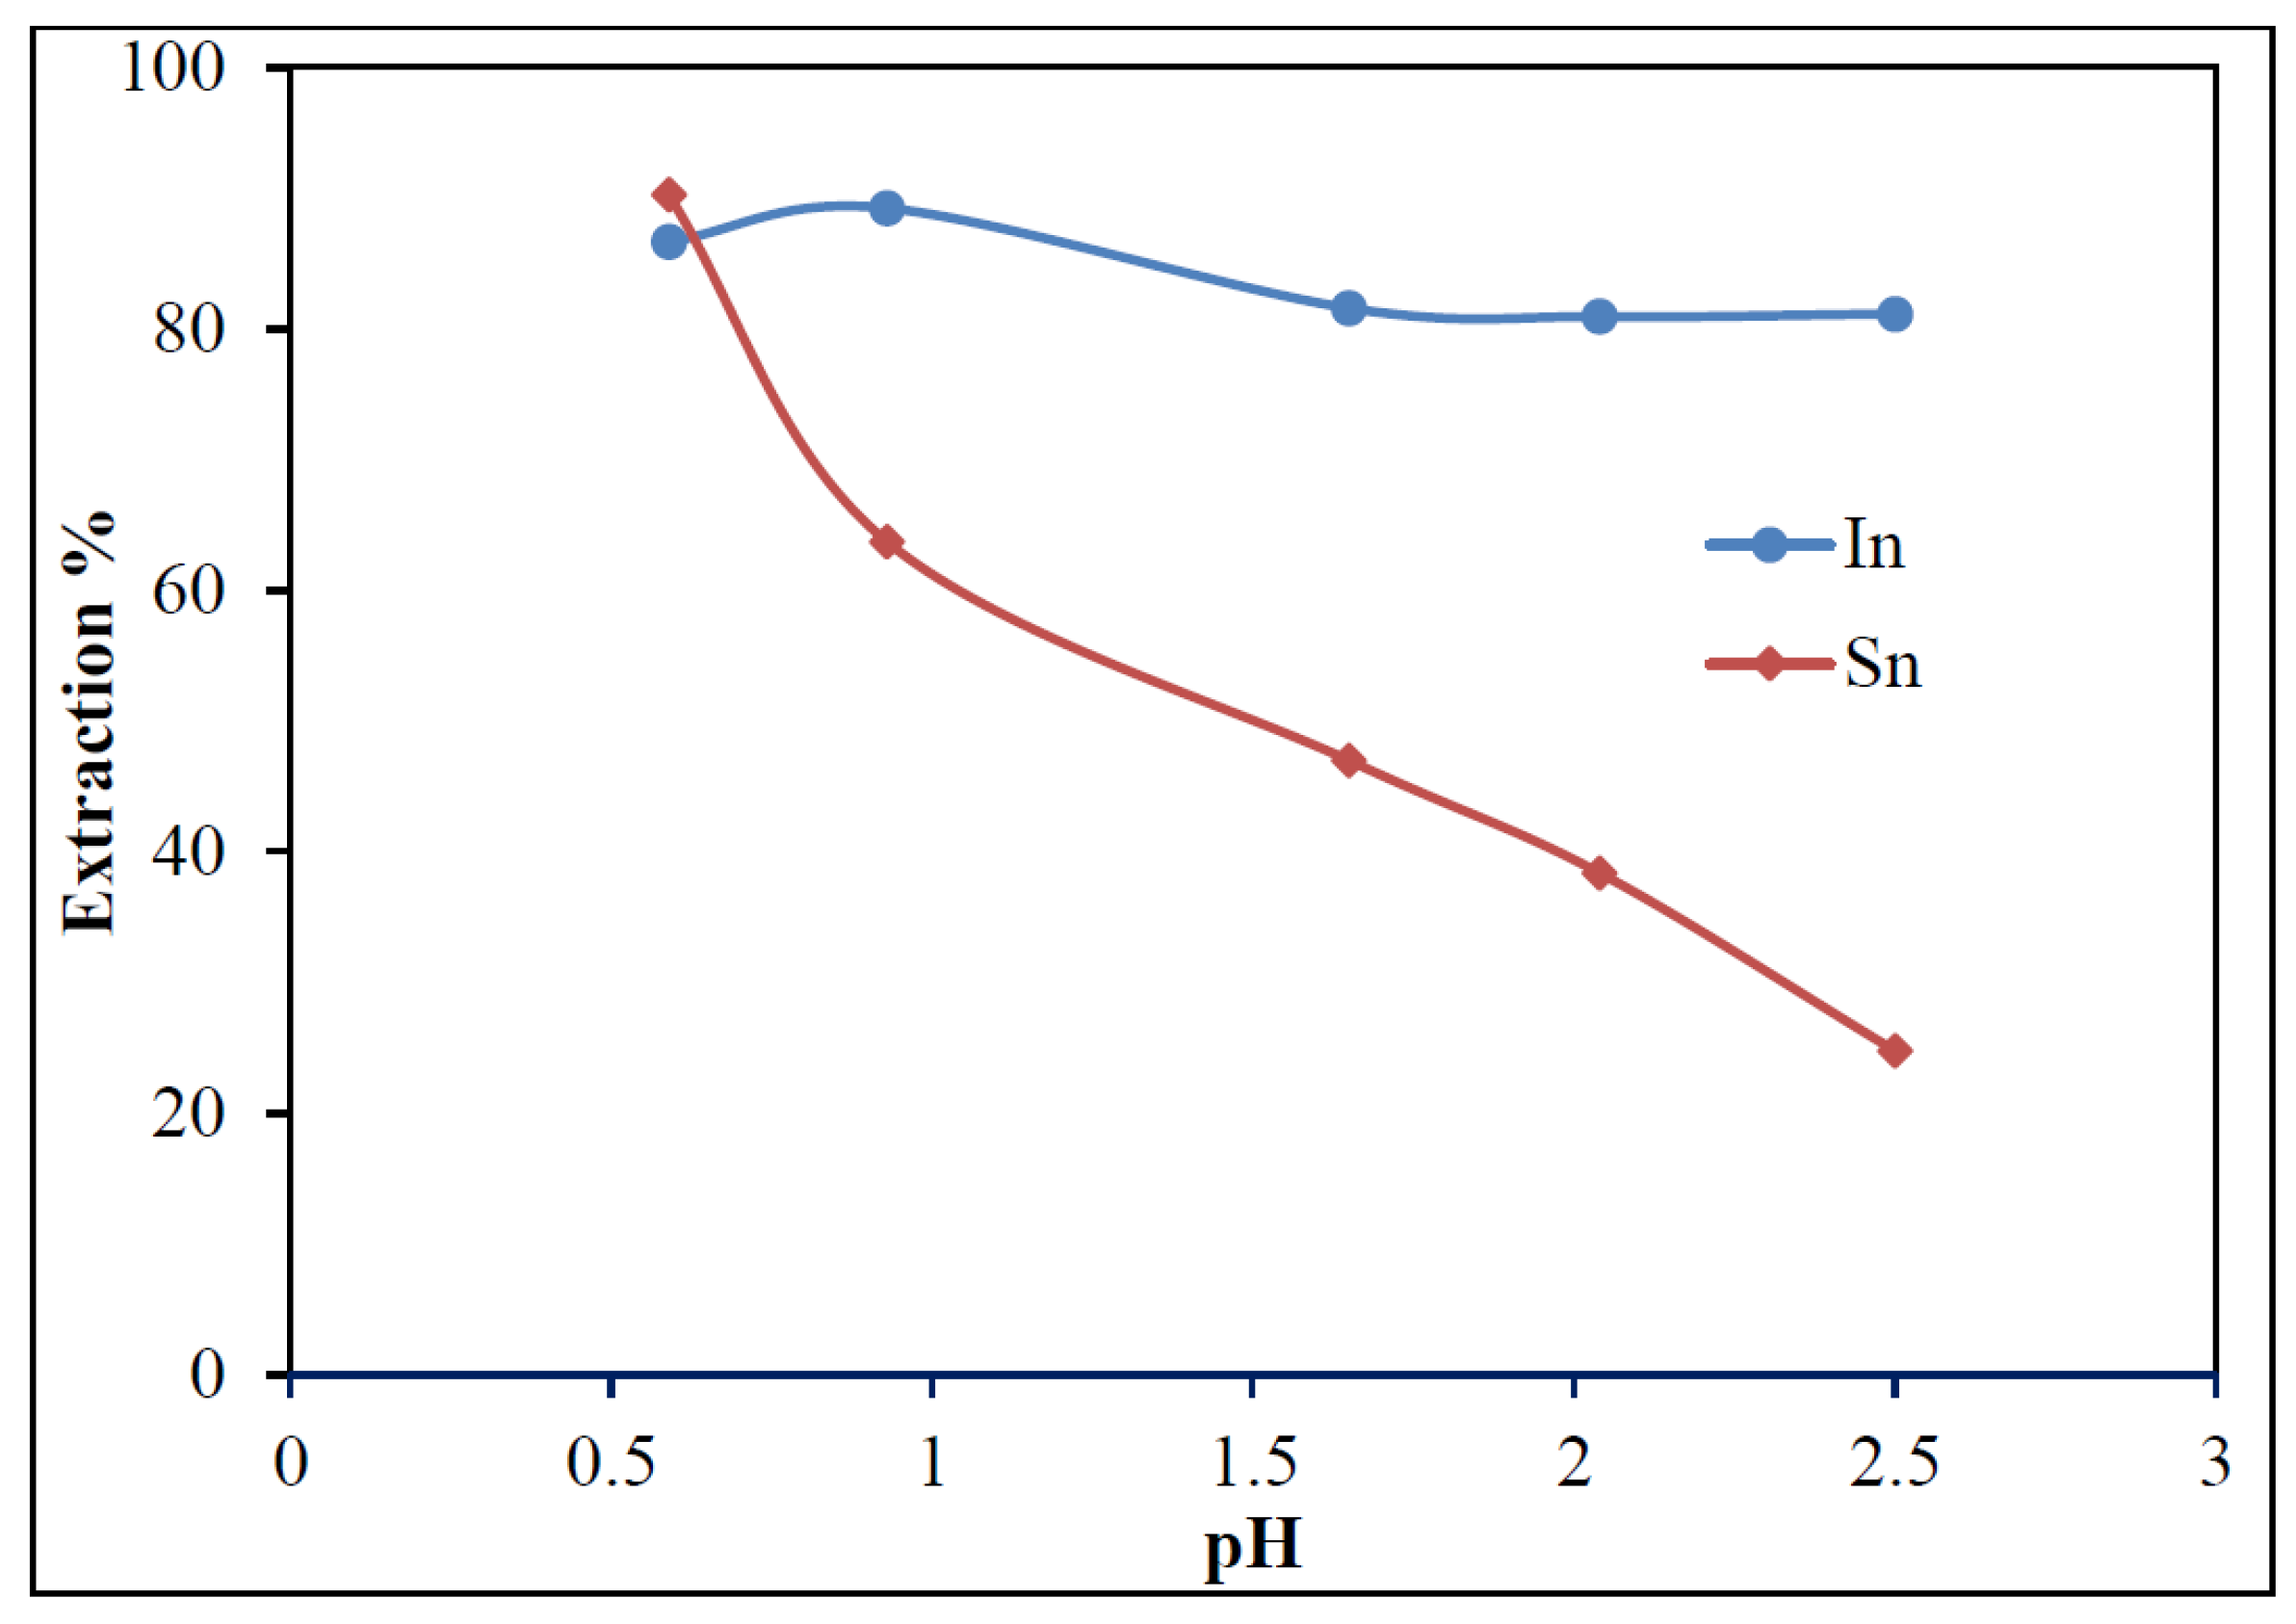
The effect of equilibrium pH on the extraction of In by 20% Cyanex 921 diluted in kerosene oil with 2% Isodecanol was studied in the range of pH 0.5–2.5. Figure 12 shows the extraction of indium remains consistently high across the tested pH range, reaching around 80%, indicating that indium can be efficiently extracted even at relatively low pH values. The main objective of the present investigation was to separate/recover In from the leach liquor. There were no changes found after the increase in the equilibrium pH to 2.5. In contrast, tin extraction shows a strong dependence on pH. At lower pH (~0.5–1), tin extraction is moderately high (~90–63%) but decreases consistently as the pH increases, reaching a minimum at pH 2.5. This behavior highlights that 20% Cyanex 921 extracts indium over tin at slightly acidic conditions, making it suitable for the purification of indium from mixed-metal solutions.

3.3.3. Effect of Time

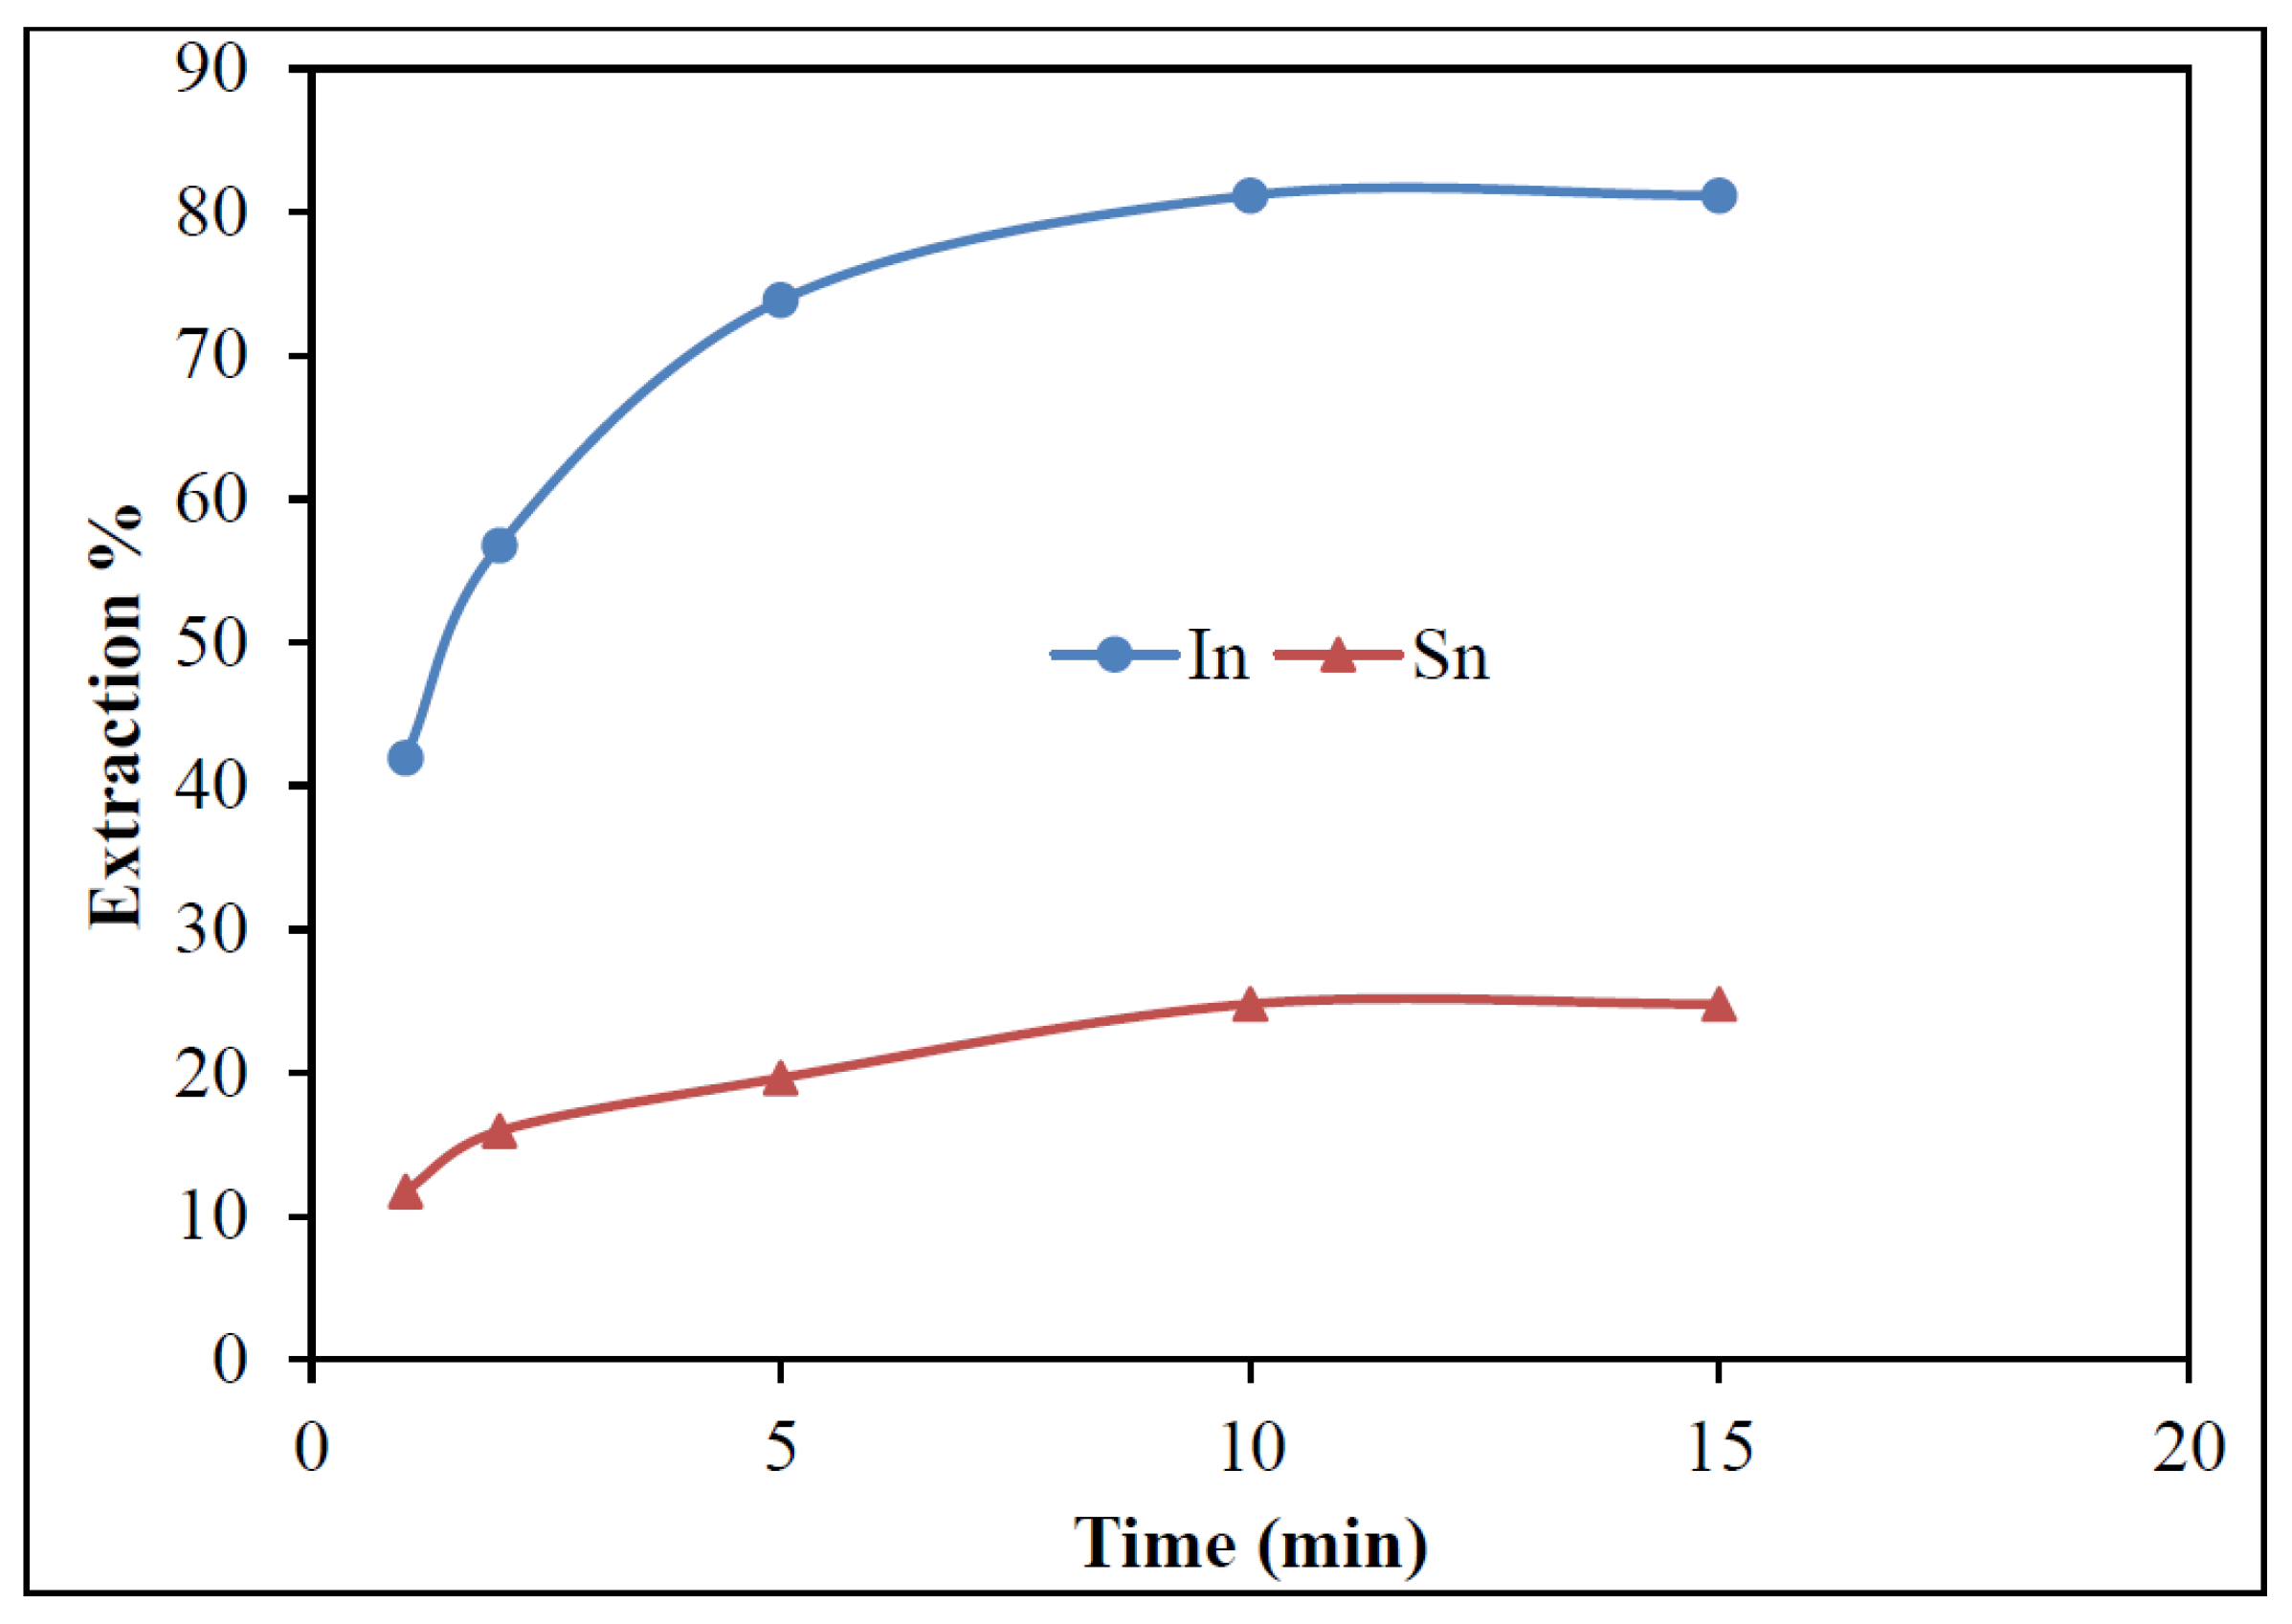
The extraction of In by 20% Cyanex 921 was studied over a range of 5–15 min. The recovery increased sharply during the initial stage and reached near-equilibrium at about 10 min, after which no significant improvement was observed (Figure 13). Therefore, 15 min mixing time was fixed as the operational time to give a little excess time to get a stabilized equilibrium. This may be explained by the fact that indium extraction involves a surface-controlled exchange process at the aqueous–organic interface. At the beginning, the large concentration gradient between indium ions in the aqueous phase and the free extractant molecules in the organic phase drives rapid mass transfer. As the available extractant sites become progressively occupied, the driving force for further transfer decreases, and the system approaches equilibrium, so longer contact times provide no additional benefit [18,19,20]. Hence, 15 min was adopted as the operational contact time for further studies.

3.3.4. Effect of Phase Ratio and McCabe–Thiele Plot

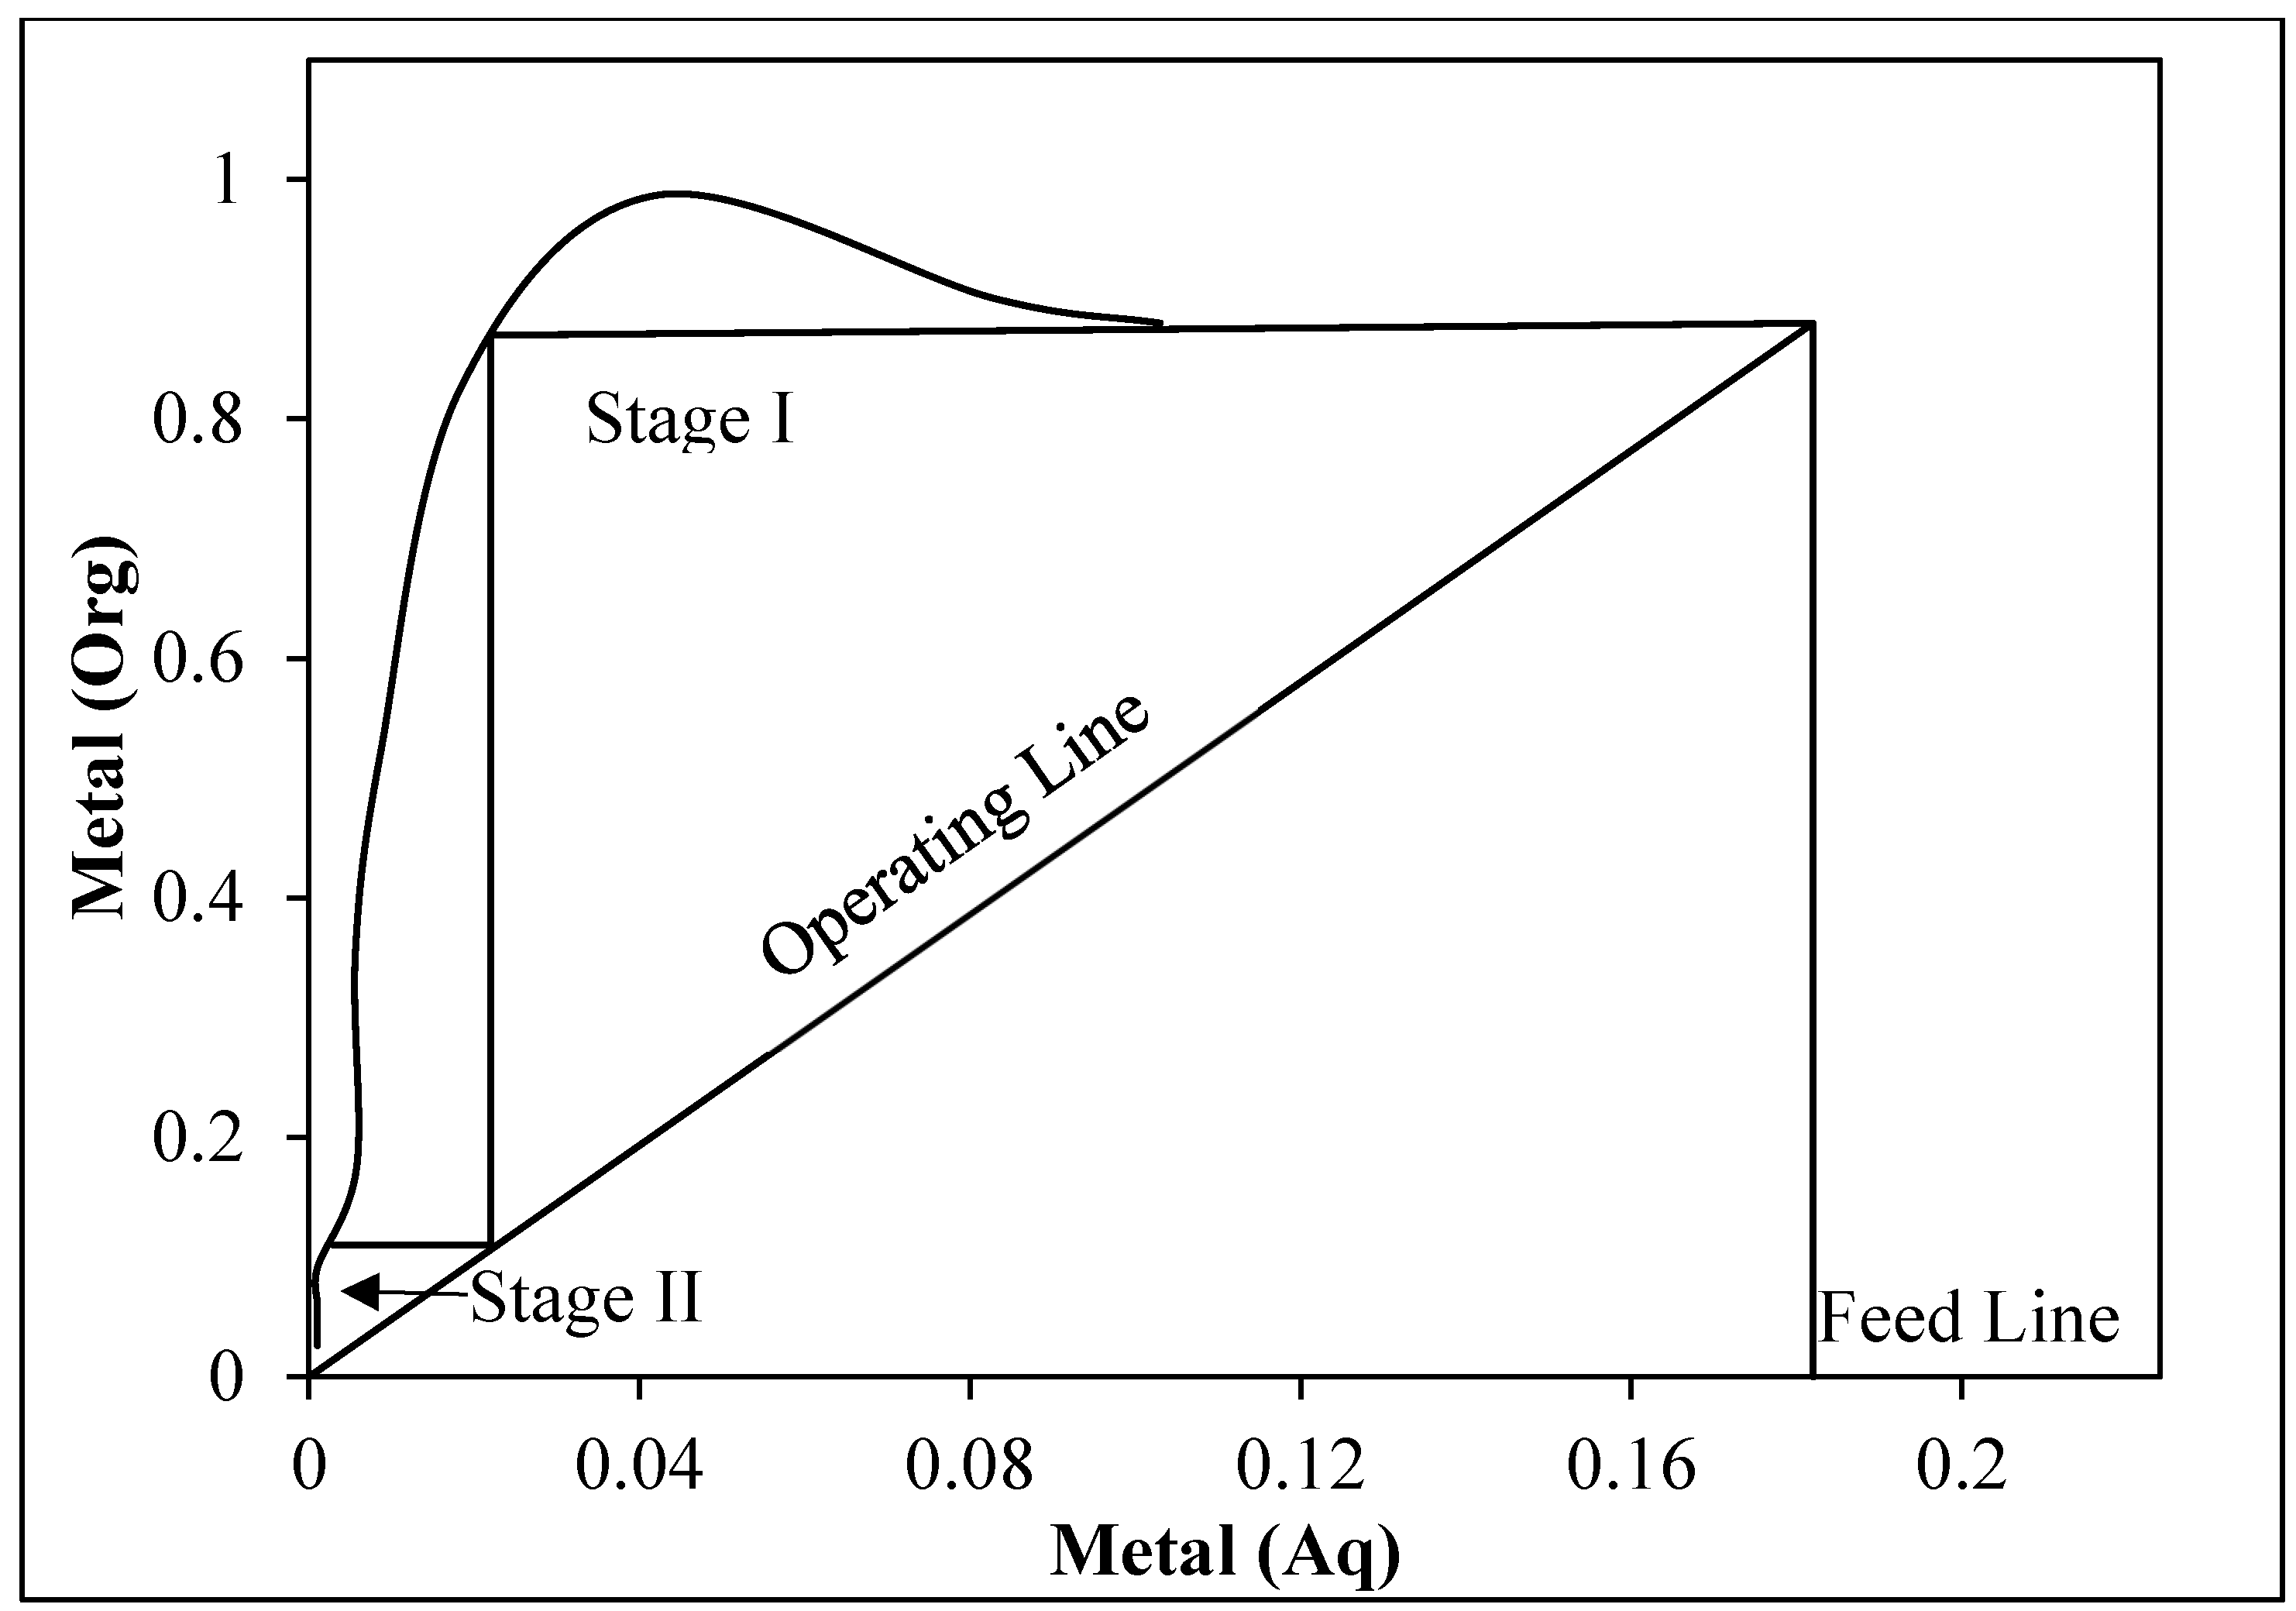
To observe the effect of organic-to-aqueous (O/A) phase ratio on the extraction of In from the leach liquor, the phase ratio was systematically varied from 1/9 to 9/1 while maintaining a constant pH 2.5 and a mixing time of 15 min. To determine the number of counter-current extraction stages required for nearly complete In recovery, a McCabe–Thiele diagram was constructed using the data obtained from the effect of organic-to-aqueous (O/A) phase ratio. It is a plot of metal distribution between aqueous (X-axis) and organic (Y-axis) phases [15]. It was found that at 1/1 (O/A ratio), two-stage extraction is required to completely load In in the organic phase, as shown in Figure 14. Further studies indicated that In loading at 1/1 is nearly the same as loading at 1/3 and starts falling beyond 1/3. Thus, to minimize the reagent usage, a 1/3 ratio was optimized. After loading In in the organic phase, 10% H2SO4 was used for stripping to recover 97.1% In in the stripped solution.

3.3.5. Separation Factor

The separation factor serves as a metric for assessing the effectiveness of separating two metals. It is determined by comparing the distribution co-efficient of two metals. This is done by calculating the ratio of the distribution co-efficient for the two metals involved (Equation (3)), where the distribution co-efficient is the ratio of the distribution of metal between organic and aqueous phases (Equation (4)). A separation factor exceeding 1 indicates the successful extraction, whereas a value below 1 indicates unsuccessful separation. Additionally, the separation factor serves as an indicator of the process’s efficiency, as a lower calculated value of the factor implies that more stages are needed for the separation process [21]. The separation factors for various pH levels were calculated based on Equation (3). It was found that at pH 2.5, the separation factor is maximum, i.e., 13.01, as shown in Table 2.
β = D(In)/D(Sn)
= [In(O)/In(A)]/[Sn(O)/Sn(A)]
where,
  • β = Separation factor
  • D(In) = Distribution co-efficient for indium
  • D(Sn) = Distribution co-efficient for tin
  • In(O) = In in organic phase
  • In(A) = In in aqueous phase
  • Sn(O) = Sn in organic phase
  • Sn(A) = Sn in aqueous phase
Table 2. Separation factors for In and Sn separation at different pH levels.
pHIn(O)/In(A)Sn(O)/Sn(A)Separation Factor
0.596.59.270.7
0.938.281.754.71
1.654.430.884.98
2.044.240.567.55
2.54.300.3313.01

3.3.6. Developed Process Flowsheet for Indium Recovery

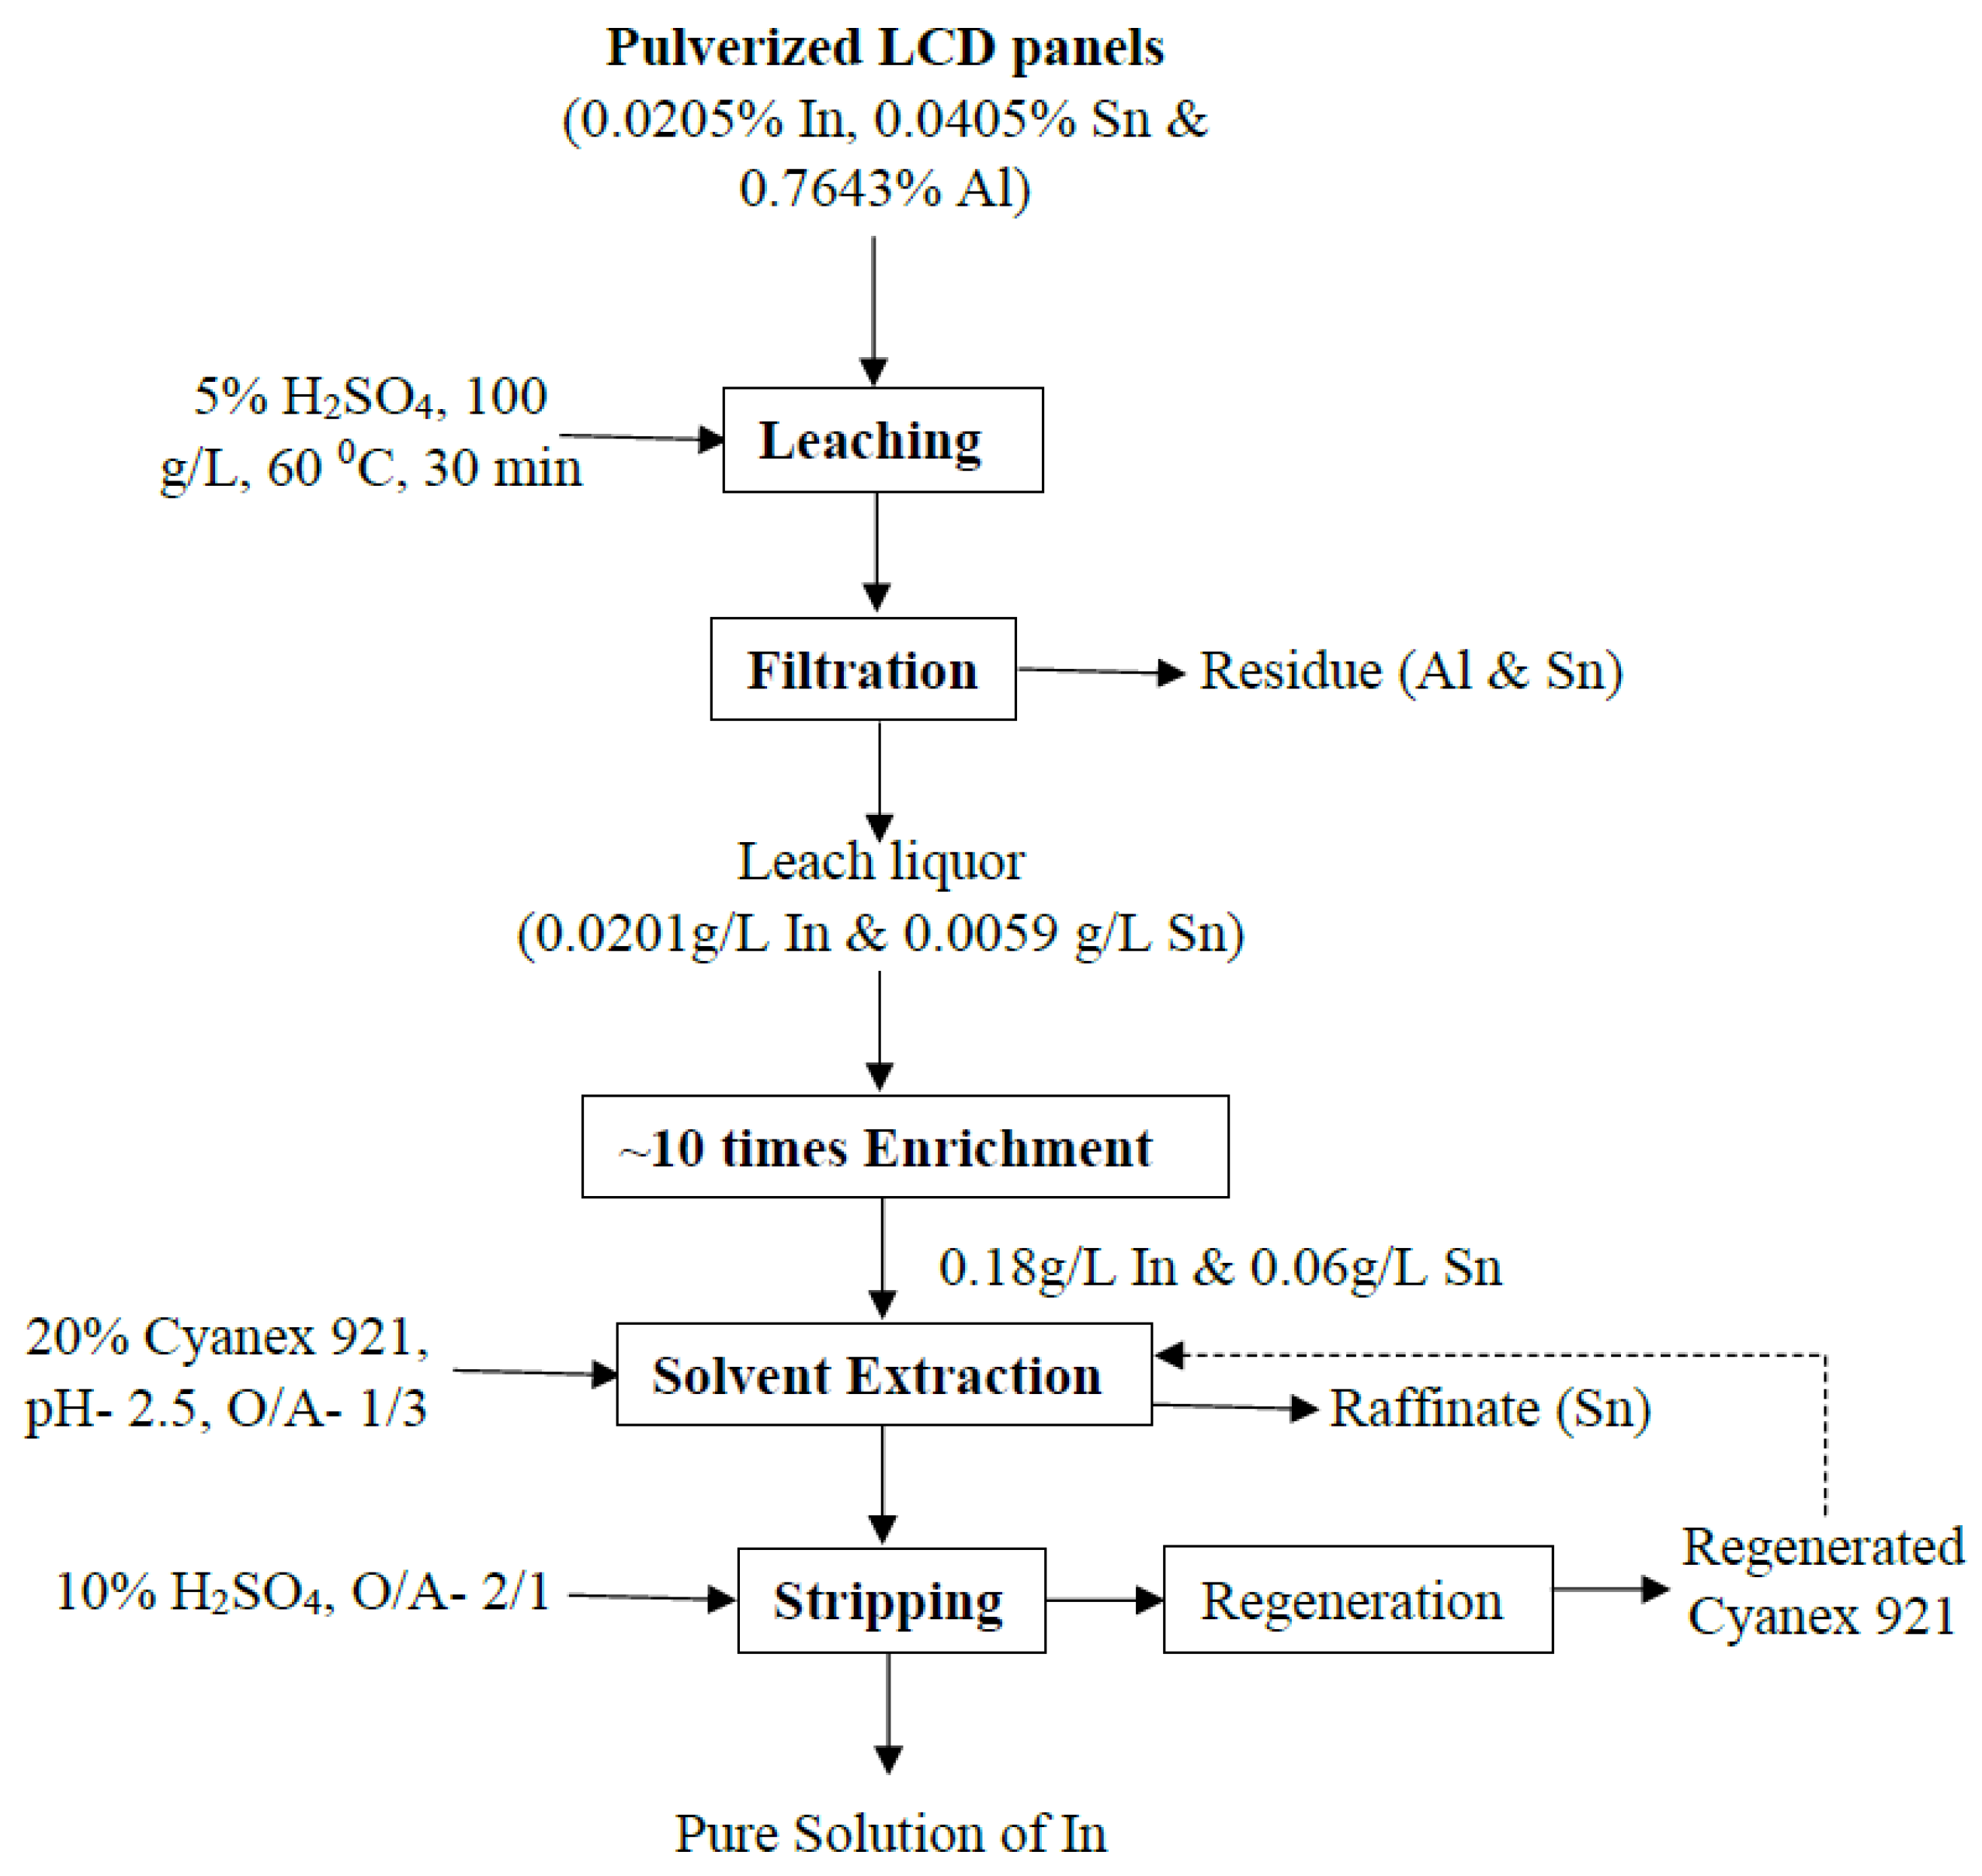
Based on the studies done from Section 3.1, Section 3.2 and Section 3.3, a hydrometallurgical process flow-sheet for In recovery of waste LCD panels was developed as shown in Figure 15. The flowsheet integrates dismantling of scrap monitors to get LCD panels, pre-treatment of LCD panels using a shredder and a pulverizer done for size reduction to increase the surface area of the sample, followed by leaching and solvent extraction to yield pure In solution.

3.3.7. FT-IR of Loaded Organic

FT-IR (Fourier transformed infra-red) spectrum of indium-loaded Cyanex 921 organic was investigated to know about the functional group present in the extractant, which is a crucial factor for the extraction process of In. FT-IR spectra of In-loaded Cyanex 921 were obtained, within the range of 600–3100 cm−1, as presented in Figure 16.
A strong absorption band observed at 2930 cm−1 corresponds to the C–H stretching vibrations of the long alkyl chains present in Cyanex 921. The weak band around 1630 cm−1 is attributed to the bending vibration of adsorbed water in the KBr pellet. The peak at 1470 cm−1 arises from CH2 scissoring and CH3 deformation vibrations associated with the alkyl chains. The characteristic P=O stretching band of the phosphine oxide group in unloaded Cyanex 921 typically appears between 1160 and 1180 cm−1 [17,22]. Upon indium loading, this band shifts to approximately 1120 cm−1, indicating coordination of indium ions to the phosphoryl oxygen atom of the extractant. In addition, the appearance of a new absorption band near 600 cm−1 (marked as 1 in Figure 15) in the loaded organic phase suggests the formation of metal–ligand vibrations (In–O), supporting complex formation between indium and Cyanex 921.

4. Conclusions

  • Waste LCD panels were confirmed to be a promising secondary source of indium. Leaching studies established the dissolution of indium with 5% H2SO4, a 60 °C temperature, at a 100 g/L pulp density, and 30 min of mixing time, 98.1% In dissolution could be achieved.
  • The mechanism of indium dissolution was clarified through kinetic studies. Analysis revealed that the process followed a diffusion-controlled kinetic model (1 − (1 − X)1/2 = kct) with an activation energy of 21.2 kJ mol−1.
  • In downstream purification, solvent extraction proved to be most effective. Comparative tests with 20% D2EHPA, 20% Cyanex 921, and 20% Ionquest 290 showed that 20% Cyanex 921 provided the best results for In extraction. Optimum extraction occurred at pH 2.5 with an O/A ratio of 1/3, and equilibrium was reached within 15 min.
  • McCabe–Thiele diagram demonstrated that two stages are required for complete In loading using 20% Cyanex 921. The separation factor was calculated to be β = 13.01.
  • FT-IR studies further confirm the In extractant bonding at optimized pH.
  • This approach demonstrates strong potential for industrial application. The process combines efficiency, selectivity, and scalability while relying on inexpensive reagents and elementary equipment. These advantages position the developed flow sheet as a practical solution for indium recovery from LCD waste, with clear economic and environmental benefits that align with sustainable resource management.

Author Contributions

K.R.: Conceptualization, Methodology, Writing-Original Draft Preparation, Investigation, Formal Analysis; R.P.: Investigation, Writing—review and editing; A.S.: Formal Analysis, Writing—review and editing, Supervision; A.K.M.: Formal Analysis; B.A.: Supervision; K.Y.: Writing—review and editing; M.K.J.: Resources, Conceptualization, Methodology, Writing—review and editing, Supervision. All authors have read and agreed to the published version of the manuscript.

Funding

This research received no external funding.

Data Availability Statement

The data presented in this study are available on request from the corresponding author.

Acknowledgments

Authors of the paper wish to thank the Director, CSIR-National Metallurgical Laboratory, Jamshedpur, India, for his kind permission to publish this paper.

Conflicts of Interest

The authors declare no conflicts of interest.

References

  1. European Commission. Critical Raw Materials Act: Proposal for a Regulation on Critical Raw Materials; European Commission: Brussels, Belgium, 2023. [Google Scholar]
  2. U.S. Geological Survey. Draft List of Critical Minerals 2025. U.S. Department of the Interior. 2025. Available online: https://www.usgs.gov (accessed on 26 September 2025).
  3. World Bank. India imports of Gallium, Hafnium, Indium, Niobium, Rhenium, or Thall (HS 811299) by Partner Country [Data Set]. WITS/UN Comtrade. 2023. Available online: https://wits.worldbank.org/trade/comtrade/en/country/IND/year/2023/tradeflow/Imports/partner/ALL/product/811299 (accessed on 26 September 2025).
  4. Vučinić, A.A.; Šimunić, S.; Radetić, L.; Presečki, I. Indium Recycling from Waste Liquid Crystal Displays: Is It Possible? Processes 2023, 11, 1662. [Google Scholar] [CrossRef]
  5. Silveira, A.V.M.; Fuchs, M.S.; Pinheiro, D.K.; Tanabe, E.H.; Bertuol, D.A. Recovery of indium from LCD screens of discarded cell phones. Waste Manag. 2015, 45, 334–342. [Google Scholar] [CrossRef] [PubMed]
  6. Willner, J.; Fornalczyk, A.; Gajda, B.; Saternus, M. Bioleaching of indium and tin from used LCD panels. Physicochem. Probl. Miner. Process. 2018, 54, 639–645. [Google Scholar] [CrossRef]
  7. Guan, J.; Wang, S.; Ren, H.; Guo, Y.; Yuan, H.; Yan, X.; Guo, J.; Gu, W.; Su, R.; Liang, B.; et al. Indium recovery from waste liquid crystal displays by polyvinyl chloride waste. RSC Adv. 2015, 5, 102836–102843. [Google Scholar] [CrossRef]
  8. Ma, E.; Xu, Z. Technological process and optimum design of organic materials vacuum pyrolysis and indium chlorinated separation from waste liquid crystal display panels. J. Hazard. Mater. 2013, 263 Pt 2, 610–617. [Google Scholar] [CrossRef] [PubMed]
  9. Fortin-Lecomte, C.; Tran, L.-H.; Rioux, G.; Coudert, L.; Blais, J.-F. Recovery of indium from acidic leach solutions of spent LCD panels using ion exchange. Hydrometallurgy 2022, 210, 105845. [Google Scholar] [CrossRef]
  10. Lahti, J.; Vázquez, S.; Virolainen, S.; Mänttäri, M.; Kallioinen, M. Membrane filtration enhanced hydrometallurgical recovery process of indium from waste LCD panels. J. Sustain. Metall. 2020, 6, 576–588. [Google Scholar] [CrossRef]
  11. Souada, M.; Louage, C.; Doisy, J.-Y.; Meunier, L.; Benderrag, A.; Ouddane, B.; Bellayer, S.; Nuns, N.; Traisnel, M.; Maschke, U. Extraction of indium-tin oxide from end-of-life LCD panels using ultrasound assisted acid leaching. Ultrason. Sonochemistry 2018, 40 Pt A, 929–936. [Google Scholar] [CrossRef] [PubMed]
  12. Luo, D.; Zhu, N.; Li, Y.; Cui, J.; Wu, P.; Wang, J. Simultaneous leaching and extraction of indium from waste LCDs with acidic ionic liquids. Hydrometallurgy 2019, 189, 105146. [Google Scholar] [CrossRef]
  13. Moutiy, E.H.; Tran, L.-H.; Mueller, K.K.; Coudert, L.; Blais, J.-F. Optimized indium solubilization from LCD panels using H2SO4 leaching. Waste Manag. 2020, 114, 53–61. [Google Scholar] [CrossRef] [PubMed]
  14. Tuck, D.G. Critical survey of stability constants of complexes of indium. Pure Appl. Chem. 1983, 55, 1477–1528. [Google Scholar] [CrossRef]
  15. Ritcey, G.M.; Ashbrook, A.W. Solvent Extraction: Principles and Applications to Process Metallurgy (Vol. 2); Elsevier: Amsterdam, The Netherlands, 1984. [Google Scholar]
  16. Schuster, J.; Ebin, B. Investigation of indium and other valuable metals leaching from unground waste LCD screens by organic and inorganic acid leaching. Sep. Purif. Technol. 2021, 279, 119659. [Google Scholar] [CrossRef]
  17. Abd El Fatah, A.I.L.; Elashry, S.M. La (III) separation by tri octyl phosphine oxide (Cyanex 921) based on Amberlite Xad-4 chelating resin. J. Inorg. Organomet. Polym. Mater. 2022, 32, 2793–2805. [Google Scholar] [CrossRef]
  18. Ferella, F.; Belardi, G.; Marsilii, A.; De Michelis, I.; Vegliò, F. Separation and recovery of glass, plastic and indium from spent LCD panels. Waste Manag. 2017, 60, 569–581. [Google Scholar] [CrossRef] [PubMed]
  19. Pu, Q.; Zhang, B.; Zhou, S.; Wei, Y.; Li, B.; Wang, H. Efficient recovery of indium from waste indium tin oxide (ITO) targets by pressure leaching with sulfuric acid. React. Chem. Eng. 2023, 8, 2332–2341. [Google Scholar] [CrossRef]
  20. Virolainen, S.; Ibana, D.; Paatero, E. Recovery of indium from indium tin oxide by solvent extraction. Hydrometallurgy 2011, 107, 56–61. [Google Scholar] [CrossRef]
  21. Oliveira GFRde Botelho Junior, A.B.; Tenório, J.A.S. Separation of cobalt from the nickel-rich solution from HPAL process by synergism using organic extracts Cyanex 272 and Ionquest 290. Tecnol. Metal. Mater. Mineração 2019, 16, 478–486. [Google Scholar] [CrossRef]
  22. Sreevani, K.; Thangaraj, K.; Ramamurthi, K.; Selvanayagam, S.; Sridhar, B.; Anierudhe, V.V. Growth and characterization of dichloro tris(triphenyl phosphine oxide)cadmium(II)—Second harmonic generation from a centrosymmetric crystal. J. Miner. Mater. Charact. Eng. 2013, 1, 20–23. [Google Scholar] [CrossRef]
Figure 1. Flow-sheet for the leaching of pulverized LCD panels.
Minerals 15 01084 g001
Figure 2. Schematic representation of the solvent extraction of metal ions from the aqueous phase to the organic phase.
Minerals 15 01084 g002
Figure 3. Flow-sheet for sample preparation of scrap LCD panels.
Minerals 15 01084 g003
Figure 4. Selection of leaching agent [Solid: Pulverized LCD panels; Liquid: 5% respective mineral acids; Temperature: 60 °C; Time: 30 min; Pulp density: 100 g/L].
Minerals 15 01084 g004
Figure 5. Effect of Acid Concentration [Solid: Pulverized LCD panels; Liquid: vary; Temperature: 60 °C; Time: 30 min; Pulp density: 100 g/L].
Minerals 15 01084 g005
Figure 6. Effect of Pulp Density [Solid: Pulverized LCD panels; Liquid: 5% H2SO4; Temperature: 60 °C; Time: 30 min; Pulp density: vary].
Minerals 15 01084 g006
Figure 7. Effect of Temperature [Solid: Pulverized LCD panels; Liquid: 5% H2SO4; Temperature: vary; Time: 30 min; Pulp density: 100 g/L].
Minerals 15 01084 g007
Figure 8. Effect of time [Solid: Pulverized LCD panels; Liquid: 5% H2SO4; Temperature: 60 °C; Time: vary; Pulp density: 100 g/L].
Minerals 15 01084 g008
Figure 9. Kinetics of In dissolution [Solid: Pulverized LCD panels; Liquid: 5% H2SO4; Temperature: 60 °C; Time: 30 min; Pulp density: 100 g/L].
Minerals 15 01084 g009
Figure 10. Arrhenius plot of In dissolution [Solid: Pulverized LCD panels; Liquid: 5% H2SO4; Time: 30 min; Pulp density: 100 g/L].
Minerals 15 01084 g010
Figure 11. Selection of extractant [O/A ratio: 1/3; Organic: 20% of respective organic; Mixing time: 15 min].
Minerals 15 01084 g011
Figure 12. Effect of pH [O/A ratio: 1/3; Organic: 20% Cyanex 291; Mixing time: 15 min].
Minerals 15 01084 g012
Figure 13. Effect of time [O/A ratio: 1/3; Organic: 20% Cyanex 291, pH: 2.5].
Minerals 15 01084 g013
Figure 14. McCabe–Thiele plot for In extraction using 20% Cyanex 921.
Minerals 15 01084 g014
Figure 15. Developed process flowsheet for the recycling of pulverized LCD panels.
Minerals 15 01084 g015
Figure 16. FT-IR spectra of In-loaded Cyanex 921.
Minerals 15 01084 g016
Table 1. Elemental weight composition of pulverized LCD panels.
Elements Sn In Al Balance
wt.%0.04050.02050.7643Silica
g/ton4052057643Silica
Disclaimer/Publisher’s Note: The statements, opinions and data contained in all publications are solely those of the individual author(s) and contributor(s) and not of MDPI and/or the editor(s). MDPI and/or the editor(s) disclaim responsibility for any injury to people or property resulting from any ideas, methods, instructions or products referred to in the content.