Article

Comparative Evaluation of Flow Rate Distribution Methods for Uranium In-Situ Leaching via Reactive Transport Modeling

by
Maksat Kurmanseiit
1,
Nurlan Shayakhmetov
1,*,
Daniar Aizhulov
2,*,
Aray Tleuberdy
3,
Banu Abdullayeva
3 and
Madina Tungatarova
1
1
Department of Mechanical Engineering, Satbayev University, Almaty 050013, Kazakhstan
2
Department of Software Engineering, Satbayev University, Almaty 050013, Kazakhstan
3
Department of Mechanics, Al-Farabi Kazakh National University, Almaty 050040, Kazakhstan
*
Authors to whom correspondence should be addressed.
Minerals 2025, 15(10), 1066; https://doi.org/10.3390/min15101066
Submission received: 2 September 2025 / Revised: 30 September 2025 / Accepted: 9 October 2025 / Published: 11 October 2025
(This article belongs to the Section Mineral Processing and Extractive Metallurgy)

Abstract

In situ leaching represents an efficient and safe method for uranium mining, where a suboptimal well flow rate distribution leads to solution imbalances between wells, forming stagnant zones that increase operational costs. This study examines a real technological block from the Budenovskoye deposit, applying reactive transport modeling to optimize well flow rates and reduce operational time and reagent consumption. A reactive transport model was developed based on mass conservation and Darcy’s laws coupled with chemical kinetics describing sulfuric acid interactions with uranium minerals ( U O 2 and U O 3 ). The model simulated a technological block with 4 production and 18 injection wells arranged in hexagonal cells over 511–542 days to achieve 90% uranium recovery. Six approaches for well flow rate redistribution were compared, based on different weighting factor calculation methods: advanced traditional, linear distance, squared distance, quadrilateral area, and two streamline-based approaches utilizing the minimum and average time of flight. The squared distance method achieved the highest efficiency, reducing operational costs by 5.7% through improved flow redistribution. The streamline-based methods performed comparably and offer potential advantages for heterogeneous conditions by automatically identifying hydraulic connections. The reactive transport modeling approach successfully demonstrated that multi-criteria optimization methods can improve ISL efficiency by 3.9%–5.7% while reducing operational costs.

1. Introduction

In situ leaching (ISL, also known as in situ recovery) is among the most cost-effective and widely used techniques for uranium mining [1]. Its application, however, is not limited to uranium: ISL has also been successfully employed for the extraction of copper [2], rare-earth elements [3], gold, and other minerals. The efficiency of the method relies on pumping a leaching solution into an ore-bearing formation through a set of injection wells, where it chemically interacts with the ore, converting the valuable component into a solution. The enriched solution is subsequently pumped to the surface through production wells (Figure 1).
The main advantages of this technology are its cost-effectiveness, as it eliminates the need to construct mines or quarries, and its relative safety, since there is no direct contact with the ore in the case of uranium mining. The ISL method is most applicable when the ore is uniformly distributed at low concentrations, ensuring a large area of interaction with the reagent. A key disadvantage of ISL is the inability to directly observe the processes occurring within the formation, effectively making the system a “black box”.
The extraction process can be broadly divided into the following main stages:
1
Exploration—the identification, delineation, and localization of ore-bearing zones through exploratory drilling and well-logging [4]. At this stage, well log data are also interpreted, and borehole information is interpolated to evaluate the filtration capacity properties and the distribution of mineralization in the inter-well space.
2
Zoning—the division of a deposit into geological and technological blocks. A technological block is understood as an area, typically characterized by relatively homogeneous filtration properties, with a separate budget and developed under an independent project.
3
Design of the technological block—involves determining the number and placement of wells, selecting a deposit extraction pattern (e.g., hexagonal, linear, or other configurations of well locations) [5,6], and performing preliminary predictive calculations of production curves under anticipated operating conditions. These calculations account for parameters such as well flow rates, the composition and acidity of the leaching solution, the vertical distribution of well screens, and other factors.
4
Commissioning, exploitation, and decommissioning of a technological block—encompasses the actual extraction process, accompanied by continuous monitoring using data from production and observation wells.
Forecasting and analysis of uranium production are effectively carried out using mathematical modeling. A comparison of different operating scenarios and well configurations is also possible only through modeling, as proper evaluation requires identical geological and technological conditions that cannot be achieved in field experiments. Mathematical modeling has gained increasing prominence in uranium mining, as evidenced by numerous studies demonstrating its successful application.
In [7], a reactive transport model of roll-front ore formation in sandstones was developed using experimentally determined reaction rates. The model reproduces the convection and chemical processes controlling uranium precipitation and dissolution, demonstrating that roll-front geometry forms naturally in homogeneous media through epigenetic filtration. The uniform filtration properties and metal concentration along redox boundaries make ISL highly efficient and economically viable in the presence of aquitards. In [8], the HYTEC software package was used to predict long-term geochemical changes from ISL operations based on 30 years of monitoring data from the Kandjugan deposit (Kazakhstan). Despite simplifications, assuming a homogeneous reservoir structure and generalized well operation history, the model successfully reproduced the spatio-temporal exploitation history, verified against 2023 drilling data. In [9], a PHAST-based model was used to simulate uranium dissolution dynamics at the Bayan-Uul deposit (China) during a 650-day field test with sulfuric acid and hydrogen peroxide, revealing that the uranium leaching zone significantly exceeded the acidification zone and that contaminated areas extended beyond the leaching zone. Long-term validation was demonstrated in [10], where a 3D model was used to describe the 12-year acid front evolution following pilot-scale ISL in Mongolia, accounting for sorption, advection, and secondary mineral reactions under natural recovery conditions. These studies, along with [11], collectively demonstrate that reactive transport modeling is valuable for optimizing ISL operations with respect to both environmental protection and production efficiency.
A key challenge in ISL reactive transport modeling is the high computational cost, which is addressable through parallel computing and machine learning approaches. GPU acceleration using CUDA and streamline methods [12] achieved 24–42-fold speedup while maintaining accuracy. Machine learning alternatives include generative models (cDC-GAN and AAE-KRG) that account for geological heterogeneity and uncertainty [13], Physics-Informed Neural Networks (PINNs) for hydrodynamic modeling that reduce Poisson equation iterations by 2.8–7.1-fold [14], and regression-based ANNs for production forecasting from historical data without resource-intensive modeling steps [15].
Importantly, however, in Kazakhstan, uranium deposits represent epigenetic ore formations formed through the transport and reprecipitation of minerals in sedimentary rocks [7]. Consequently, porosity and permeability vary only slightly within the scale of a single block, which enables effective zoning. This conclusion is consistent with the findings of [8], which demonstrated that a mathematical model, even under the assumption of homogeneity and the use of generalized well operation histories, can accurately reproduce the spatio-temporal evolution of processes. Building on these insights, and under the conditions of generalized production histories and a homogeneous reservoir structure, two key points can be formulated for the present study: (i) extraction efficiency is determined primarily by the spacing between wells rather than by reservoir heterogeneity, and (ii) the streamline method is capable of adequately representing the pattern of filtration processes under such assumptions.
Forecasting production and analyzing operating regimes in ISL require the development of a comprehensive mathematical model that reproduces the key hydrodynamic and geochemical processes, namely, advection (convection), dispersion (molecular diffusion), and chemical kinetics, while also accounting for the interaction of injection and production wells and their spatial configuration [7,9,11,12]. Reactive transport models that integrate hydrodynamic simulation with geochemical modules make it possible to predict the spatio-temporal evolution of leaching zones, assess the efficiency of various technological regimes (including reagent concentrations and injection/production schedules), and analyze the long-term environmental consequences of exploitation [8,10]. However, such models demand substantial computational resources [12,13,14,15], and, under the confidentiality policies of uranium deposits, which preclude the use of remote centralized computing clusters, there arises a need to accelerate methods capable of providing more accurate predictive results based on simplified models.
An accurate mathematical model combined with accelerated computation enables the automation of the design and operation process, including the key task of optimally allocating well flow rates in ISL. The problem of flow rate optimization is examined in [16,17,18,19,20,21,22,23,24,25], where the main factors influencing production efficiency are considered, including the hydrodynamic properties of the reservoir, the geochemical interactions of the leaching solution with the host rock, and the configuration and operating regimes of the wells.
Li et al. [16] demonstrated the effectiveness of a hybrid well placement scheme (horizontal injection–vertical production) with nonuniform spacing, achieving a 42.25% increase in the leaching zone through multiparametric flow rate optimization. This confirms the potential of adapting well flow rates to their spatial configuration. Their study also established that an optimal injection/production ratio of 1.003 ensures effective control of the well influence zone, with flow velocity decreasing exponentially with distance. In [17], the effectiveness of a nonuniform injection flow rate distribution (10% higher for inner wells than for outer wells) for controlling solutions was shown using TOUGHREACT, further underscoring the need for individual optimization of well flow rates depending on their placement scheme. Reference [18] focused on profit maximization in the development of the Bayan-Uul sandstone uranium deposit through adaptive process parameter management based on machine learning methods. The authors demonstrated the necessity of the multi-criteria optimization of ISL parameters, taking into account both technical uranium recovery indicators and economic factors such as reagent costs and operational expenses. The study also confirmed the importance of accelerating computations, which was achieved using the Monte Carlo method while maintaining the high accuracy of the results. In [19], a surrogate model based on Recurrent U-Net and Recurrent Residual U-Net was proposed as an alternative to computationally expensive reactive transport modeling. This approach reduced the computation time by a factor of 34 compared to the traditional Monte Carlo method. The authors demonstrated the effectiveness of multi-criteria ISL parameter optimization using the NSGA-II evolutionary algorithm and deep learning methods to simultaneously maximize uranium recovery, minimize costs, and control environmental risks.
Luo et al. [20] identified a trade-off between maximizing uranium recovery, which requires reducing production well flow rates, and minimizing dead zones, which is achieved by increasing injection well flow rates. Accordingly, the multi-criteria optimization of the well flow rate distribution, taking into account the spatial distribution of the minerals within the deposit, is an important task. In [21], the application of well reversal technology was examined as a means of reducing the impact of stagnant zones that arise due to zero hydraulic gradients during ISL. For linear well configurations, this approach allows efficiency levels comparable to those of hexagonal schemes to be achieved, providing a 3%–18% increase in recovery depending on the reversal method used. In [22], a quantitative approach was proposed based on identifying stagnation points (points with zero hydraulic gradient) near injection wells. Numerical hydrodynamic modeling enables the construction of a line connecting such points, which provides an objective external boundary of the leaching zone. This solution accounts for the actual nonuniform spacing between wells and the variation in flow rates, resulting in a more accurate and economically efficient distribution of flows between injection and production wells.
It is worth noting the studies of [23,24], which showed that filter clogging and changes in the permeability of ore-bearing rocks significantly affect the efficiency of ISL production, making them important factors to account for. However, the application of declogging technology using ammonium fluoride and soda has proven effective in restoring well performance. Additionally, a nonuniform distribution of well flow rates leads to uneven reagent delivery across the cells of a technological block, causing the formation of “stagnant zones”, areas not covered by the leaching solution, or spreading zones, with the solution flowing beyond the block boundaries [21]. Such zones (Figure 1) arise due to zero hydraulic gradients [20,22], which negatively impact both the technical and economic indicators of production [18], as well as environmental aspects [25]. The established term for this problem is “solution imbalance”, i.e., the heterogeneity of leaching and production solution distributions within local zones, such as hexagonal cells of technological blocks [26,27] (see the legend of Figure 1). During block operation, depending on the current level of imbalance, decisions are made to adjust well flow rates or modify the reagent composition of the solution. However, the effectiveness of such measures is often difficult to predict due to the complexity of assessing the consequences of each adjustment. A promising approach to addressing this challenge is multi-criteria optimization, which accounts for technological and economic parameters, the spatial distribution of minerals, and well configurations [16,17,18,19,20].
In the present study, the focus is placed on minimizing solution imbalance by redirecting flows from spreading zones to stagnant zones. In other words, reactive transport modeling is applied to determine the optimal well flow rates in order to reduce operating costs and mitigate adverse environmental impacts while keeping computational expenses to a minimum.

2. Materials and Methods

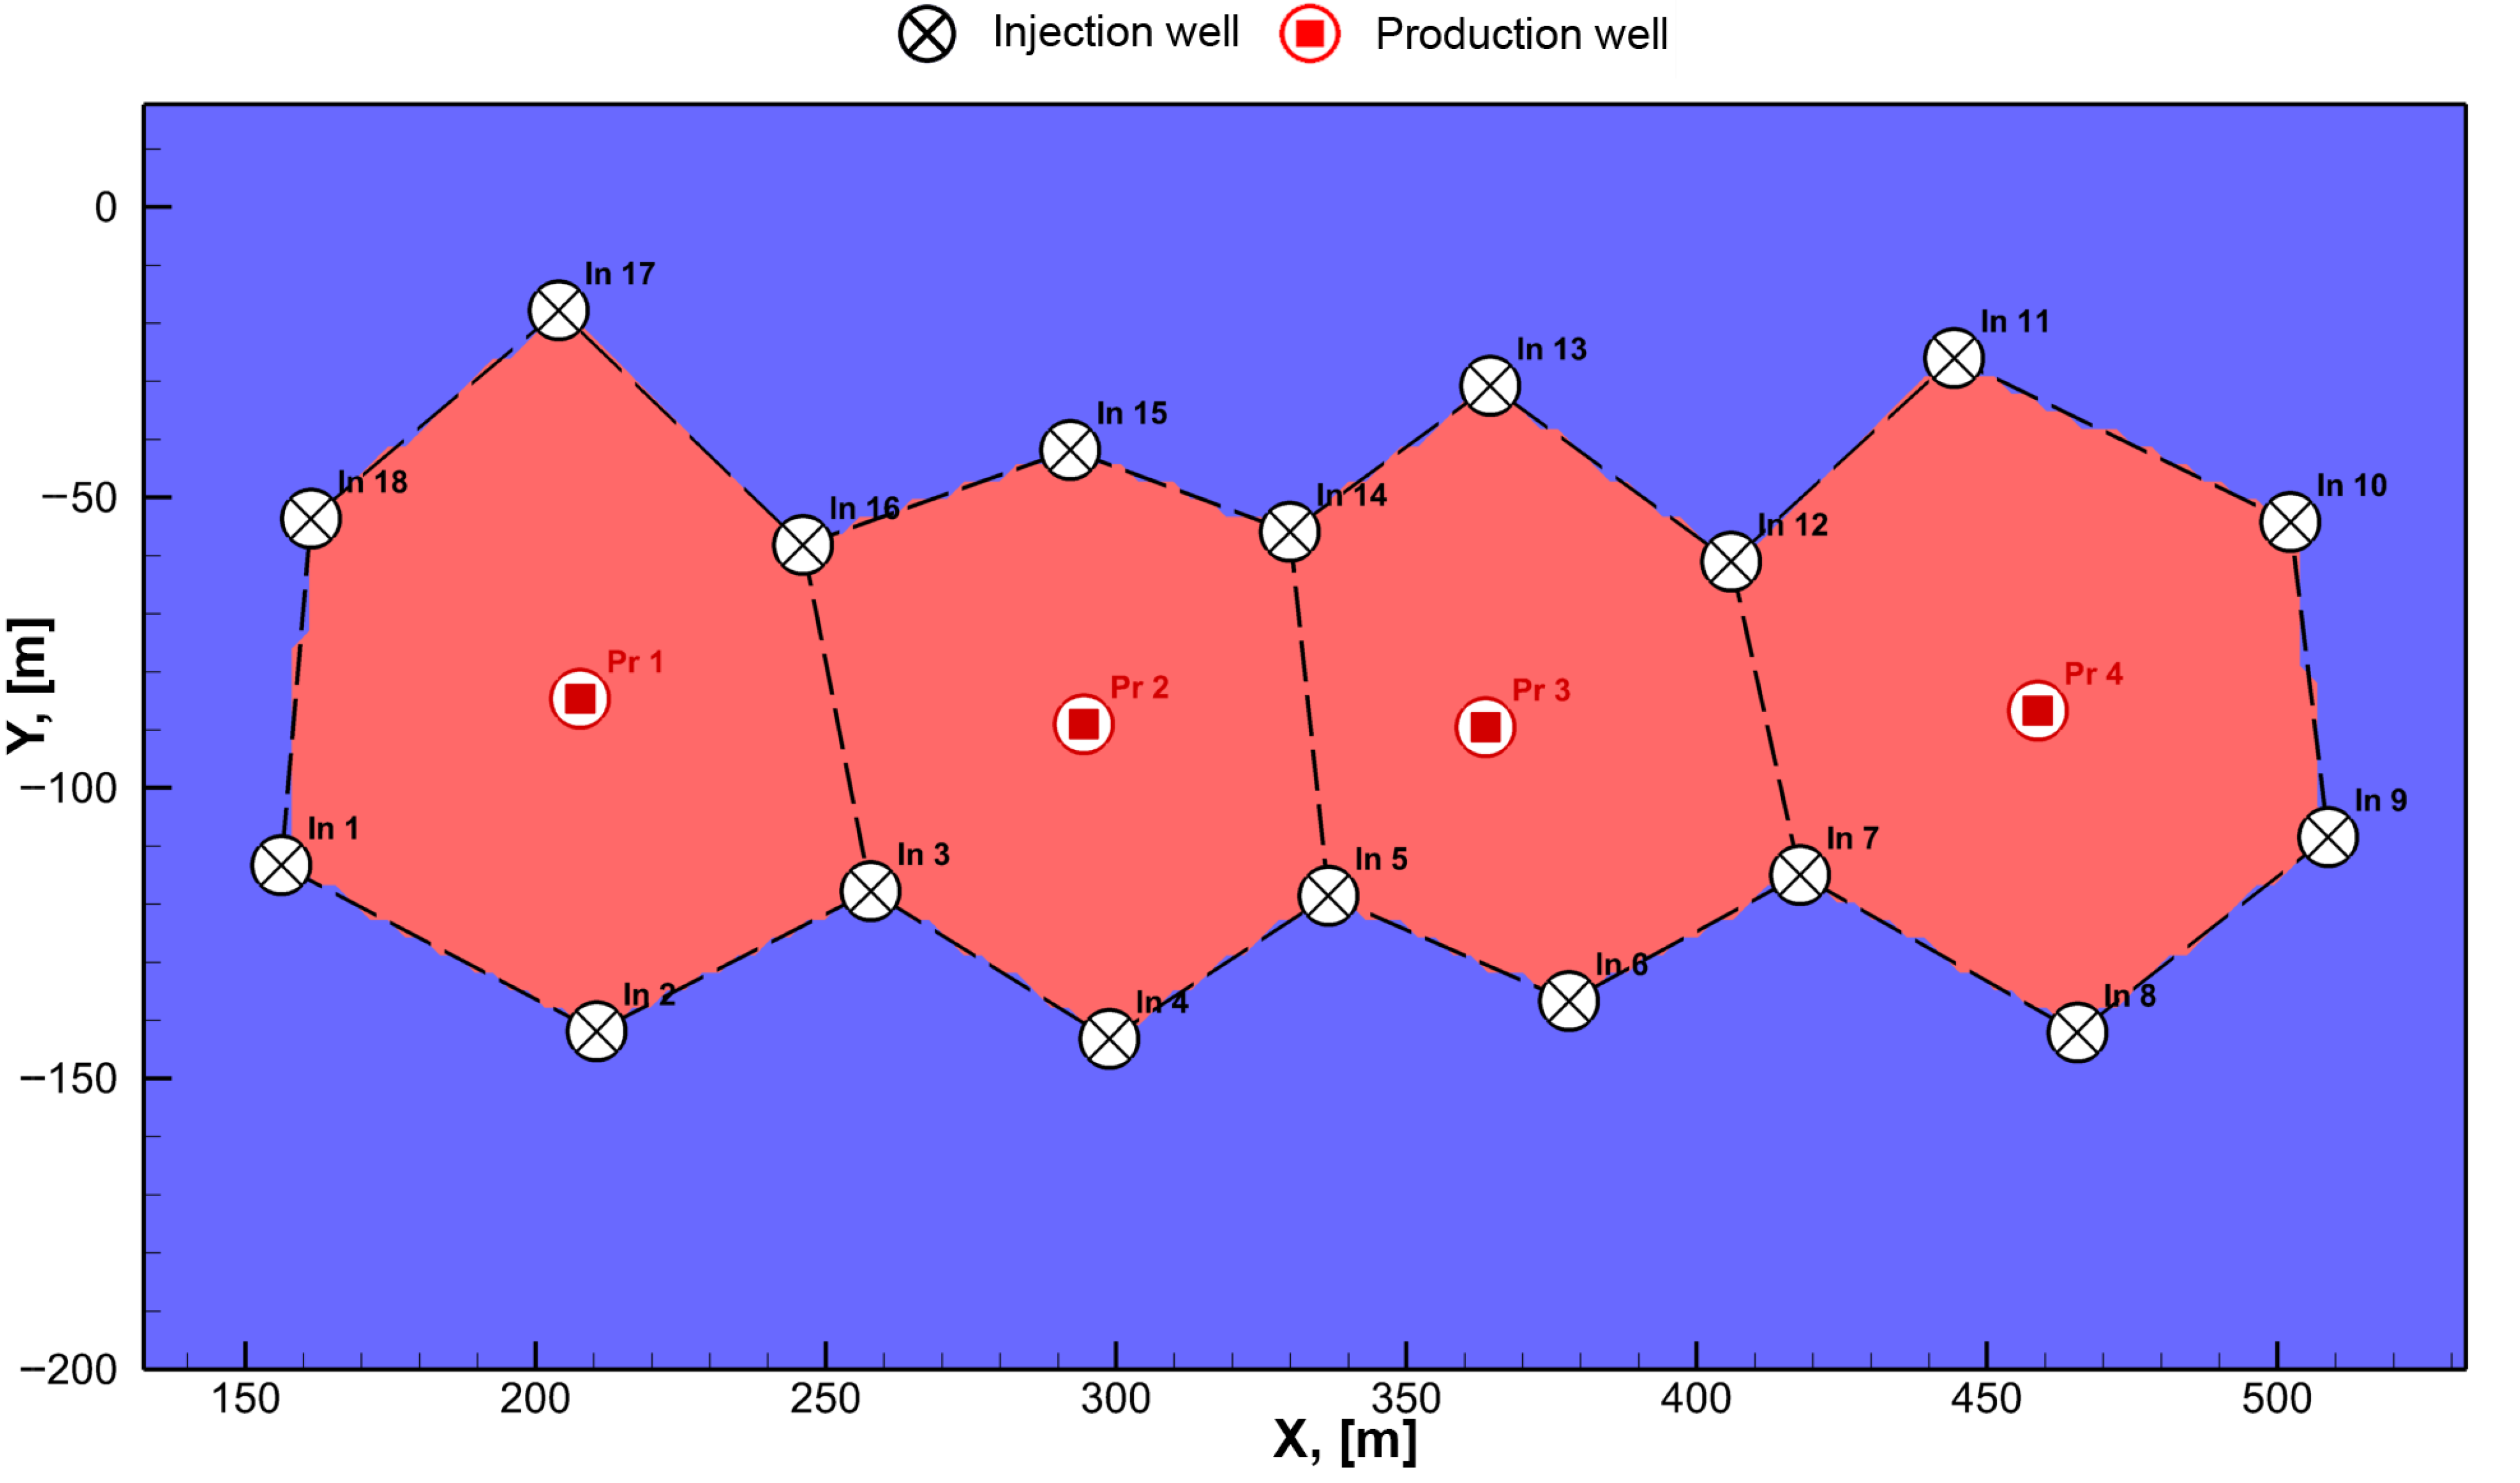
Methods for determining the optimal distribution of well flow rates in the technological block at the Budenovskoye deposit (Turkestan region, Kazakhstan) are studied and compared with the aim of reducing operational expenditures. The analysis is conducted using a reactive transport model and proprietary software developed by the authors, which has been implemented at several production sites of JSC “NAC Kazatomprom” (Astana, Kazakhstan). The reactive transport model was previously validated in [28] and relies on historical data from the same block [29,30]. As part of the studies carried out at this technological block, zones of flow imbalance were identified to improve process efficiency through subsequent redistribution of technological well flow rates [27]. The area of the considered technological block of the field is 23,700 m2, with an average specific uranium content of 15.25 kg/m3. Uranium was recovered from the formation using a well system consisting of 4 hexagonal cells, with the average distance between the injection and production wells being 40–67 m. The scheme includes 18 injection and 4 production wells, as shown in Figure 2.
The main geological and technical characteristics of the site are as follows:
  • Thickness averaged throughout the deposit— H = 11.28 [m];
  • Average uranium mass fraction— y U = 0.00077 [kg/kg];
  • Uranium content in meter-percent— a U = H · y U = 0.8686 [m%];
  • Hydraulic conductivity of the ore-bearing layer— K f = 7.0 [m/day];
  • Average density of the uranium-containing formation— ρ s = 1700 [kg/m3];
  • Average porosity of the layer— ϕ = 0.22 [m3/m3].
Reactive transport modeling is conducted to simulate the ISL process under the geological and hydrodynamic conditions of the technological block and to investigate various flow optimization methods with the aim of assessing their applicability and economic efficiency.

2.1. Reactive Transport Modeling

Mathematical modeling of the process is carried out using the reactive transport model, which consists of two stages.
The first stage is carried out through the modeling of hydrodynamic processes based on the mass conservation equation, that is, Equation (1), and Darcy’s law (2).
· v = i = 1 N P r Q P r i δ ( x x P r i , y y P r i ) production wells + j = 1 N I n Q I n j δ ( x x I n j , y y I n j ) injection wells
v = u ϕ = K f h
where v [m/day]—real velocity vector; N P r , N I n —number of production and injection wells, respectively; Q P r i , Q I n j [m3/day]—flow rate of the i-th production and j-th injection wells, respectively; x P r i , y P r i and x I n j , y I n j [m]—coordinates of the i-th production and j-th injection wells, respectively; u [m/day]—Darcy’s velocity vector; ϕ [m3/m3]—rock porosity; K f [m/day]—hydraulic conductivity of rock; and h [m]—hydraulic head.
By substituting Equation (2) into Equation (1), an elliptic equation for the hydraulic head (h) is obtained:
· ( K f h ) = i = 1 N P r Q P r i δ ( x x P r i , y y P r i ) + j = 1 N I n Q I n j δ ( x x I n j , y y I n j )
The second stage of modeling involves the simulation of the kinetics of the chemical reactions between the leaching agent (in this case, sulfuric acid, H 2 S O 4 ) contained in the leaching solution and the target uranium oxide minerals, represented in two valence states: U O 2 and U O 3 . As a result of this interaction, uranium is transformed into its dissolved form as the sulfate compound U O 2 S O 4 . However, it should be noted that other agents may be involved in the leaching process, including alkaline solutions and oxygen, which would require different chemical kinetic modeling methods [20]. The kinetics under consideration also account for the dissolution of accompanying minerals (M) in the rock by the leaching agent, with their concentrations calculated on the basis of the solid rock, the molar mass of which corresponds to the molar mass of the components dissolved by the leaching agent. The simplified chemical equation has the following form:
H 2 S O 4 ( l ) + U O 3 ( s ) k U O 3 U O 2 S O 4 ( l ) + H 2 O ( l )
H 2 S O 4 ( l ) + U O 2 ( s ) + O x i d a n t ( l ) k U O 2 U O 2 S O 4 ( l ) + 2 H ( l ) + + R e d u c t a n t ( s )
H 2 S O 4 ( l ) + M ( s ) k M S o l u t i o n ( l )
It should be noted that the chemical components presented in Equations (4)–(6) refer to the solid and liquid phases. The solid components are immobile, but their concentrations may change as a result of chemical reactions. The liquid components, in contrast, are subject to processes such as advection (convection), hydrodynamic dispersion, molecular diffusion, and chemical reactions, as well as the pumping into and out of the formation through injection and production wells. Taking into account the aggregate state of each reagent and their chemical interactions, the following dynamic system of partial differential equations is obtained for the concentrations of interest of the leaching reagent ( c H 2 S O 4 ), solid minerals ( c U O 2 , c U O 3 , and c M ), and the target mineral formed in dissolved form as a result of the reactions ( c U O 2 S O 4 ):
ϕ c H 2 S O 4 t = · ( u ϕ c H 2 S O 4 ) advection + 2 ( D ϕ c H 2 S O 4 ) dispersion ( ω 1 + ω 2 + ω 3 ) reactions + i = 1 N P r c H 2 S O 4 Q P r i Δ V δ ( x x P r i , y y P r i ) production wells + j = 1 N I n c H 2 S O 4 0 Q I n j δ ( x x I n j , y y I n j ) injection wells
( 1 ϕ ) c U O 3 t = ω 1 reaction
( 1 ϕ ) c U O 2 t = ω 2 reaction
( 1 ϕ ) c M t = ω 3 reaction
ϕ c U O 2 S O 4 t = · ( u ϕ c U O 2 S O 4 ) advection + 2 ( D ϕ c U O 2 S O 4 ) dispersion ( ω 1 + ω 2 ) reactions + i = 1 N P r c U O 2 S O 4 Q P r i Δ V δ ( x x P r i , y y P r i ) production wells
where c H 2 S O 4 [mol/L]—molar concentration of sulfuric acid in leaching solution; D [m2/day]—dispersion coefficient; c H 2 S O 4 0 [mol/L]—initial concentration of sulfuric acid in injection wells; ω 1 = k U O 3 c U O 3 c H 2 S O 4 , ω 2 = k U O 2 c U O 2 c H 2 S O 4 , and ω 3 = k M c H 2 S O 4 c U O 2 S O 4 [L/(mol·day)]—reaction rates for Equations (4), (5), and (6), respectively [28]; c U O 3 , c U O 2 , and c M [mol/L]—molar concentrations of uranium trioxide, uranium dioxide, and accompanying minerals, respectively; and c U O 2 S O 4 [mol/L]—molar concentration of uranyl sulfate in pregnant solution.
The main extracted mineral is uranium, where its oxide forms influence only the leaching rate through the corresponding reaction rate constants ( k U O 3 and k U O 2 ). Therefore, the primary focus is on the total uranium concentration ( c U ) in the following formation:
c U = c U O 3 + c U O 2
In this case, a 1:1 ratio of target uranium oxide minerals was adopted, following previous studies validated against real data [28]. The result of the first stage is the velocity field, which serves as an input for the second stage to determine the concentration at an arbitrary time t. The dynamics of the dissolved uranium and reagent concentrations in the leaching solution, particularly at the locations of production wells, are used to obtain the recovery rates over time, which constitute a key source of information for assessing production efficiency.
The reactive transport model was previously verified through convergence analysis, parameter estimation, and statistical validation. Convergence tests with computational cell sizes ranging from 13 m to 0.7 m showed that a 1.5 m cell size is sufficient, with variations in the hydraulic head below 1%. Kinetic parameters were determined as k U O 3 = 4.4 ± 0.1 , k U O 2 = 0.6 ± 0.1 , k M = 4.4 ± 0.1 , and simulations demonstrated good agreement with experimental data (NRMSD < 7%). Additional validation using data from the Budenovskoe deposit confirmed low error values for the uranium concentration (NRMSD = 0.0097 ) and ore recovery (NRMSD = 0.0168 ). Sensitivity analysis further revealed that a ±0.2 m/day change in flow velocity (≈25% of baseline) modifies uranium extraction by 3% and alters the mining time by 23%–31%, underscoring both the robustness of the model and the dominant influence of the flow rate on recovery outcomes.

2.2. Methods for Flow Rate Optimization

Common methods for optimizing the flow rates of production and injection wells are reduced to the problem of determining the weighting coefficients λ P r i and λ I n j for each well, based on the given total flow rate of the production Q s u m P r = i = 0 N P r Q P r i δ ( x x P r i , y y P r i ) and injection Q s u m I n = j = 0 N I n Q I n j δ ( x x I n j , y y I n j ) wells, respectively. In general, since one node of the acid distribution unit is assigned per block, the total flow rates are determined per the same block. However, the distribution framework can be scaled to other levels (e.g., field-wide implementation) if required for operational or optimization purposes. To ensure a balance between the flow rates of production and injection wells, the following condition must be satisfied, at least at the level of the entire technological block and preferably at the level of individual hexagonal cells [16,17]:
t ( Q s u m P r + Q s u m I n ) 0
To ensure consistency, a comparison of the results obtained using different methods was carried out at identical total well flow rates. In this analysis, the concentration of the leaching reagent ( c H 2 S O 4 0 ) in the leaching solution was kept constant at the standard operational level of 20 g/L [26]. The total flow rates were determined by averaging actual production data [29,30] (Figure 3).
The individual flow rate of each well is determined as follows:
Q P r i = λ P r i · Q s u m P r , Q I n j = λ I n j · Q s u m I n
In order to satisfy condition (13), and in accordance with Equation (14), the sum of the weighting coefficients for production and injection wells must be equal to one:
i = 1 N P r λ P r i = 1 , j = 1 N I n λ I n j = 1
Traditional optimization methods generally rely on simplified methods to determine weighting factors. In the most basic version, the weights are assigned in proportion to the number of injection and production wells, without consideration of their spatial arrangement or hydrodynamic connections:
λ P r i = 1 N P r i , λ I n j = 1 N I n j
A more advanced traditional (AT) method involves forming pairs of wells that are hydrodynamically connected according to the principle of “working for each other”, which allows for partial consideration of the configuration of the well pattern [26]:
λ P r i = n c o n i I n i = 1 N P r n c o n i P r , λ I n j = n c o n j P r j = 1 N I n n c o n j I n
i = 1 N P r n c o n i P r = j = 1 N I n n c o n j I n
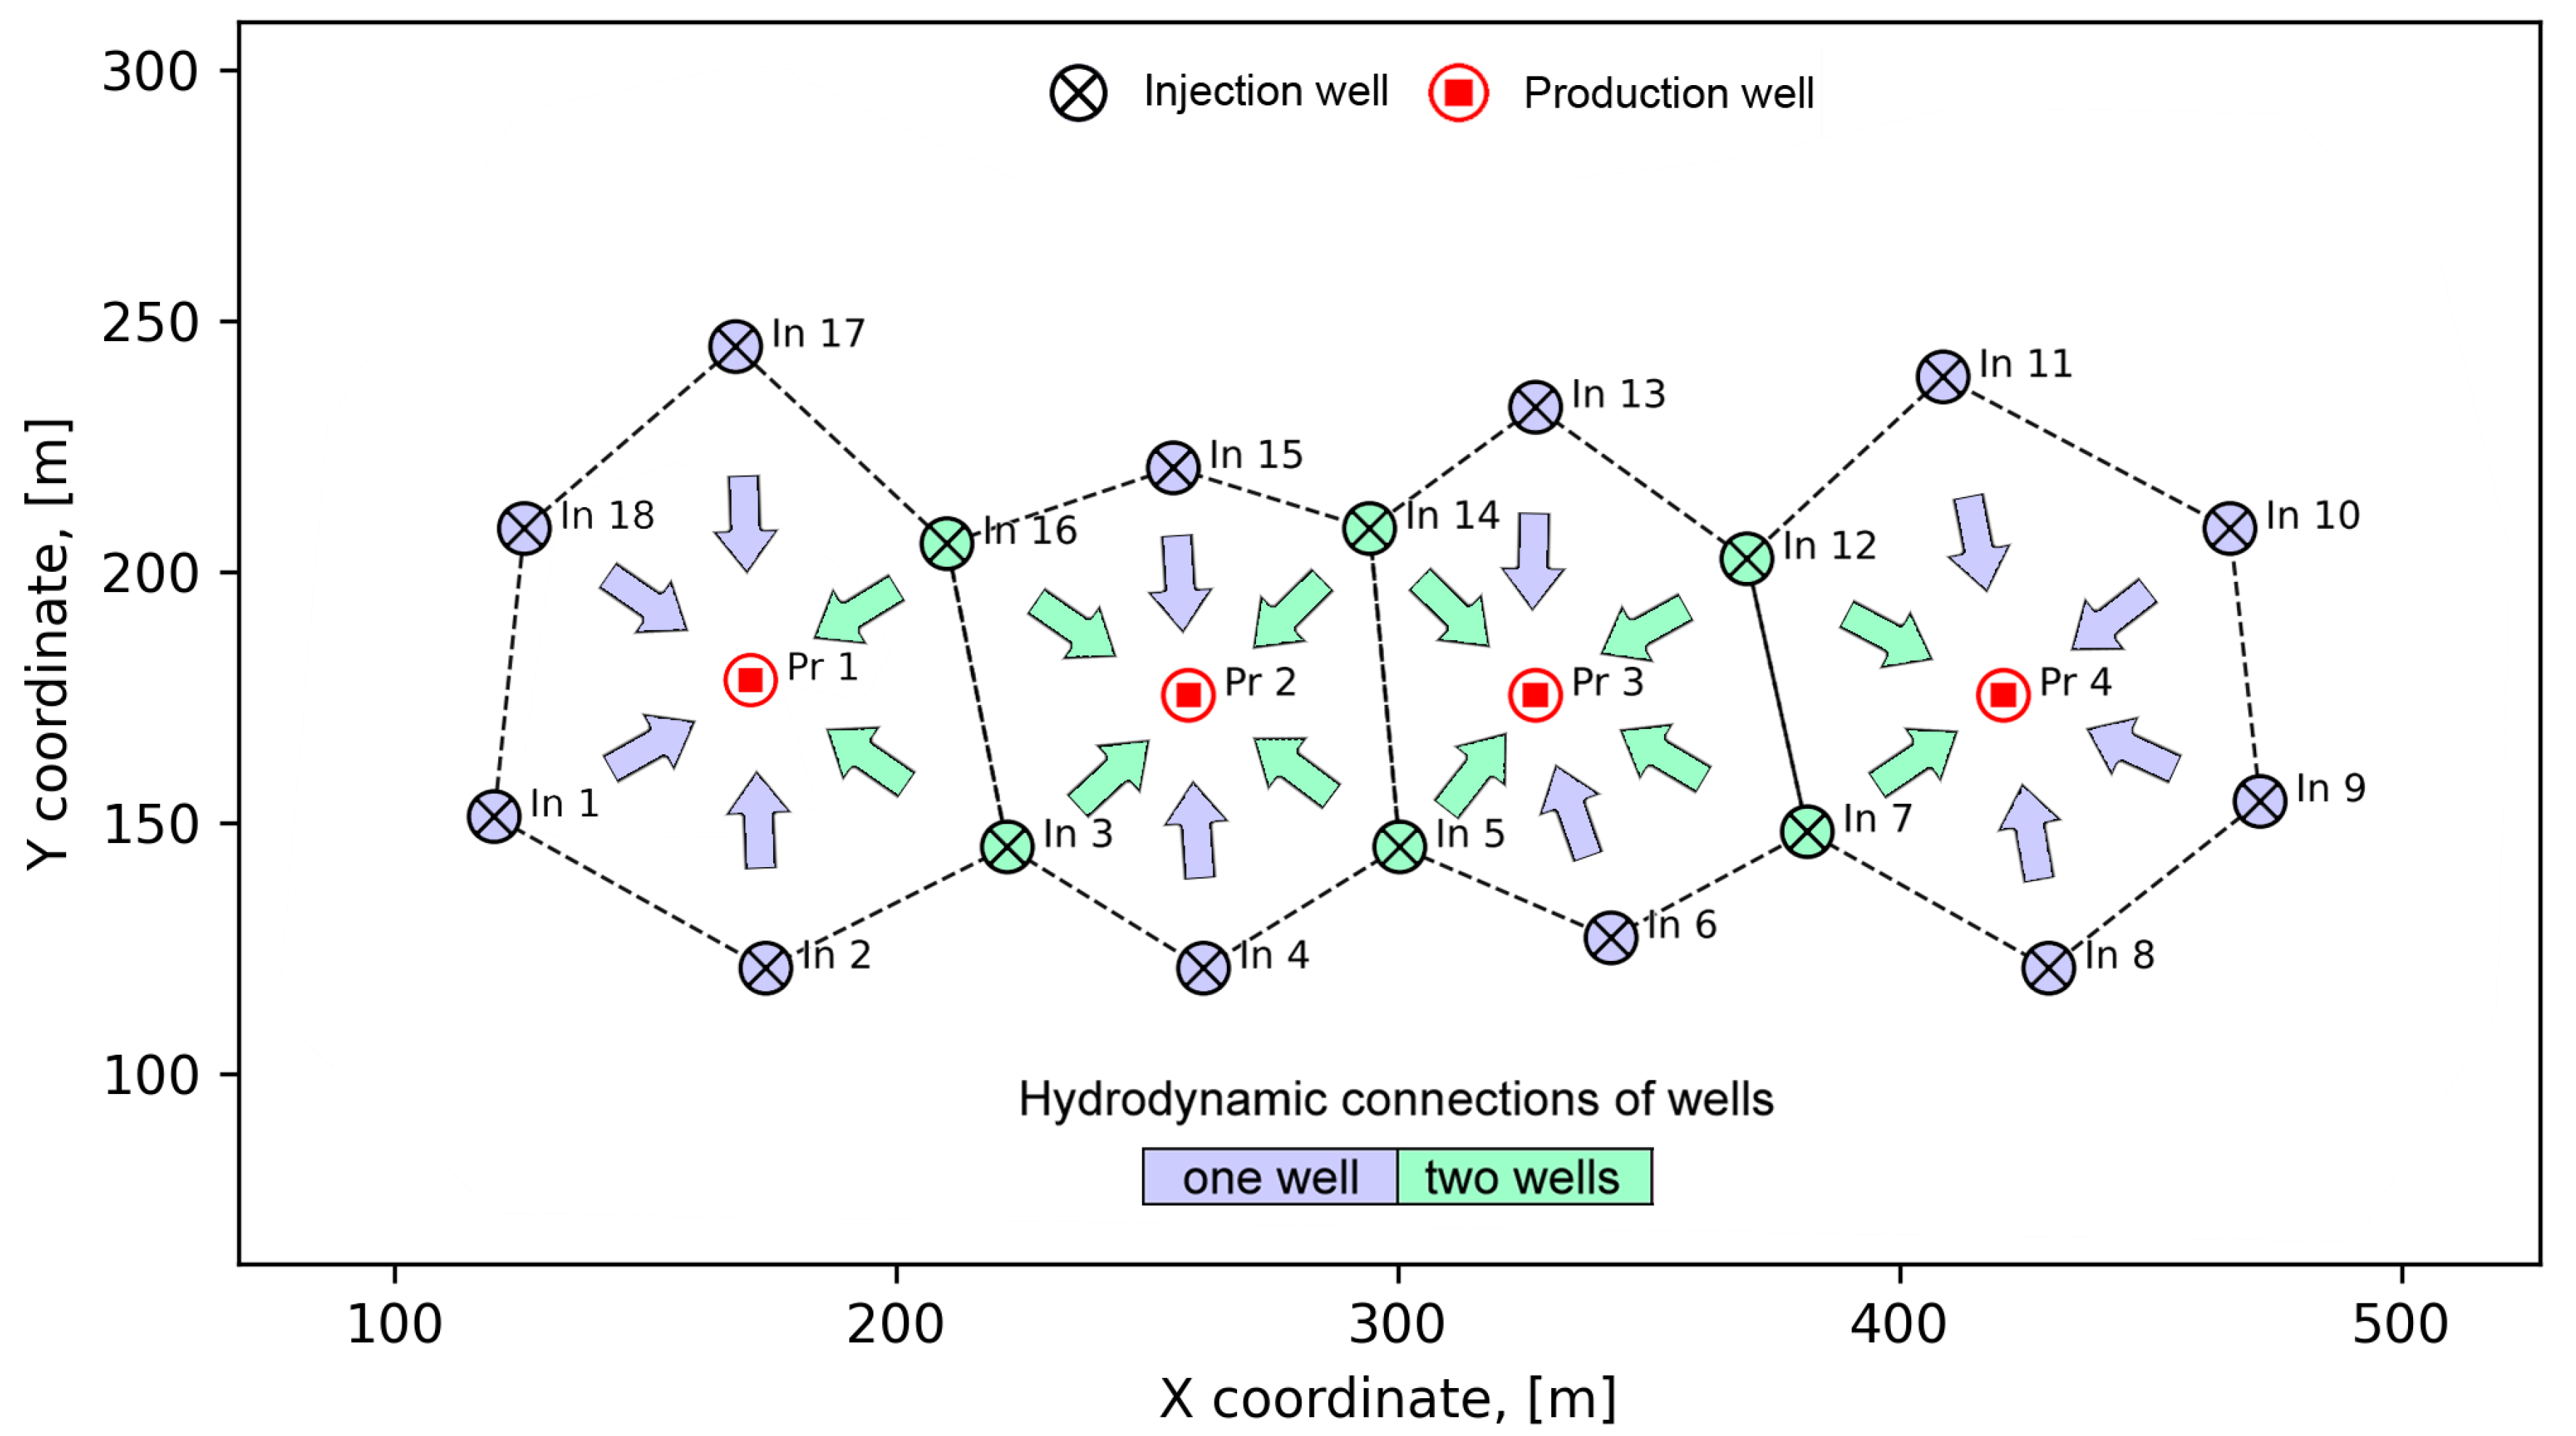
Figure 4 illustrates the distribution of hydrodynamic connections among 4 production wells ( N P r ) and 18 injection wells ( N I n ) in the block under consideration. For the basic traditional approach, the flow rate distribution factors are defined as follows: for production wells, λ P r i = 1 / 4 , and for injection wells, λ I n j = 1 / 18 .
In the AT approach, the hydrodynamic connections between each pair of injection and production wells are pre-calculated (the connections are shown by arrows in Figure 4). For example, well I n 1 is hydrodynamically connected only to P r 1 , and well I n 3 is connected to P r 1 and P r 2 . In the configuration under consideration, 6 injection wells are connected to 1 production well ( n c o n j P r = 1 ), and 12 are connected to 2 production wells ( n c o n j P r = 2 ). Thus, the total number of connections is j = 1 N I n n c o n j I n = 12 · 1 + 6 · 2 = 24 . In the considered block with a hexagonal well pattern, the total number of production wells is 4, and each well has six hydrodynamic connections ( n c o n j I n = 6 ) with adjacent injection wells. Accordingly, the total number of hydrodynamic connections between all production wells and the injection wells amounts to i = 1 N P r n c o n i P r = 4 · 6 = 24 . Taking this into account, the flow rate distribution coefficients are defined as follows:
  • For production wells— λ P r i = 6 24 ;
  • For injection wells connected to one production well— λ I n j = 1 24 ;
  • For injection wells connected to two production wells— λ I n j = 2 24 .
The verification of condition (15) yields the following:
i = 1 13 λ P r i = 4 · 6 24 = 1 , j = 1 42 λ I n j = 12 · 1 24 + 6 · 2 24 = 1
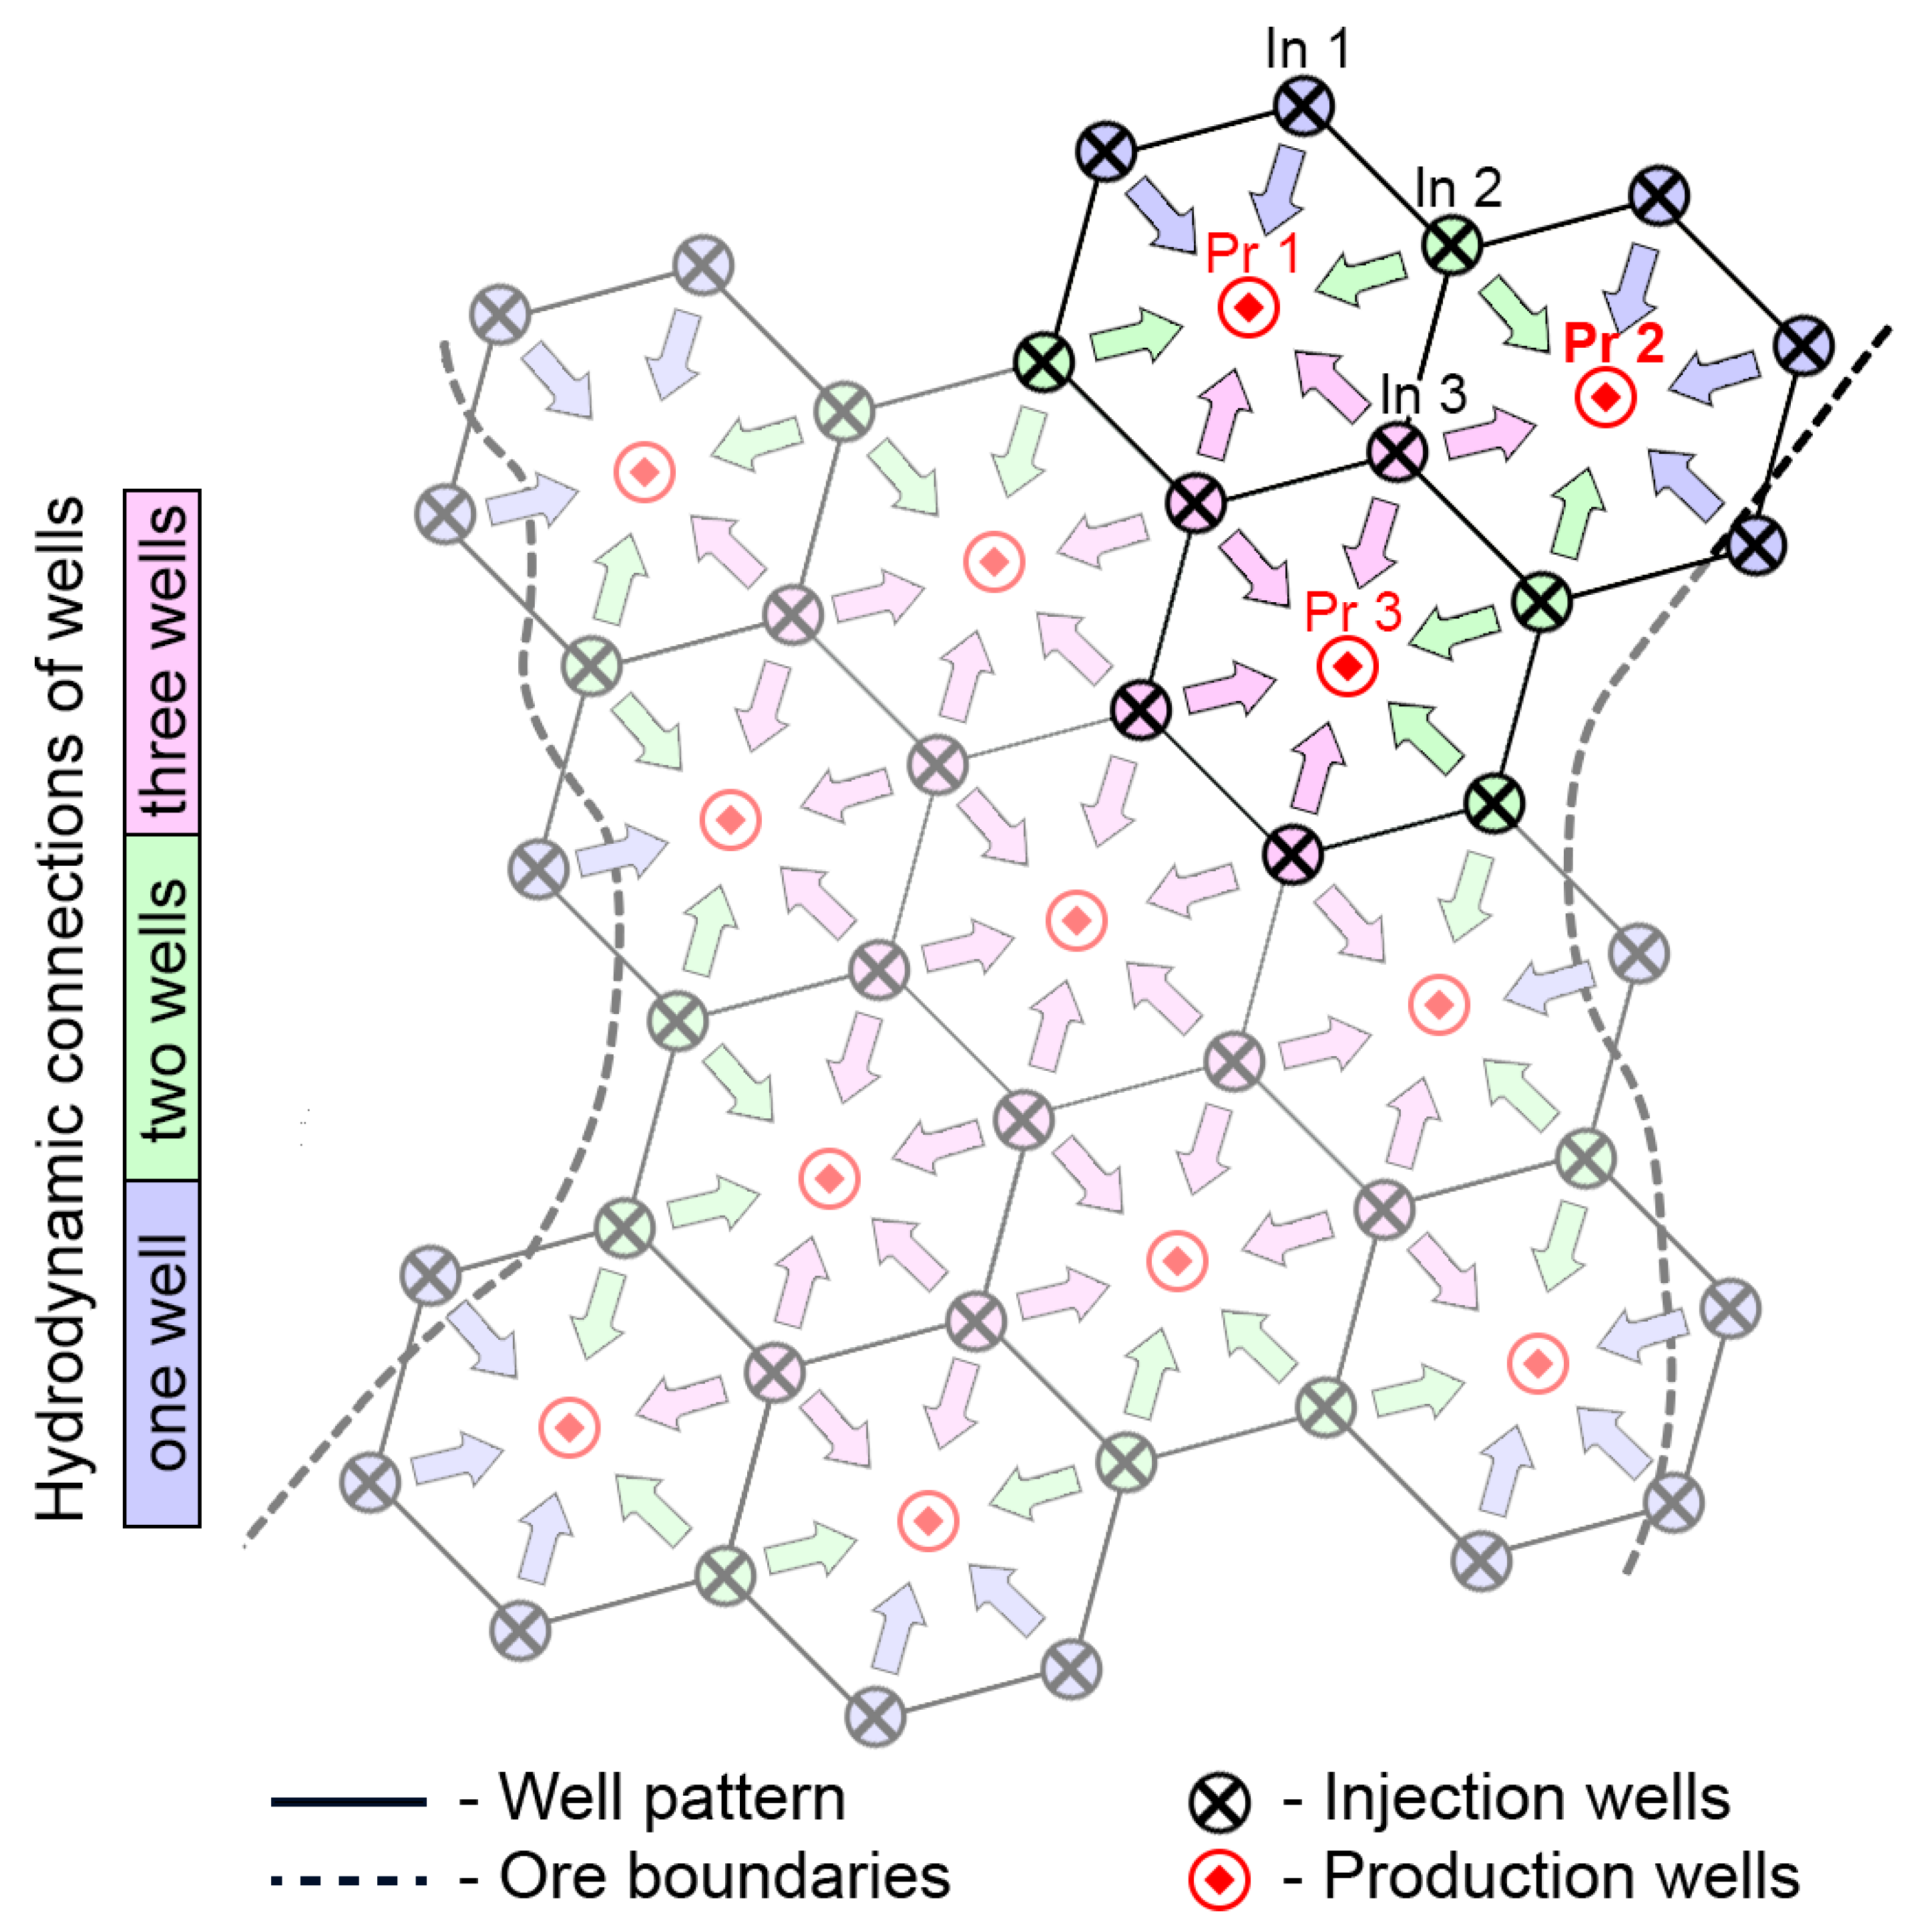
A variant is also observed when a single injection well is hydrodynamically connected to three production wells, as illustrated in Figure 5. In such cases, Equation (4) remains applicable.
Evidently, traditional approaches have the main drawback of neglecting the distances between wells. In practice, the geometry of the well pattern may vary considerably due to the technological limitations of drilling [31], the instability of wellbores (as confirmed by inclinometric measurements), and the necessity of covering the ore-bearing body. Consequently, the distances between wells may differ significantly, which influences the movement of solution fronts between them. In addition, the time required for the leaching solution to reach the production well can be affected by the filtration characteristics of the formation, such as hydraulic conductivity (permeability), porosity, and their variations [23,24]. However, according to data on actual production blocks, variations in filtration properties within a single block are usually minor and do not exert a critical effect on the overall pattern of flow redistribution [8].
In this regard, a method must be developed for determining well flow rates that accounts for both the distances between wells and their hydrodynamic connections. The weighting function can then be represented with an assumption of homogeneous filtration properties:
λ P r i = f ( x P r i , y P r i , n c o n I n ) , λ I n j = f ( x I n j , y I n j , n c o n P r )
In the context of the problem of determining the optimal flow rate distribution, five different types of functions were considered and analyzed, each incorporating the distance between wells in one way or another:
1
Linear distance between wells (LD)—accounts for the direct distance between a pair of injection and production wells;
2
Squared distance (SD)—assumes that the influence of distance on well interactions increases quadratically, which may reflect nonlinear filtration losses;
3
Area of the quadrilateral formed between injection and production wells (AQ)—allows the spatial configuration of the well grid to be considered;
4
Minimum time of flight along the streamline (TOFmin)—determined on the basis of the hydrodynamic model and reflects the shortest time for fluid movement between the wells;
5
Average time of flight along all streamlines between a pair of wells (TOFavg)—also calculated on the basis of the hydrodynamic model and characterizes the average time of solution transport between injection and production wells.
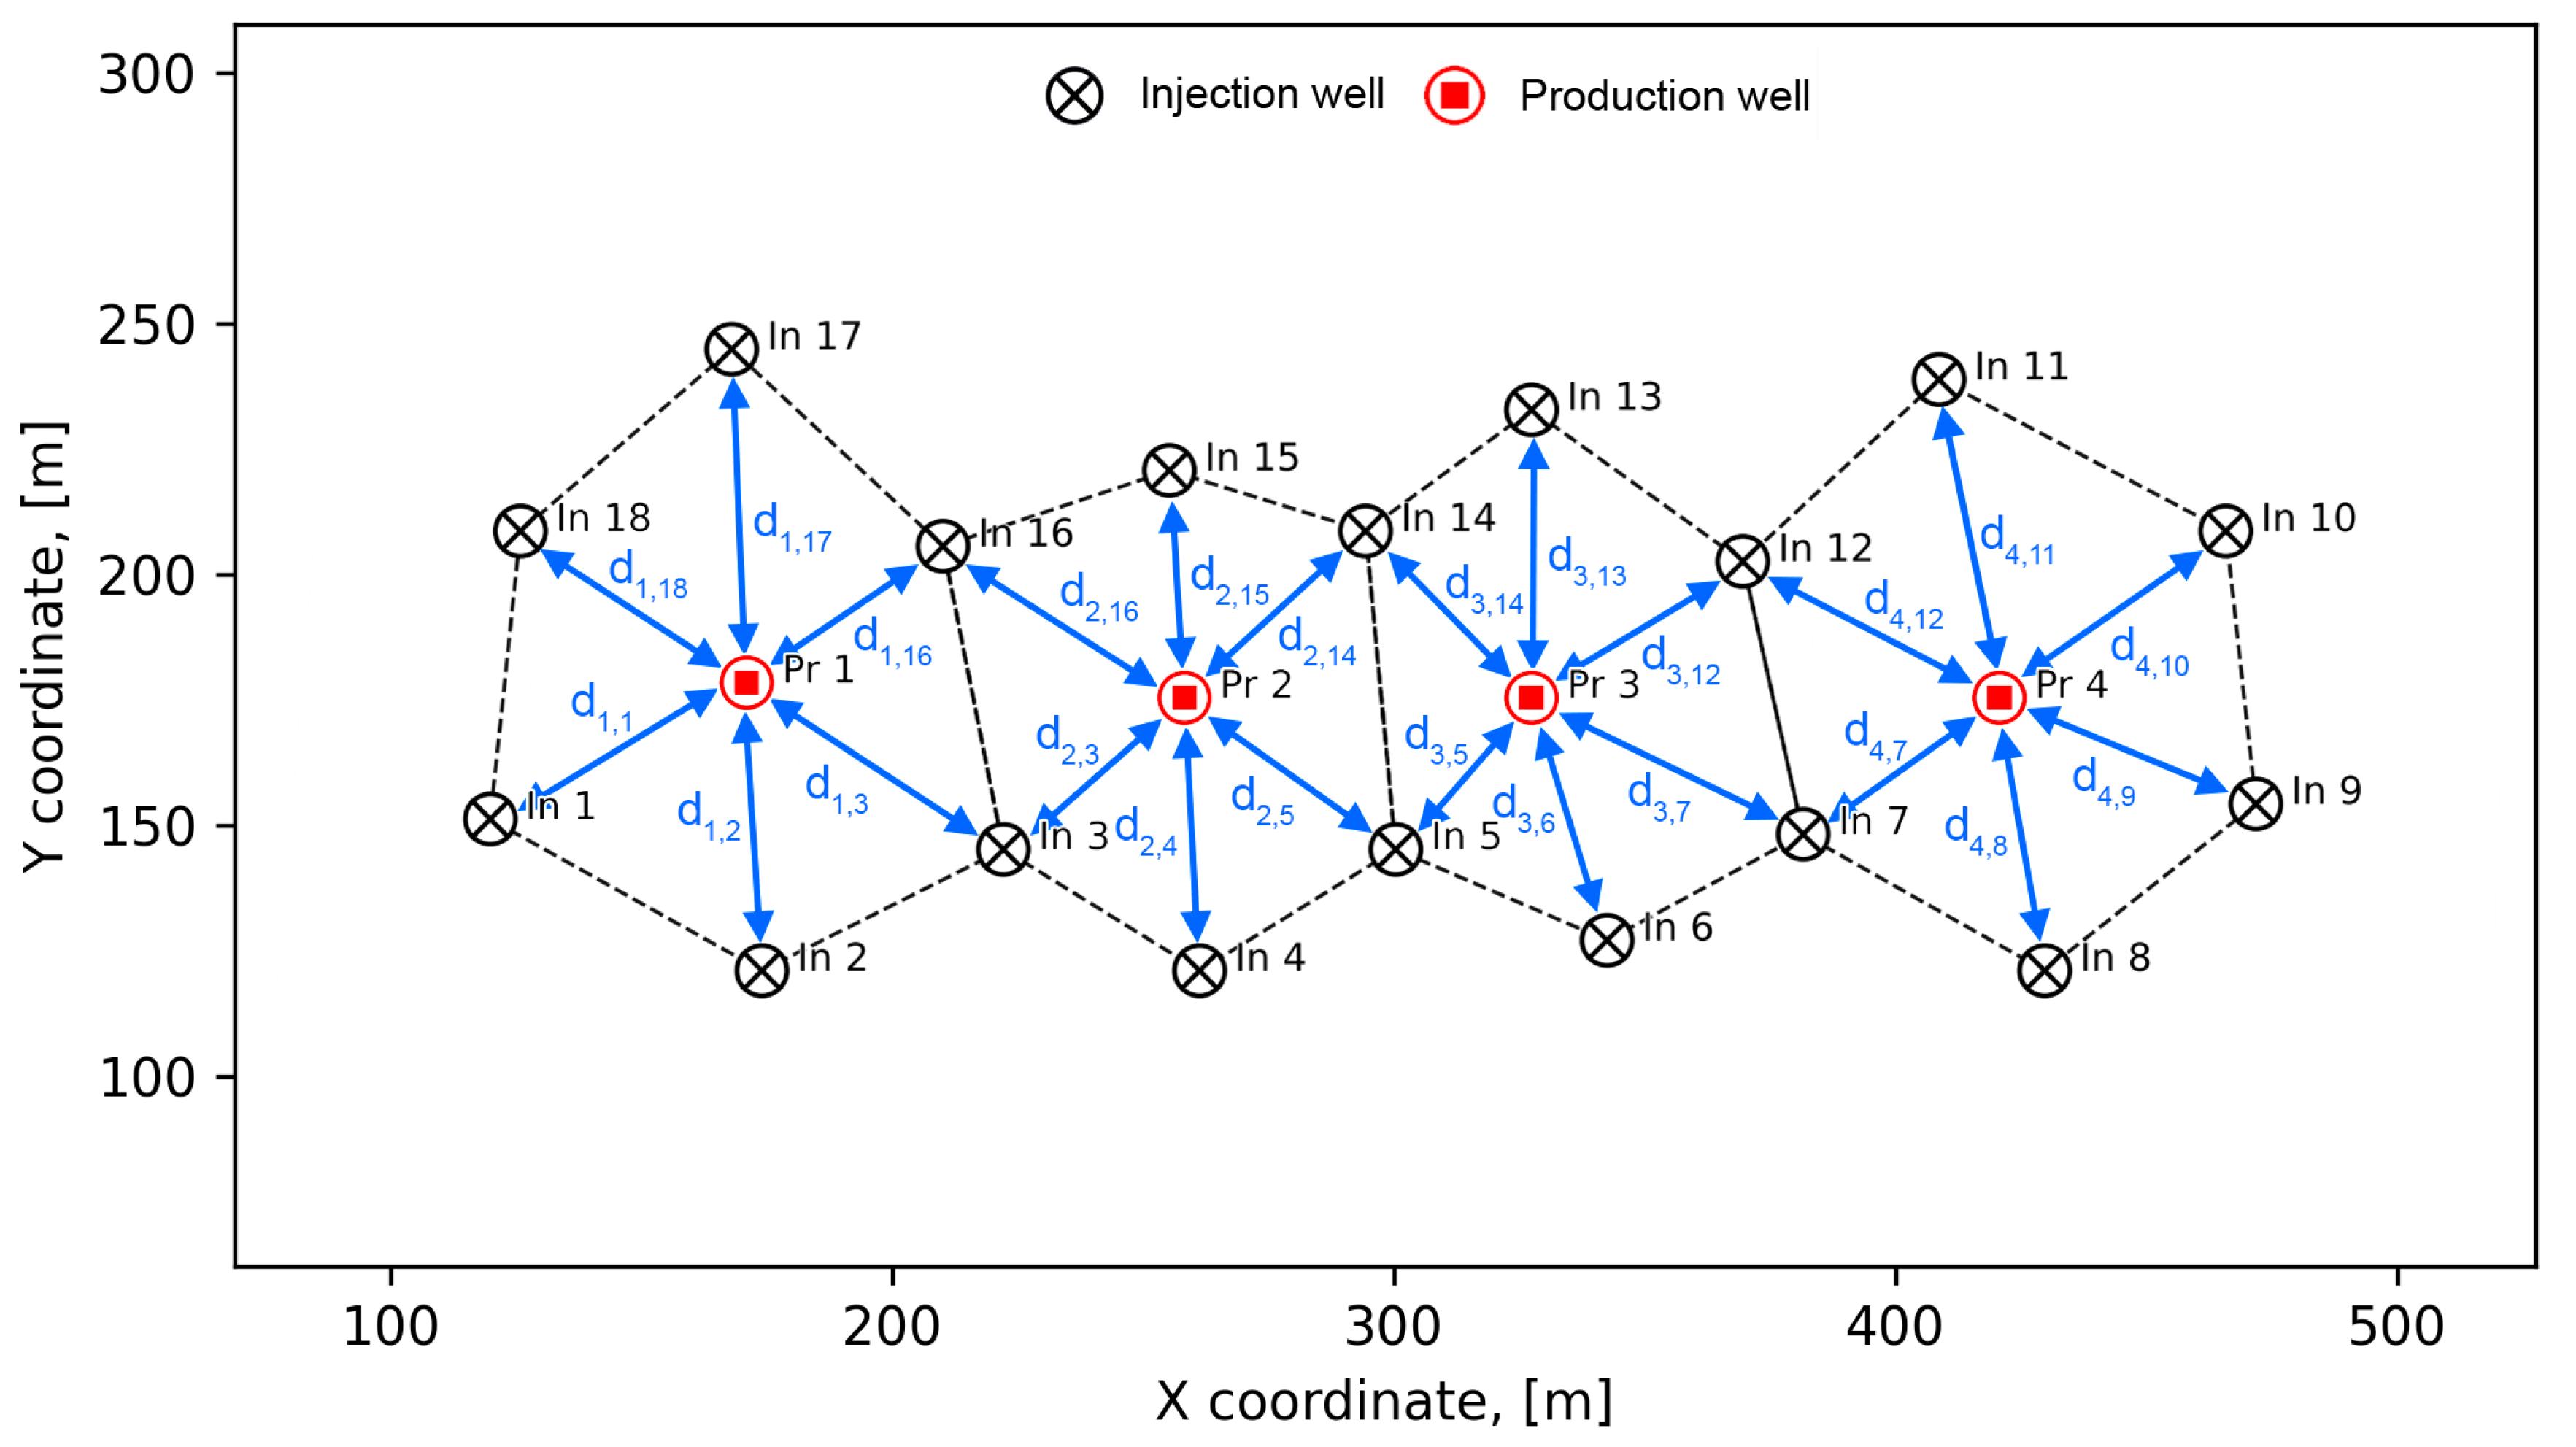
The LD method between a pair of injection and production wells is based on determining the ratio of the distance for each individual pair of wells to the total sum of distances ( d N in (21)) across all cells (22), as schematically illustrated in Figure 6.
d L D = i = 1 N P r j = 1 N I n d i , j , d i , j = ( x P r i x I n j ) 2 + ( y P r i y I n j ) 2
where d N [m]—the total inter-well distance; d i , j —the distance between the i-th production well and j-th injection well.
λ P r i = j = 1 n c o n i I n d i , j d L D , λ I n j = i = 1 n c o n j P r d i , j d L D
The SD method refines the linear distance with a squared inter-well distance, where the ratio for each injection–production pair is calculated as the squared distance divided by the total sum of squared distances ( d S in (23)) across all cells (24).
d S D = i = 1 N P r j = 1 N I n d i , j 2
λ P r i = j = 1 n c o n i I n d i , j 2 d S D , λ I n j = i = 1 n c o n j P r d i , j 2 d S D
The AQ method is based on identifying the midpoints between two adjacent injection wells and calculating the area of the quadrilateral ( S i , j ) defined by these midpoints and the coordinates of the considered injection well and the hydraulically connected production well (see S i , j in Figure 7). In this approach, the metric is the quadrilateral area, which is similar to the SD method, and it captures the quadratic nature of the leaching front variation as a function of the inter-well distance. In this case, the weights are defined as the ratio of the individual quadrilateral area (taking into account that, in this particular case, a single injection well may be connected to two production wells) to the total area across all wells ( S N ) as (26) and (27):
S i , j = 1 4 | x P r i ( y I n j y I n j + 1 ) + x I n j ( y I n j + 1 y P r i ) + x I n j + 1 ( y P r i y I n j ) | + 1 4 | x P r i ( y I n j 1 y I n j ) + x I n j 1 ( y I n j y P r i ) + x I n j ( y P r i y I n j 1 ) |
S N = i = 1 N P r j = 1 N I n S i , j
λ P r i = j = 1 n c o n i I n S i , j S N , λ I n j = i = 1 n c o n j P r S i , j S N
In the methods described above, inter-well distances were accounted for to some extent, but the time of flight (the TOF is denoted as τ ) along the streamlines between wells was also identified as a crucial factor, as it reflects the hydraulic conductivity of the inter-well space. Accordingly, an analysis and comparison of methods incorporating the TOF were carried out, with both the minimum (TOFmin) and average (TOFavg) values between hydraulically connected injection–production well pairs. In the TOFmin method, the weights are defined as the ratio between the minimum TOF ( τ m i n i , j ) of a given injection–production well pair (in Figure 8) and the total minimum TOF of all wells ( τ N ):
τ N = i = 1 N P r j = 1 N I n τ m i n i , j
λ P r i = j = 1 n c o n i I n τ m i n i , j τ N , λ I n j = i = 1 n c o n j P r τ m i n i , j τ N
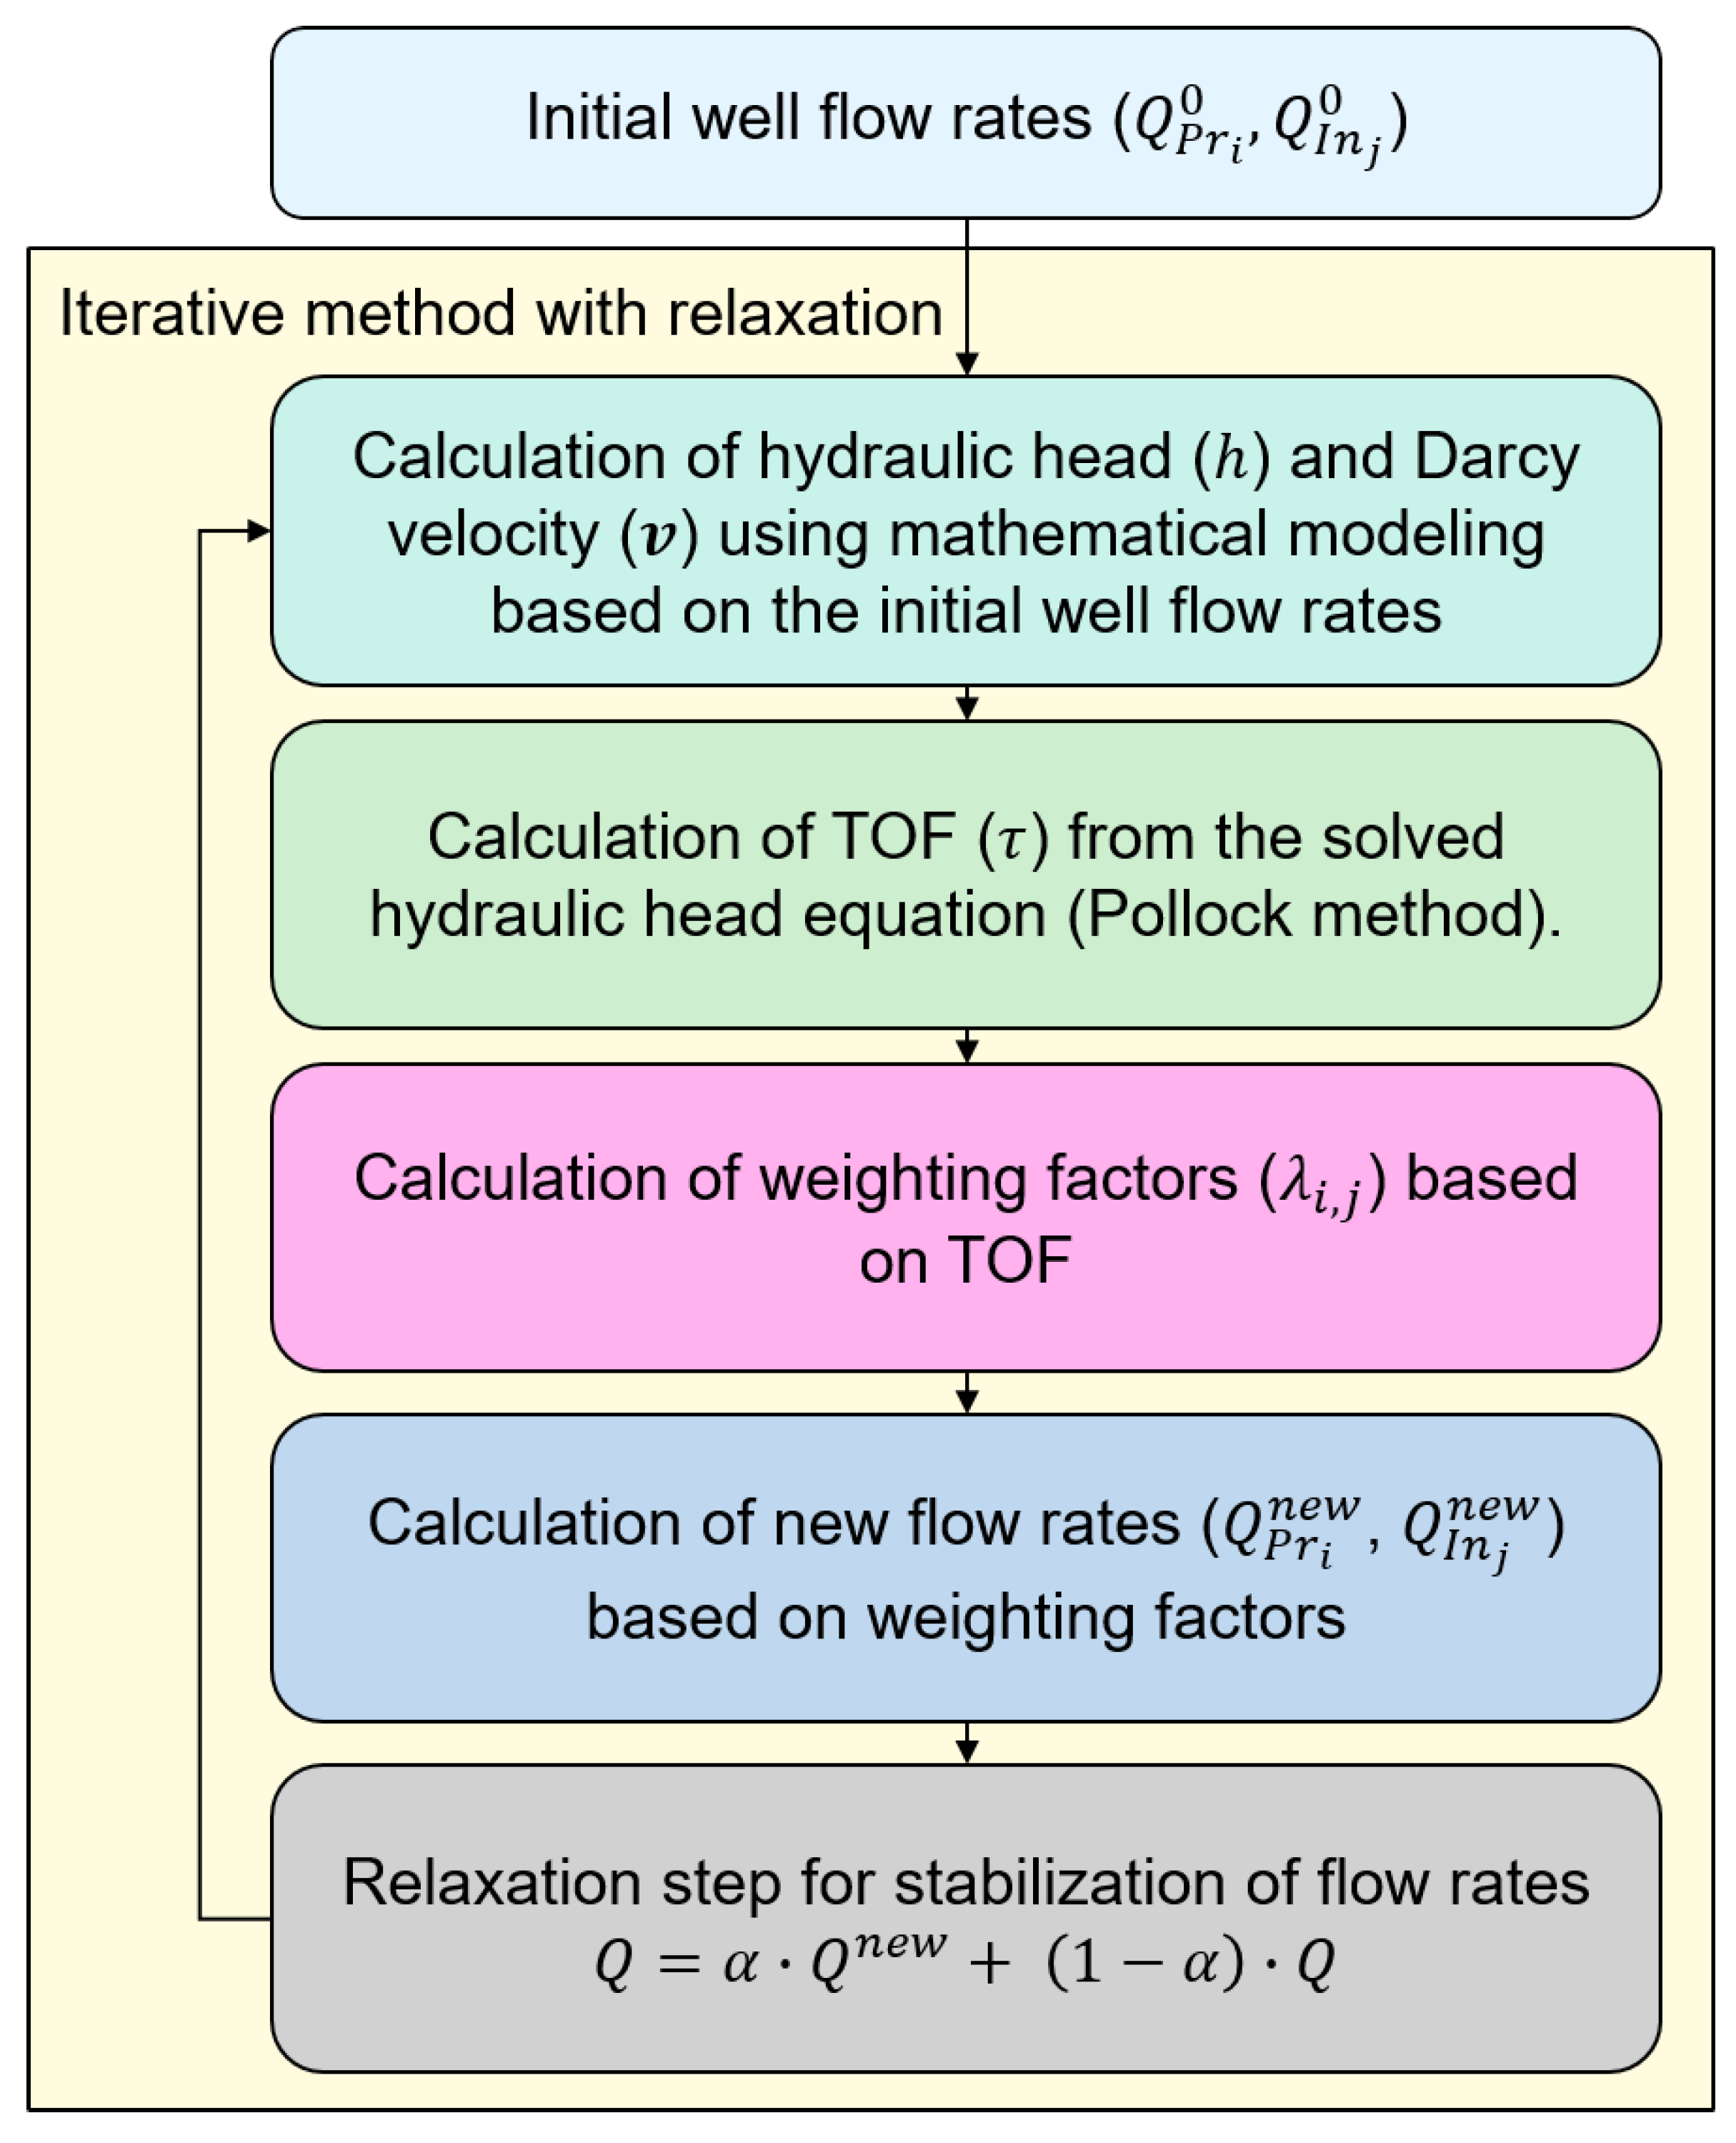
The construction of streamlines was carried out using the Pollock method [32] by solving Equation (3) and substituting the hydrodynamic head field into the Darcy Equation (2). This approach ultimately allowed for the determination of the inlet and outlet points on the computational grid, tracing the trajectory from the injection well to the production well (provided that the streamline reached the production well within the specified time). This method is iterative, with the weights at each iteration determined according to the algorithm illustrated in Figure 9.
The relaxation stopping criterion is defined as | Q n e w Q | < ϵ , where ϵ represents the required accuracy tolerance.
The TOFavg method employs a similar algorithm to the TOFmin method for determining well flow rates. However, instead of using the minimum time-of-flight values between wells, it is based on the average values ( τ a v g i , j ). This approach bears similarity to the AQ method, as both incorporate the leaching area in their calculations, although in different ways:
τ N = i = 1 N P r j = 1 N I n τ a v g i , j
λ P r i = j = 1 n c o n i I n τ a v g i , j τ N , λ I n j = i = 1 n c o n j P r τ a v g i , j τ N
Consideration of these variables enables a comparative analysis and the identification of the most appropriate metric for constructing the weighting function used in optimizing the flow rate distribution. In general, the above methods can be divided into two categories: those based primarily on field geometry (AT, LD, SD, and AQ) and those based on the modeling of hydrodynamic processes (TOFmin and TOFavg), which also inherently account for the geometry of the well distribution and the heterogeneity of the filtration properties. Methods based primarily on the field geometry require manual calculations, such as determining hydrodynamic connections. In contrast, streamline-based methods automatically establish these connections by constructing streamlines and calculating the TOF along them, which significantly accelerates the process by eliminating the need for manual computations. This factor is particularly important to consider in non-standard well configurations, where a single injection well may interact with multiple production wells, including those located at greater distances. In linear well configuration patterns, numerous hydraulic connections can also be involved.
The economic assessment of well flow rate optimization methods is based on the calculation of acid consumption over the entire block development period, as determined from the recovery rate curve. The block development time is usually defined as the period required to achieve a recovery rate of 90% of the estimated uranium mass, established at the stages of zoning and design of the ore-bearing rock prior to the start of operation. The development time and recovery rate ( R ( t ) ) are determined by modeling the filtration processes and chemical interactions of reagents under the influence of a system of injection and production wells:
R ( t ) = M e x t ( t ) M 0
where R ( t ) [ton/ton]—the recovery rate of the block at a given time t; M e x t ( t ) [ton]—the mass of the mineral extracted at time t; and M 0 [ton]—the initial mass of the mineral in the technological block.
In this case, the calculation of expenses for acid consumption ( E A C ( t * ) ) is performed, which directly depend on the operating time t:
E A C ( t * ) = t = 0 t * P A C Q s u m I n c H 2 S O 4 d t
where t * [day]—the time at which the recovery rate reaches 90%, P A C [USD/ton]—the unit price of acid, as given in [33].
Thus, the main task is to reduce the expenses for acid consumption by determining the optimal flow rate for each of the methods presented in Section 2.2. The cost of sulfuric acid was 49,153 KZT per tonne, according to JSC ‘NAC Kazatomprom’ [33,34], which corresponds to approximately 105 USD based on the average 2024 exchange rate of the National Bank of the Republic of Kazakhstan [35].

3. Results and Discussion

For the block under consideration, 3D mathematical modeling was carried out according to Equations (3) and (7)–(11), resulting in the hydrodynamic head (h) distribution and velocity field ( v ). These enable the calculation of streamlines and serve as input parameters for computing the distribution of the leaching agent ( c H 2 S O 4 ), as well as the concentrations of the solid ( c U ) and dissolved minerals ( c U O 2 S O 4 ).
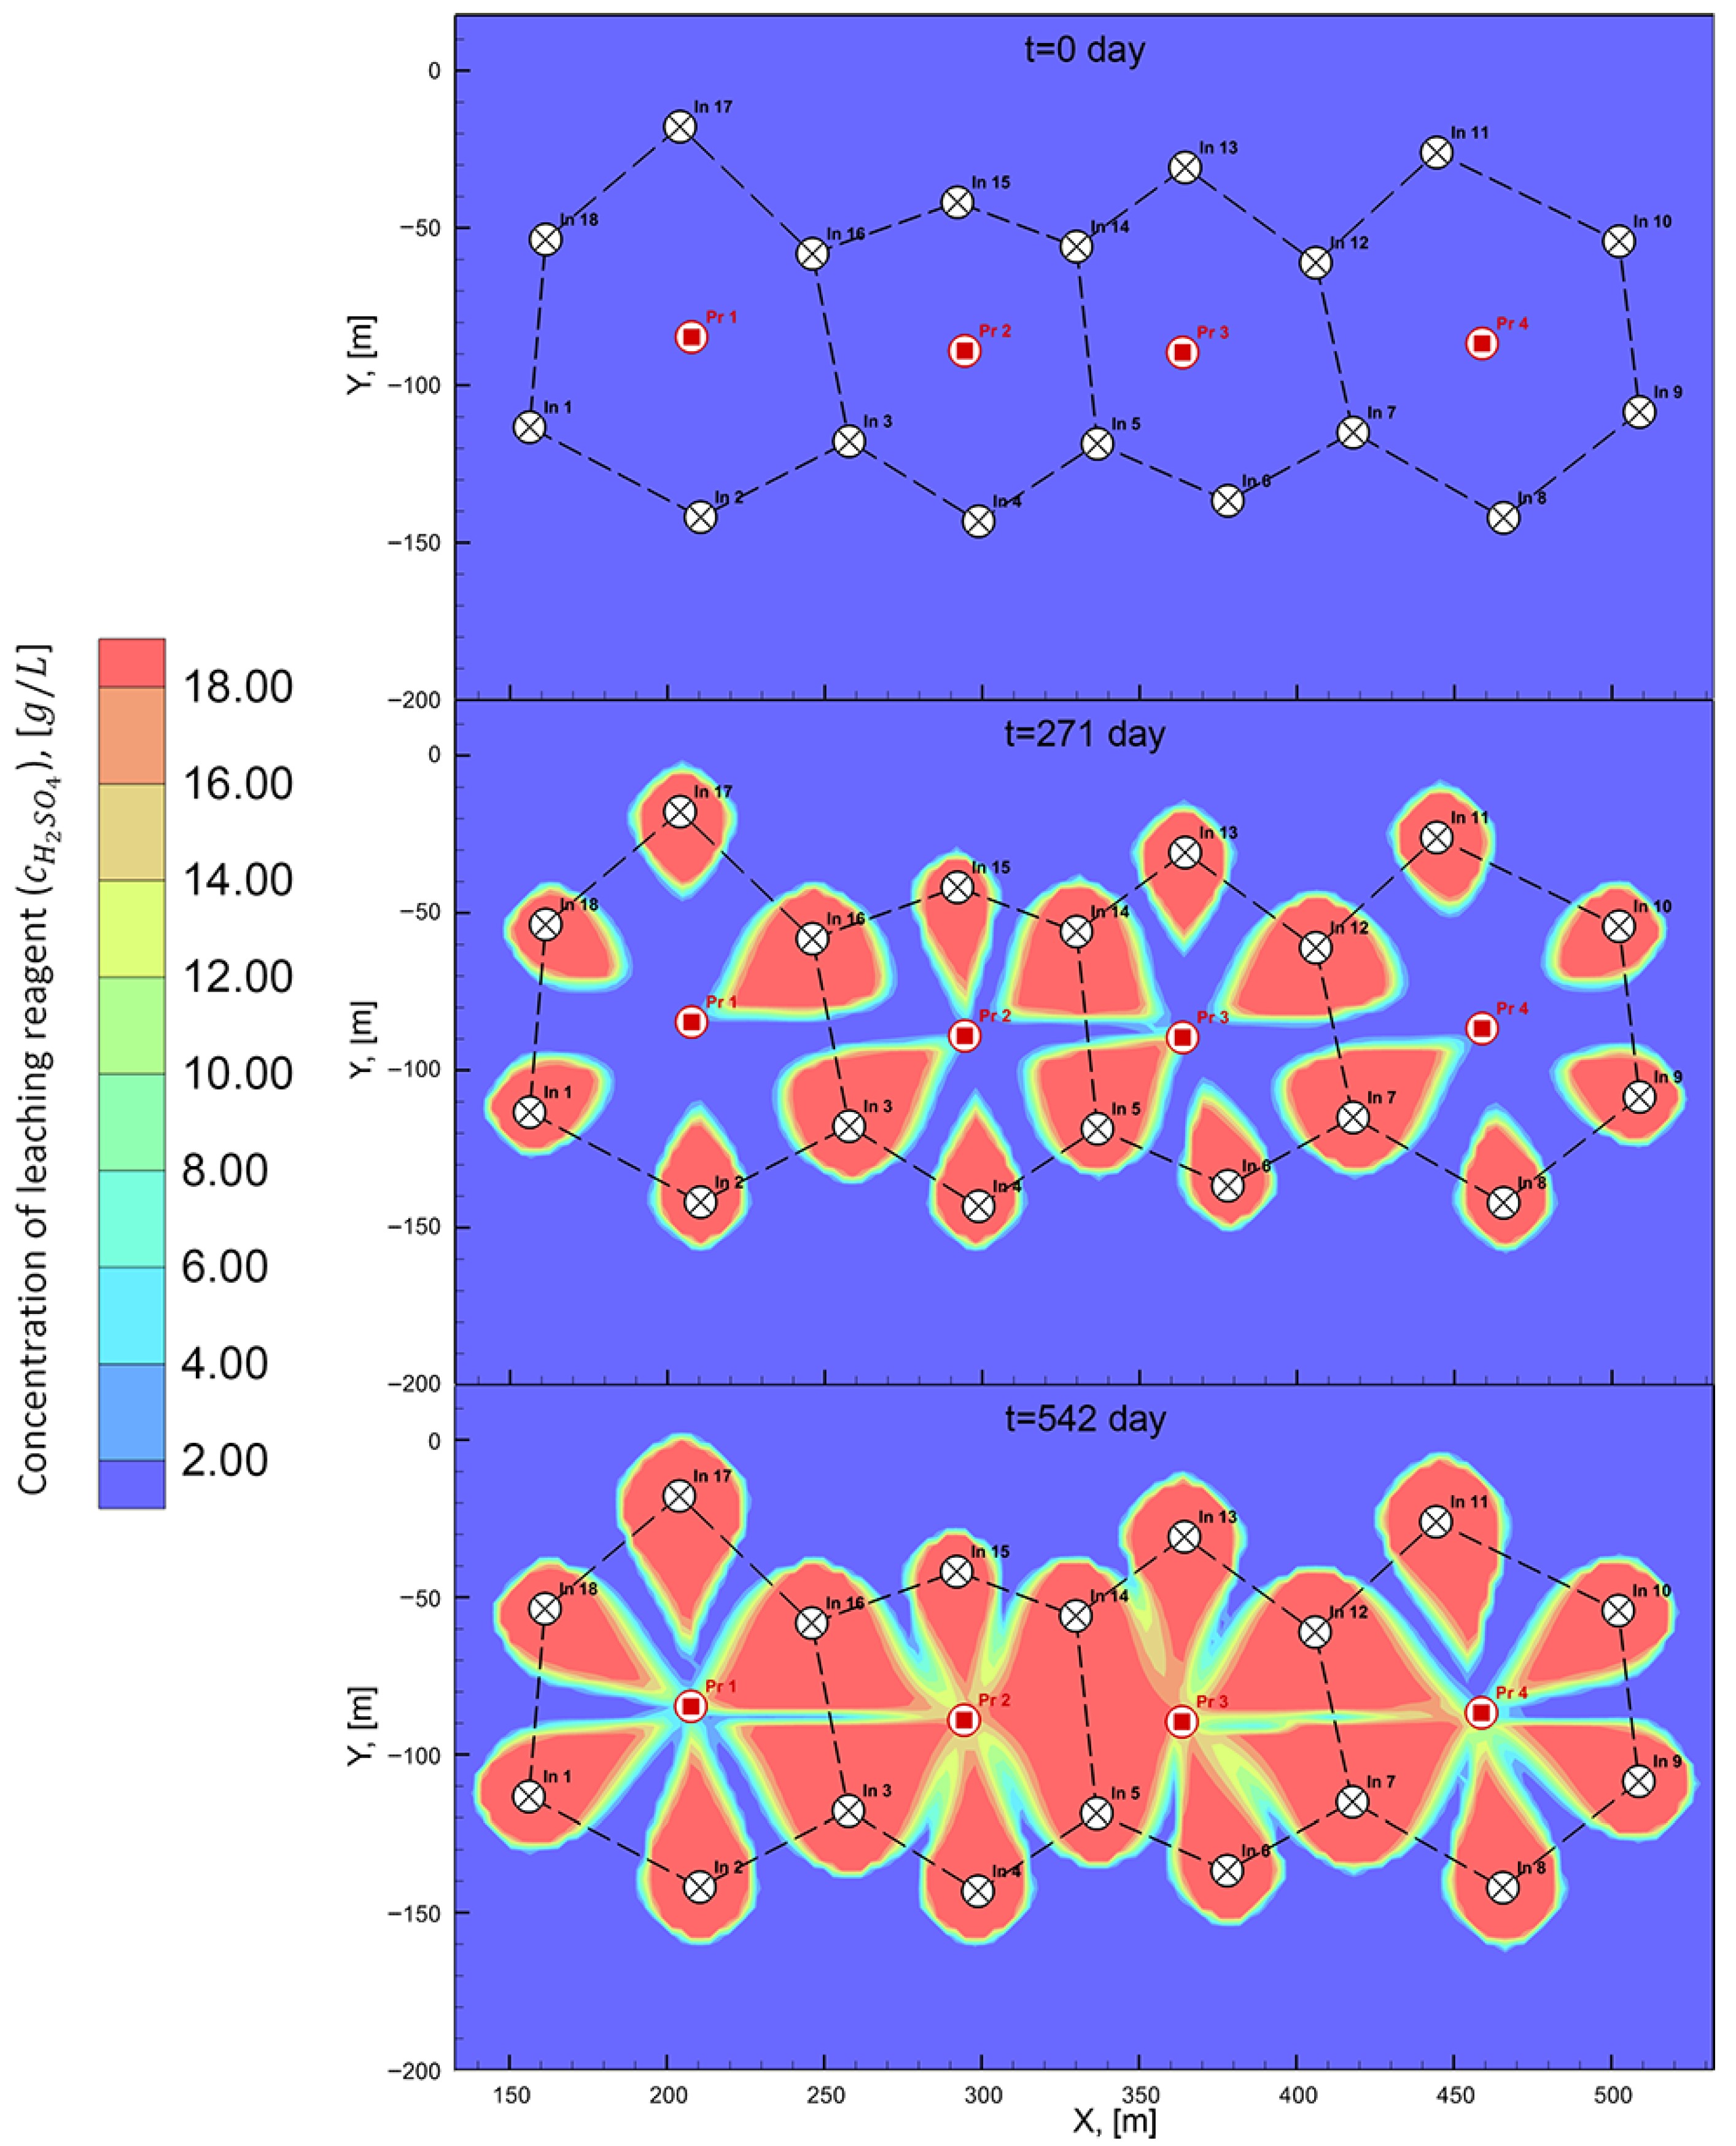
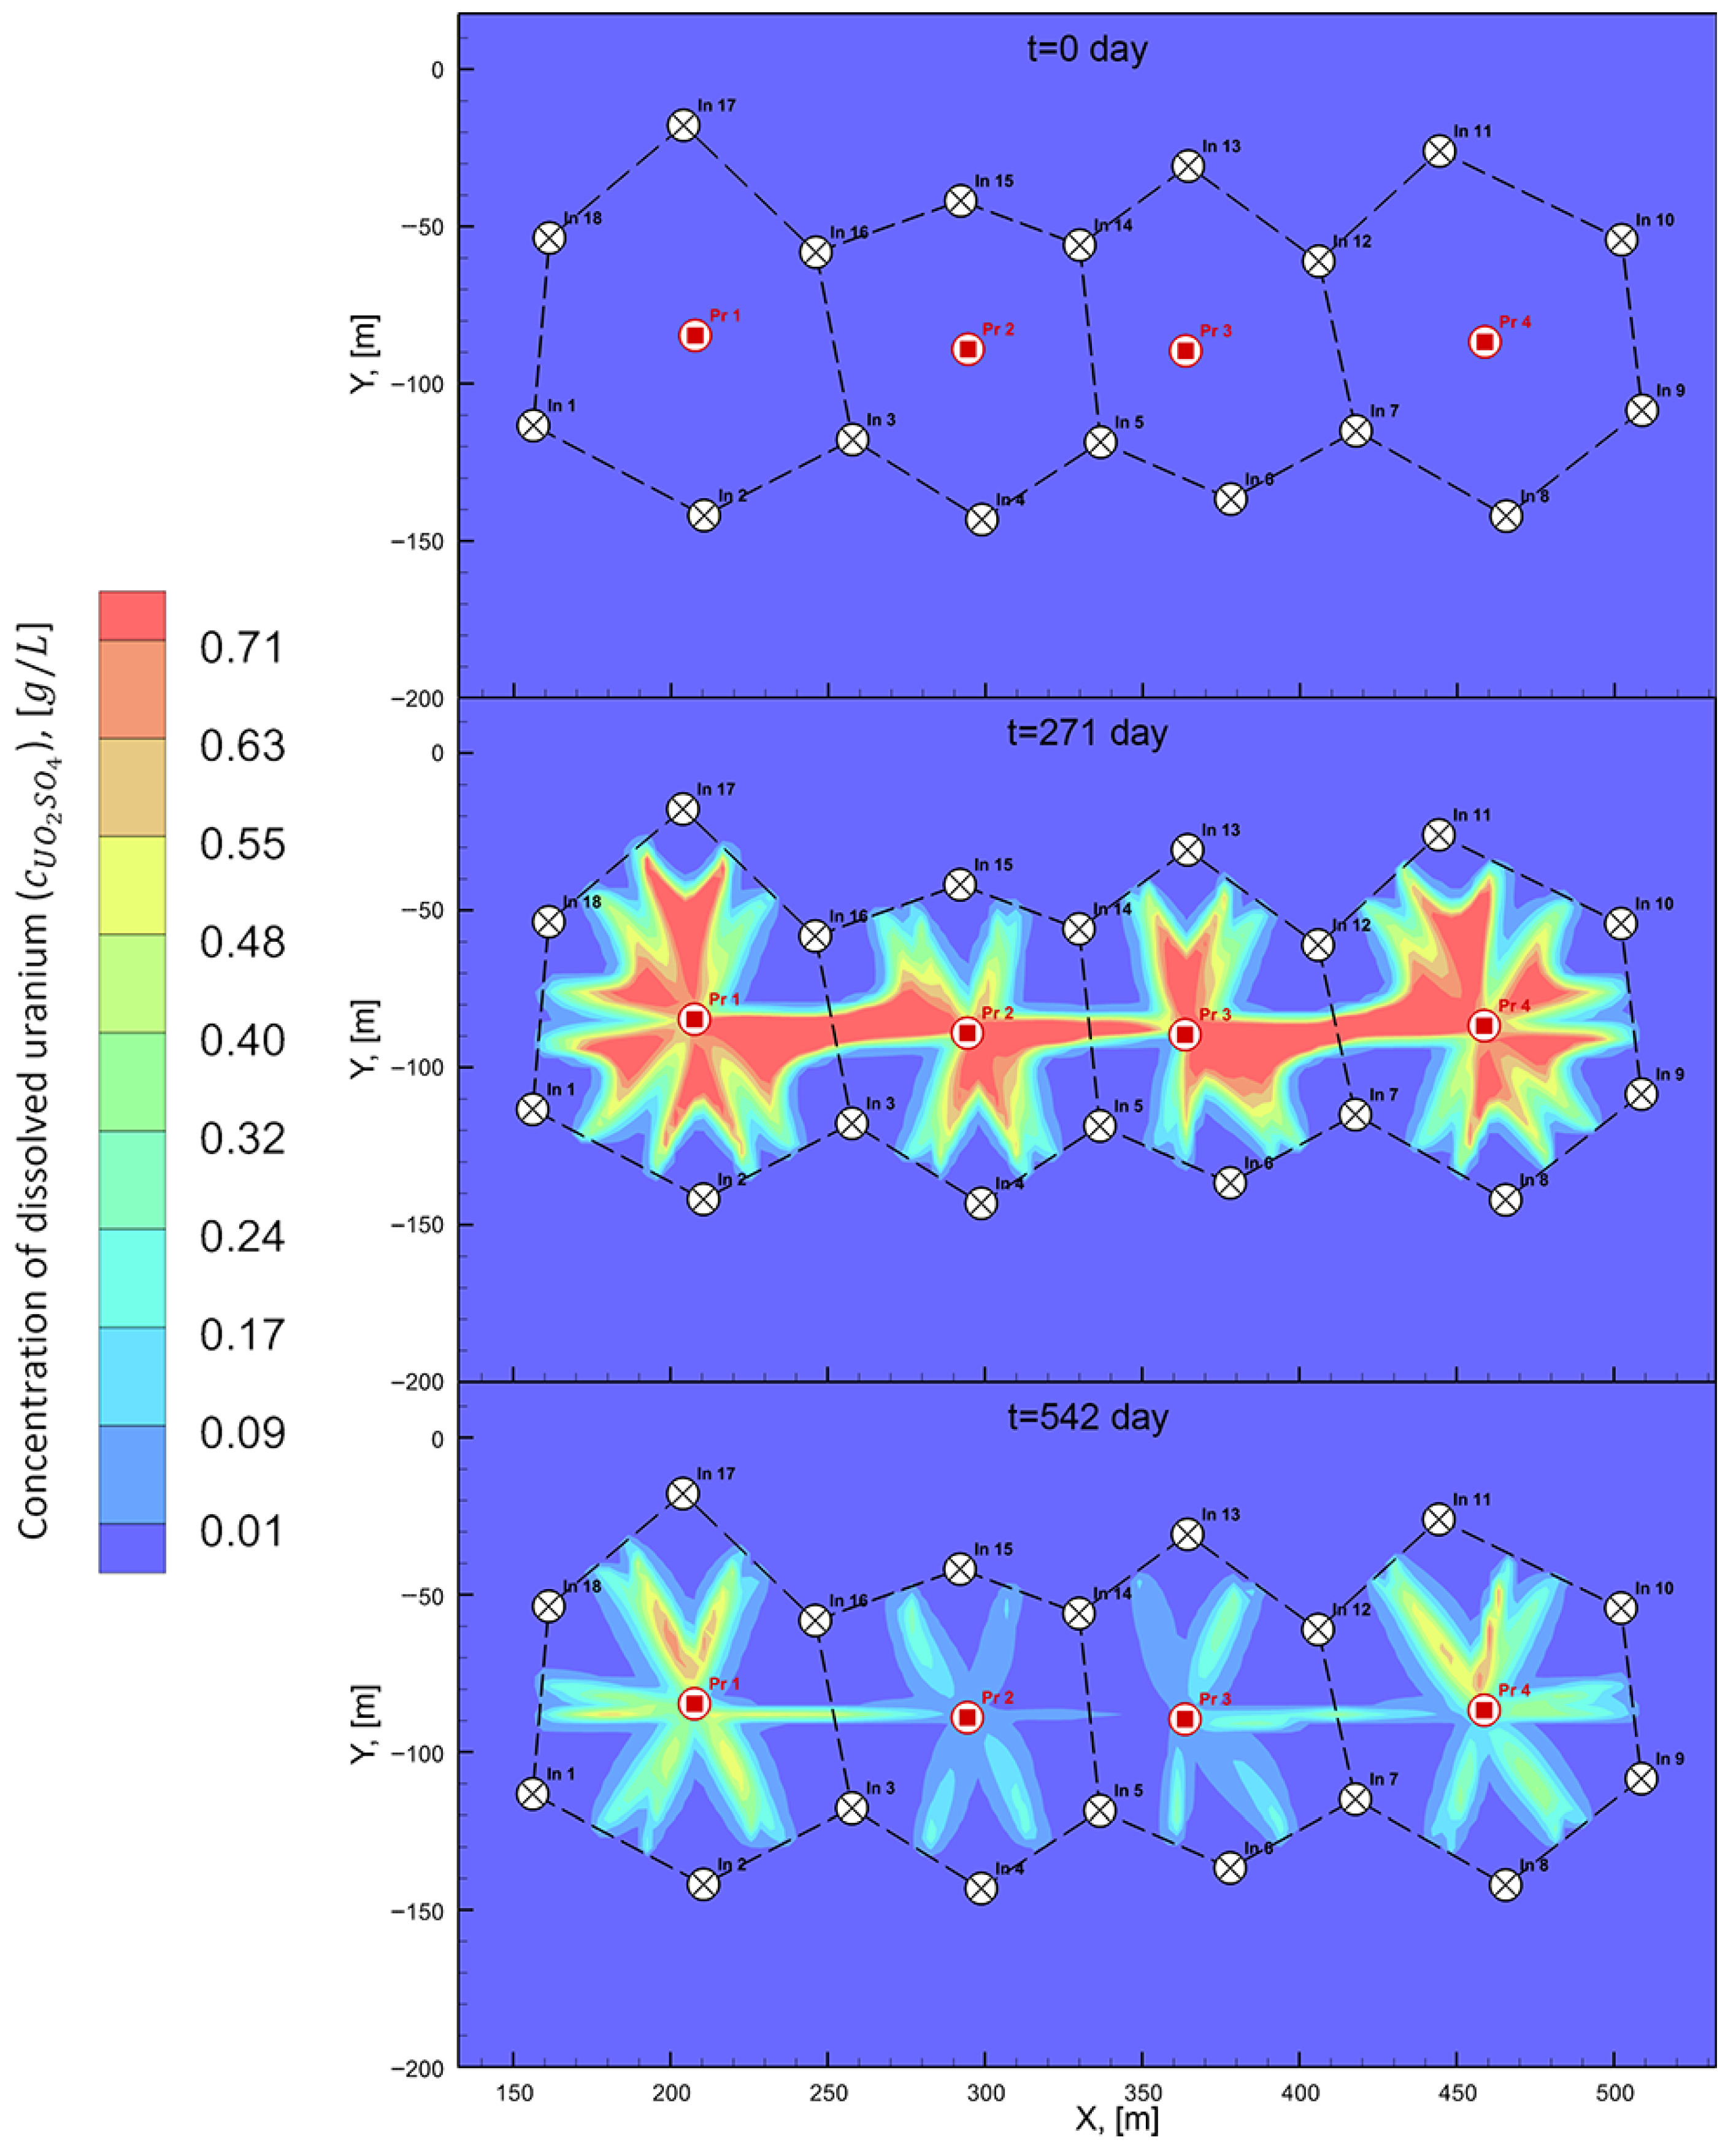
For a more detailed explanation of the dynamics of component interactions at the beginning, intermediate, and final stages of processing, Figure 10, Figure 11 and Figure 12 illustrate their distribution using the AT method.
As shown in Figure 10, Figure 11 and Figure 12, at the initial stage ( t = 0 ), only the solid mineral is present in the formation. With the ongoing injection during the course of production ( t = 271 ), the leaching solution enters the formation and reacts with the solids, resulting in the appearance of the dissolved mineral. In the later stage of production ( t = 542 ), the concentration of the dissolved mineral decreases due to extraction through production wells (Figure 12). Finally, during the decommissioning stage, the residual leaching solution is removed by an injection of water (Figure 10).
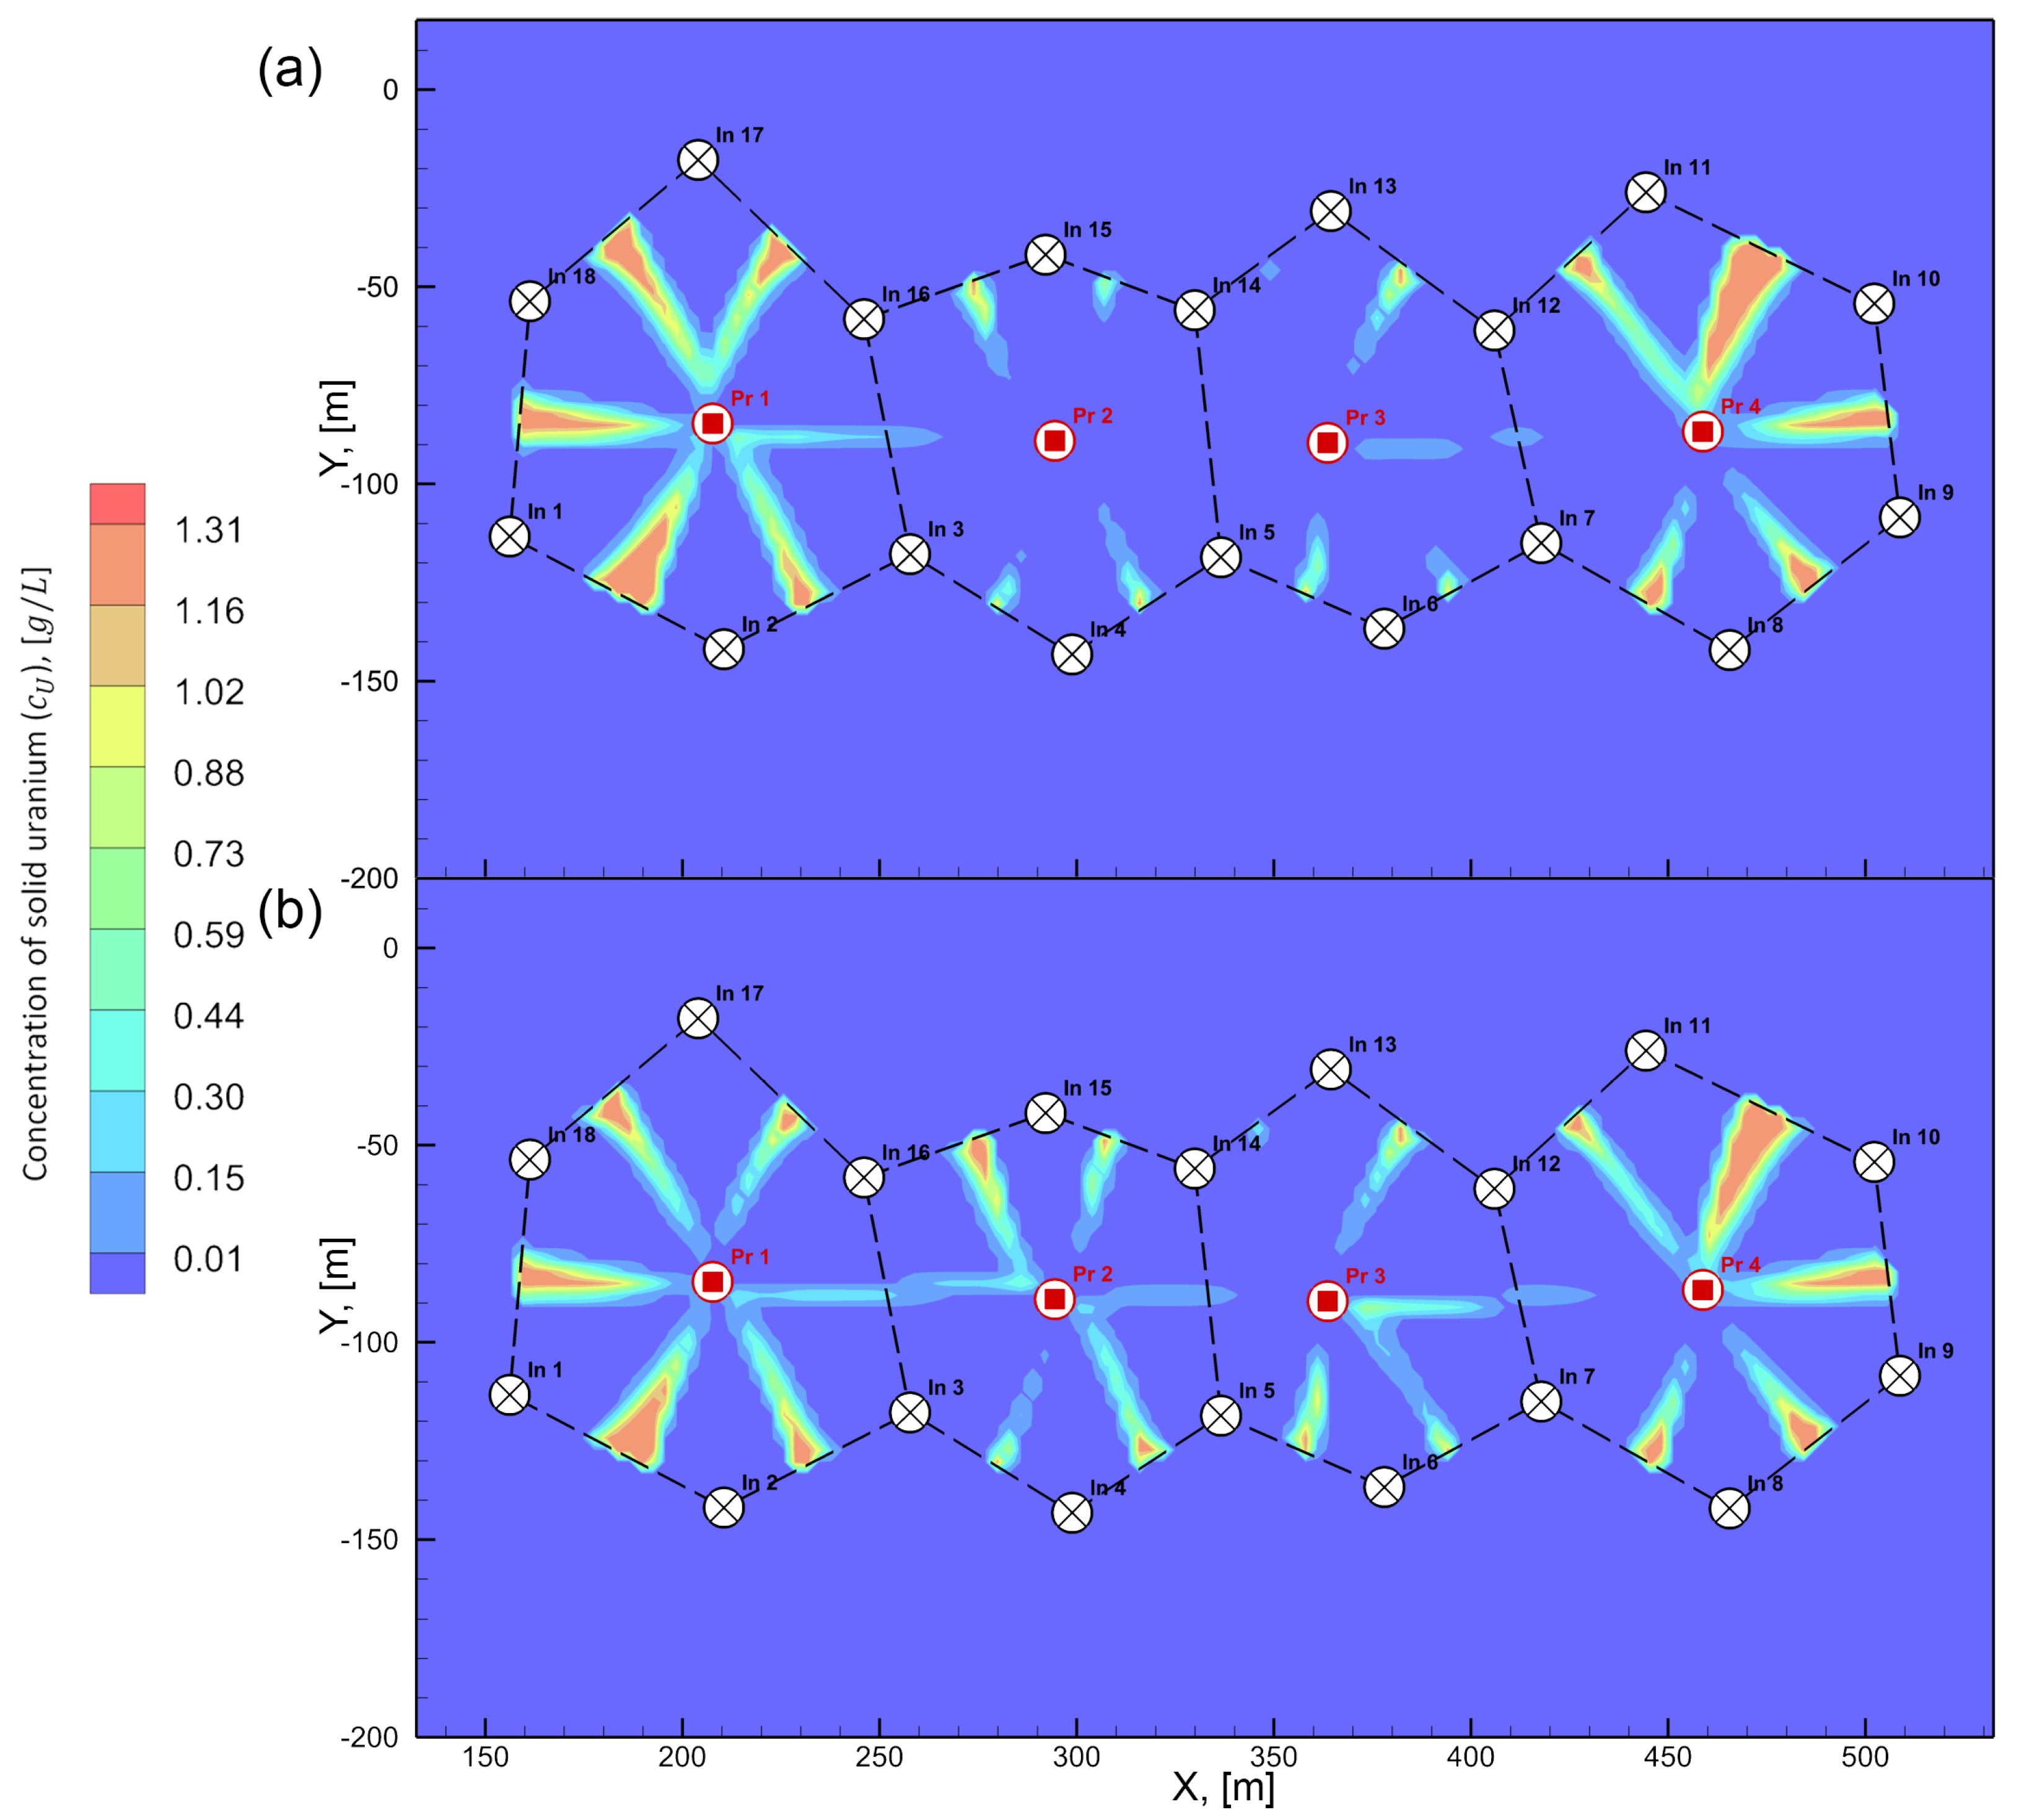
As illustrated in Figure 11, stagnant zones inevitably form between wells of identical function (i.e., injection–injection) due to the zero gradient of the hydrodynamic head. These stagnant zones lead to an imbalance of solutions when flow rates are calculated using the AT method. The effect is most pronounced in the cells centered on production wells P r 1 and P r 4 , where the residual solid uranium content and sulfuric acid concentration are significantly higher than in the cells containing P r 2 and P r 3 . The latter cells are characterized by smaller areas and shorter inter-well distances. This imbalance underscores the need to recalculate and reset well flow rates by accounting for both the inter-well distances and the areas of the hexagonal cells, thereby mitigating stagnant zones and improving the solution distribution.
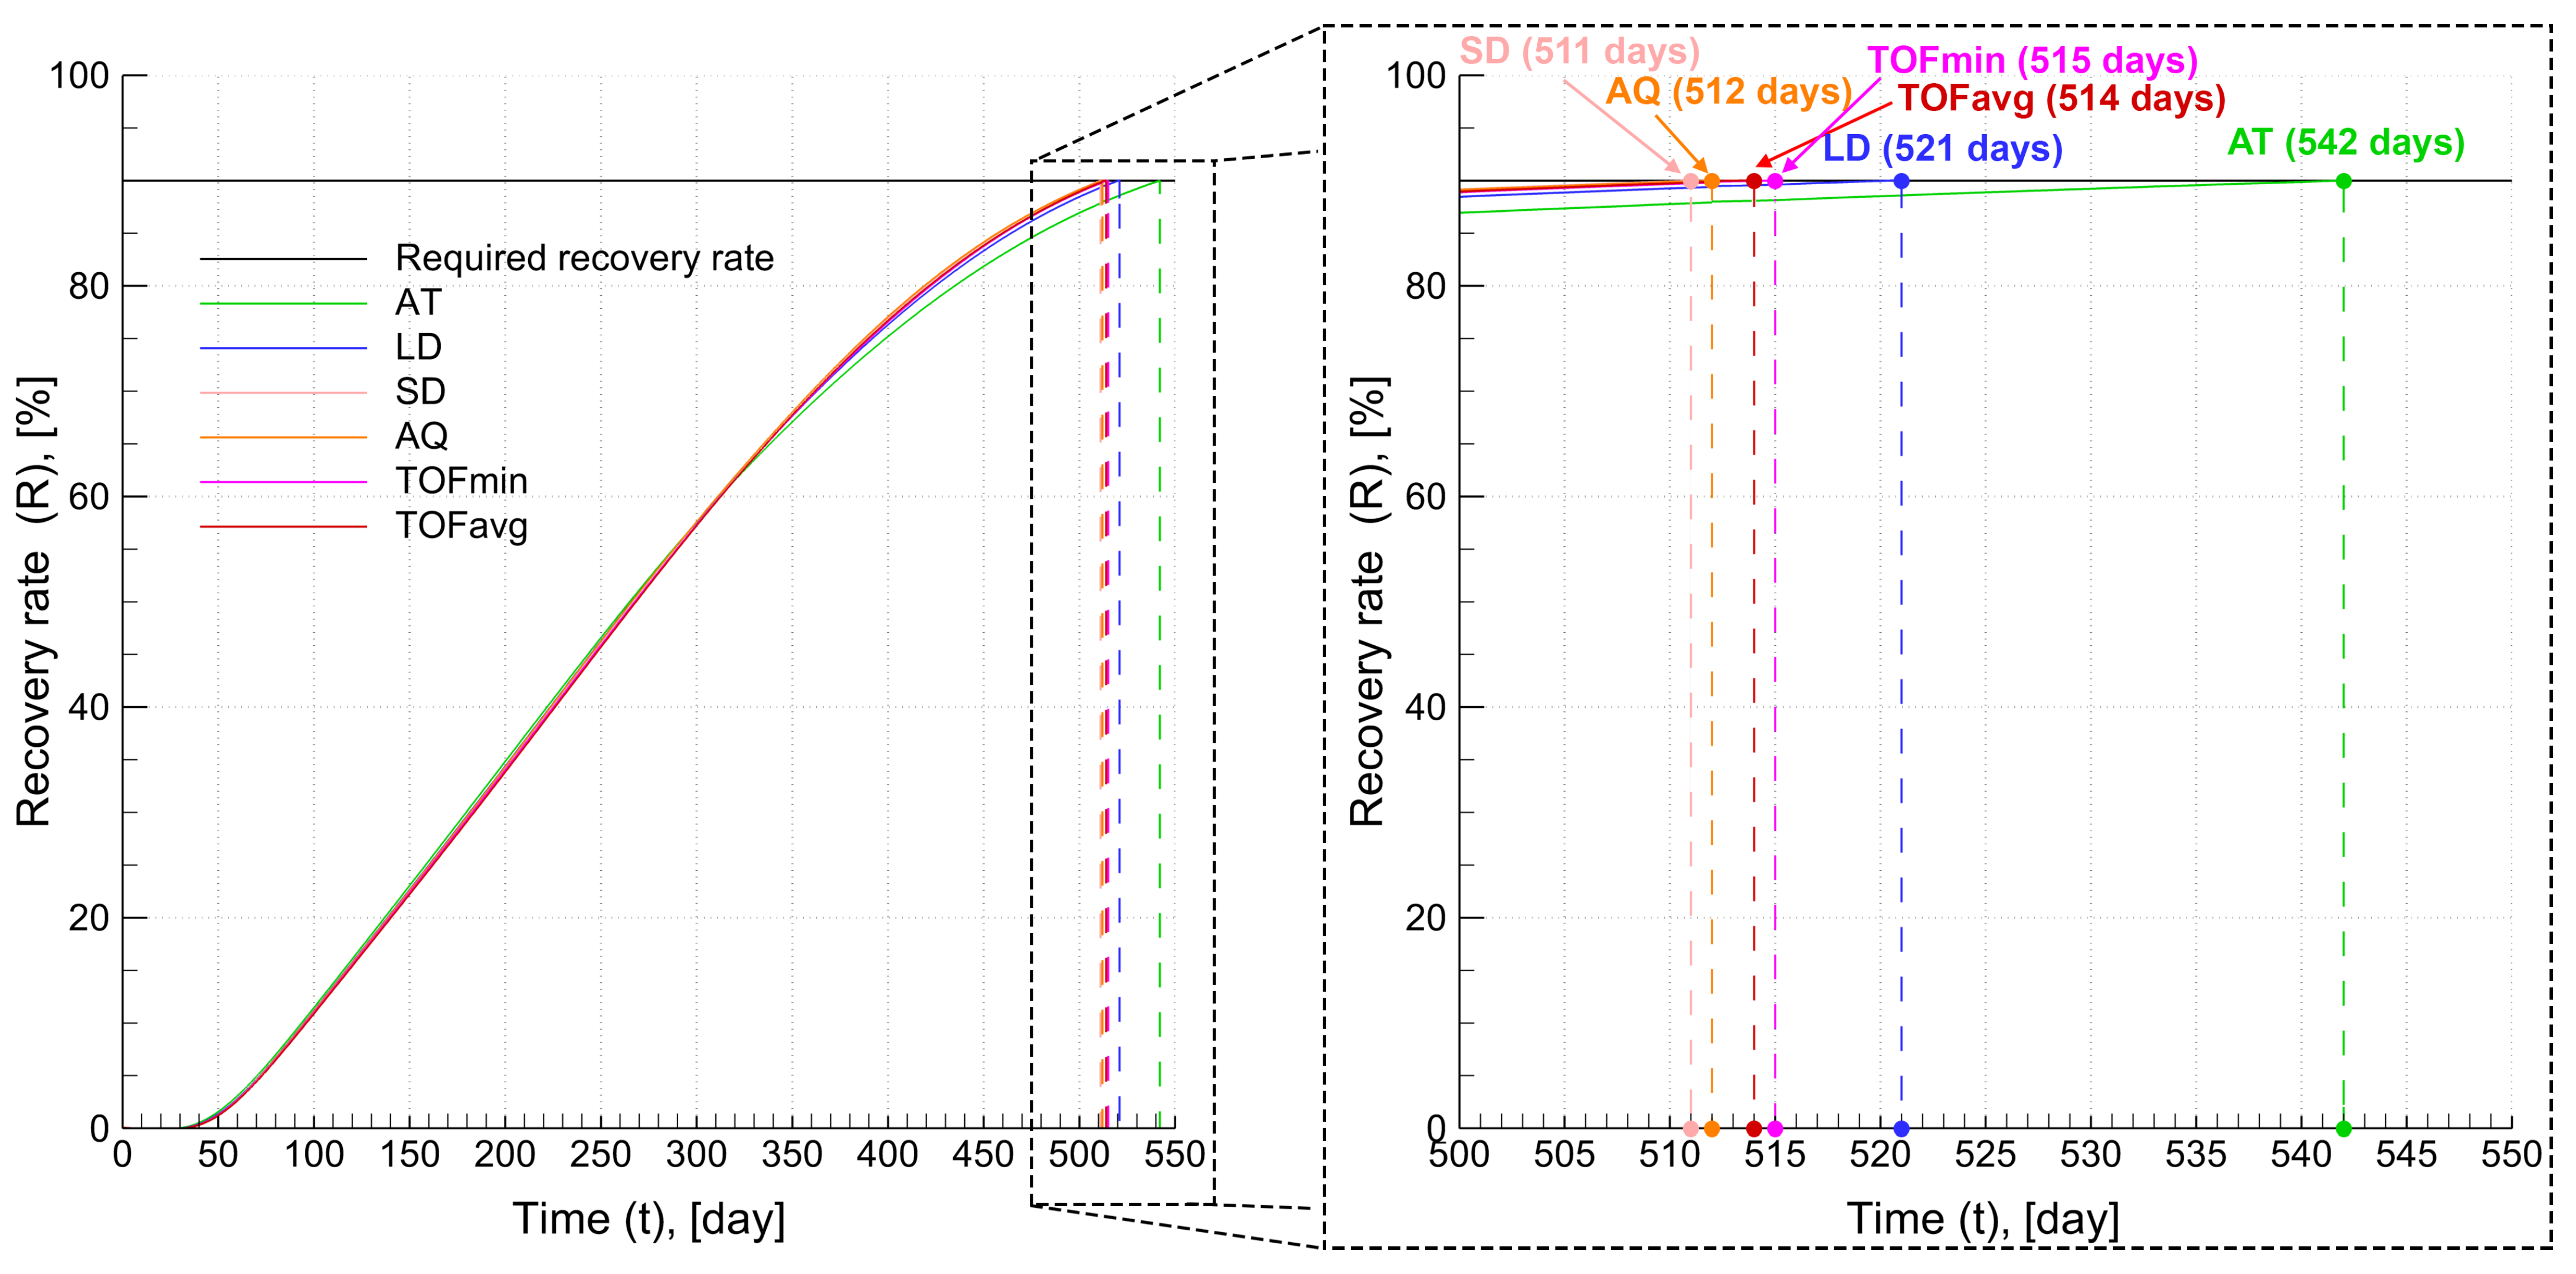
Based on the concentrations obtained from mathematical modeling at the production wells and the calculated well flow rates, the extracted mass of uranium was determined for each of the applied well flow rate optimization methods. Accordingly, the recovery rate for each method is presented in Figure 13. In addition, mathematical modeling was performed to calculate the distribution of reagent concentrations for each method.
As shown in Figure 13, the SD method provides the shortest recovery time (511 days), whereas the AT method results in the longest recovery time (542 days). The AQ, TOFavg, and TOFmin methods yield close values of 512, 514, and 515 days, respectively. The LD method falls between SD and AT, with a recovery time of 521 days. To explain these differences, Figure 14 illustrates the qualitative results (distribution of the solid mineral at 90% recovery) for SD and AT, while Table 1 presents the corresponding quantitative comparison for all methods.
After recalculating the flow rates using the SD method, a localized change in the distribution of residual solid uranium was observed (Figure 14). Specifically, in the cells containing P r 1 and P r 4 , the uranium concentration in stagnant zones decreased from 0.191 to 0.140 and from 0.166 to 0.151 , respectively, whereas in the cells with P r 2 and P r 3 , the stagnant zones increased from 0.023 to 0.072 and from 0.021 to 0.046 in g/L, respectively (Table 1), which confirms the balance between the cells as a function of the distance between the wells. From the perspective of the component distribution among cells, the deviation from the average solid uranium concentration in the SD method was nearly uniform, amounting to 0.040 g/L (with the total deviation equal to 0.168 g/L). This indicates a more balanced system; however, it also shows that enhanced uniformity does not necessarily lead to greater mining efficiency, as evidenced by the slight increase in the operational time (Figure 13).
The results of the sulfuric acid consumption calculations, assuming no re-usage during production, are summarized in Table 2.
The SD method demonstrated the highest efficiency in reducing operating costs, achieving a 5.7% decrease relative to the AT method. The AQ, TOFmin, and TOFavg methods yielded comparable results, with reductions of 5.5%, 5.0%, and 5.2%, respectively. In contrast, the LD method exhibited the lowest efficiency, with a reduction of only 3.9%. A pairwise comparison matrix of the methods is presented in Table 3.
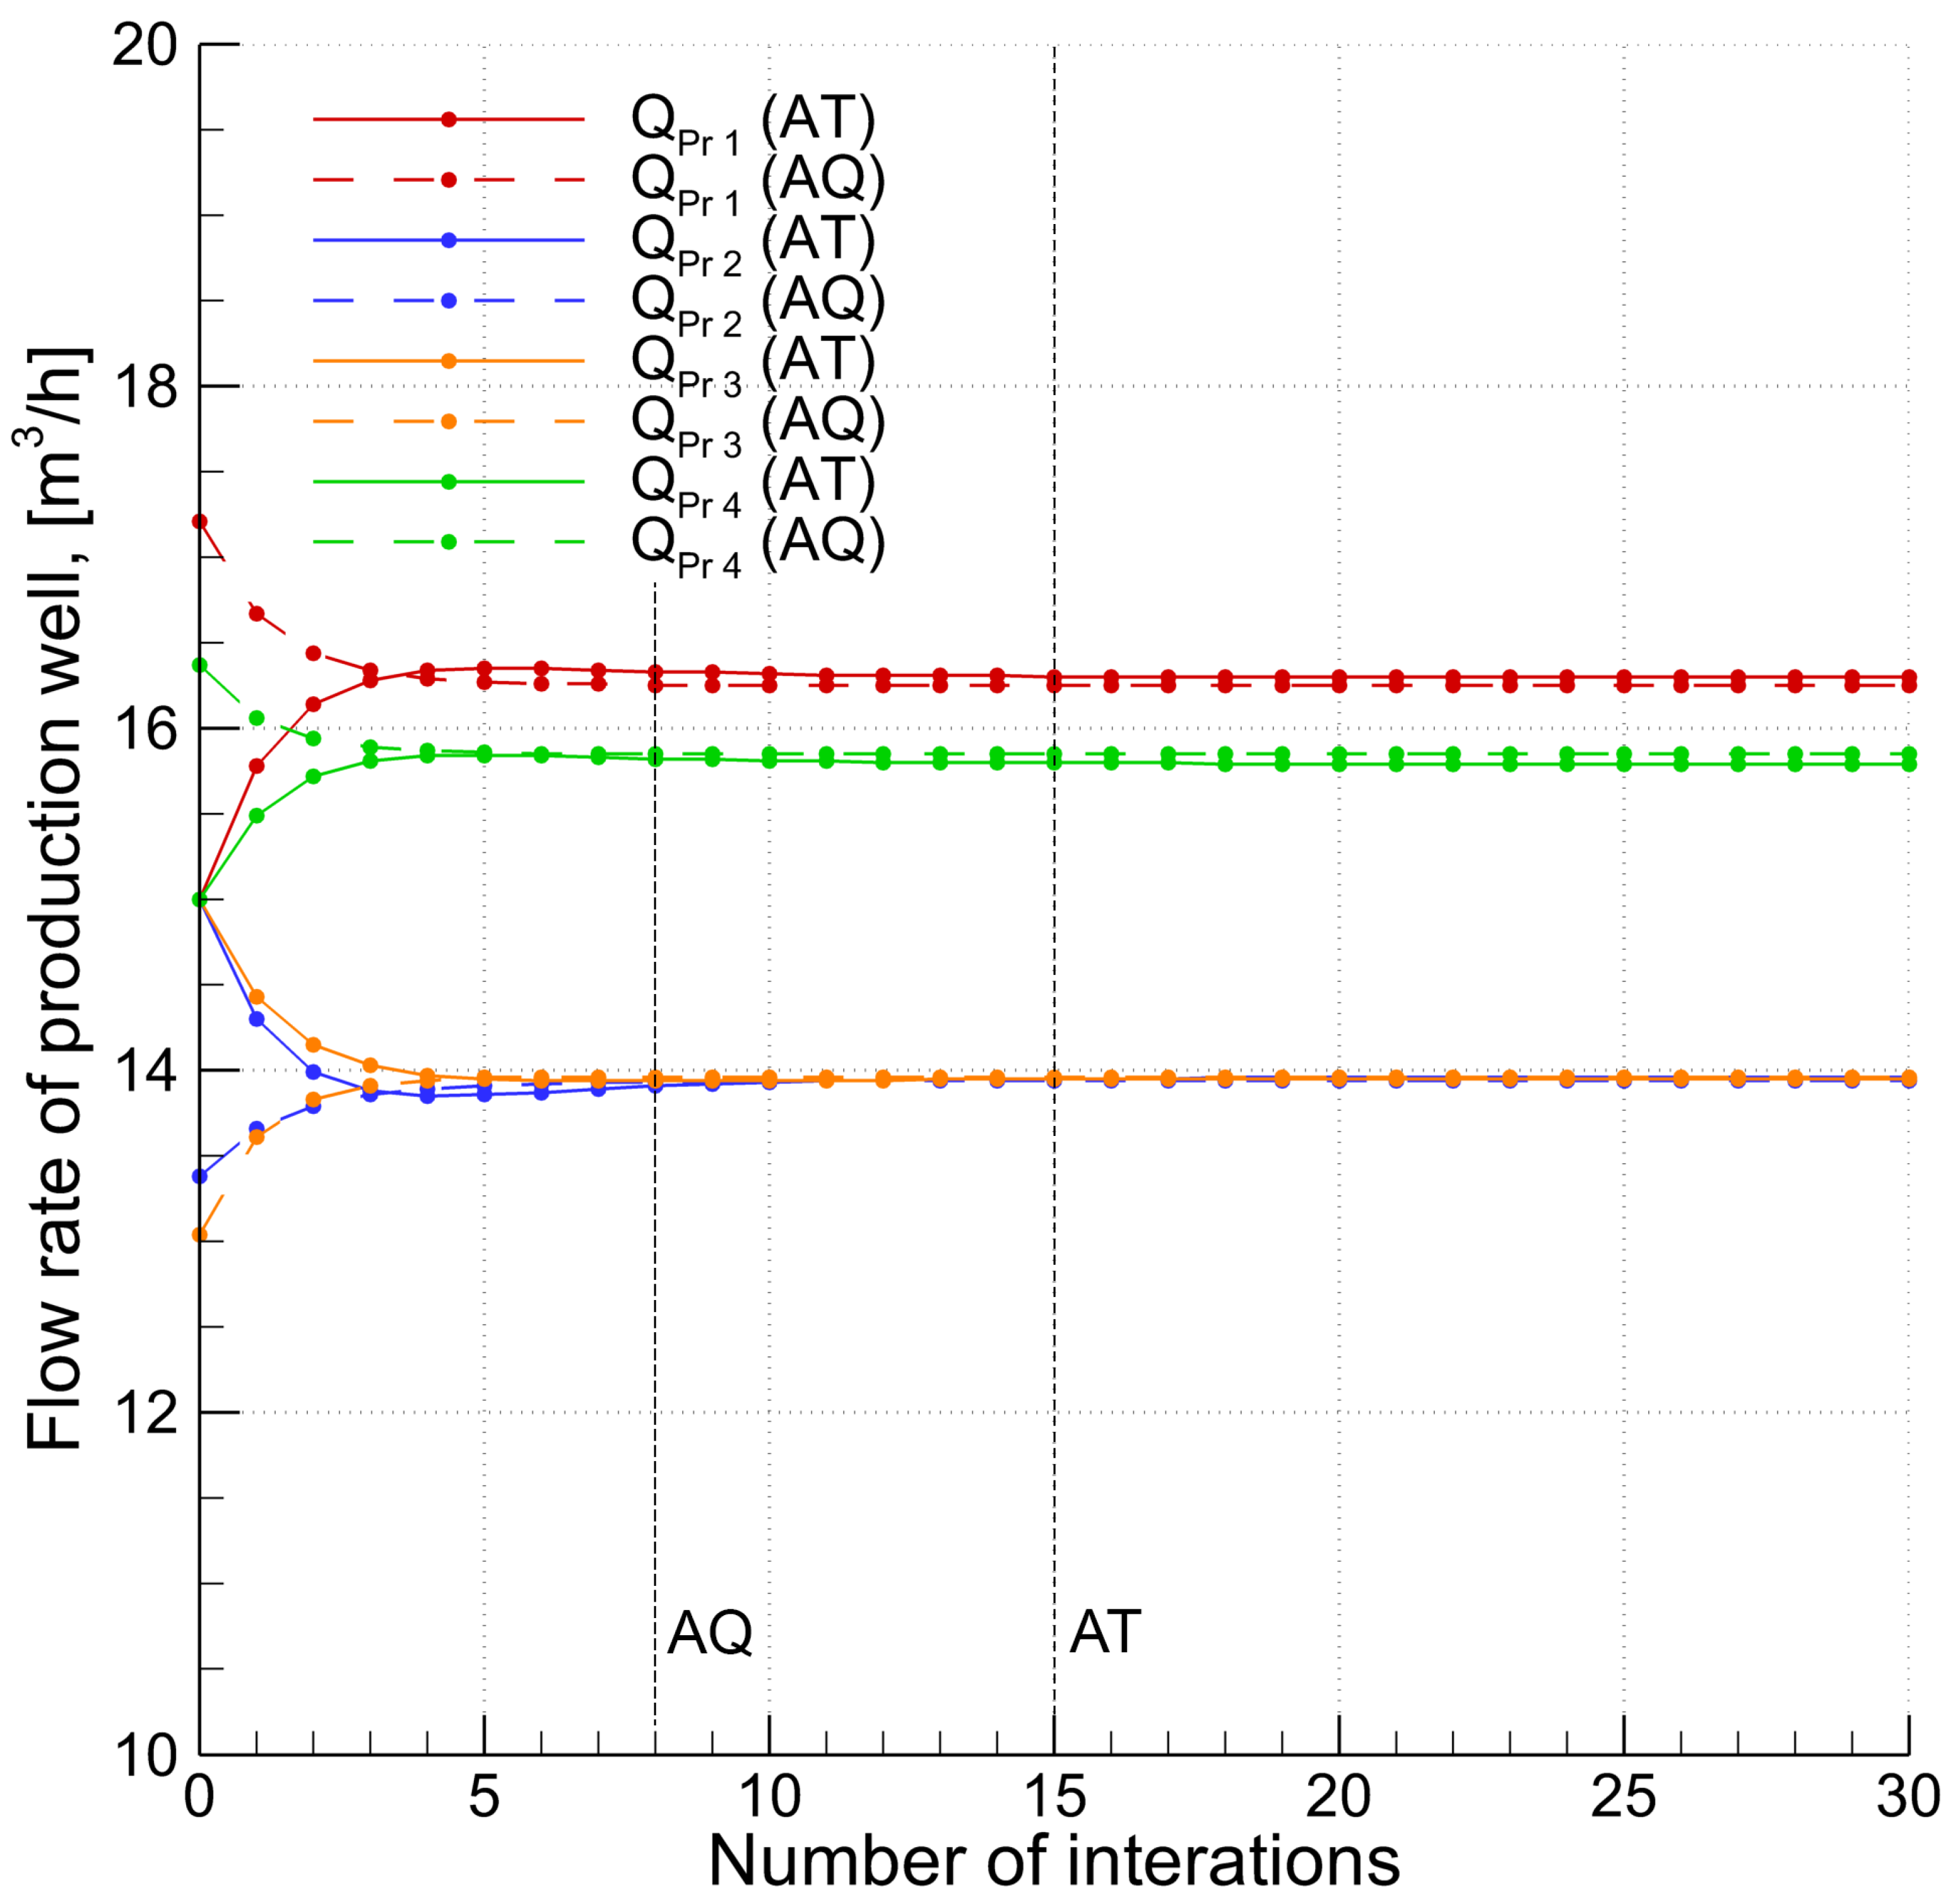
Although the streamline-based TOF methods may initially appear inefficient for flow rate redistribution, resulting in longer development times and, consequently, greater acid consumption, it should be emphasized that, in highly heterogeneous environments or in cases when clogging occurs, these methods can provide higher efficiency by explicitly accounting for variations in hydraulic conductivity. The hydraulic connections between wells are identified automatically without the need for manual input, and the TOF results converge to a stable value for each injection well irrespective of the initial flow rates (Figure 15).
Figure 15 presents the results of adjusting the flow rates of the production wells by the TOFmin method. To improve clarity, only a subset of production wells is shown, since including all injection wells would result in a large number of overlapping lines, thereby reducing readability. As illustrated in Figure 15, the flow rates of the production wells converge to a single value after several iterations, regardless of whether the initial distribution was specified using the AT (solid lines) or AQ (dashed lines) methods. Specifically, convergence is achieved after approximately 15 iterations in the case of AT and after 8 iterations in the case of AQ. While it is true that the hydraulic head equation must be solved to determine the velocity field and associated streamlines, these fields are often precomputed in industrial practice using existing software, whereas the streamline method itself is relatively fast.
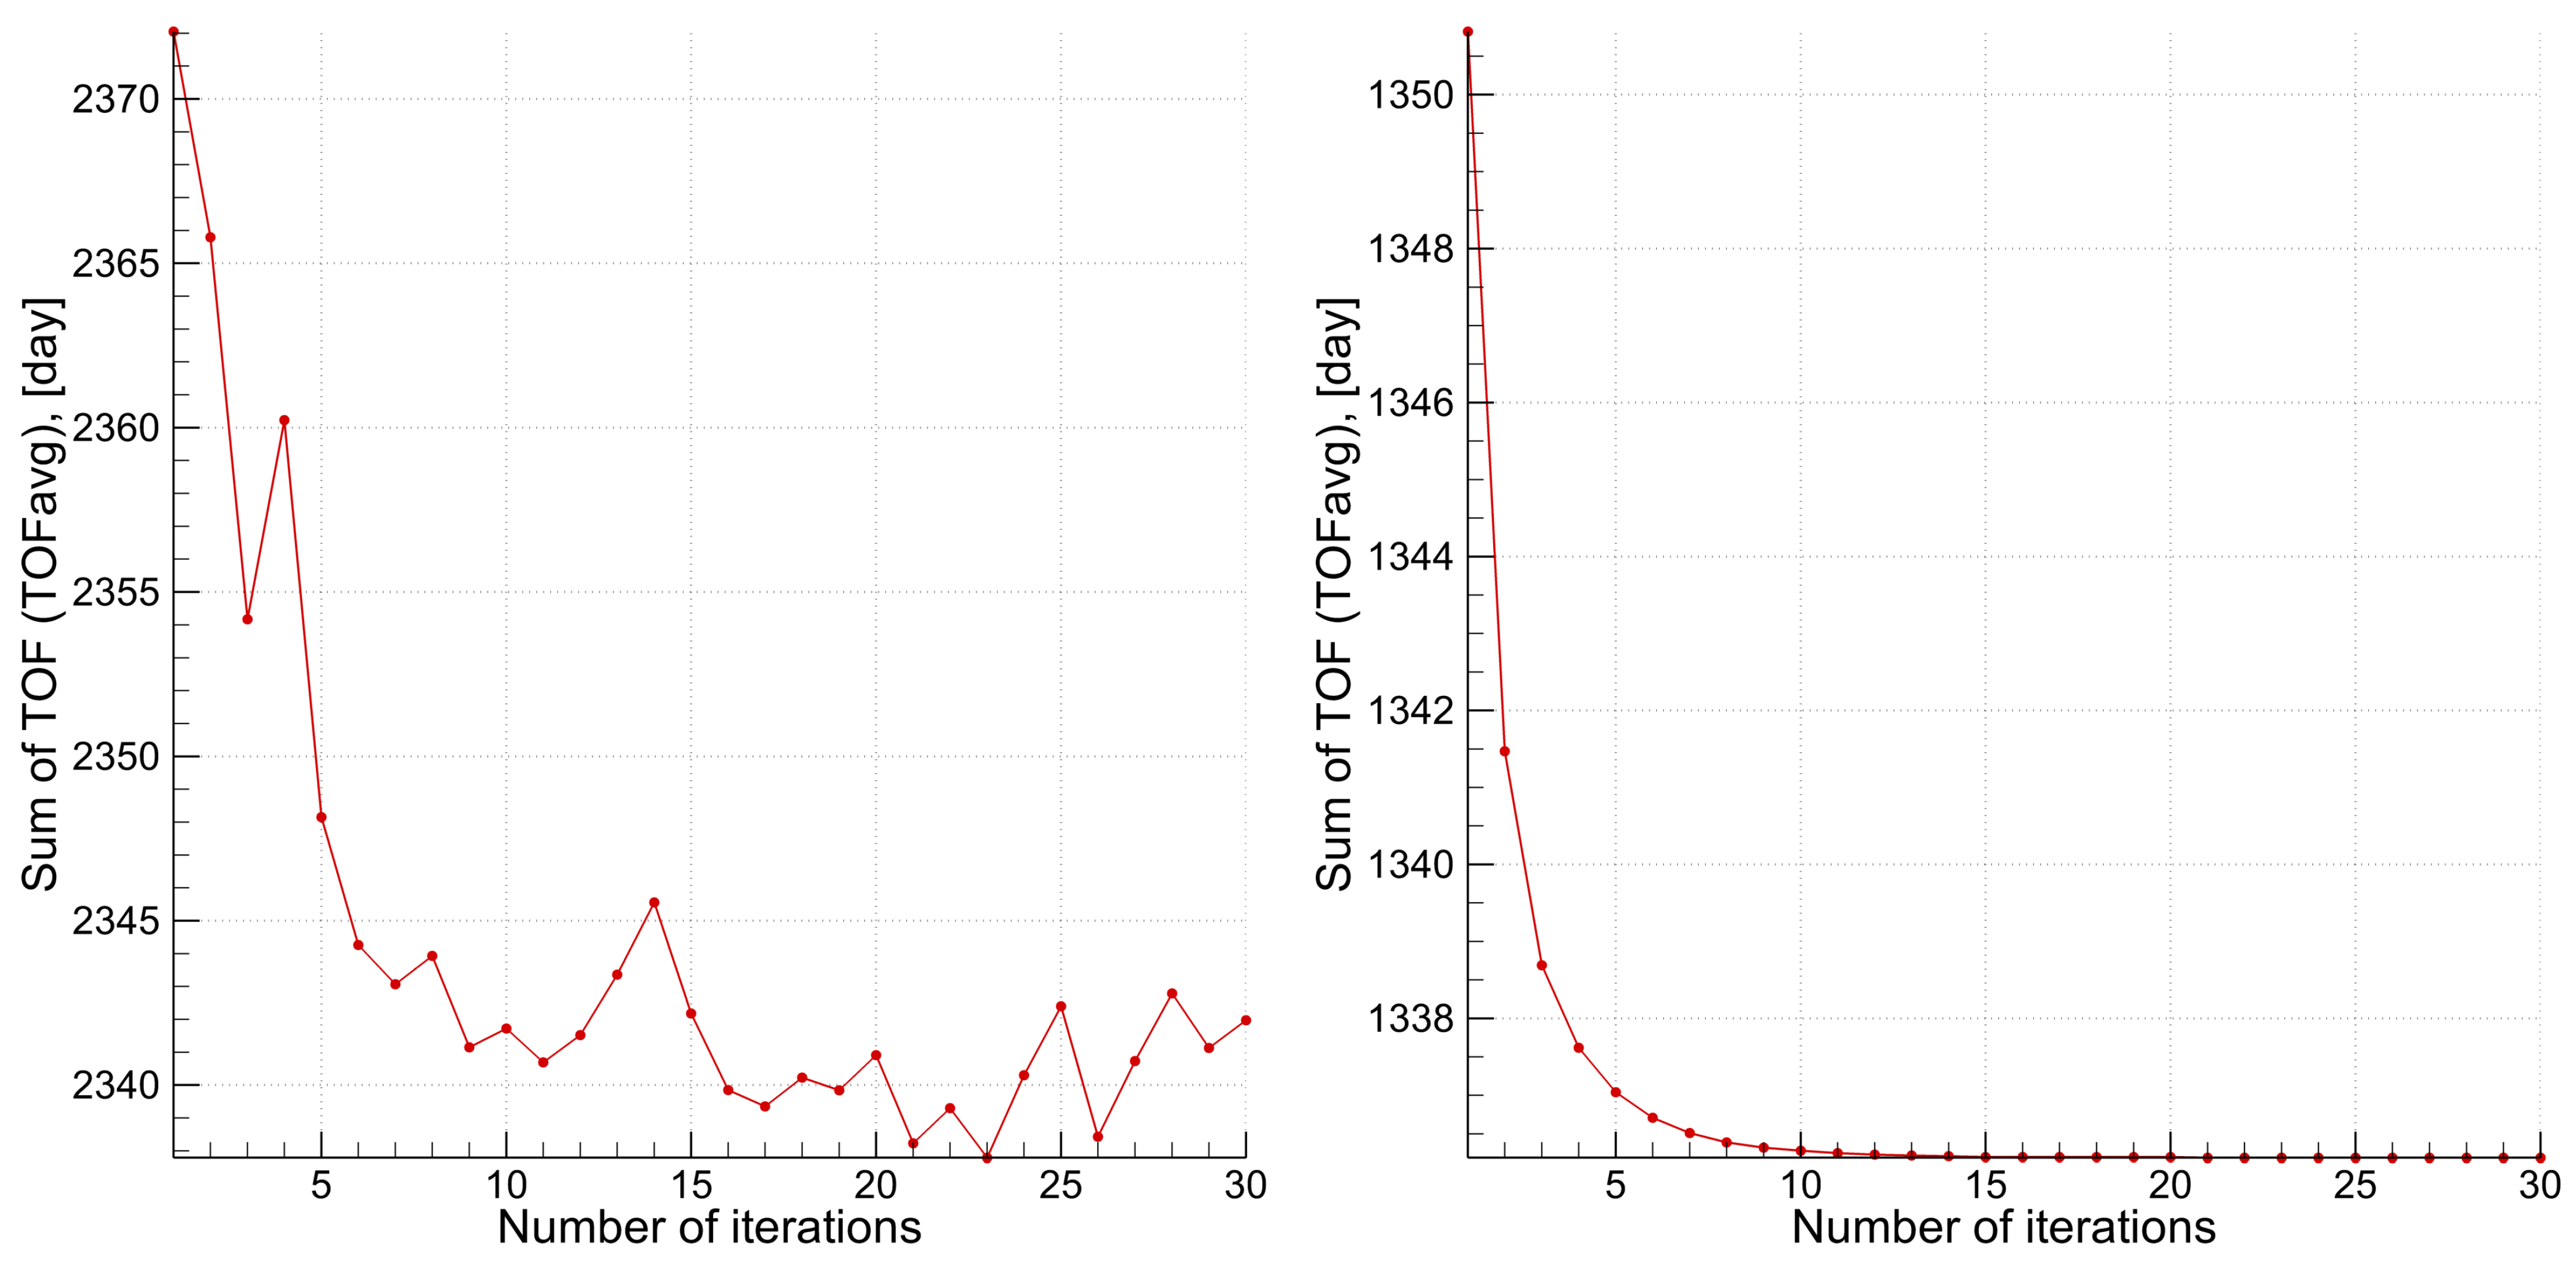
The comparison between TOFmin and TOFavg approaches essentially contrasts length-based versus area-based metrics. While streamlines follow the path of least resistance, TOFmin accounts for the time of flight along the shortest flow path, conceptually similar to LD but expressed in temporal rather than spatial terms. Consequently, TOFmin does not capture the leaching area or the influence of neighboring injection wells. Conversely, TOFavg incorporates these spatial factors; however, it exhibits instability because streamline distributions change significantly after certain iterations, particularly for streamlines with the longest time-of-flight values (Figure 16). Evidently, these limitations result in both TOF-based approaches being less efficient than SD and AQ.
Notably, the results of all methods, except for AT and LD, fall within a narrow range of practical significance. Differences of only a few days in recovery time would require flow rate precision unattainable under actual field conditions, suggesting that multiple approaches may be equally viable for operational implementation.
The results demonstrate that the SD method, which does not require complex numerical computations, provides higher efficiency by reducing the recovery time and OPEX. Time of flight-based approaches also show promise in cases with more heterogeneous conditions, although additional study is required.
To evaluate scaling effects, test calculations were performed for various homogeneous values of hydraulic conductivity, total well flow rates, and well spacing. The results demonstrated comparable efficiency percentages across all scenarios.

4. Conclusions

The efficiency of production depends strongly on operational decisions, particularly the adjustment of well flow rates to balance reagent distribution, maximize ore coverage, and minimize costs. This study evaluated six allocation methods, including advanced traditional, distance-based, area-based, and streamline-based approaches, through reactive transport modeling of uranium in situ leaching at the Budenovskoye deposit. Simulations, conducted under homogeneous conditions, extended historical operations to 90% recovery, enabling a comparative assessment of method performance.
The results demonstrate that multi-criteria methods, based on distances, areas, and time of flight between hydraulically connected wells, can serve as efficient alternatives to the standard advanced traditional approach. In particular, the squared distance method, which uses the distance between injection and production wells as a weighting factor for flow rate redistribution, reduced operational costs by 5.7% (with an operational time of 511 days) while ensuring greater uniformity of reagent concentration across technological cells. By contrast, the linear distance weighting method performed the worst (with the exception of the traditional method), leading to the least balanced distribution between cells and the lowest overall production efficiency (521 days operational time). The quadrilateral area method achieved the most uniform reagent distribution between cells, minimizing stagnant zones; however, it underperformed in terms of efficiency, with a slightly longer operational time (512 days, +0.2%) and higher reagent consumption (+28.8 tons). The streamline-based methods performed comparably to the squared distance method (514 days for TOFavg and 515 days for TOFmin) but did not demonstrate the expected performance advantages. Nonetheless, because streamline-based methods intrinsically account for hydraulic conductivity variations and can automatically identify hydraulic connections between wells, they may be better suited for on-site simulations during both the design and exploitation stages under real-world conditions. Manual identification of hydraulic connections is often challenging, as solution flow may occur even between distant wells; therefore, automating this step can accelerate the decision-making process.
Thus, based on the results, the SD method proves to be the most effective, as it does not require mathematical modeling and ensures higher efficiency by reducing both the recovery time and OPEX. Time of flight-based approaches also appear prospective; however, they necessitate additional studies before practical implementation.
Future work should focus on streamline-based methods using empirical data from exceptionally heterogeneous mining sites, particularly data capturing temporal changes in hydraulic conductivity due to chemical clogging (due to calcium carbonates), mechanical clogging, and pore channeling.

Author Contributions

Conceptualization, M.K. and N.S.; methodology, M.K.; software, M.K., D.A. and B.A.; validation, B.A. and A.T.; formal analysis, N.S. and M.K.; investigation, M.K. and N.S.; resources, M.T.; data curation, B.A. and A.T.; writing—original draft preparation, D.A., N.S. and M.T.; writing—review and editing, D.A. and N.S.; visualization, M.K., B.A. and A.T.; supervision, M.T.; project administration, M.T.; funding acquisition, M.T. All authors have read and agreed to the published version of the manuscript.

Funding

This research was funded by the Ministry of Science and Higher Education of Kazakhstan, grant number AP19676743.

Data Availability Statement

The original contributions presented in this study are included in the article. Further inquiries can be directed to the corresponding authors.

Conflicts of Interest

The authors declare no conflicts of interest.

References

  1. Li, G.; Yao, J. A Review of In Situ Leaching (ISL) for Uranium Mining. Mining 2024, 4, 120–148. [Google Scholar] [CrossRef]
  2. Sinclair, L.; Thompson, J. In Situ Leaching of Copper: Challenges and Future Prospects. Hydrometallurgy 2015, 157, 306–324. [Google Scholar] [CrossRef]
  3. Gui, Y.; Li, N.; Luo, S.; Wang, G. The Steady Seepage Line Equation of Ionic Rare Earth Ore (IREO) In Situ Leached with Long Strip Bare Feet and Its Application. Sustainability 2023, 15, 2223. [Google Scholar] [CrossRef]
  4. Müller, D.; Groves, D.I.; Santosh, M.; Yang, C.-X. Critical Metals: Their Mineral Systems and Exploration. Geosyst. Geoenviron. 2024, 4, 100323. [Google Scholar] [CrossRef]
  5. Jia, M.; Luo, B.; Lu, F.; Yang, Y.; Chen, M.; Zhang, C.; Xu, Q. Improved FMM for well locations optimization in in-situ leaching areas of sandstone uranium mines. Nucl. Eng. Technol. 2024, 56, 3750–3757. [Google Scholar] [CrossRef]
  6. Shayakhmetov, N.M.; Aizhulov, D.Y.; Alibayeva, K.A.; Serovajsky, S.; Panfilov, I. Application of hydrochemical simulation model to determination of optimal well pattern for mineral production with In-Situ Leaching. Procedia Comput. Sci. 2020, 178, 84–93. [Google Scholar] [CrossRef]
  7. Aizhulov, D.Y.; Shayakhmetov, N.M.; Kaltayev, A. Quantitative Model of the Formation Mechanism of the Roll-Front Uranium Deposits. Eurasian Chem.-Technol. J. 2018, 20, 213–221. [Google Scholar] [CrossRef]
  8. Doucmak, R.; Seigneur, N.; Escario, S.; Chanvry, E.; Lagneau, V.; Khaibulin, R.; Yegorov, R.; Kairambayev, S.; Descostes, M. The first modeling, measurement, and confirmation of natural attenuation over a 30-year period in a uranium in-situ recovery context: Approaches and perspectives. J. Contam. Hydrol. 2025, 273, 104607. [Google Scholar] [CrossRef]
  9. Wang, B.; Luo, Y.; Liu, J.-H.; Li, X.; Zheng, Z.-H.; Chen, Q.-Q.; Li, L.-Y.; Wu, H.; Fan, Q.-R. Ion migration in in-situ leaching (ISL) of uranium: Field trial and reactive transport modelling. J. Hydrol. 2022, 615, 128634. [Google Scholar] [CrossRef]
  10. Seigneur, N.; Grozeva, N.; Purevsan, B.; Descostes, M. Reactive transport modelling as a toolbox to compare remediation strategies for aquifers impacted by uranium in situ recovery. J. Contam. Hydrol. 2024, 265, 104392. [Google Scholar] [CrossRef]
  11. Mwetulundila, A.L.; Atangana, A. Modeling Borehole Interactions and In-situ Leach Uranium Mining Impacts on Groundwater in the Stampriet Aquifer. Earth Syst. Environ. 2025, 7, 102. [Google Scholar] [CrossRef]
  12. Tungatarova, M.; Kurmanseiit, M.B.; Shayakhmetov, N. GPU Accelerated Modeling of In-Situ Leaching Process and Streamline Based Reactive Transport Simulation. Procedia Comput. Sci. 2020, 178, 145–152. [Google Scholar] [CrossRef]
  13. Ji, W.; Zhang, H.; Zhang, L.; Xu, X.; Li, X.; Wang, X.; Chen, X. Integrated surrogate framework for reactive transport modeling of uranium in groundwater using deep learning. J. Hydrol. 2024, 630, 130737. [Google Scholar] [CrossRef]
  14. Kurmanseiit, M.B.; Tungatarova, M.S.; Abdullayeva, B.Z.; Aizhulov, D.Y.; Shayakhmetov, N.M. Acceleration of Numerical Modeling of Uranium In Situ Leaching: Application of IDW Interpolation and Neural Networks for Solving the Hydraulic Head Equation. Minerals 2024, 14, 1043. [Google Scholar] [CrossRef]
  15. Aizhulov, D.; Tungatarova, M.; Kurmanseiit, M.; Shayakhmetov, N. Artificial Neural Networks for Mineral Production Forecasting in the In Situ Leaching Process: Uranium Case Study. Processes 2024, 12, 2285. [Google Scholar] [CrossRef]
  16. Li, Y.; Zhang, C.; Tang, Z.; Li, C.; Liu, Z.; Tan, K.; Liu, L. Hydrodynamics control for the well field of in-situ leaching of uranium. Nucl. Eng. Technol. 2024, 56, 4176–4183. [Google Scholar] [CrossRef]
  17. Li, H.; Tang, Z.; Xiang, D. Study on Numerical Simulation of Reactive-Transport of Groundwater Pollutants Caused by Acid Leaching of Uranium: A Case Study in Bayan-Uul Area, Northern China. Water 2024, 16, 500. [Google Scholar] [CrossRef]
  18. Wang, Z.; Xie, W.; Liu, K.; Cheng, L.; Wang, X.; Cai, X. A HLLC method based on the local multi-layer SWEs to simulate partial obstructed flow in 2D model. J. Hydrol. 2023, 628, 130234. [Google Scholar] [CrossRef]
  19. Qiu, W.; Yang, Y.; Song, J.; Que, W.; Zhang, X.; Liu, Y.; Li, Z.; Zhang, J.; Zhang, L. A deep-learning-based multiobjective optimization for the design of in-situ uranium leaching system under multiple uncertainties. J. Hydrol. 2025, 651, 132576. [Google Scholar] [CrossRef]
  20. Luo, J.; Cui, G.; Yang, D.; Huo, C.; Zhang, X.; Liu, Y.; Li, Z.; Zhang, J.; Zhang, L. Impact of the existence of carbonate minerals on the performance of CO2 + O2 during in situ leaching in uranium deposits. Nucl. Eng. Technol. 2025, 57, 103821. [Google Scholar] [CrossRef]
  21. Shayakhmetov, N.M.; Aizhulov, D.Y.; Alibayeva, K.A.; Serovajsky, S.; Panfilov, I. Enhancing uranium in-situ leaching efficiency through the well reverse technique: A study of the effects of reversal time on production efficiency and cost. Hydrometallurgy 2023, 219, 106086. [Google Scholar] [CrossRef]
  22. Zhang, C.; Li, Y.; Niu, Y.; Tan, K.; Xie, T.; Yao, Y.; Li, C.; Liu, Z. Quantitative determination of the leaching range of in-situ leaching mining area by stagnation point. Nucl. Eng. Technol. 2025, 57, 103204. [Google Scholar] [CrossRef]
  23. Lanzhi, Y.; Pingchao, K.; Lingling, X.; Guangrong, L.; Kai, Z.; Feifan, Y.; Yipeng, Z. The role of P(V) salts in inhibiting CaCO3 precipitation in the uranium in-situ leaching process using CO2 and O2. Hydrometallurgy 2025, 234, 106462. [Google Scholar] [CrossRef]
  24. Yussupov, K.; Abdissattar, G.; Aben, E.; Myrzakhmetov, S.; Akhmetkanov, D.; Yelzhanov, E. A Novel Process for Decolmatation of Wells During In Situ Leach Mining of Uranium. Civ. Eng. J. 2025, 11, 1447–1457. [Google Scholar] [CrossRef]
  25. Zhao, J.; Liu, C. Advancements in regional geological surveys: Insights from the 2024 China National Regional Geological Survey Conference and a six-year uranium exploration case study in Shaoguan, Guangdong. Phys. Chem. Earth Parts A/B/C 2025, 139, 103953. [Google Scholar] [CrossRef]
  26. Poezhaev, I.P.; Polynovsky, K.D.; Gorbatenko, O.A.; Panova, E.N.; Bulenova, K.Z.; Karmanov, E.M.; Blynsky, P.A.; Bitovt, O.A. Geotechnology of Uranium [Geotehnologiya Urana]; Kazakh Universitety: Almaty, Kazakhstan, 2017; p. 319. (In Russian) [Google Scholar]
  27. Kurmanseiit, M.; Shayakhmetov, N.; Aizhulov, D.; Abdullayeva, B.; Tungatarova, M. Computational Approaches to Assess Flow Rate Efficiency During In Situ Recovery of Uranium: From Reactive Transport to Streamline- and Trajectory-Based Methods. Minerals 2025, 15, 835. [Google Scholar] [CrossRef]
  28. Kurmanseiit, M.B.; Tungatarova, M.S.; Kaltayev, A.; Royer, J.-J. Reactive Transport Modeling during Uranium In Situ Leaching (ISL): The Effects of Ore Composition on Mining Recovery. Minerals 2022, 12, 1340. [Google Scholar] [CrossRef]
  29. Patrin, A.P.; Zabaznov, V.L.; Chistilin, P.E. The main results of a full-scale field experiment on the ISL of Uranium at site 2 of the Budenovskoye deposit. In Proceedings of the Vth International Conference, “Actual Problems of the Uranium Industry”, Almaty, Kazakhstan, 19–20 September 2008; pp. 198–204. [Google Scholar]
  30. Podrezov, D.R. Development and Identification of Models for the Reserves Estimating of the URANIUM In-Situ Leaching Mine. Master’s Thesis, National Research Technological University “MISIS”, Moscow, Russia, 2021. [Google Scholar]
  31. DePonty Jersy, D.; Shane, R.G.; DePinto, P.; Grant Kornrumph, S.; Marvin, F.; Glotfelty, R.G. Plumbness and Alignment Standards—Analysis and Recommendations for Operational Applicability. pp. 1–7. Available online: https://inspectapedia.com/water/Water-well-plumbness-alignment-standards-DePonty.pdf (accessed on 20 August 2025).
  32. Pollock, D.W. Semi-analytical Computation of Path Line for Finite Difference Models. Ground Water 1988, 6, 743–750. [Google Scholar] [CrossRef]
  33. JSC “NAC Kazatomprom”. Consolidated Financial Statements for the Year Ended 31 December 2024 and Independent Auditor’s Report; JSC “NAC Kazatomprom”: Astana, Kazakhstan, 2024; p. 77. Available online: https://www.kazatomprom.kz/storage/cb/konsolidirovannaya_finansovaya_otchetnost_ao_nak_kazatomprom_za_god_zakonchivshiisya_31_dekabrya_2024_g_na_angliiskom_yazikevy4nnjlepyasihvj4esdh.pdf (accessed on 20 August 2025).
  34. JSC “NAC Kazatomprom”. Operating and Financial Review for 2024; JSC “NAC Kazatomprom”: Astana, Kazakhstan, 2024; pp. 19–20. Available online: https://www.kazatomprom.kz/storage/66/ofr_eng_12m_2024hu7sk2kzthic5kjkpyx5j.pdf (accessed on 20 August 2025).
  35. National Bank of the Republic of Kazakhstan. Daily Official (Market) Foreign Exchange Rates. Available online: https://nationalbank.kz/en/exchangerates/ezhednevnye-oficialnye-rynochnye-kursy-valyut (accessed on 20 August 2025).
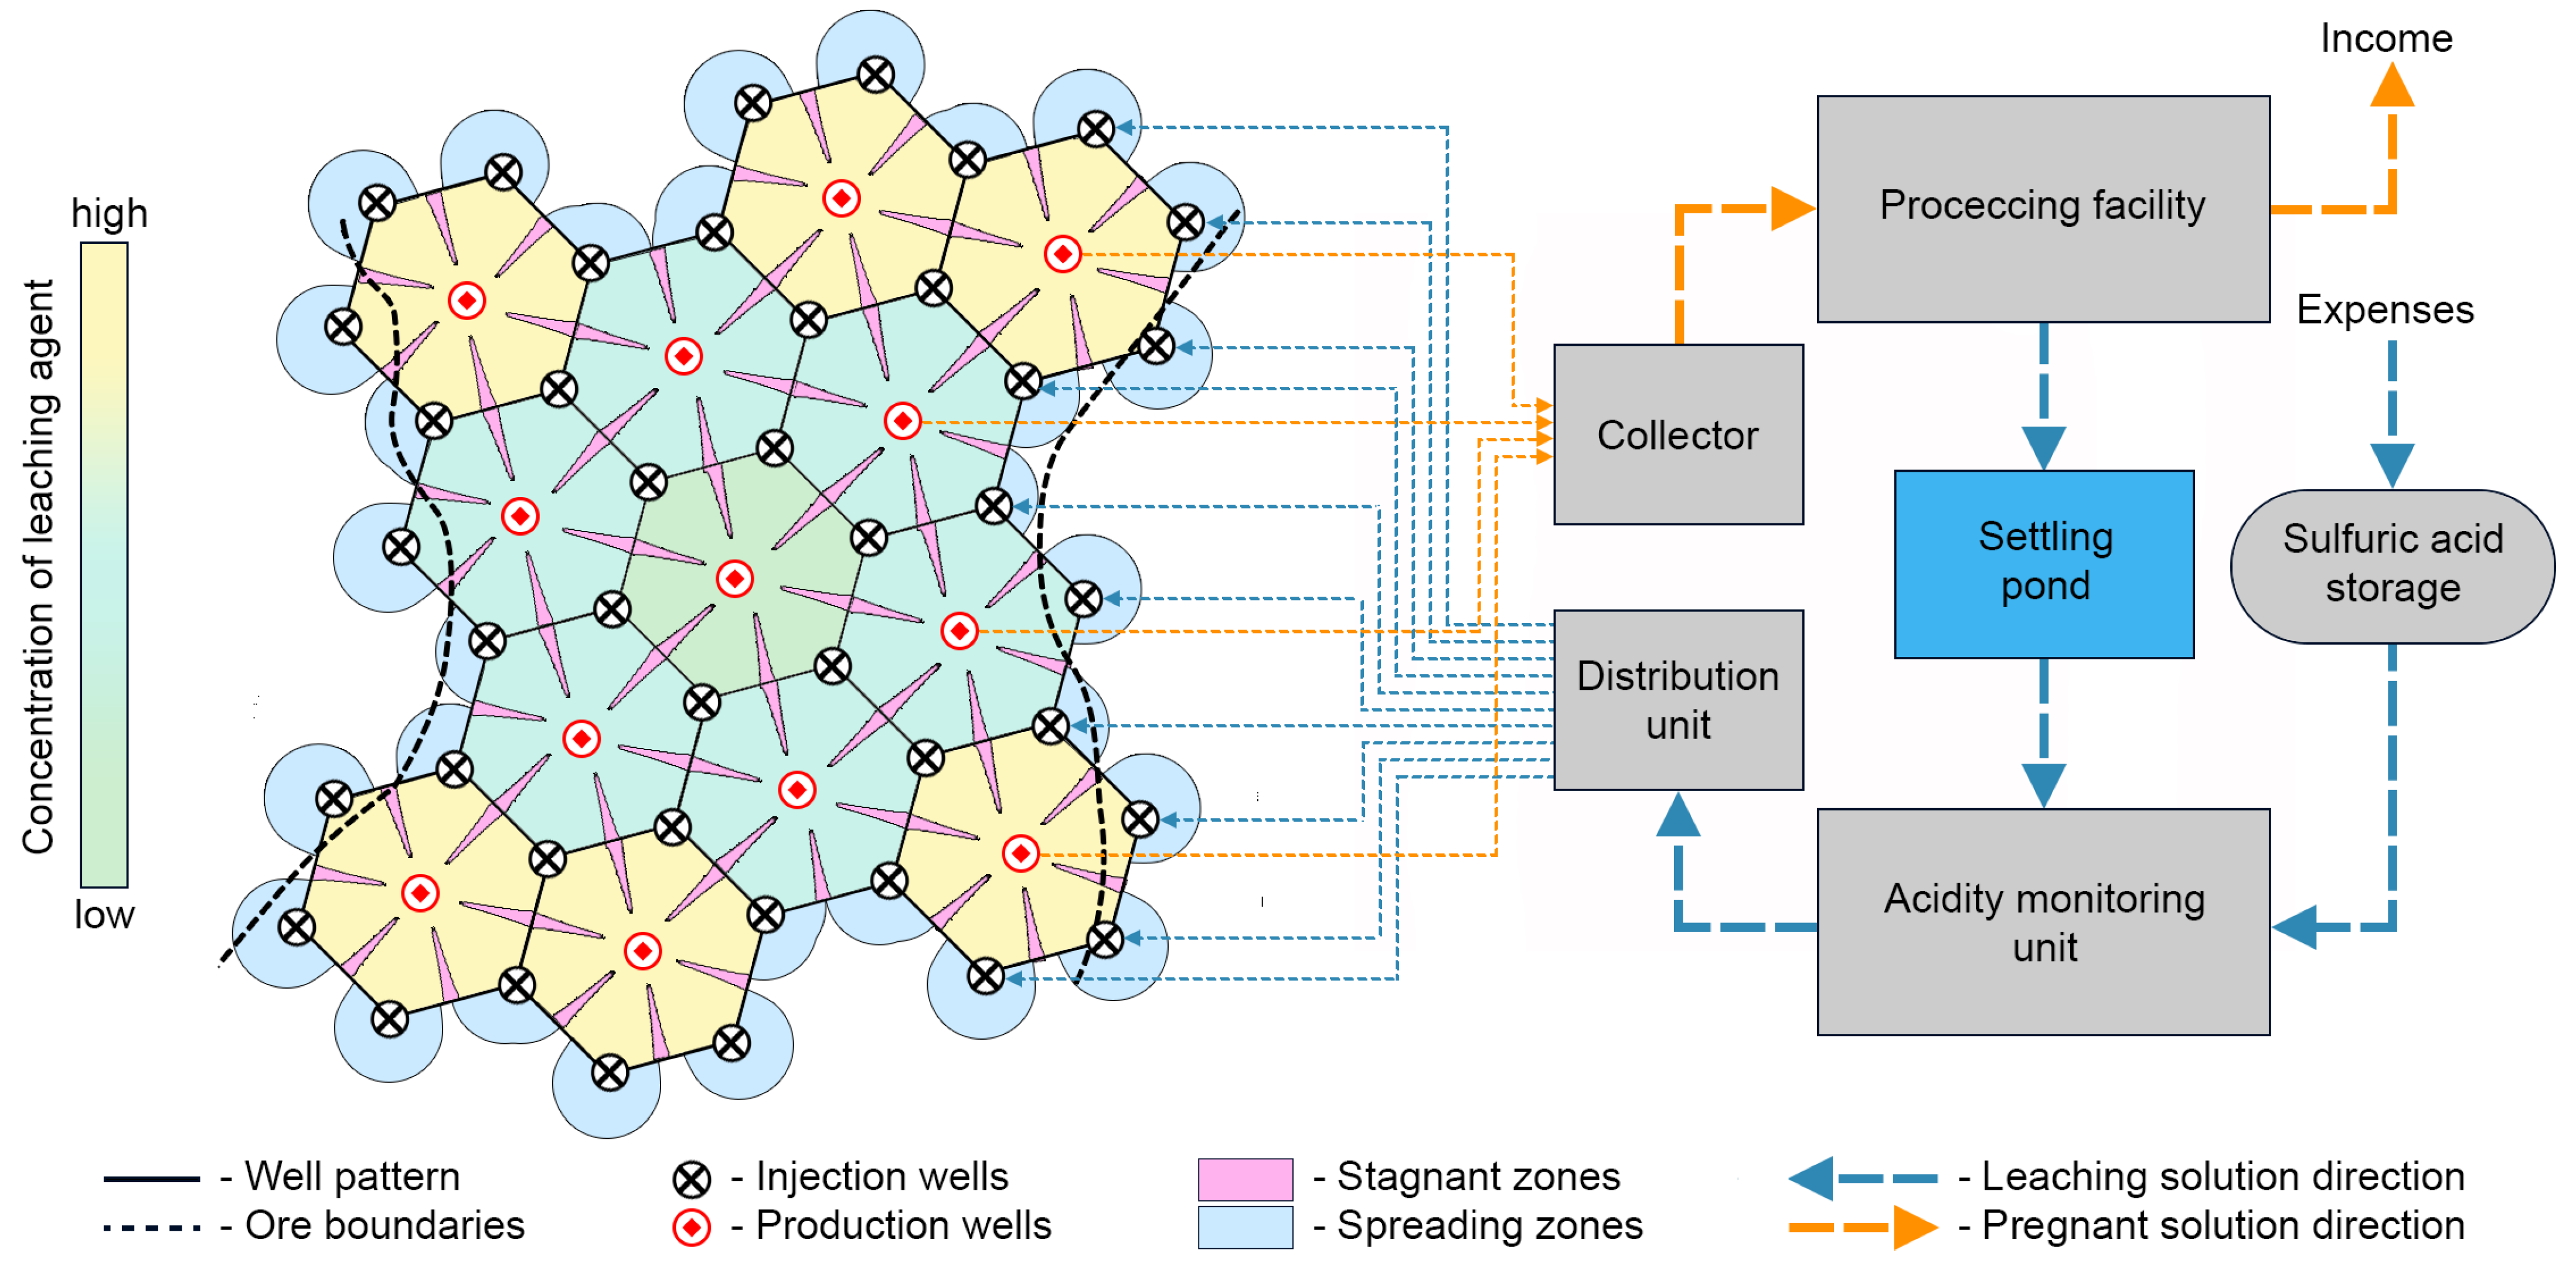
Figure 1. Top view of a technological block used in the ISL process, showing injection wells, production wells arranged in hexagonal cells, and associated processing units.
Minerals 15 01066 g001
Figure 2. Top view of the technological block of the Budenovskoye deposit under consideration, containing 18 injection wells and 4 production wells, with a fixed concentration of uranium spread homogeneously throughout the cells.
Minerals 15 01066 g002
Figure 3. Theactual variations in total well flow rates, obtained from production data, along with averaged total flow rates ( Q s u m I n and Q s u m P r ), were used as input for the mathematical modeling.
Minerals 15 01066 g003
Figure 4. Distribution of hydrodynamic connections between 4 pumping wells and 18 injection wells in the technological block at the Budenovskoye field.
Minerals 15 01066 g004
Figure 5. Example of a technological block including 13 production and 42 injection wells, with injection wells connected to 1, 2, or 3 production wells.
Minerals 15 01066 g005
Figure 6. Calculation of inter-well distances and corresponding flow rate distribution using the LD method.
Minerals 15 01066 g006
Figure 7. Quadrilateral distribution for the considered deposit.
Minerals 15 01066 g007
Figure 8. Distribution of minimal time of flight (TOF) between injection and production wells for the considered deposit denoted by blue curves.
Minerals 15 01066 g008
Figure 9. Algorithm of the iterative TOFmin method with relaxation, using streamline tracing for determination of well flow rates.
Minerals 15 01066 g009
Figure 10. Spatial distribution of reagent concentration at initial time, day 271, and day 542, obtained using the AT method.
Minerals 15 01066 g010
Figure 11. Spatial distribution of solid mineral concentration at initial time, day 271, and day 542, obtained using the AT method.
Minerals 15 01066 g011
Figure 12. Spatial distribution of dissolved mineral concentration at initial time, day 271, and day 542, obtained using the AT method.
Minerals 15 01066 g012
Figure 13. Change in the recovery rate over time using different well flow rate optimization methods; the right panel presents a zoomed-in view for identifying the exact development time (the dashed line indicates the development time for the corresponding method).
Minerals 15 01066 g013
Figure 14. Distribution of the solid mineral at 90% recovery: (a) the AT method (542 days) and (b) the SD method (511 days).
Minerals 15 01066 g014
Figure 15. Change in production well flow rates using the TOFmin method, with the initial distribution specified by the AT (solid lines, converged after 15 iterations) and AQ (dashed lines, converged after 8 iterations) methods; the flow rate of each production well is represented by a distinct color.
Minerals 15 01066 g015
Figure 16. Change in sum in TOF with respect to number of iterations for TOFmin and TOFavg to reflect stability of the approaches.
Minerals 15 01066 g016
Table 1. Change in solid mineral concentrations [g/L] across the well cells under different well flow rate optimization methods at 90% recovery.
CellATLDSDAQTOFminTOFavg
[g/L] [g/L] [g/L] [g/L] [g/L] [g/L]
Cell with P r 1 0.1910.1670.1400.1450.1650.161
Cell with P r 2 0.0230.0410.0720.0570.0560.059
Cell with P r 3 0.0210.0330.0460.0630.0390.045
Cell with P r 4 0.1660.1600.1510.1430.1440.139
Average by all 4 cells0.1000.1000.1020.1020.1010.101
Deviation from average in P r 1 0.0910.0670.0380.0430.0640.060
Deviation from average in P r 2 0.0770.0590.0300.0450.0450.042
Deviation from average in P r 3 0.0790.0680.0560.0390.0620.056
Deviation from average in P r 4 0.0650.0600.0490.0410.0440.038
Sum of average deviation0.3130.2540.1730.1680.2150.196
Table 2. Operational time, acid consumption, and corresponding costs under different well flow rate optimization methods at 90% recovery.
ATLDSDAQTOFminTOFavg
Operation time to reach 90% recovery ( t * ), [day]542521511512515514
Acid consumption, [ton]15,609.615,004.814,716.814,745.614,832.014,803.2
Acid expenses ( E A C ), [thousand USD]1639.01575.51545.31548.31557.41554.3
Efficiency (% decrease in operational costs)03.95.75.55.05.2
Table 3. Pairwise comparison matrix of the flow rate optimization methods. The rows indicate relative efficiency [%], and the columns represent the corresponding increase in costs [%].
ATLDSDAQTOFminTOFavg
AT0.0−3.9−5.7−5.5−5.0−5.2
LD3.90.0−1.8−1.7−1.1−1.3
SD5.71.80.00.20.70.5
AQ5.51.7−0.20.00.60.4
TOFmin5.01.1−0.7−0.60.0−0.2
TOFavg5.21.3−0.5−0.40.20.0
Disclaimer/Publisher’s Note: The statements, opinions and data contained in all publications are solely those of the individual author(s) and contributor(s) and not of MDPI and/or the editor(s). MDPI and/or the editor(s) disclaim responsibility for any injury to people or property resulting from any ideas, methods, instructions or products referred to in the content.