Article

Optimization of High-Pressure Grinding Roll (HPGR) Performance in an Industrial-Scale HPGR/Tower Mill Comminution Circuit

1
School of Resources & Civil Engineering, Northeastern University, Shenyang 110819, China
2
Liaoning Provincial Engineering Research Center of Efficient Comminution and Separation, Shenyang 110027, China
3
Shenyang Shengshi Wuhuan Science and Technology Co., Ltd., Shenyang 110027, China
4
Shenyang Shengshi Wuhuan Mining and Metallurgical Engineering Technology Co., Ltd., Shenyang 110027, China
5
NBK Institute of Mining Engineering, University of British Columbia, Vancouver, BC V6T 1Z4, Canada
*
Authors to whom correspondence should be addressed.
Minerals 2025, 15(10), 1065; https://doi.org/10.3390/min15101065 (registering DOI)
Submission received: 25 August 2025 / Revised: 10 September 2025 / Accepted: 13 September 2025 / Published: 11 October 2025
(This article belongs to the Section Mineral Processing and Extractive Metallurgy)

Abstract

The integration of high-pressure grinding roller (HPGR) with pre-concentration techniques and stirred mills is recognized for its energy efficiency. Studies have suggested that the feed with a P80 around 1 mm is acceptable for stirred mills or coarse particle flotation. Nonetheless, published experimental data characterizing the comminution behavior of single-stage HPGR circuits configured with a 1 mm screen aperture remain scarce. Moreover, extant research remains confined to laboratory scale. Consequently, critical performance metrics, including production capacity, screening efficiency, and process continuity, have not been substantively documented in the literature. In this paper, the HPGR performance in an industrial-scale HPGR/tower mill comminution circuit was assessed and optimized by laboratory and industrial tests. The research meticulously analyzed the impact of feed rate on the industrial-scale flip-flow screen and HPGR performance and found that the HPGR featuring two studded rolls with a diameter of 800 mm and a width of 400 mm, operating in a reverse classification circuit with a scalped feed by a 14.64 m2 flip-flow screen while running continuously 24 h per day, is capable of producing a −1 mm comminution product suitable for tower mill feed. Under the optimal operating conditions identified, it achieved a specific energy consumption of 4.57 kWh/t with a feed rate of 27.08 t/h.

1. Introduction

Comminution processes, especially grinding, have been identified as highly energy-intensive and energy-inefficient, accounting for up to 1.8% of global electricity generation [1] and 60% of total energy consumption in processing plants, yet achieving energy efficiencies as low as 1% [2]. There is every indication that the energy cost of comminution will continue to rise in the coming years. The reasons for this lie in the continuously increasing cost of generating electricity and in the perceptible trend towards finer grinding of ores on an increasingly larger scale for mineral liberation from lower-grade ores and for producing ultrafine particulates for emerging materials technologies. Consequently, optimizing and controlling energy usage in particle size reduction units is crucial [3].
HPGRs have been widely recognized as an energy-efficient alternative to conventional tertiary or quaternary crushers [4,5,6]. HPGRs offer several potential benefits, including reduced energy consumption, increased throughput, enhanced mineral liberation, particle weakening, and the induction of microcracks at the grain boundaries [7,8,9]. These material modifications contribute to lower energy requirements, higher grades, and improved recovery rates in the downstream process [10,11,12,13,14]. Furthermore, energy efficiency can be significantly enhanced by replacing traditional primary grinding equipment with HPGR systems [15].
A tower mill is a kind of wet vertical stirred grinding equipment utilizing steel balls or ceramic grinding media. It has been utilized in fine and ultra-fine grinding for many years [16]. To enable the use of the energy-efficient vertical stirred mill, the transfer size must be controlled by closing the upstream with a screen, which allows other energy-efficient upstream technologies to be utilized, such as HPGRs. Pilot test work was carried out by [17] on a batch ball mill and a pilot-scale vertical mill to assess the energy efficiency factor. The results revealed that the vertical mill achieved a 35% higher efficiency compared to the batch ball mill when processing iron and copper samples with feed sizes of up to 1.57 mm and 1.13 mm, respectively. These findings demonstrated that the stirred mill performs effectively for coarser feed sizes. Regarding pre-concentration, significant advancements in coarse particle separation technology have been documented. Studies suggest that the upper limit of flotation may be extended up to 1 mm [18,19,20,21].
The improved utilization of high-pressure grinding rolls (HPGRs) and stirred mills for coarser grinding is being actively explored, particularly when integrated with pre-concentration [1]. Ref. [22] proposed the very first concept in which two stages of the HPGR produce material with a P80 of 1.5 mm, which can then be fed directly to a Vertimill. Simulation results presented in the study demonstrated energy savings exceeding 45% when employing high-intensity blasting, HPGRs, and stirred milling circuits, compared to conventional blasting/SAG/ball mill circuits. Similar findings were reported by [10,23], who concluded that the two-stage HPGR–stirred mill circuit is more energy-efficient than HPGR–ball mill circuits, cone crusher–ball mill circuits, and SABC–ball mill circuits. However, studies of a one-stage HPGR closed with around 1 mm screen apertures are very rare. In addition, these studies did not investigate the impact of throughput, as they were conducted under laboratory-scale conditions. While laboratory-scale tests are valuable for pre-feasibility assessments, they may not fully represent industrial-scale operations [3]. Pilot-scale HPGR testing is considered the only available option to estimate the specific energy, particle size reduction, and circulating load for a closed-circuit HPGR operation [2]. Ref. [24] provided a brief overview of the performance of an industrial-scale HPGR–tower mill comminution circuit. In this study, the performance of an industrial-scale HPGR–stirred mill circuit was investigated in detail.
To provide technical support for the promotion and application of the HPGR/tower mill comminution circuit, the HPGR performance in an industrial-scale HPGR/tower mill comminution circuit was assessed and optimized in this paper. First, laboratory-scale HPGR pressure force-sensitive tests were conducted in an open circuit. On this basis, reverse and forward classification circuits with a 1 mm screen aperture were investigated. Finally, and most importantly, the effect of feed rate on the screening efficiency of an industrial-scale flip-flow screen, recycled load, specific pressure, roll gap, specific energy consumption, and fines generated (%−75 μm) were studied in detail in an industrial-scale HPGR. The performance of the tower mill and pre-concentration in the circuit will be reported in a future paper.

2. Materials and Methods

2.1. Sample and Characterization

Bulk iron–zinc ore samples were sourced from Sujia Mine, located in Heilongjiang province in China. The iron–zinc ore deposit comprises four distinct ore bodies, and the ore dressing plant typically processes a blend of these ore bodies. During the tests conducted in this study, the ore dressing plant was fed with material from the III# Zinc ore body. The chemical composition and XRD pattern of the representative feed sample are provided in Table 1 and Figure 1, respectively.
The chemical analysis results in Table 1 show that the iron–zinc ore consisted of 21.31 wt.% Fe2O3, 12.55 wt.% S, 28.35 wt.% SiO2, and 3.52 wt.% Zn. Combining the XRD spectra in Figure 1 and the chemical compositions provided in Table 1, it can be concluded that the major minerals present are pyrite, sphalerite, quartz, magnetite, pyrrhotite, and chlorite.

2.2. Bond Work Index

The homogenized sample was crushed, and a series of −3.2 mm fractions were prepared according to the standard Bond Work Index test procedure. Bond ball mill locked-cycle tests were conducted using a standard laboratory-scale Bond mill (305 mm in diameter) with a standard Bond ball charge at a closing screen size of 0.074 mm. The work index (WI), expressed in kWh/t, was calculated using the equation proposed by Bond [25]. As shown in Table 2, the Bond Ball Work Index (BBWI) of the sample was determined to be 16.06 kWh/t.

2.3. Laboratory-Scale Tests

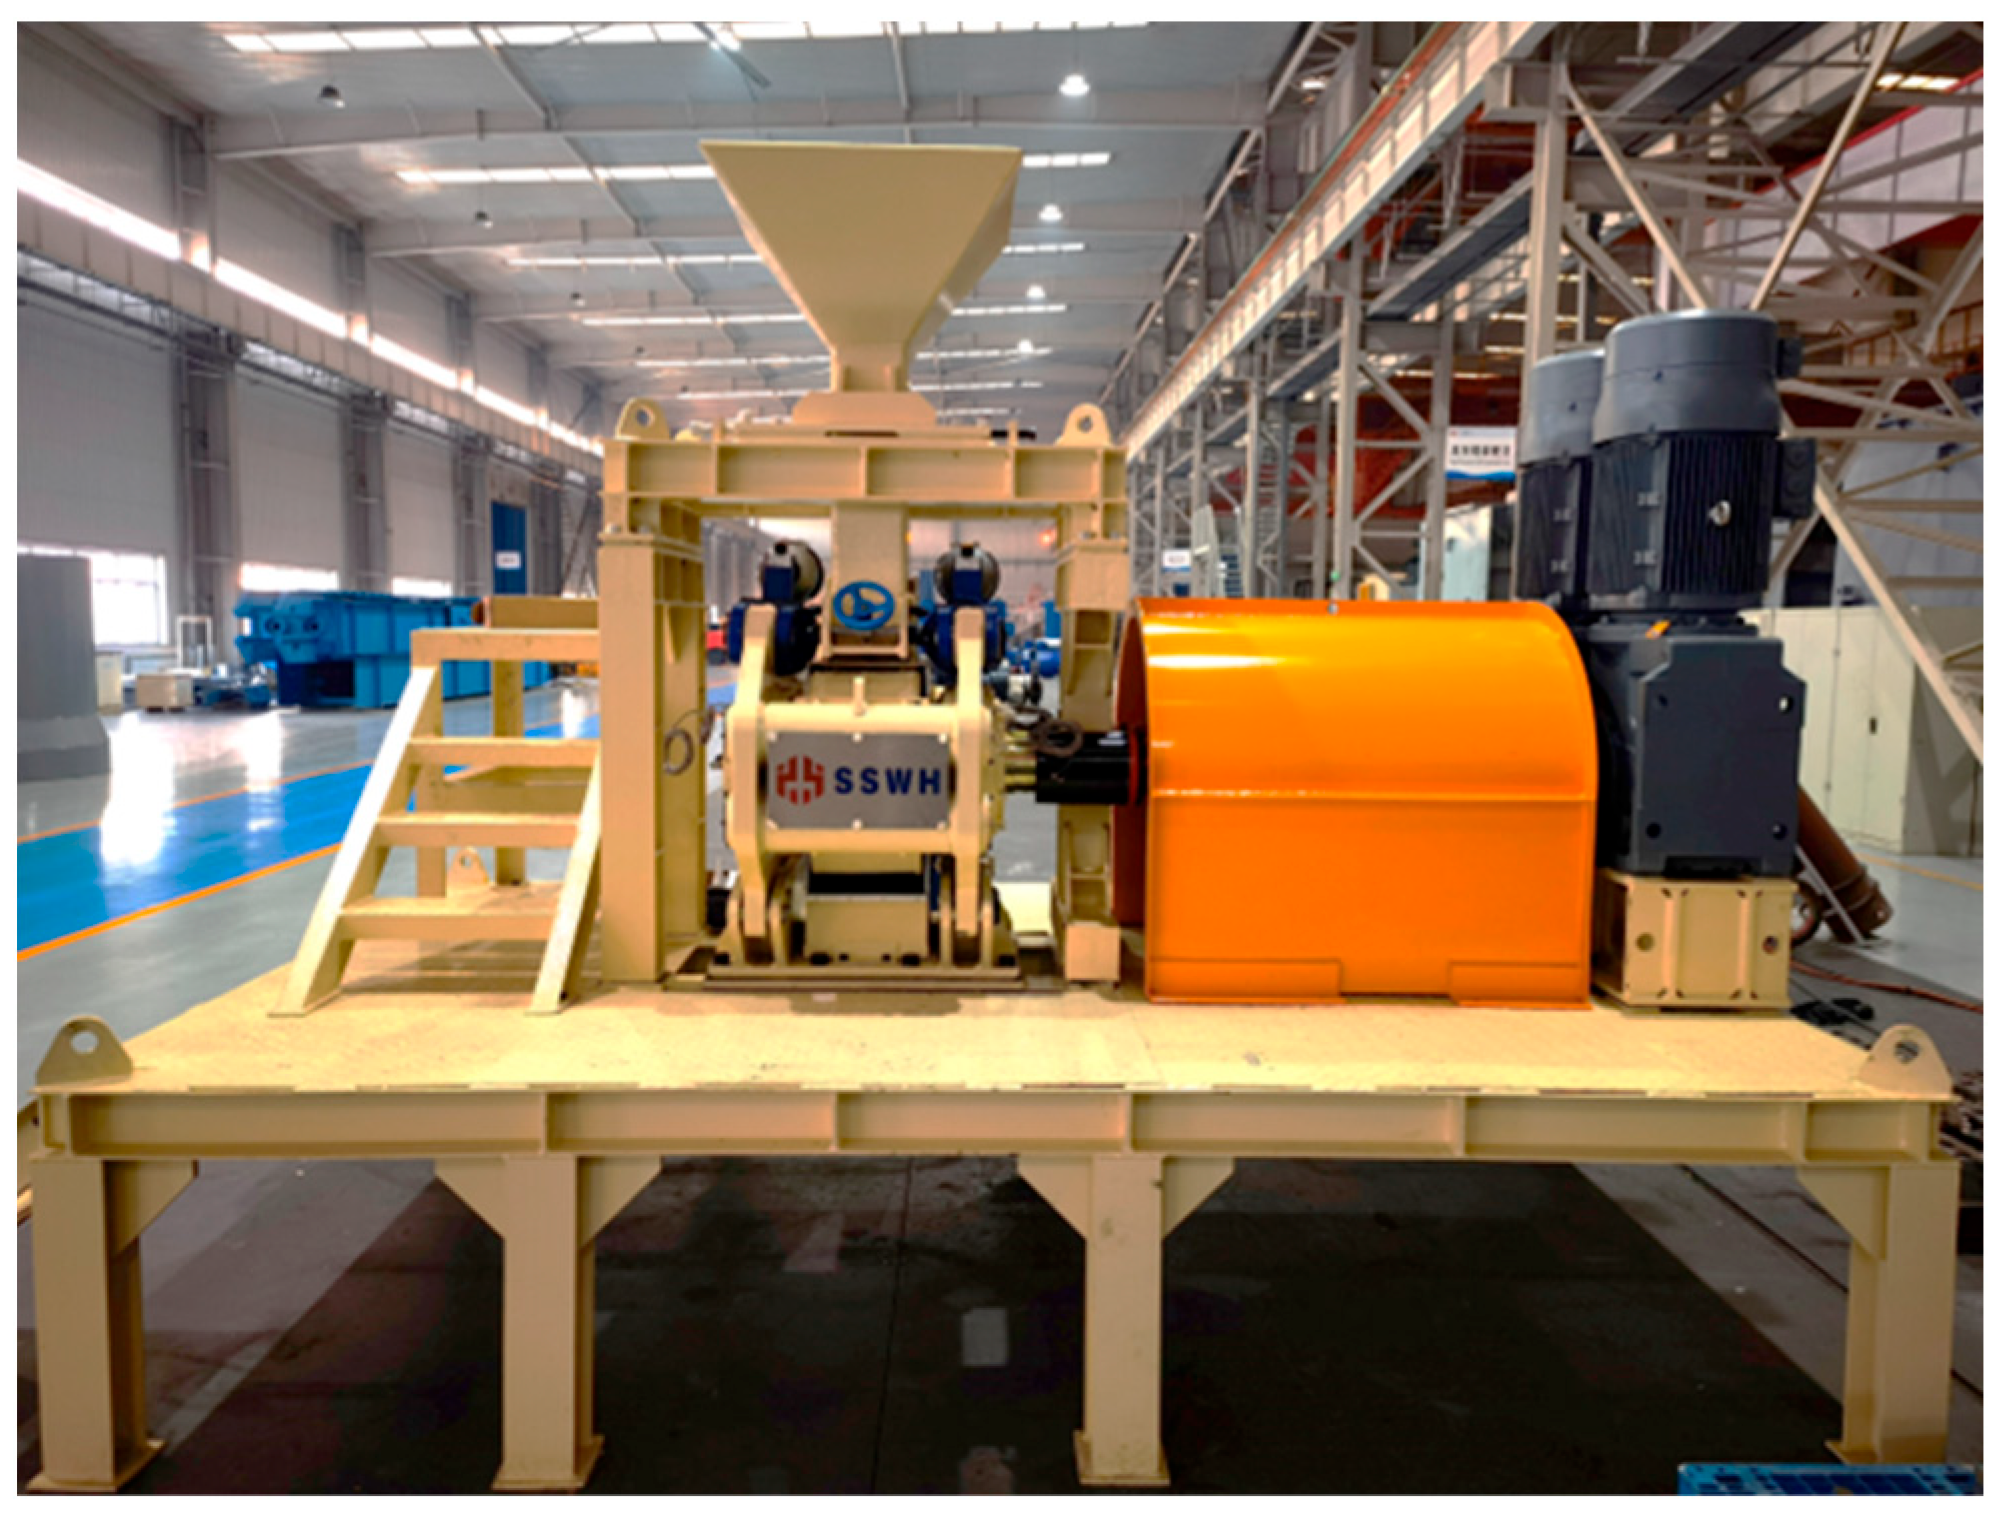
A laboratory-scale WGM-3516 HPGR (manufactured by Shenyang Shengshi Wuhuan Science and Technology Co., Ltd., Shenyang, China) (Figure 2) with a 350 mm roll diameter and 160 mm roll width and a roll speed of 0.4 m/s was used in the laboratory-scale tests. The specifications of the unit are listed in Table 3.
In each test, 25 kg of the ore sample was accurately weighed and utilized. Open-circuit tests were conducted at four specific pressures of 3.0, 3.5, 4.0, and 4.5 MPa, respectively. In closed-circuit tests, the ore sample was passed through the HPGR, followed by dry screening with a 1 mm screen size. The fresh feed and the oversize material were fed into the next cycle, where fresh materials were equal to the weight of the previous undersize fractions. This grinding and screening procedure was repeated gradually until the undersize weight was equal to the fresh feed in the same cycle. After about six locked cycles were performed, the −1 mm products of the last three cycles were combined, homogenized, and sampled for size analysis.

2.4. Industrial-Scale HPGR Tests

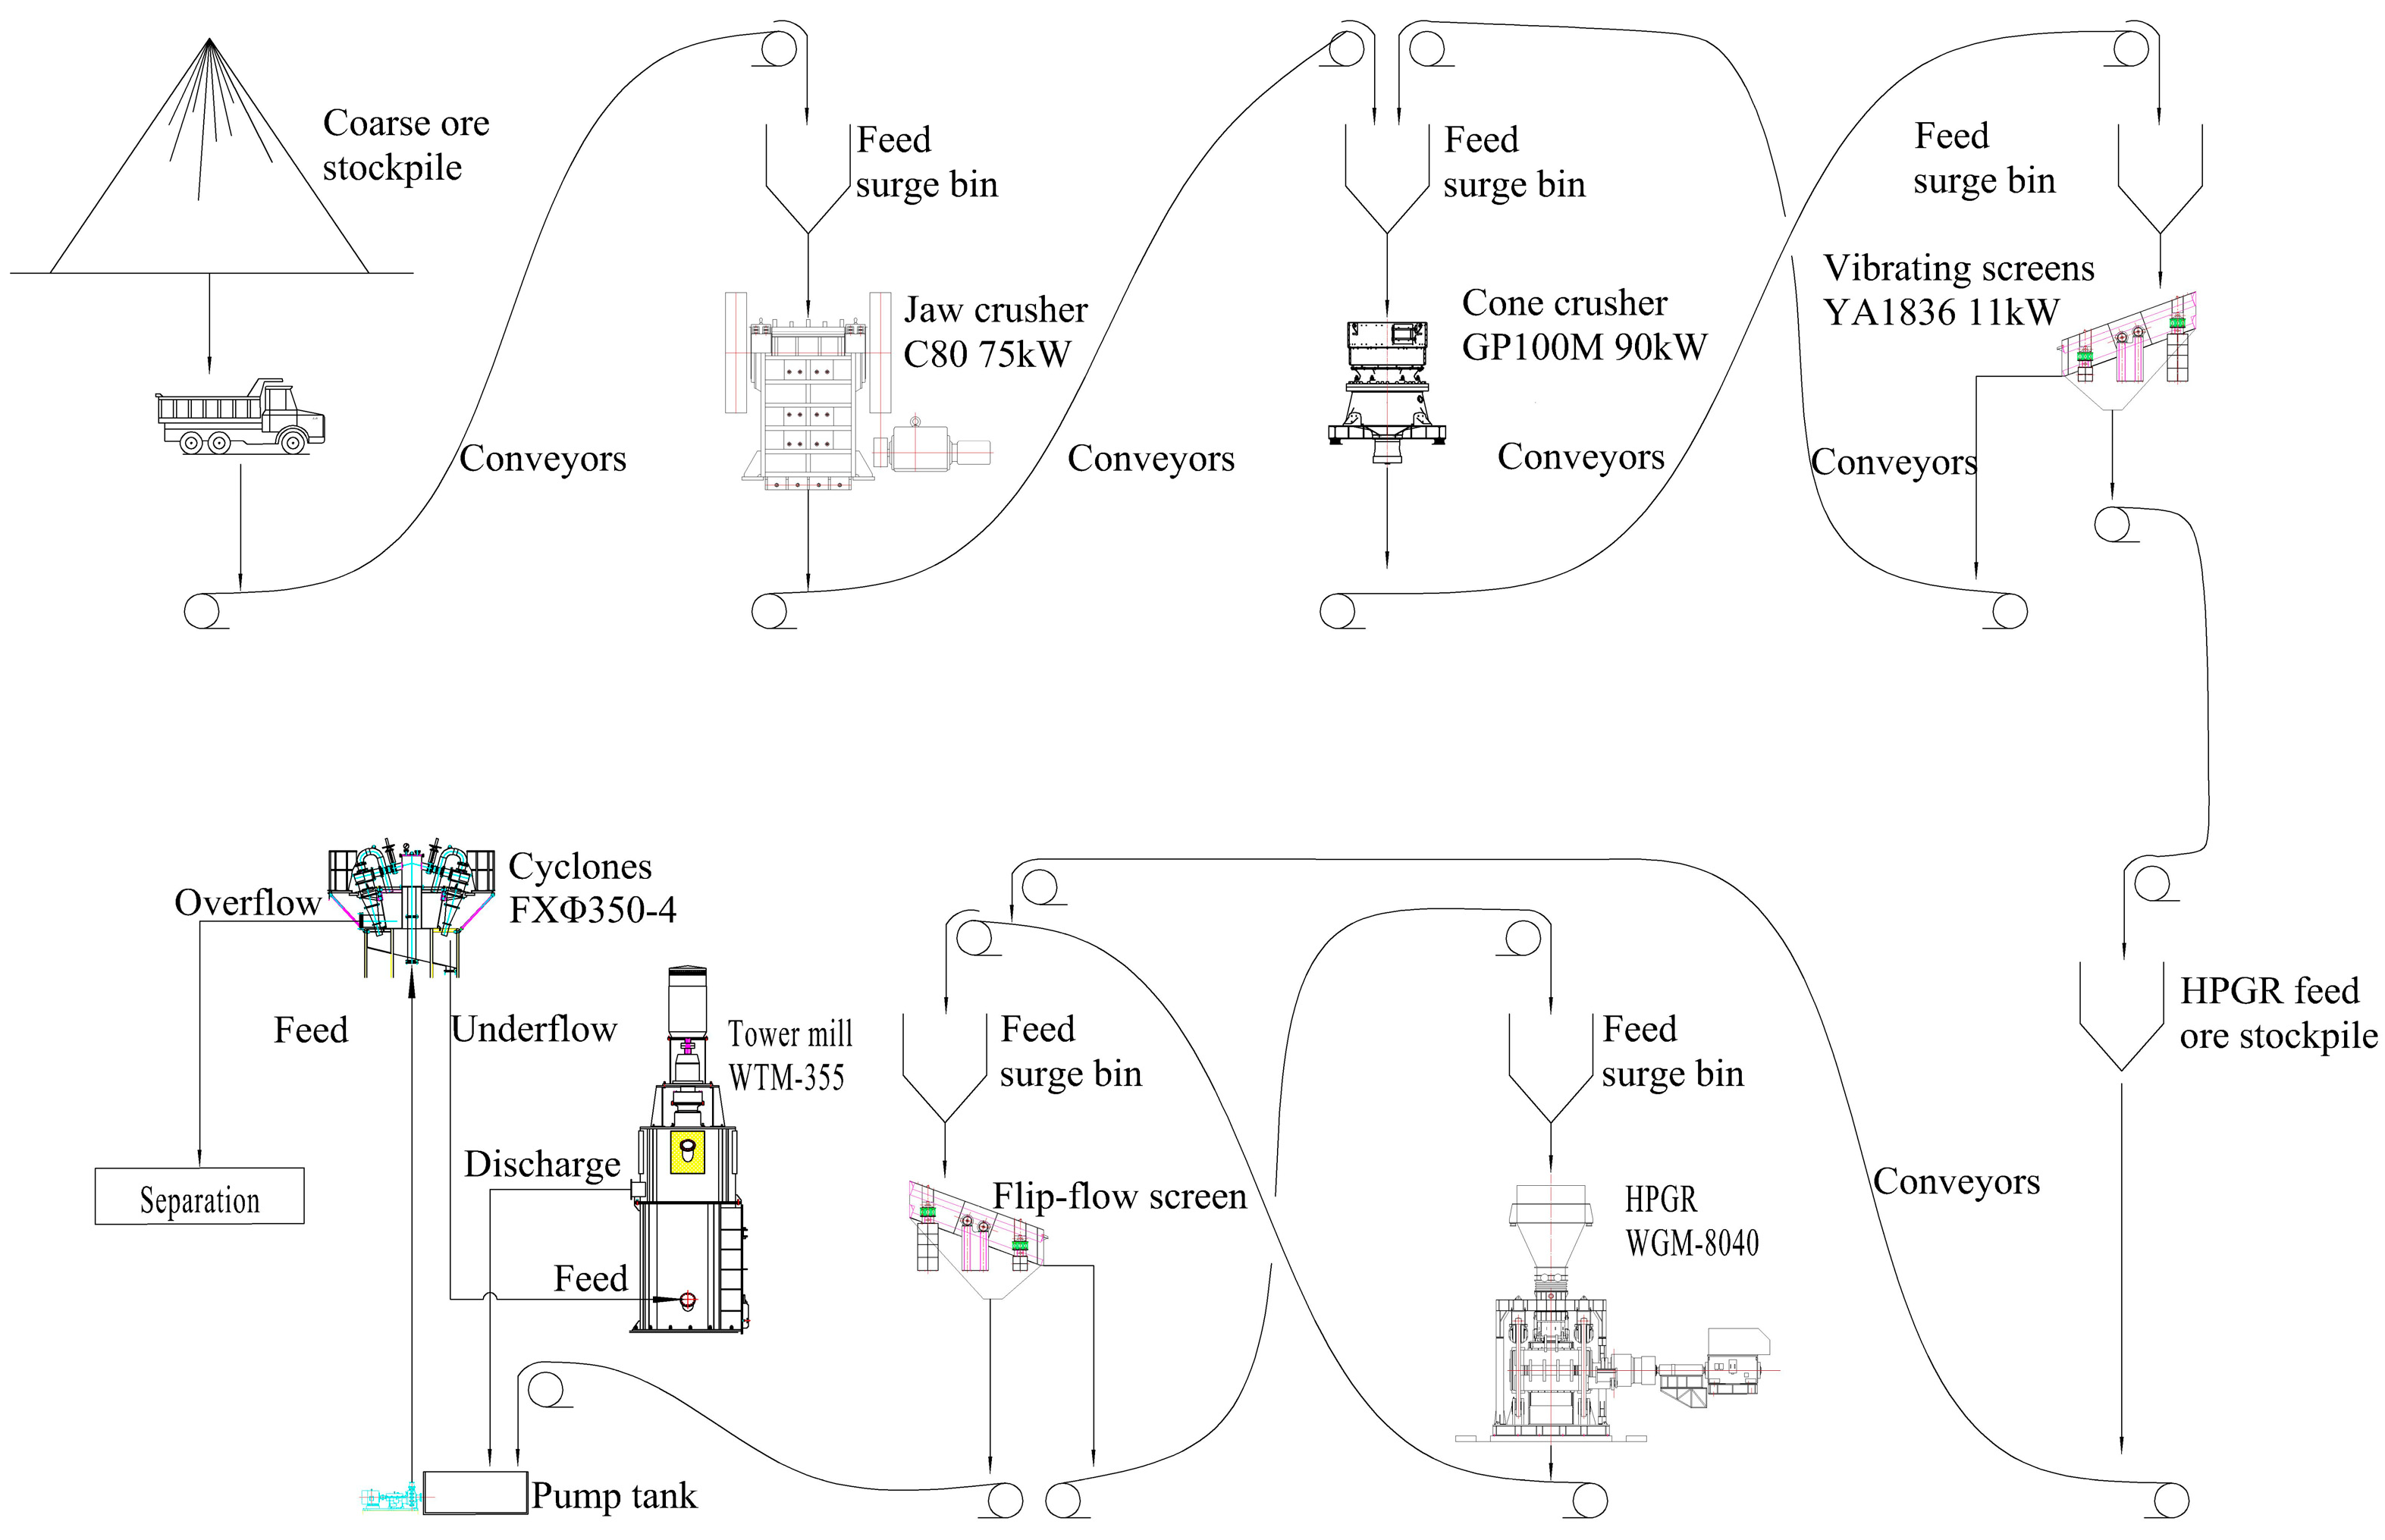
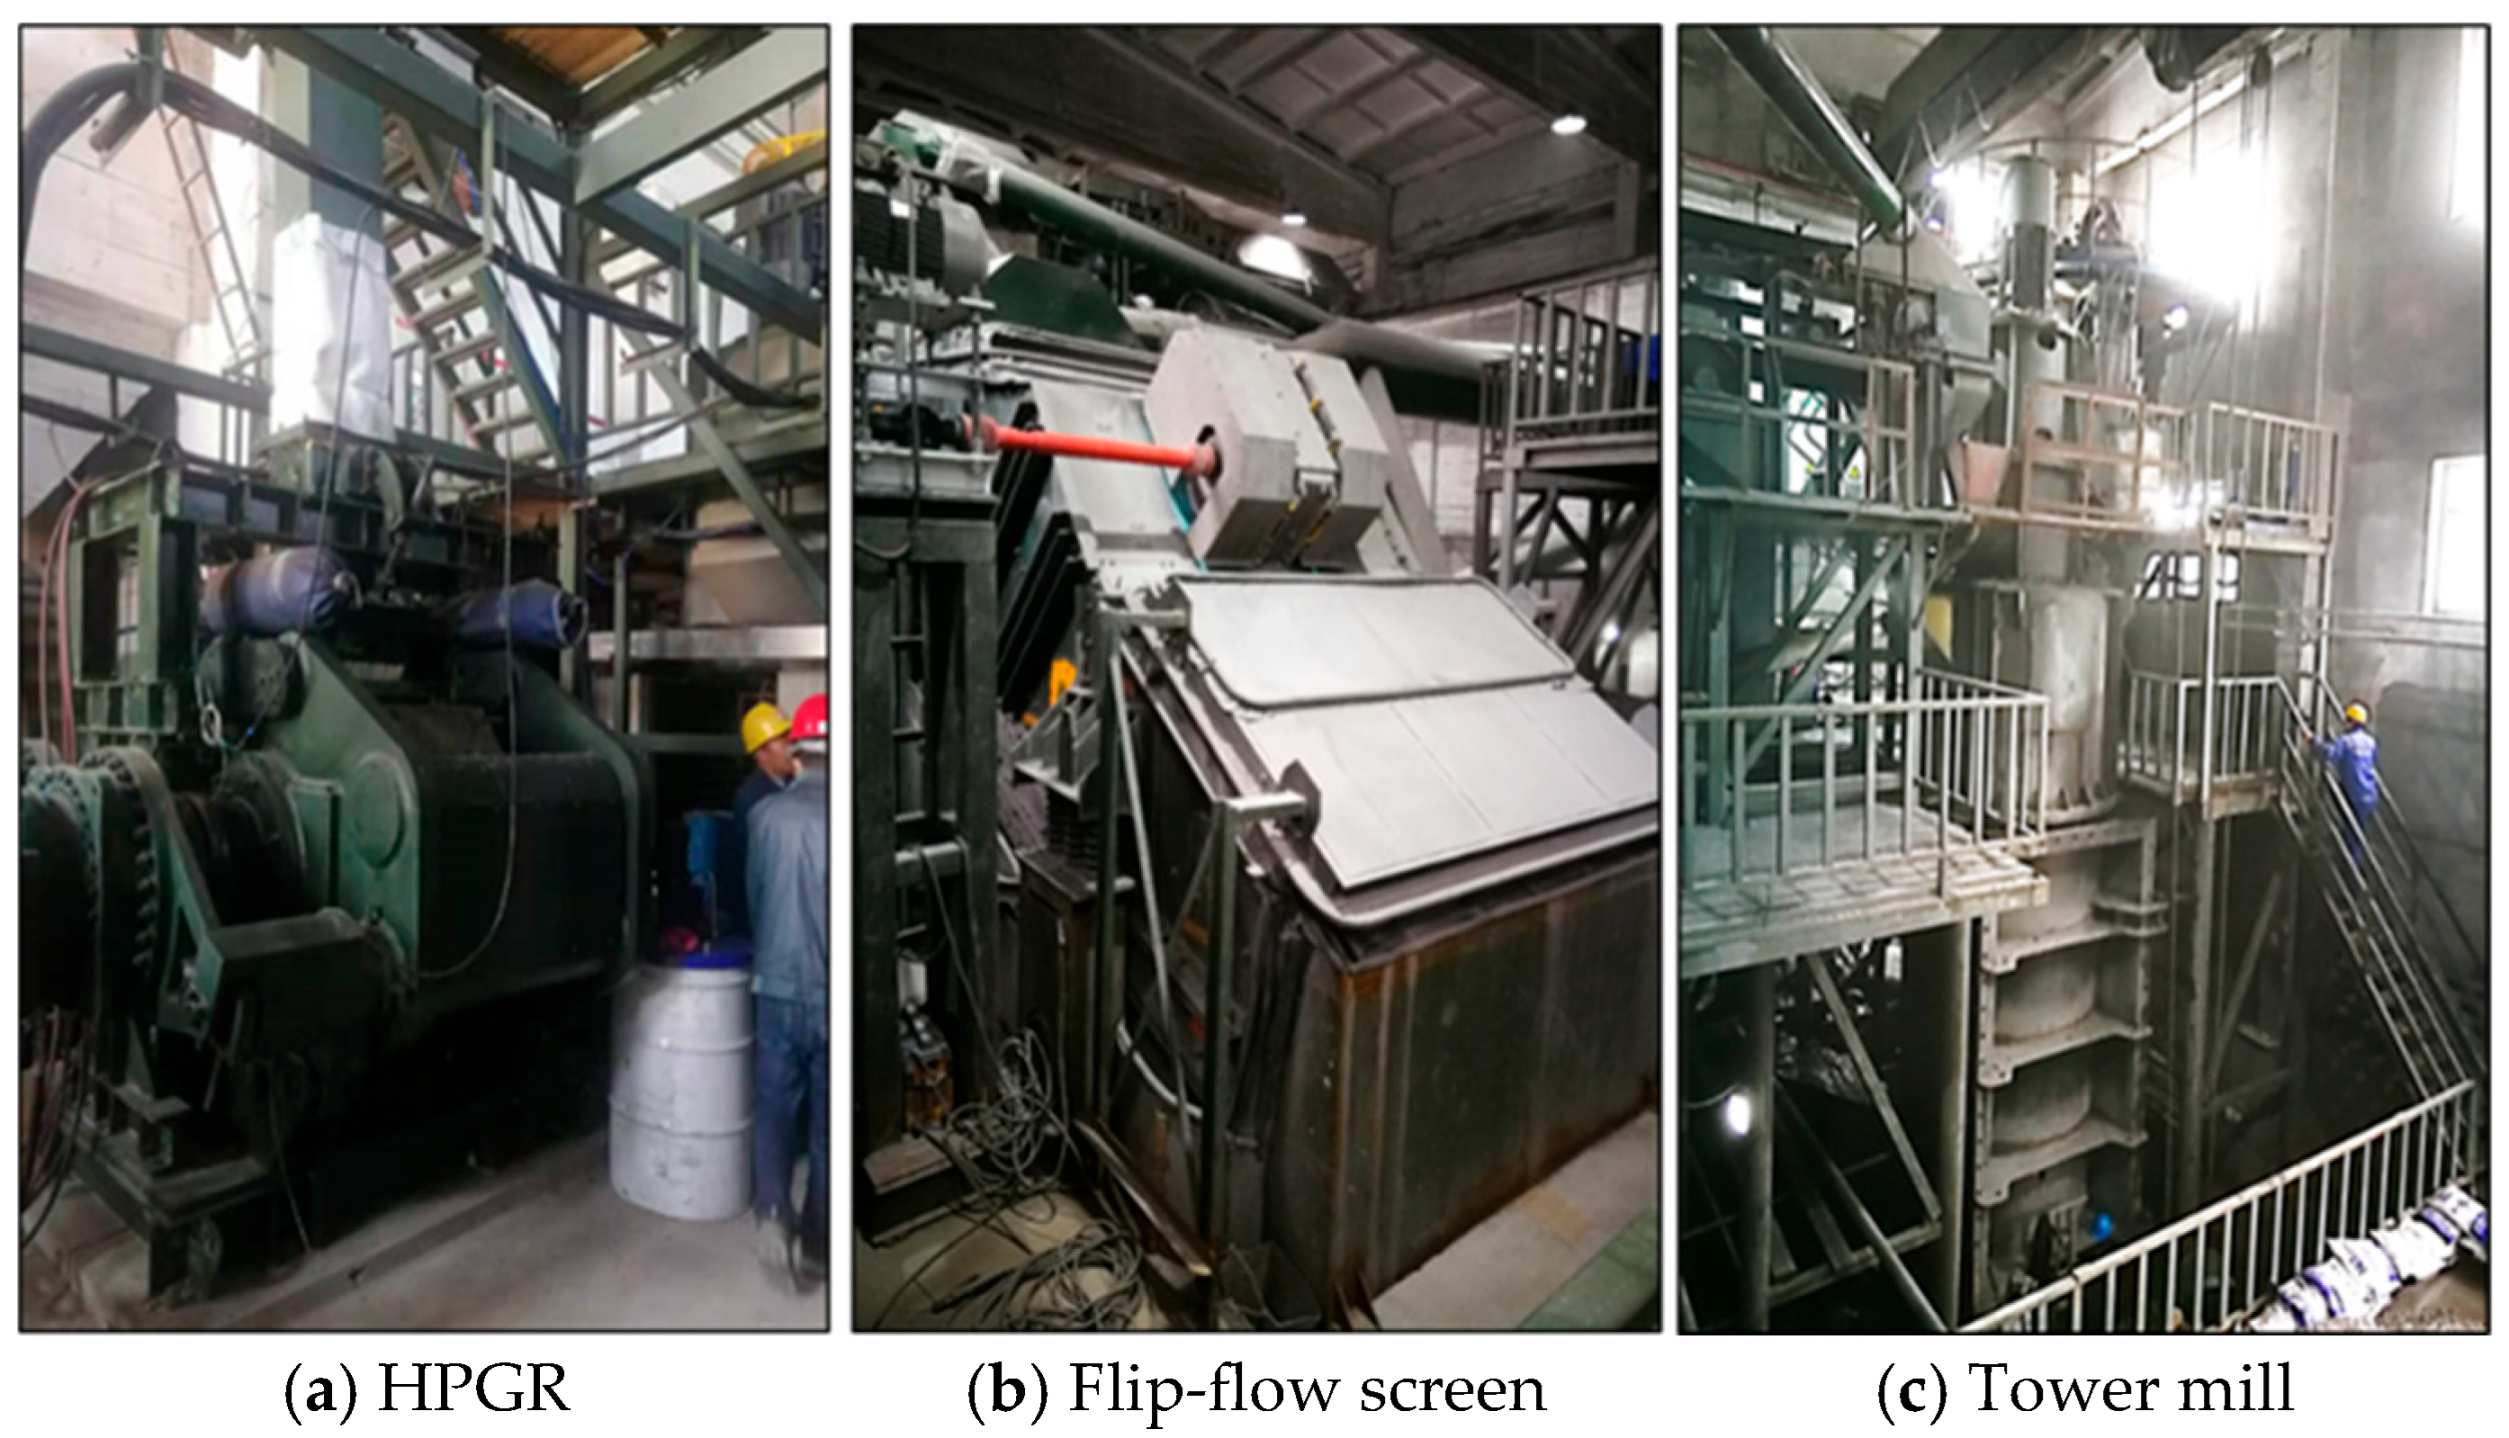
Industrial-scale HPGR tests were conducted at the Harbin Xiaoling iron–zinc mineral processing plant, utilizing an HPGR unit with a roll diameter of 800 mm and a roll width of 400 mm. The comminution circuit comprised several key components: a jaw crusher operating in an open circuit, a reverse-closed cone crusher paired with a circular vibrating screen, a closed HPGR circuit integrated with a vibrating flip-flow screen and a closed tower mill circuit equipped with hydrocyclones. The circular vibrating screen was used to achieve an aperture size of −12 mm for the HPGR feed, while the configured vibrating flip-flow screen produced an undersize product with 90% of particles measuring less than 1 mm. The flowsheet and main equipment are presented in Table 4 and Figure 3, and the industrial-scale HPGR, vibrating flip-flow screen, and tower mill are shown in Figure 4.
The jaw crusher, cone crusher and circular vibrating screen were supplied by Shunda Mining Group, located in Shenyang, China. The HPGR and Tower mill were manufactured by Shenyang Shengshi Wuhuan Science and Technology Co., Ltd., located in Shenyang, China. The vibrating flip-flow screen was provided by Selm Technology Co., Ltd, located in Shenyang, China. The cyclones and Cyclone feed pump were produced by HaiWang Hydro cyclone Co., Ltd., located in Weihai, China.
The comminution circuit incorporated a WGM-8040 HPGR unit, as illustrated in Figure 4a, featuring two studded rolls with a diameter of 800 mm and a width of 400 mm. Detailed specifications of the unit are presented in Table 5. When operated, the initial specific pressure and initial roll gap were set at 4.0 MPa and 8 mm, respectively. The HPGR’s key process operating parameters, such as hopper level, roll speed, working gap, hydraulic pressure, and fixed and floated power, were monitored and recorded by automatic systems.
The vibrating flip-flow screen, extensively employed for screening moist fine-grained minerals [26], as shown in Figure 4b, is composed of a screen frame, a floating screen frame, rubber shear springs, supporting springs, supporting frames, and elastic sieve mats [27]. The specifications of the unit are provided in Table 6.

3. Results and Discussion

3.1. Laboratory-Scale Tests

3.1.1. Open HPGR Circuit

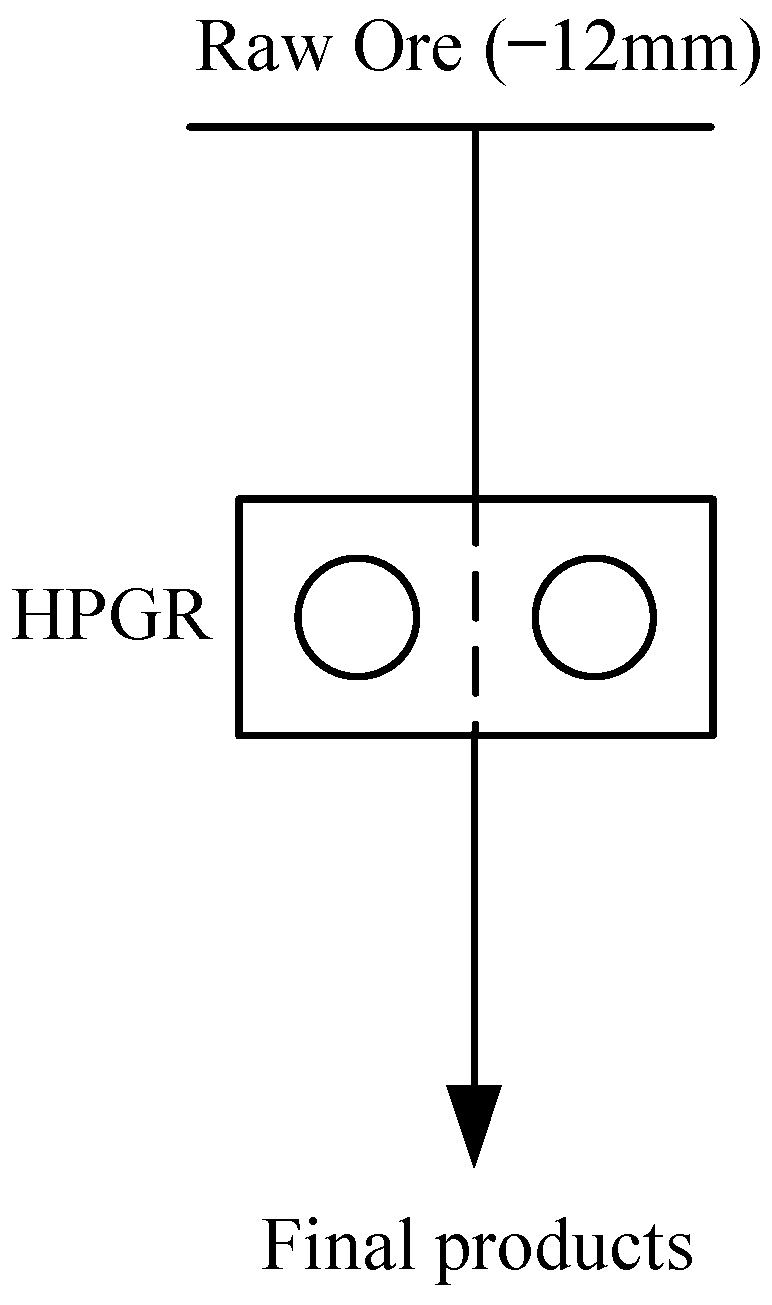
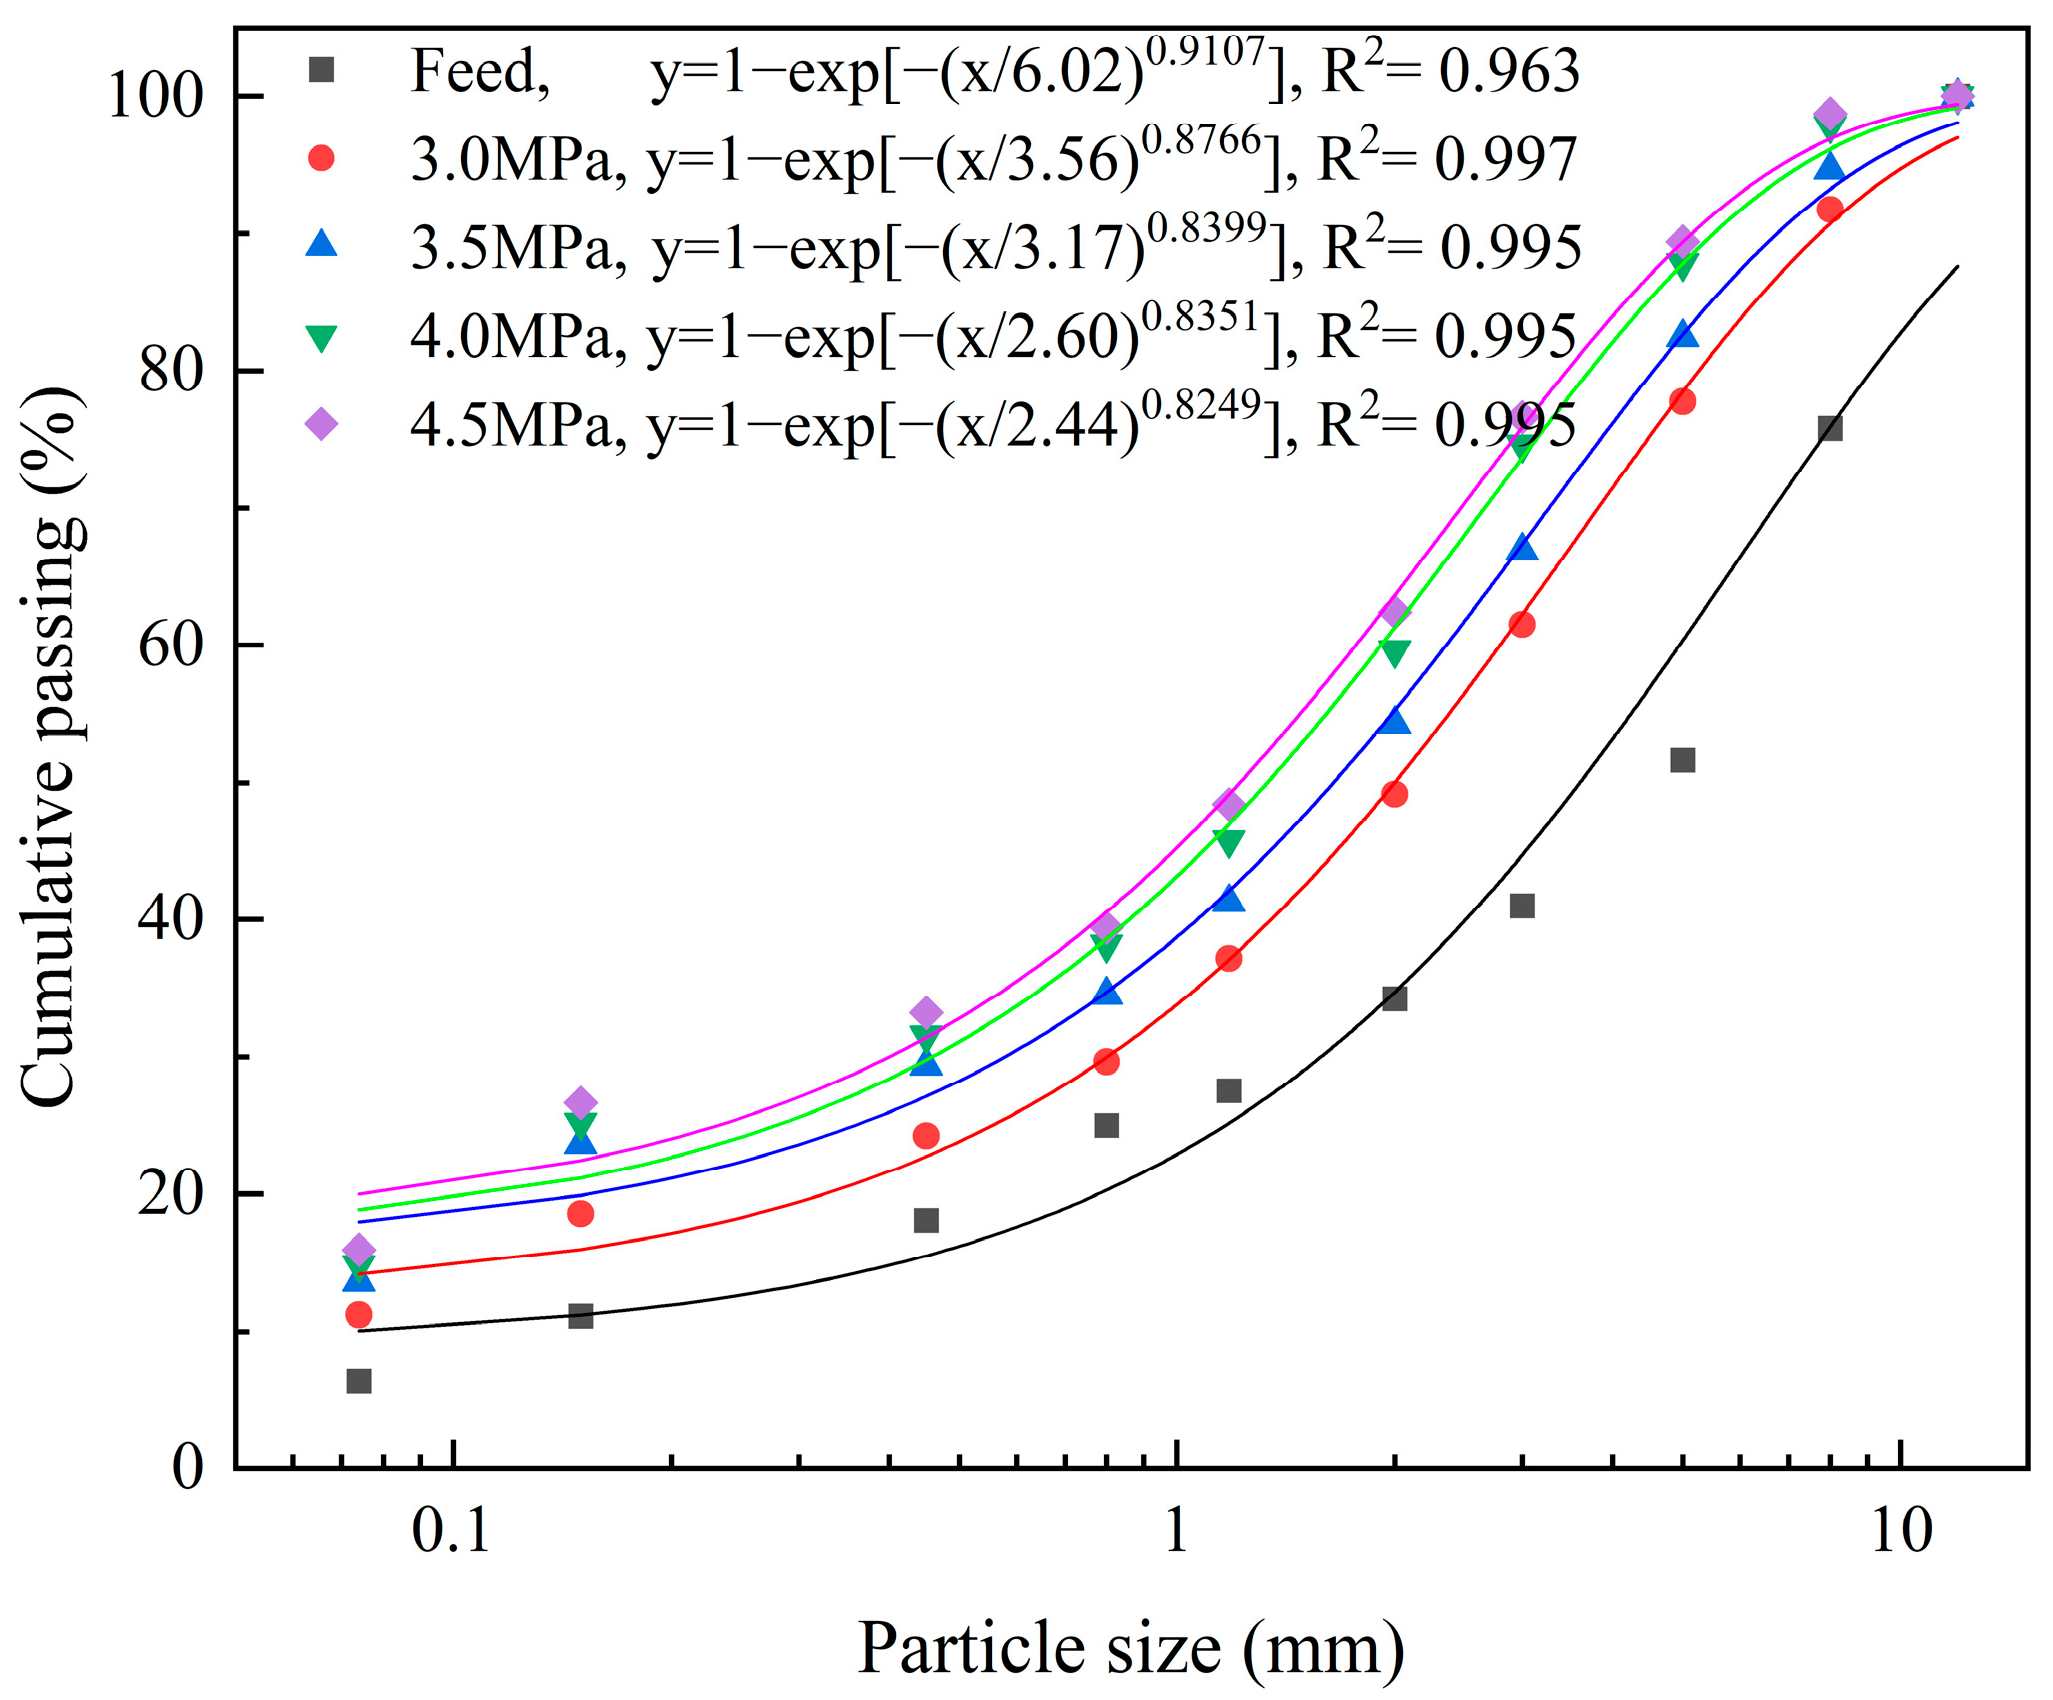
Specific pressure sensitivity tests were conducted under open-circuit conditions, as illustrated in Figure 5. Samples were comminuted by the HPGR at specific pressures of 3.0, 3.5, 4.0, and 4.5 MPa, and the feeding and product particle size distribution (PSD) at different specific pressures are presented in Figure 6 and Figure 7, respectively. For quantitative analysis of the PSD characteristics, the Rosin–Rammler distribution function [28], Equation (1), was employed to mathematically describe the PSD.
y = 1 e x p x x n
where y represents the cumulative percentage undersize mass fraction distribution function, and x denotes particle size (x ≥ 0). The parameter x′ corresponds to the characteristic particle size at which 63.1% of the particles pass through the sieve, serving as an indicator of the average particle size. The exponent n, known as the non-uniformity coefficient, quantifies the degree of particle size distribution (PSD) heterogeneity [28,29].
It is observed in Figure 6 and Figure 7 that size reduction occurred as the coarse fraction decreased and the fine portion increased. As specific pressure increased up to 4.0 MPa, the −12 + 8 mm fraction changed from 24.17% to 2.14%, with a net decrease of 22.03%; the −0.074 mm fraction changed from 6.35 to 14.84%, with a net increase of 8.49%; and the P80 changed from 9.14 mm to 3.40 mm, with a net decrease of 5.74 mm. As specific pressure continued to increase from 4.0 MPa to 4.5 MPa, the −12 + 8 mm fraction changed from 2.14% to 1.28%, with a net decrease of only 0.86%; the −0.074 mm fraction changed from 14.84% to 15.93%, with a net increase of 1.09%; and the P80 changed from 3.73 mm to 3.42 mm, with a net decrease of 0.31 mm.
As illustrated in Figure 7, the Rosin–Rammler function exhibited an excellent fit with the experimental data, demonstrating its capability to accurately describe and predict the particle size distribution (PSD) across various specific pressure levels. The analysis revealed that as the specific pressure increased from 3.0 MPa to 4.0 MPa, the characteristic particle size (x′) decreased significantly from 3.56 mm to 2.60 mm. However, a further increase in specific pressure to 4.5 MPa resulted in only a marginal reduction in average particle size, from 2.60 mm to 2.44 mm. Concurrently, the non-uniformity coefficient (n) showed a slight decrease from 0.9107 to 0.8246 as the specific pressure increased from 3.0 MPa to 4.5 MPa, indicating a marginally wider PSD. This wider PSD can be attributed to the generation of finer particles, despite the reduction in coarse particles. The parameters of the Rosin–Rammler function consistently demonstrated that higher specific pressures lead to smaller average particle sizes and more uniform particle size distributions.
In mineral comminution processes, one of the most critical parameters is the mass-specific comminution energy (ESE) associated with t10, which is defined as the cumulative mass percentage of the product passing 1/10th of the initial feeding size [30]. In this study, the net specific energy (ENSE) for the HPGR operating in the open comminution circuit was calculated as the power input integrated over the grinding time (t) and divided by the mass of feeding (m) [31], as shown in Equation (2).
E N S E = P G P N m
where ENSE is the net specific energy (kWh/t), PG is the gross power draw (kW), PN is the no-load power draw (kW), and m is the dry mass of HPGR feed (t/h).
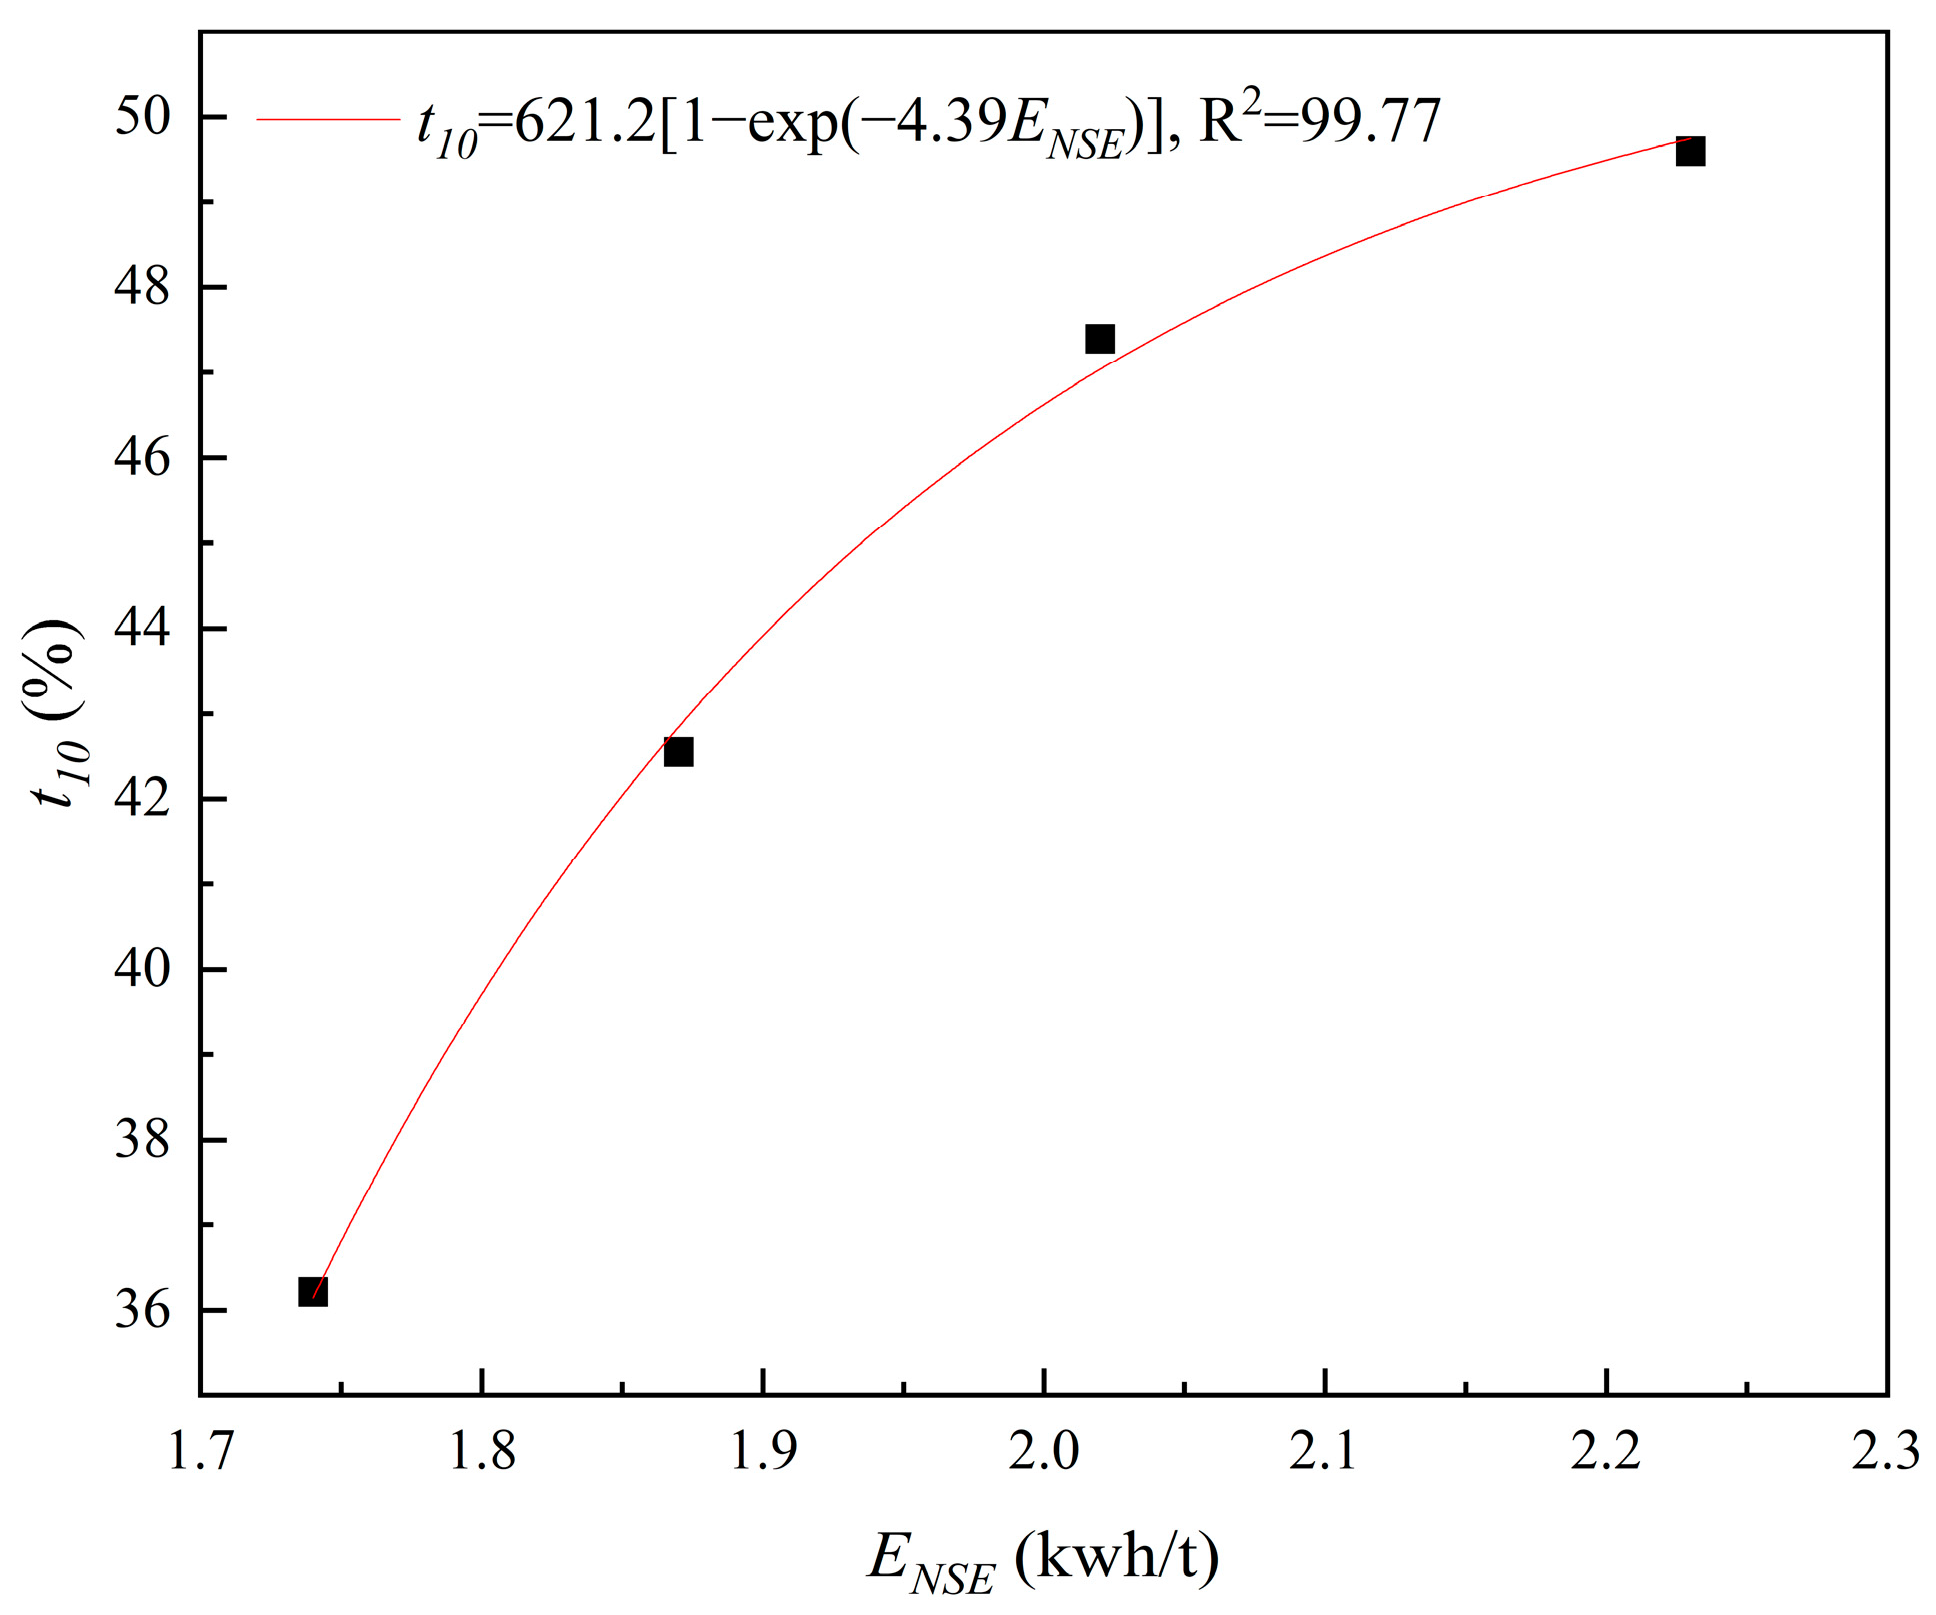
Figure 8 displays the trends in t10 and Esc at four specific pressure levels. At specific pressures of 3.0 MPa, 3.5 MPa, 4.0 MPa, and 4.5 MPa, the corresponding t10 values were 36.22%, 42.55%, 47.4%, and 49.6%, respectively, while the Esc values were 1.74, 1.87, 2.02, and 2.23, respectively. It is evident that when the specific pressure exceeded 4.0 MPa, the rate of the increase in t10 slowed significantly, whereas the ENSE showed a notable rise. Regarding the relationship between specific pressure and Ecs, further increasing the specific pressure led to an increase in the HPGR shaft torque, which subsequently increased the total power drawn from the motor [32].
A quantitative relationship exists between comminution energy and the particle size of breakage products in the comminution process [33]. In this study, the modified Weibull distribution model (Equation (3)) [34] was employed to describe the breakage index t10 (%) in relation to the mass-specific impact energy, presented in Figure 9.
t 10 = M 1 e x p f m a t · X · E N E S E m i n
where M (%) represents the maximum t10 for a material subject to breakage, X (m) is the initial particle size, ENES (J kg−1) is the mass-specific impact energy, and Emin (J kg−1) is the threshold energy.
As depicted in Figure 9, the high R2 value indicates that the model provides an excellent fit to the experimental data. When the net specific energy exceeded 2.02 kWh/t (corresponding to a specific pressure of 4.0 MPa), the growth rate of t10 (i.e., the slope of the curve in the plot) decreased significantly.
In related studies, refs. [35,36,37] observed the same phenomenon during interparticle breakage tests and attributed the fracture kinetics to a distinct feature of the interparticle breakage mechanism. As the specific pressure increases, due to the gradual filling of void spaces in the bed of particles by fine-produced particles and as a result of the absence of any void space, the hydrostatic state is reached in the bed, and breakage comes to a “halt” [36].
To sum up, increasing the specific pressure from 3.0 MPa to 4.0 MPa resulted in efficient size reduction. However, when the specific pressure exceeded 4.0 MPa, the rate of size reduction diminished significantly, while the specific energy consumption increased sharply. Therefore, a specific pressure of 4.0 MPa was selected for the subsequent closed-circuit operations.

3.1.2. Closed HPGR Circuit

Instead of an open HPGR circuit, a closed HPGR circuit incorporating classification (screening) is employed to provide a defined product with a fixed top size and a higher fines content [5]. From an energy efficiency perspective, if the feed contains minimal material of final product size, it is generally more advantageous to feed it directly to the HPGR, as the classifying device would otherwise return all material to the HPGR, placing unnecessary load on the screen. Conversely, if the feed contains a significant amount of fines and the classification process is efficient, pre-classifying the material can be beneficial. In this study, given that approximately 30% of the fresh feed consisted of a minus 1 mm fraction, as shown in Figure 7, a reverse comminution circuit was recommended.
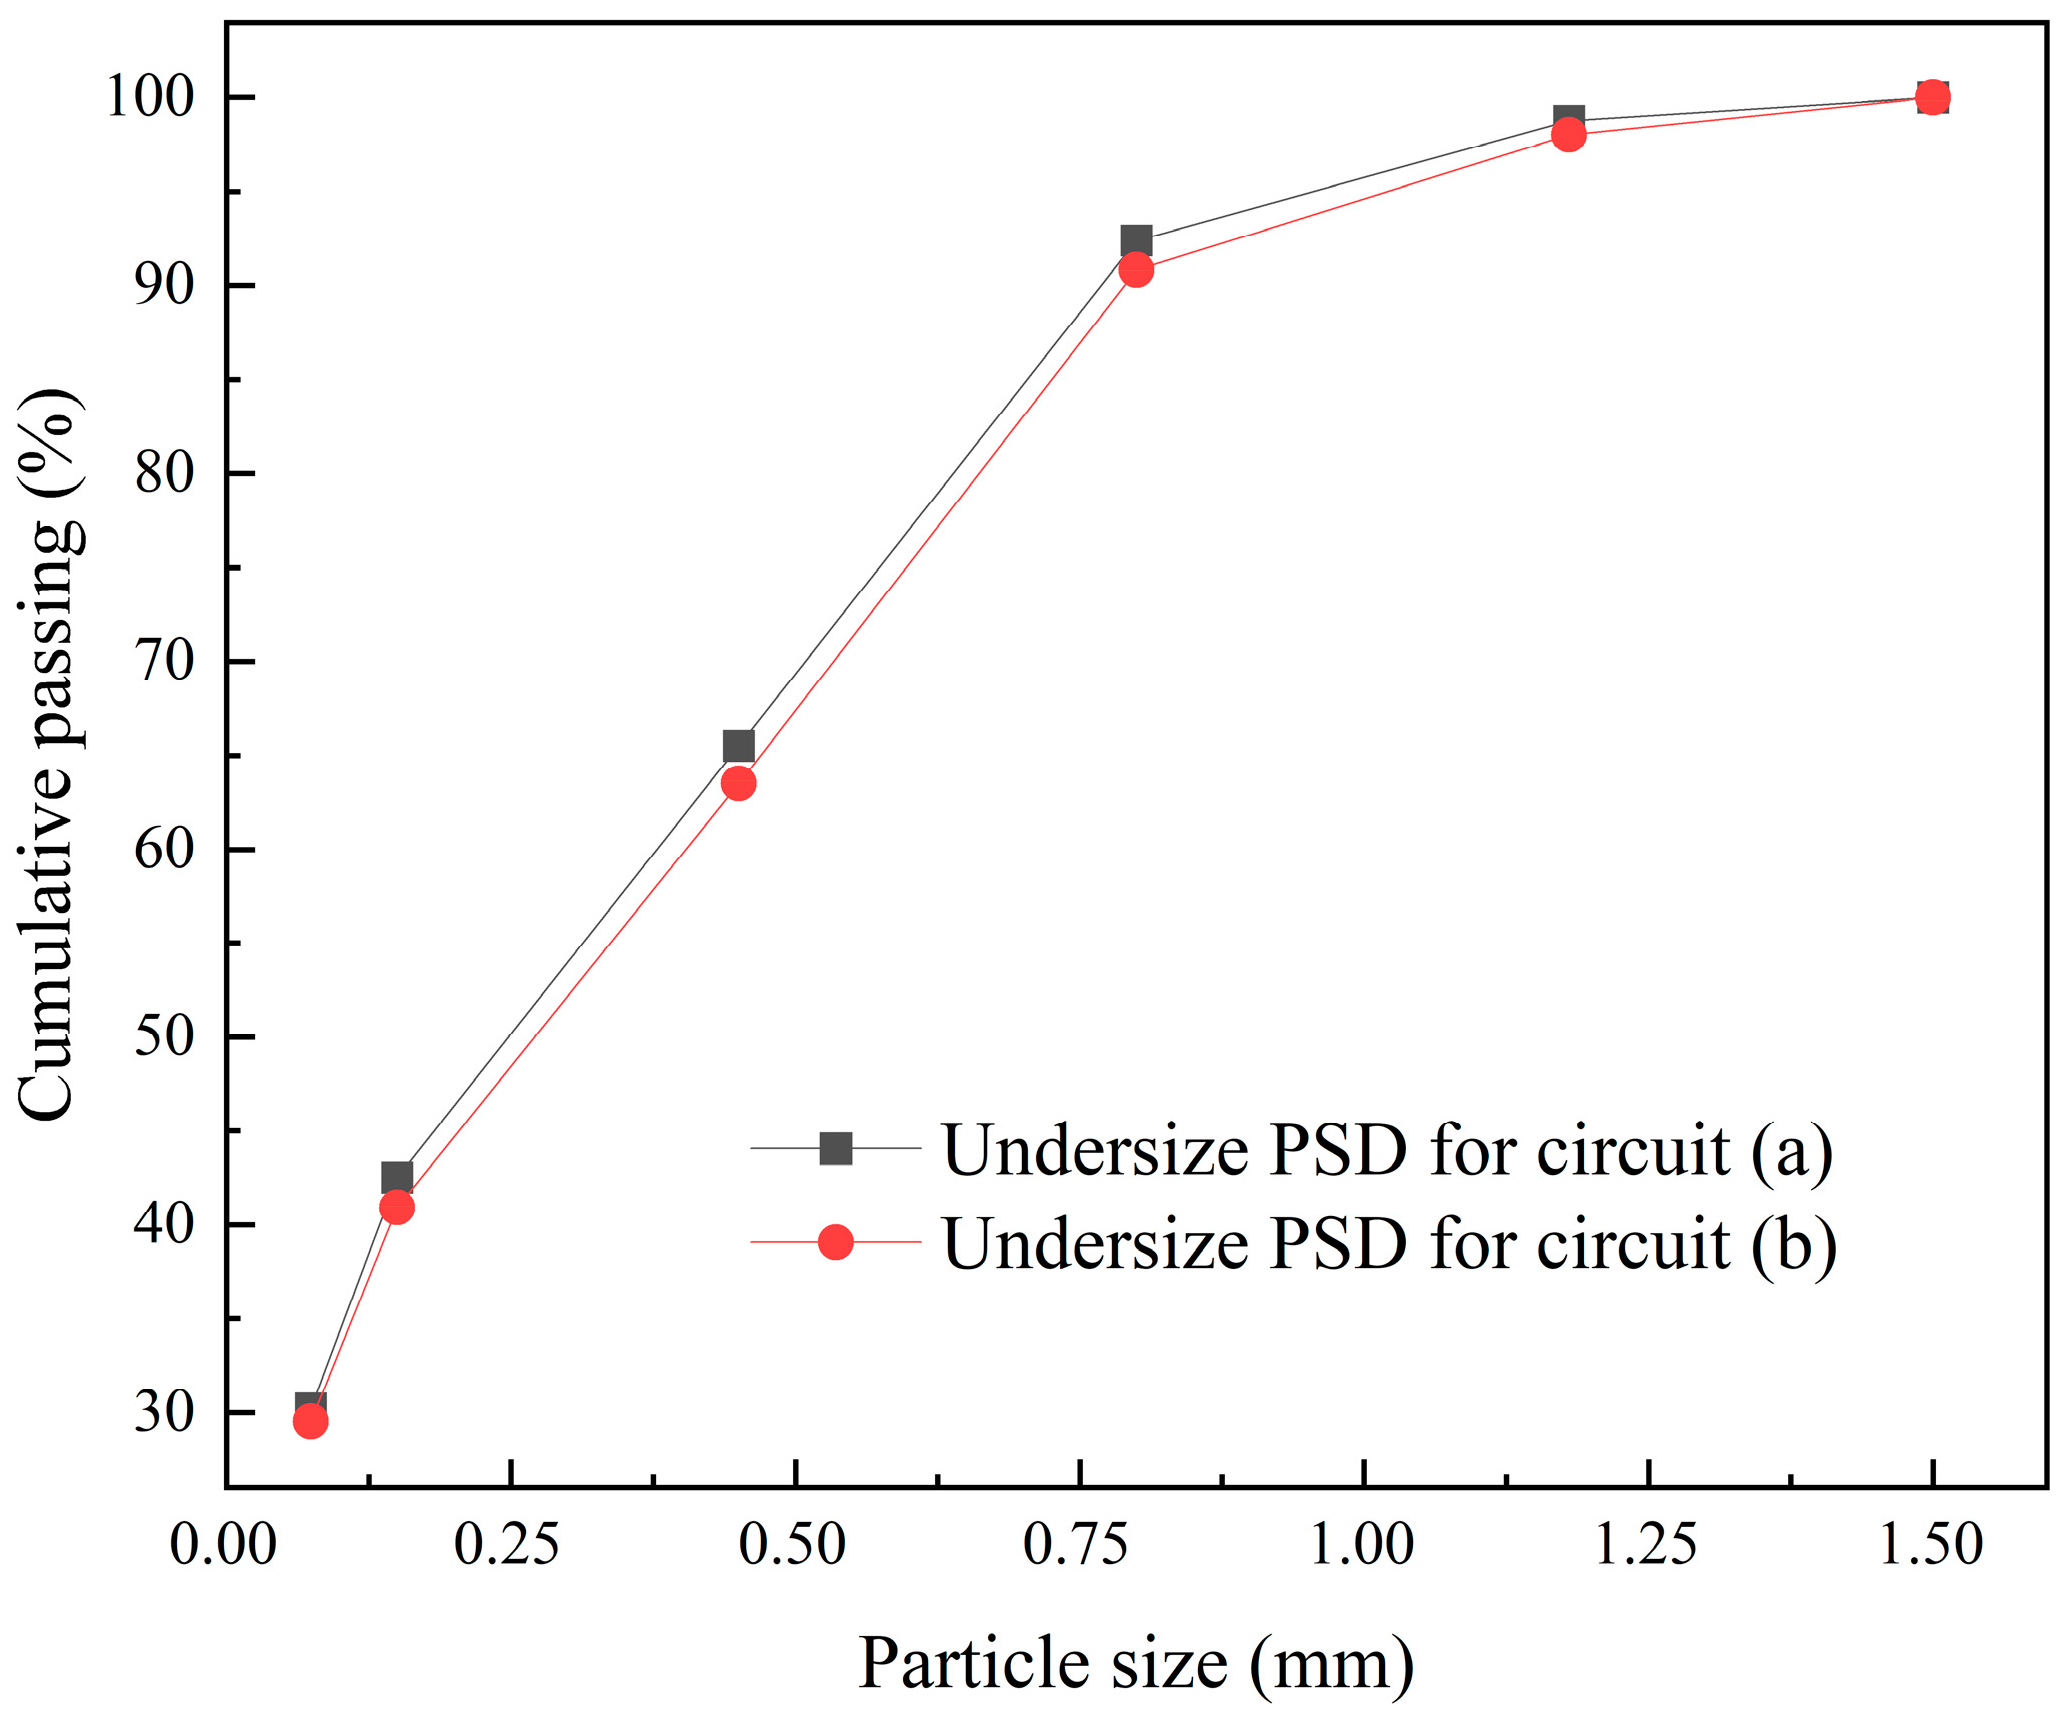
Figure 10 illustrates the mass balance of the two closed HPGR circuit configurations: (a) forward classification, where the fresh feed is directed straight to the HPGR, and (b) double classification, combining both scalped and reverse classification, where the fresh feed is first sent to the screen [38]. PSDs of the undersize for closed HPGR circuit tests are presented in Figure 11.
As shown in Figure 10, the double classification configuration (Figure 10b) demonstrated significant advantages over the forward classification case (Figure 10a). Specifically, the recycling load decreased by 30.84%, from 96.45% to 65.61%, and the throughput was reduced by 58.41%, from 196.45% to 138.08%, due to 27.53% of fine material bypassing the HPGR. Additionally, Figure 11 reveals that the P80 of the undersize material was 0.64 mm for the forward classification circuit and 0.66 mm for the double classification circuit, indicating no significant difference in product fineness.
The results presented in Figure 10 and Figure 11 suggest that scalping the feed can reduce the required HPGR size, lower capital costs, and decrease comminution energy consumption by removing a portion of fines from the HPGR feed. Therefore, reverse classification was selected for the subsequent industrial tests.

3.2. Industrial Test Results

Attempts at improving comminution machines have generally been directed towards increasing performance efficiency, particularly increasing the throughput rate and reducing energy consumption [39]. Throughput stands as a pivotal metric for assessing comminution circuits, directly influencing both energy consumption and the economic efficiency of beneficiation plants. As mentioned earlier, few studies exist on the HPGR/tower mill comminution circuit, and there is still a lack of assessment of capacity.
Furthermore, within the HPGR/tower mill comminution circuit, the HPGR-crushed product sizing (−1 mm) presents a significant caking tendency. To mitigate this issue, no surge bin will be placed between the HPGR and the tower mill, and the upstream HPGR throughput will be adjusted according to the downstream tower mill’s capacity. Consequently, investigating the impact of feed rate on HPGR and flip-flow screen performance becomes imperative.
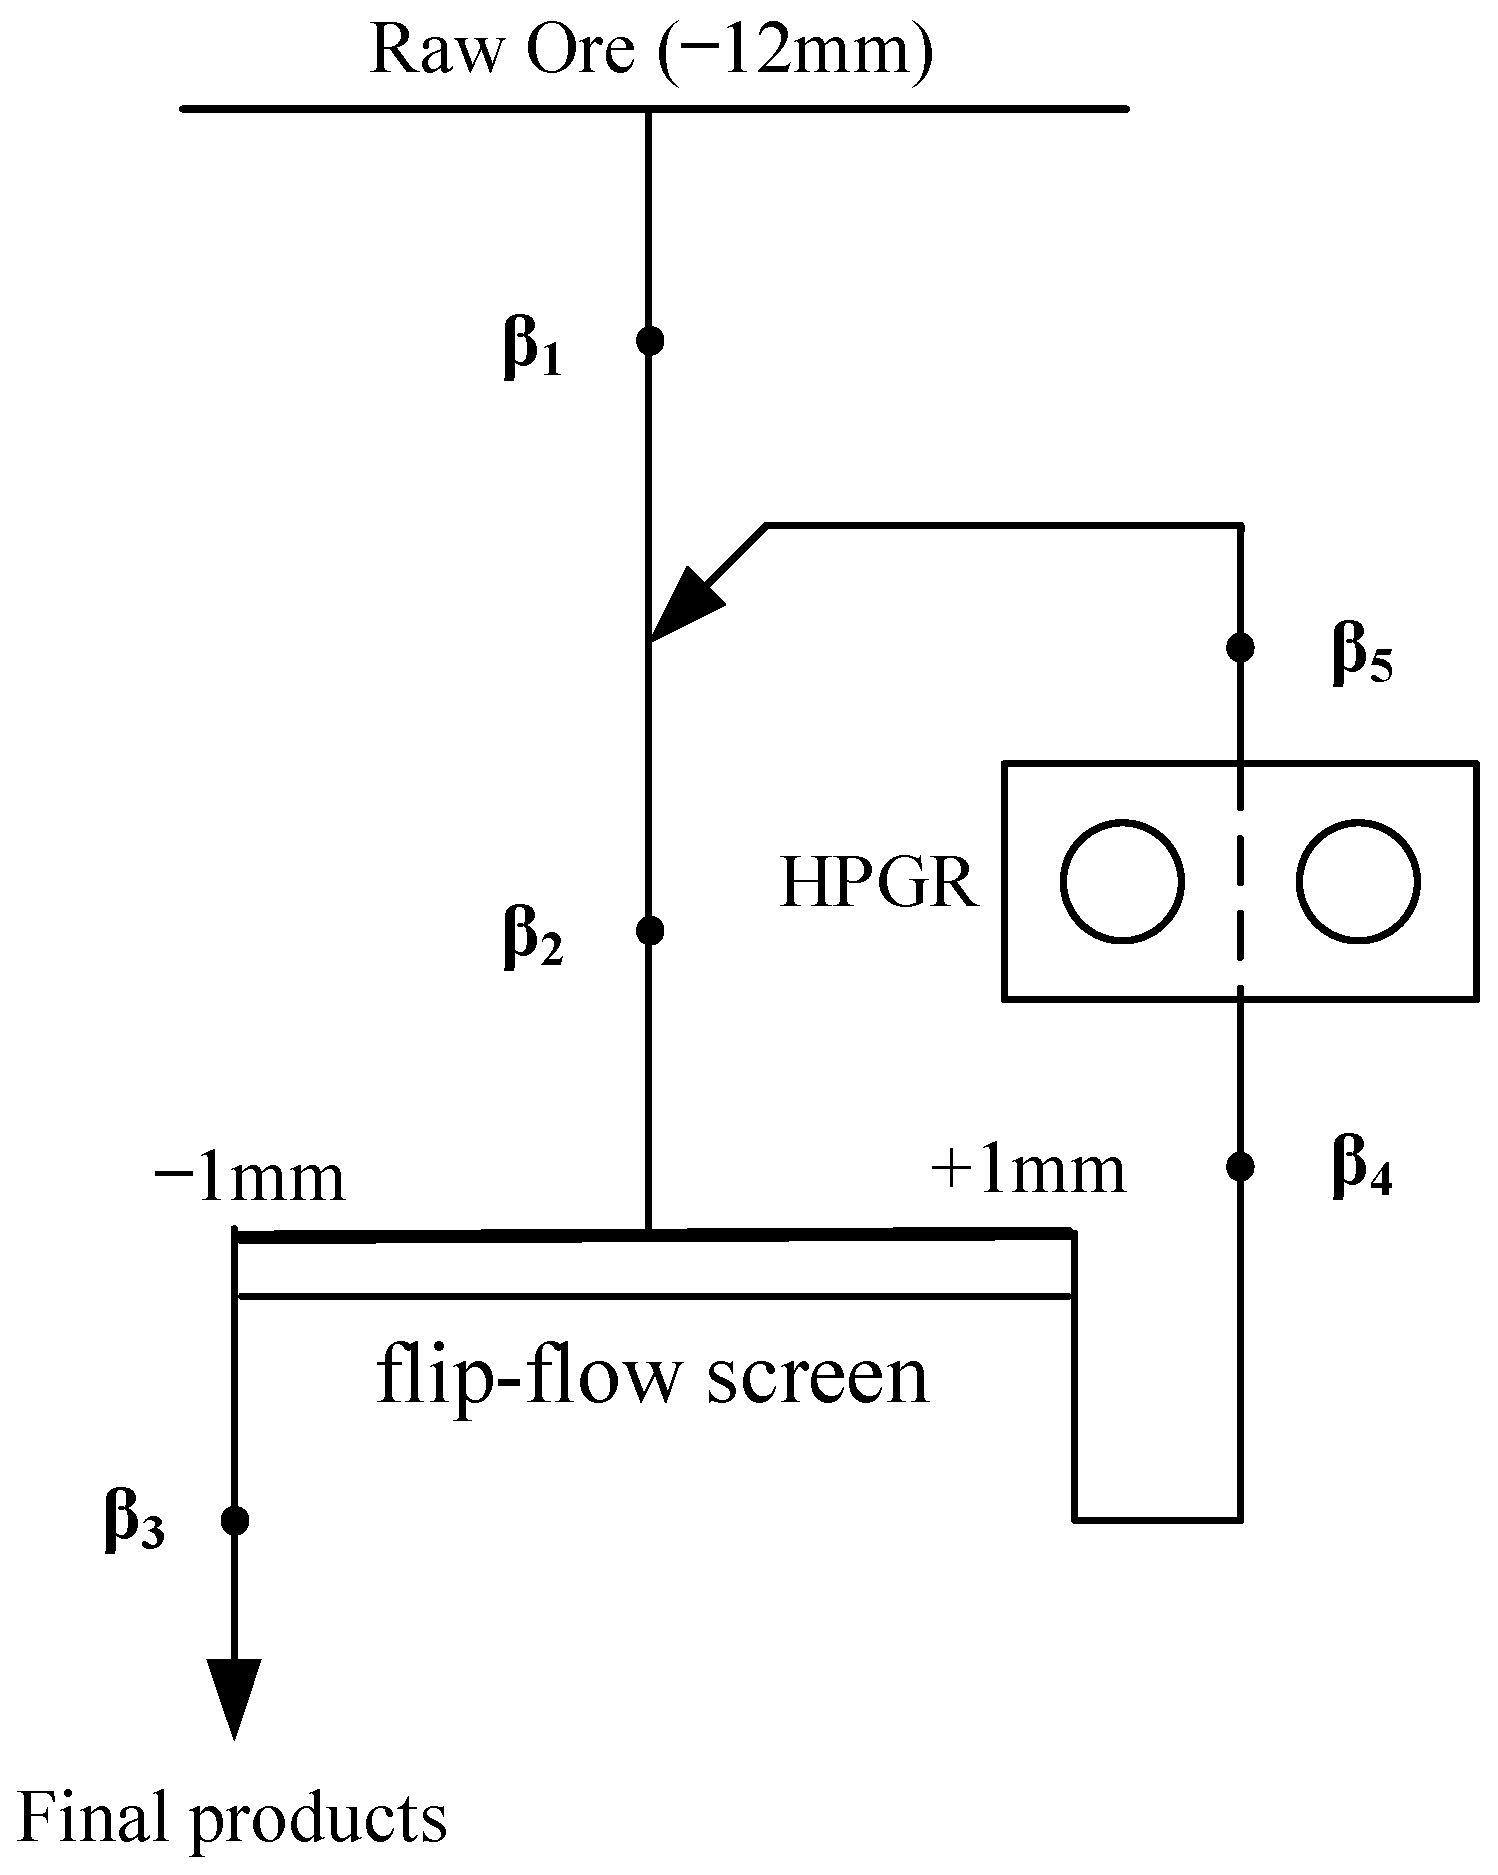
In the industrial test, the fresh-feed rate of the HPGR was regulated using a disc feeder. At disc feeder frequencies of 35, 40, 45, 50, 55, and 60 Hz, the corresponding fresh-feed rates were 18.98, 21.67, 24.38, 27.08, 29.79, and 32.50 tones per hour (tph), respectively. The industrial-scale circuit configurations and sampling positions are illustrated in Figure 12.
In closed HPGR circuit configurations, the total feed to the HPGR consists of fresh feed and recycled coarse material from the overflow of the flip-flow screen. However, in practice, due to the particle size characteristics and the limited screening time, fine particles cannot be fully separated into the underflow. Therefore, screening efficiency is used to characterize the actual screening performance [40].
The screening efficiency (E), recycled load (C), and HPGR throughput (Q4) can be expressed in terms of the measured undersize mass fractions in each stream and calculated using Equations (4)–(6) [41].
E = β 2 β 4 β 2 ( 1 β 4 )
C = 1 β 1 E β 5 E
Q 4 = C Q 1
where β2 and β4 represent the proportions of screen underflow for the 1 mm aperture screen in the feed and overflow for the flip-flow screen, respectively. β1 and β5 represent the proportions of screen underflow for a 1 mm aperture screen in the fresh feed and the comminution product of the HPGR, respectively, as shown in Figure 12. Q1 represents the HPGR fresh-feed rate.
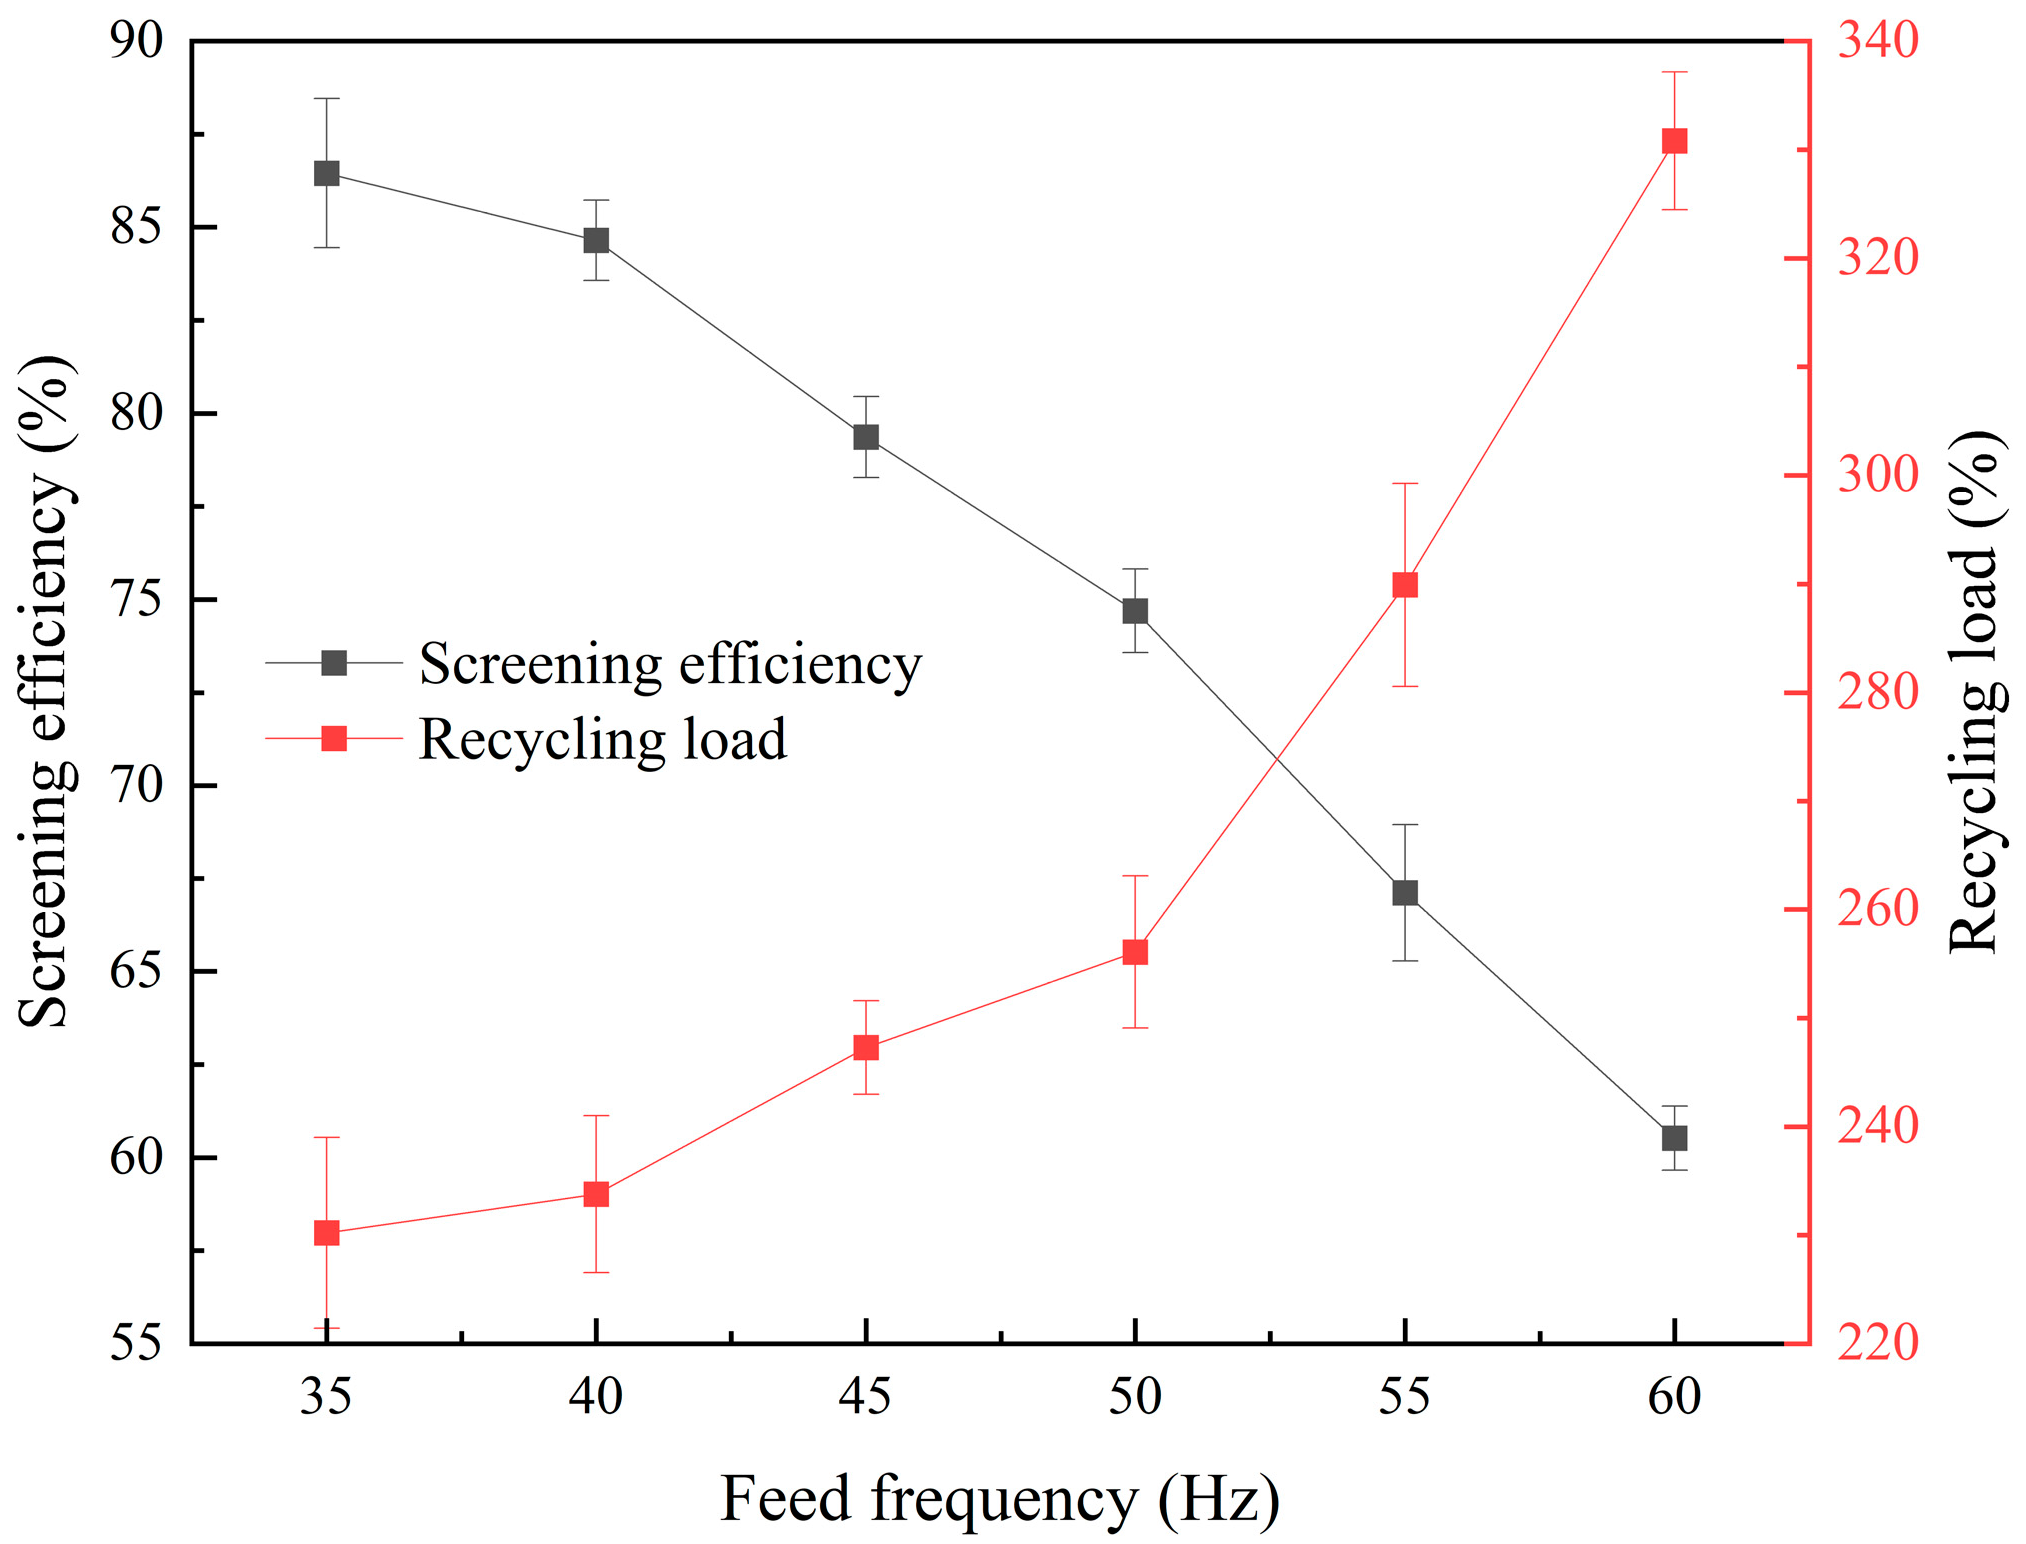
Screening efficiency and recycled load, calculated using Equations (4) and (5), are presented in Figure 13 for the feed frequency sensitivity tests.
The results indicate that as the feed frequency increased from 18.98 tph (35 Hz) to 32.50 tph (60 Hz), the screening efficiency of the flip-flow screen decreased from 86.45% to 60.52%, while the recycled load increased from 230.23% to 336.98%. This trend is attributed to the increased processing capacity per unit area of the screen at higher feed rates, which led to a thicker material layer. This made it more difficult for fine particles to pass through the layer and reach the screen surface [40]. Consequently, fine materials overflowed with coarse products and were returned to the HPGR as recycled material, further increasing the recycled load.
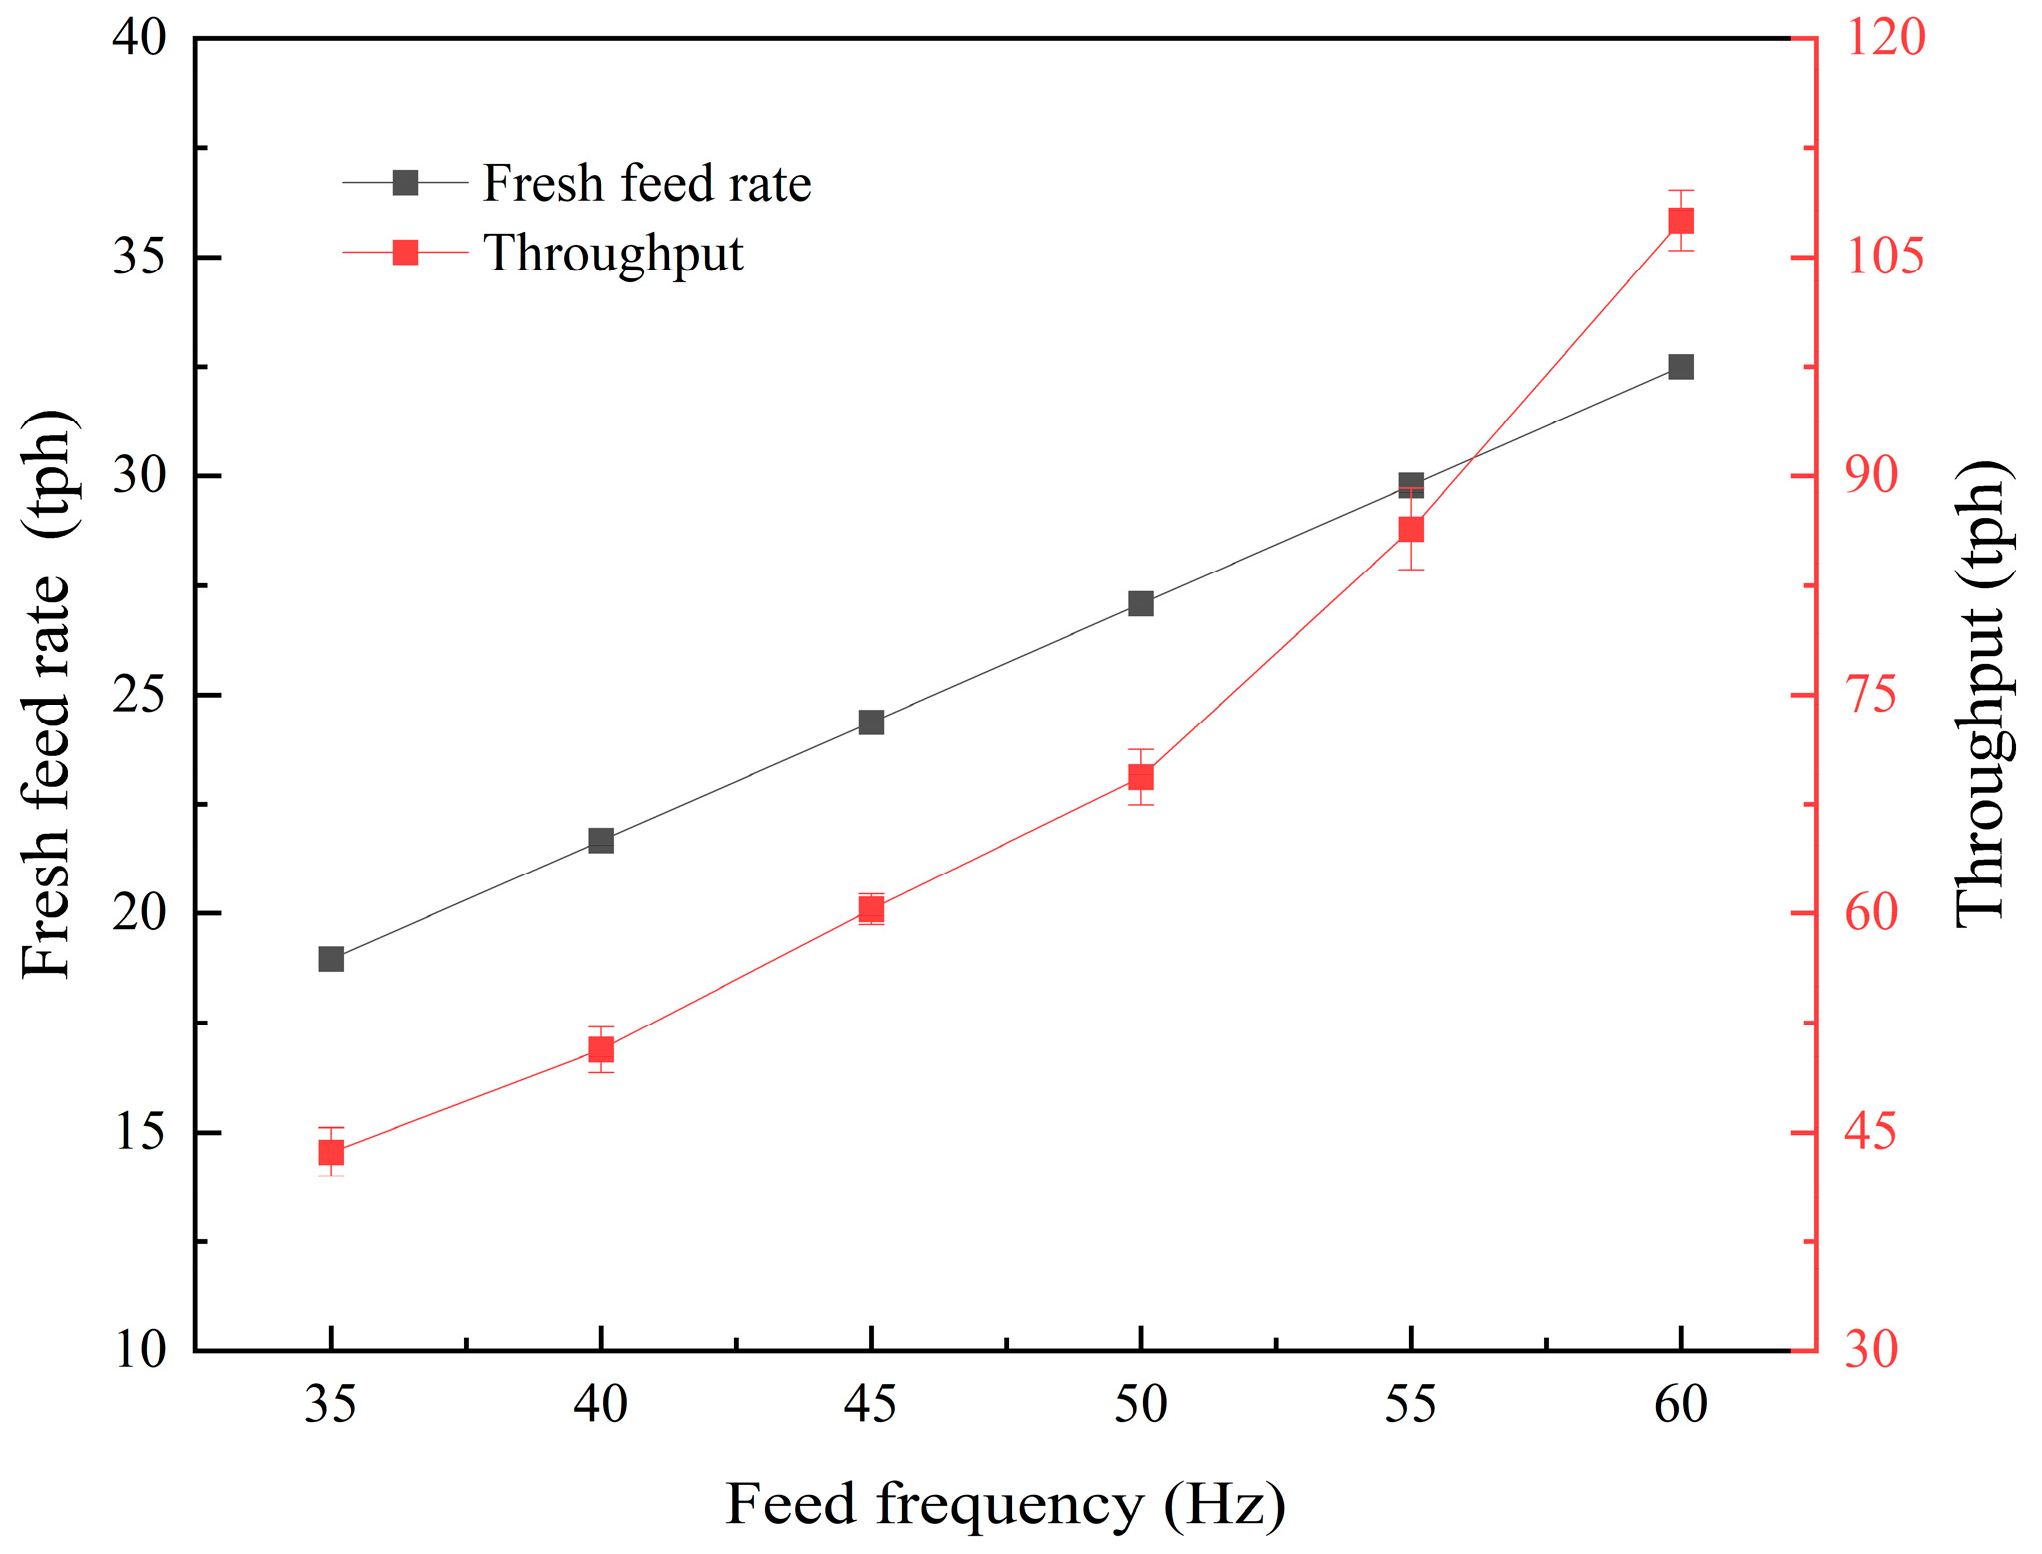
Figure 14 illustrates the relationship between the fresh-feed rate and the back-calculated throughput in the feed frequency sensitivity tests.
As shown in Figure 14, when the fresh-feed rate increased by 66.66% from 18.98 tph (20 Hz) to 27.08 tph (50 Hz), the throughput increased by 58.91% from 69.35 tph to 107.51 tph. However, the fresh feed increased by 20.01% from 27.08 tph (50 Hz) to 32.50 tph (60 Hz), with the throughput increasing by 55.03% from 69.35 tph to 107.51 tph due to the decrease in screening efficiency and the increase in recycled load.
Combining the insights from Figure 13 and Figure 14, it can be inferred that the small specification of the flip-flow screen and its mismatch with the HPGR led to a rapid decline in screening efficiency as the fresh-feed rate increased. This resulted in a higher recycled load and worsened comminution performance. To mitigate these negative effects, a larger HPGR model is required to accommodate the reduced screening efficiency and improve overall circuit performance.
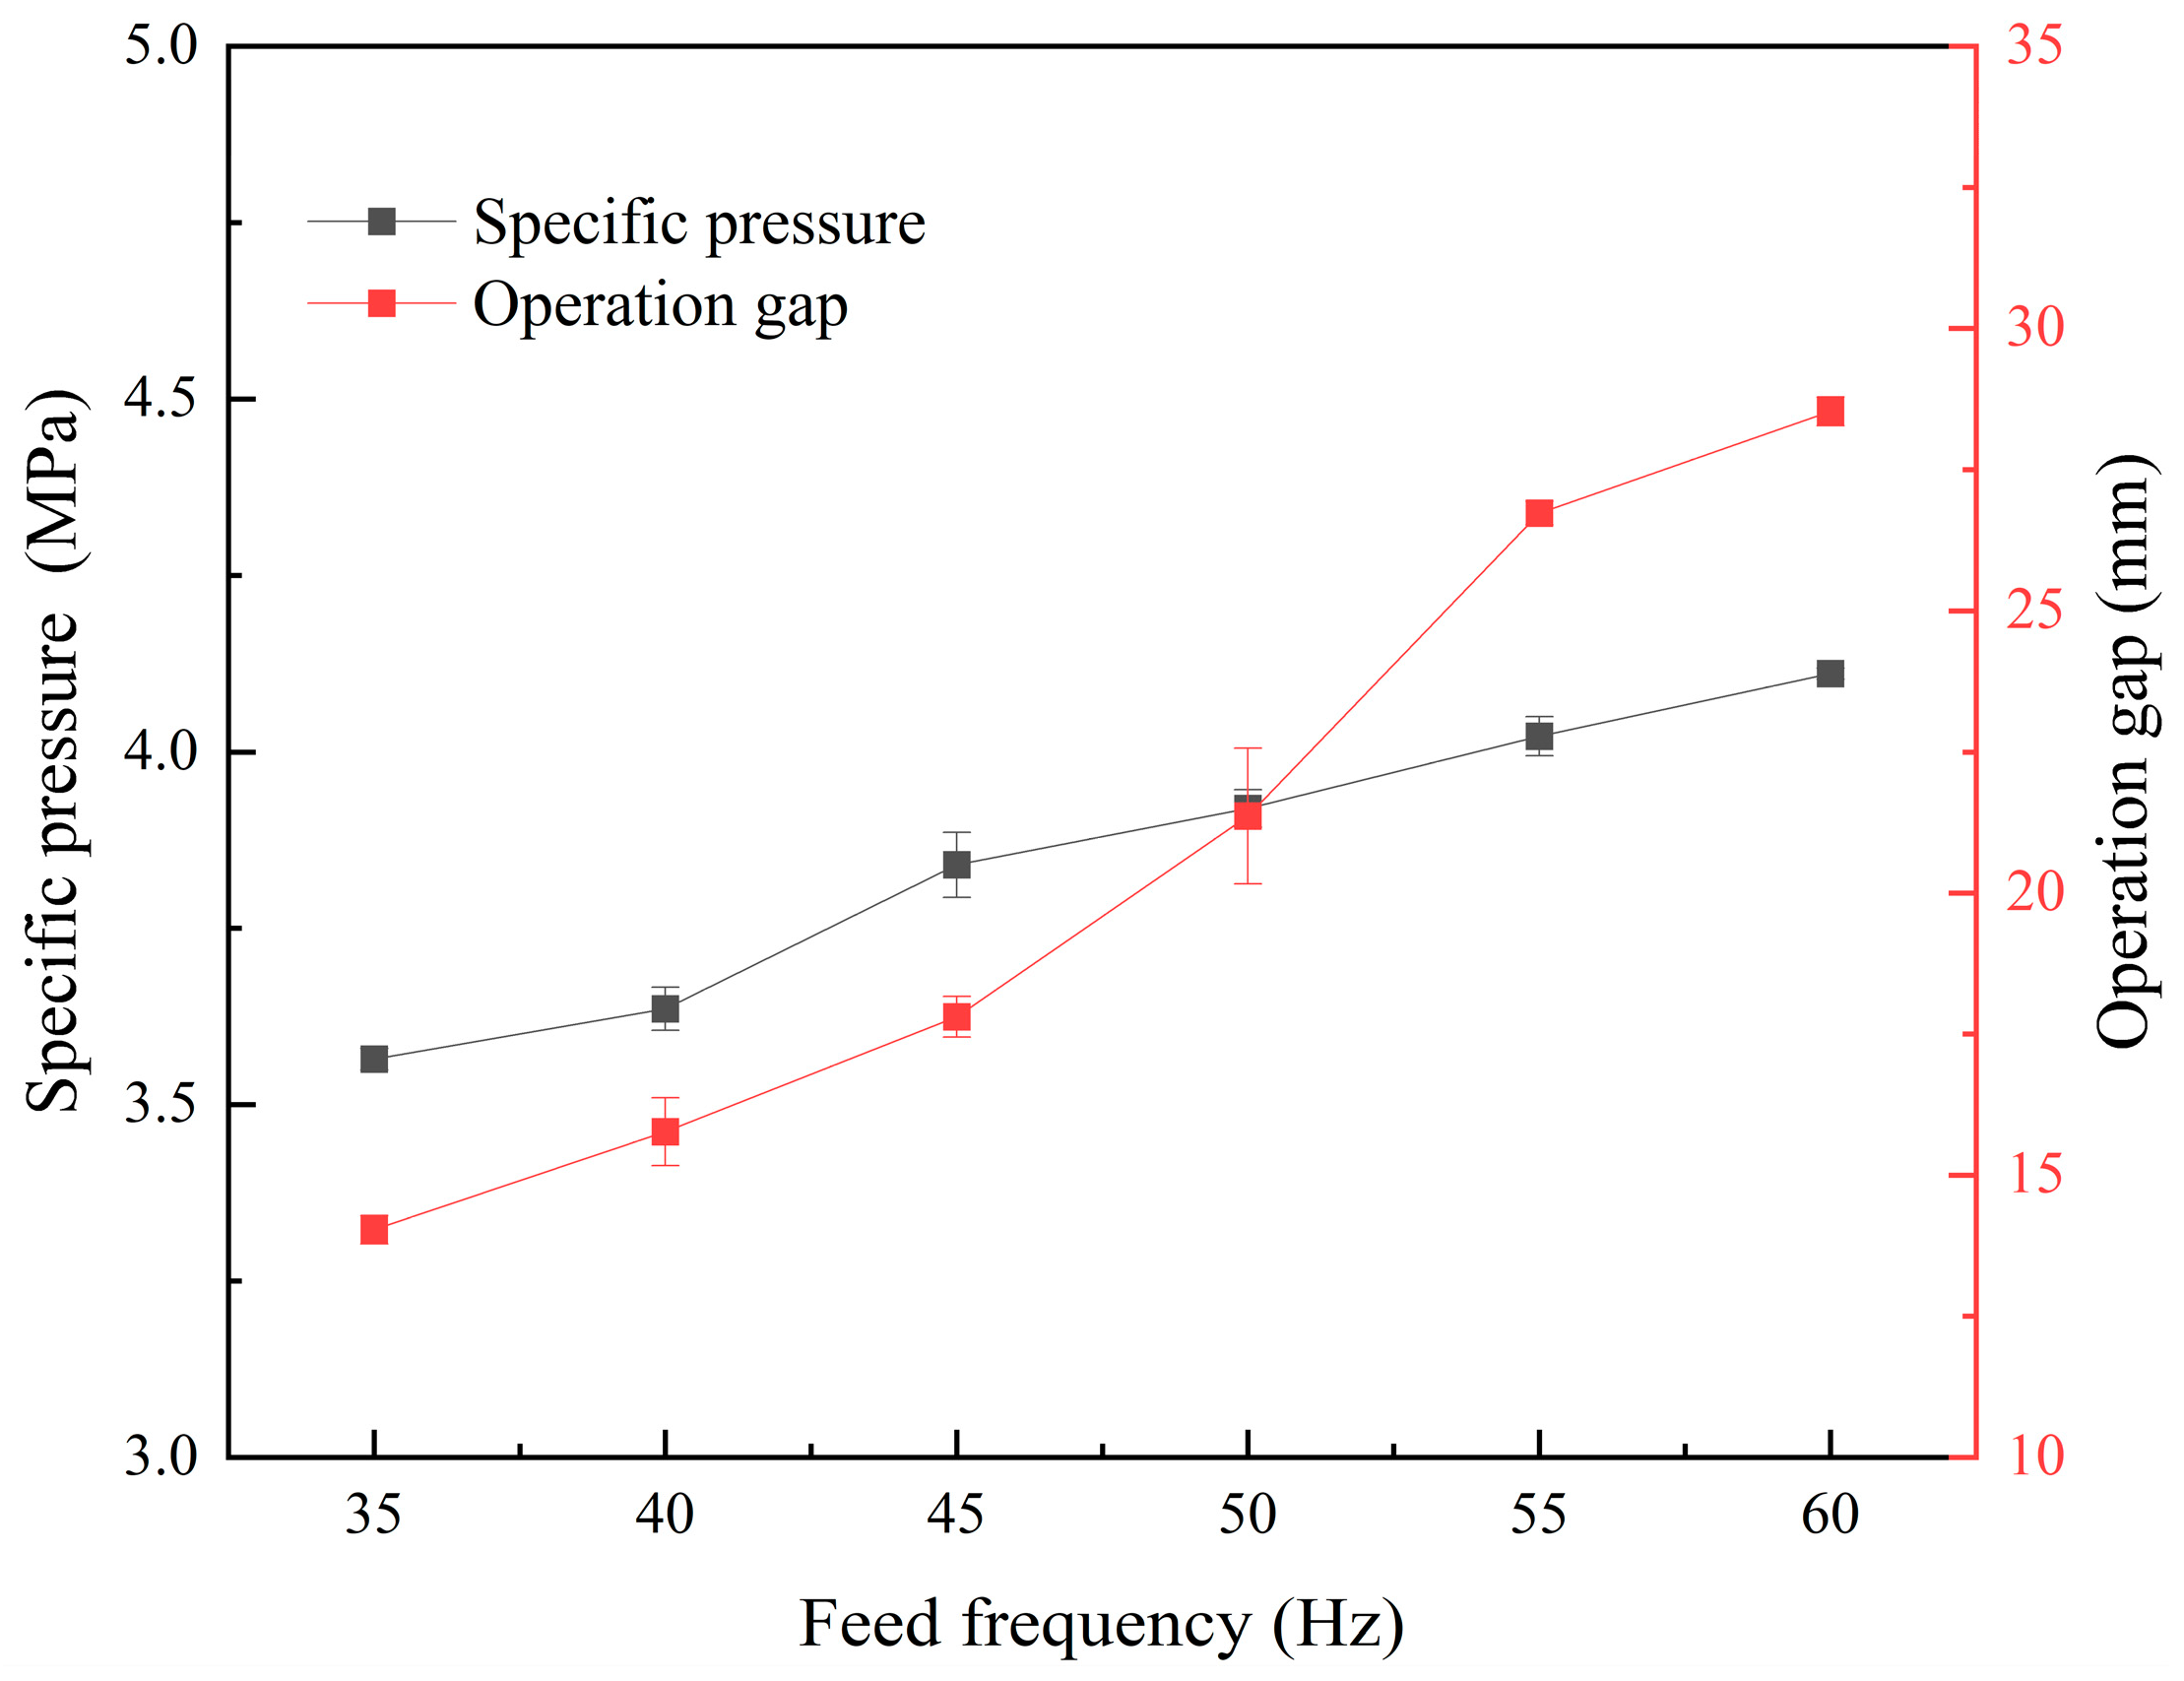
To investigate the influence of feed rate on specific pressure and the operational gap, a constant hydraulic pressure of 15 MPa (corresponding to an initial specific pressure of 4.0 MPa) was maintained throughout all industrial trials. The variations in specific pressure and operational gap for each test are illustrated in Figure 15.
As evident from Figure 15, an increase in the fresh-feed rate resulted in a corresponding rise in both specific pressure and operational gap. When the feed frequency was increased from 35 Hz to 60 Hz, the specific pressure increased from 3.5 MPa to 4.1 MPa, while the operational gap expanded from 14.03 mm to 28.53 mm. Notably, the operational gap exhibited a trend similar to that of the specific pressure, as depicted in Figure 15. However, these findings deviate from the results reported by [42,43], where HPGRs operating under a constant feed rate demonstrated a reduction in operational gap with increasing pressing force. This discrepancy highlights the significant role of feed rate variability in influencing the operational dynamics of HPGRs.
The operational gap is inherently not directly controllable, as it results from the dynamic interaction between the particle bed and the hydraulic system. The roller shifting velocities and positions can be determined using the following equations [44]:
x ¨ ( t n ) = f t n + c x ˙ t n + k x ( t n ) m
x ˙ t n + 1 = x ˙ t n + x ¨ ( t n ) t
x t n + 1 = x t n + x ¨ ( t n + 1 ) t
Here, f t n represents the total force acting on the floating roller at the current time step, while x t n + 1 , x ˙ t n + 1 , and x ¨ ( t n ) denote the roller position, velocity, and acceleration at the next time step, respectively. Additionally, t is the time step, and m is the mass of the floating roll.
Ref. [45] compared the comminution behavior of HPGRs and jaw crushers, highlighting that HPGRs exhibit time-dependent dynamic behavior influenced by loading conditions. The compressive force exerted on the roller is fed back into the model for the next update, causing the roller to retract if internal forces exceed a certain threshold. Consequently, even under a constant hydraulic pressure setting, an increase in fresh-feed rate leads to higher specific pressure and a larger operational gap. A similar argument was also proposed by [46], further supporting this phenomenon.
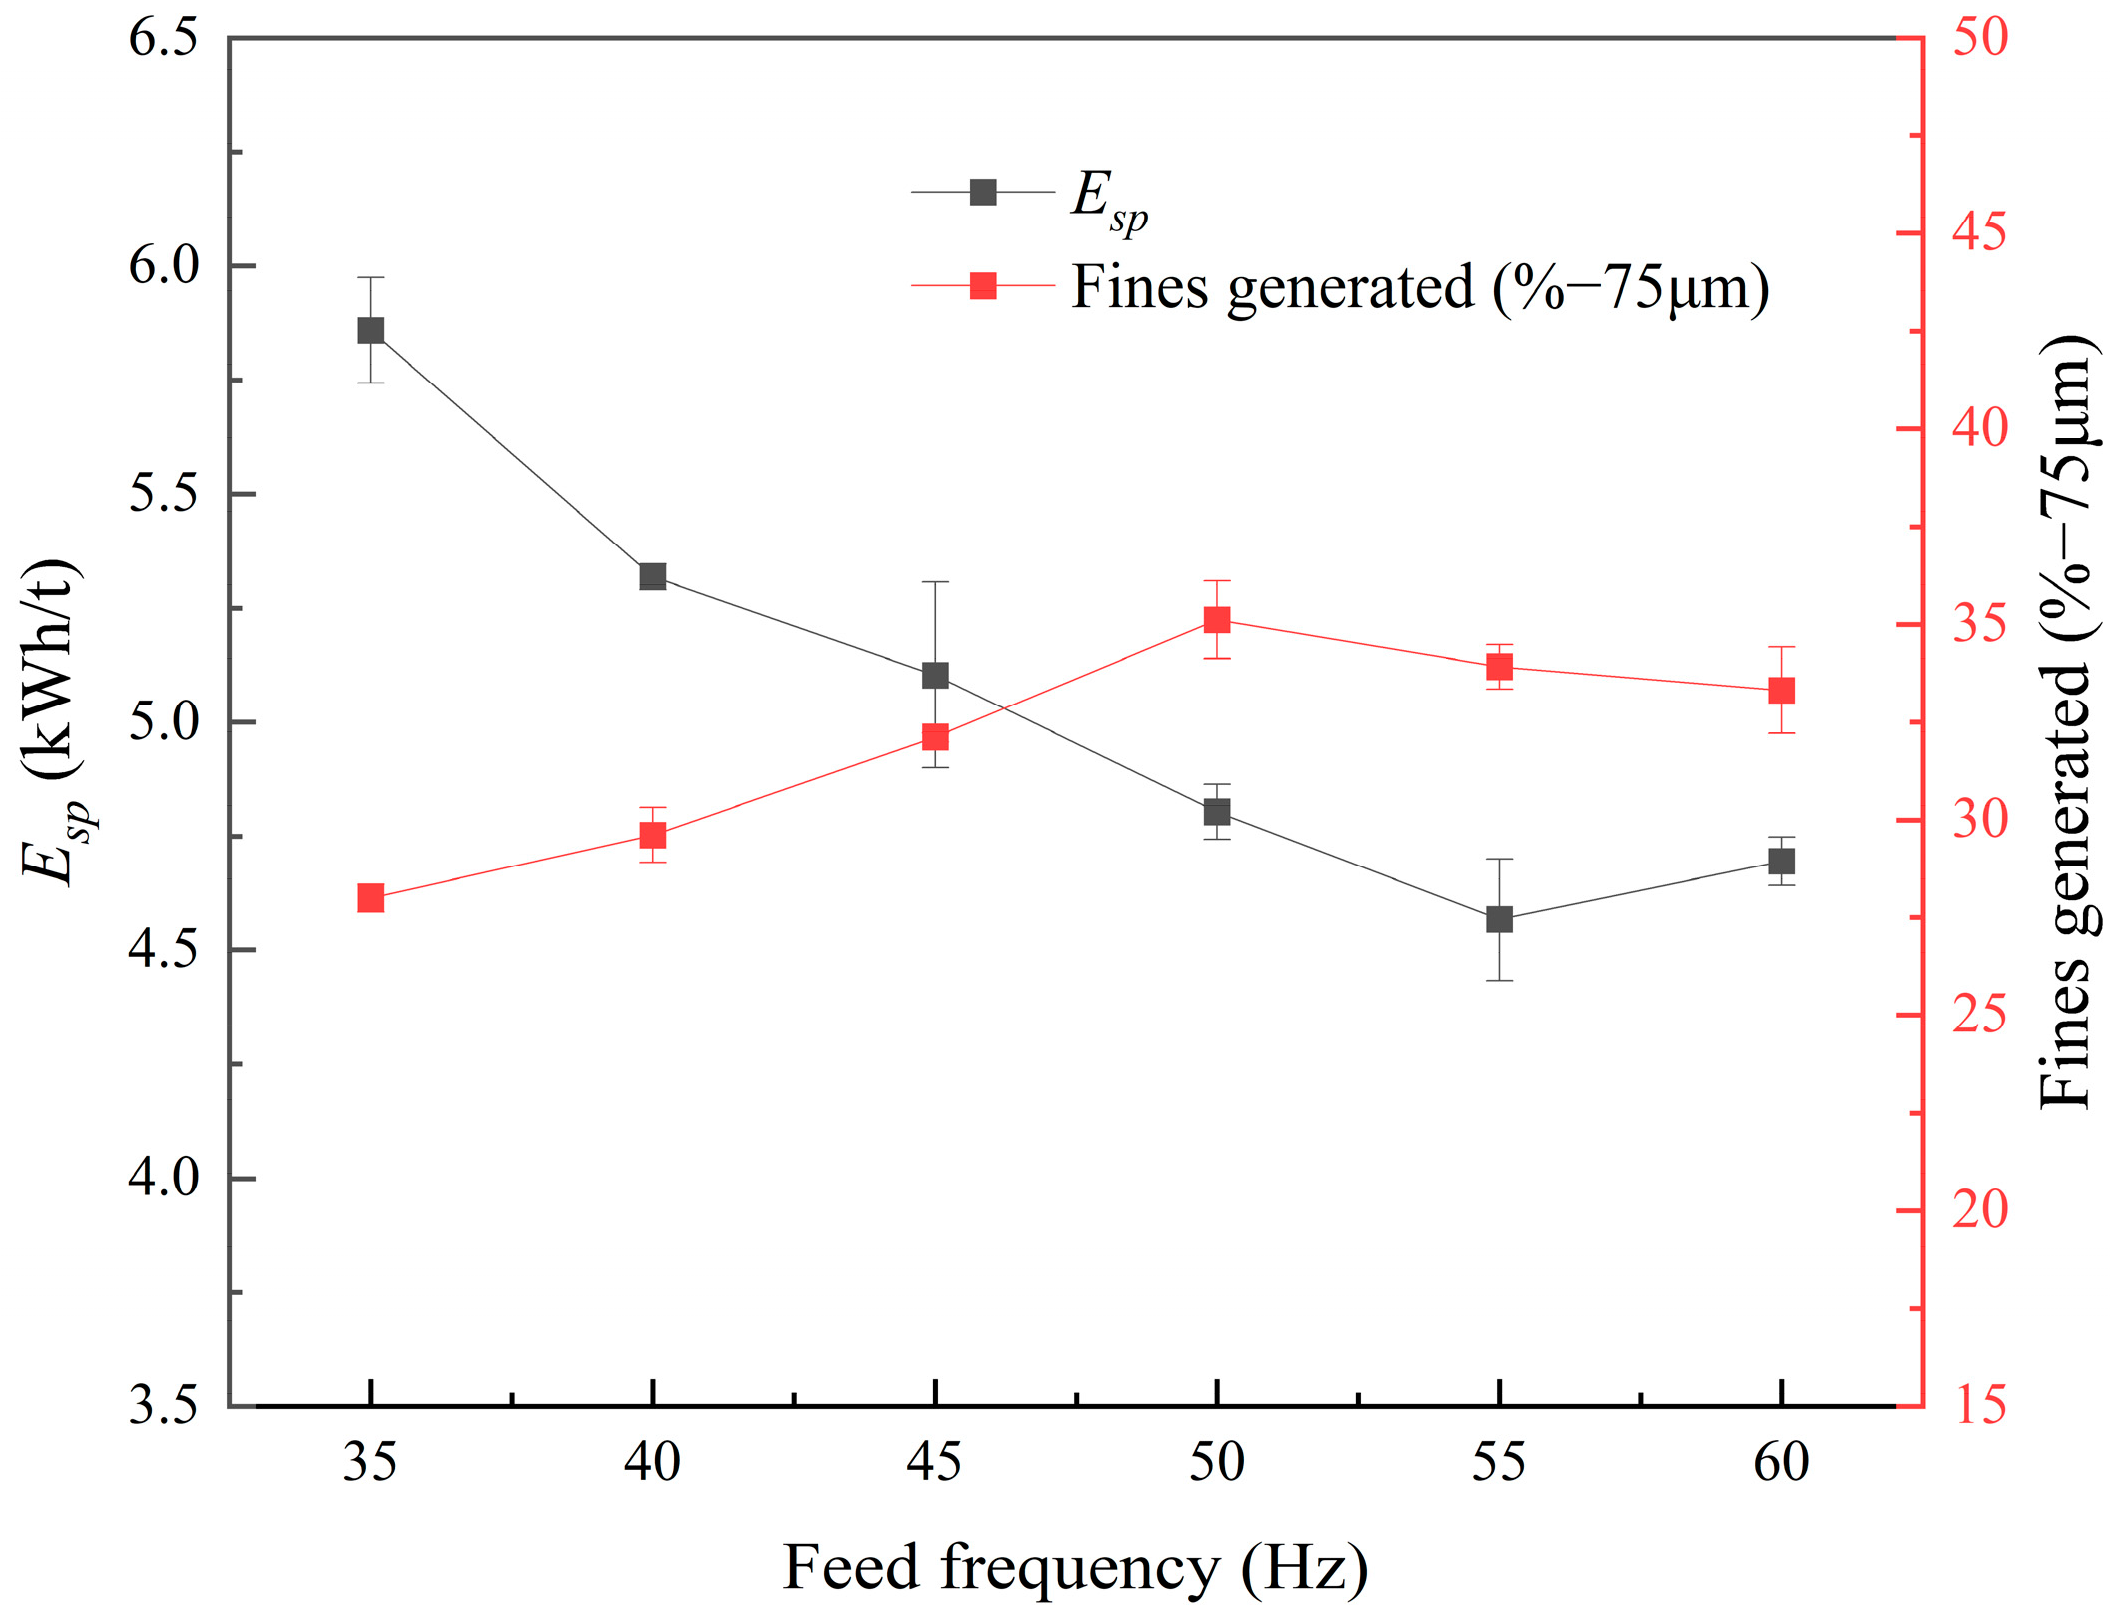
Energy, as a critical variable in comminution, plays a central role in various comminution models, serving either as an input or output parameter [47]. Compared to conventional comminution equipment, HPGRs offer significant technological and economic advantages, including more efficient particle breakage and lower energy consumption per unit mass of processed feed material across the entire crushing and grinding circuit [48]. These energy savings in downstream comminution are primarily attributed to particle weakening and the increased generation of fine particles, particularly those below 75 μm [49], which surpasses the performance of traditional comminution machinery [50]. The effect of fresh-feed rate on HPGR circuit-specific energy [51], calculated using Equation (10), and the generation of fines (%−75 μm) were investigated, as illustrated in Figure 16.
E s p = P Q
where Esp is the specific energy consumption (kWh/t), P is the consumed power (kW), and Q is the fresh-feed rate (t/h).
The results in Figure 16 demonstrate that increasing the fresh-feed rate initially reduced Esp from 5.86 kWh/t to 4.57 kWh/t at a feed frequency of 55 Hz, after which Esp slightly increased to 4.70 kWh/t at 60 Hz. Conversely, the fines generated (%−75 μm) exhibited an inverse trend, reaching a maximum of 35.95% at 50 Hz before declining slightly at higher feed frequencies.
The results from Figure 16 also suggest that increasing the fresh-feed rate to a proper level had a positive effect on Esp reduction in HPGR and subsequent grinding stages, which could be attributed to interparticle breakage [52]. During particle bed compression, smaller particles fill the voids between larger particles, facilitating direct energy transfer and size reduction within the particle bed rather than through surface contact crushing between the rollers.
However, as shown in Figure 16, exceeding a certain fresh-feed-rate threshold negatively impacts both Esp and fines production. This may be due to an increase in fresh-feed rate directly causing an increase in specific pressure, then increasing the total power drawn from the motor, and consequently having an adverse effect on Esp. Additionally, excessive specific pressure can lead to over-compression, resulting in the formation of larger cakes that hinder fines production and screening efficiency. Similar observations have been reported by [10,48].
With a throughput of 27.08 t/h (50 Hz), the circuit has been operating for more than 10,000 h, confirming that an HPGR operating with a closed-circuit flip-flow screen aperture of approximately 1 mm can efficiently provide the feed for a downstream stirred mill in an HPGR/tower mill comminution circuit.

4. Conclusions and Outlook

This study presents an industrial-scale application where an HPGR produced a −1 mm comminution product for a tower mill. To comprehensively evaluate HPGR performance, the article examined multiple factors, including screening efficiency, recycled load, specific pressure, roll gap, specific energy consumption, and fines generation (%−75 μm). The key findings are summarized as follows:
(1)
Higher specific pressures resulted in finer products and increased energy consumption. A specific pressure of 4.0 MPa was identified as the optimal balance, achieving reasonable product fineness and moderate energy consumption.
(2)
Compared to forward classification, a reverse classification circuit with a scalped feed to the laboratory-scale HPGR reduced the recycling load by 30.84%, and the throughput was reduced by 58.41%.
(3)
An appropriate increase in feed rate reduced screening efficiency but enhanced HPGR performance, particularly in terms of energy efficiency. Increasing the fresh-feed rate from 18.98 tph to 32.50 tph initially reduced specific energy consumption from 5.86 kWh/t to 4.57 kWh/t at 29.79 tph, after which it slightly increased to 4.70 kWh/t.
(4)
With a throughput of 27.08 t/h, the circuit has operated for more than 10,000 h, confirming that an HPGR operating with a closed-circuit flip-flow screen aperture of approximately 1 mm can efficiently provide the feed to a downstream stirred mill in an HPGR/tower mill comminution circuit.
To further promote their application, future research will focus on the performance of the tower mill and pre-concentration processes within the industrial-scale HPGR/tower mill comminution circuit.

Author Contributions

Conceptualization, methodology, and drafting manuscript, B.W.; conceptualization, Z.Y., L.L., Q.F., and Q.Z.; data curation, B.W., Q.M., and Q.Z.; supervision, Z.Y., X.X., and B.K. All authors have read and agreed to the published version of the manuscript.

Funding

This work was financially supported by the National Natural Science Foundation of China (52174243), Key Research and Development Program of Liaoning Province (2024JH2/102400026).

Data Availability Statement

Data will be made available on request.

Acknowledgments

The authors acknowledge Shenyang Shengshi Wuhuan Science and Technology Co., Ltd. for providing equipment and technical support.

Conflicts of Interest

Author Quan Feng was employed by the company Shenyang Shengshi Wuhuan Science and Technology Co., Ltd. Author Qiang Zhang was employed by the company Shenyang Shengshi Wuhuan Mining and Metallurgical Engineering Technology Co., Ltd. The remaining authors declare that the research was conducted in the absence of any commercial or financial relationships that could be construed as a potential conflict of interest.

References

  1. Napier-Munn, T. Is progress in energy-efficient comminution doomed? Miner. Eng. 2015, 73, 1–6. [Google Scholar] [CrossRef]
  2. Kumar, A.; Wang, C.; Gong, D.; Saud, C.; Pamparana, G.; Klein, B. Development of Locked-cycle piston press test procedure to simulate closed circuit HPGR comminution. Miner. Eng. 2023, 201, 108160. [Google Scholar] [CrossRef]
  3. Tohry, A.; Yazdani, S.; Hadavandi, E.; Mahmudzadeh, E.; Chelgani, S.C. Advanced modeling of HPGR power consumption based on operational parameters by BNN: A “Conscious-Lab” development. Powder Technol. 2021, 381, 280–284. [Google Scholar] [CrossRef]
  4. Liu, L.; Tan, Q.; Liu, L.; Li, W.; Lv, L. Comparison of grinding characteristics in high-pressure grinding roller (HPGR) and cone crusher (CC). Physicochem. Probl. Miner. Process. 2017, 53, 1009–1022. [Google Scholar]
  5. van der Meer, F.P.; Gruendken, A. Flowsheet considerations for optimal use of high pressure grinding rolls. Miner. Eng. 2010, 23, 663–669. [Google Scholar] [CrossRef]
  6. Saramak, D.; Foszcz, D.; Gawenda, T.; Konieczny, A.; Pawlos, W. Influence of type of lining in high-pressure grinding rolls on effectiveness of copper ore comminution. Physicochem. Probl. Miner. Process. 2016, 52, 182–192. [Google Scholar]
  7. Liu, Z.; Wu, J.; Cui, S.; Guo, X.; Dai, S. Development of Piston Press Test to Simulate the Energy Consumption of HPGR Comminution. JOM 2024, 76, 6709–6717. [Google Scholar] [CrossRef]
  8. Guo, X.; Dai, S.; Wang, Q. Influence of different comminution flowsheets on the separation of vanadium titano-magnetite. Miner. Eng. 2020, 149, 108268. [Google Scholar] [CrossRef]
  9. Cao, J.; Liu, L.; Han, Y.; Feng, A. Comminution behavior and mineral liberation characteristics of low-grade hematite ore in high pressure grinding roll. Physicochem. Probl. Miner. Process. 2019, 55, 575–585. [Google Scholar]
  10. Santosh, T.; Eswaraiah, C.; Soni, R.K.; Kumar, S. Size reduction performance evaluation of HPGR/ball mill and HPGR/stirred mill for PGE bearing chromite ore. Adv. Powder Technol. 2023, 34, 103907. [Google Scholar] [CrossRef]
  11. Rodríguez-Torres, I.; Tuzcu, E.T.; Reyes, I.A.; Rosales, G. A quantitative study between HPGR and cone crusher aided ball mill grinding: Mathematical modeling by evaluating the possible microfracture effect produced by HPGR technology and cone crusher. Physicochem. Probl. Miner. Process. 2024, 60, 177620. [Google Scholar] [CrossRef]
  12. Barani, K.; Balochi, H. A comparative study on the effect of using conventional and high pressure grinding rolls crushing on the ball mill grinding kinetics of an iron ore. Physicochem. Probl. Miner. Process. 2016, 52, 920–931. [Google Scholar]
  13. Liu, L.; Tan, Q.; Yue, T.; Guo, Z.; Lv, L. Pre-Concentration of Ultrafine Crushed Hematite Ores. Sep. Sci. Technol. 2014, 49, 1442–1448. [Google Scholar] [CrossRef]
  14. Liu, L. The hematite ore liberation and separation properties in different comminution way. Sep. Sci. Technol. 2022, 57, 131–140. [Google Scholar] [CrossRef]
  15. Thivierge, A.; Bouchard, J.; Desbiens, A. Modelling the product mass flow rate of high-pressure grinding rolls. IFAC-PapersOnLine 2021, 54, 127–132. [Google Scholar] [CrossRef]
  16. Wang, Z.; Hou, Y.; Sobhy, A. Prediction and optimization of tower mill grinding power consumption based on GA-BP neural network. Physicochem. Probl. Miner. Process. 2023, 59, 172096. [Google Scholar] [CrossRef]
  17. Mazzinghy, D.B.; Schneider, C.L.; Alves, V.K.; Galéry, R. Vertical Agitated Media Mill scale-up and simulation. Miner. Eng. 2015, 73, 69–76. [Google Scholar] [CrossRef]
  18. Curry, J.A.; Ismay, M.J.L.; Jameson, G.J. Mine operating costs and the potential impacts of energy and grinding. Miner. Eng. 2014, 56, 70–80. [Google Scholar] [CrossRef]
  19. Jameson, G.J. New directions in flotation machine design. Miner. Eng. 2010, 23, 835–841. [Google Scholar] [CrossRef]
  20. Awatey, B.; Thanasekaran, H.; Kohmuench, J.N.; Skinner, W.; Zanin, M. Optimization of operating parameters for coarse sphalerite flotation in the HydroFloat fluidised-bed separator. Miner. Eng. 2013, 50, 99–105. [Google Scholar] [CrossRef]
  21. Santosh, T.; Soni, R.K.; Eswaraiah, C.; Kumar, S.; Rao, D.S.; Venugopal, R. Modeling and application of stirred mill for the coarse grinding of PGE bearing chromite ore. Sep. Sci. Technol. 2023, 58, 149–163. [Google Scholar] [CrossRef]
  22. Walter Valery, A.J. The future of comminution. In Proceedings of the 34th IOC on Mining and Metallurgy, Bor Lake, Serbia, 30 September–3 October 2002. [Google Scholar]
  23. Wang, B.C.; Nadolski, S.; Mejia, O.; Drozdiak, J.; Klein, B. Energy and cost comparisons of HPGR based circuits with the SABC circuit installed at the Huckleberry mine. In Proceedings of the 45th Annual Meeting of the Canadian Mineral Processors, Ottawa, ON, Canada, 22 January 2013. [Google Scholar]
  24. Li, L.; Wei, B.; Zhang, Q.; Zhang, J.; Zhang, X.; Wang, C.; Li, N.; Liu, Z. Evaluating the performance of an industrial-scale high pressure grinding rolls (HPGR)-tower mill comminution circuit. Miner. Eng. 2023, 191, 107973. [Google Scholar] [CrossRef]
  25. Rodríguez-Torres, I.; Tuzcu, E.T.; Andrade-Martínez, J.; Rosales-Marín, G. Estimation methodology for Bond ball mill work index experiment output via mathematical modeling. Miner. Eng. 2023, 201, 108186. [Google Scholar] [CrossRef]
  26. Gong, S.; Zhang, F.; Xu, N.; Zhao, G.; Liu, B.; Guo, J.; Guo, Y. Equal-thickness screening mechanism of multi-mass vibrating flip-flow screens. Physicochem. Probl. Miner. Process. 2025, 61, 206993. [Google Scholar] [CrossRef]
  27. Wu, T.; Gong, S.; Zhao, G.; Xu, N.; Liu, B.; Zhang, F. Separation mechanism and kinematic characteristics of particles on screen panel with different vibration modes. Physicochem. Probl. Miner. Process. 2025, 61, 205443. [Google Scholar] [CrossRef]
  28. Kumar, R.; Gopireddy, S.R.; Jana, A.K.; Patel, C.M. Study of the discharge behavior of Rosin-Rammler particle-size distributions from hopper by discrete element method: A systematic analysis of mass flow rate, segregation and velocity profiles. Powder Technol. 2020, 360, 818–834. [Google Scholar] [CrossRef]
  29. Zhang, G.; Fan, Y.; Yang, R.; Li, S. Application of the Rosin-Rammler function to describe quartz sandstone particle size distribution produced by high-pressure gas rapid unloading at different infiltration pressure. Powder Technol. 2022, 412, 117982. [Google Scholar] [CrossRef]
  30. Zuo, W.; Shi, F. A t 10 -based method for evaluation of ore pre-weakening and energy reduction. Miner. Eng. 2015, 79, 212–219. [Google Scholar] [CrossRef]
  31. Baawuah, E.; Kelsey, C.; Addai-Mensah, J.; Skinner, W. Comparison of the performance of different comminution technologies in terms of energy efficiency and mineral liberation. Miner. Eng. 2020, 156, 106454. [Google Scholar] [CrossRef]
  32. Uttarwar, K.; Sonawwanay, P.D.; Bhosale, S. Finite element analysis of high-pressure grinding rolls for crack prediction to determine safe working conditions. Mater. Today Proc. 2022, 56, 2952–2959. [Google Scholar] [CrossRef]
  33. Zhou, W.-T.; Han, Y.-X.; Sun, Y.-S.; Yang, J.-L.; Ma, S.-J. Multi-scale impact crushing characteristics of polymetallic sulphide ores. Trans. Nonferrous Met. Soc. China 2019, 29, 1929–1938. [Google Scholar] [CrossRef]
  34. Shi, F.; Kojovic, T. Validation of a model for impact breakage incorporating particle size effect. Int. J. Miner. Process. 2007, 82, 156–163. [Google Scholar] [CrossRef]
  35. Schönert, K. A first survey of grinding with high-compression roller mills. Int. J. Miner. Process. 1988, 22, 401–412. [Google Scholar] [CrossRef]
  36. Aminalroaya, A.; Pourghahramani, P. The Effect of Feed Characteristics on Particles Breakage and Weakening Behavior in High Pressure Grinding Rolls (HPGR). Miner. Process. Extr. Metall. Rev. 2021, 43, 610–621. [Google Scholar] [CrossRef]
  37. Liu, L.X.; Powell, M. New approach on confined particle bed breakage as applied to multicomponent ore. Miner. Eng. 2016, 85, 80–91. [Google Scholar] [CrossRef]
  38. Wills, B.A.; Finch, J.A. Chapter 7—Grinding Mills. In Wills’ Mineral Processing Technology, 8th ed.; Wills, B.A., Finch, J.A., Eds.; Butterworth-Heinemann: Boston, MA, USA, 2016; pp. 147–179. [Google Scholar]
  39. Abouzeid, A.-Z.M.; Fuerstenau, D.W. Grinding of mineral mixtures in high-pressure grinding rolls. Int. J. Miner. Process. 2009, 93, 59–65. [Google Scholar] [CrossRef]
  40. Wang, W.; Pan, M.; Duan, C.; Jiang, H.; Zhao, Y.; Lu, H. Dry deep screening of spodumene and its mineral processing technology. Miner. Eng. 2022, 179, 59–65. [Google Scholar] [CrossRef]
  41. Wills, B.A.; Finch, J.A. Chapter 8—Industrial Screening. In Wills’ Mineral Processing Technology, 8th ed.; Wills, B.A., Finch, J.A., Eds.; Butterworth-Heinemann: Boston, MA, USA, 2016; pp. 181–197. [Google Scholar]
  42. Lim, W.I.L.; Weller, K.R. Some benefits of using studded surfaces in high pressure grinding rolls. Miner. Eng. 1999, 12, 187–203. [Google Scholar] [CrossRef]
  43. Pamparana, G.; Klein, B. A methodology to predict the HPGR operational gap by using piston press tests. Miner. Eng. 2021, 166, 106875. [Google Scholar] [CrossRef]
  44. Barrios, G.K.P.; Tavares, L.M. A preliminary model of high pressure roll grinding using the discrete element method and multi-body dynamics coupling. Int. J. Miner. Process. 2016, 156, 32–42. [Google Scholar] [CrossRef]
  45. Johansson, M.; Evertsson, M. A time dynamic model of a high pressure grinding rolls crusher. Miner. Eng. 2019, 132, 27–38. [Google Scholar] [CrossRef]
  46. Benzer, H.; Aydogan, N.A.; Dündar, H. Investigation of the breakage of hard and soft components under high compression: HPGR application. Miner. Eng. 2011, 24, 303–307. [Google Scholar] [CrossRef]
  47. Campos, T.M.; Andersson, C.; Evertsson, M.; Powell, M.; Tavares, L.M. Energy-based modelling of single-particle breakage by slow compression. Miner. Eng. 2024, 208, 106875. [Google Scholar] [CrossRef]
  48. Saramak, D.; Leśniak, K. Impact of HPGR operational pressing force and material moisture on energy consumption and crushing product fineness in high-pressure grinding processes. Energy 2024, 302, 131908. [Google Scholar] [CrossRef]
  49. Ballantyne, G.R.; Peukert, W.; Powell, M.S. Size specific energy (SSE)—Energy required to generate minus 75 micron material. Int. J. Miner. Process. 2015, 136, 2–6. [Google Scholar] [CrossRef]
  50. Tavares, L.M. Particle weakening in high-pressure roll grinding. Miner. Eng. 2005, 18, 651–657. [Google Scholar] [CrossRef]
  51. Morrell, S. Helping to reduce mining industry carbon emissions: A step-by-step guide to sizing and selection of energy efficient high pressure grinding rolls circuits. Miner. Eng. 2022, 179, 131908. [Google Scholar] [CrossRef]
  52. Sadangi, J.K.; Das, S.P. Potential of High-Pressure Grinding Roll (HPGR) for Size Reduction of Hard Banded Iron Ore. Trans. Indian Inst. Met. 2022, 75, 1797–1811. [Google Scholar] [CrossRef]
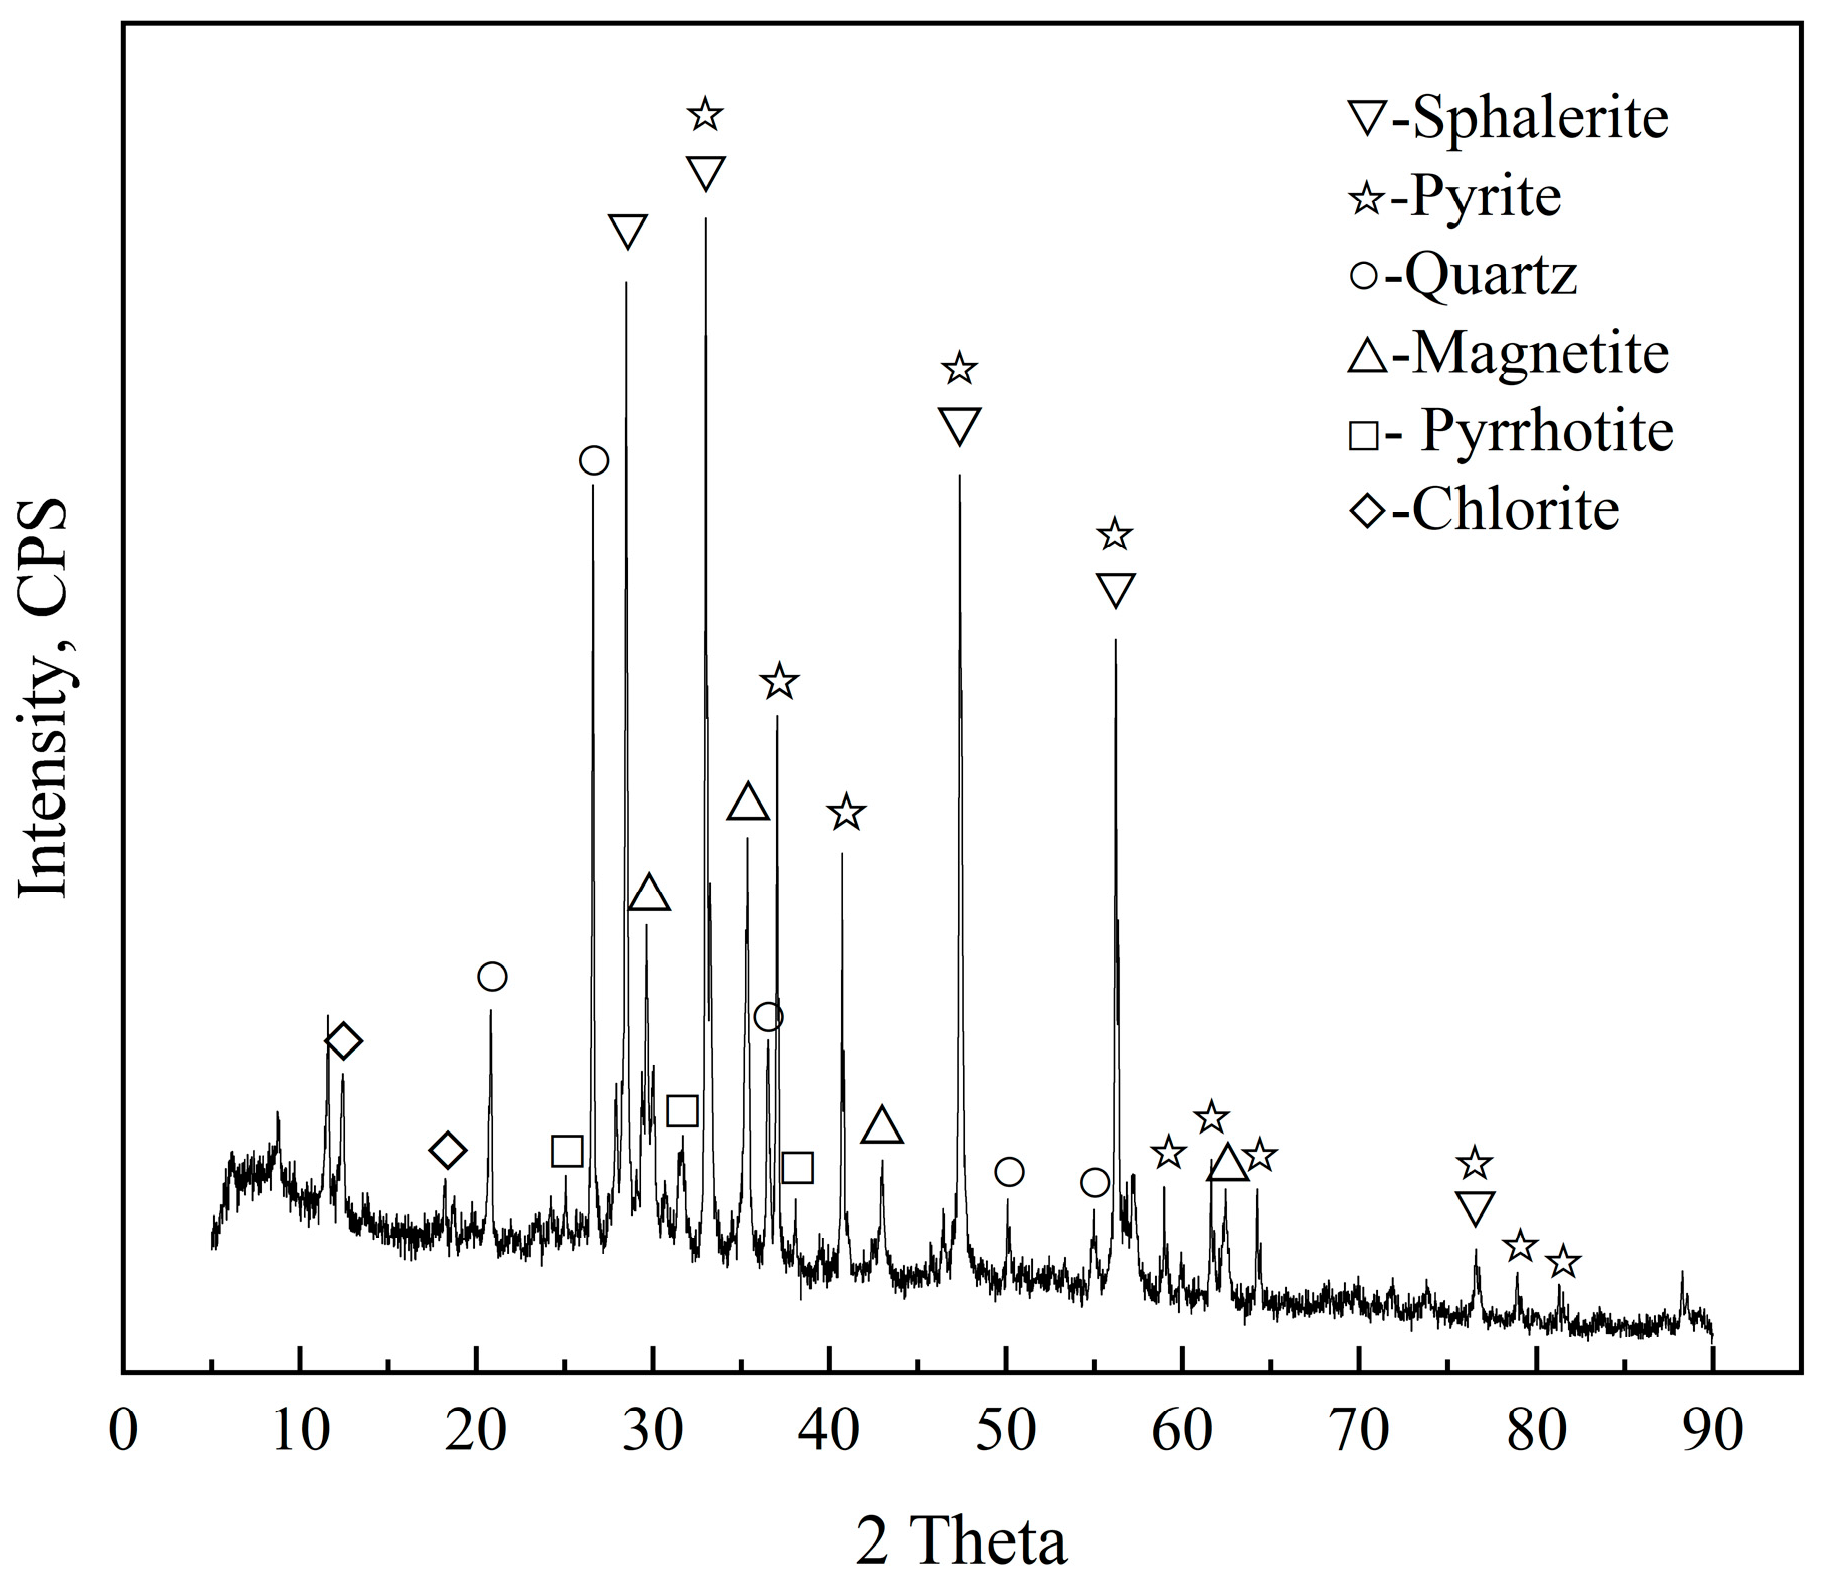
Figure 1. X-ray diffraction spectra of raw ore.
Minerals 15 01065 g001
Figure 2. Laboratory-scale WGM-3516 HPGR.
Minerals 15 01065 g002
Figure 3. Simplified flowsheet of the HPGR/tower mill circuit.
Minerals 15 01065 g003
Figure 4. Industrial-scale experimental equipment.
Minerals 15 01065 g004
Figure 5. HPGR operated in an open circuit.
Minerals 15 01065 g005
Figure 6. Differential distribution of feed and product particle size fraction.
Minerals 15 01065 g006
Figure 7. Cumulative passing of feed and product particle size fraction.
Minerals 15 01065 g007
Figure 8. Effect of specific pressure on t10 and ENSE.
Minerals 15 01065 g008
Figure 9. Fitting curve between t10 and ENES.
Minerals 15 01065 g009
Figure 10. Mass balance around the HPGR closed with the screen.
Minerals 15 01065 g010
Figure 11. Undersize PSDs for closed HPGR circuit tests.
Minerals 15 01065 g011
Figure 12. The industrial-scale circuit configurations and sampling positions.
Minerals 15 01065 g012
Figure 13. Screening efficiency and recycling load in feed frequency sensitivity tests.
Minerals 15 01065 g013
Figure 14. Relationship between fresh-feed rate and throughput in feed frequency sensitivity tests.
Minerals 15 01065 g014
Figure 15. Specific pressure and operational gap in feed frequency sensitivity tests.
Minerals 15 01065 g015
Figure 16. Esp and fines generated (%−75 μm) in feed frequency sensitivity tests.
Minerals 15 01065 g016
Table 1. Chemical composition of raw ore (mass fraction, %).
ElementsFe2O3SSiO2ZnCuPb
Content21.3112.5528.353.520.400.83
Table 2. BMWI test results for raw ore.
Bulk DensityF80P80Closing Screen SizeBBWI
2.07 t/m31820 μm51.18 μm74 μm16.06 kwh/t
Table 3. Laboratory-scale WGM-3516 HPGR.
ItemDescription
HPGR modelWGM-3516
Roll diameter350 mm
Roll width160 mm
Initial gap (gap zero)6 mm
Maximum gap15 mm
Wear surfaceStudded
Motor power2 × 18.5 kW
Maximum specific pressure6 N/mm2
Variable speed drive0~0.4 m/s
Table 4. Main equipment.
Equipment TypeQuantitySpecificationPower (kW)
Primary jaw crusher1C8075
Secondary cone crusher1GP100M90
Circular vibrating screen1YA183611
HPGR1WGM80402 × 110
Vibrating flip-flow screen1SSMS246133
Tower mill1WTM-355355
Cyclones1FXΦ350-4-
Cyclone feed pump1150JZ55
Table 5. HPGR specifications.
ItemDescription
HPGR modelWGM-8040
Roll diameter800 mm
Roll width400 mm
Initial gap (gap zero)8 mm
Maximum gap20 mm
Wear surfaceStudded
Motor power2 × 110 kW
Maximum specific pressure8.5 N/mm2
Variable speed driveUp to 40 rpm (1.55 m/s)
Table 6. Vibrating flip-flow screen specifications.
ItemDescription
Screen modelSSMS2461 (single layer)
Screen area14.64 m2
Screen size1 mm × 10 mm
Power30 kW
Speed800 rpm
Disclaimer/Publisher’s Note: The statements, opinions and data contained in all publications are solely those of the individual author(s) and contributor(s) and not of MDPI and/or the editor(s). MDPI and/or the editor(s) disclaim responsibility for any injury to people or property resulting from any ideas, methods, instructions or products referred to in the content.