Article

Pore Diagenetic Evolution and Its Coupling Relationship with Natural Gas Accumulation in Tight Sandstone Reservoirs of the Second Member of the Xujiahe Formation, Xinchang Area, Western Sichuan

by
Zongze Li
1,
Sibing Liu
1,*,
Youyi Bi
2,
Junqi Li
1,
Meizhou Deng
2,
Jinxi Wang
3 and
Hengyi Gao
2
1
College of Energy Resources, Chengdu University of Technology, Chengdu 610059, China
2
Exploration and Development Research Institute, Southwest Oil & Gas Company, Sinopec, Chengdu 610059, China
3
Tight Oil & Gas Exploration and Development Project Department, PetroChina Southwest Oil & Gasfield Company, Chengdu 610059, China
*
Author to whom correspondence should be addressed.
Minerals 2025, 15(10), 1052; https://doi.org/10.3390/min15101052
Submission received: 22 August 2025 / Revised: 27 September 2025 / Accepted: 29 September 2025 / Published: 3 October 2025
(This article belongs to the Special Issue Natural and Induced Diagenesis in Clastic Rock)

Abstract

By employing thin section analysis, scanning electron microscopy (SEM), homogenization temperatures of fluid inclusions, and carbon–oxygen isotope analysis of carbonate cements, this study conducted a temporal-quantitative investigation into the porosity evolution of relatively high-quality reservoirs in the Second Member of the Xujiahe Formation (Xu-2 Member) in the Xinchang area of western Sichuan. The analysis focused on quantifying porosity loss due to compaction, cementation, and porosity enhancement from dissolution. Results indicate that compaction exerted the most significant impact on reservoir quality in the Xu-2 Member, causing over 70% of total porosity loss. Cementation processes, including carbonate cements, silica cements, and authigenic chlorite, further degraded reservoir properties. Authigenic chlorite precipitated earliest at burial depths of 600–800 m, while authigenic quartz and carbonate cements persistently affected the reservoir at depths of 2000–5000 m, reducing porosity by at least 10% (up to 21%). Dissolution processes initiated at approximately 3500 m burial depth, generating secondary porosity of ≥2%, with a maximum increase of 16%. Integrating these findings with the natural gas accumulation history, the coupling relationship between pore evolution and gas accumulation was elucidated. The study reveals that reservoir tightness in the Xu-2 Member developed at burial depths of 4050–5300 m, with large-scale gas accumulation predominantly occurring prior to reservoir densification. The findings provide critical guidance for identifying high-quality tight sandstone reservoirs and optimizing exploration targets in the Xu-2 Member of the Xinchang area, Western Sichuan Basin, thereby supporting efficient development of regional tight gas resources.

1. Introduction

Tight sandstone gas has experienced rapid development, with its proportion in natural gas production and reserves increasing annually, and is projected to remain the primary contributor to gas reserve and production growth over the next 10–20 years [1,2,3,4]. The Xujiahe Formation in the Western Sichuan Basin possesses favorable geological conditions for tight gas reservoirs and has achieved significant exploration breakthroughs [2,4]. However, the Upper Triassic Xujiahe sandstone reservoirs in the Western Sichuan Depression are characterized by the “two lows and one high” features—ultra-low porosity, ultra-low permeability, and abnormally high formation pressure—resulting in relatively low exploration success rates. Identifying favorable reservoirs under such conditions has become a critical challenge. Reservoir densification processes are fundamentally linked to the development mechanisms and distribution patterns of high-quality reservoirs, serving as a key approach for studying sandstone reservoir evolution in analogous basins [5].
Research on reservoir evolution addresses both fundamental geological questions and practical economic concerns regarding quality prediction of deeply buried reservoirs. The densification of sandstone reservoirs under deep burial conditions is significantly influenced by pre-burial sediment composition and post-depositional water-rock interactions [6,7,8]. Consequently, studying reservoir densification requires a comprehensive investigation of various physicochemical diagenetic processes. Previous studies have extensively investigated hydrocarbon accumulation conditions, diagenetic fluid characteristics, fluid-rock interactions, reservoir densification mechanisms, pore development and Machine Learning Methods in the Xujiahe Formation [9,10,11,12,13,14,15,16,17,18]. However, controversies still exist regarding the coupling relationship between densification process and hydrocarbon accumulation in the Xujiahe Formation tight sandstone reservoirs, leading to divergent views on genetic types including pre-accumulation densification, post-densification accumulation, and synchronous densification-accumulation [19,20,21,22]. This study focuses on the Second Member of Xujiahe Formation (T3x2), one of the major gas-producing tight sandstone reservoirs in the Western Sichuan Depression, as the target interval. Through comprehensive application of various analytical techniques and conducting temporal-quantitative research on the relationship between major diagenetic processes and porosity evolution, this work clarifies the pore evolution process of relatively high-quality reservoirs in the Xu-2 Member of the study area. By integrating analysis of natural gas accumulation history, it reveals the coupling relationship between reservoir pore evolution and gas accumulation, providing a basis for further geological exploration of tight sandstone gas in the Western Sichuan Depression.

2. Geological Setting

The Western Sichuan Depression, located in the western Sichuan Basin, represents the deep depocenter of continental sedimentation since the Late Triassic and serves as a key exploration target for tight gas resources. Bordered by the Longmen Mountain Fold-Thrust Belt to the west, Micangshan Orogenic Belt to the northeast, and Emeishan-Liangshan Fault Block to the southwest, this NE-trending structural unit exhibits intense tectonic activity [10,19,23]. The study wells are predominantly situated within the Xinchang Structural Belt of the central depression (Figure 1).
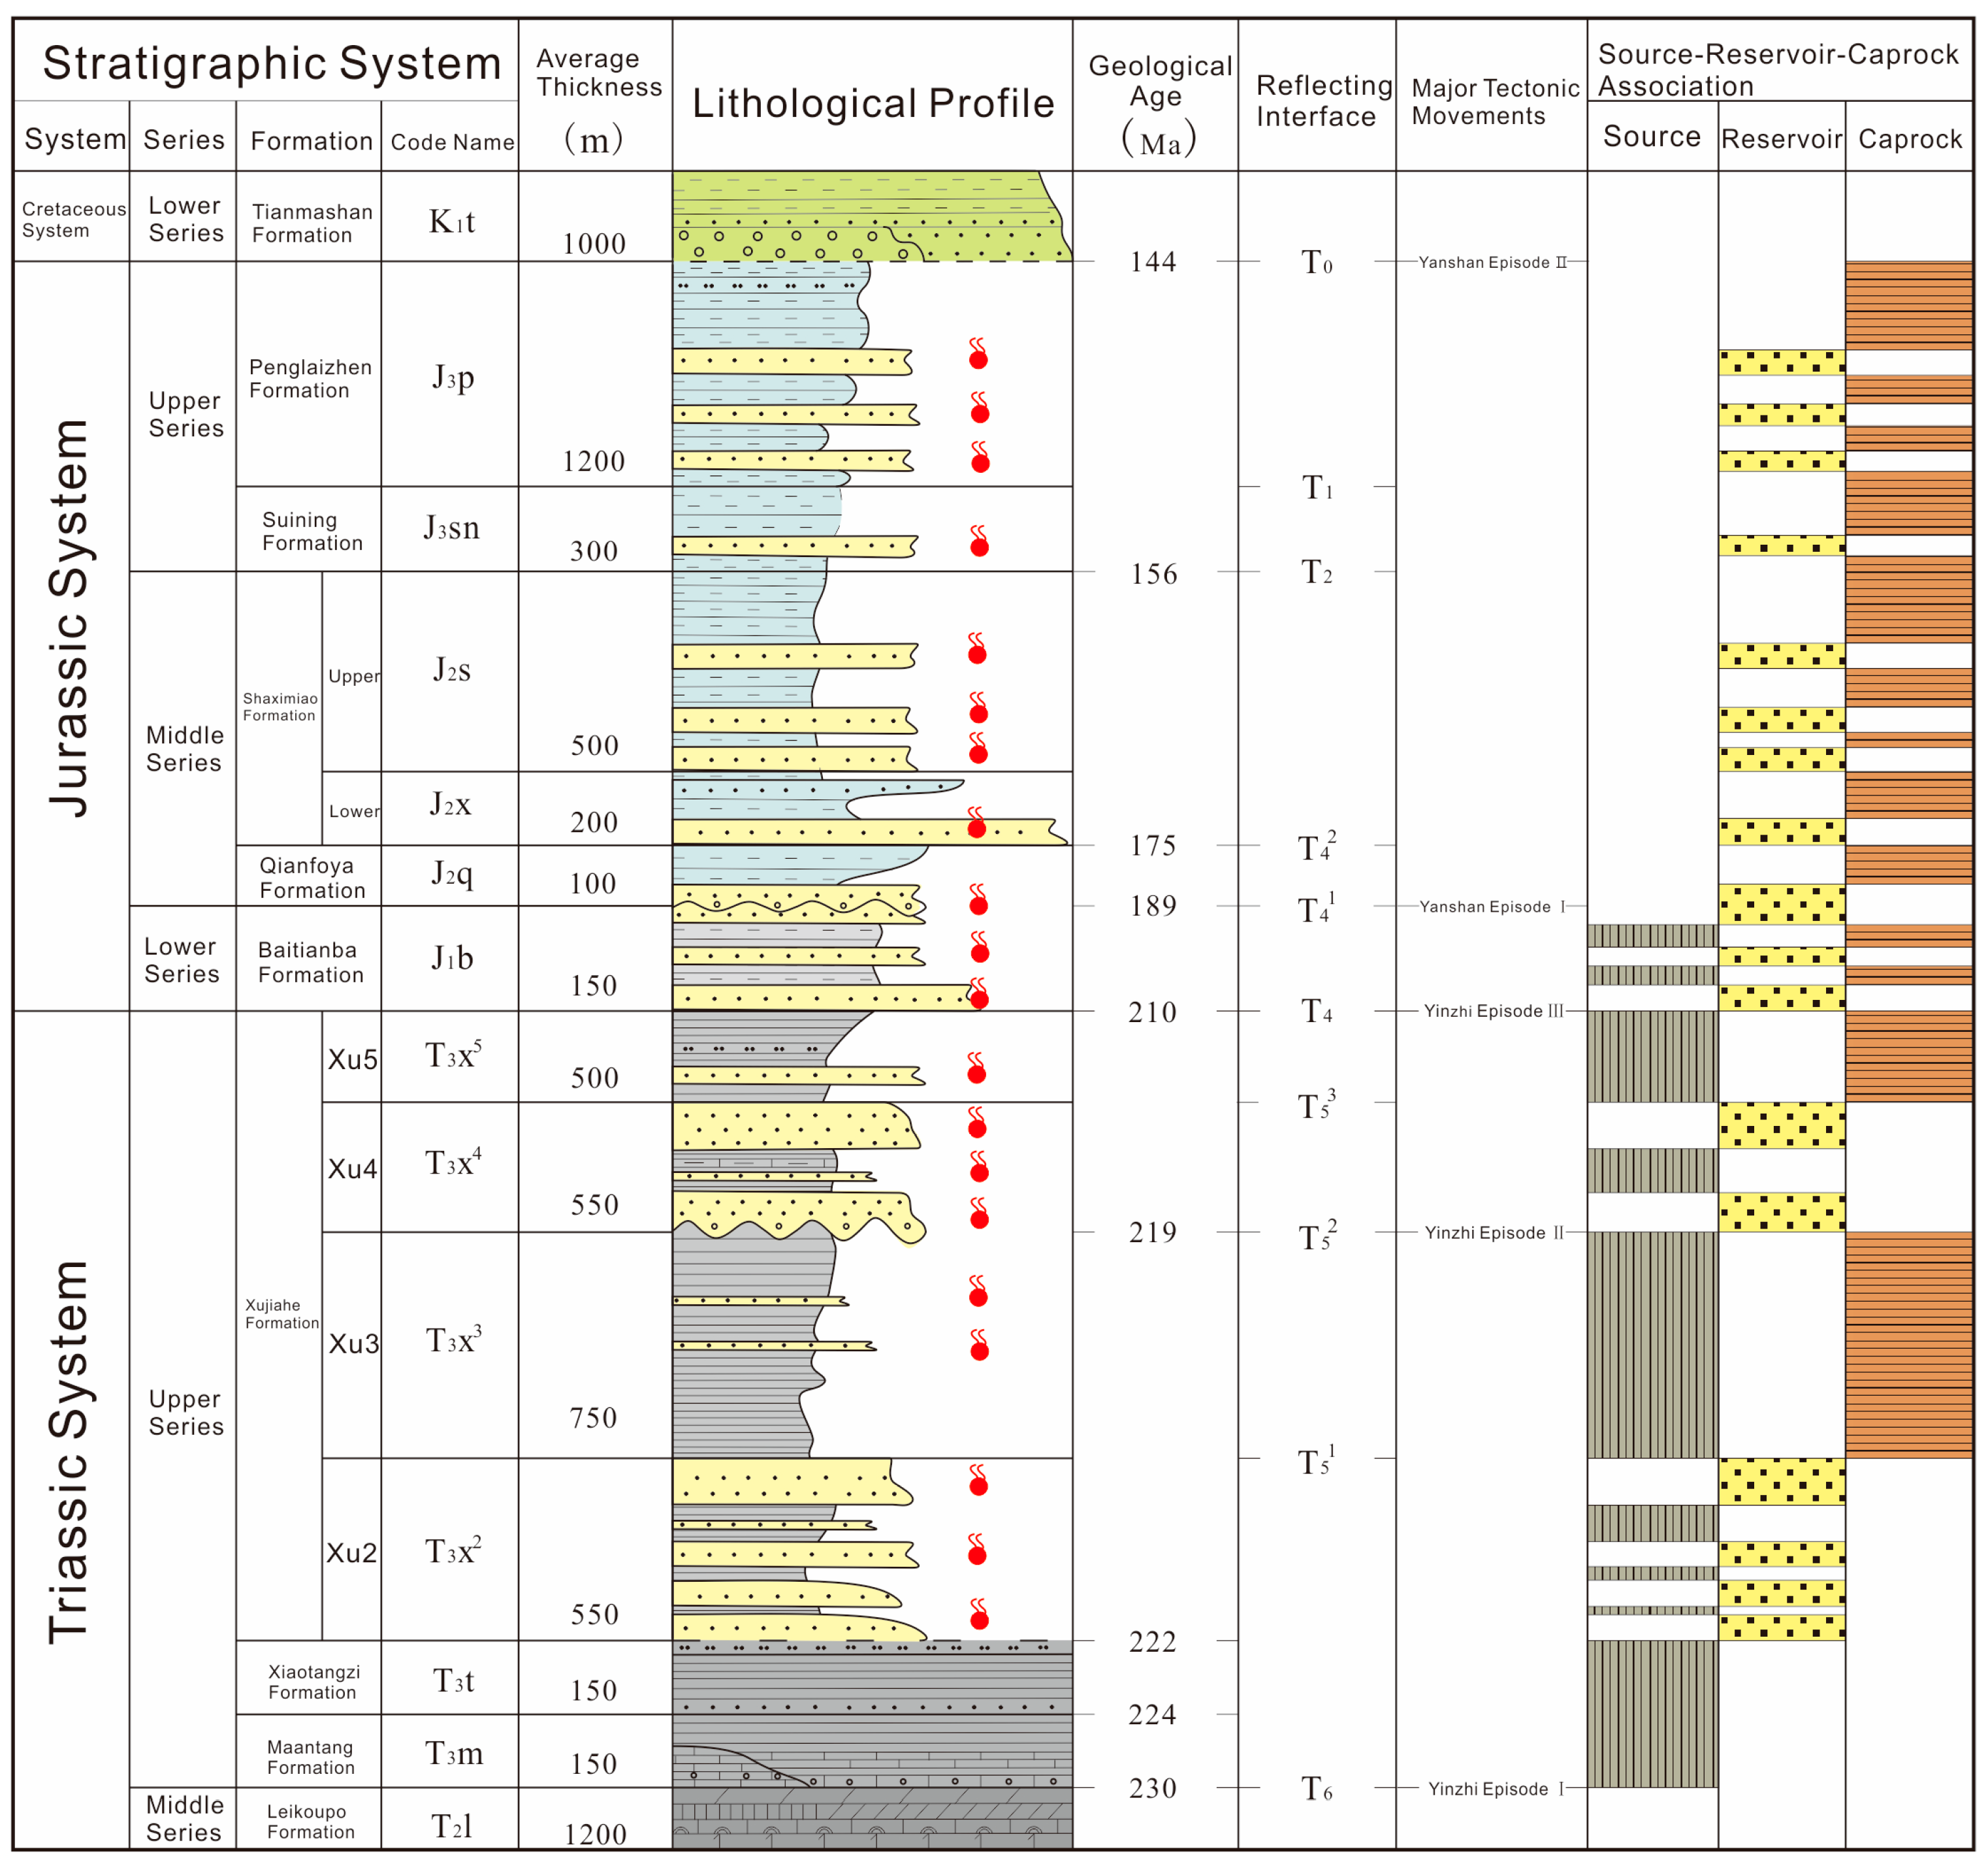
Indosinian tectonic reorganization during the Late Middle Triassic, characterized by the Longmen Mountain thrust-nappe movement, fundamentally altered the basin’s depositional regime. Post-orogenic sedimentation developed a stratigraphic succession comprising the Upper Triassic marine-continental transitional facies (Ma’antang–Xiaotangzi Formation), followed by continental clastic and coal-bearing strata of the Xu 2, Xu 3, Xu 4, and Xu 5 Members, and culminating in Jurassic–Cretaceous continental red beds [24,25]. Within this succession, the Ma’antang–Xiaotangzi Formation, Xu 3, and Xu 5 Members function as primary source rocks, while the Xu 2 and Xu 4 Members constitute the principal reservoir units (Figure 2).
The hydrocarbon system of the Second Member of the Xujiahe Formation in the Xinchang area of the Western Sichuan Depression represents a typical tight sandstone gas accumulation. Its gas source is primarily derived from the underlying coal-bearing source rocks of the Third and Fifth Members of the Xujiahe Formation. The reservoir predominantly consists of medium to fine-grained lithic quartz sandstone, characterized by low porosity and permeability (generally < 10% porosity and mostly < 0.1 mD permeability). Pore types are dominated by secondary dissolution pores and microfractures. The basal mudstone of the Third Member forms a high-quality regional seal, and the occurrence of formation overpressure effectively enhances sealing capacity. The hydrocarbon accumulation process primarily occurred during the Late Jurassic to Early Cretaceous (J3-K1), exhibiting characteristics of “accumulation before densification”.

3. Materials and Methods

The samples used in this study were collected from different depths of the Second Member of the Xujiahe Formation in the Xinchang area, western Sichuan. The samples are mainly composed of sandstone. All selected core samples were photographed, and physical property tests (porosity and permeability) were conducted, with their petrological characteristics described simultaneously. The fluid inclusion analysis of the samples mainly included two steps: petrological observation and microthermometric analysis. All experiments were completed in the State Key Laboratory of Oil and Gas Reservoir Geology and Exploitation, Chengdu University of Technology.
Thin sections with a standard thickness (0.03 mm) after treating blue epoxy resin by the vacuum impregnation method. By means of microscopic observation and the point-counting technique (300 points counted per thin section), we conducted composition and structure analysis using an advanced Leica DM2500P polarized-light fluorescence microscope equipped with a fluorometer. Based on 241 samples obtained from cores, and in accordance with the industry standard SY/T 5336-2006 [26], we determined the porosity and permeability values at this depth using an Ultrapore-200A helium porosimeter and an Ultra-perm200 permeameter under the conditions of a room temperature of 23 °C, a humidity of 51%, and an atmospheric pressure of 1.025 × 10⁵ Pa. Porosity determines the reservoir’s capacity to store oil and gas, while permeability controls the ability of oil and gas to flow in the reservoir. By combining microscopic observation and reservoir quality analysis, we revealed the characteristics of particle size, pore types, diagenetic minerals, and the relative chronological sequence of diagenetic events.
The thermometric analysis of fluid inclusions was carried out in accordance with the SY/T 6010-1994 standard [27] using a LINKAM THMS600 heating–cooling stage with a temperature error of ±0.1 °C. The thermometric experiment was conducted under the conditions of a room temperature of 20 °C and a humidity of 30%. The sample testing was completed in the State Key Laboratory of Oil and Gas Reservoir Geology and Exploitation, Chengdu University of Technology.
Carbon and oxygen isotope analyses were conducted at the National Key Laboratory of Oil and Gas Reservoir Geology and Engineering, Chengdu University of Technology. A total of 54 samples were selected with the aim of determining the isotopic composition of carbonate cements in the reservoir. Following sample preparation steps including sectioning, grinding, and drying, carbonate cements were targeted using a laser microsampling device (with a spot diameter of 10 μm) for thermal decomposition. The released gases were subsequently analyzed by an isotope ratio mass spectrometer, with an analytical precision better than ±0.22‰.

4. Results

4.1. Reservoir Characteristics

4.1.1. Petrological Features

Previous studies indicate two primary provenance directions during the deposition of the Xu 2 Member in the Xinchang area: northwestern (Longmen Mountains) and northeastern (Qinling-Daba Mountains) sources [28]. The northwestern provenance supplied lithic sandstone and lithic quartz sandstone dominated by sedimentary rock fragments with low feldspar content, while the northeastern provenance contributed feldspathic lithic sandstone and lithic sandstone enriched in feldspar and volcanic lithic fragments.
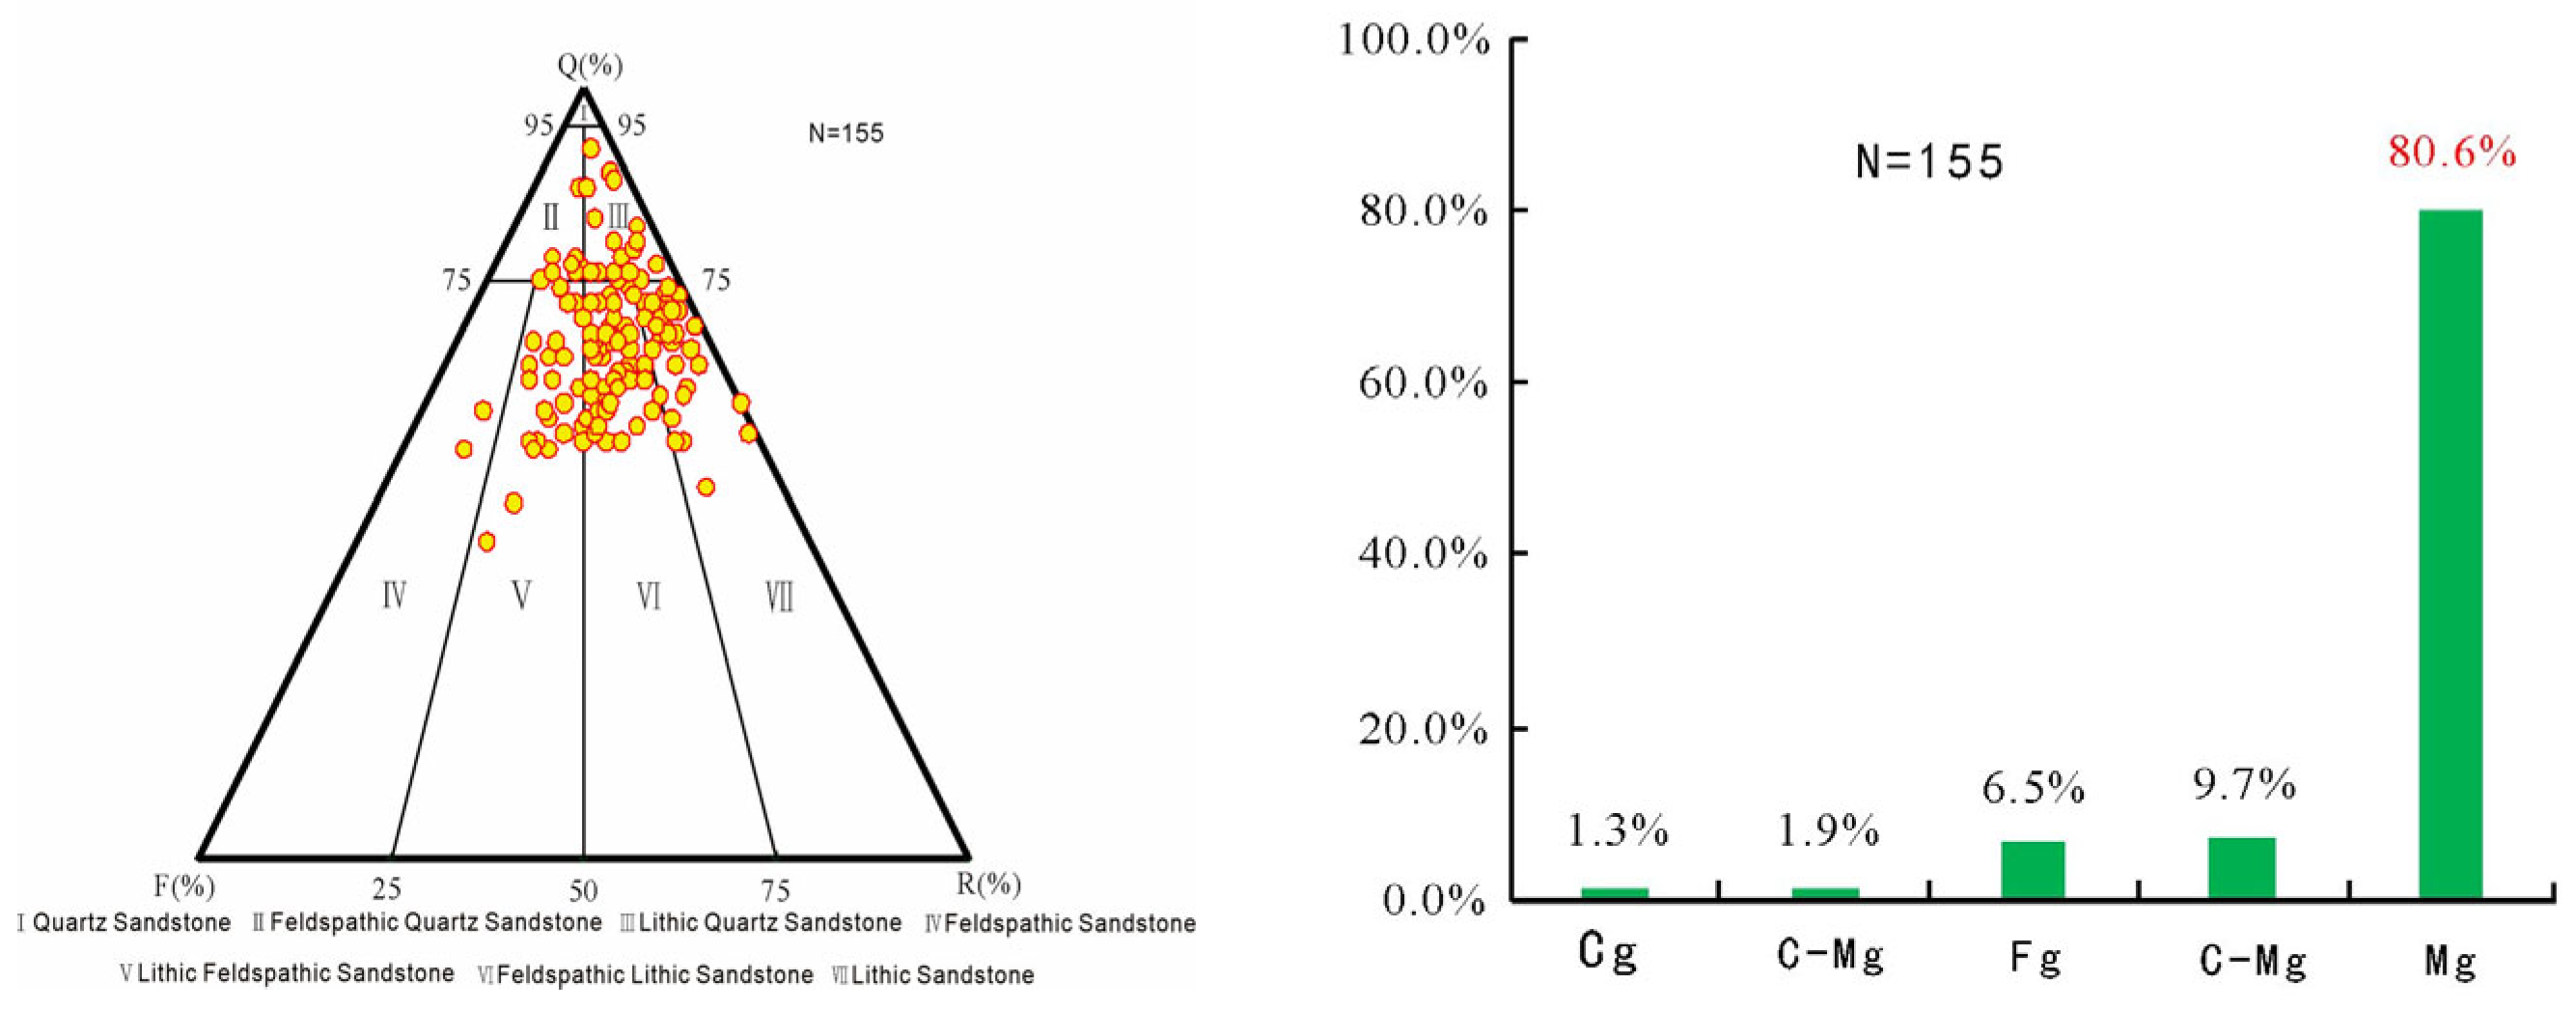
Thin section analysis demonstrates that the Xu 2 Member reservoirs are predominantly composed of medium-grained lithic sandstone, lithic feldspathic sandstone, and feldspathic lithic sandstone. Mineralogical composition averages 67.1% quartz, 12.4% feldspar, and 20.3% lithic fragments. Grain-size analysis reveals medium-grained sandstone as the dominant textural type, followed by fine- to medium-grained varieties (Figure 3). Sorting ranges from good to moderate, with subangular grain morphologies prevailing.

4.1.2. Reservoir Physical Properties

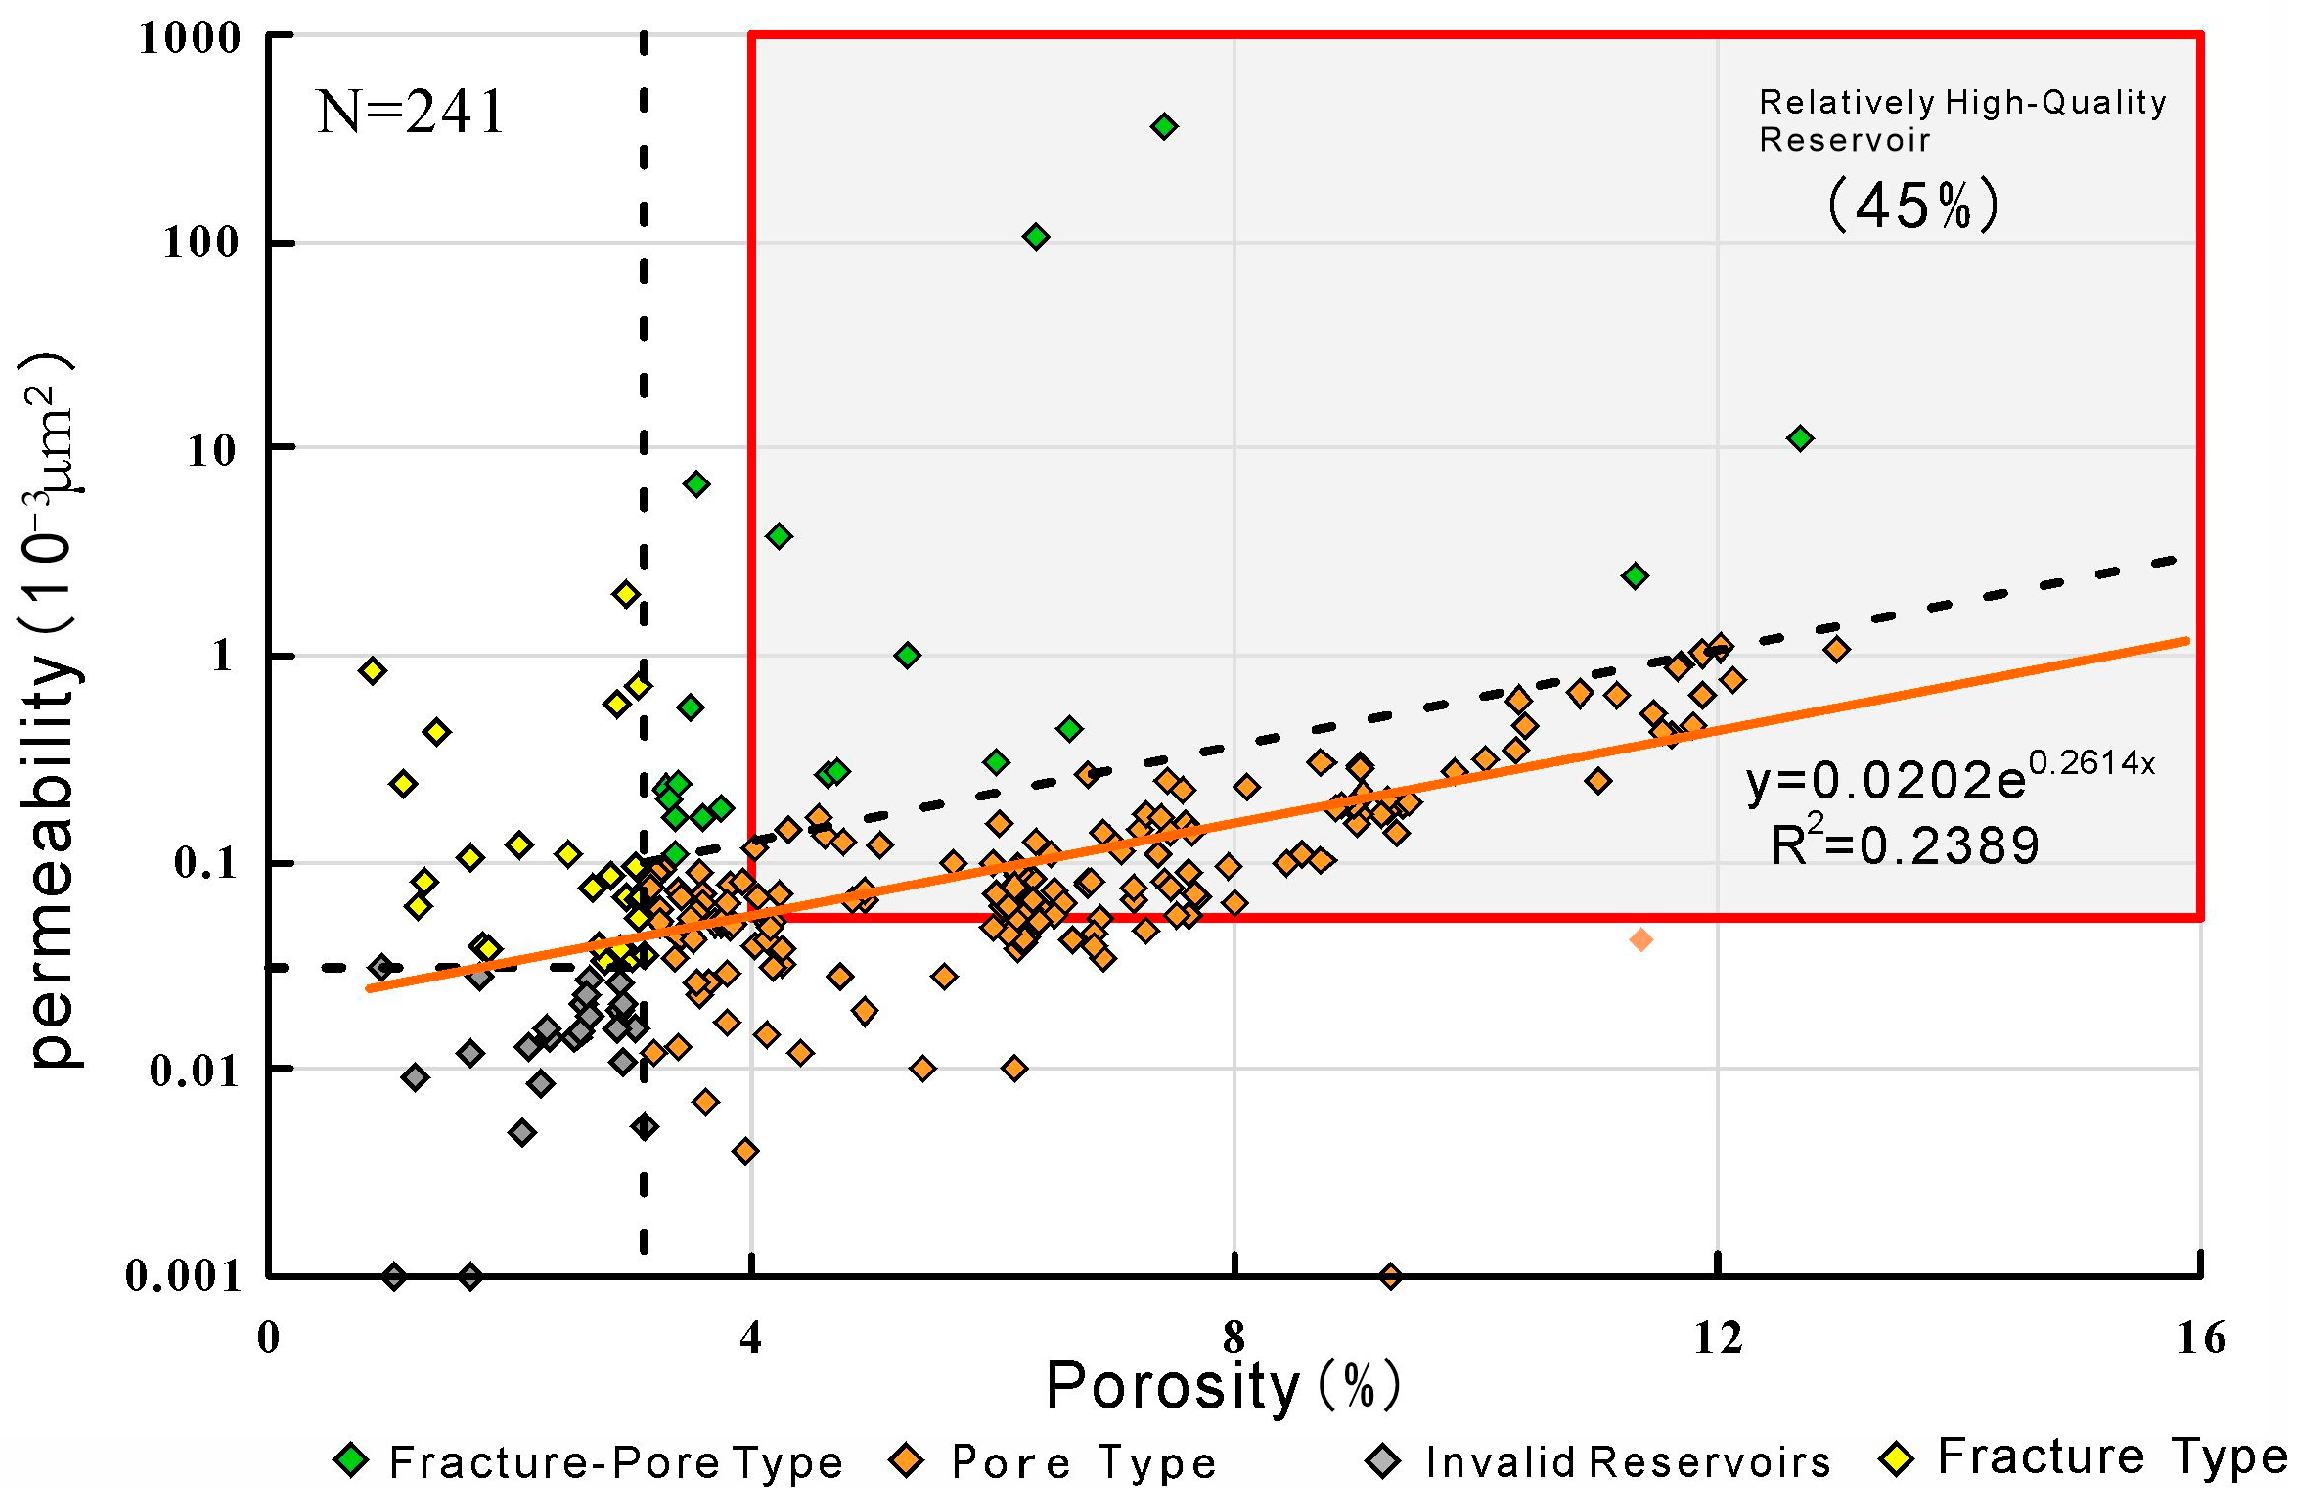
Analysis of 241 core samples from the Xu 2 Member reveals ultra-low porosity (2%–8%, average 5.6%) and permeability ((0.01 − 1) × 10−3·μm2) (Figure 4), with fracture-enhanced samples reaching up to 365 × 10−3 μm2. These tight sandstones exhibit strong heterogeneity, locally developing low-porosity, moderate-permeability zones. Quartz sandstones display the highest porosity, followed by feldspathic quartz sandstones, while lithic feldspathic sandstones show the lowest values, confirming lithological control on reservoir quality [29]. Relatively high-quality reservoirs in this system are defined by porosity > 4% and permeability > 0.06 × 10⁻³ μm2 [30], accounting for 45% of the total samples. Four reservoir types are classified based on pore-permeability relationships: non-reservoirs (porosity < 3%, permeability < 0.03 × 10⁻³ μm2) lack visible pores or fractures under microscopy; pore-type reservoirs (porosity > 3% with permeability-porosity correlation) are dominated by pore networks but require hydraulic fracturing for production; fracture-type reservoirs (porosity < 3% but permeability > 0.03 × 10⁻³ μm2) rely on fractures but exhibit rapid production decline; and fracture-pore reservoirs, combining effective pore-throat systems and fractures, represent the most prospective type [31]. The Xu 2 Member’s relatively high-quality reservoirs predominantly comprise pore-type and fracture-pore systems (Figure 5).

4.2. Controls on Reservoir Porosity

4.2.1. Compaction Effects

Compaction intensity generally increases with greater burial depth. Analysis of negative cement porosity diagrams from representative wells shows that most Xu 2 Member samples cluster in the lower-left quadrant (Figure 6), indicating substantial porosity reduction dominated by compaction. Quantitatively, compaction accounts for over 70% of total porosity loss, establishing it as the primary factor degrading reservoir quality in the study area. The compaction porosity reduction rate in the study wells ranges from 63.29% to 84.87% (Table 1).

4.2.2. Cementation Effects

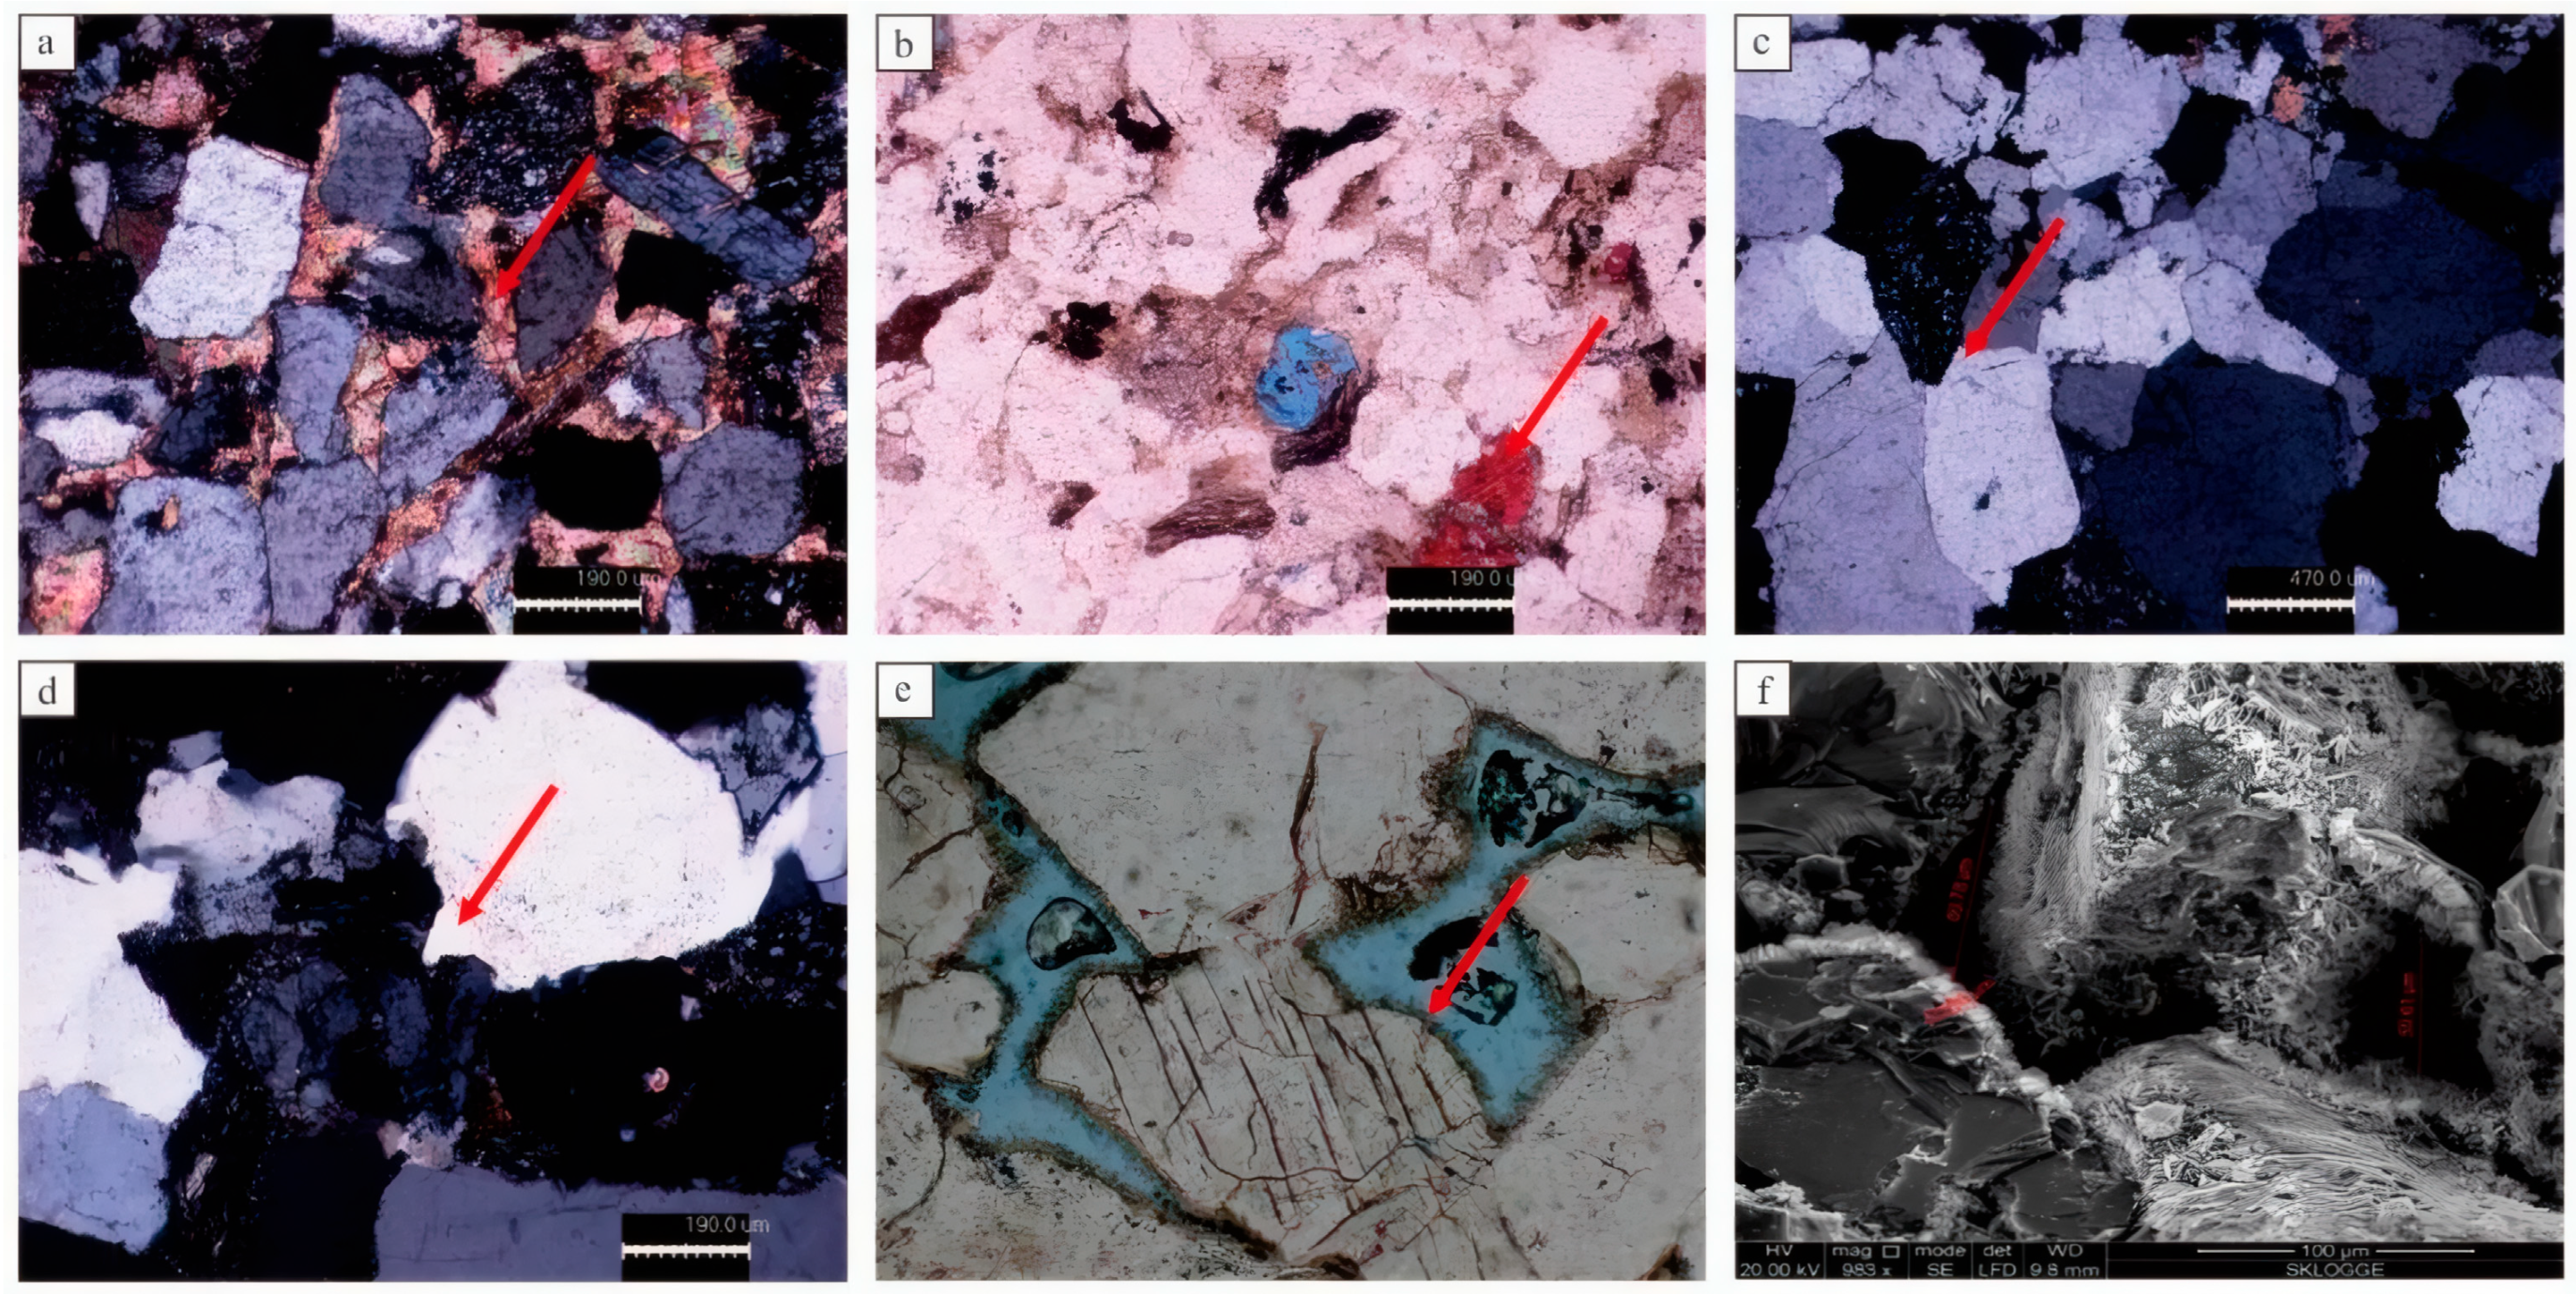
Thin section observations reveal diverse cement types in the Xu 2 Member reservoirs, dominated by carbonate cements, followed by silica cements and authigenic chlorite. Carbonate cements primarily infill primary pores, while late-stage carbonate cementation further occludes secondary pores, significantly degrading reservoir quality (Figure 7). Silica cements similarly impair reservoir properties through quartz overgrowths that replace original point or point-line grain contacts with line or concavo-convex contacts (Figure 7). Authigenic chlorite forms pore-lining rims (Figure 7), which mechanically resist compaction and inhibit secondary quartz growth, thereby preserving primary pore-throat systems. This dual mechanism establishes chlorite as a critical agent for primary porosity retention.

4.2.3. Dissolution Effects

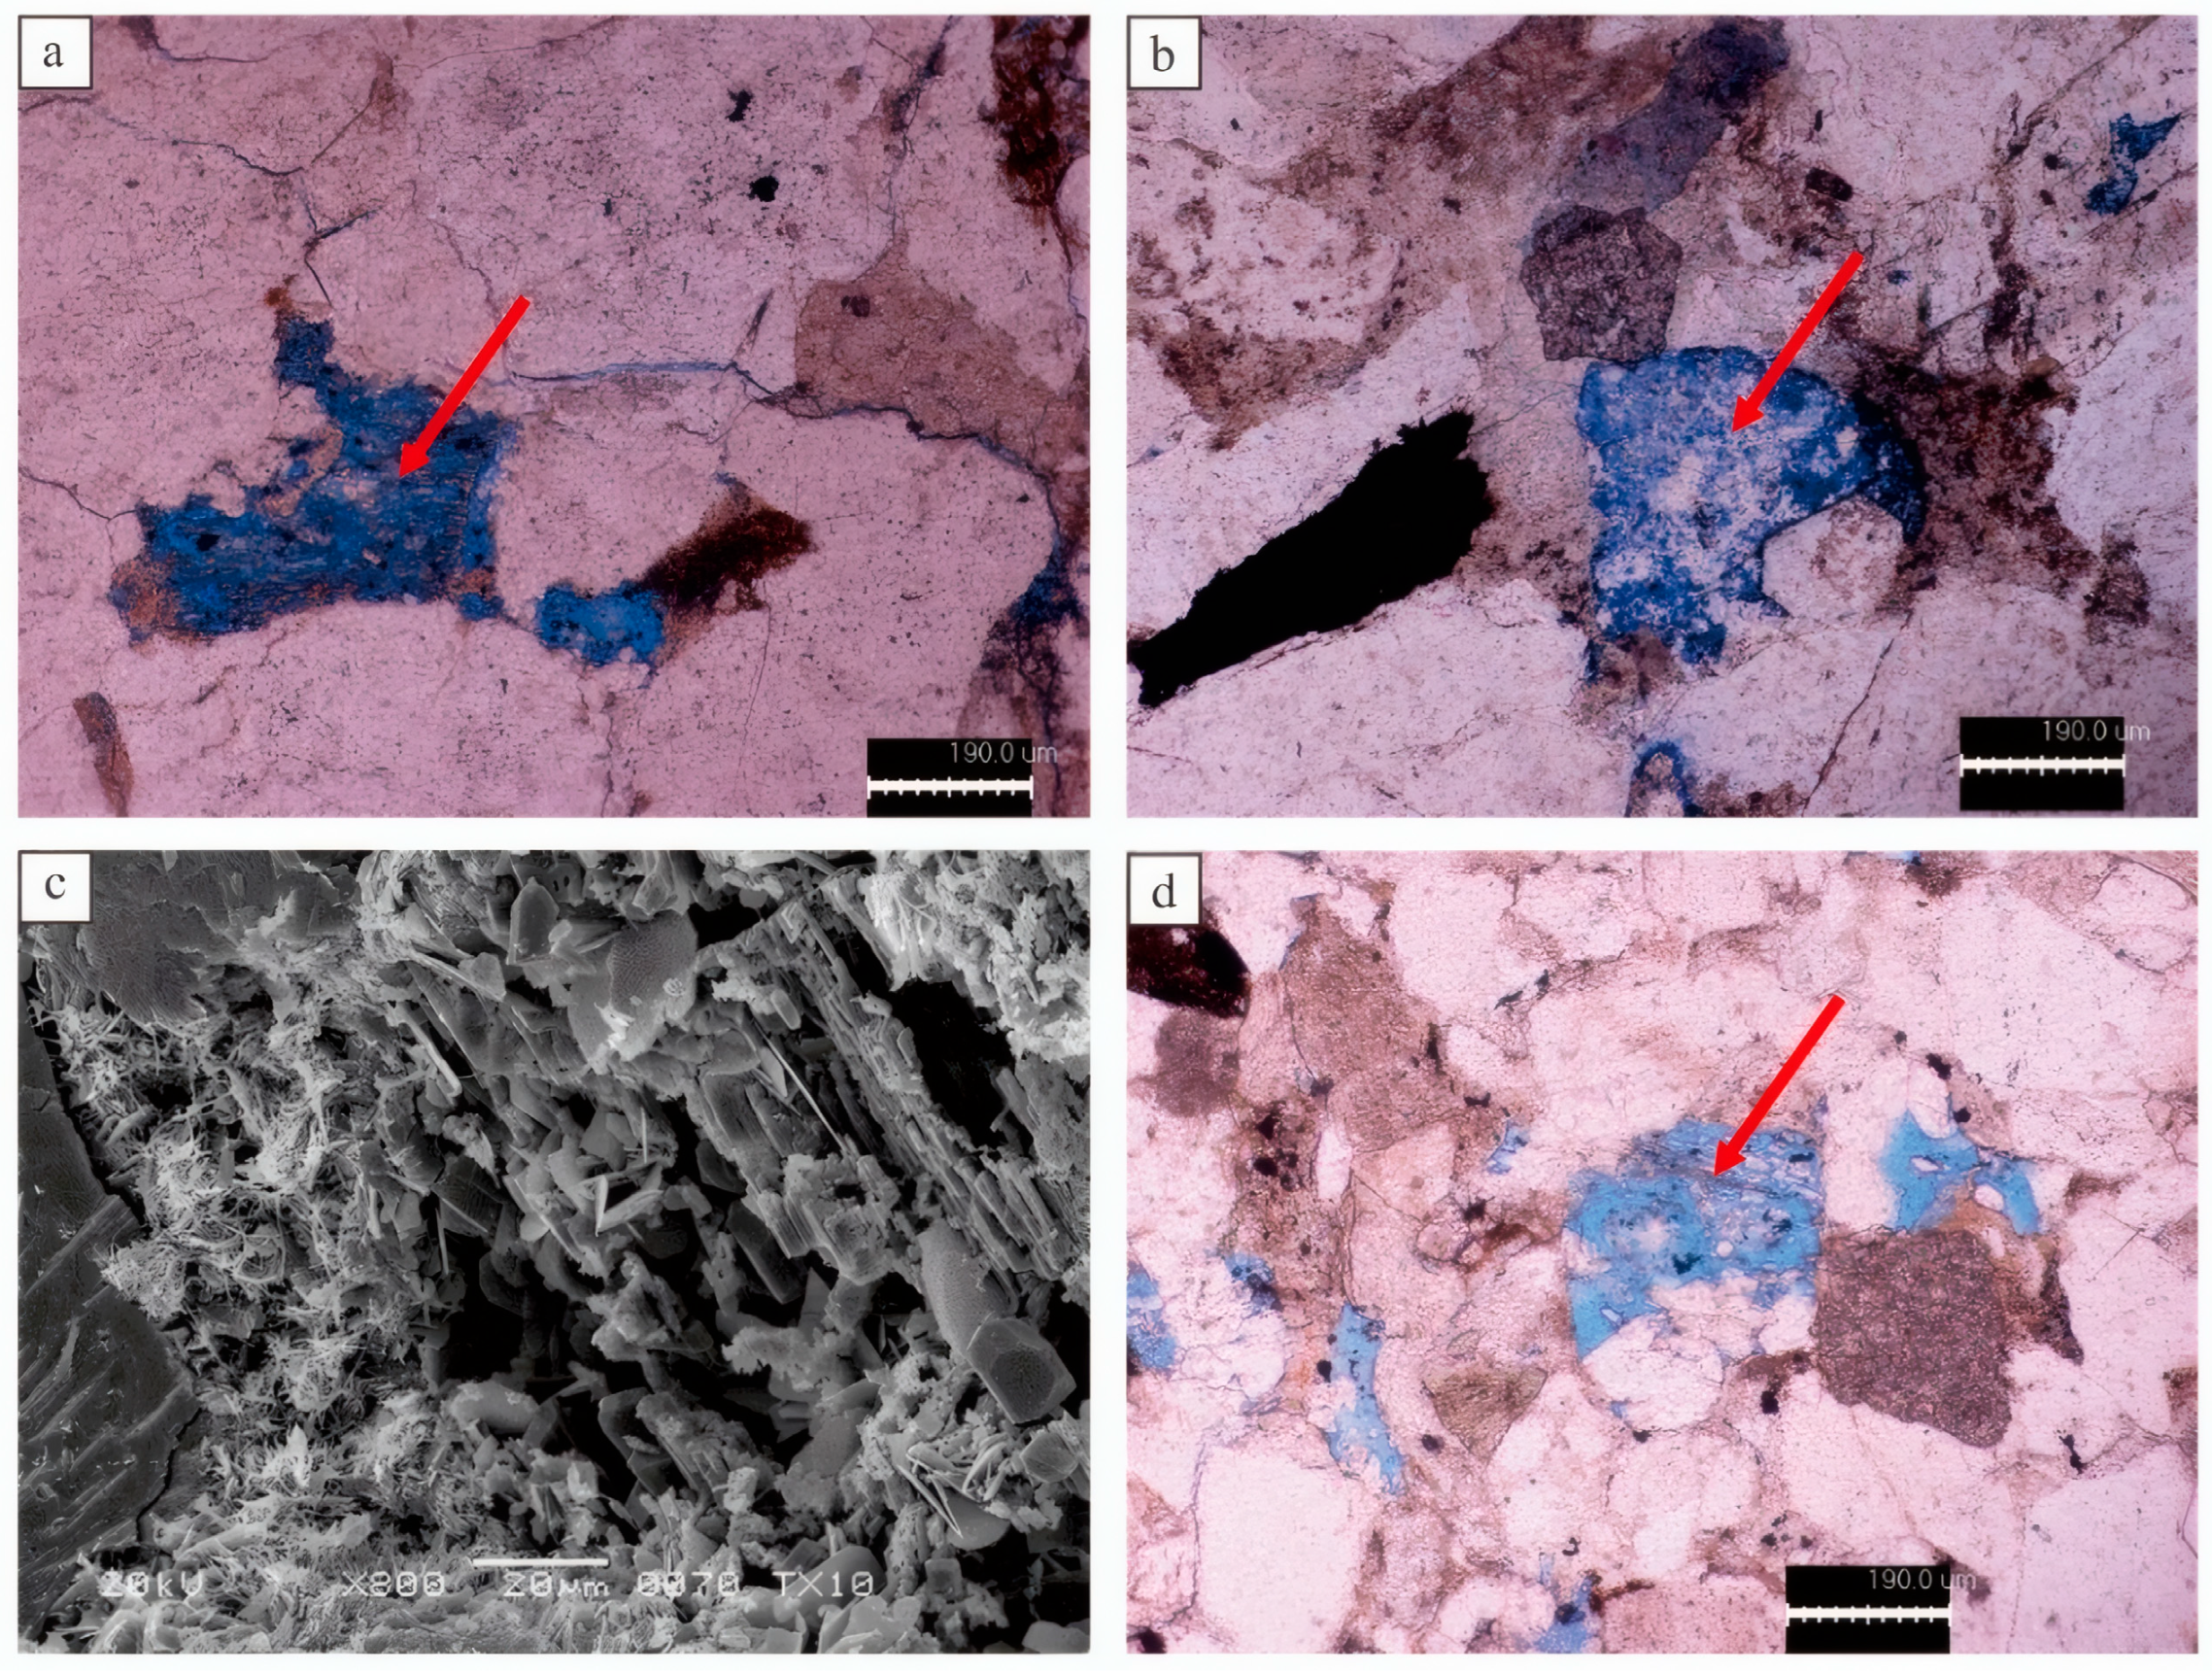
Dissolution processes are well-developed in the Xu 2 Member reservoirs of the Xinchang area, Western Sichuan. Feldspar dissolution exhibits the most distinct microscopic characteristics, primarily occurring along cleavage planes, with some feldspar grains displaying honeycomb-like textures or even moldic pores (Figure 8). Lithic fragment dissolution is dominated by selective leaching of soluble components (e.g., feldspar) within rock fragments, forming intragranular dissolution pores. As the key mechanism for generating relatively high porosity during reservoir densification, dissolution represents the most critical factor improving reservoir quality in the Xu 2 Member. Based on carbon and oxygen isotope analyses of carbonate cements, the δ13CPDB (‰) values range from −1.93‰ to 8.7‰, with a mean value of 0.9‰; the δ18OPDB (‰) values vary between −3.62‰ and −16.7‰, averaging −13.07‰ (Figure 9). The more negatively shifted δ18OPDB values are indicative of higher precipitation temperatures, suggesting influence from deep hydrothermal fluids. Meanwhile, the strongly negative δ13CPDB excursions imply involvement of organic acid-rich fluids. Overall, the considerable variation in δ13CPDB values suggests that the diagenetic fluids were not derived from a single source but rather resulted from mixing of multiple fluid endmembers [32].
A comparison with the Shaximiao Formation in the Xinchang area of western Sichuan shows that the gas reservoir in the Shaximiao Formation exhibits well-developed late-burial dissolution, which is also predominantly characterized by intragranular dissolution of feldspar, resulting in intragranular pores and moldic pores. Locally, intergranular dissolution-enlarged pores and intercrystalline dissolution pores within cements are also observed. Porosity demonstrates a positive correlation with the intensity of dissolution, indicating that an increase in dissolution leads to enhanced reservoir porosity [33].

4.3. Fluid Inclusion Characteristics

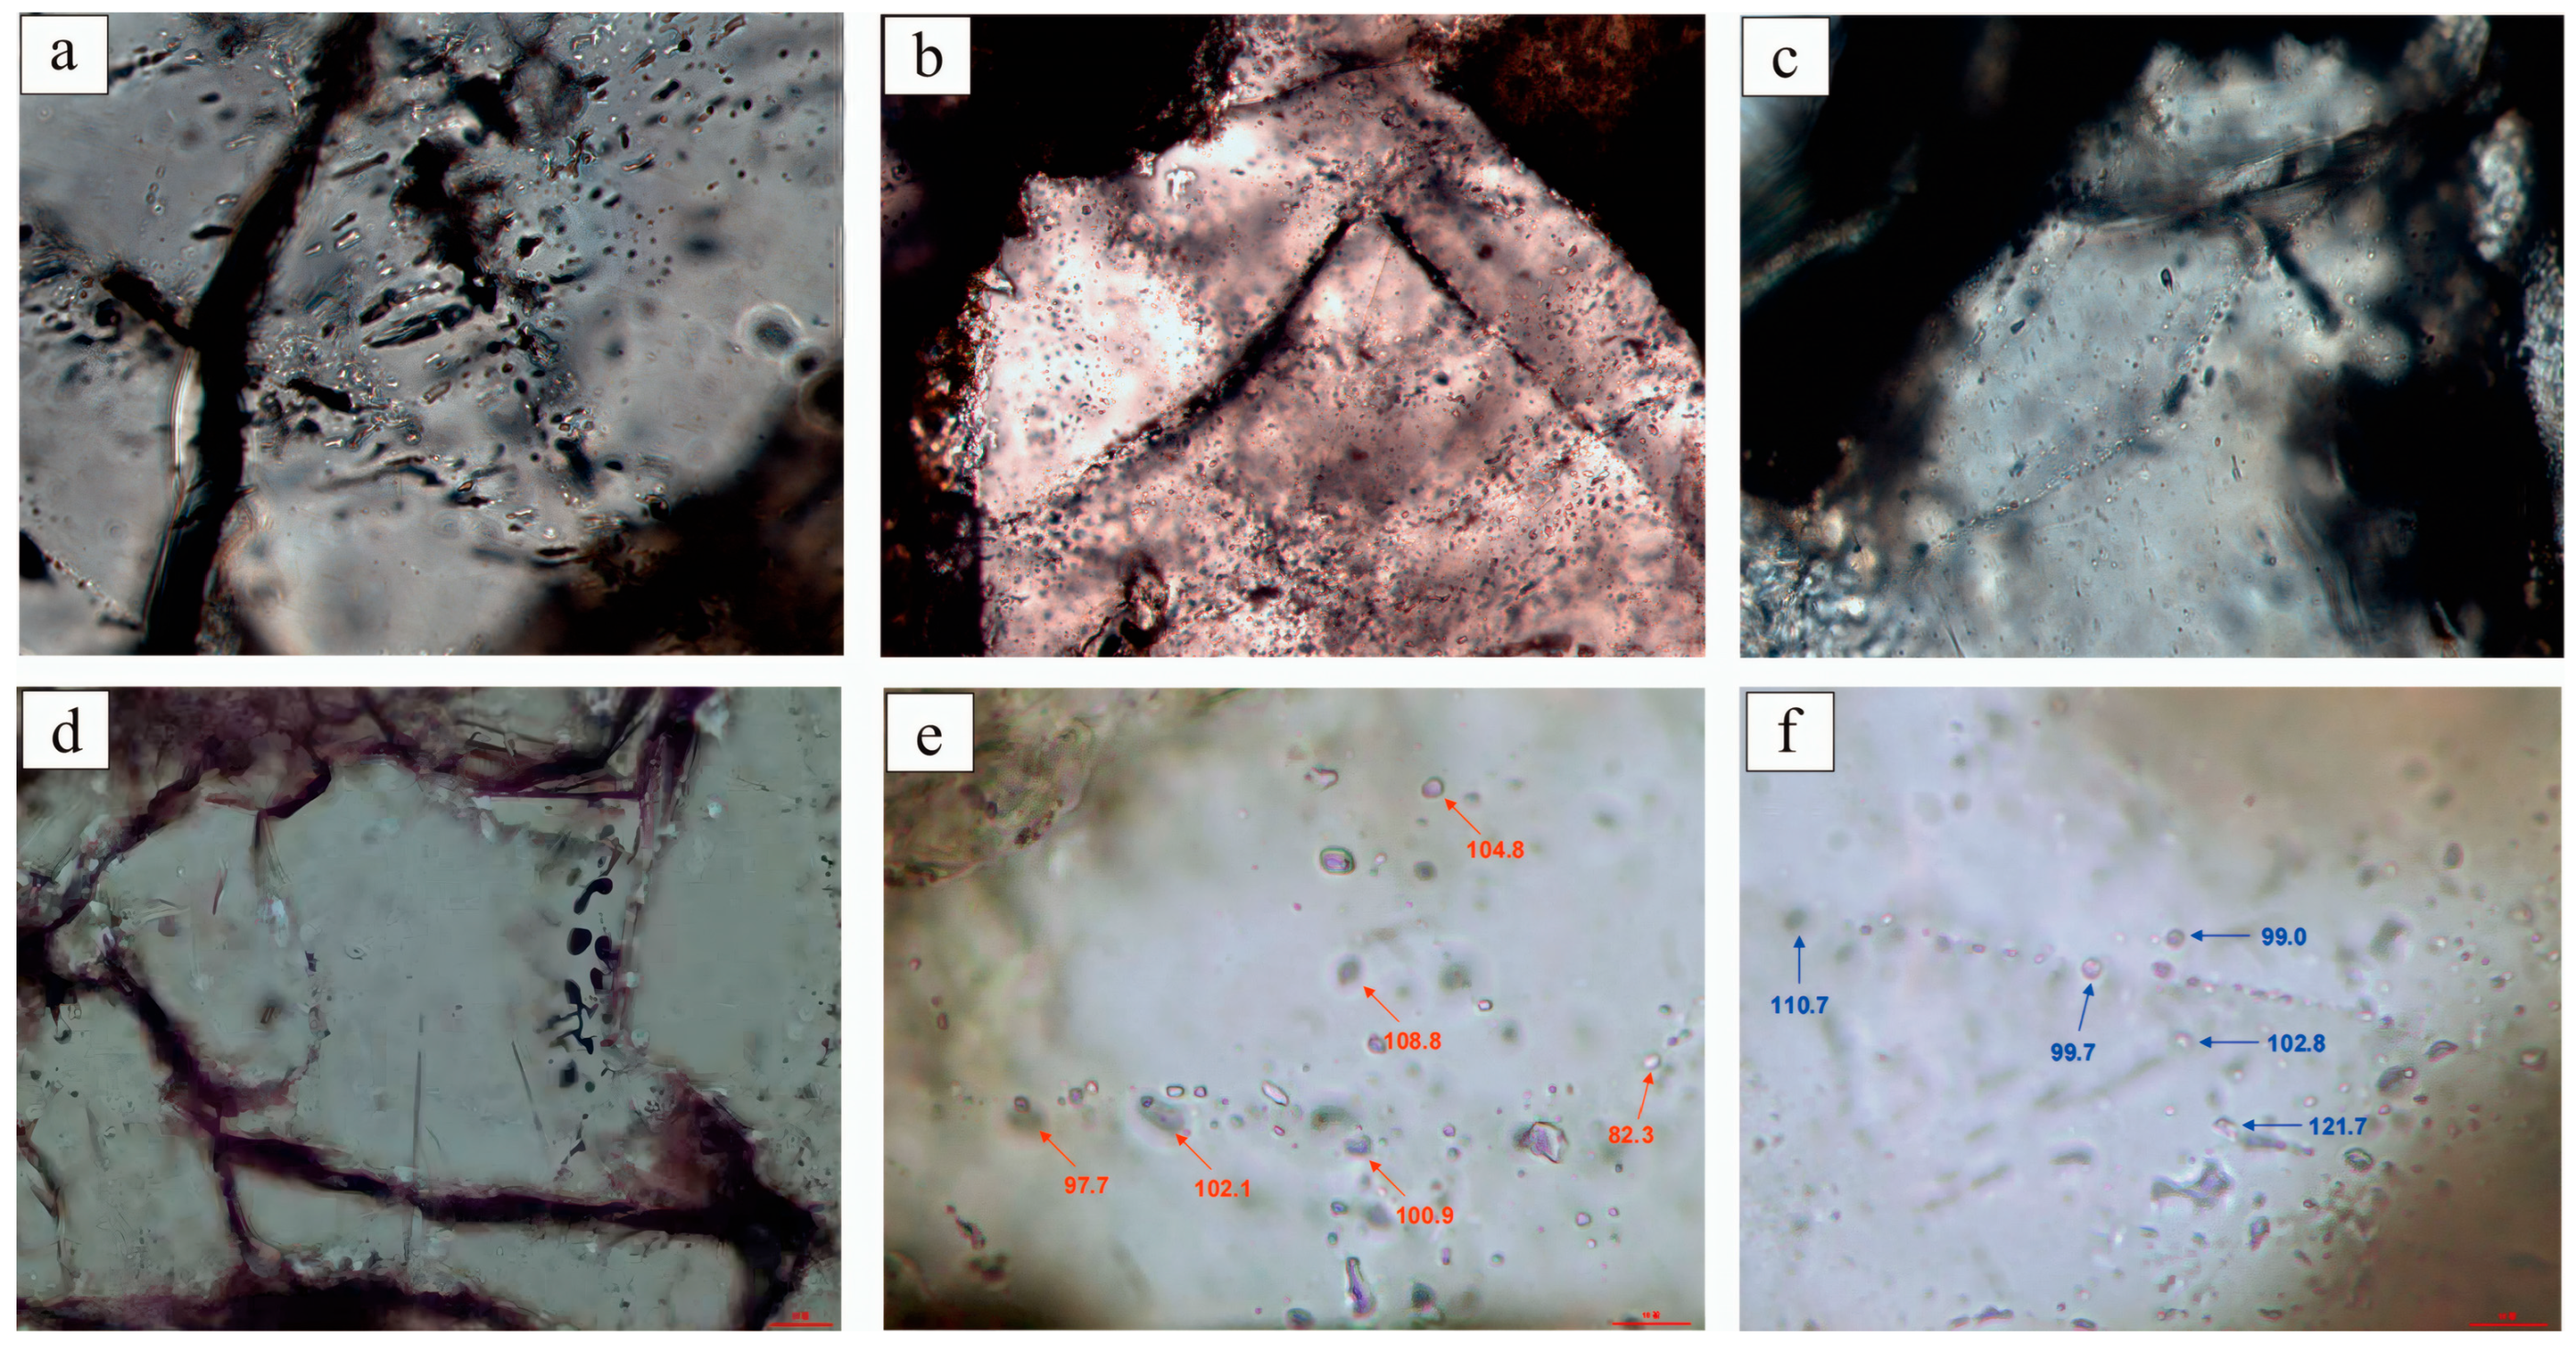
Fluid inclusion microcharacteristics in the Xu 2 Member are illustrated in Figure 10. Petrographic analysis of host mineral types, spatial distribution, mineral generations, and inclusion classifications provides the foundation for phase division and genetic interpretation. Hydrocarbon-bearing inclusions predominantly occur in transgranular quartz fractures, diagenetic microcracks within quartz grains, quartz overgrowths, and carbonate cements, with transgranular fractures hosting the highest abundance. These inclusions exhibit diameters of 5–25 μm, displaying elliptical, polygonal, and irregular morphologies. Fluorescence microscopy reveals characteristic light white, pale yellow, bluish-white, and pink emissions (Figure 10).

4.4. Homogenization Temperatures of Fluid Inclusions

The homogenization temperature of fluid inclusions refers to the instantaneous temperature at which a gas-liquid two-phase system transitions into a single homogeneous phase during heating [34]. Measuring homogenization temperatures of aqueous inclusions associated with hydrocarbon inclusions not only determines their formation temperatures but also provides critical constraints on the thermal evolution and burial history of the study area. Coexisting aqueous inclusions with hydrocarbon inclusions, particularly those with vapor–liquid ratios ≤5%, are selected for temperature measurements, as their homogenization temperatures reliably represent hydrocarbon inclusion formation conditions [35]. Hydrocarbon-bearing aqueous inclusions generally exhibit higher homogenization temperatures compared to pure aqueous inclusions at similar vapor–liquid ratios, reflecting hydrocarbon charging temperatures [36].
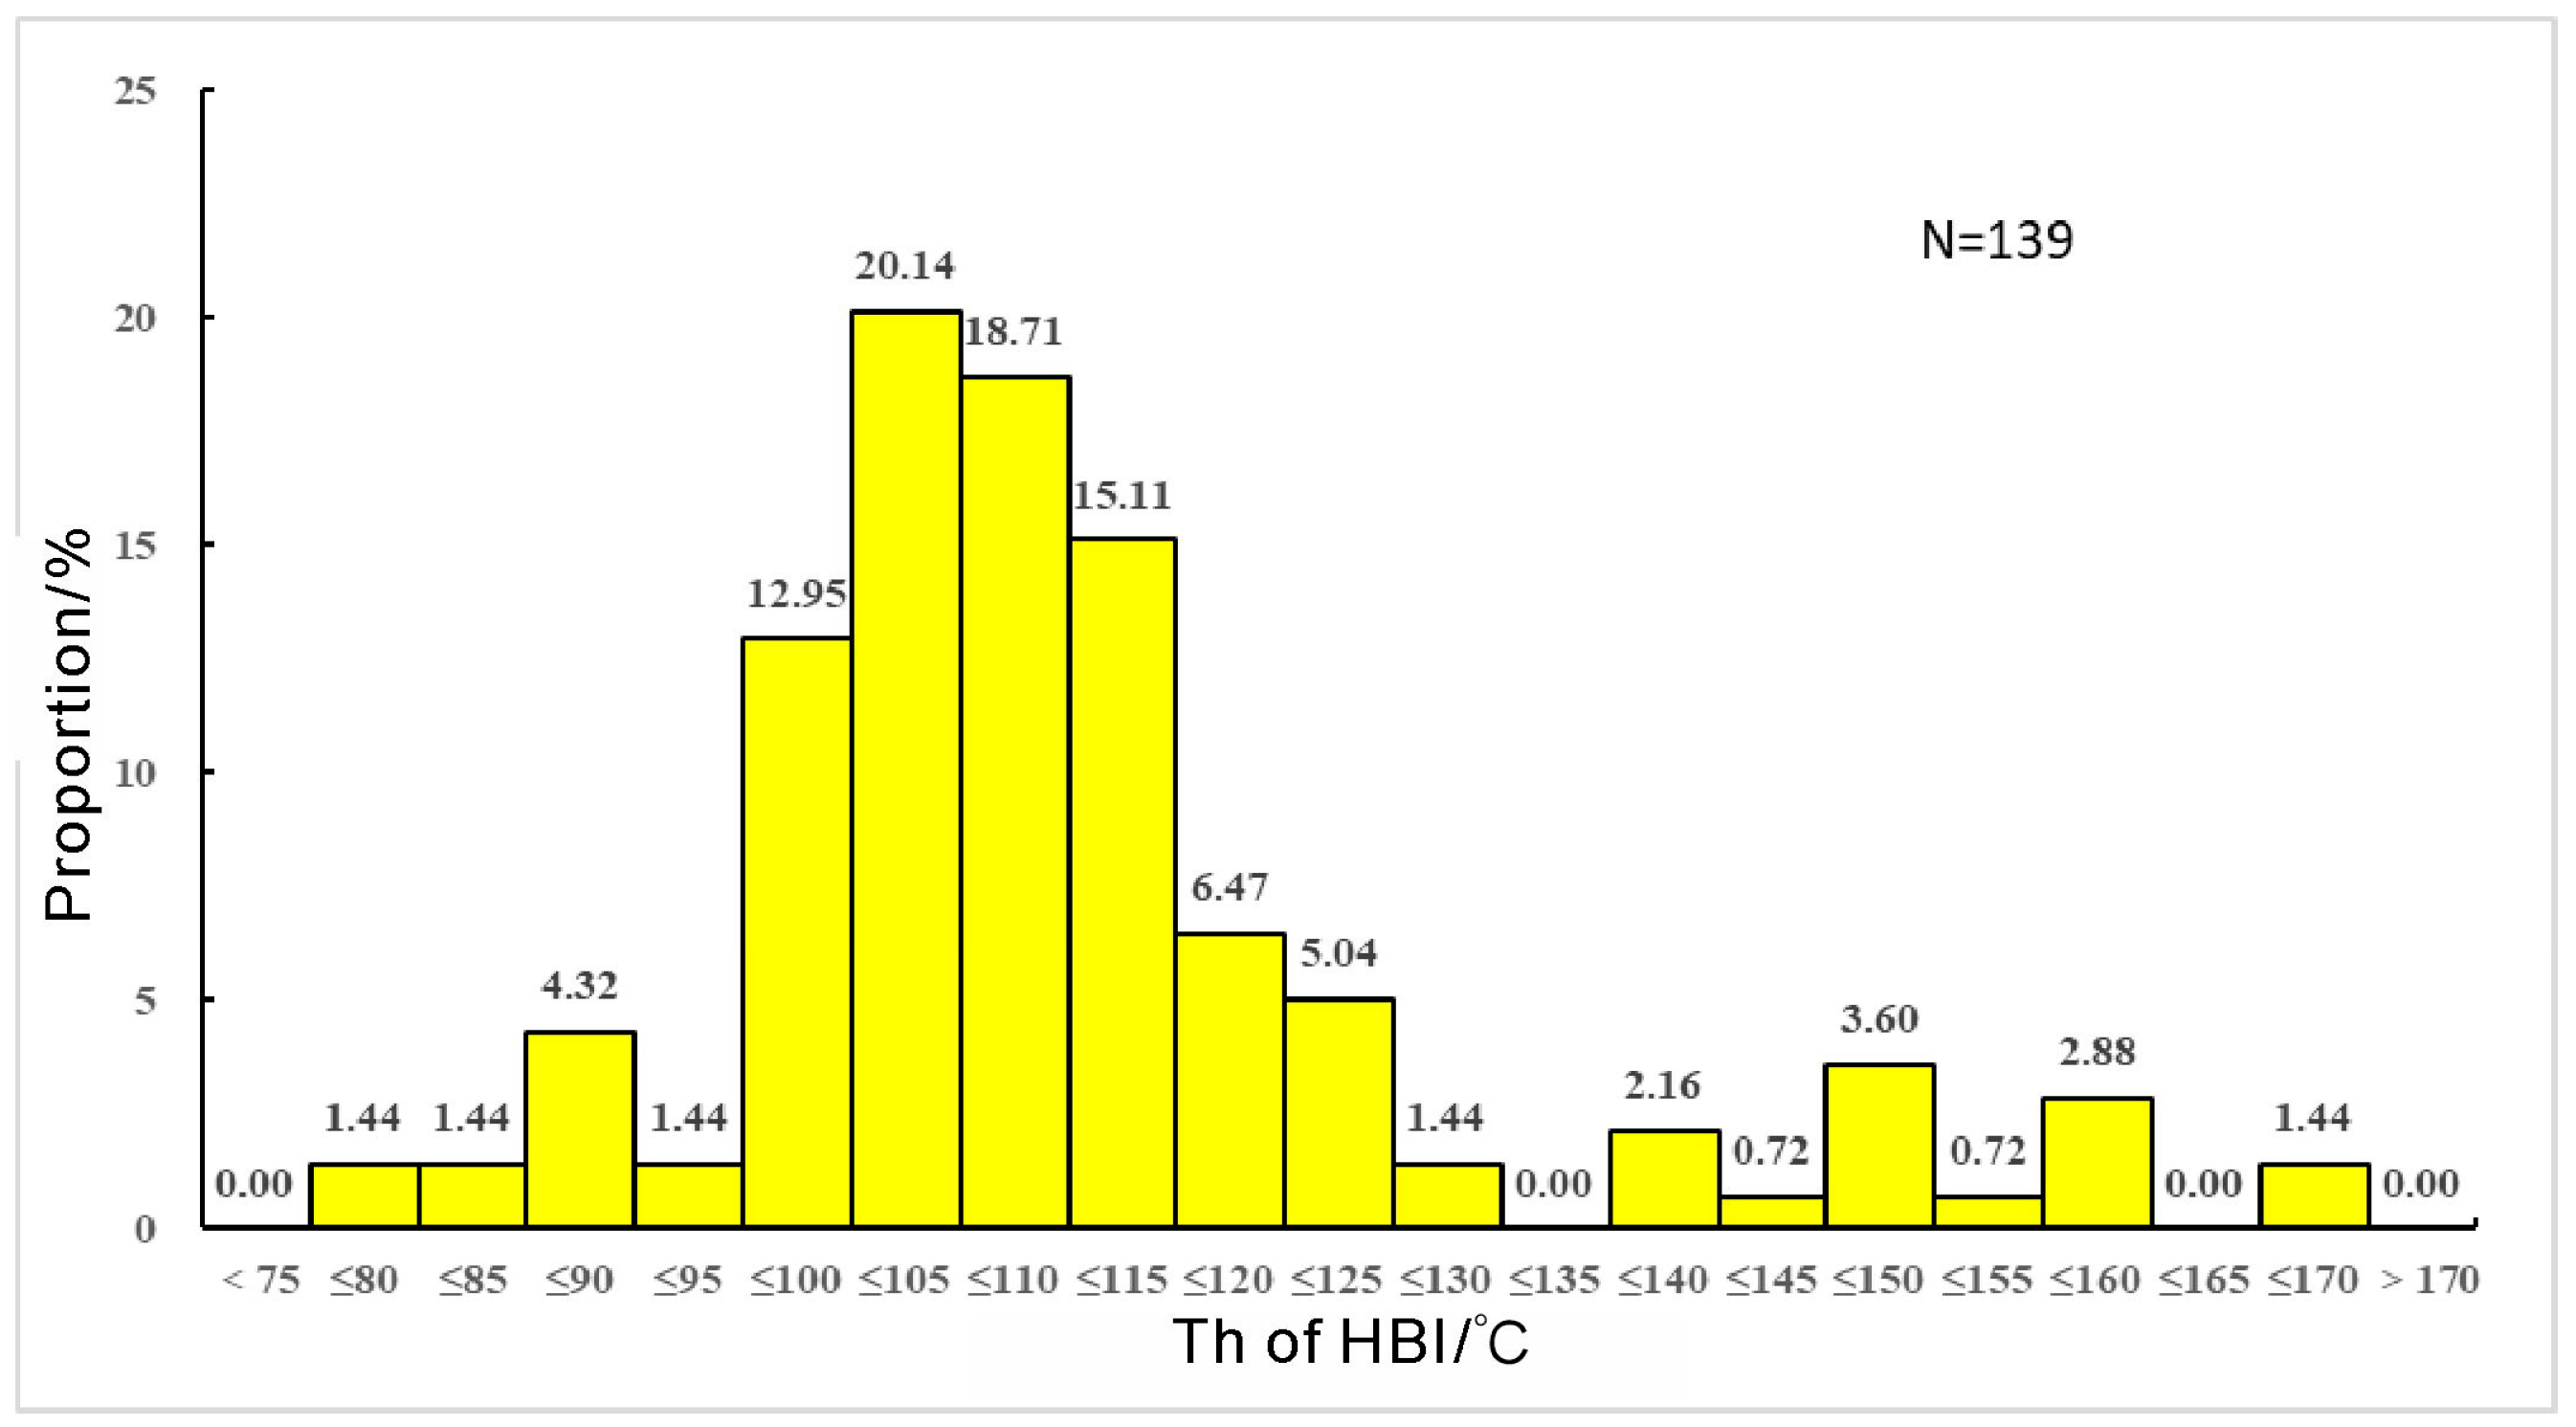
Analysis reveals homogenization temperatures of associated hydrocarbon-bearing aqueous inclusions ranging from 75–170 °C, with a dominant peak interval of 100–120 °C. Integrated with paleo-thermal and burial history models, this temperature range corresponds to burial depths of 3250–4050 m and a primary hydrocarbon accumulation period of 136–143 Ma (Early to Late Cretaceous), coinciding with peak hydrocarbon expulsion (Figure 11).
Temperature variations correlate with host mineral types and formation timing. Early-stage inclusions in quartz overgrowths and diagenetic microcracks (uncut overgrowths) show temperatures of 75–100 °C, peaking at 85–90 °C. Mid-stage inclusions within transgranular quartz fractures and late-stage overgrowths record 100–125 °C, with a peak of 100–115 °C. Late-stage inclusions in transgranular quartz fractures and quartz-filled fractures exhibit 125–170 °C, dominated by a 140–160 °C peak (Figure 11).
Hydrocarbon-bearing aqueous inclusions in the reservoirs show no significant correlation between salinity and homogenization temperatures. Numerous samples exhibit low salinity (<10%) coupled with high homogenization temperatures (>120 °C), reflecting hydrothermal fluid influx from deeper strata [37].

5. Discussion

5.1. Quantitative-Temporal Reconstruction of Porosity Evolution

5.1.1. Initial Porosity Restoration (Φ1)

Unconsolidated sandstone’s initial porosity (Φ1) is estimated using the empirical relationship between sorting coefficient (S0) and porosity under surface conditions [38,39]:
Φ1 = 20.91 + 22.90/S0
where:
S0 = Trask sorting coefficient = (Q1/Q3)1/2
Q1 = first quartile (25th percentile grain size)
Q3 = third quartile (75th percentile grain size)
Grain-size analysis of the Xu 2 Member sandstones in the Western Sichuan area reveals well-sorted sediments with S0 values ranging from 1.1 to 1.4. These parameters yield calculated initial porosity values of 37.27% to 41.73%. For single-well porosity evolution modeling, a representative initial porosity of 38% is adopted, consistent with regional sedimentological characteristics.

5.1.2. Post-Compaction/Pressure Solution Porosity (Φ2)

Compaction constitutes the primary factor degrading reservoir quality in the Xu 2 Member of the Western Sichuan Depression, making the restoration of post-compaction/pressure solution porosity critical for understanding porosity evolution. Under normal compaction conditions, primary porosity follows an exponential relationship with burial depth [40]: Φ2 = Φ1 × e(C×H). This relationship predicts porosity reduction from approximately 40% to 18.4% at 2000 m depth, 12.4% at 3000 m, and 5.6% at 5000 m. However, significant variations exist among different reservoir types in the Xu 2 Member. Chlorite-rich reservoirs retain substantial intergranular porosity, while reservoirs dominated by secondary pores exhibit limited intergranular porosity. These differences, coupled with variable cementation degrees, result in distinct compaction intensities and post-compaction porosity values (Φ2), necessitating reservoir-specific compaction coefficients (C-values) [39]. Theoretical compaction curves alone cannot accurately reconstruct these processes. To address this, the study employs a dual-method approach. First, petrographic quantification is performed using the formula:Φ2 = [(Intergranular pore area + Cement-dissolution pore area)/Total pore area] × Measured porosity + Cement content. Concurrently, compaction coefficients (C-values) are derived through the relationship Φ2 = Φ1 × e(C×H), where burial depth (H) and restored initial porosity (Φ1) serve as known parameters. These C-values characterize porosity decline trends specific to each reservoir type.
For Well Deyang 1, Φ2 is calculated as 16% (burial depth: 5190 m; Φ1: 40%), yielding a C-value of −0.000172. This reveals a gradual porosity reduction trend (Figure 12). In contrast, Well Chuanxiao 93 exhibits a steeper decline, highlighting lithology-controlled compaction efficiency. These divergent evolutionary paths significantly influence overall porosity evolution.

5.1.3. Cementation-Induced Porosity Loss

The Xu 2 Member reservoirs in the Western Sichuan Depression contain three major cement types significantly impacting reservoir quality: carbonate cements, authigenic quartz, and authigenic chlorite. Systematic thin-section analysis quantifies the content of these cements across various wells. Statistical results show total cement content ranging from 2.81% to 8.1% among different reservoirs (Table 2). Cementation causes porosity reduction generally exceeding 10%, with an average loss of 12.5%.
Building on quantified cement content across reservoir types, the precipitation timing and burial depths of different cements are determined through homogenization temperatures of fluid inclusions, oxygen isotope thermometry of carbonate cements, and burial history analysis of representative wells. Authigenic quartz precipitation depths are primarily constrained by fluid inclusion homogenization temperatures, while carbonate cementation depths are calculated using carbon–oxygen isotopes.
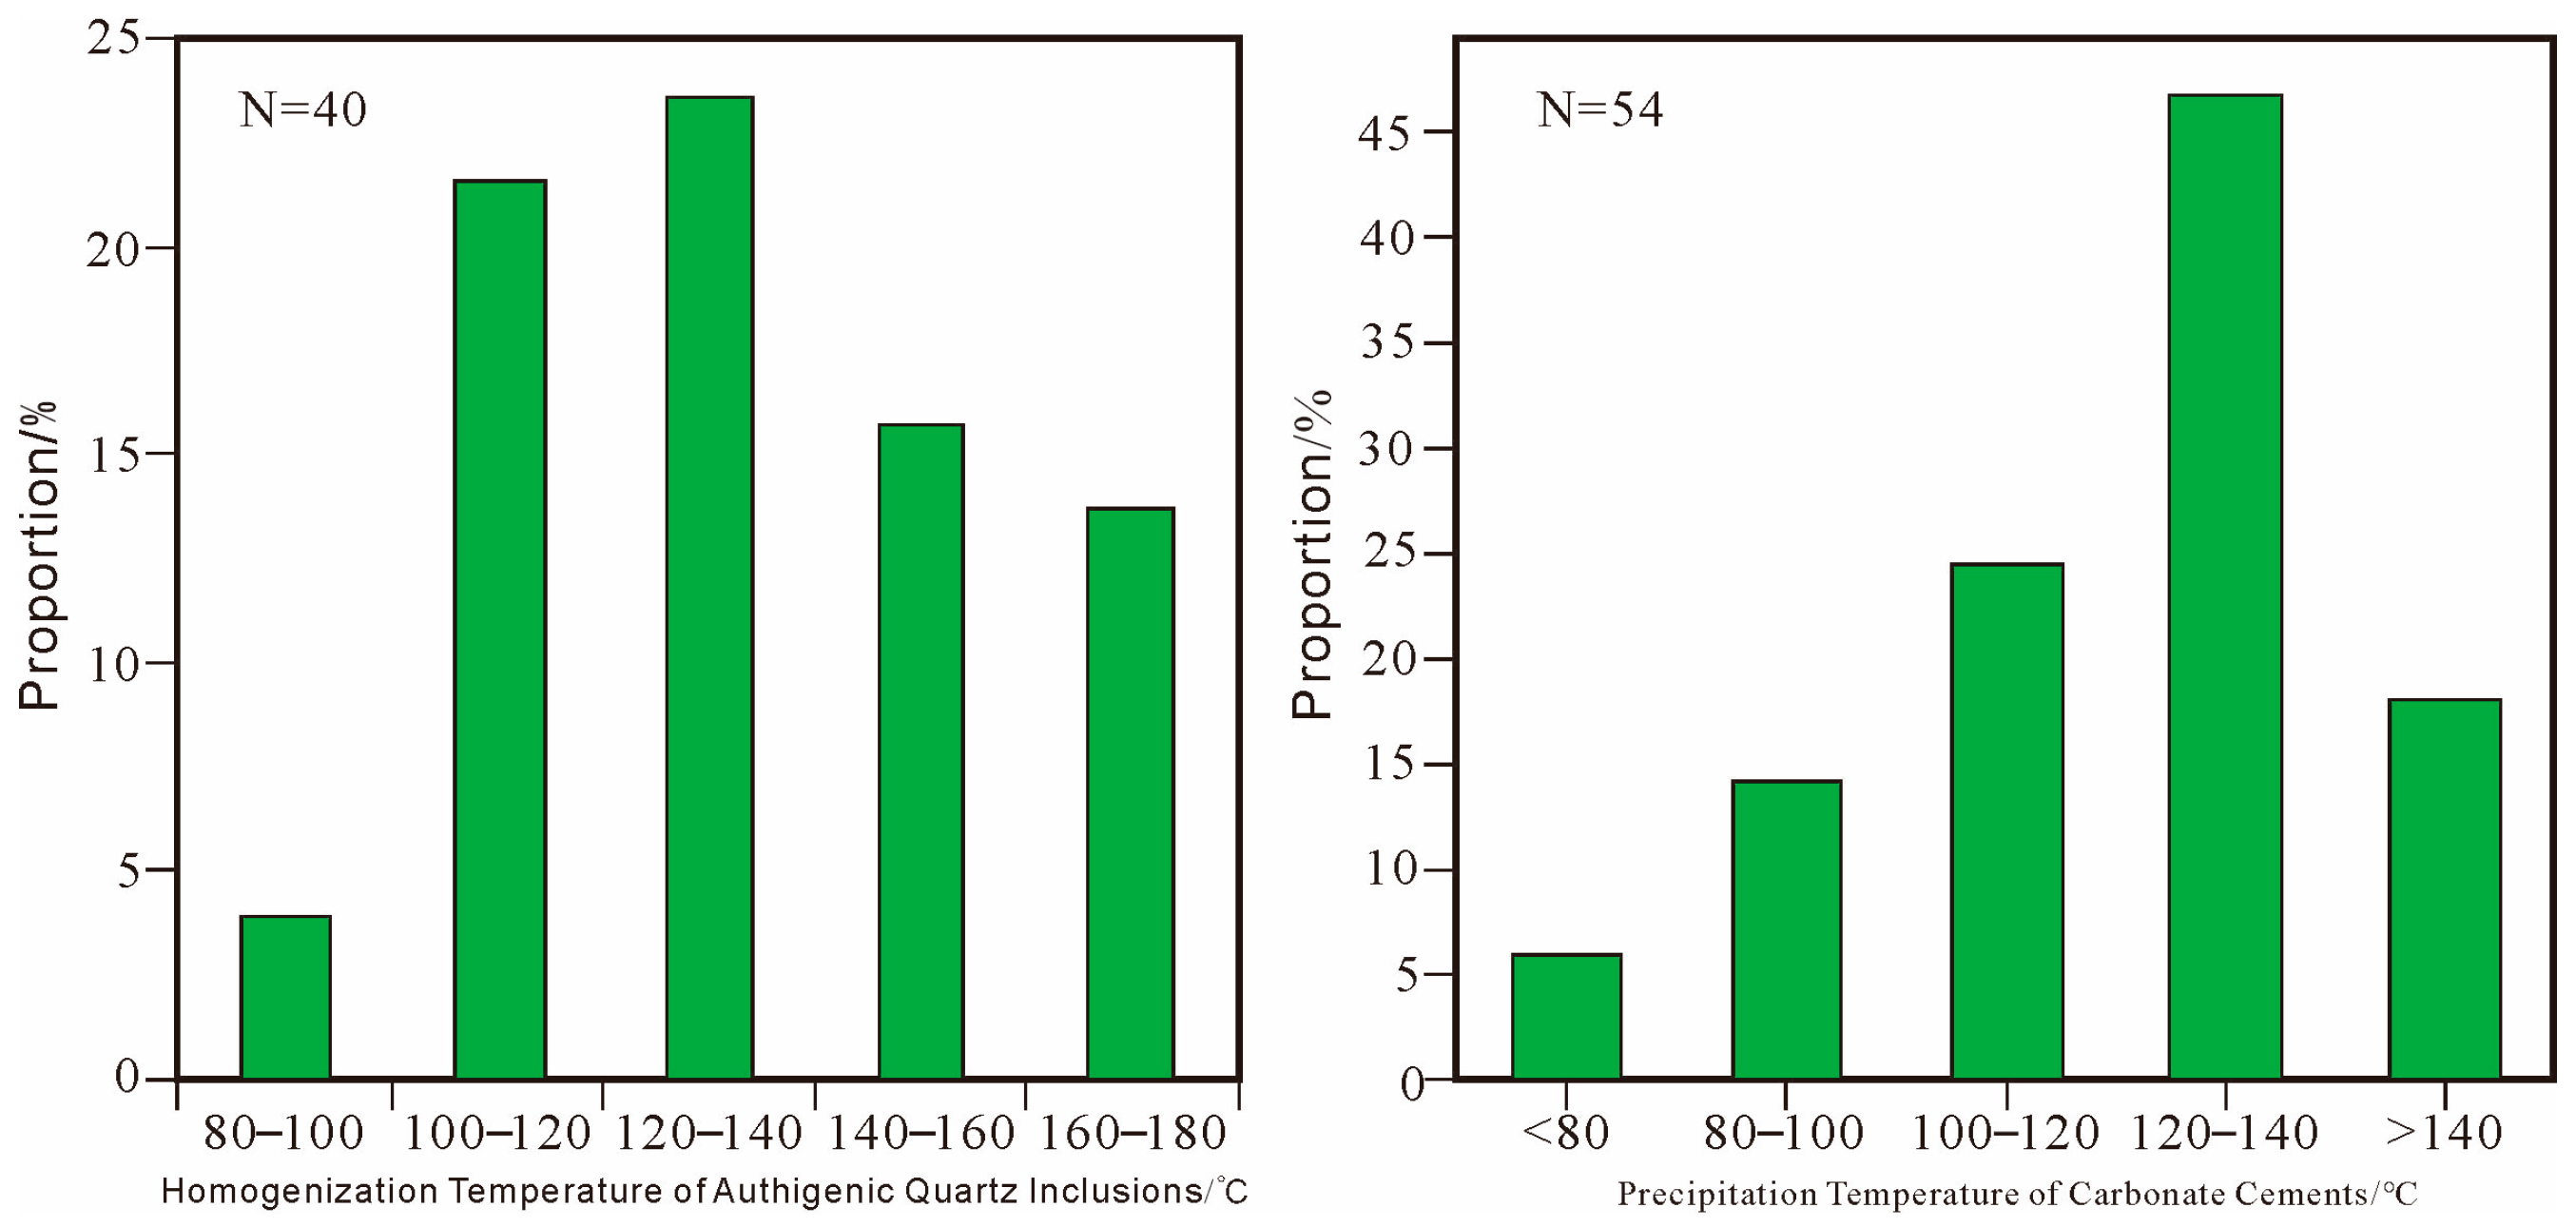
Authigenic quartz initiates precipitation at approximately 80 °C, with peak precipitation temperatures exceeding 160 °C, corresponding to burial depths of 2000–5000 m. The predominant precipitation temperature range (100–140 °C) aligns with depths of 2650–4000 m (Figure 13). Carbonate cements exhibit a similar dominant precipitation temperature range (100–140 °C) and corresponding burial depths 2650–4000 m (Figure 13). Petrographic observations indicate authigenic chlorite precipitated during the early diagenetic stage.

5.1.4. Dissolution-Enhanced Porosity

Analysis of thin section demonstrates significant porosity enhancement through dissolution in the Xu 2 Member reservoirs, with secondary porosity contributions consistently exceeding 2% (Table 3). The dissolution-induced porosity increase reaches a maximum of 16%, averaging 9.82%.
Previous studies identify two dissolution phases in the Xu 2 Member. Early-phase dissolution, associated with anorthite dissolution [13], likely generated secondary pores now destroyed due to prolonged deep burial. Current reservoir quality benefits predominantly from late-phase dissolution. The timing of this phase is constrained by homogenization temperatures of authigenic quartz fluid inclusions [13], which primarily range between 100–140 °C (Figure 13). Consequently, dissolution occurred at slightly lower temperatures of 90–130 °C.

5.1.5. Reservoir Porosity Evolution Process

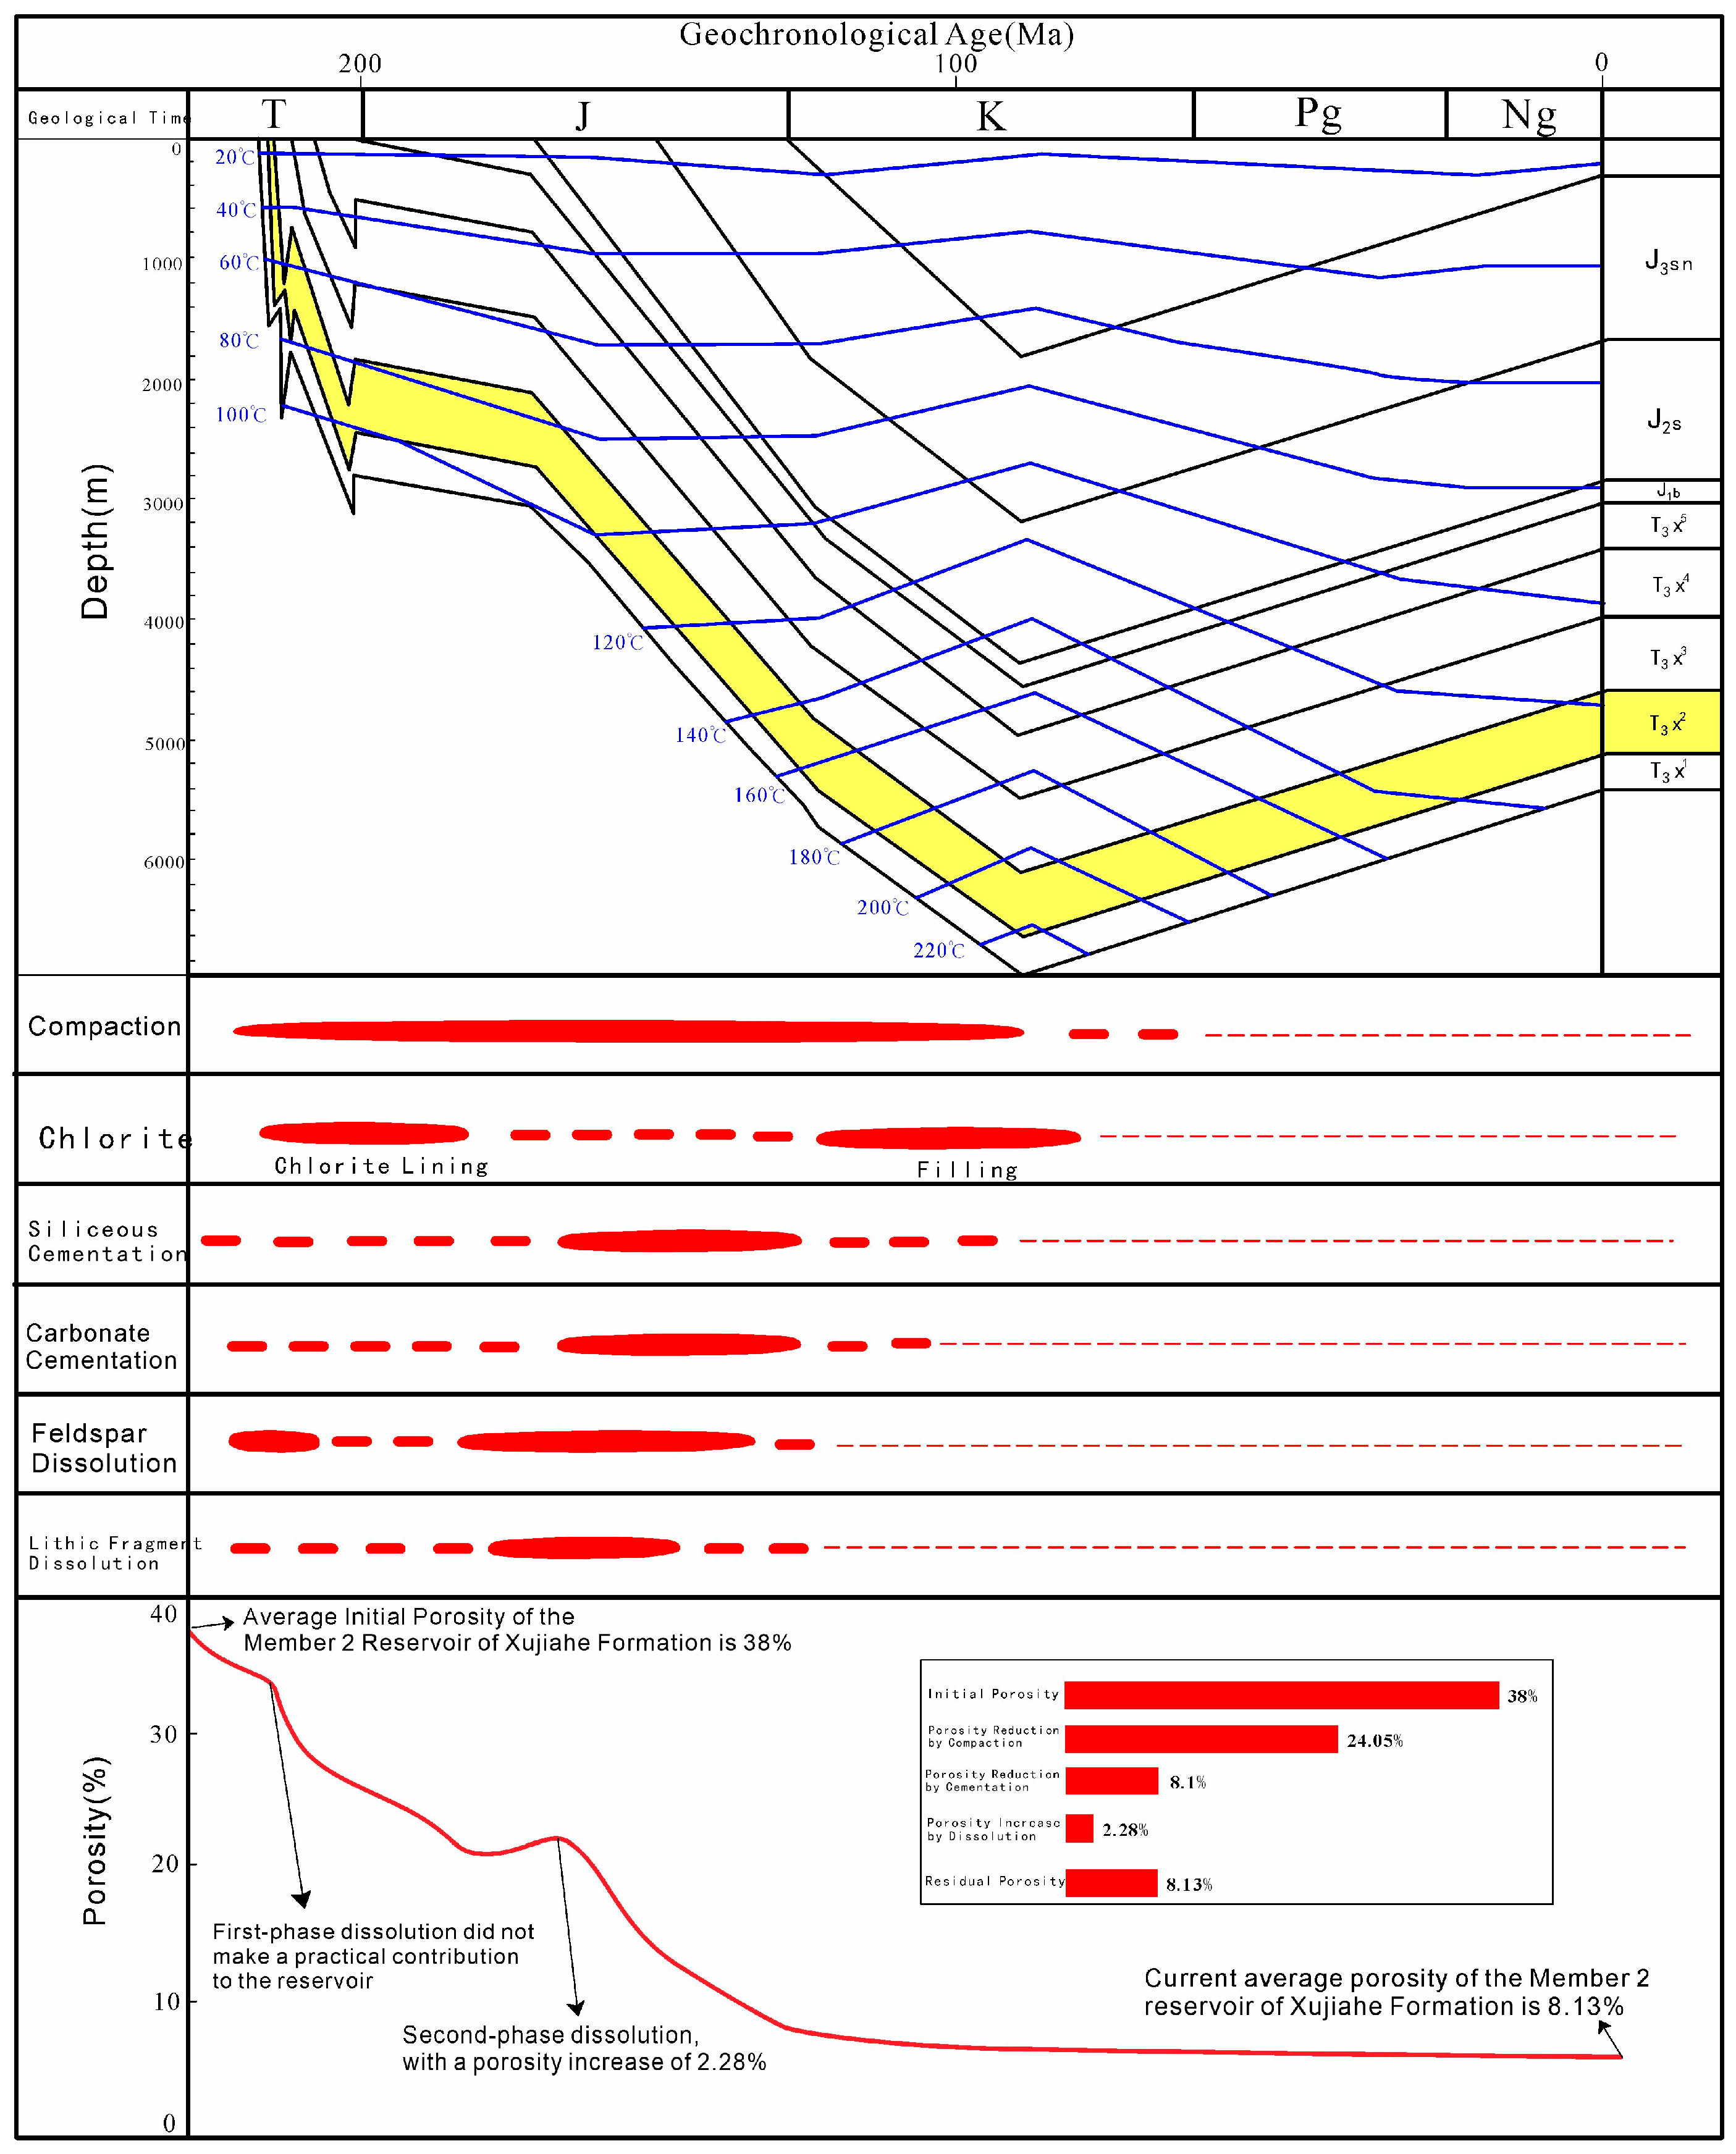
Integrated analysis of cementation timing, dissolution phases, and compaction trends reconstructs the porosity evolution of relatively favorable Xu 2 Member reservoirs (Figure 14). The evolutionary trajectory shows primary porosity decreasing from an initial 40% to 31.72% at 1000 m depth, 26.59% at 2000 m, 22.11% at 3000 m, 18.46% at 4000 m, and 15.41% at 5000 m. Two dissolution phases are recognized: an early phase during initial diagenesis that was erased by subsequent compaction, contributing negligibly to current porosity, and a late phase initiating at approximately 3500 m depth that enhanced porosity by about 2.28%.
Three cementation phases significantly impact reservoir quality. Authigenic chlorite precipitated early at 600–800 m depth, occupying 2.66% porosity while inhibiting later cementation and enhancing compaction resistance, thus net benefiting porosity preservation. Authigenic quartz reduced porosity by 1.64% during 2000–5000 m burial, concurrent with carbonate cements causing 3.88% porosity loss. Cumulative porosity changes include 24.05% loss from compaction, 8.1% loss from cementation, and 2.28% gain from dissolution, collectively defining the reservoir’s diagenetic footprint (Figure 14).

5.2. Coupling Relationship Between Reservoir Densification and Gas Accumulation

Previous studies have established methodologies for determining hydrocarbon accumulation phases through fluid inclusion analysis in sedimentary basins. The primary approach integrates measured homogenization temperatures and salinity values (derived from freezing-point depression) with burial-thermal evolution models. Projection of these parameters onto geological timelines approximates hydrocarbon charging ages, effectively defining accumulation timing [32]. Tight sandstone gas reservoirs can be classified into pre-densification accumulation and post-densification accumulation types based on the timing of hydrocarbon charging and reservoir densification [41,42].
In the Xinchang area’s Xu 2 Member, analysis of homogenization temperatures and inclusion assemblages identifies a dominant hydrocarbon charging phase. Projection of the primary homogenization temperature peak (100–120 °C) onto burial-thermal evolution models for key wells correlates with burial depths of 3250–4050 m and an accumulation period of 136–143 Ma (Late Jurassic to Early Cretaceous). This interval coincides with peak hydrocarbon expulsion, marking the principal accumulation phase for these reservoirs.
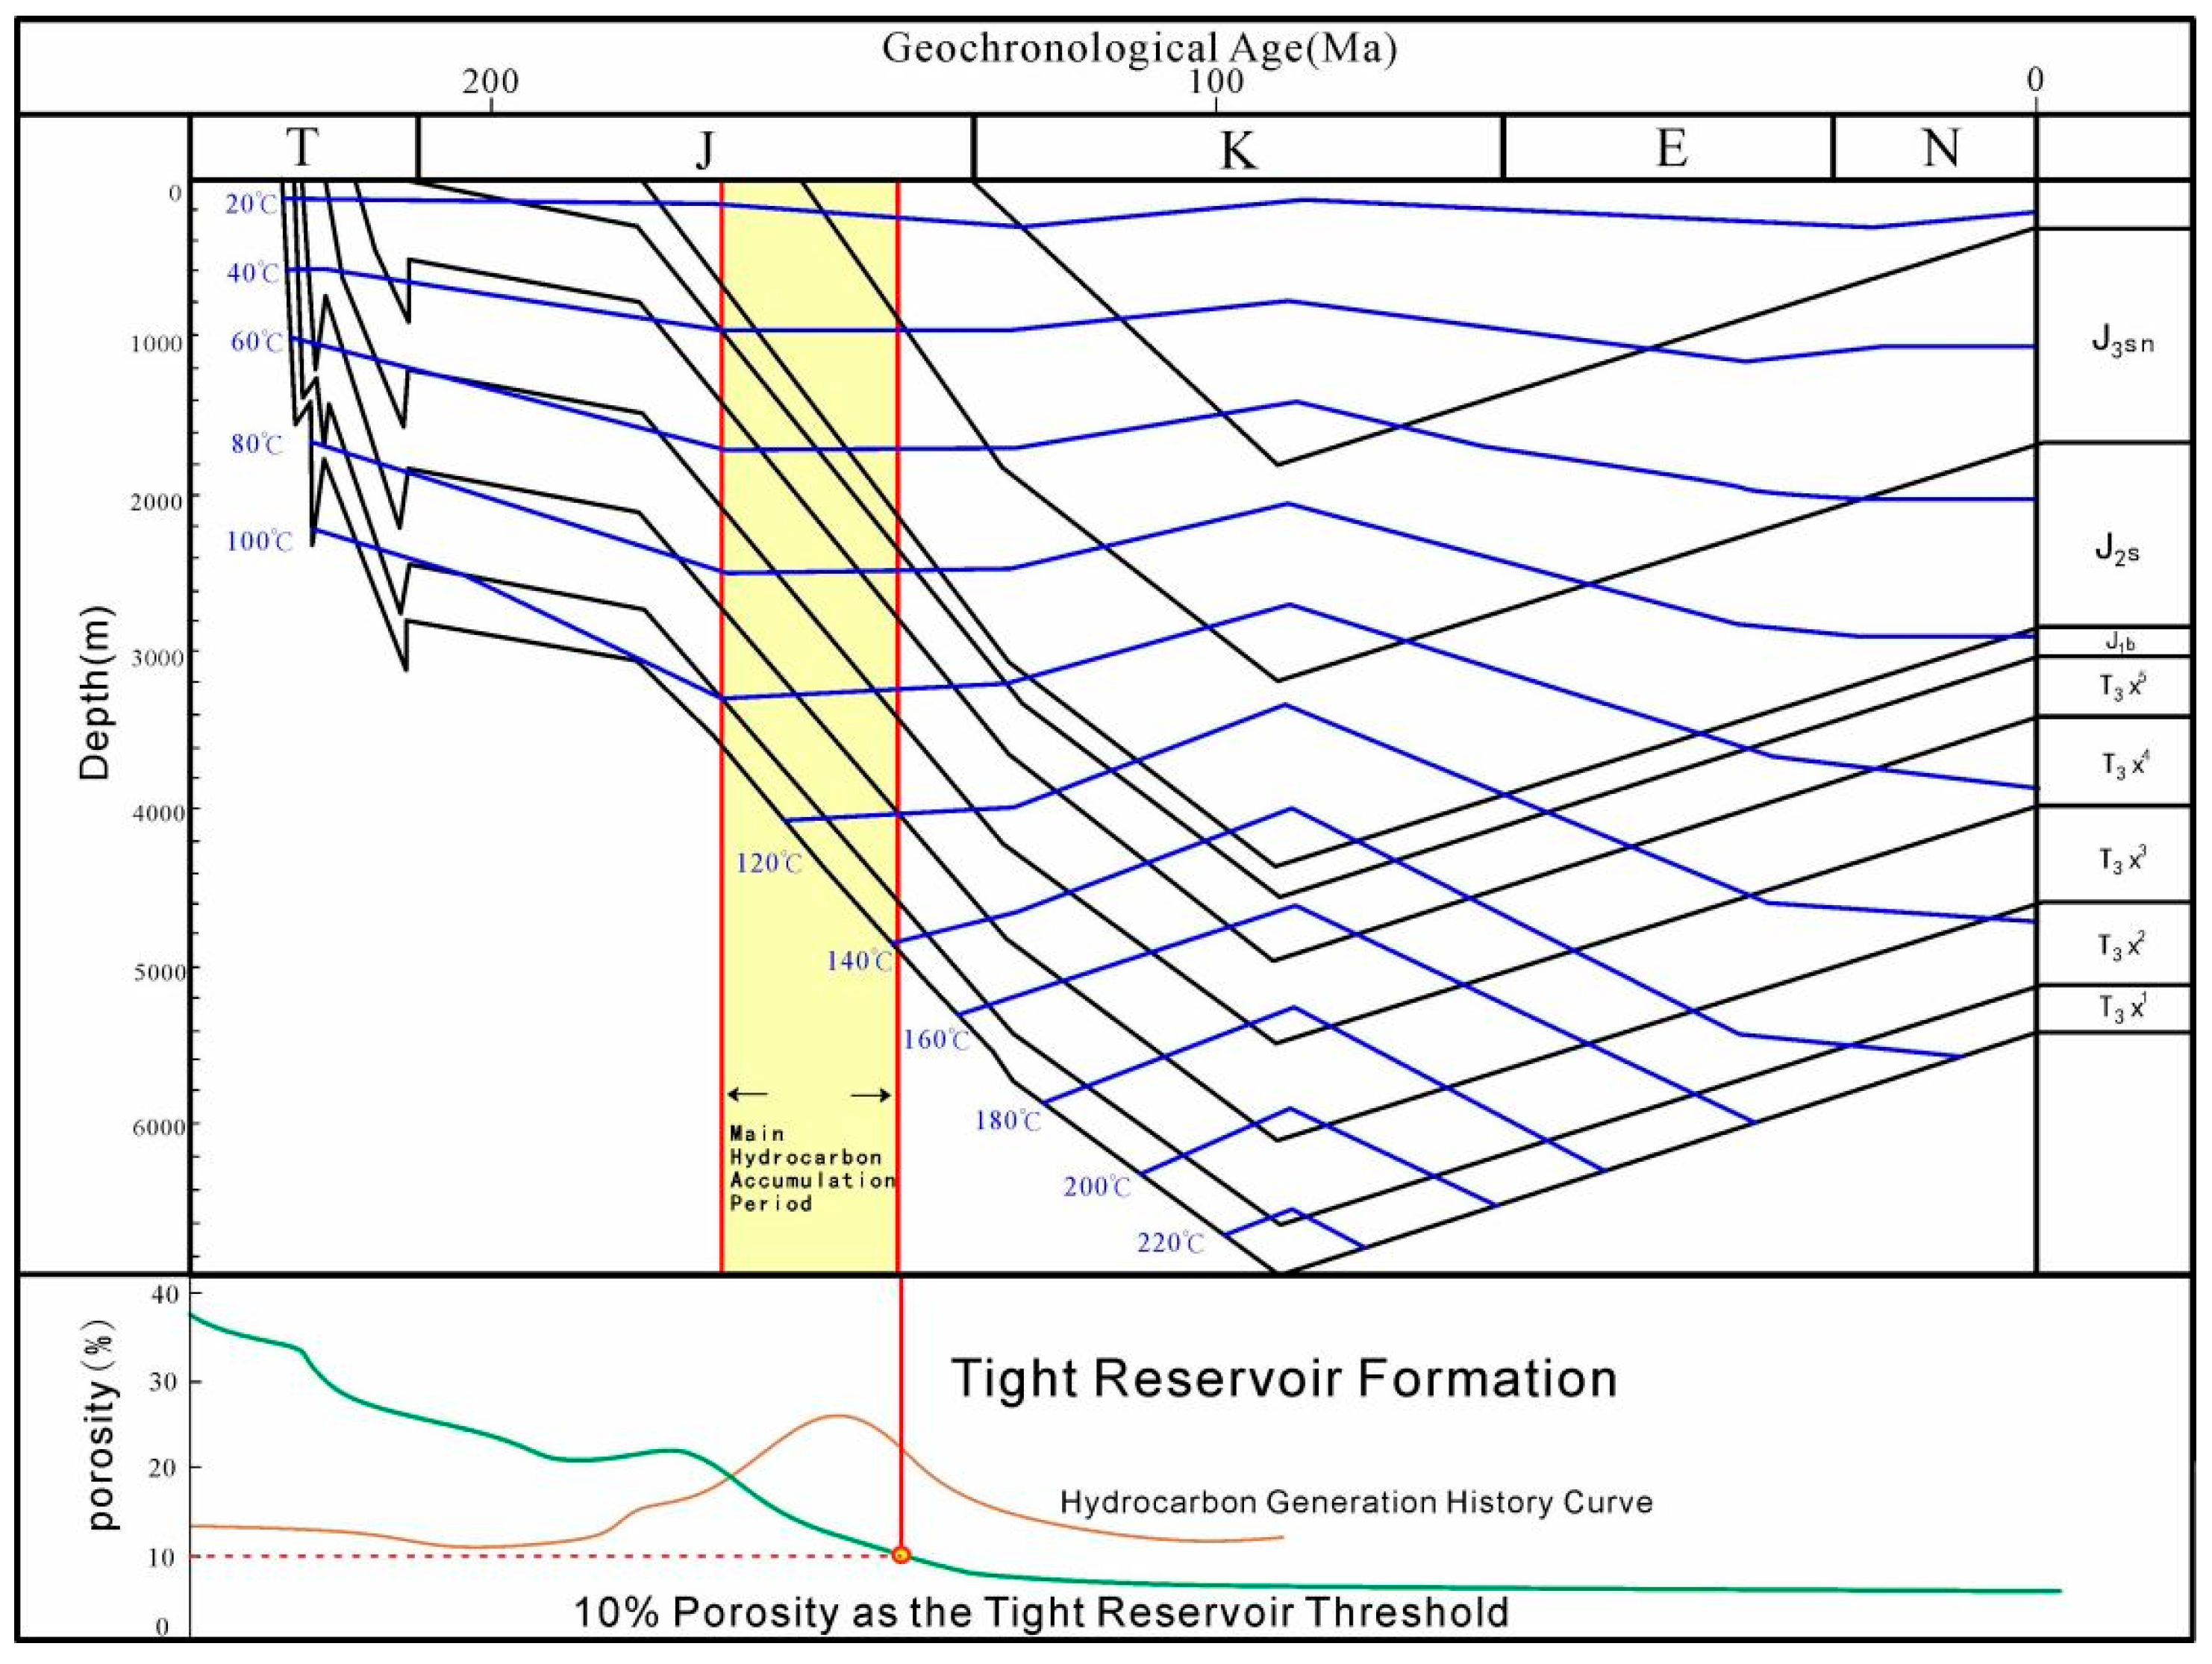
Integrated analysis of source rock hydrocarbon generation/expulsion modeling and Raman compositional analysis of hydrocarbon inclusions clarifies the temporal coupling between reservoir densification and peak hydrocarbon expulsion in the Xu 2 Member. Both hydrocarbon generation modeling and inclusion data indicate the primary expulsion phase occurred at burial depths of 3250–4050 m (Figure 15).
Comparative analysis with porosity evolution reveals reservoir densification depths of 4050–5300 m (Figure 15). Synthesis of gas accumulation phases, diagenetic evolution, and burial history establishes a “pre-tightness accumulation” coupling mechanism. Reservoir densification initiated during the Early Cretaceous, while major gas accumulation occurred in the Late Jurassic, demonstrating that large-scale hydrocarbon charging predated reservoir tightness.
The diagenesis-accumulation coupling evolves through sequential phases. During the early accumulation phase (<3 km burial), intense compaction and early calcite cementation rapidly reduced porosity, coinciding with low source rock maturity and limited hydrocarbon generation. As burial depth increased, mid-accumulation phase diagenesis saw progressive porosity reduction partially mitigated by chlorite coatings, though hydrocarbon generation remained insufficient for reservoir charging. The late accumulation phase witnessed peak hydrocarbon expulsion concurrent with continued porosity decline.

6. Conclusions

(1)
The study demonstrates three principal findings regarding diagenetic controls on the Xu 2 Member reservoirs. Compaction emerges as the dominant factor degrading reservoir quality, reducing primary porosity from an initial 40% ± 5% to 31.72% ± 5% at 1000 m depth, 26.59% ± 5% at 2000 m, 22.11% ± 5% at 3000 m, 18.46% ± 5% at 4000 m, and 15.41% ± 5% at 5000 m.
(2)
Cementation exerts substantial impacts through three key phases: authigenic chlorite precipitates early at 600–800 m burial depth, while authigenic quartz and carbonate cements persistently reduce porosity by 10%–21% during 2000–5000 m burial. Dissolution initiates at ~3500 m depth, generating secondary porosity of 2%–16%.
(3)
Critical coupling exists between reservoir densification and gas accumulation. Hydrocarbon generation/expulsion peaks occur at 3250–4050 m burial depth, whereas reservoir tightness develops below 4050 m. Large-scale gas accumulation predates reservoir densification, with primary charging during the Late Jurassic preceding Early Cretaceous tightness development. This temporal decoupling highlights favorable conditions for hydrocarbon preservation in the Xu 2 Member.
This pre-densification accumulation model can be extended to other tight sandstone formations in the Western Sichuan Basin with similar sedimentary–diagenetic backgrounds, providing a universal framework for exploring high-yield reservoirs. In future research, clarifying the key conditions for “dissolution gain > cementation loss” and exploring logging-based identification methods may serve as important directions in related studies. For the logging identification of this interval, future efforts may need to combine advanced logging technologies (e.g., imaging logging, elemental capture spectroscopy logging) with experimental results to explore and establish a targeted logging interpretation model, which can support the rapid logging evaluation of reservoir quality. These contents can be further developed as key directions in subsequent research.

Author Contributions

Conceptualization, Z.L.; methodology, Z.L. and S.L.; software, Y.B.; formal analysis, Z.L.; investigation, J.L.; resources, J.W. and H.G.; data curation, M.D.; writing—original draft preparation, Z.L.; writing—review and editing, S.L. and Y.B.; supervision, S.L.; funding acquisition, S.L. All authors have read and agreed to the published version of the manuscript.

Funding

This research was funded by the National Natural Science Foundation of China (NSFC). The specific projects are as follows: NSFC Project (Grant No. 42472180), entitled “Tracing, Process Reconstruction of Cross-Formation Fluid Mixing in Deep-Shallow Tight Sandstones and Its Reservoir-Forming and Hydrocarbon Accumulation Effects in the Central-Western Sichuan Basin”; NSFC Project (Grant No. 41972158), entitled “Fluid-Rock Interactions and Reservoir Response Mechanisms in Deep Tight Sandstones of the Xujiahe Formation, Western Sichuan Basin”.

Data Availability Statement

Data are contained within the article.

Acknowledgments

The authors sincerely thank Chunyu Zhou, Luyan Li, Jianting Yao, Dong Zhou, and Hailiang Liu for their valuable work support. Additionally, the authors would like to express their sincere gratitude to the journal editors and anonymous reviewers for their insightful review comments and constructive suggestions.

Conflicts of Interest

Youyi Bi, Meizhou Deng, Hengyi Gao are employees of Southwest Oil & Gas Company. Jinxi Wang is an employee of PetroChina Southwest Oil & Gasfield Company. The paper reflects the views of the scientists and not the company.

References

  1. Wang, H. Distribution Characteristics of Tight Sandstone Gas Reservoirs of Xujiahe Formation in Central Sichuan Basin. In Proceedings of the International Field Exploration and Development Conference 2021, Qingdao, China, 16–18 September 2021; Springer Series in Geomechanics and Geoengineering; Springer: Singapore, 2022; pp. 382–388. [Google Scholar]
  2. Xuefeng, B.; Yu, Y.; Junhui, L.; Youzhi, W. Accumulation conditions and exploration prospects of tight gas reservoirs in the fifth member of the Upper Triassic Xujiahe Formation in Yilong–Pingchang area, Sichuan Basin. China Pet. Explor. 2025, 30, 42. [Google Scholar]
  3. Jiang, L.; Zhao, W.; Bo, D.-M.; Hong, F.; Gong, Y.-J.; Hao, J.-Q. Tight sandstone gas accumulation mechanisms and sweet spot prediction, Triassic Xujiahe Formation, Sichuan Basin, China. Pet. Sci. 2023, 20, 3301–3310. [Google Scholar] [CrossRef]
  4. Wei, J.; Zhang, J.; Yong, Z. Characteristics of Tight Gas Reservoirs in the Xujiahe Formation in the Western Sichuan Depression: A Systematic Review. Energies 2024, 17, 587. [Google Scholar] [CrossRef]
  5. Xu, X.-T.; Zeng, L.-B.; Dong, S.-Q.; Li, H.-M.; Liu, J.-Z.; Ji, C.-Q. The characteristics and controlling factors of high–quality reservoirs of ultra–deep tight sandstone: A case study of the Dabei Gas Field, Tarim Basin, China. Pet. Sci. 2025; in press. [Google Scholar] [CrossRef]
  6. Lander, R.H.; Walderhaug, O. Porosity prediction through simulation of sandstone compaction and quartz cementation. AAPG Bull. 1999, 83, 433–449. [Google Scholar]
  7. Paxton, S.T.; Szabo, J.O.; Ajdukiewicz, J.M.; Klimentidis, R.E. Construction of an intergranular compaction curve for evaluating and predicting compaction and porosity loss in rigid grained sandstone reservoirs. AAPG Bull. 2002, 86, 2047–2067. [Google Scholar] [CrossRef]
  8. Szabo, J.O.; Paxton, S.T. Intergranular volume (IGV) decline curves for evaluating and predicting compaction and porosity loss in sandstones (abs.). AAPG Bull. 1991, 75, 678. [Google Scholar]
  9. Jiang, L.; Sun, X.; Chen, D.; Lei, W.; Yang, H.; Deng, Y.; Wang, Z.; Li, C.; Liu, T.; Geng, C.; et al. Tight Sandstone Gas Reservoir Types and Formation Mechanisms in the Second Member of the Xujiahe Formation in the Anyue Area, Sichuan Basin. Energies 2025, 18, 3009. [Google Scholar] [CrossRef]
  10. Li, W.; Wang, X.; Zhao, R.; Tang, D.; Yin, H.; Pei, S. Formation and evolution of overpressure system in tight sandstone gas reservoir of Xujiahe Formation of Upper Triassic in the Western Sichuan foreland basin and its relationship with natural gas accumulation. Nat. Gas Ind. 2022, 42, 25–39. [Google Scholar]
  11. Yu, Y.; Lin, L.; Li, Z.; Chen, H. Source of quartz cement in tight gas sandstone: Evidence from the Upper Triassic Xujiahe Formation in the western Sichuan Basin, SW China. J. Pet. Sci. Eng. 2022, 212, 110299. [Google Scholar] [CrossRef]
  12. Lin, L.; Yu, Y.; Nan, H.; Chen, H. Petrologic and geochemical characteristics of carbonate cements in the Upper Triassic Xujiahe Formation tight gas sandstone, western Sichuan Basin, China. AAPG Bull. 2022, 106, 461–490. [Google Scholar] [CrossRef]
  13. Huang, P.; Liu, M.; Cao, B.; Ren, Y.; Tan, X.; Zeng, W.; Lian, C. Formation mechanism of carbonate cement in tight sandstone reservoirs in the depression zone of foreland basin and its impact on reservoir heterogeneity: The upper Triassic Xujiahe Formation in Western Sichuan foreland basin, China. Mar. Pet. Geol. 2024, 167, 106971. [Google Scholar] [CrossRef]
  14. Luo, L.; Meng, W.; Gluyas, J.; Tan, X.; Gao, X.; Feng, M.; Kong, X.; Shao, H. Diagenetic characteristics, evolution, controlling factors of diagenetic system and their impacts on reservoir quality in tight deltaic sandstones: Typical example from the Xujiahe Formation in Western Sichuan Foreland Basin, SW China. Mar. Pet. Geol. 2019, 103, 231–254. [Google Scholar] [CrossRef]
  15. Zhao, C.; Jiang, Y.; Yang, H.; Wang, L. The genesis of authigenic minerals and the porosity evolution of various lithologies and their implications for identifying high–quality reservoirs in the fourth member of Xujiahe Formation Northeast–Sichuan Basin, China. J. Pet. Sci. Eng. 2022, 212, 110261. [Google Scholar] [CrossRef]
  16. Liu, J.; Zhang, C.; Jiang, Y.; Hou, S. Investigation on pore structure characteristics of ultra–tight sandstone reservoirs in the upper Triassic Xujiahe Formation of the northern Sichuan Basin, China. Mar. Pet. Geol. 2022, 138, 105552. [Google Scholar] [CrossRef]
  17. Zhang, K.; Lin, N.; Yang, J.; Zhang, D.; Cui, Y.; Jin, Z. An Intelligent Approach for Gas Reservoir Identification and Structural Evaluation by ANN and Viterbi Algorithm—A Case Study From the Xujiahe Formation, Western Sichuan Depression, China. IEEE Trans. Geosci. Remote Sens. 2023, 61, 5904412. [Google Scholar] [CrossRef]
  18. Hui, G.; Chen, Z.; Wang, Y.; Zhang, D.; Gu, F. An Integrated Machine Learning–Based Approach to Identifying Controlling Factors of Unconventional Shale Productivit. Energy 2023, 266, 126512. [Google Scholar] [CrossRef]
  19. Zheng, J.; Lin, L.; Yu, Y.; Yuan, Q.; Wen, L.; Deng, X.; Huang, Y.; Qiu, Y.; Wei, J.; Zheng, C.; et al. Chronology and geofluids characteristics of calcite cement in the Upper Triassic Xujiahe Formation tight sandstone reservoir, Wstern Sichuan Basin, SW China. Mar. Pet. Geol. 2024, 170, 107148. [Google Scholar] [CrossRef]
  20. Chen, C.; Xu, G.; Xu, F.; Yuan, H.; Chen, F. Sequence of densification and hydrocarbon charging of Xu2 reservoir in Anyue–Hechuan area, Sichuan Basin, China. J. Cent. South Univ. 2016, 23, 1439–1448. [Google Scholar] [CrossRef]
  21. Wang, Q.; Chen, D.; Gao, X.; Wang, F.; Li, J.; Liao, W.; Wang, Z.; Xie, G. Microscopic pore structures of tight sandstone reservoirs and their diagenetic controls: A case study of the Upper Triassic Xujiahe Formation of the Western Sichuan Depression, China. Mar. Pet. Geol. 2020, 113, 104119. [Google Scholar] [CrossRef]
  22. Chen, D.; Wang, L.; Pang, X.; Bai, T. Geological characteristics and hydrocarbon accumulation models of the tight–sand gas reservoirs in upper Triassic Xujiahe formation in western Sichuan depression of China. In Proceedings of the Unconventional Resources Technology Conference 2013 (URTC), Denver, CO, USA, 12–14 August 2013. [Google Scholar]
  23. Zhao, J.; Yang, Y.; Chen, G.; Zheng, X.; Yin, S.; Tian, L. Controls of Multi–Scale Fractures in Tight Sandstones: A Case Study in the Second Member of Xujiahe Formation in Xinchang Area, Western Sichuan Depression. Lithosphere 2024, 2024, 1–25. [Google Scholar] [CrossRef]
  24. Gou, M.; Lu, G.; Deng, B.; Wang, C.; Li, Z.; Yu, Y.; Yang, R.; Jin, X. Tectonic–paleogeographic evolution of the Late Triassic in the Sichuan basin, SW China: Constraints from sedimentary facies and provenance analysis of the Xujiahe Formation. Mar. Pet. Geol. 2024, 160, 106649. [Google Scholar] [CrossRef]
  25. Jiang, Z.; Ran, B.; Li, Z.; Liu, S.; Wang, Z.; Han, Y.; Lv, F.; Jiang, X. A Late Triassic depositional age for the Xujiahe formation, Sichuan basin: Implications for the closure of the Paleo–Tethys Ocean. Mar. Pet. Geol. 2023, 155, 106346. [Google Scholar] [CrossRef]
  26. SY/T 5336-2006; Petroleum and Natural Gas Industry Standards of the People’s Republic of China-Practices for core analysis. National Development and Reform Commission: Beijing, China, 2006.
  27. SY/T 6010-1994; Method for Determination of Homogenization Temperature and Salinity of Inclusions in Sedimentary Rocks. China National Petroleum Corporation: Beijing, China, 1994.
  28. Zhang, Y.; Zeng, L.; Lyu, W.; Sun, D.; Chen, S.; Guan, C.; Tang, L.; Shi, J.; Zhang, J. Natural fractures in tight gas sandstones: A case study of the Upper Triassic Xujiahe Formation in Xinchang gas field, Western Sichuan Basin, China. Geol. Mag. 2021, 158, 1543–1560. [Google Scholar] [CrossRef]
  29. Lei, Y.; Huang, Q.; Wang, X.; Yang, T.; Tian, Y.; Li, H.; Tang, X.; Liu, B. Reservoir Characteristics and Main Controlling Factors of Tight Sandstone in Member 2 of the Xujiahe Formation in Northwest Sichuan. Spec. Oil Gas Reserv. 2023, 30, 50–57+66. [Google Scholar]
  30. Kang, Y.-L.; Luo, P.-Y. Current status and prospect of key techniques for exploration and production of tight sandstone gas reservoirs in China. Shiyou Kantan Yu Kaifa/Pet. Explor. Dev. 2007, 34, 239–245. [Google Scholar]
  31. Li, P.; Hu, Z.; Liu, Z.; Xu, S.; Liu, Z.; Wang, A.; Liu, J.; Jin, W. Types of the deep tight sandstone reservoirs and their different controlling in the T3x2 member of Xujiahe formation in Xinchang area, western Sichuan Basin. Nat. Gas Geosci. 2024, 35, 1136–1149. [Google Scholar]
  32. Wei, X.; Fu, Q.; Dan, W.; Zhao, S.; Pang, J.; Chu, M. Diagenesis fluid stagnation effect and genesis of tight sandstone reservoir in Yanchang Formation, Ordos Basin. Acta Pet. Sin. 2018, 39, 858–868. [Google Scholar]
  33. Zhang, X.; Deng, H.; Li, T.; Xu, Z.; Fu, M.; Ling, C.; Duan, B.; Chen, Q.; Chen, G. The conditions and modelling of hydrocarbon accumulation in tight sandstone reservoirs: A case study from the Jurassic Shaximiao formation of western Sichuan Basin, China. Geoenergy Sci. Eng. 2023, 225, 211702. [Google Scholar] [CrossRef]
  34. Xie, N.; Song, J.; Bai, D. Characteristics of fluid inclusions and accumulation stages of Sinian Dengying Formation in Penglai Area, central Sichuan. Unconv. Oil Gas 2023, 10, 55–63. [Google Scholar]
  35. Goldstein, R.H. Fluid inclusion in the sedmentary and diageneticsystems. Liths 2001, 55, 159–193. [Google Scholar] [CrossRef]
  36. Hao, D.; Liu, Z.; Qu, L.; Bai, Y.; Chen, Z.; Liu, Q. Jurassic hydrocarbon accumulation period division in Huanjiang oilfield: Evidence from fluid inclusions. Int. J. Oil Gas Coal Technol. 2025, 37, 301–320. [Google Scholar] [CrossRef]
  37. Kyser, K.; Hiatt, E.E. Fluid in sedmentary basin: Anintrocduction. J. Geochem. Explor. 2003, 80, 139–149. [Google Scholar] [CrossRef]
  38. Scherer, M. Parameters Influencing Porosity in Sandstones: A Model for Sandstone Porosity Prediction. AAPG Bull. 1987, 71, 485–491. [Google Scholar] [CrossRef]
  39. Beard, D.C.; Weyl, P.K. Influence of texture on porosity and permeability of unconsolidated sand. AAPG Bull. 1973, 57, 349–369. [Google Scholar] [CrossRef]
  40. Tang, D.; Tan, X.; Tu, L.; Zeng, Q.G.; Liu, S.B.; Liu, H.L.; Liu, W. Control factors and pore evolution of tight sandstone reservoir of the Second Member of Shaximiao Formation in the transition zone between central and western Sichuan Basin, China. J. Chengdu Univ. Technol. (Sci. Technol. Ed.) 2020, 47, 460–471. [Google Scholar]
  41. Athy, L.F. Density, Porosity and Compaction of Sedimentary Rocks. AAPG Bull. 1930, 4, 1–24. [Google Scholar] [CrossRef]
  42. Xiao, Z.; Chen, S.; Liu, G.; Wang, P.; Tang, L.; Liu, Z. Further understandingof differential accumulations of oil and water in tight sandstones withlimited charging power: A case study of Chang 8 member in Huachiarea, Ordos Basin, China. Oil Gas Geol. 2020, 41, 1129–1138. [Google Scholar]
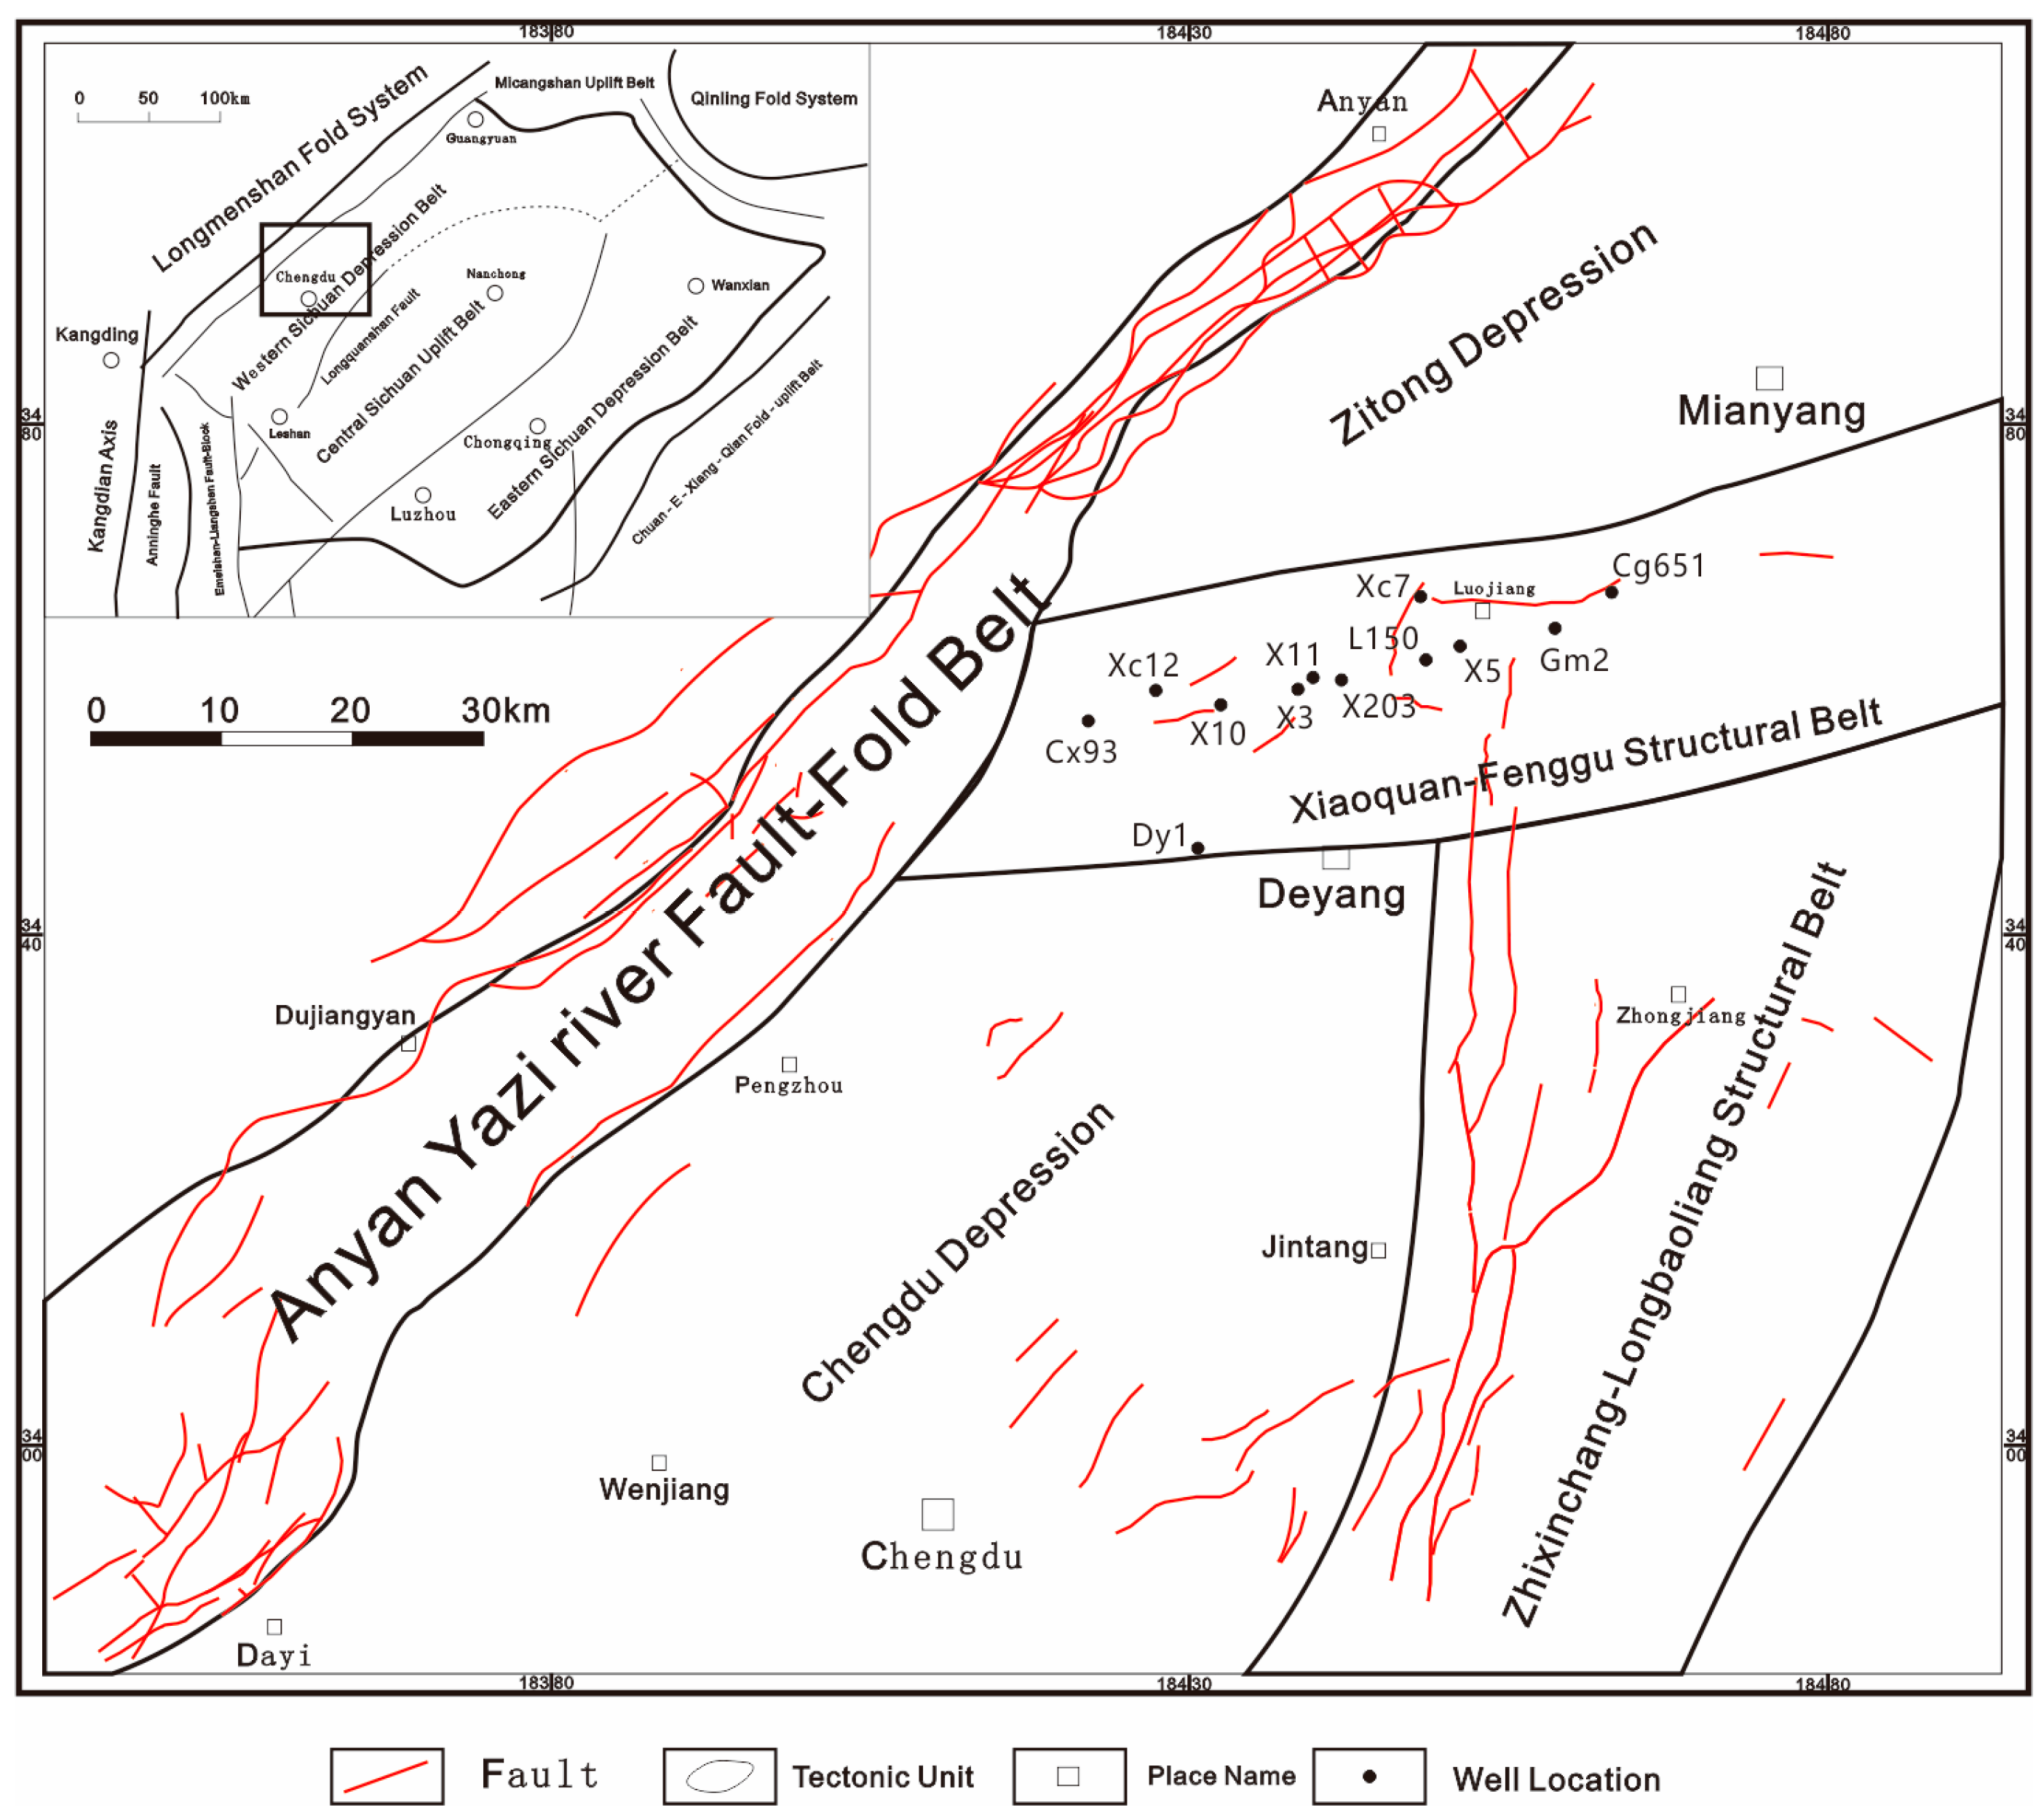
Figure 1. Map showing the structural division and the wells location of the west Sichuan Basin.
Minerals 15 01052 g001
Figure 2. Sedimentary filling succession of the west Sichuan Basin.
Minerals 15 01052 g002
Figure 3. Triangle diagram of sandstone classification and histogram of sandstone particle size distribution in the research area (Cg: coarse-grain; Fg: fine-grain; Mg: medium-grain).
Minerals 15 01052 g003
Figure 4. Histogram of porosity and permeability distribution of sandstone in the second section of the study area.
Minerals 15 01052 g004
Figure 5. Pore permeability relationship diagram of the second section sandstone in the research area.
Minerals 15 01052 g005
Figure 6. The comparison of reservoir compaction and porosity reduction from typical wells in Member 2 of the Xujiahe Formation, Sichuan Basin.
Minerals 15 01052 g006
Figure 7. The characteristics of main cement in Member 2 of the Xujiahe Formation, west Sichuan Basin. (a) Well Xinchang 12, 4812.34 m, Xu 2 Member: Calcite mosaic cementation (+). (b) Well Gaomiao 3, 4923 m, Xu 2 Member: Calcite occluding dissolved pores (-). (c) Well Xinchang 12, 4832.45 m, Xu 2 Member: Quartz overgrowth cementation (+). (d) Well Xin 5, 4964.12 m, Xu 2 Member: Quartz overgrowth cementation (+). (e) Well Xinchang 7, 5188.49 m, Xu 2 Member: Pore-lining chlorite (-). (f) Well Deyang 1, 5530.86 m, Xu 2 Member: Pore-lining chlorite (SEM).
Minerals 15 01052 g007
Figure 8. The characteristics of dissolution in Member 2 of the Xujiahe Formation, west Sichuan Basin. (a) Well Xinchang 15, 5154.10 m, Xu 2 Member: Feldspar dissolution pores (-). (b) Well Deyang 1, 5470 m, Xu 2 Member: Feldspar dissolution pores (-). (c) Well Xin 10, 4884.53 m, Xu 2 Member: Feldspar dissolution pores filled with authigenic quartz and illite (SEM). (d) Well Gaomiao 3, 5082 m, Xu 2 Member: Feldspar dissolution pores (-).
Minerals 15 01052 g008
Figure 9. The Characteristics of Carbon and Oxygen Isotope Distribution in Member 2 of the Xujiahe Formation, west Sichuan Basin. [32].
Minerals 15 01052 g009
Figure 10. The characteristics of dissolution in Member 2 of the Xujiahe Formation, west Sichuan Basin. (a) Well Chuanluo 562, 5107.7 m, Xu 2 Member: Fluid inclusions distributed in quartz grain microcracks within sandstone. (b) Well Chuanmian 39, 5196.5 m, Xu 2 Member: Fluid inclusions hosted in quartz veins within sandstone. (c) Well Chuanluo 561, 5107.7 m, Xu 2 Member: Fluid inclusions along quartz overgrowths or sutured contacts in sandstone. (d) Well Chuanluo 562, Xu 2 Member: Abundant weak white-fluorescing pure gas-phase inclusions in transgranular quartz fractures. (e) Well Chuanluo 562, Xu 2 Member: Hydrocarbon-bearing aqueous inclusions (blue) and aqueous inclusions (black) in transgranular quartz fractures, with homogenization temperatures as shown. (f) Well Chuanluo 562, Xu 2 Member: Hydrocarbon-bearing aqueous inclusions (blue) in transgranular quartz fractures, with homogenization temperatures as shown.
Minerals 15 01052 g010
Figure 11. Histogram of Homogenization Temperatures of Hydrocarbon-Bearing Brine Inclusions (Th of HBI) in the Second Member of Xujiahe Formation in the Study Area.
Minerals 15 01052 g011
Figure 12. The comparison of primary pore evolution between Well DY-1 and CX-93, procedure for construction of these curves is detailed in the text.
Minerals 15 01052 g012
Figure 13. Histogram of Precipitation Temperatures of Authigenic Quartz (Based on Fluid Inclusion Homogenization Temperatures) and Carbonate Cements (Based on C and O Isotopes) in Member 2 of the Xujiahe Formation, Western Sichuan Basin.
Minerals 15 01052 g013
Figure 14. The pore evolution of the relative quality reservoir in Well Deyang-1.
Minerals 15 01052 g014
Figure 15. The relationship between the hydrocarbon expulsion period and the reservoir densification in west Sichuan Basin.
Minerals 15 01052 g015
Table 1. Summary Table of Compaction-Related Porosity Loss in Study Wells.
Well LocationDrilling DepthAverage Porosity
/%
Total Cement Content
/%
Primary-to-Secondary
Porosity Ratio
Primary PorosityCompaction-Reduced
Porosity
Secondary PorosityCompaction Porosity LossCompaction Porosity
Reduction Rate
DY-15550.00 8.13 8.10 0.72 5.85 13.95 2.28 24.05 63.29
XC-75190.00 10.50 4.86 0.75 7.88 12.74 2.63 25.27 66.49
CG-5614985.50 8.19 5.10 0.74 6.06 11.16 2.13 26.84 70.62
X-114949.00 9.16 5.39 0.55 5.04 10.43 4.12 27.57 72.55
XC-124790.00 6.43 6.12 0.55 3.54 9.66 2.89 28.34 74.59
GM-25068.00 8.67 3.99 0.60 5.20 9.19 3.47 28.81 75.81
X-54948.00 7.72 4.04 0.45 3.47 7.51 4.25 30.49 80.23
X-2035067.00 7.90 2.81 0.55 4.35 7.16 3.56 30.85 81.17
L-1504860.00 8.48 3.41 0.28 2.37 5.78 6.11 32.22 84.78
CX-934836.00 7.79 3.88 0.24 1.87 5.75 5.92 32.25 84.87
Table 2. The reservoir cement content of typical wells in west Sichuan Basin.
Well LocationHorizonCarbonate Cement Content/%Siliceous Cement Content/%Chlorite Cement Content/%Total Cement Content/%
DY-1XU23.801.642.668.10
XC-7XU20.881.102.884.86
CG-561XU22.320.372.415.10
X-11XU22.921.101.375.39
XC-12XU23.691.540.896.12
GM-2XU22.820.510.663.99
X-5XU21.931.340.774.04
X-203XU21.231.000.582.81
L-150XU21.981.330.103.41
CX-93XU22.551.230.103.88
Table 3. The secondary pore content of typical wells in the relative quality reservoir, west Sichuan Basin.
Well LocationHorizonPrimary Porosity Proportion/%Primary Porosity/%Secondary Porosity/%
DY-1XU2725.852.28
XC-7XU2757.882.63
CG-561XU2746.062.13
X-11XU2555.044.12
XC-12XU2553.542.89
GM-2XU2605.203.47
X-5XU2453.474.25
X-203XU2554.353.56
L-150XU2282.376.11
CX-93XU2241.875.92
Disclaimer/Publisher’s Note: The statements, opinions and data contained in all publications are solely those of the individual author(s) and contributor(s) and not of MDPI and/or the editor(s). MDPI and/or the editor(s) disclaim responsibility for any injury to people or property resulting from any ideas, methods, instructions or products referred to in the content.