Article

Adsorption Characteristics of Praseodymium and Neodymium with Clay Minerals

1
Xingfa School of Mining Engineering, Wuhan Institute of Technology, Wuhan 430073, China
2
Key Laboratory for Green Chemical Process, Ministry of Education, Wuhan 430073, China
*
Author to whom correspondence should be addressed.
Minerals 2025, 15(10), 1051; https://doi.org/10.3390/min15101051
Submission received: 9 June 2025 / Revised: 18 September 2025 / Accepted: 26 September 2025 / Published: 3 October 2025
(This article belongs to the Section Mineral Processing and Extractive Metallurgy)

Abstract

As the production of electric vehicles grows, the rare earth elements Pr and Nd become increasingly significant, as they are key in magnetic materials production. In order to achieve the green and efficient recovery of Pr and Nd from the rare earth leachate, this paper selected kaolinite and halloysite as adsorbents to conduct rare earth solution adsorption experiments for exploring the effects of the initial leachate concentration, the solution pH, and the adsorption temperature on the adsorption process. The adsorption characteristics of Pr and Nd by clay minerals were analyzed by quantum chemical calculation. The results showed that the adsorption effects of clay minerals on Pr and Nd decreased with the rise of leachate concentration. When leachate pH increased, the adsorption efficiency of kaolinite and halloysite for Pr firstly increased and then decreased, and the optimal adsorption efficiency was 13.33% and 24.778% at pH 6, respectively. The adsorption effects of kaolinite and halloysite on Nd enhanced gradually with the increase in pH, which increased to 15.925% and 30.482% at pH 7, respectively. With temperature increased, the adsorption of Pr and Nd by kaolinite and halloysite was positively correlated. The isothermal adsorption model was fitted to the experimental data, and it was found that the adsorption of Pr and Nd by kaolinite and halloysite was consistent with the Langmuir model, with R2 above 0.96, indicating that the adsorption process was a single molecular layer adsorption. The results provide theoretical support for the effective recycling of Pr and Nd, which is of great significance for the utilization of rare earth resources in permanent magnets.

1. Introduction

Rare earth resources are widely used in many technology fields, and have become essential key components in high-tech products, equipment, and technology, including clean energy such as solar and wind energy, national security and defense science, and technology [1,2]. As a crucial strategic rare metal resource, rare earth elements are important metal resources in the development of science, technology, and industry, especially in the electric vehicle and renewable energy fields [3,4,5,6]. For carmakers in Europe, China, and the US, the growing production of electric vehicles is dependent on rare earth permanent magnets made from Pr and Nd, as raw materials. In addition, Pr and Nd materials are widely used in a series of new energy industrial chains such as hydrogen storage and permanent magnet materials. In particular, Pr and Nd materials have become essential for the wind power and magnetic materials industries [7,8]. The weathered crust elution-deposited rare earth ore is enriched in rare earth elements, and is the main source of Pr and Nd. Pr and Nd are often adsorbed as hydrated or hydroxyl hydrated ions with clay minerals, which mainly include kaolinite, montmorillonite, and illite in the weathered crust elution-deposited rare earth ore [9,10].
At present, scientists have done a lot of research work on the occurrence law and mineralization mechanism of rare earth elements on the surface of clay minerals. The mineralization process of ion-adsorbed rare earth minerals was revealed through the adsorption experiment of La on the surface of kaolinite [11]. The Langmuir model was the best for the isothermal adsorption of heavy metal ions by humic acid, and the adsorption capacity increased with the increase in temperature, which was the conclusion of adsorption selectivity tests on the heavy metal mixture system containing La and Nd [12]. The Langmuir model of the adsorption of rare earth ions on clay minerals found the highest correlation for the surface adsorption of different types of rare earth ions on clay minerals [13]. The adsorption and desorption characteristics of rare earth ions on clay minerals are not representative of actual carrier ion rare earth minerals. The adsorption of heavy rare earth by amino-phosphonic acid resin was the best when the buffer solution of HOAc-NaOAc had a pH = 5.0, and its static saturation adsorption capacity at 298 K could reach 332 mg/g, providing a new condition for the recovery of rare earth [14]. The complete adsorption law of rare earth elements was studied using kaolinite at different pH and ionic strength, and a systematic comparison of the enrichment law of rare earth elements on kaolinite was conducted [15]. However, there were few reports on the enrichment rules and adsorption characteristics of Pr and Nd elements with the typical clay minerals, and a systematic analysis of Pr and Nd elements was absent.
In the paper, kaolinite and halloysite were used as adsorbents, and the adsorption behavior of kaolinite and halloysite on Pr and Nd elements was explored. Through static adsorption experiments, the effects of the initial concentration, pH, and experimental temperature on the adsorption process of Pr and Nd by kaolinite minerals were systematically analyzed, and the adsorption model of kaolinite minerals on Pr and Nd was established. The mechanism of the kaolinite adsorption of Pr and Nd was studied using quantum chemistry theory, which provides a theoretical basis for the green and efficient mining of Pr and Nd, and is expected to enrich the utilization of resources in permanent magnets.

2. Materials and Methods

2.1. Experimental Materials

The ore samples used in the experiment were collected from the weathered crust elution-deposited rare earth ore in Yunnan, China. The chemical composition of the ore samples was analyzed by X-ray fluorescence spectroscopy (Axios advanced, Malvern Panalytical, Malvern, UK), as shown in Table 1. Table 1 showed that SiO2 was the main chemical component in the ore, accounting for 66.23%, followed by Al2O3, accounting for 18.14%, while the content of rare earth oxide accounts for 0.12%. The partitioning values of Pr and Nd are usually 2–5 % and 16–20% in the rare earth ore. All chemical reagents were analytically pure.

2.2. Experimental Methods

2.2.1. Adsorption Experiment

In the isothermal adsorption experiments, different concentrations (ranging from 100 to 10,000 umol/L) of Pr and Nd solutions were prepared, and 25 mL of each concentration was taken into a 50 mL centrifuge tube and repeated for four groups. A total of 0.5 g of kaolinite and halloysite was added to each of the above four solutions, mixed evenly by a magnetic stirrer at 200 rpm, and then shaken for 12 h with a constant temperature oscillator. At the end of the reaction, the mixed group was separated by centrifugation, and the supernatant was taken to determine the element content. The solution pH (pH Meter, DELTA320, Mettler Toledo, Greifensee, Switzerland) was adjusted with 0.05 mol/L NaOH and 0.1 mol/L H2SO4, normally kept as 5–6. The rare earth concentrations were tested by ICP-MS (Agilent 7700x, Agilent, CA, USA). The other instruments were GeminiSEM 300 (ZEISS, Jena, Germany) and Nicolet6700 (Thermo Fisher Scientific, Waltham, MA, USA), provided by the analytical center of the Wuhan Institute of Technology.
In the exploration of isothermal adsorption experiments with temperature factors, the constant temperature was adjusted. The adsorption data were characterized by the adsorption amount Qe, µmol/g, which means the mass of Pr or Nd adsorbed per gram of clay mineral. The equation is shown in Equation (1):
Q e   =   ( C 0 C ) · V m
In the formula, C0 is the initial rare earth solution concentration, µmol/L; C is the concentration of rare earth solution at adsorption equilibrium, µmol/L; V is the solution volume, L; and m is the mass of clay minerals, g.

2.2.2. Isothermal Adsorption Model

The adsorption isotherms of Pr3+ and Nd3+ on kaolinite and halloysite were investigated by batch experiments, and the isothermal adsorption model was fitted to the experimental data. In this paper, the classical Langmuir model and Freundlich model were selected for fitting to reflect the adsorption mechanism. The Langmuir model describes the monolayer adsorption on a uniform surface, and the linear expression is shown in (2):
C e Q e   =   1 K Q max   +   C e Q max
In the formula, Ce is the equilibrium concentration of Pr3+ or Nd3+, µmol/L; Qe is the adsorption capacity, µmol/g; K is the Langmuir absorption constant; and Qmax is the maximum adsorption capacity, mg/g.
The Freundlich adsorption isothermal formula is an empirical formula summarized based on a large number of experimental data, and is suitable for the physical adsorption of multi-molecular layers on non-uniform surfaces. The linear expression is shown in (3):
log Q e = log K F   +   1 n log C e
In the formula, KF is the Freundlich absorption constant and n is a constant.

2.2.3. Quantum Chemical Analysis

The first-principles method based on the plane wave pseudopotential density functional theory was adopted, and the relevant calculations were carried out in the Castep module of the Materials Studio 2019 software. Under the conditions of a k point size of 2 × 1 × 1 and a truncation energy of 400 eV, the geometric structure of the unit cell was optimized by the BFGS algorithm. Kaolinite and halloysite were cut out from the optimized unit cell and expanded into a 2 × 2 × 1 superunit cell surface. The adsorption energy was calculated under the geometric optimization convergence criteria of an energy convergence threshold of 2.0 × 10⁻⁵ eV·atom−1, an interatomic force convergence threshold of 0.05 ev Å−1, a crystal internal stress convergence threshold of 0.1 GPa, and an atomic displacement convergence threshold of 0.002 Å.

3. Results

3.1. Clay Mineral Composition and Content

We used the methodology from ‘X-ray diffraction analysis methods for clay minerals and common non-clay mineral in sedimentary rocks’ (SY/T 5163-2010) to analyze the clay mineral composition by preparing the natural sheet, ethanediol sheet, and temperature sheet [16]. The clay mineral composition and content in the weathered crust elution-deposited rare earth ore are shown in Figure 1.
According to Stokes’ principle, clay minerals were extracted from the rare earth ore samples by natural sedimentation, and the composition and content of the clay minerals were analyzed by X-ray diffraction. Kaolinite group clay minerals, kaolinite, halloysite, illite, and montmorillite are represented by KAO-group, Kao, Hal, It, and S, respectively. The calculation formula for their percentage content is as follows:
Kao   group   =   I 0.7 nm ( N ) / 1.5 I 0.7 nm ( N ) / 1.5   +   I 0.7 nm ( 550   )   ×   100
It = I 1.0 nm ( EG )   ×   h 0.7 nm ( N ) / h 0.7 nm ( EG ) I 1.0 nm ( 550   )   ×   ( 100     Kao )
S = 100 K a o I t
The calculation formula for the relative content of kaolinite and halloysite in kaolinite group clay minerals is as follows:
Hal Kao   =   K   ×   I 1.09 nm I 0.715 nm
In the formula, I and h, respectively, represent the intensity and height of the diffraction peaks in the XRD pattern, and their subscript indicates the position of the diffraction peaks in the pattern. The N, EG, and 550 °C in parentheses represent the diffraction peaks of different oriented plates, namely, the natural oriented plate, the ethylene glycol saturated oriented plate, and the heated oriented plate. Take equal amounts of halloysite and kaolinite standard samples, mix them evenly, and then saturate them with dimethyl sulfoxide for 5 h. Measure the intensities of the d001 diffraction peaks, respectively, and the ratio is K.
After subtracting the background from the spectrum in Figure 1, the intensity and height values of each diffraction peak were measured and substituted into Equations (4)–(6) to calculate the relative contents of KAO-group, illite, and montmorillite. Kaolinite and halloysite have similar chemical compositions and crystal structures. The difference between the two is that there are interlayer hydrates within the crystal layers of halloweite. Halloweite is divided into 7Å halloweite and 10Å halloweite. At room temperature, 10Å halloweite can also easily lose its interlayer hydrate to become 7Å halloweite, and this water loss shrinkage is irreversible. Ethylene glycol can enter the 7Å halloweite crystal layer, forming salt intercalation or interlayer complexes, causing the (001) crystal layer spacing to expand, while the structure of the kaolinite crystal layer remains unchanged. Therefore, dimethyl sulfoxide saturation treatment can be used to distinguish and semi-quantitatively analyze the relative content.
As can be seen from the above figure, after the sample was saturated with dimethyl sulfoxide, the intensity of the d001 = 7.15Å peak of the kaolinite clay minerals weakened, and a new peak appeared at 10.9 Å, indicating that the kaolinite clay minerals include halloysite and kaolinite. To sum up, the clay mineral components in the ore samples of each weathering layer all include kaolinite, halloysite, illite, and montmorillite.
The diffraction peak intensities IHal and IKao of halloysite and kaolinite, respectively, 7Å after the score peak can be measured from Figure 1. Substituting them into Equation (7), the relative contents of halloysite and kaolinite can be calculated. The K value measured experimentally is 0.820. The calculation results are shown in Table 2.
According to Figure 1 and Table 2, the characteristic peaks of kaolinite, halloysite, illite, and montmorillonite were 7.15Å, 3.57Å, 10Å, and 15Å. Four clay minerals, kaolinite, halloysite, illite, and montmorillonite, are mainly clay minerals in the ore, and the corresponding relative contents of these four clay minerals are 25.06%, 65.78%, 8.13%, and 1.03%, respectively. This suggested that the clay minerals present in the rare earth formation are most abundant in halloysite, followed by kaolinite, with illite and montmorillonite being relatively less abundant.

3.2. Effects of Initial Solution Concentration on Adsorption Process

3.2.1. Effects of Kaolinite and Halloysite on Pr Adsorption Properties

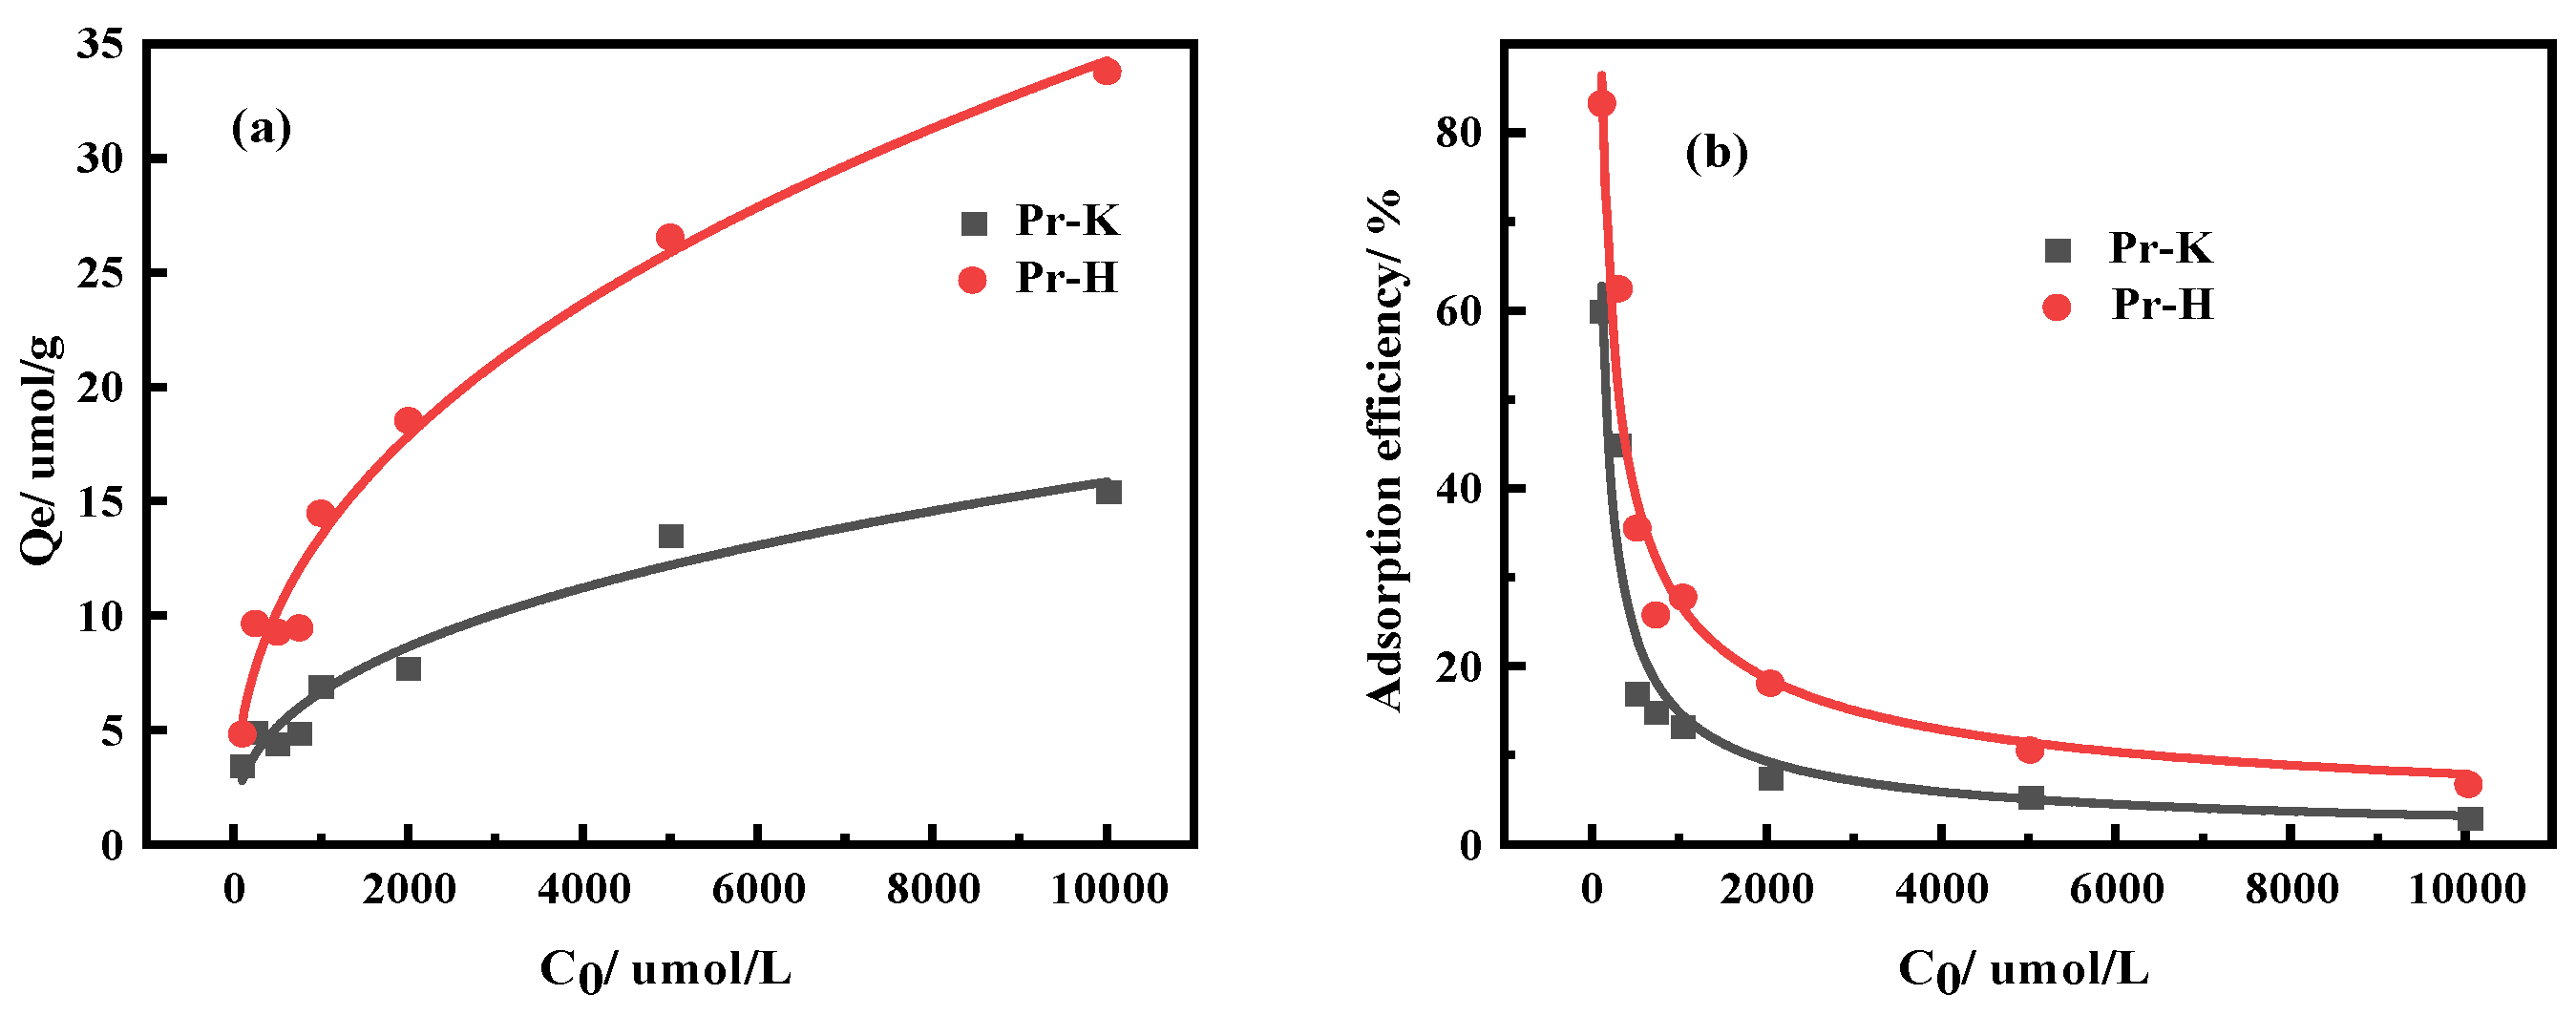
In order to research the effects of the initial solution concentration on the adsorption process of Pr by kaolinite and halloysite, the content and efficiency of Pr adsorption by kaolinite and halloysite are shown in Figure 2.
It can be seen from Figure 2 that the adsorption capacity of kaolinite and halloysite for Pr increased with the enhancement in the rare earth solution concentration, while the adsorption efficiency for Pr decreased with the increase in the concentration of the solution. When the concentration of Pr3+ was 10000 µmol/L, the adsorption capacity of kaolinite and halloysite was 15.45 µmol/g and 33.80 µmol/g, respectively. The adsorption efficiency was 6.73% and 3.08%, respectively. At this time, the adsorption process tended to be saturated, and the adsorption capacity was close to the maximum value. The experimental results showed that the adsorption capacity and adsorption efficiency of kaolinite to rare earth element Pr were lower than that of halloysite, which may be due to the fact that kaolinite has a silicon oxygen tetrahedral sheet and an aluminum oxygen octahedral sheet in the lattice structure, and the hydrogen bond between adjacent crystal layers prevents the expansion of kaolinite, which directly results in a small specific surface area of about 10–20 m2/g, all on the outer surface. The possibility of isomorphous replacement occurring is very low and hence the cation exchange capacity is low [17,18]. However, halloysite showed excellent adsorption performance for rare earth element Pr due to its nano-hollow tubular morphology, abundant pore structure, and external surface with tetrahedral siloxane groups [19].
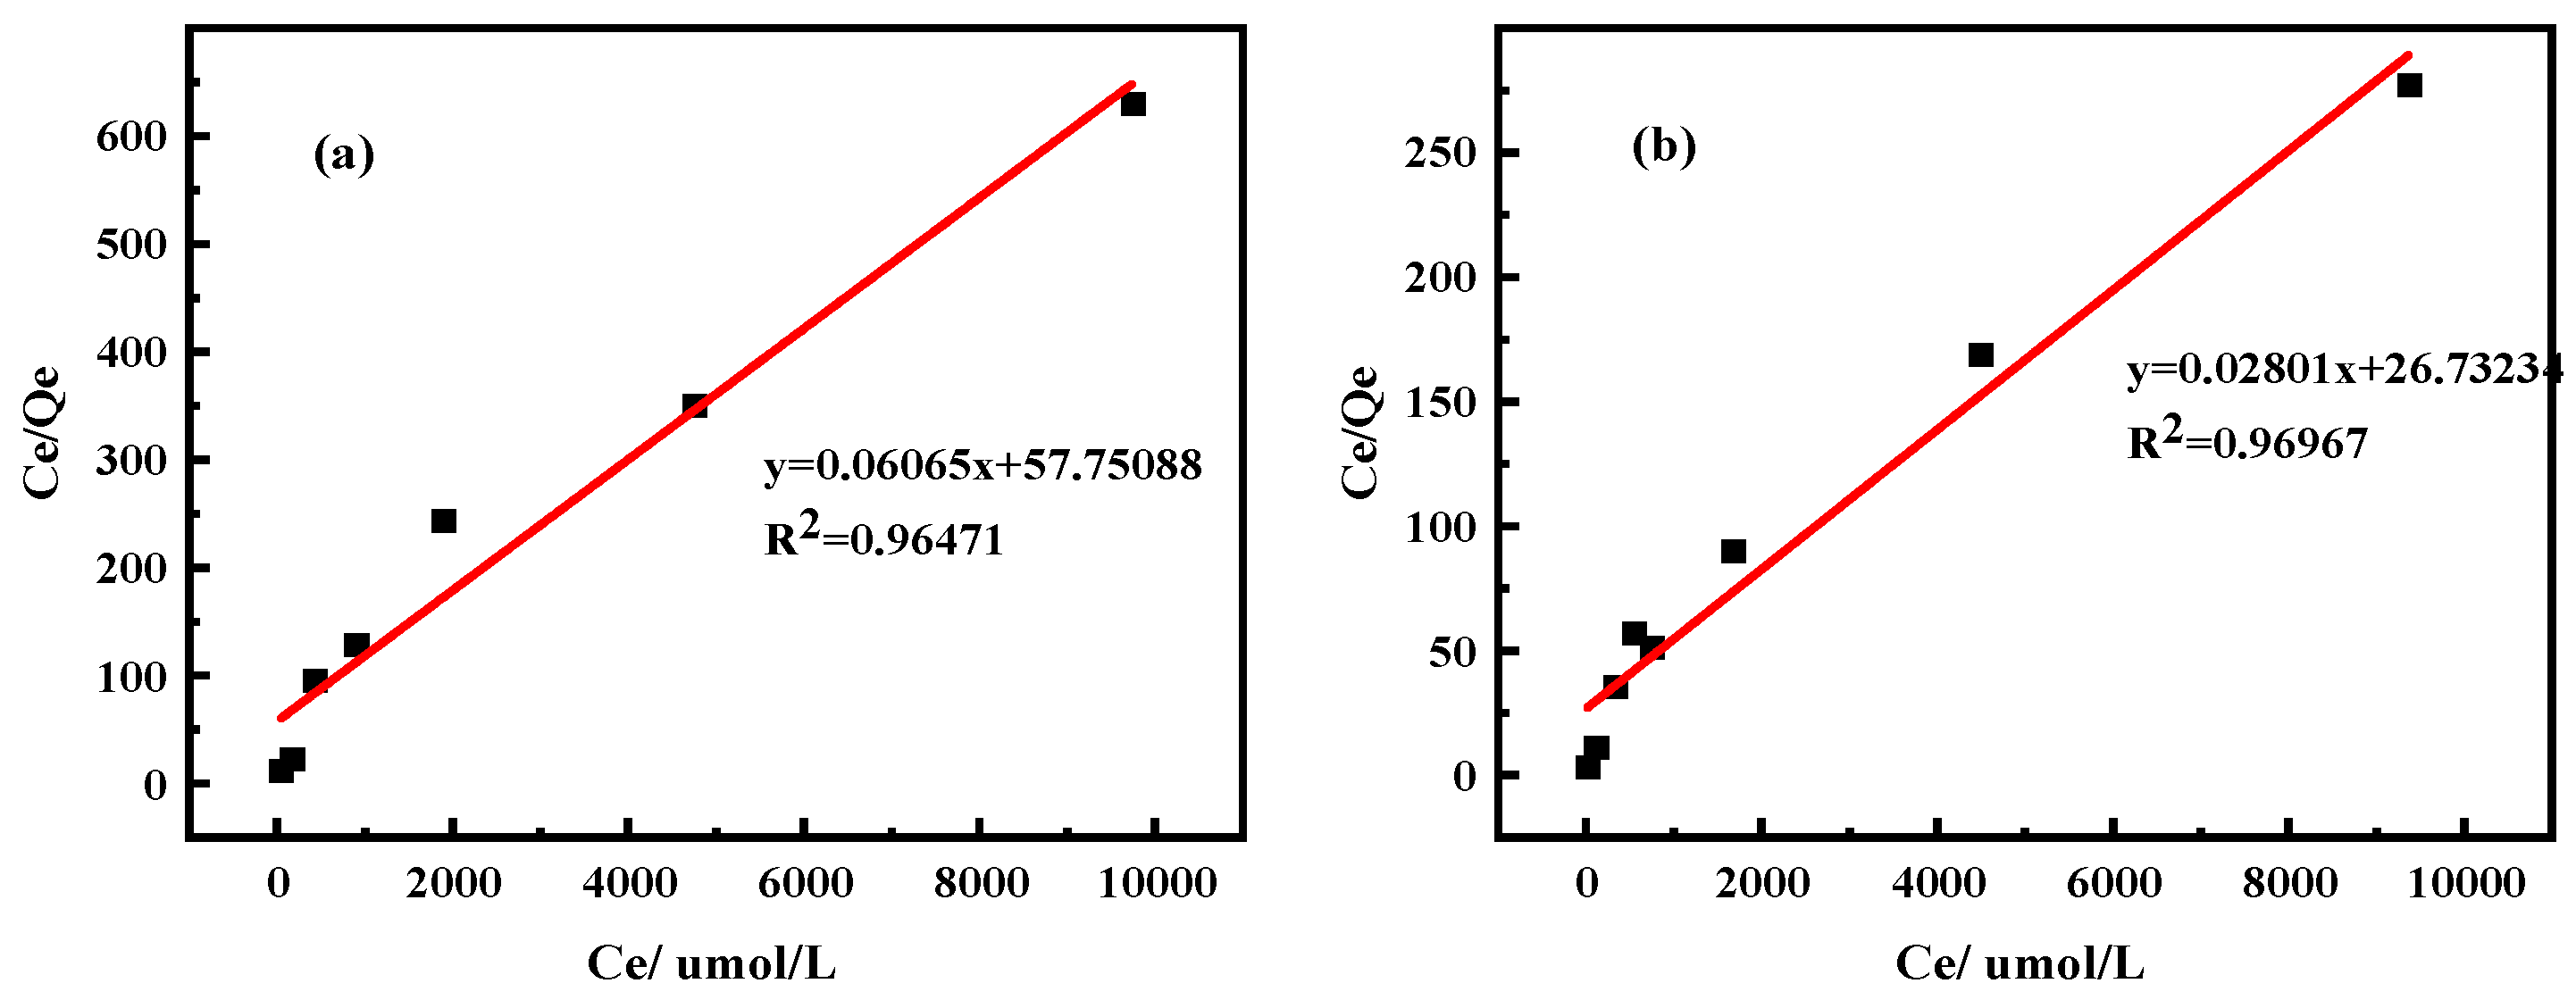
In order to further analyze the adsorption behaviors of Pr on kaolinite and halloysite, the isothermal adsorption model was fitted to the experimental data, and the fitting results are shown in Figure 3, and the results of the relevant calculated parameters are listed in Table 3.
As can be seen from Table 3, the R2 of the Langmuir model of kaolinite and halloysite adsorption of Pr were 0.965 and 0.970, which were larger than the fitting parameters of the Freundlich model of 0.607 and 0.937. Therefore, the adsorption process of Pr3+ by kaolinite and halloysite is more consistent with the Langmuir model, indicating that the adsorption process belongs to the monolayer adsorption, indicating that monolayer adsorption more easily adsorbs the rare earth element Pr. The maximum adsorption capacity of kaolinite and halloysite for Pr was 16.488 µmol/g and 35.702 µmol/g calculated by Langmuir model fitting, which was consistent with the experimental data.

3.2.2. Effects of Kaolinite and Halloysite on Nd Adsorption Properties

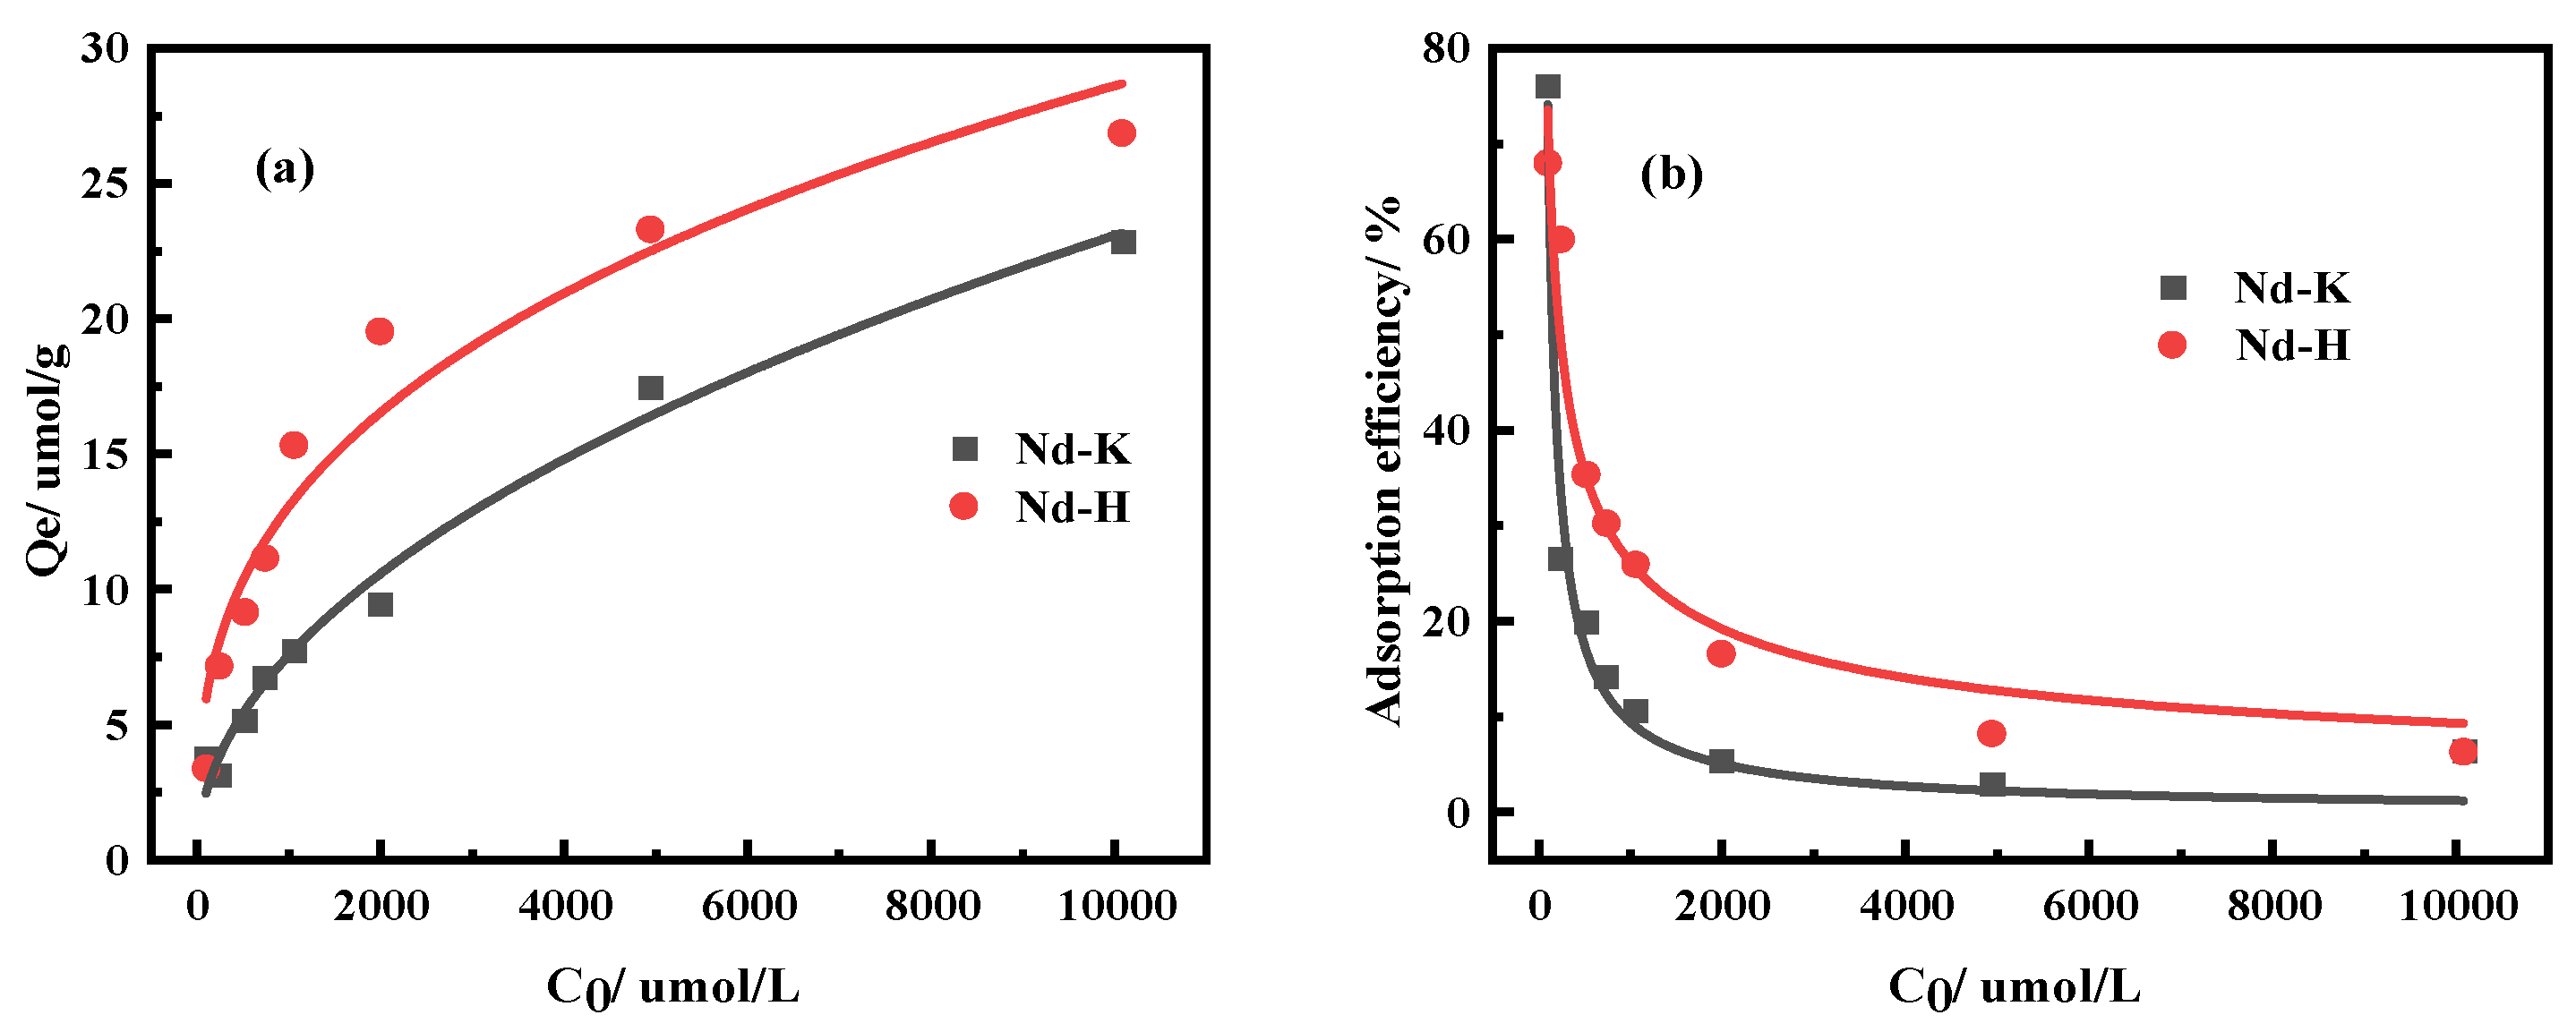
In order to study the effect of the solution concentration on the process of the Nd adsorption of kaolinite and halloysite, the experiment was carried out and the experimental results are shown in Figure 4.
According to Figure 4, with the rise of the concentration, the adsorption capacity of kaolinite and halloysite with Nd increased continuously, and the adsorption efficiency decreased gradually. In Figure 4, the adsorption capacity of Nd by kaolinite and halloysite reached 22.86 µmol/g and 26.86 µmol/g, respectively; when the concentration was 10,000 µmol/L, the adsorption efficiencies were 6.32% and 6.52%, indicating that the adsorption process reached equilibrium, and the adsorption capacity of kaolinite and halloysite on Nd also tends to be the maximum. According to the two figures, the adsorption capacity and adsorption efficiency of halloysite on Nd were greater than those of kaolinite on Nd, indicating that halloysite showed better adsorption performance than kaolinite on Nd.
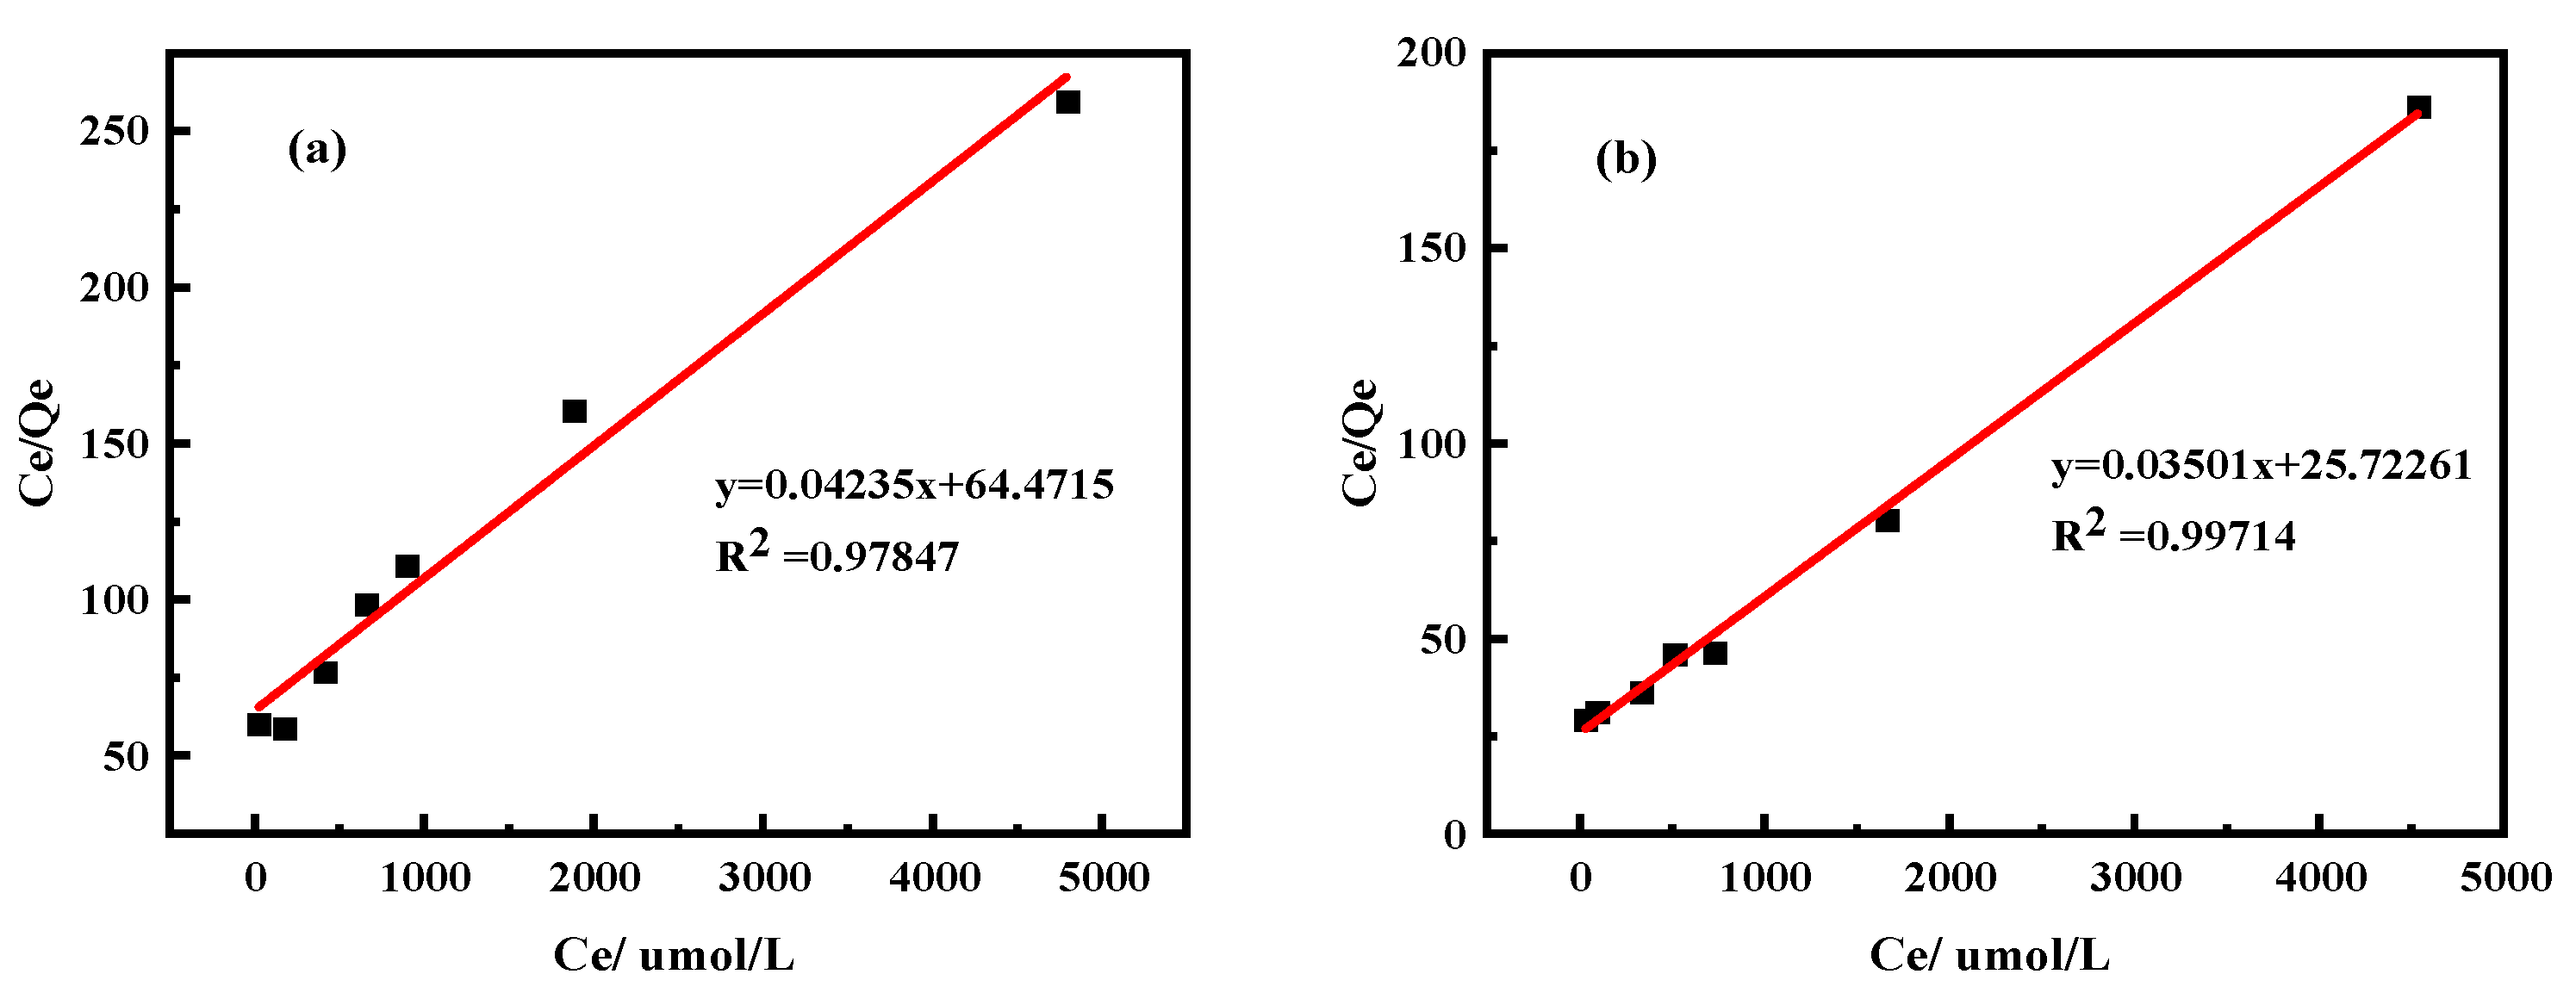
In order to further analyze the adsorption behaviors of neodymium on kaolinite and halloysite, the isothermal adsorption model was fitted to the experimental data; the results are shown in Figure 5, and the calculated results are listed in Table 4.
From the data in the Table 4, it can be seen that the linear correlation coefficients of Langmuir model fitting for Nd adsorption with kaolinite and halloysite were 0.978 and 0.997, which are higher than the fitting parameters of Freundlich model, which is more consistent with the Langmuir model, indicating that the adsorption process is a single layer. These results indicate that Nd is more easily adsorbed by monolayer adsorption. According to the fitting parameters of the Langmuir model, it can also be seen that the maximum adsorption capacity of kaolinite on Nd was about Qmax = 23.613 µmol/g, and the maximum adsorption capacity of halloysite on Nd was about Qmax = 28.571 µmol/g, which was consistent with the experimental data. The effects of the adsorption process on Pr and Nd recovery can further strengthen the resource’s application.

3.3. Effects of pH on Adsorption Efficiency/Adsorption Capacity

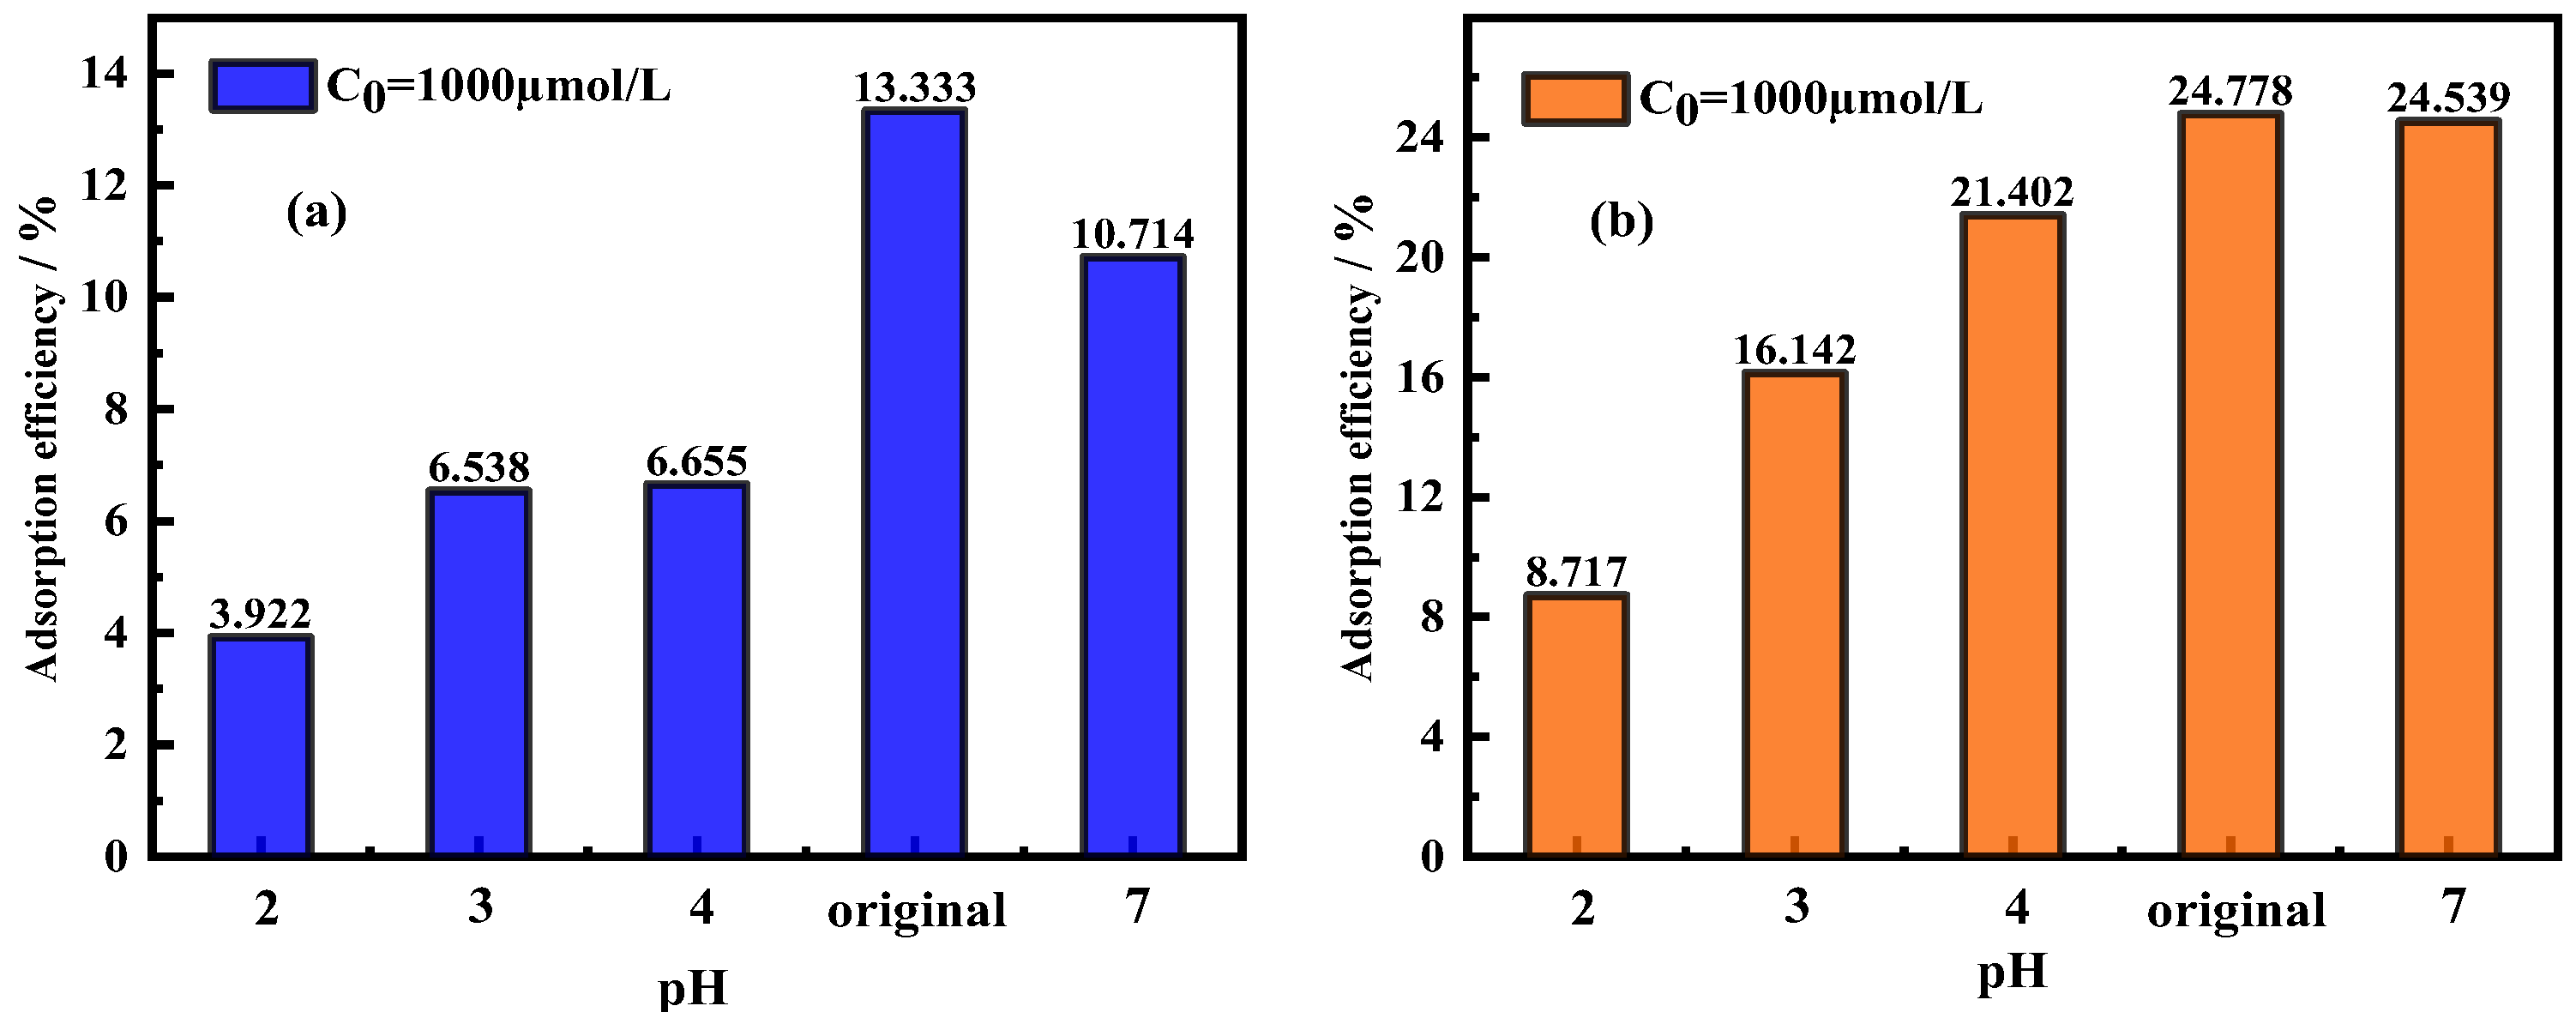
In order to analyze the effect of pH on the adsorption of rare earth element Pr by kaolinite and halloysite, static adsorption experiments were carried out under different pH conditions, and the experimental results are shown in Figure 6.
As shown in Figure 6, when the solution’s pH value ranged from 2 to 7, the adsorption efficiency of kaolinite and halloysite on Pr increased with the rise of pH, and the adsorption effect was better. When the pH was at 7, the adsorption effects of kaolinite and halloysite on Pr became worse. This is because the variation in pH value will cause a change in the surface charge of kaolinite and halloysite, and then lead a change in the surface functional groups and structure. When the solution’s pH value was low, H+ and Pr3+ would compete for adsorption, and the adsorbent group would combine with H+, so that the active site was occupied and the adsorption rate of Pr3+ was reduced. The functional groups on the surface of kaolinite and halloysite might undergo a degranulation reaction and result in the co-precipitation of Pr [20].
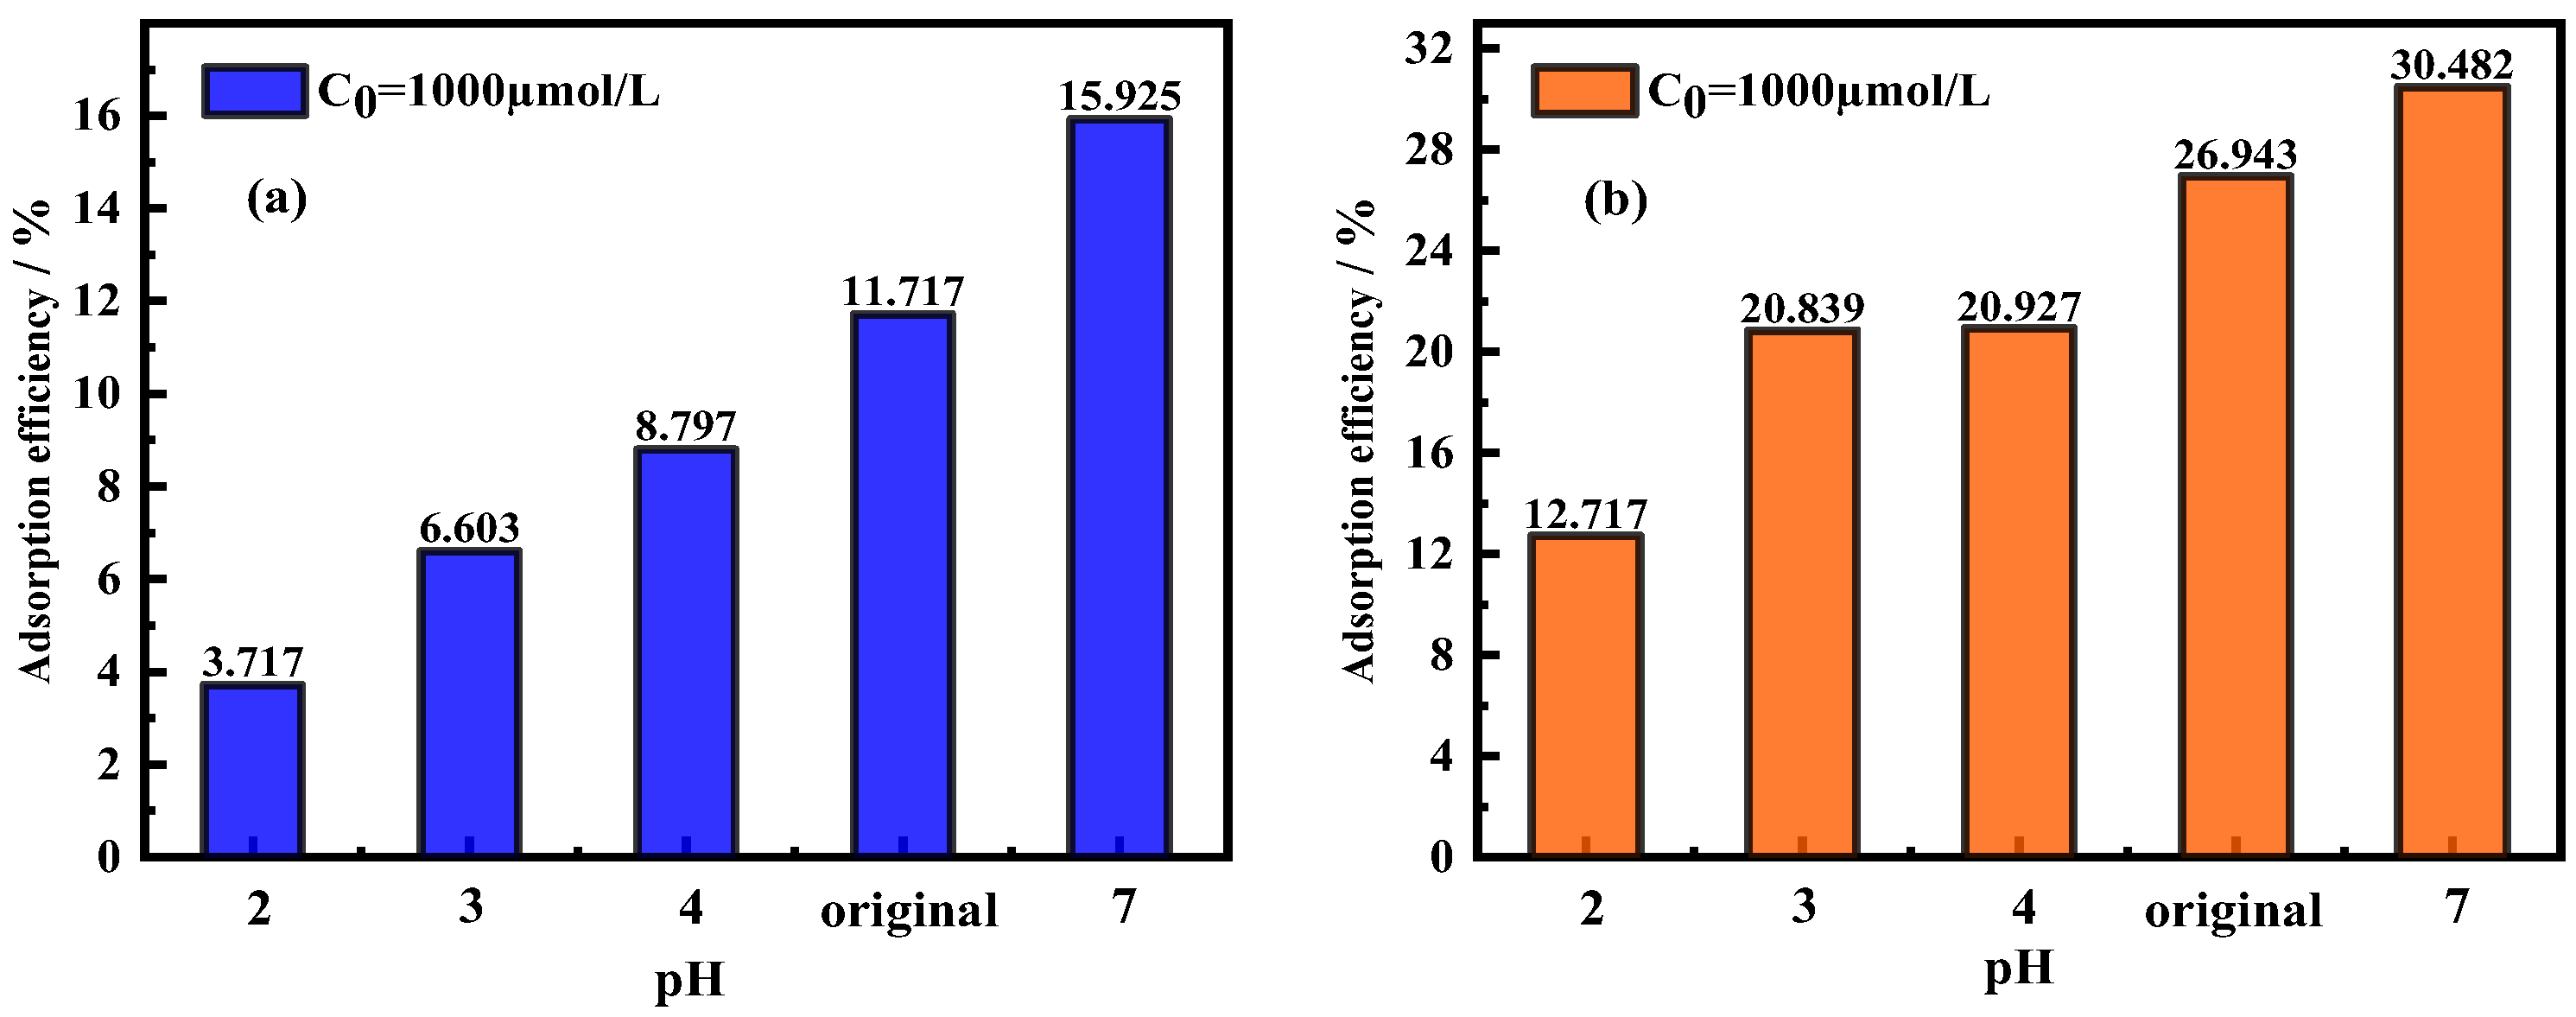
To explore the effects of pH on the adsorption of Nd by kaolinite and halloysite, static adsorption experiments were carried out by setting different pH, and the experimental results are shown in Figure 7.
According to Figure 7, when pH ranged from 4 to 7, the adsorption performance of kaolinite and halloysite on Nd was better with the increase in pH, which may be due to the increased adsorption effects of kaolinite and halloysite on Nd when the ionic strength was low and the pH increased without co-precipitation. The Nd was absorbed in the form of cation exchange on the surface of kaolinite and halloysite at low pH [21]. Excessively high pH is not conducive to the existence of rare earth element ions and has a significant impact on the recovery of Pr and Nd. pH has a considerable influence on the adsorption of rare earth, and particular attention should be paid to the change in pH during the adsorption process for a better recovery effect.

3.4. Effects of Temperature on Adsorption Efficiency/Adsorption Capacity

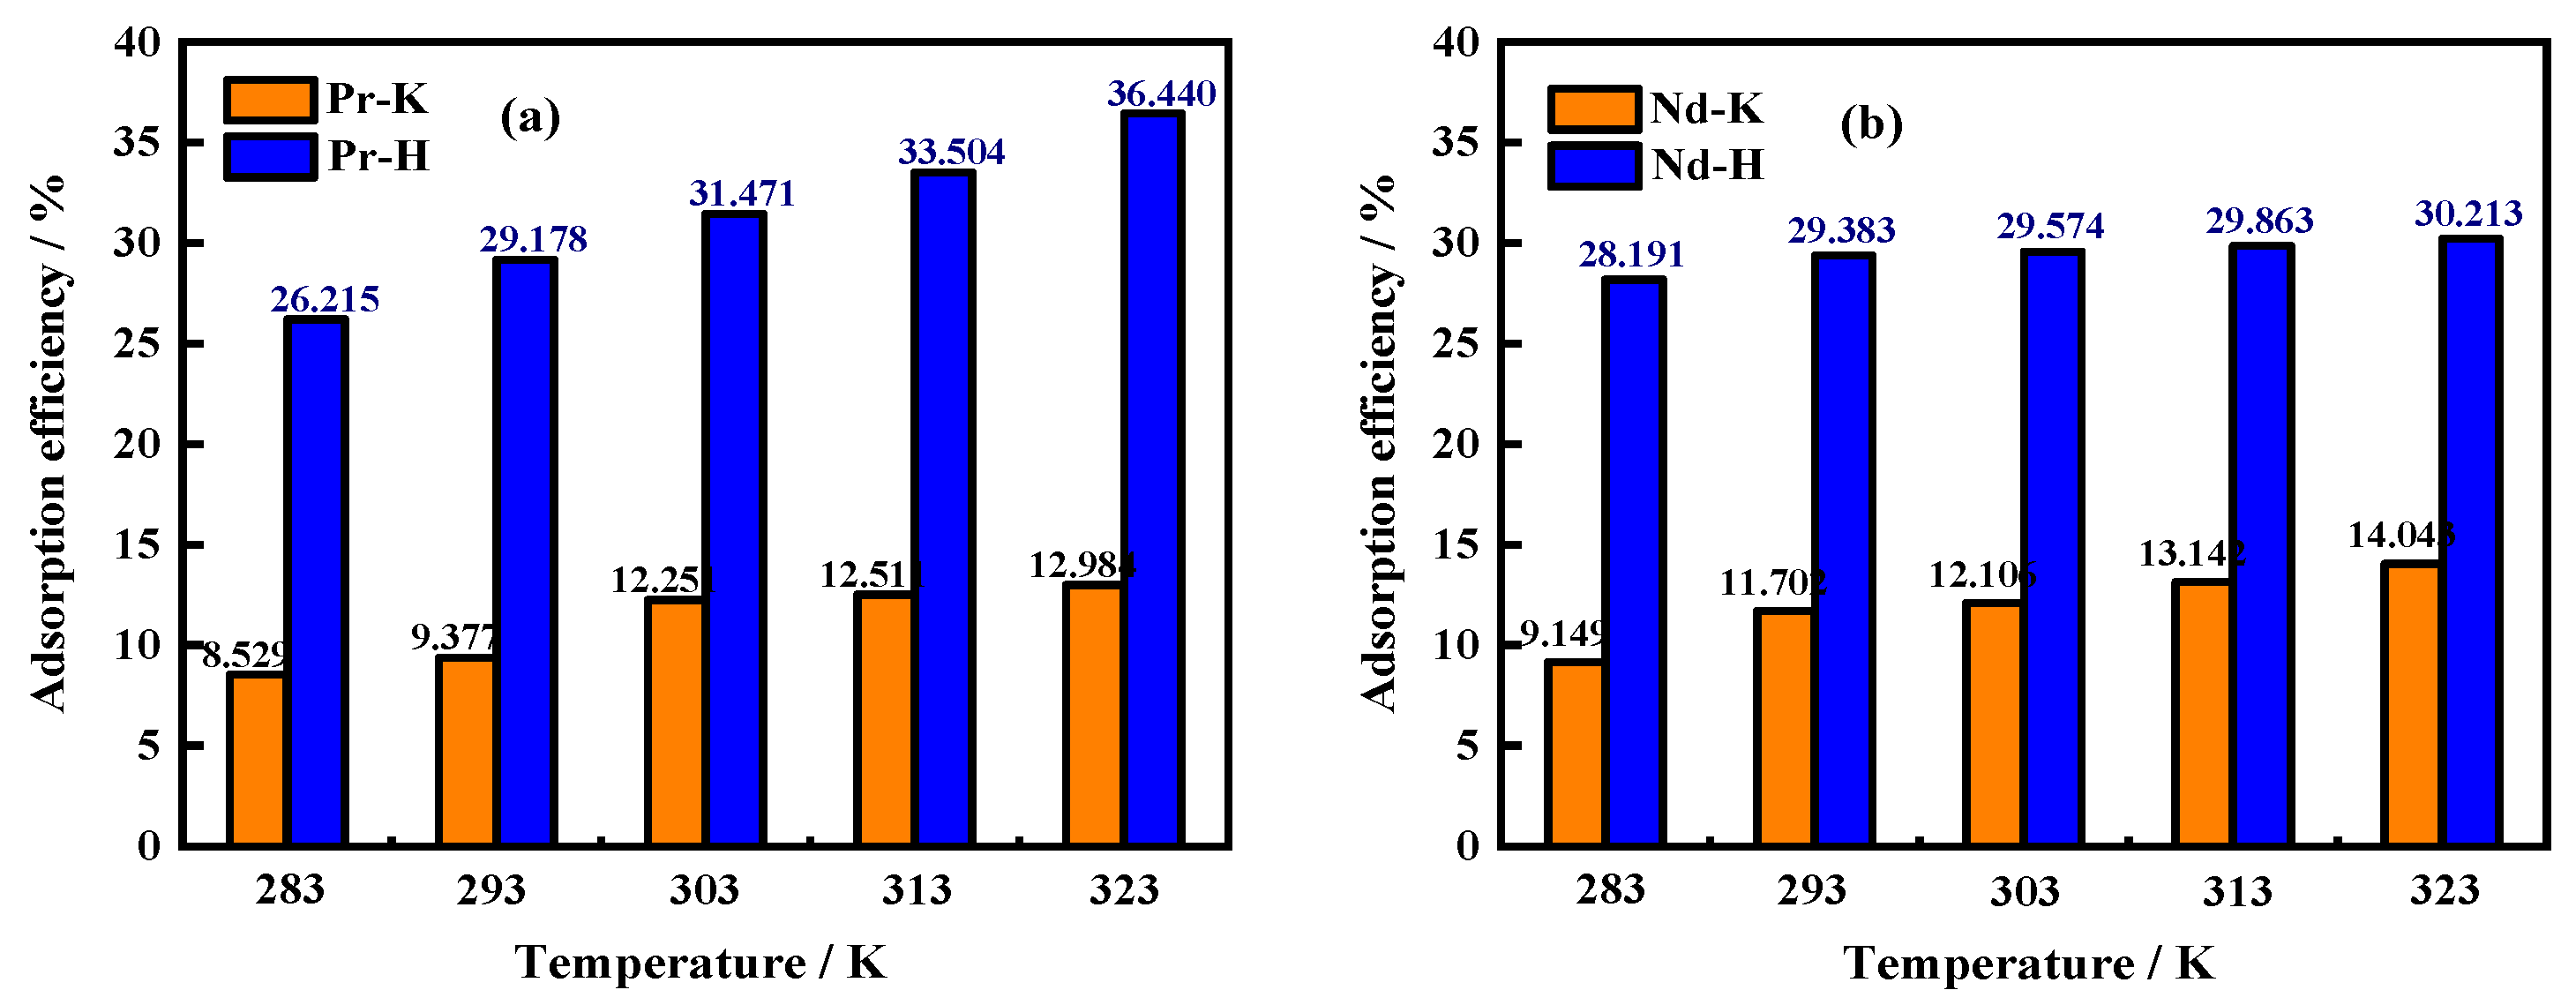
In order to study the effect of temperature on the adsorption process of Pr and Nd by kaolinite and halloysite, the static adsorption experiments of Pr and Nd elements were conducted at temperatures of 283 K, 293 K, 303 K, 313 K, and 323 K, respectively, and the results are shown in Figure 8.
As can be seen from Figure 8, the adsorption efficiency of Pr and Nd by kaolinite and halloysite showed a gradual increase with the enhancement of the reaction temperature, indicating that the adsorption reaction is a heat-absorbing process, and the enhancement of the reaction temperature helps the adsorption of Pr3+ and Nd3+ by the clay minerals. However, the trend of increasing the equilibrium adsorption efficiencies of kaolinite and halloysite with rising temperature was not obvious.

3.5. Adsorption Mechanism of Rare Earth Elements with Clay Minerals

3.5.1. SEM Analysis Results of Adsorption Process

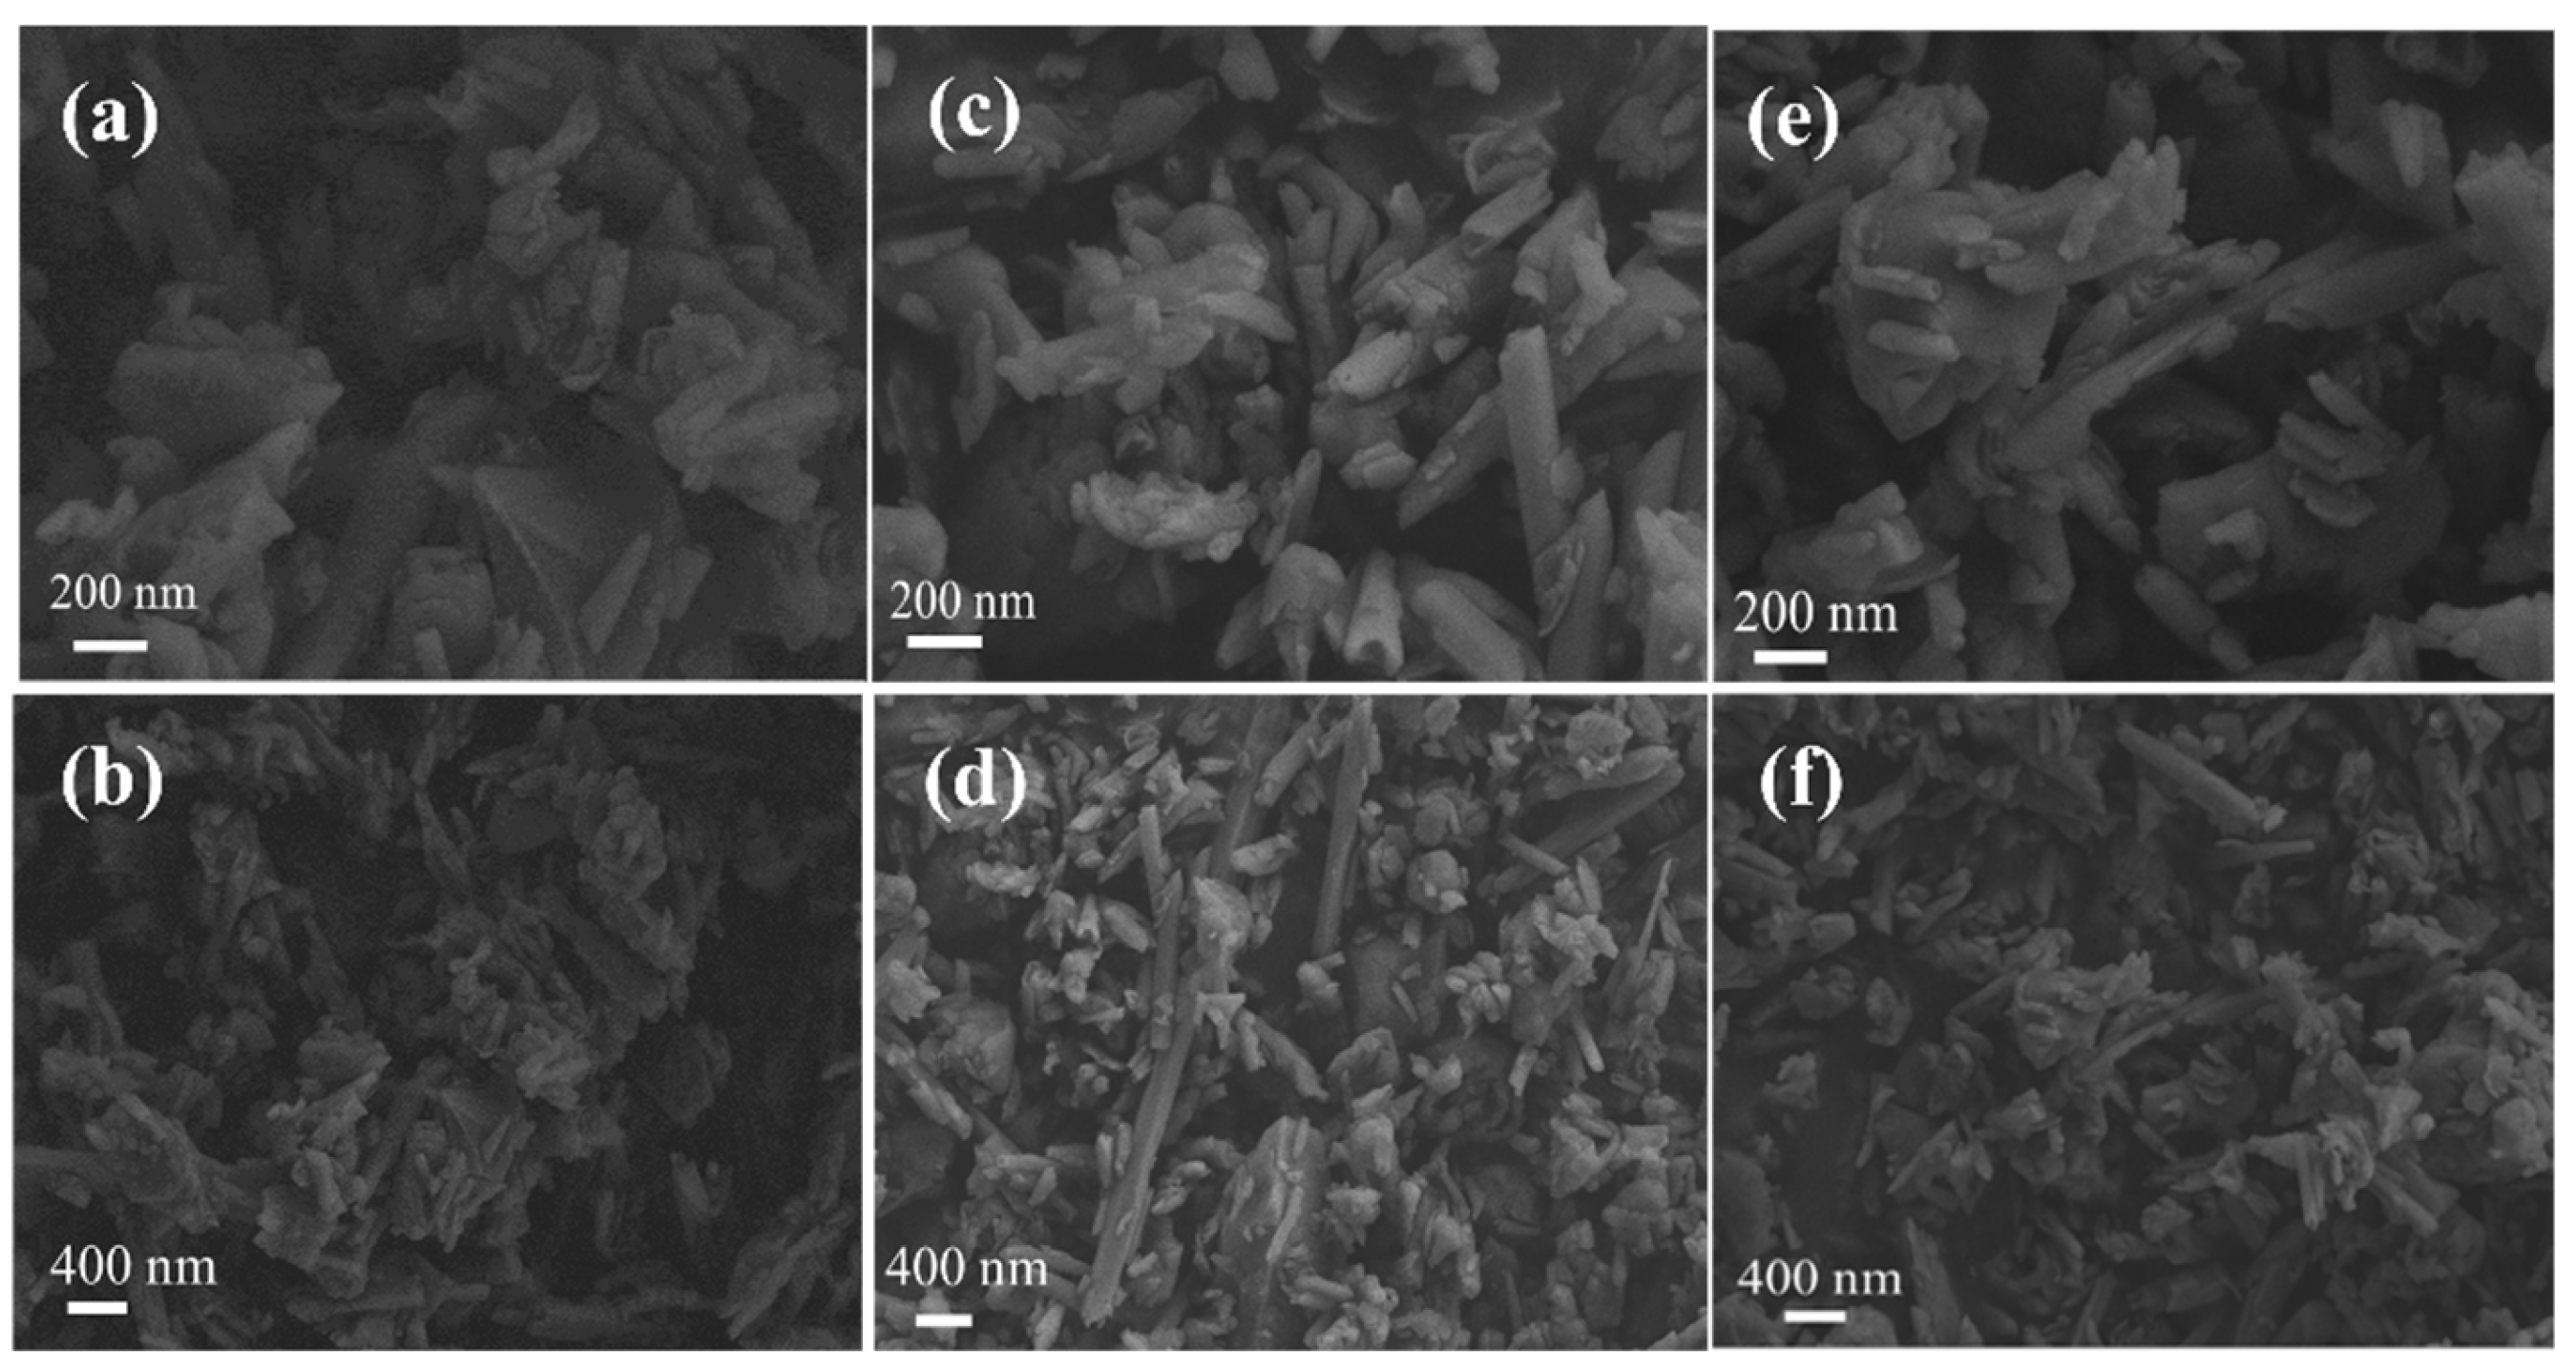
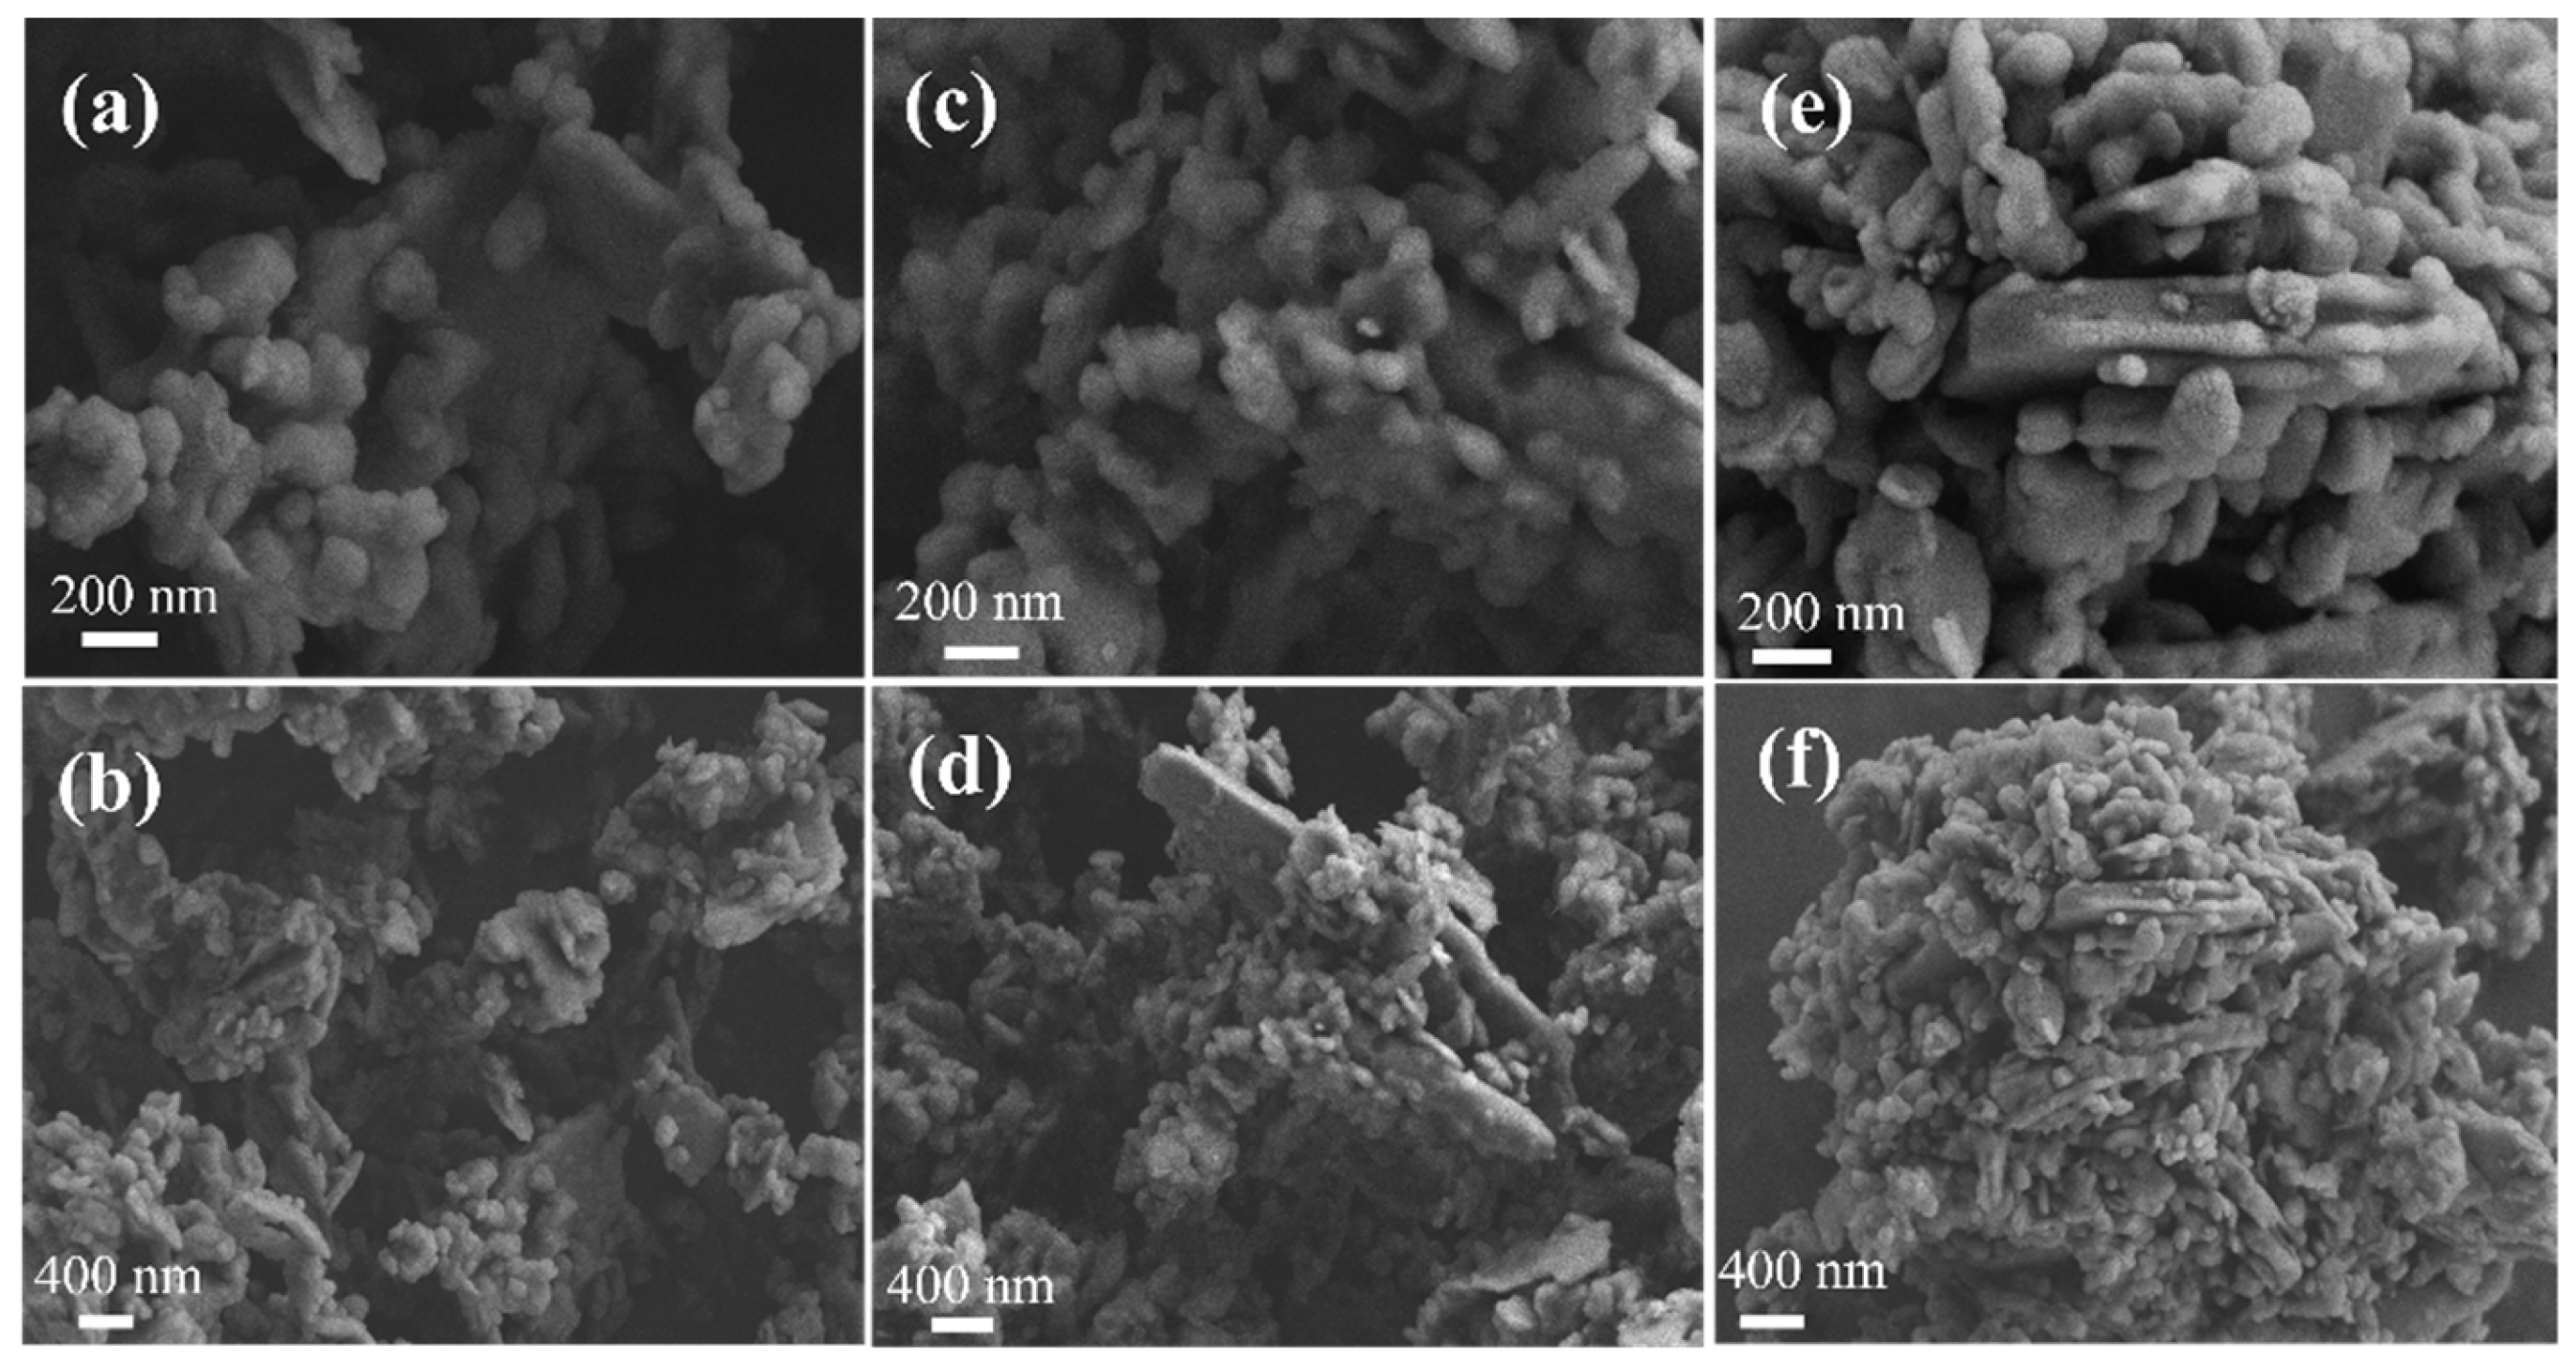
In order to explore the adsorption mechanism of Pr and Nd adsorbed by halloysite, the adsorbents before and after the adsorption of Pr and Nd were analyzed by scanning electron microscopy, and the results are shown in Figure 9.
Figure 9 showed that halloysite has a stacked tubular structure. Figure 9c–f show that after Halloysite adsorbs Pr and Nd, except for the tubular halloysite, some granular substances can be clearly observed, which may be due to the fragmentation of halloysite nanotubes during the adsorption process, and the surface roughness of halloysite decreases after adsorption.
In order to explore the adsorption mechanism of the rare earth elements Pr and Nd adsorbed by kaolinite, the ore samples before and after the kaolinite adsorption of rare earth elements Pr and Nd were analyzed by scanning electron microscopy, and the results are shown in Figure 10.
According to Figure 10, kaolinite presents multi-layered stacking, and produces the phenomenon of the cross-stacking of stacked bodies, and the overall appearance is a disorderly aggregation of particles of multiple layered stacked bodies. Figure 10c–f show that after adsorption, the kaolinite stacks are denser, and more granular substances are gathered, which exist between the stacks, and the surface of the adsorbed kaolinite becomes rough.

3.5.2. Infrared Spectroscopy Analysis Results of Adsorbents

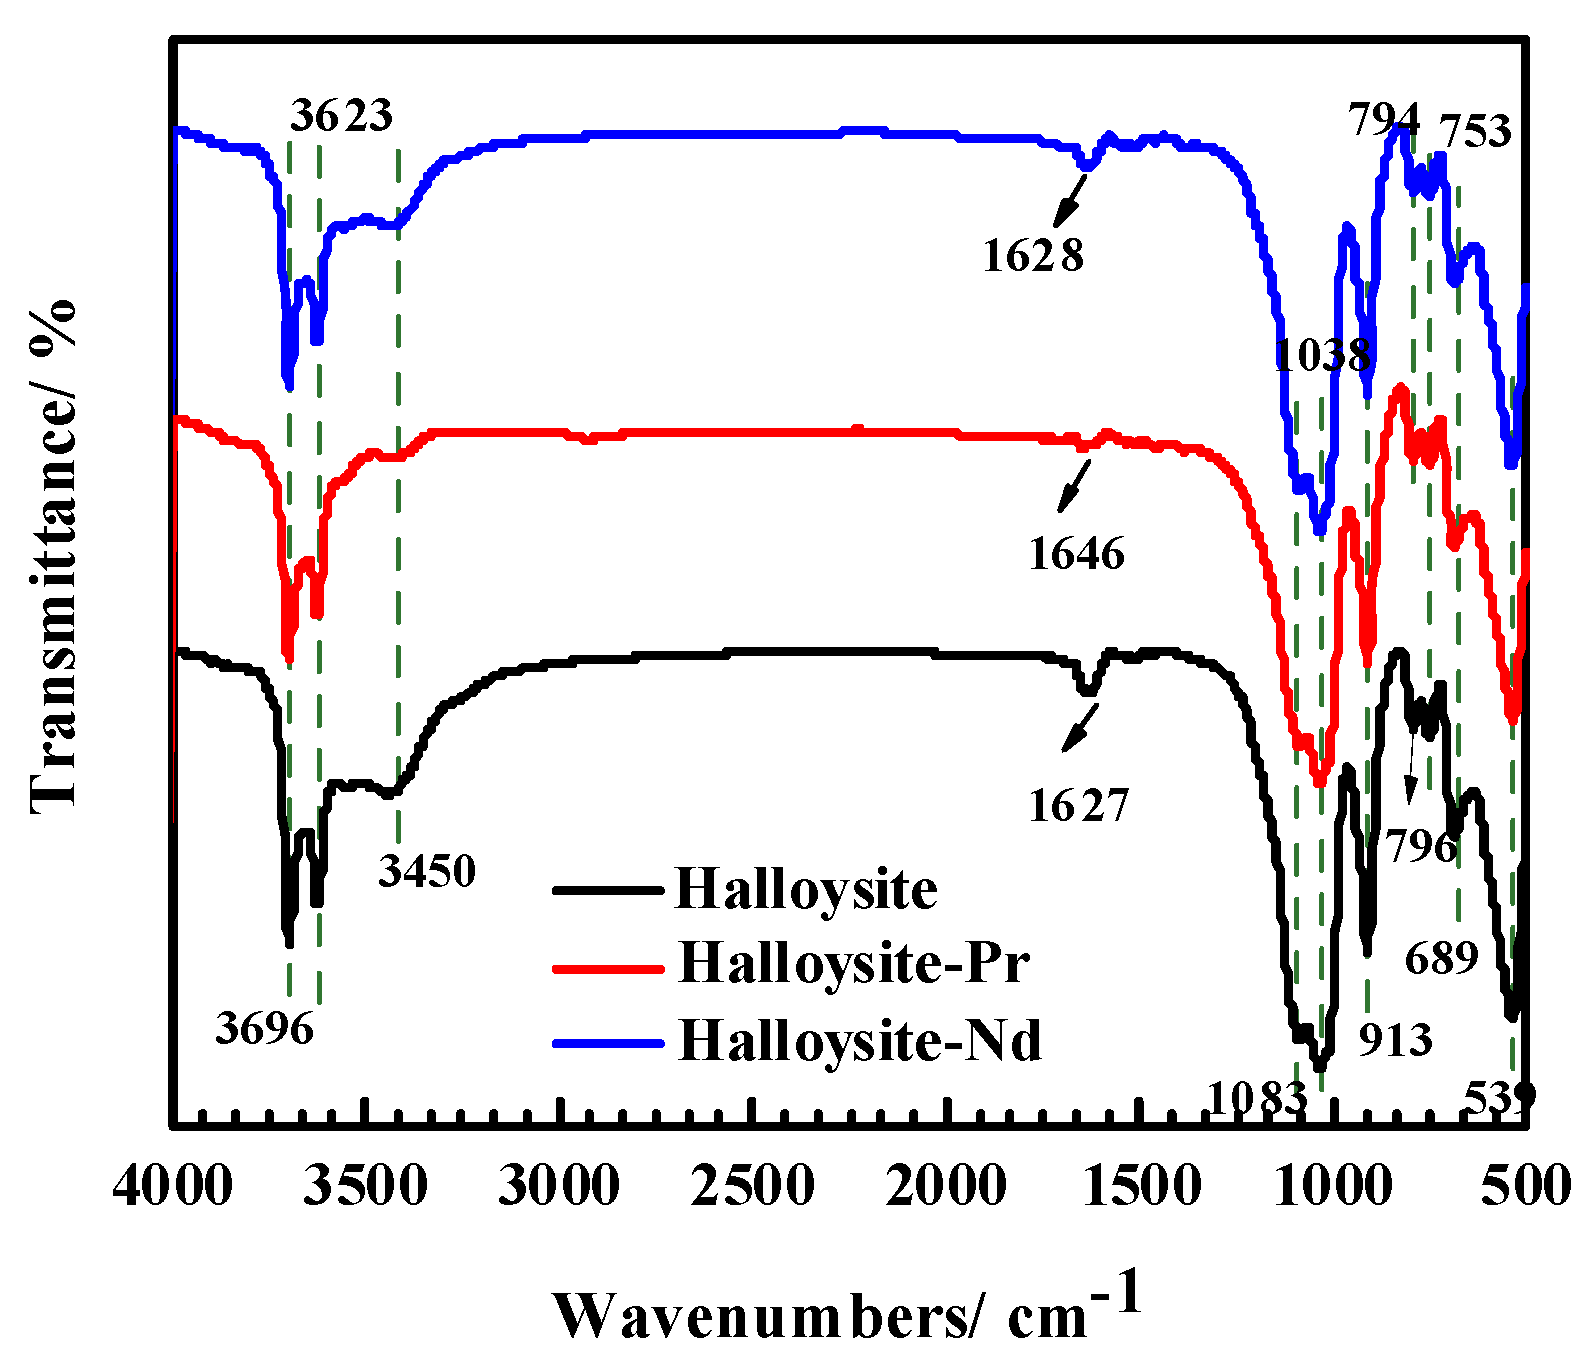
In order to explore the adsorption mechanism of the rare earth elements Pr and Nd adsorbed by halloysite, the infrared spectra of adsorption samples of the rare earth elements Pr and Nd were analyzed, and the results are shown in Figure 11.
According to Figure 11, the infrared absorption peaks with wave numbers of 3696 cm−1 and 3623 cm−1 correspond to the inner -OH and outer -OH stretching vibration peaks in the lamellar tube wall, respectively [22]. In addition, the absorption peak at 3450 cm−1 belonged to the stretching vibration of -OH, which is formed by the -OH on the surface of the halloysite nanotube through intramolecular hydrogen bonding. The absorption peak at the wavenumber 1628 cm−1 was strengthened by the free water molecules contained in the halloysite nanotube [23]. After the adsorption of rare earth element Pr, the absorption peak at 1628 cm−1 was blue-shifted to obtain the absorption peak at 1646 cm−1 [24], which indicated that there may be hydrogen bonding or surface complexation between Pr and halloysite. While Nd was red-shifted from 1628 cm−1 to 1627 cm−1, this may be caused by hydrogen bonding between halloysite and Nd. The infrared absorption peaks located at 1083 cm−1 and 1038 cm−1 belonged to the stretching vibration of Si-O, the absorption peak at 913 cm−1 was attributed to the bending vibration of Al-OH, and the peaks at 753 cm−1 and 539 cm−1 were attributed to the vertical stretching peak of Si-O-Al and the bending vibration peak of Si-O, respectively. Both are characteristic absorption peaks of halloysite nanotubes [25].
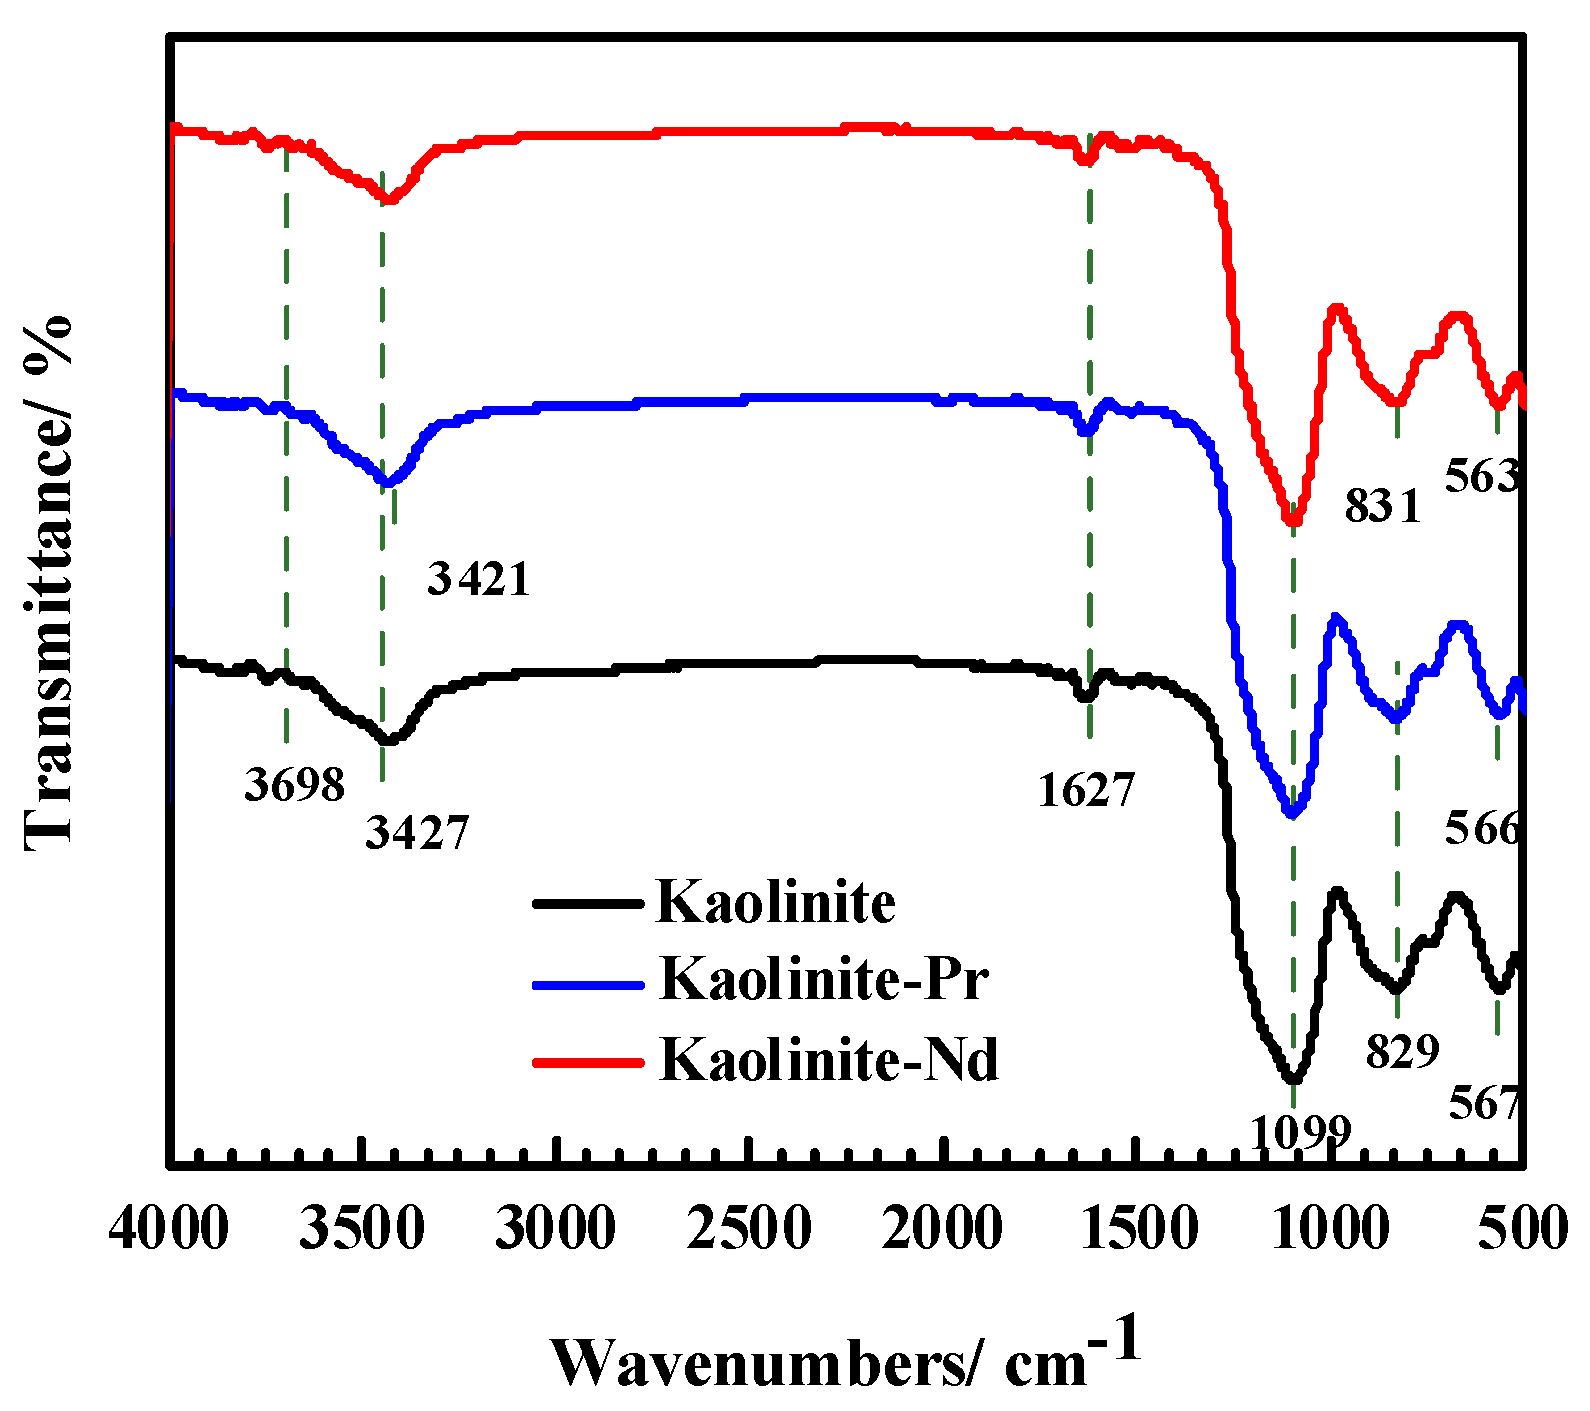
In order to explore the adsorption mechanism of the rare earth elements Pr and Nd adsorbed by kaolinite, the adsorbents during the adsorption of rare earth elements Pr and Nd were analyzed by scanning electron microscopy, and the results are shown in Figure 12.
It can be observed from Figure 12 that both 3698 cm−1 and 3427 cm−1 belonged to the hydroxyl group vibration on the inner surface of kaolinite [26], while the stretching vibration peak at 3427 cm−1 is red-shifted to 3421 cm−1 in the spectrum after the adsorption process, indicating that hydrogen bonding may occur between Pr and kaolinite. The stretching and bending vibration peaks at 1627 cm−1 and 1099 cm−1 did not change in the spectra, indicating that neither Pr nor Nd bonded with kaolinite. In the low frequency region, 831 cm−1 and 563 cm−1 were attributed to O-Al-OH vibration absorption. After the adsorption of Pr and Nd, the characteristic absorption peak at 831 cm−1 was red-shifted to 829 cm−1, indicating that there may be hydrogen bonding between Pr and Nd with kaolinite. The characteristic absorption peak at 563 cm−1 was blue-shifted to 566 cm−1 and 567 cm−1, respectively, which further demonstrated that Pr and Nd were adsorbed between kaolinite layers and formed new hydrogen bonds.

3.5.3. Quantum Chemical Analysis Results of Adsorption Process

The adsorption process of the rare earth elements Pr and Nd on clay minerals is affected by many factors, and the adsorption energy of different rare earth elements on the surface of the same clay minerals is different. In order to better explain the adsorption mechanism of kaolinite and halloysite on Pr and Nd, the strength of the binding effect of rare earth elements on the surface of clay minerals can be judged by adsorption energy. The adsorption energy of rare earth elements on the surface of clay minerals is calculated as shown in Equation (8):
E ads   =   E A / surf     surf     E A ( g )
where EA/surf, Esurf, and EA(g) are the energy of atom A adsorbed on the surface, the energy of cleaning the surface, and the energy of an isolated A atom in an A cubic periodic box of side length 20 A, and the 1 × 1 × 1 Monkhorst–Pack k point grid used for sampling the Briouin region, respectively. The negative value of adsorption energy indicates that adsorption can proceed spontaneously [27].
According to Table 5, the order of the adsorption energy of rare earth elements Pr and Nd on kaolinite followed Eads(Pr) > Eads(Nd), and both of them were negative values, −13.28eV and −13.39eV, respectively. Therefore, the adsorption reaction of elements Pr and Nd on kaolinite can be carried out spontaneously. The process of rare earth adsorption on the surface of kaolinite was actually the result of the competition between the trapping and retention of rare earth ions on the surface of kaolinite. The collecting process corresponds to the physical adsorption process of Pr and Nd ions on the kaolinite surface, which mainly depends on the electrostatic interaction between molecules. The retention process mainly corresponds to the chemisorption process of Pr and Nd ions on the kaolinite surface, mainly by covalent interaction. The adsorption energy reflects the difficulty of the retention [28,29].

3.5.4. Model of the Microscopic Adsorption Structure of Pr and Nd by Kaolinite and Halloysite

The clay minerals are the main carriers of rare earth elements in the weathered crust elution-deposited rare earth ore in southern Yunnan. Kaolinite and halloysite are the main clay minerals in the weathered crust elution-deposited rare earth ore in southern Yunnan, and the microscopic adsorption structure model of rare earth elements Pr and Nd is shown in Figure 13.
Due to different adsorption energies, rare earth elements adsorbed on clay minerals showed different stability in the adsorption process, and the rare earth elements Pr and Nd continue to migrate to the upper part of the rare earth ore body. This continuous adsorption–desorption makes the Pr and Nd gradually enriched in rare earth ore bodies. This can provide the theoretic guidance to achieve resource recycling.

3.6. The Relation Between the Adsorption Recovery and Rare Earth Resource Perspective

In recent years, praseodymium–neodymium metal become a key material for manufacturing the core component of new energy vehicles. With the deepening contradiction between the supply and demand of Pr and Nd, more stringent requirements have been put in place for the efficient and green extraction and separation of rare earth resources. In particular, the recovery of Pr and Nd resources from low-concentration rare earth solutions such as rare earth ore beneficiation wastewater, refining wastewater, seawater, and hot springs has become a research hotspot. Compared with traditional extraction technologies, this adsorption method captures rare earth ions on the surface of adsorbents through physical or chemical adsorption. Due to its characteristics of a large processing capacity, wide processing concentration range, and short processing flow, the adsorption recovery of Pr and Nd resources from low-concentration rare earth leaching solutions can meet the urgent needs of industrial application. It is necessary to optimize the single-factor adsorption conditions of the adsorption process to enhance the adsorption process and increase the recovery rate of praseodymium–neodymium. Therefore, the research results are expected to provide a reference for the efficient utilization of rare earth resources.

4. Conclusions

Based on the adsorption experiments of Pr and Nd ions with kaolinite and halloysite, the adsorption characteristics of different clay minerals with Pr and Nd were studied, and the effects of initial rare earth element concentration, pH, and experimental temperature on the adsorption of Pr and Nd ions in clay minerals were discussed. The results showed that the adsorption behaviors of clay minerals on Pr and Nd became worse with the rise of clay mineral concentration. The adsorption efficiency of kaolinite for Pr first increased and then decreased with the increase in pH, and the adsorption efficiency was the best, at 13.333% and 24.778%, respectively, with kaolinite and halloysite when the adsorption pH was 6. The adsorption efficiency of kaolinite for Nd and that of halloysite for Pr and Nd increased with the increase in pH. When the temperature increased, the adsorption efficiency of clay minerals for Pr and Nd increased, and reached 36.440% and 20.213% at 323K with kaolinite; thus, the overall rising trend was not significant. The isothermal adsorption model was used to fit the experimental data, and the adsorption of kaolinite and halloysite for Pr and Nd was consistent with the Langmuir model, which presented as a single molecular layer adsorption, indicating that Pr and Nd are adsorbed between kaolinite and halloysite layers by forming new hydrogen bonds. The research results can provide beneficial theoretical guidance and technical support for the recovery of Pr and Nd from rare earth leaching solutions to achieve resource recycling. It is of significance to strengthen the comprehensive utilization of rare earth resources and to enhance the research and development of technologies for adsorption; this can effectively alleviate the shortage of praseodymium and neodymium resources, and promote the efficient recycling and utilization of secondary rare earth resources.

Author Contributions

Conceptualization, Z.C. and Z.Z.; methodology, H.W.; software, Z.C.; validation, Z.C., H.W. and R.C.; formal analysis, Z.C.; investigation, H.W.; resources, Z.C.; data curation, Z.C.; writing—original draft preparation, Z.C.; writing—review and editing, Z.Z.; visualization, H.W.; supervision, R.C.; project administration, Z.Z.; funding acquisition, Z.C. All authors have read and agreed to the published version of the manuscript.

Funding

This research was funded by the National Nature Science Foundation of China (52222405, 92475206, U24A2096, 52304293 and 52574321) and Key Laboratory of Ionic Rare Earth Resources and Environment, Ministry of Natural Resources of the People’s Republic of China (No. 2024IRERE203).

Data Availability Statement

Data are available on request from the authors.

Conflicts of Interest

The authors declare that they have no known competing financial interests or personal relationships that could have appeared to influence the work reported in this paper.

References

  1. Yang, X.J.; Lin, A.; Li, X.L.; Wu, Y.D.; Zhou, W.B.; Chen, Z.H. China’s ion-adsorption rare earth resources, mining consequences and preservation. Environ. Dev. 2013, 8, 131–136. [Google Scholar] [CrossRef]
  2. Sun, Z.S.; Zhao, Y.M.; Yan, G.H.; Yuan, H.T.; Zhang, M.R.; Zhang, B. A novel method for low-rank coal drying using steam transient flash evaporation. Fuel 2023, 354, 129238. [Google Scholar] [CrossRef]
  3. Balaram, V. Rare earth elements: A review of applications, occurrence, exploration, analysis, recycling, and environmental impact. Geosci. Front. 2019, 10, 1285–1303. [Google Scholar] [CrossRef]
  4. Gao, Y.Q.; Zhang, S.M.; Zhao, K.Y.; Wang, Z.W.; Xu, S.X.; Liang, Z.P.; Wu, K. Adsorption of La3+ and Ce3+ by poly-γ-glutamic acid crosslinked with polyvinyl alcohol. J. Rare Earths 2015, 33, 884–891. [Google Scholar] [CrossRef]
  5. Goodenough, K.M.; Wall, F.; Merriman, D. The rare earth elements: Demand, global resources, and challenges for resourcing future generations. Nat. Resour. Res. 2018, 27, 201–216. [Google Scholar] [CrossRef]
  6. Izatt, R.M.; Izatt, S.R.; Bruening, R.L.; Izatt, N.E.; Moyer, B.A. Challenges to achievement of metal sustainability in our high-tech society. Chem. Soc. Rev. 2014, 43, 2451–2475. [Google Scholar] [CrossRef]
  7. Lewis, L.H.; Jiménez-Villacorta, F. Perspectives on permanent magnetic materials for energy conversion and power generation. Metall. Mater. Trans. A 2013, 44, 2–20. [Google Scholar] [CrossRef]
  8. Wilburn, D.R. Wind Energy in the United States and Materials Required for the Land-Based Wind Turbine Industry from 2010 Through 2030; US Department of the Interior: Washington, DC, USA; US Geological Survey: Reston, VA, USA, 2011.
  9. Xiao, Y.F.; Feng, Z.Y.; Hu, G.H.; Huang, L.; Huang, X.W.; Chen, Y.Y.; Li, M.L. Leaching and mass transfer characteristics of elements from ion-adsorption type rare earth ore. Rare Met. 2015, 34, 357–365. [Google Scholar] [CrossRef]
  10. Huang, S.X.; Feng, J.; Liu, J.Q.; Yu, J.X.; Chi, R.A. Adsorption and desorption characteristics of clay minerals on NH4+ in the leaching agent of weathered crust elution-deposited rare earth ore. China Min. Mag. 2021, 30, 152–158. [Google Scholar]
  11. Deng, Z.X.; Qin, L.; Wang, G.S.; Luo, S.H.; Peng, C.L.; Li, Q. Metallogenic process of ion adsorption REE ore based on the occurrence regularity of La in kaolin. Ore Geol. Rev. 2019, 112, 103022. [Google Scholar] [CrossRef]
  12. Jia, L.; Zhang, Z.L. Adsorption of La3+, Nd3+ and some heavy metal ions by humic acid in amulti-metal-ion system. J. Chin. Soc. Rare Earths 2009, 27, 816–821. [Google Scholar]
  13. Xiao, Y.F. Study on the Green and Efficient Leaching Technology for Ion-Adsorption Type Rare Earths Ore with Magnesium Salt System; Northeastern University: Boston, MA, USA, 2015. [Google Scholar]
  14. Jiao, Y.F.; He, X.L.; Liao, C.F.; Jiang, P.G. Studies on the sorption of amino methylene phosphonic acid resin for heavy rare earth metals. Ion Exch. Adsorpt. 2009, 25, 306–312. [Google Scholar]
  15. Yang, M.J.; Liang, X.L.; Ma, L.Y.; Huang, J.; He, H.P.; Zhu, J.X. Adsorption of REEs on kaolinite and halloysite: A link to the REE distribution on clays in the weathering crust of granite. Chem. Geol. 2019, 525, 210–217. [Google Scholar] [CrossRef]
  16. SY/T 5163-2010[S]; X-Ray Diffraction Analysis Methods for Clay Minerals and Common Non-Clay Mineral in Sedimentary Rocks. Oil and Gas Industry Standards of the People’s Republic of China: Beijing, China, 2010.
  17. Xue, W.L.; Li, F.H.; Liu, Y.; Li, B.Y.; Huang, B.B. Mixing soil with bentonite to amend its microstructure and permeability. J. Irrig. Drain. 2022, 41, 85–92. [Google Scholar]
  18. Shen, W.; Wang, Z. Research evolvement of treatment technology of Pb2+ in water with clay mineral. Guangzhou Chem. Ind. 2009, 37, 60–62. [Google Scholar]
  19. Xie, J.J. Structure and Physical-Chemistry Property Evolution of Heat-Treatment Palygorskite as Well as Adsorption for Phosphorus; Hefei University of Technology: Hefei, China, 2014. [Google Scholar]
  20. Tang, Y.N.; Cai, Y.T.; Yang, P.J.; Chang, K.K. Ferric oxide on U(VI) adsorption. Biol. Chem. Eng. 2016, 2, 23–24. [Google Scholar]
  21. Coppin, F.; Berger, G.; Bauer, A.; Castet, S.; Loubet, M. Sorption of lanthanides on smectite and kaolinite. Chem. Geol. 2002, 182, 57–68. [Google Scholar] [CrossRef]
  22. Peixoto, A.F.; Fernandes, A.C.; Pereira, C.; Pires, J.; Freire, C. Physicochemical characterization of organosilylated halloysite clay nanotubes. Microporous Mesoporous Mater. 2016, 219, 145–154. [Google Scholar] [CrossRef]
  23. Li, W.Y.; Liu, J.; Chen, H.; Deng, Y.; Zhang, B.; Wang, Z.; Zhang, X.; Hong, S. Application of oxalic acid cross-linking activated alumina/chitosan bio composites in defluorination from aqueous solution. Investigation of adsorption mechanism. Chem. Eng. J. 2013, 225, 865–872. [Google Scholar] [CrossRef]
  24. Xu, J.C.; Wu, H.D.; Zhou, Z.H.; Yao, P.K.; Zhang, Q.P. Intercalation-hydrothermal preparation of submicron 13X zeolite with coal-measure kaolin. Bull. Chin. Ceram. Soc. 2018, 37, 1188–1194. [Google Scholar]
  25. Ma, W.S.; Shi, J.J.; Wang, W.; Ning, P. Surface modification of long-chain alkyl silane on hnts. Silicone Mater. 2011, 25, 248–252. [Google Scholar]
  26. Zhang, A.; Kang, L.L.; Zhang, Y.M.; Ding, D.Q.; Zhang, Y.F. Effect of Kaolinite Particle Size on lts Crystal Structure and Thermal Evolution Behaviors. Bull. Chin. Ceram. Soc. 2019, 38, 3964–3971. [Google Scholar]
  27. Clark, S.J.; Segall, M.D.; Pickard, C.J.; Hasnip, P.J.; Probert, M.I.J.; Refson, K.; Payne, M.C. First principles methods using CASTEP. Z. Krist.-Cryst. Mater. 2005, 220, 567–570. [Google Scholar] [CrossRef]
  28. Li, H.T. First-Principles Study on Microstructures and Elastic Properties of Clay Mineral; Taiyuan University of Technology: Taiyuan, China, 2016. [Google Scholar]
  29. Wang, G.S.; Lai, Y.M.; Peng, C.L. Adsorption of rare earth yttrium and ammonium ions on kaolinite surfaces: A DFT study. Theor. Chem. Acc. 2018, 137, 53. [Google Scholar] [CrossRef]
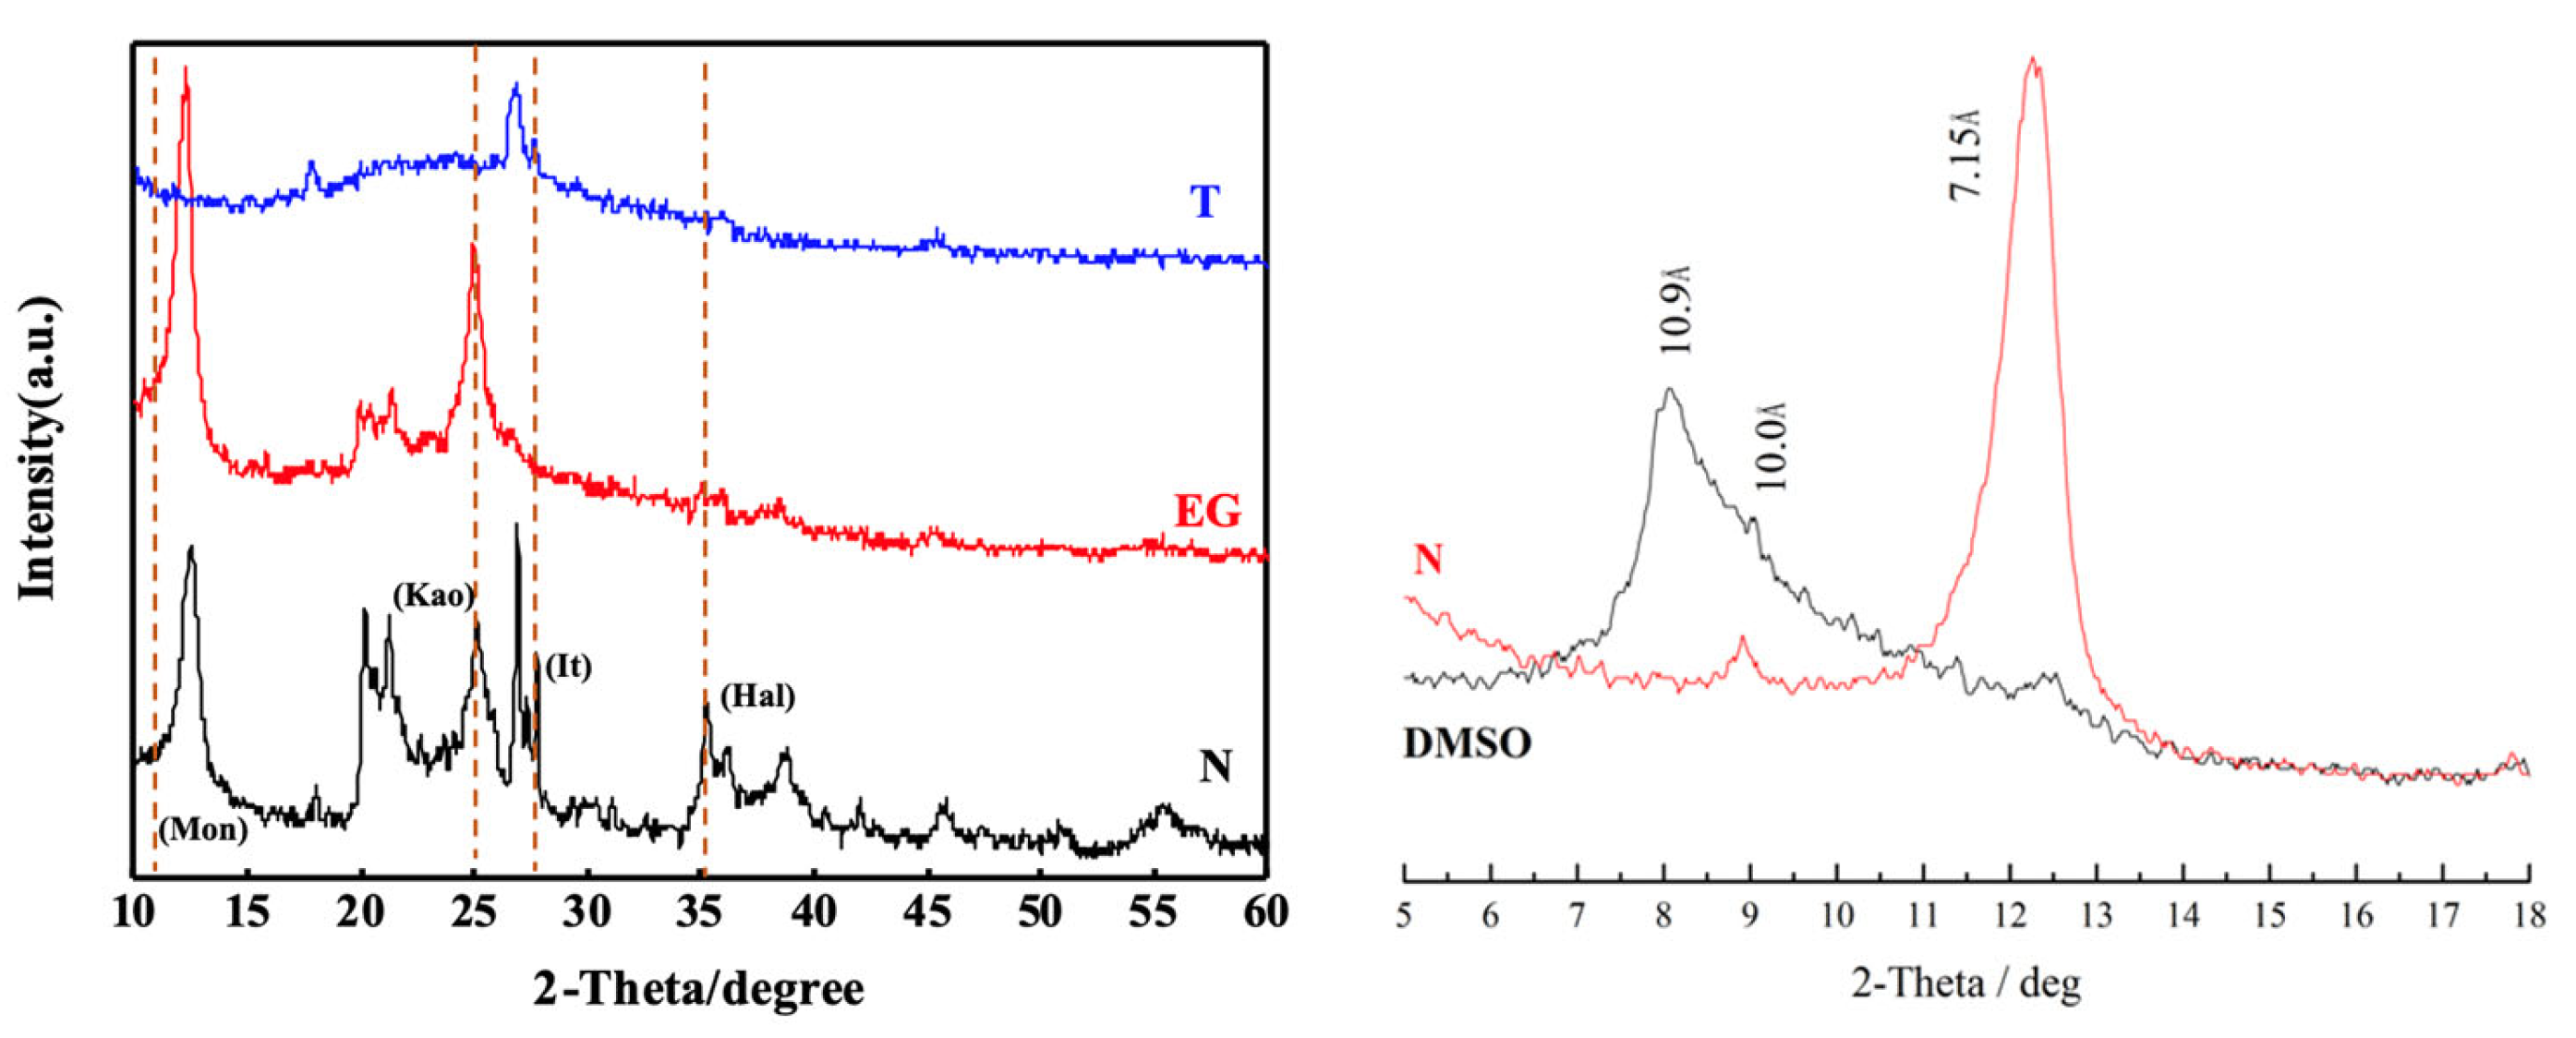
Figure 1. XRD pattern of clay minerals (N: original sample, EG: saturated sample with ethylene glycol, and T: sample heated to 550 °C for 2 h).
Minerals 15 01051 g001
Figure 2. Isothermal adsorption curve of Pr3+ adsorption by clay minerals (a) and adsorption efficiency diagram of Pr3+ adsorption by clay minerals (b).
Minerals 15 01051 g002
Figure 3. Kaolinite fitting of Langmuir thermodynamic model (a) and halloysite fitting of Langmuir thermodynamic mode (b) for the adsorption of Pr3+.
Minerals 15 01051 g003
Figure 4. Isothermal adsorption curve of Nd3+ adsorption by clay minerals (a) and adsorption efficiency diagram of Nd3+ adsorption by clay minerals (b).
Minerals 15 01051 g004
Figure 5. Kaolinite fitting of the Langmuir thermodynamic model (a) and halloysite fitting of the Langmuir thermodynamic model (b) for the adsorption of Nd3+.
Minerals 15 01051 g005
Figure 6. Adsorption efficiency of Pr3+ by kaolinite (a) and Pr3+ by halloysite (b) with various pH.
Minerals 15 01051 g006
Figure 7. Adsorption efficiency of Nd3+ by kaolinite (a) and Nd3+ by halloysite (b) with various pH.
Minerals 15 01051 g007
Figure 8. Adsorption efficiency diagram of Pr3+ adsorbed by clay minerals at various temperatures (a) and Nd3+ adsorbed by clay minerals at various temperatures (b).
Minerals 15 01051 g008
Figure 9. SEM images of halloysite, (a,b); halloysite-adsorbed Pr (c,d); and halloysite-adsorbed Nd, (e,f).
Minerals 15 01051 g009
Figure 10. SEM images of kaolinite, (a,b); kaolinite-adsorbed Pr, (c,d); and kaolinite-adsorbed Nd, (e,f).
Minerals 15 01051 g010
Figure 11. FT-IR plots of halloysite, halloysite-adsorbed Pr, and halloysite-adsorbed Nd.
Minerals 15 01051 g011
Figure 12. FT-IR plots of kaolinite, kaolinite-adsorbed Pr, and kaolinite-adsorbed Nd.
Minerals 15 01051 g012
Figure 13. The micro adsorption model between clay minerals and rare earth elements.
Minerals 15 01051 g013
Table 1. Chemical Composition of Rare Earth Ores (wt %).
IngredientREOSiO2Al2O3MnOK2ONa2O
Content0.1266.2318.140.134.210.57
IngredientCaOTiO2P2O5Fe2O3FeOLoss
Content0.040.050.091.600.67.1
Table 2. Relative content of clay minerals (wt %).
SpecimenKaoliniteHalloysiteIlliteMontmorillonite
Ledge25.0665.788.131.03
Table 3. Thermodynamic model fitting parameters of Pr adsorption by clay minerals.
EquationsFreundlich EquationLangmuir Equation
In KF1/nR21/(QmaxKL)Qm(µmol/g)R2
Clay mineralsKaolinite0.0830.2690.60757.75116.4880.965
Halloysite0.5900.3110.93726.73235.7020.970
Y: adsorption by Clay Mineral, Ce: equilibrium of Pr, a, k1, k2, k3: constant, Qm: utmost adsorption.
Table 4. Thermodynamic model fitting parameters for Nd adsorption by clay minerals.
EquationsFreundlich EquationLangmuir Equation
In KF1/nR21/(QmaxKL)Qm(µmol/g)R2
Clay mineralsKaolinite−0.0910.2920.55864.47123.6130.978
Halloysite0.1770.3580.95125.72328.5710.997
Table 5. The adsorption energy of rare earth on the kaolinite.
Single AtomsModel 1: Kaolinite (001)
AtomEtot (eV)AdsorbateEtot (eV)Eads (eV)
Pr−0.157Pr−737.186−13.28
Nd−0.156Nd−737.295−13.39
Disclaimer/Publisher’s Note: The statements, opinions and data contained in all publications are solely those of the individual author(s) and contributor(s) and not of MDPI and/or the editor(s). MDPI and/or the editor(s) disclaim responsibility for any injury to people or property resulting from any ideas, methods, instructions or products referred to in the content.