Article

Mining Prediction Based on the Coupling of Structural-Alteration Anomalies in the Tsagaankhairkhan Copper–Gold Mine in Mongolia Through the Collaboration of Multi-Source Remote Sensing Data

1
Department of Earth Science and Technology, City College, Kunming University of Science and Technology, Kunming 650093, China
2
School of Land and Resources Engineering, Kunming University of Science and Technology, Kunming 650093, China
3
Yunnan Copper Industry Mineral Resources Exploration and Development Co., Ltd., Kunming 650051, China
*
Author to whom correspondence should be addressed.
Minerals 2025, 15(10), 1005; https://doi.org/10.3390/min15101005
Submission received: 24 August 2025 / Revised: 12 September 2025 / Accepted: 17 September 2025 / Published: 23 September 2025

Abstract

Against the backdrop of the continuous growth in global demand for mineral resources, efficient and accurate mineral exploration technologies are of paramount importance. Therefore, utilizing remote sensing technology, which features wide coverage, a non-contact nature, and multi-source data acquisition, is of great significance for conducting mineral resource exploration and prospecting research. This study focuses on the Tsagaankhairkhan copper–gold mining area in Mongolia and proposes a structural-alteration anomalies coupling mining prediction method based on the collaboration of multi-source remote sensing data. By comprehensively utilizing multi-source image data from Landsat-8, GF-2, and Sentinel-2, and employing methods such as principal component analysis (PCA), band ratio, and texture analysis, we effectively extracted structural information closely related to mineralization, as well as alteration anomaly information, including hydroxyl alteration anomalies and iron-staining alteration anomalies. Landsat-8 and Sentinel-2 data were employed to extract and mutually validate hydroxyl and iron-staining alteration anomaly information in the study area, thereby delineating alteration anomaly zones. By integrating the results of structural interpretation, the distribution of alteration anomaly information, and their spatial coupling characteristics, we explored the spatial coupling relationship between structural and alteration anomalies, analyzed their mineral control patterns, and identified 7 prospecting target areas. These target areas exhibit abundant mineral anomalies and favorable structural settings, indicating high metallogenic potential. The research findings provide crucial clues for the exploration of the Tsagaankhairkhan copper–gold mine in Mongolia and can guide future mineral exploration and development efforts.

1. Introduction

In recent years, with the continuous advancement of remote sensing technology, remarkable progress has been made in its application of remote sensing technology in copper–gold mining, demonstrating unique advantages in mineral resource surveys within complex geological settings and inaccessible areas. In particular, the widespread use of high-resolution satellite data has elevated the role of remote sensing-based geological structure interpretation to an increasingly prominent position in mineral resource exploration. The launch of China’s “GF-2” satellite signifies a technological breakthrough in the field of Earth observation, especially in terms of resolution and data quality, with its spatial resolution of less than 1 m providing high-precision support for geological surveys. Liang et al. [1] evaluated the application of the “GF-2” satellite in the Hami region of Xinjiang, demonstrating its advantages in geological unit mapping, structural zone delineation, and mineral resource surveys, especially in remote and harsh environments where satellite data offers invaluable support for large-scale geological exploration. This satellite enhances the spatial resolution of the image through pan-sharpening technology while preserving spectral characteristics and effectively identifying faults, rock types, and structural features. Pei et al. [2] first utilized the fusion of Landsat-8 and WorldView-2 data to enhance spatial and spectral information, thereby aiding in the identification of key features, including the interpretation of mineral vein-controlling structures and lithology, achieving favorable results.
The application of this technology is not confined to mineral resource surveys alone; it also provides crucial data support for the prediction and exploration of mineralized alteration zones. Remote sensing image processing techniques, such as the ratio method [3], PCA [4,5,6], and Spectral Angle Mapper (SAM) [7,8], are effective in extracting geological anomaly information associated with mineralization processes. These techniques not only enhance the precision of anomaly information but also assist researchers in establishing typical mineral prospecting models by integrating regional geological backgrounds and successfully delineating multiple prospecting target areas [9]. In particular, through the extraction of remote sensing alteration information and structural information analysis, researchers can accurately identify the distribution of mineralized belts, structural belts, and mining deposits, providing a solid scientific basis for mineral resource exploration.
By integrating high-resolution remote sensing images (such as WorldView-2, ETM+, ASTER) with hyperspectral data (like HyMap and FieldSpec Pro), and combining this with geological, geophysical, and geochemical information, it is possible to effectively identify geological anomalies associated with mineralization, including hydroxyl alteration, iron-staining anomalies, circular structures, and fault zones [10,11,12,13,14,15]. After processing this information through techniques such as image enhancement, band ratios, and PCA, alteration mineral assemblages can be extracted, which in turn can be used to delineate potential metallogenic prospects [16,17,18]. Taking examples from the Hou’erdaogou area in Inner Mongolia, the Duolong superlarge copper (gold) mining cluster area in Tibet, and Papua New Guinea [19,20,21], researchers have constructed comprehensive prospecting models that integrate remote sensing interpretation, geological modeling, and field validation. These models not only consider the geological background of mineralization (such as magmatic–hydrothermal systems and areas of intense tectonic activity) but also achieve quantitative prediction and hierarchical assessment of prospecting targets through the fusion of multi-source data. For instance, in the study of the Duolong mining cluster area, it was clearly proposed that the genesis of ore bodies is closely related to the evolution of deep rock masses and that the intersection of circular and linear structures is a key area for prospecting, while in Papua New Guinea, integrating remote sensing and geological data successfully delineated different grades of prospecting prospects. Additionally, these studies emphasize the significant indicative role of alteration zoning in porphyry copper–gold mines. For example, potassic alteration and sericite alteration zones are highly coupled with mineralization, playing a crucial role in delineating the spatial distribution of ore bodies. Notably, the reliability of remote sensing predictions has been validated through field exploration and laboratory geochemical analysis in multiple regions, demonstrating a high level of technical maturity and practicality [22,23]. The application of remote sensing technology in mineral resource exploration, particularly the use of high-resolution remote sensing data, has significantly improved the efficiency and precision of geological exploration [24]. With technological advancements, this technology will play an increasingly important role in the exploration and evaluation of mineral resources in the future [25], especially in complex and remote areas, where it provides new solutions and robust support for exploration [26]. Its advantages of speed, cost-effectiveness, and wide-area coverage make it occupy an increasingly important position in global mineral resource surveys [27,28].
Despite the progress made in existing research on remote sensing geological surveys and prospecting prediction, several shortcomings still persist: Firstly, most research areas are concentrated in typical geological units or regions with convenient data acquisition, and the regional representativeness and adaptability of research findings need further expansion; secondly, remote sensing interpretation often relies heavily on subjective experience and limited field validation, lacking systematic quantitative accuracy analysis and error evaluation, which affects the scientific validity and reproducibility of interpretation results; thirdly, the types of remote sensing data and interpretation methods employed are relatively limited, and the application of advanced algorithms such as multi-source data fusion and deep learning remains insufficient. Additionally, most metallogenic prediction models have not established standardized variable systems, with limited validation methods and a lack of multi-scale, multi-dimensional comprehensive analysis of metallogenic mechanisms supported by geophysical/drilling results. Therefore, there is an urgent need to conduct research on prospecting methods tailored for complex geological environments, integrating multi-source remote sensing and geological data, and incorporating intelligent interpretation algorithms to enhance the scientific validity and practicality of prediction models.
Taking the Tsagaankhairkhan copper–gold deposit exploration area as an example, this study addresses the existing issues in geological survey and mineral prediction, such as the singularity of data types, the subjectivity of interpretation methods, the lack of standards in the prediction variable system, and the insufficiency of mineralization mechanism research. To tackle these challenges, the study fully integrates multi-source remote sensing data and systematically carries out geological structure interpretation and extraction of hydroxyl and iron-staining alteration information. It constructs a spatial coupling relationship between structural lines and alteration anomalies and establishes a mineral prediction model driven by geological processes. Using structural and alteration information as the main control variables, the study explores their intrinsic mechanism relationship with mineralization and preliminarily builds a mineral prediction system with mechanism constraints and spatial expression capabilities. This effectively responds to the core issues in current remote sensing mineral exploration research, such as the singularity of methods, the lack of standardization in variable systems, and the insufficient validation of prediction results.

2. Overview of the Study Area

2.1. Geographic Location

The Tsagaankhairkhan copper–gold mining area (Figure 1) is situated in the main watershed region of the Mongolian Altai Mountains, which generally trends northwest-southeast, gradually decreasing in elevation from south to north. The northern part connects with the Shalging Gobi, and this mining area is located in the middle section of the Altai Mountains, characterized by a relative height difference of 2500 to 3200 m. In the southwest, there is the Buhsenhan Mountain (3393.6 m), surrounded by high mountains over 3000 m, such as the Alagkhan Mountain (3839 m) and the Khukhbulag Peak (3224 m). The central part of the area is dominated by fault-block mountains with elevations ranging from 2400 to 2800 m and steep slopes. The tops of these high mountains have mostly undergone glacial erosion and are covered with glacial debris and vegetation. The mountain slopes are steep, with numerous cliffs and deeply incised gullies. The depressions between the mountains generally trend northwest–southeast, with some structural valleys (like the Burgasni Valley, Markte Valley, and Tegleg-Yole Valley) extending radially. The Shalging Gobi Valley is a fault basin formed by neotectonic movement, with an absolute elevation of 1300 to 1600 m, where the lowest point is the Dalanthuru Valley at an elevation of 1270 m [29].

2.2. Regional Geological Background

2.2.1. Geological Background of Mongolia

Mongolia is an important part of the Central Asian metallogenic domain. Its metallogenesis is closely related to the evolution of the Paleozoic–Mesozoic arc-basin system. Particularly in the South Gobi region, porphyry copper–gold deposits are widely developed [29]. The Oyu Tolgoi mining area is situated at the southern edge of the Central Mongolian Rift Zone and to the west of the Khangbogd granite. From a broader perspective, Mongolia is mainly located in the western part of the Mongolian–Xing’an large tectonic system, including the Paleozoic Huaxia–Mongolia–Nurbaijin system and the Mesozoic–Cenozoic system’s composite area. This complex tectonic background provides a favorable structural environment for the formation of copper–gold mines.
Mongolia’s mineral deposits can be classified into six types, namely porphyry, volcanic-hosted massive sulfide (VMS), granite-related copper deposits, skarn, basalt, and sandstone, with the most important copper deposits with industrial significance considered porphyry and VMS. Copper deposits in Mongolia were mainly formed during four periods: the late Neoproterozoic (Ediacaran), the Late Devonian, the Late Carboniferous, and the Triassic–Early Jurassic. Spatially, Mongolian copper deposits can be roughly divided into two major metallogenic belts, southern and northern, which are related to the evolution of the Paleo-Asian Ocean and the Mongolian–Okhotsk Ocean, respectively. The southern Cu belt can be further subdivided into three sub-belts from north to south: the northern sub-belt of Devonian VMS-type Cu-Zn and polymetallic deposits, the middle sub-belt of Late Carboniferous porphyry-type Cu-Au deposits, and the southern sub-belt of Late Devonian porphyry-type Cu-Au-Mo deposits; the northern Cu belt can be divided into southern and northern sub-belts, characterized by “early west and late east” copper mineralization ages. Mongolian porphyry copper deposits were all formed under the background of oceanic plate subduction, classified as “subduction-type” porphyry copper deposits, where the southern Cu belt, associated with the Paleo-Asian Ocean, was mainly formed in an intra-oceanic arc and back-arc basin environment above the subduction zone, while the northern Cu belt, related to the subduction of the Mongolian–Okhotsk Ocean, was formed in a continental margin arc environment. Influenced by the Mongolian orocline structure, the northern Cu belt in Mongolia cannot extend beyond the national border to the west, while its northern and southern sub-belts extend eastward into the outer Baikal region of Russia and the northern part of the Greater Khingan Range, respectively. For the southern Cu belt, except for the definite west–northwestward extension of its northern sub-belt (the VMS-type copper belt) into the southern part of the Arshan–Tai, the extension of the other two sub-belts to both sides remains unclear.

2.2.2. Geological Background of the Tsagaankhairkhan Copper–Gold Mining Area

The Tsagaankhairkhan copper–gold mining area contains metamorphic–volcanic rocks and terrigenous sedimentary rocks ranging from the Riphean to the Permian, as well as rocks of various ages and compositions, including subvolcanic formations from the Early Cambrian, Late Devonian, and Middle Permian, granitoid rocks of the Middle–Late Cambrian Togtoh Group, Early Carboniferous diorite, and Middle Permian syenite (Figure 2). The strata distributed around the mining area include various types such as sedimentary rocks, volcanic layers, and metamorphic layers, spanning a geological time frame from the Neoproterozoic Cambrian system to the present day. The core metallogenic elements in this mining area are multi-stage magmatic–hydrothermal activities, where Late Devonian volcanic-intrusive rocks (including basalt, diorite, and granite) serve as heat sources, providing metallogenic fluids and metal substances (such as Cu and Au), forming porphyry-type copper–gold mines (within and around the rock mass) and epithermal copper–gold veins (in volcanic rock fracture zones). Structural fractures and the intersections of secondary fractures constitute fluid migration pathways, controlling the positioning of quartz–sulfide, such as gold-bearing pyrite–chalcopyrite quartz veins [30].
This mining area is located in the eastern section of the Central Asian Orogenic Belt (CAOB), featuring four types of copper–gold metallogenic systems: porphyry, skarn, epithermal, and orogenic types. The porphyry-type system is concentrated in the fine vein mineralization within the late Devonian granite diorite body, while the epithermal-type system exhibits stockwork-style gold–silver mineralization in fractures of the Late Devonian andesite. The skarn-type system involves copper–gold enrichment at the contact zone between Cambrian rock masses and Cambrian limestone, and the orogenic-type system is represented by gold veins within the Ordovician–Silurian metamorphic rock ductile–brittle shear zones. The most promising exploration targets are located at the contact zones between Devonian volcanic rocks and intrusive rocks, at fault intersections, and in areas where Cambrian carbonate strata are distributed, with a metallogenic background comparable to the large copper–gold mine cluster in the CAOB, indicating significant prospects for deep exploration.
1—Modern sediments: gravel, clay, silt; 2—Slope deposits: clay, sandy soil, silt, gravel, debris, gravelly sandy soil; 3—Upper Jurassic: unclassified sediments, yellowish-gray coarse debris, muddy conglomerate, conglomerate, sandstone, siltstone, mudstone; 4—Late Devonian: Salsiag subvolcanic rock formation, metamorphosed andesite, andesite basalt, diabase, andesite porphyry, metamorphosed basalt, andesitic tuff; 5—Late Devonian: Kobdo intrusive rocks, fine- to medium-grained granite containing biotite, light-colored fine- to medium-grained granite; 6—Late Devonian: Kobdo intrusive rocks, biotite-bearing granodiorite, gneissic granite with large, medium, and small grains; 7—Late Devonian: Kobdo intrusive rock, medium-grained gabbro, fine- to medium-grained diorite; 8—Ordovician–Silurian: metamorphic rocks, Bijir rock group, white rock layer sub-group, containing biotite–amphibolite; 9—Ordovician–Silurian: metamorphic rocks, Bijir rock group, gneiss, biotite gneiss; 10—Lower Ordovician: base consisting of pebble conglomerate, grading upwards into interbedded sandstone and siltstone; 11—Middle–Late Cambrian: Togtoxin-group intrusive strata, third stage, alkaline granite containing biotite, with large, medium, and small grains, containing a small amount of biotite granite; 12—Middle–Late Cambrian: Togtoxin-group intrusive strata, second stage, medium- to fine-grained gabbro, medium- to fine-grained diorite, and a small amount of medium-grained quartz diorite; 13—Lower Cambrian: Nalan group, grayish-green, brownish-gray gravel, sandstone, siltstone, tuffaceous rocks, tuffaceous gravel, reddish-brown siltstone, with interbedded limestone layers; 14—Lower Cambrian: Shuangjin group, base consisting of dolomitic large pebble conglomerate, containing tuffaceous cemented gravel, tuffaceous sandstone, siltstone; 15—Neoproterozoic: Tsagaankhairkhan strata: composed of dolomitic limestone, containing flint layers and interbedded dolostone, with poorly preserved micro-rock debris; 16—Neoproterozoic: Duranha strata: its layer group includes angular rock segments, showing intense shalization, brecciation, and marbleization of limestone layers and interbeds, as well as metamorphosed basalt, metamorphosed andesite, metamorphosed sandstone, and siltstone; 17—Alluvial, flood alluvial accumulation; 18—Alluvial–lacustrine; 19—Gneiss; 20—Gneiss containing garnet; 21—Gneiss containing biotite; 22—Schistose andesite; 23—Limestone; 24—Andesite and its tuff; 25—White granite; 26—Weakly alkaline white granite; 27—Diorite; 28—Conglomerate; 29—Diorite; 30—Geological boundary; 31—Confirmed structural fault; 32—Inferred structural fault.

3. Data Sources and Preprocessing

3.1. Data Sources

This study utilized remote sensing image data from Landsat-8, GF-2, and Sentinel-2, as well as Copernicus DEM data.
Landsat-8 L2SP data [31] are atmospheric-correction-processed intermediate products that provide surface reflectance and temperature information, with 9 spectral bands and a 100 m thermal infrared band, imaged on 5 July 2021, with data obtained from the Geospatial Data Cloud website (https://www.gscloud.cn (accessed on 1 March 2025)). The GF-2 dataset, offering 1 m panchromatic plus 4 m multispectral imagery with the four key bands for surface-material identification, was acquired on 26 August 2024 through the China Resources Satellite Data Center portal (https://data.cresda.cn/#/2dMap (accessed on 10 March 2025)). The Sentinel-2 data [32] consist of 13 bands with spatial resolutions ranging from 10 m to 60 m, with data obtained from the Copernicus Open Access Hub (https://dataspace.copernicus.eu (accessed on 15 March 2025)). All the remote sensing data acquired for the study area were free from cloud cover, shadows, and ice and snow coverage, making them suitable for geological structure and mineral alteration research. The Copernicus DEM [33] has a spatial resolution of 30 m and a vertical accuracy superior to that of SRTM and ASTER GDEM, with data downloaded from the ESA Copernicus panda website (https://dataspace.copernicus.eu (accessed on 25 March 2025)). Detailed parameters for each dataset are presented in Table 1, Table 2 and Table 3.

3.2. Data Preprocessing

3.2.1. Multi-Source Remote Sensing Data Preprocessing

The preprocessing of GF-2 data includes radiometric calibration, atmospheric correction, and clipping. Radiometric calibration and atmospheric correction are employed to eliminate sensor and atmospheric interferences, thereby enhancing the accuracy of reflectance measurements, and finally, the data are clipped according to the study area to ensure that the spatial and geometric accuracy meet the requirements for analysis.
Landsat-8 L2SP data have already undergone atmospheric and radiometric corrections, so the data preprocessing part was clipped according to the study area.
Sentinel-2 data S2B level data have already undergone necessary preprocessing, such as atmospheric correction, but since a single scene of the image cannot cover the entire mining area, a total of four scenes were used. First, the remote sensing data were uniformly resampled to 10 m resolution, and then the four scenes of the image were fused [34]. The information for each band of the fused image is presented in Table 4.
For the Copernicus DEM data, taking the raster DEM as input, bilinear interpolation first located the exact positions of the specified elevation between cells; all such iso-points were then sequentially linked into polylines. With a base contour of 1545 m and an interval of 100 m, the lines were thinned, smoothed, and unit-converted to yield vector contours that each represent a constant value and visualize the continuous surface. A hillshade was subsequently created, and color bands were finally assigned to give a 3D impression while revealing elevation-change trends.

3.2.2. Enhancement of Geological Structure Interpretation Features

The spatial resolutions of the visible, near-infrared, and shortwave infrared bands of Landsat-8 data are all 30 m. This enables relatively strong capabilities for identifying exposed mineral bodies on the surface, but its structural recognition capability is weak at large scales, leading to uncertainties in spectral studies [35,36]. In contrast, GF-2 data boast a high spatial resolution of up to 4 m; however, it lacks shortwave infrared bands that are beneficial for identifying mineral information. Therefore, theoretically, by synergizing the spatial detection capabilities of GF-2 data with the shortwave infrared spectral detection capabilities of Landsat-8 data, the interpretation ability of remote sensing for geological structural features can be improved.
To ensure that the synergized data can better preserve the multispectral information of bands 1–7 from Landsat-8 data, the structural synergistic information was optimized using a high-fidelity Gram-Schmidt transformation fusion method. The fused image thus obtained possessed a 4 m spatial resolution and retained all the band information from Landsat-8 data, followed by geometric accuracy correction based on the original Landsat-8 data.
The correlation coefficient matrix (Table 5) illustrates the inter-band correlations, with values closer to 1 indicating stronger correlations. The analysis of correlation coefficients aids in understanding the information associations among different bands. Following the principle that poorer correlation and lower redundancy imply richer image information, an analysis of image band correlations was conducted, determining that bands 6, 7, and 1 (R, G, B) with poorer correlation were selected for image false-color synthesis to enhance geological body information for visual interpretation purposes.

3.2.3. Mineral Alteration Information Extraction and Interference Information Removal

Information such as water bodies and vegetation appears as strong signals in remote sensing images, while mineralized alteration information manifests as weak signals and is susceptible to interference from these strong signals. Therefore, the removal of water bodies and vegetation from images is an important prerequisite for ensuring the accuracy of mineralized alteration information [37]. In this study, vegetation and water body masks were created based on the concept of band ratios.
For vegetation information extraction, the Normalized Difference Vegetation Index (NDVI) was employed. The NDVI, as a mathematical transformation, based on the concept of band ratio, can effectively describe vegetation conditions. Its calculation formula is as follows:
N D V I = [ ( N I R R / ( N I R + R ) ]
where NIR represents the near-infrared band, R denotes the red-light band, and the values of the NDVI range from −1 to 1. Negative values indicate ground cover such as clouds, water, and snow; values around 0 indicate the presence of rocks or bare soil; near-infrared radiation and red light are approximately equal; positive values indicate vegetation cover, with the magnitude increasing as the degree of cover increases. Based on the principle of the NDVI, Landsat-8 data and Sentinel-2 data were processed separately, and threshold segmentation was applied, considering values greater than 0 as vegetation, thus extracting results as a vegetation mask to remove vegetation information from the images.
For water body information extraction, the Modified Normalized Difference Water Index (MNDWI) was employed, which modifies the wavelength combination based on NDWI by replacing the near-infrared band with the mid-infrared band. This method is not only applicable to vegetated areas but also is capable of accurately extracting water bodies in urban settings, thereby enhancing the accuracy of water body extraction. Its calculation formula is as follows:
M N D W I = ( G r e e n M I R ) / ( G r e e n + M I R )
where MIR denotes the mid-infrared band, Green represents the green light band, and the values of the MNDWI range from −1 to 1. The closer the value is to 1, the higher the likelihood of it representing a water body, while negative values indicate arid areas or non-water surfaces. Based on the principle of the MNDWI, Landsat-8 data and Sentinel-2 data were processed separately, and threshold segmentation was applied, considering values greater than 0 as water bodies, thus extracting results as a water body mask to remove water body information from the images.

4. Remote Sensing Geological Structure Interpretation

4.1. Linear Structure Interpretation

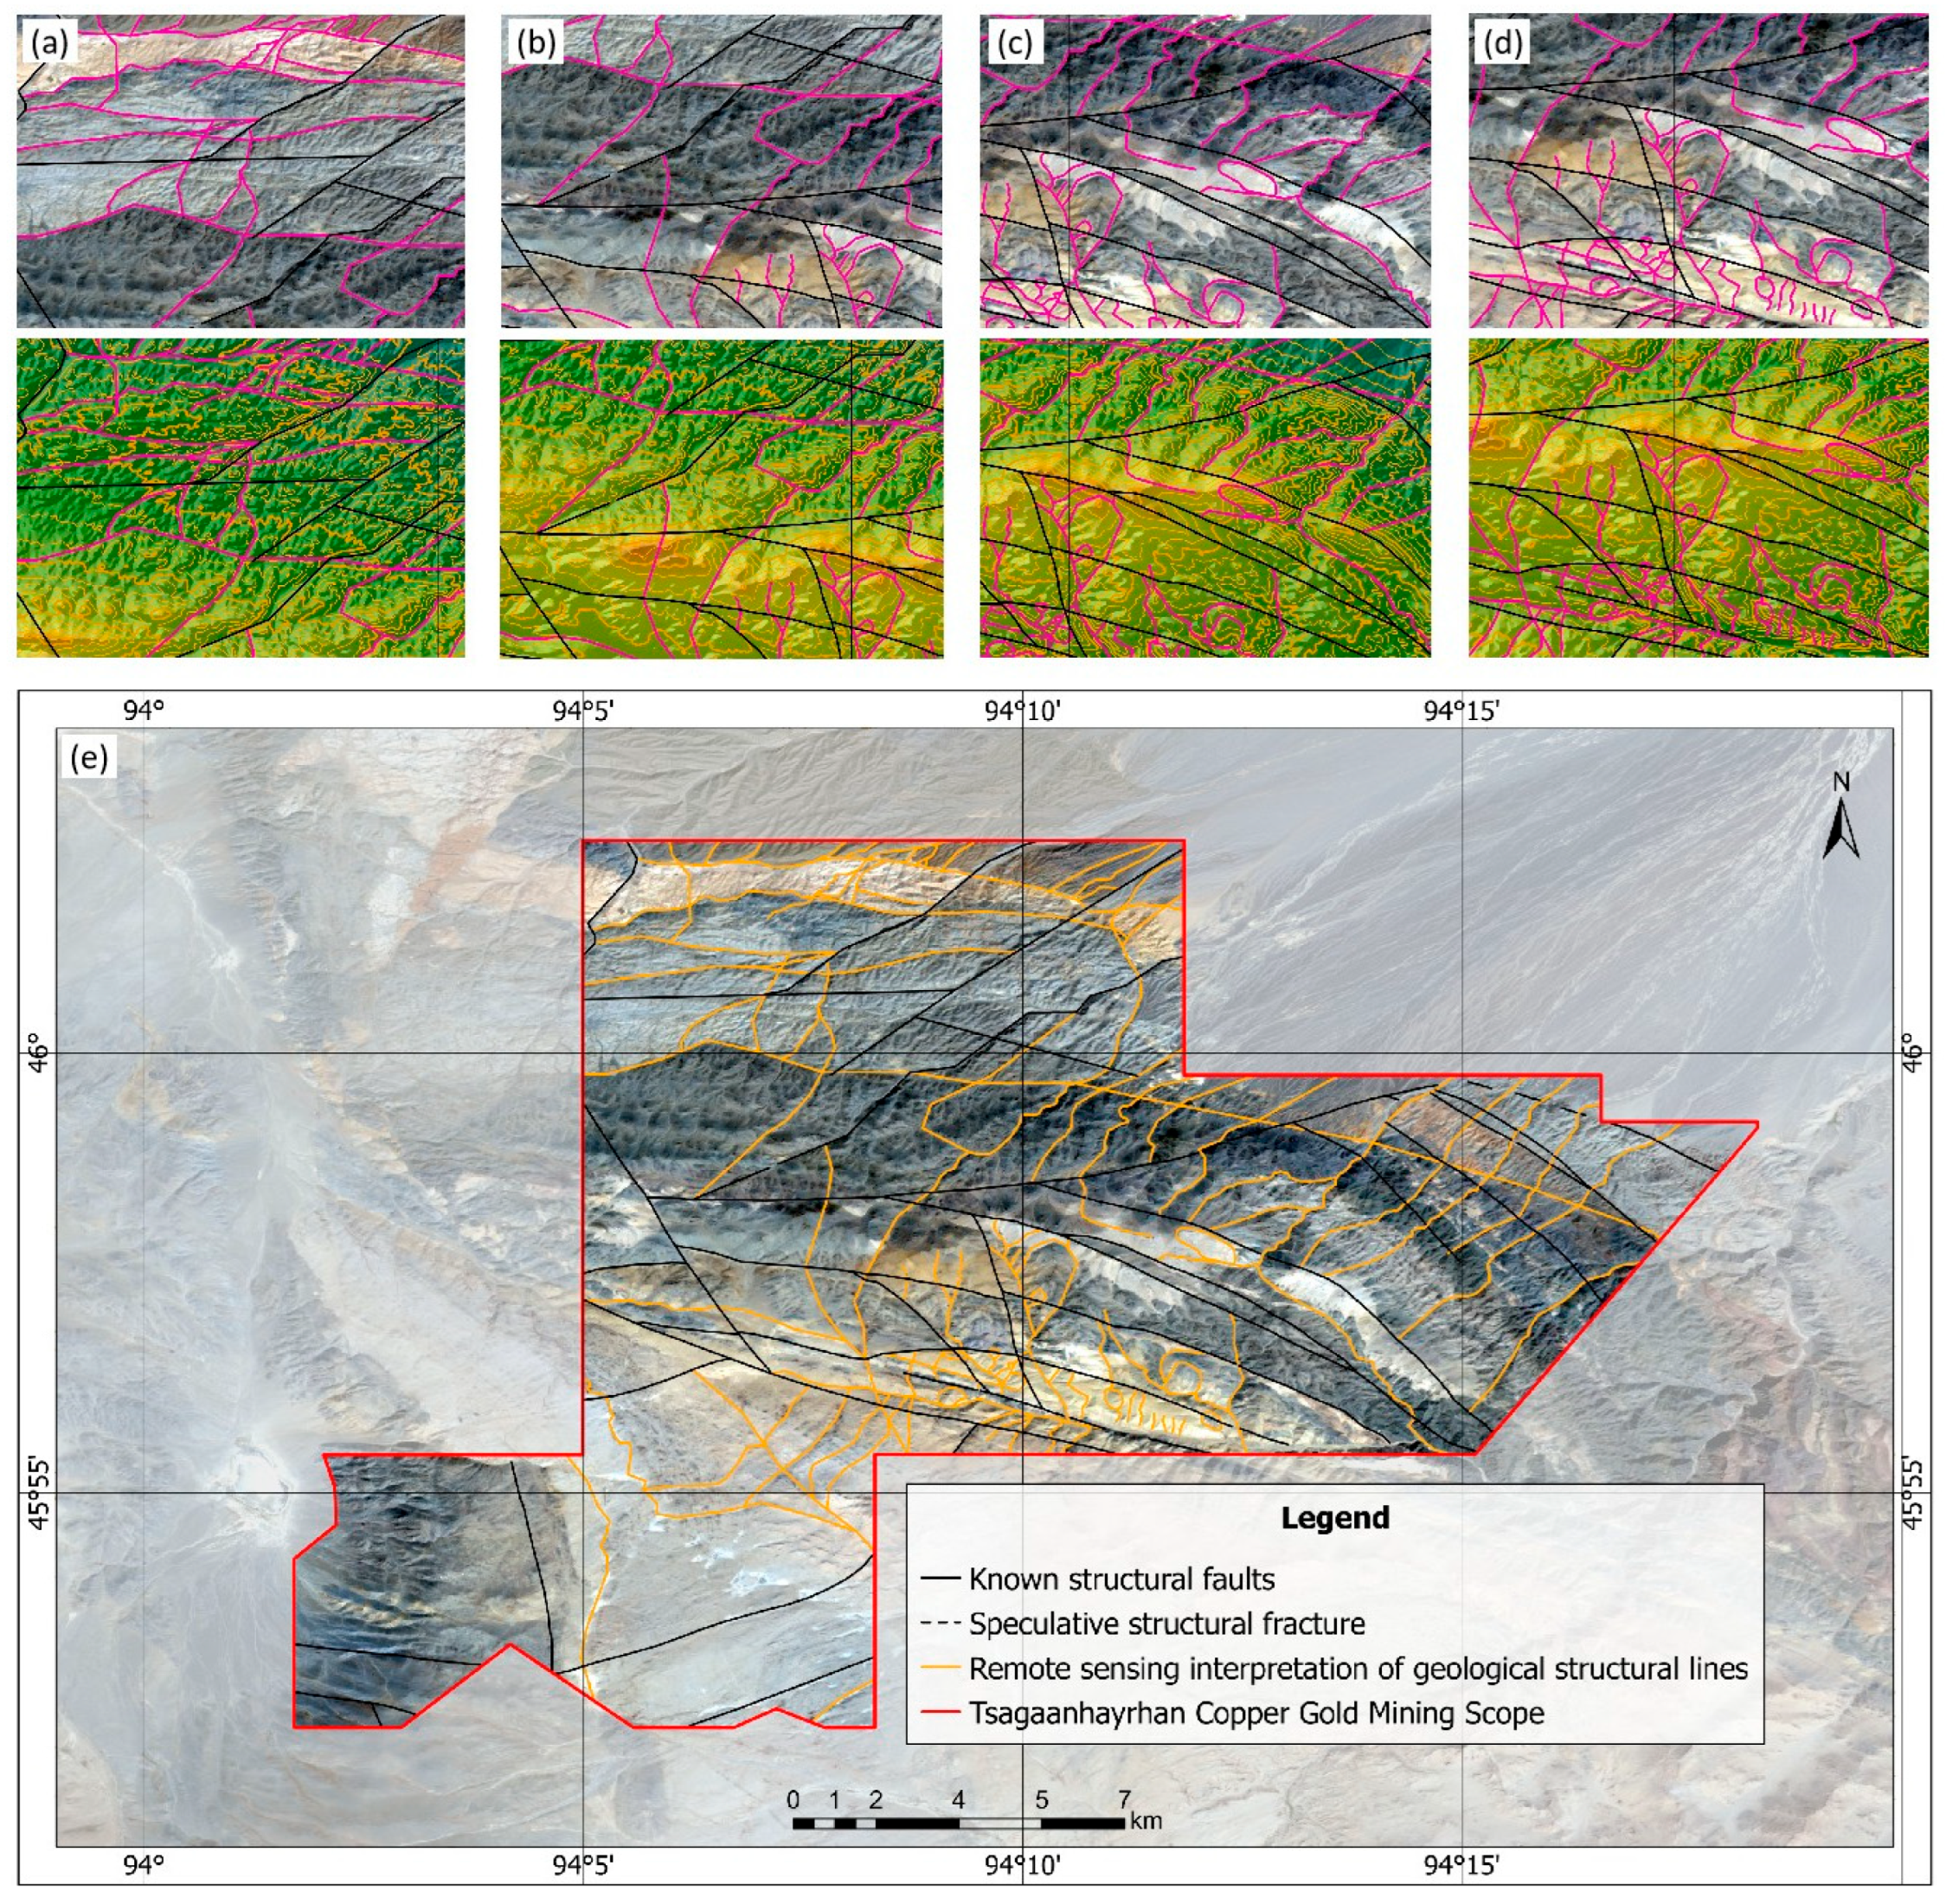
Linear structures primarily refer to straight, arcuate, or angular linear (or linear-like) image features associated with geological processes, which mainly reflect regional fault structures, linear strain zones, and stratigraphic boundaries [38]. Linear structures generally extend for several kilometers to tens of kilometers and exhibit distinct color, shape, and texture characteristics on remote sensing images. The main interpretation criteria for linear structures are as follows: ① color lines or color bands that are different in hue from the background; ② significant differences in shadow and texture on both sides of the linear body; ③ linear structures are often accompanied by typical topographic geomorphic features distributed in a certain direction, such as linear foothills, linear saddles, truncated mountains, zigzag ridges, knife-edge valleys, bead-like basins, and steep cliffs, all exhibiting linear distribution; and ④ differences in geological landscapes and water system types on both sides of the linear band, or variations in water system morphology. For example, abrupt changes in water system orientation often occur on both sides of the linear band, with valleys suddenly turning or intersecting vertically, and the development of hook-shaped water systems and bent water system valleys.
On images, linear structures often exhibit clear linear traces, frequently manifesting as linear color lines or color boundaries of a certain scale (Figure 3a). Color lines refer to linear anomalies within the background hue, while color boundaries denote linear boundaries where two different hues (or colors) abruptly meet.
In addition to the aforementioned characteristic markers of linear structures, fractures interpreted from remote sensing images also exhibit features such as lithological changes, stratigraphic cutting, displacement, stratigraphic repetition, or absence; furthermore, on the imagery, they are manifested as discontinuities in geological structures; that is, structural features are interrupted or abruptly change along a certain interface (Figure 3b), such as the oblique intersection of rock layer strike lines on both sides of the interface, displacements along the strike of faults and folds, sudden widening or narrowing of folds along their strike, and significant differences in the degree and pattern of structural development on both sides of the interface.
Large-scale fault zones are often accompanied by the exposure of structural fracture zones, which appear in images as line-shaped features that vary in width, are intermittently visible, and discontinuously extend, often appearing in dark tones due to the presence of water (Figure 3c).
The relationship between linear structures of different levels and mineralization varies. Generally speaking, mega-fault zones and deep-seated faults often control the locations of ore fields or metallogenic belts, while deposits with industrial prospects are typically distributed in secondary faults and joint zones that obliquely intersect or are parallel to these main faults. Linear structures can serve as mineral conduits or mineralization sites, while later-stage active linear structures may disrupt pre-existing mineral deposits; magma is most likely to intrude along large shear zones into the extensional regions of the shear stress field, often accompanied by mineralization.

4.2. Interpretation of Circular Structures

Circular structures formed during the intrusion of magma (concealed or sub-concealed rock bodies) or those triggered by large-scale thermal events (hydrothermal rings) are more or less reflected in the existing surface landscapes and exhibit specific or regular phenomena, often forming circular traces in topography and geomorphology and manifesting as circular images on remote sensing images.
On a 1:100,000 scale image map, circular structures images with a diameter of 1–2 km or larger are mostly of structural causes, while magmatic rings and thermal event rings associated with mineralization are generally formed by faults, fractures, and magmatic-hydrothermal processes, and typically have diameters of around 500 m. Meanwhile, the micro-topographic features are characterized by arc-shaped ridges or valleys enclosing them. There are also smaller, fuzzier thermal event rings composed of micro-geomorphic features with a certain degree of fading. These thermal event rings appear light-colored and rounded, often with some color spots or different textures forming a halo-like ring inside. Their combination forms include ring junctions, ring chains, overlapping rings, and concentric rings [38].
It is worth noting that almost every small thermal event ring interpreted from remote sensing images in the area is somehow related to small faults and fractures. The interpretation markers include ① annular color boundaries, stratigraphic or ridge arc-shaped bends; ② annular color lines; ③ arc-shaped fractures; ④ annular uplifts and depressions with radial or concentric water systems distributed on them; and ⑤ annular color spots, etc. Magmatic rings refer to the ring structure caused by magmatic activity, with large magmatic rings composed of multiple-phase rings indicating that the area has experienced underground magmatic activity. When the image texture features are distinct, it suggests that the underground magmatic activities occurred relatively recently, while blurred imagery characteristics reflect that the underground magmatic activities took place a long time ago. The size and number of the ring structures reflect the intensity and frequency of magmatic activities. As depicted in (Figure 3d), the image texture features are clear, the boundaries are well-defined, and there are obscure small rings within the large ring, indicating that magmatic activities in this area were frequent and occurred relatively recently.
Linear and ring structures often control the locations of mineral fields or metallogenic belts. Many industrial-prospect deposits are distributed in secondary faults and joints that obliquely intersect or are parallel to these main fault zones. Mineral alteration also frequently occurs in areas where linear and ring structures intersect or are tangent to each other; thus, the enhanced remote sensing image interpretation of linear and ring geological structure lines can provide important evidence for delineating mineral exploration target areas.

4.3. Geological Structure Interpretation Results and Analysis

Based on the enhanced images derived from the synergistically fused GF-2 and Landsat-8 data, combined with the contour topographic maps generated from Copernicus DEM, a total of 107 linear and ring structure lines were interpreted (Figure 3), primarily including linear features formed by stratigraphic boundaries, linear valleys, and ridge fractures. Among them, the linear structure lines with extensions longer than 1 km are mainly oriented in the NE, NS, and WE directions. In the northern part of the study area, the dominant geological formations are the intrusive strata of the Middle–Late Cambrian Togtohxin group and the Late Devonian Kebu Duo intrusive rocks, with geomorphological boundaries often showing significant color differences as well as linear structures that are distinctly inconsistent with surrounding areas. The central and eastern parts of the study area are mainly covered by relevant rock strata types such as the Late Devonian, Lower Cambrian, Neoproterozoic, and the intrusive strata of the Middle–Late Cambrian Togtohxin group, resulting in a complex geological environment. Therefore, the linear and ring structures derived from geological interpretation are relatively abundant, indicating a strong metallogenic potential in this area. By comparing with the geological map, it is also found that this area has a wide variety of rock types, with fault zones present within the same strata or at the boundaries between different strata. In addition, there are ring structures triggered by large-scale thermal events, which manifest as ring images on remote sensing images. In contrast, the southern part of the study area is mainly composed of relevant rock strata such as Ordovician–Silurian metamorphic rocks and Late Devonian Kebu Duo intrusive rocks, which are relatively simpler in the geological environment. Judging from the contour topographic map, the geological structural lines in this region are also sparser, indicating weaker metallogenic potential, and thus it is not considered a primary choice for delineating metallogenic target areas.

5. Alteration Information Extraction

Alteration of the surrounding rock near the ore body is an imprint left during the process of gradual enrichment and mineralization of ore-forming materials. Most endogenous ore deposits are accompanied by metasomatic alteration of the surrounding rocks, and the range of the alteration zone is several times to dozens of times larger than that of the ore body distribution [39]. The discovery of hydrothermal alteration rocks can provide indications for prospecting directions. Geologists also believe that although the presence of altered rocks does not necessarily imply the presence of ore, large- and super-large endogenous deposits are generally associated with intense and extensive alteration in the surrounding rocks. Remote sensing captures surface information, and as long as there is a certain area of altered rocks exposed at the surface, they may be detected. In other words, even if the ore body is concealed, it is still possible to discover the ore body using remote sensing methods as long as there is a sufficient area of strongly altered rock exposed [40].
Minor components in rocks, such as iron or alteration minerals, can attain a dominant position within the rock spectral bands. In other words, in the visible and infrared spectra, the most common spectral features of natural minerals and rocks are produced by iron in various forms, or by water, hydroxyl groups, or carbonate groups. Based on these theoretical foundations, the visible–near-infrared bands can be utilized to reflect differences in alteration information, enabling the identification and judgment of remote sensing anomalies, directly extracting hydrothermally altered rock information with mineral exploration significance from data, specifically obtaining hydroxyl alteration anomaly information and iron-staining alteration anomaly information from the data [41,42].

5.1. Spectral Feature Analysis of Alteration Minerals

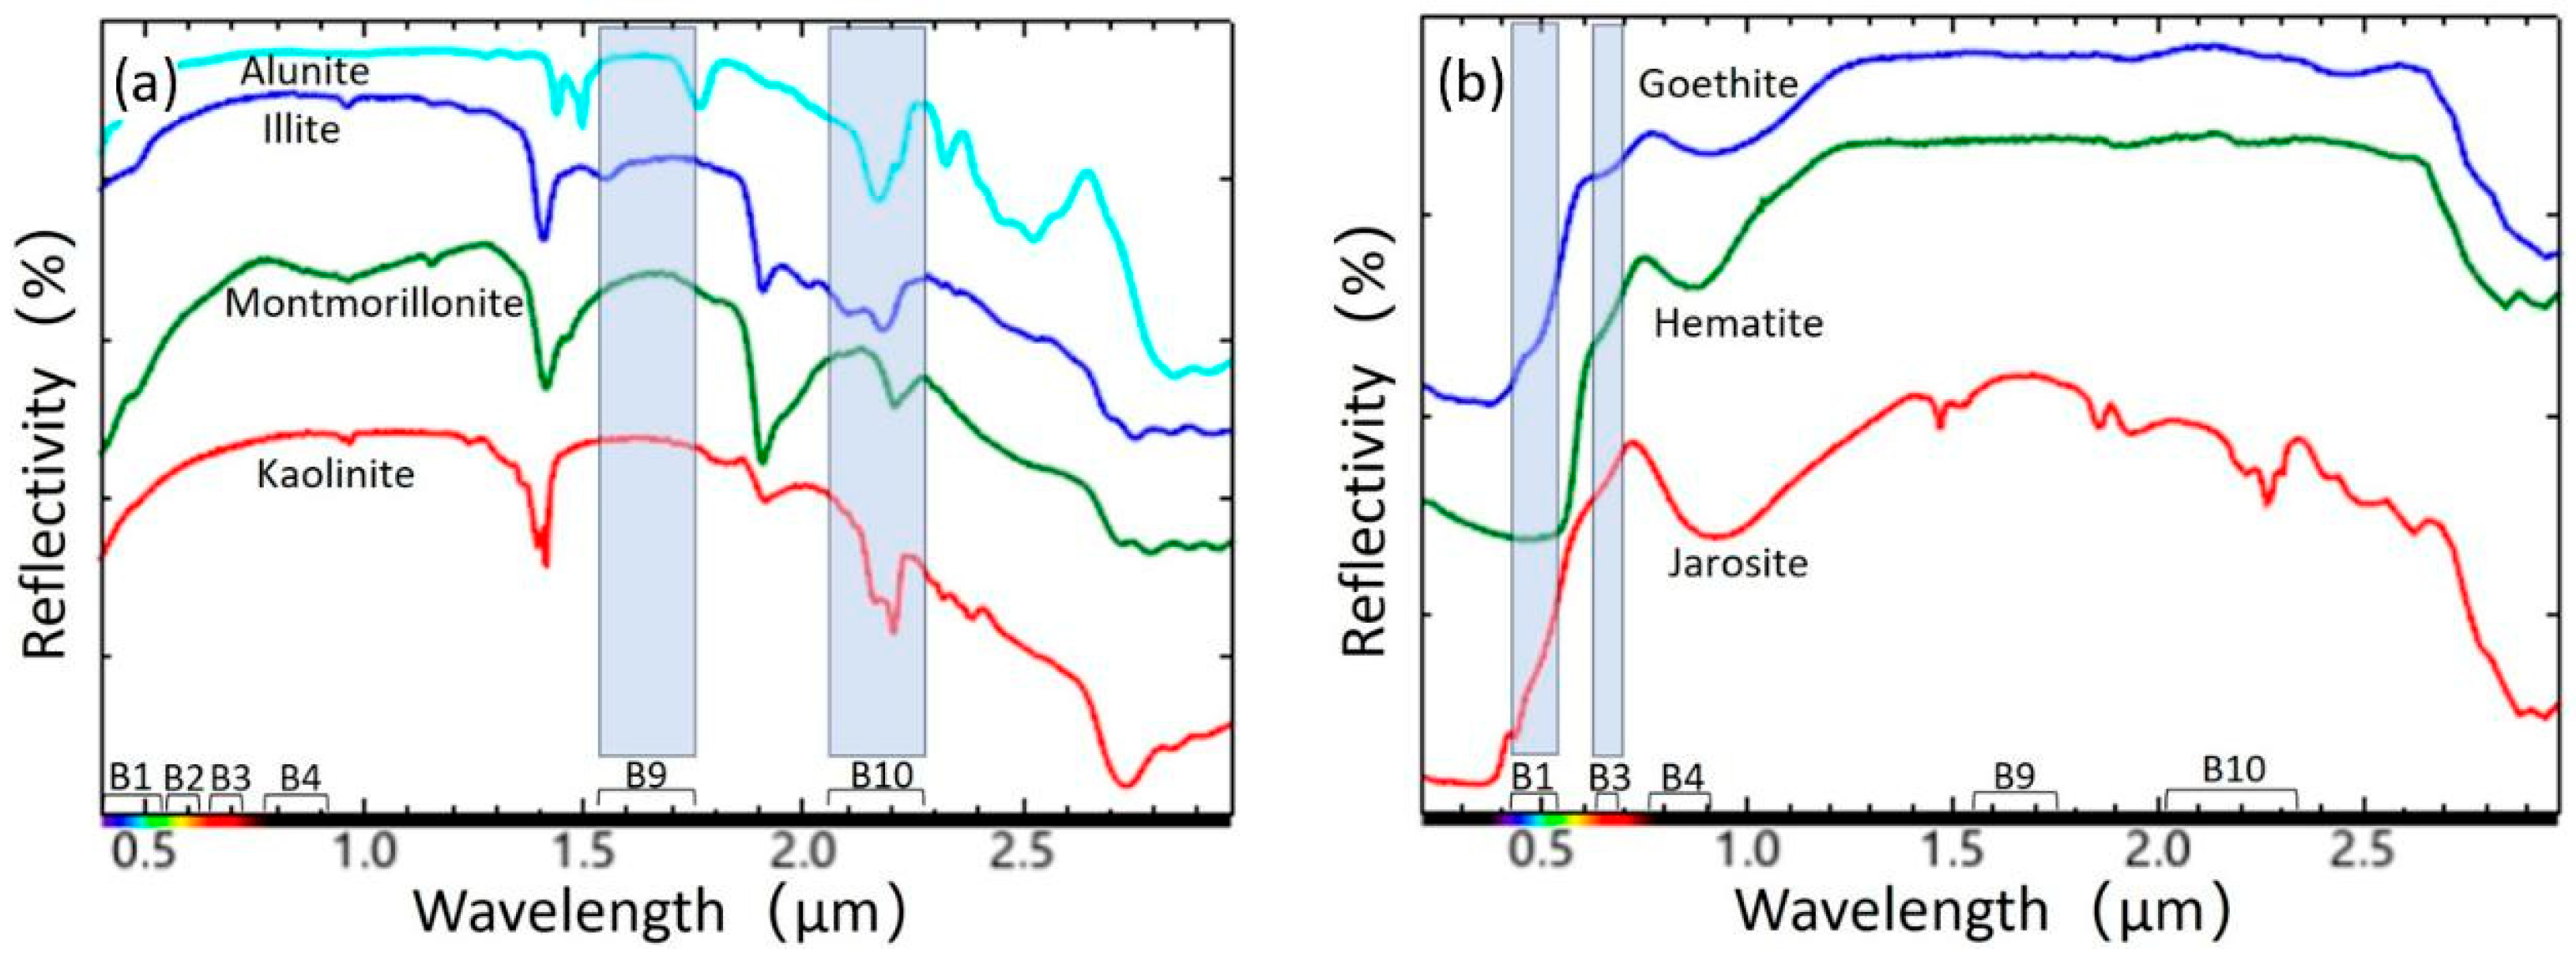
Metasomatic alteration of rocks is primarily the result of the interaction between different types of hydrothermal fluids and the original rocks. The most common types of alteration include potassic alteration, silicification, sericitization, chloritization, albitization, skarnization, dolomitization, baritization, and manganiferous–ferruginous carbonatization. These common mineralization phenomena can be identified by the presence of ions such as Fe2+, Fe3+, and OH [43]. Alteration minerals containing Fe2+, Fe3+, and OH exhibit distinct characteristic spectra, displaying different characteristic absorption bands within specific wavelength ranges. Based on these characteristics, it is possible to accurately extract mineralization-alteration information. Taking the resampled Sentinel-2 data as an example, the band intervals corresponding to the absorption and reflection peaks of alteration minerals containing hydroxyl groups, as well as those corresponding to the absorption and reflection peaks of alteration minerals containing Fe2+ and Fe3+ ions, are shown in Figure 4.

5.2. Principal Component Analysis (PCA)

PCA, also known as the K-L transform, is a multidimensional orthogonal linear transformation method that generates new component images through linear combinations based on image features. PCA can reduce the number of variables and the data dimension with minimal information loss, achieving the effects of data compression and decorrelation. Taking two-dimensional data as an example, the first principal component represents the maximum amount of information, and the second principal component is orthogonal to the first. PCA preserves the main features of multispectral data in the low-order principal components, with the first principal component reflecting the radiative differences of ground objects, while other components reveal spectral characteristics. Each principal component is independent of the others and has the function of separating information and highlighting different ground object targets [38].
In practical applications, the geological significance of each principal component depends on its characteristics rather than its order.
Based on the PCA method and taking into account the spectral characteristics of alteration minerals, for Sentinel-2 data, hydroxyl (OH) exhibits high reflectance in the B9 band and strong absorption in the B10 band. Therefore, the four bands of B1, B4, B9, and B10 are used to extract hydroxyl alteration anomaly information. Similarly, considering that the B3 band shows high reflectance of iron ions (Fe2+, Fe3+) and the B1 band has strong absorption characteristics, the bands B1, B3, B4, and B9 are employed to extract iron-staining alteration anomaly information.
When using Landsat-8 data to extract hydroxyl and iron-staining alteration anomaly information, based on the spectral characteristics of minerals, the four bands of B2, B5, B6, and B7 are utilized to extract hydroxyl alteration anomaly information, and the bands B2, B4, B5, and B6 are adopted to extract iron-staining alteration anomaly information.

5.3. Extraction Results and Analysis of Alteration Information

5.3.1. Extraction of Hydroxyl Alteration from Sentinel-2 and Landsat-8

For Sentinel-2 data, hydroxyl (OH) exhibits high reflectance in the B9 band, making a positive contribution in PCA, and strong absorption in the B10 band, resulting in a negative contribution in PCA. Similarly, Landsat-8 data show high reflectance in the B6 band, contributing positively to PCA, and strong absorption in the B7 band, contributing negatively to PCA. Therefore, based on the principal component transformation characteristic matrix for hydroxyl alteration anomalies extracted from Sentinel-2 data (Table 6), principal component 3 (PC3) is used to analyze hydroxyl alteration anomalies for Sentinel-2 data, while based on the principal component transformation characteristic matrix for hydroxyl alteration anomalies extracted from Landsat-8 data (Table 6), principal component 4 (PC4) is employed to analyze hydroxyl alteration anomalies for Landsat-8 data [38].

5.3.2. Landsat-8 and Sentinel-2 Iron-Staining Alteration Extraction

For Sentinel-2 data, iron-staining alteration anomaly information exhibits high reflectance in the B3 band, making a positive contribution in PCA, and strong absorption in the B1 band, resulting in a negative contribution in PCA. Similarly, considering the band distribution of Landsat-8 data, they show high reflectance in the B4 band, contributing positively to PCA, and strong absorption in the B2 band, contributing negatively to PCA. Therefore, based on the principal component transformation feature matrix for iron-staining alteration anomalies extracted from Sentinel-2 data (Table 7), principal component 4 (PC4) is used to analyze iron-staining alteration anomalies for Sentinel-2 data, while based on the principal component transformation feature matrix for iron-staining alteration anomalies extracted from Landsat-8 data (Table 7), principal component 4 (PC4) is employed to analyze iron-staining alteration anomalies for Landsat-8 data.

5.4. Anomaly Classification

5.4.1. Hydrolysis Alteration Anomaly Classification

Studies have shown that when the sample size is sufficiently large and the mechanisms leading to the results are uncertain (i.e., random), many natural phenomena exhibit characteristics that approximate a normal distribution. For alteration rock zones exposed on the surface, they mostly have relatively stable brightness value distributions on remote sensing images, and these distributions possess both structural and random characteristics. Therefore, it can be approximately assumed that the alteration anomaly components follow a normal distribution. Selecting appropriate thresholds for threshold segmentation of the PCA results can effectively highlight the central positions of mining anomalies. Typically, anomaly classification is carried out through thresholding based on “Mean + n times the standard deviation”, where the degree of deviation from the mean (n times the standard deviation) is used to represent the anomaly level. A larger n value corresponds to a smaller number of anomalies but a higher anomaly level. In the principal component images of hydrolysis alteration anomalies, when n takes values of 2, 2.5, and 3, they correspond to first-, second-, and third-level anomalies, respectively; in the principal component image of iron-staining alteration anomalies, when n takes values of 1.5, 2, and 2.5, they correspond to first-, second-, and third-level anomalies, respectively [4,40].
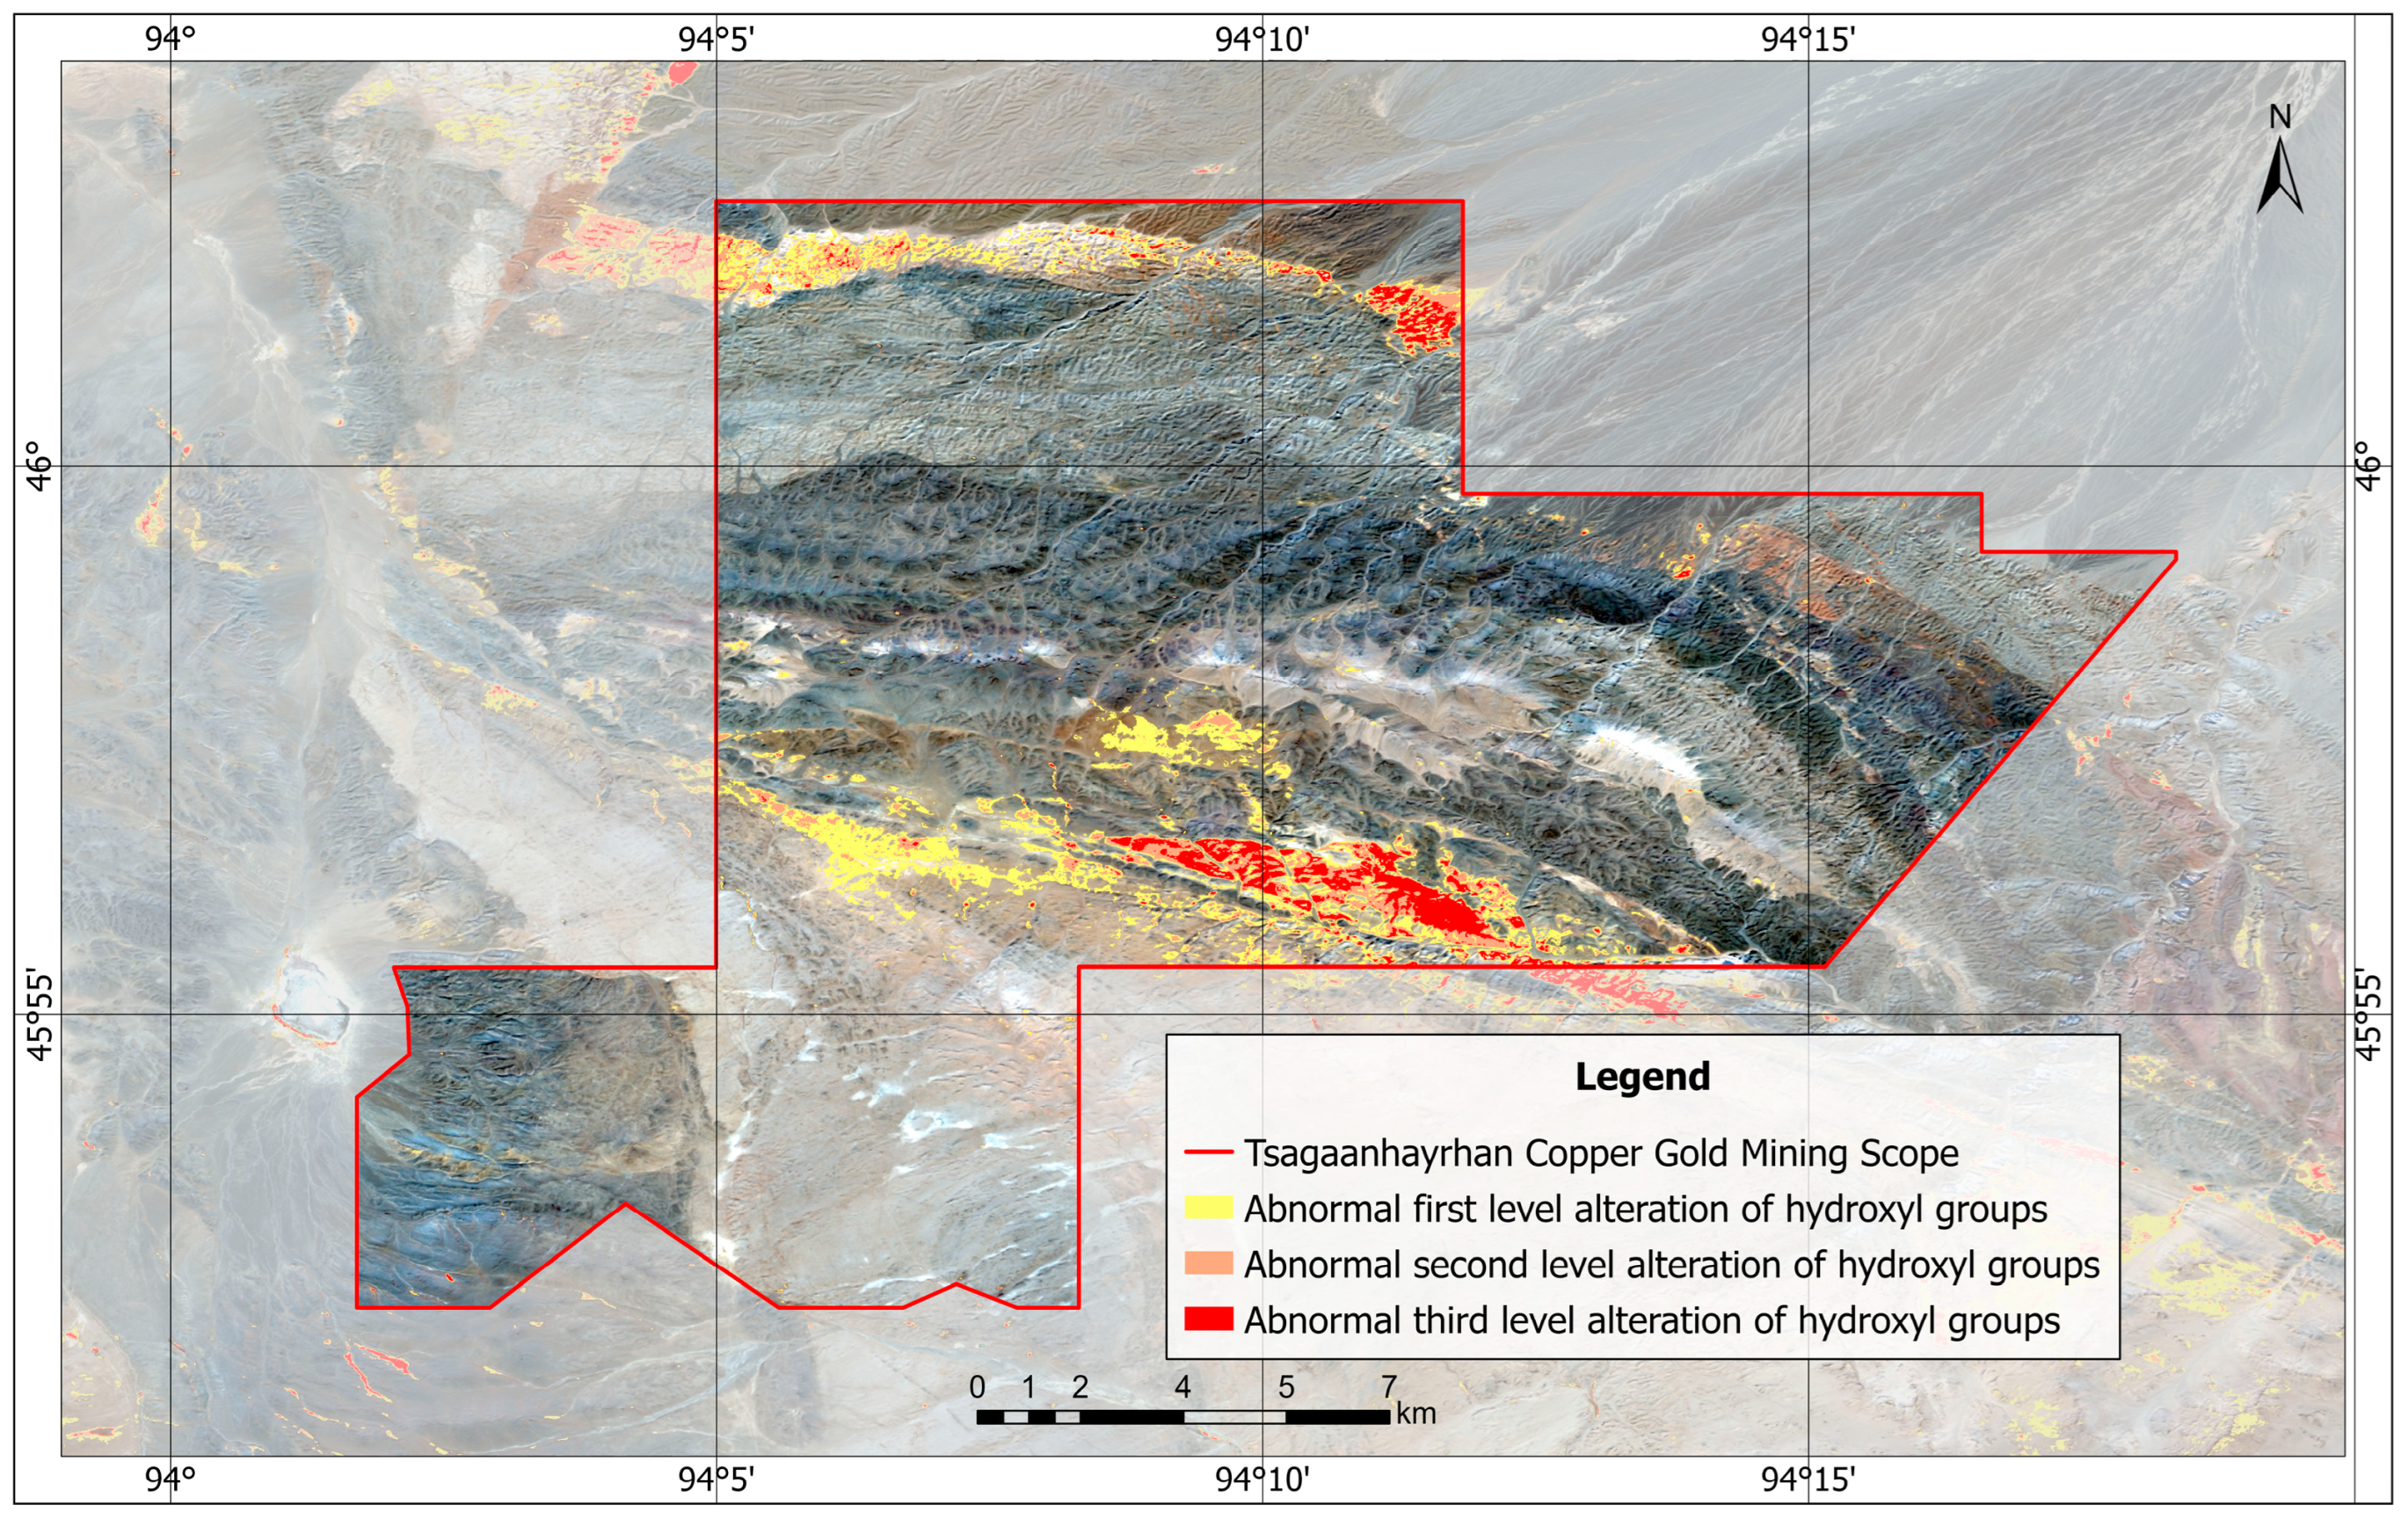
After extracting the hydroxyl alteration anomaly information, an analysis table of the standard deviations of the principal components for hydroxyl alteration anomalies (Table 8) is obtained. Anomaly classification is conducted based on the multiples of the standard deviations obtained from the PCA. The lower limit for first-level alteration anomalies is 2 times the standard deviation, for second-level alteration anomalies, it is 2.5 times the standard deviation, and for third-level alteration anomalies, it is 3 times the standard deviation. The third-level anomalies represent the most intense alteration anomaly information, with the intensity of alteration information gradually decreasing from the third level to the first level (Table 9). The hydroxyl alteration anomaly information is superimposed onto the remote sensing images, as shown in Figure 5.

5.4.2. Iron-Staining Alteration Anomaly Classification

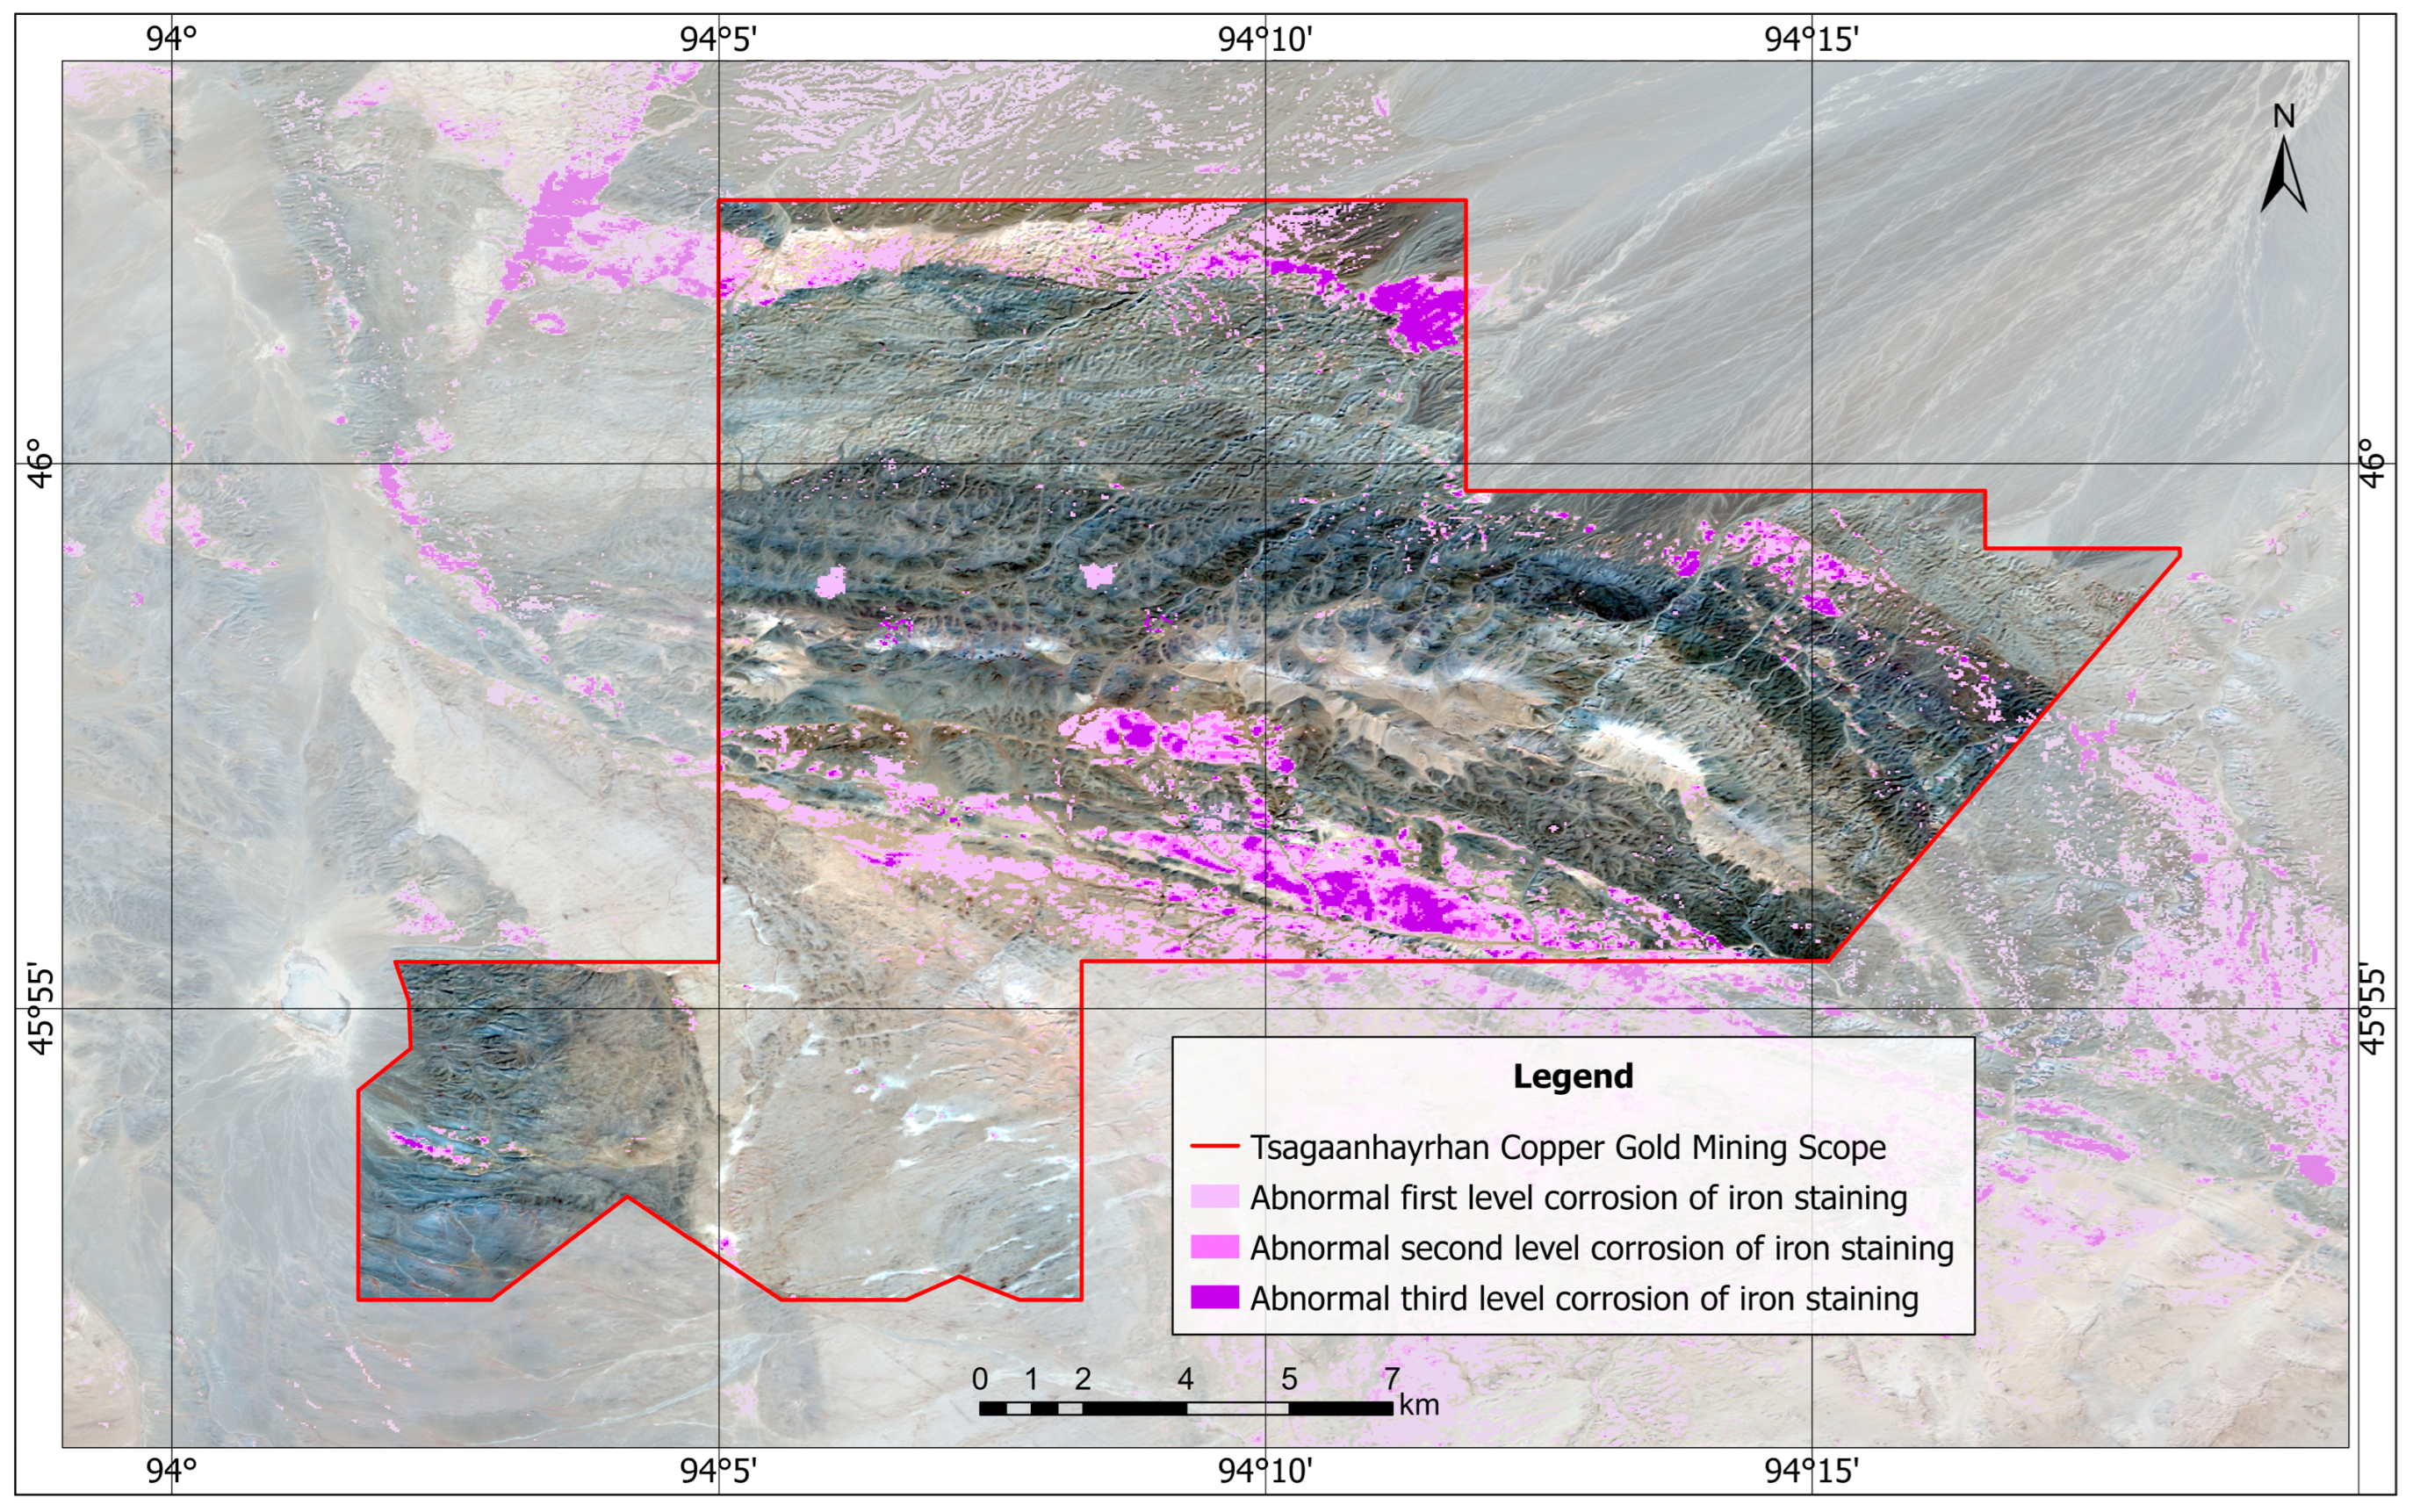
After extracting the iron-staining alteration anomaly information, an analysis table of the standard deviations of the principal components for iron-staining alteration anomalies (Table 10) is obtained. Anomaly classification is carried out based on the multiples of the standard deviations obtained from the PCA. The lower limit for first-level alteration anomalies is 1.5 times the standard deviation, for second-level alteration anomalies, it is 2 times the standard deviation, and for third-level alteration anomalies, it is 2.5 times the standard deviation. The third-level anomalies indicate the most intense iron-staining alteration anomaly information, with the intensity of the alteration information gradually decreasing from the third level to the first level (Table 11). The iron-staining alteration information is superimposed onto the remote sensing images, as depicted in Figure 6.

5.5. Evaluation of Alteration Anomaly Information Extraction Effect

After conducting a superposition analysis of hydroxyl alteration anomaly information and iron-staining alteration anomaly information, it was found that the alteration anomaly information extracted from Landsat-8 data is generally more significant in terms of spectral response intensity, especially showing higher contrast and clearer boundaries in iron-staining alteration areas. This may be related to the spectral band configuration of Landsat-8 and its excellent radiometric calibration performance, which makes it more sensitive in the identification of minerals such as iron oxides [44]. In contrast, although the Sentinel-2 satellite has a higher spatial resolution, providing more detailed spatial information at the 10 m scale, its performance in extracting the spectral absorption features of certain minerals is slightly inferior to that of Landsat-8. However, from the perspective of spatial distribution, the hydroxyl alteration anomaly information extracted from both Sentinel-2 and Landsat-8 shows consistency in the distribution range, indicating that both can accurately reflect the true distribution characteristics of hydroxyl minerals and iron-staining minerals in the region [45].

6. Delimitation of Mineralization Target Areas and Mineralization Prediction

The basis for delineating target areas is primarily based on a comprehensive analysis of regional structural characteristics, remote sensing anomaly data, and alteration features to identify areas with higher mineralization potential. First, in terms of structural characteristics, all 7 target areas (Figure 7) are located at the intersections of different types of structures or within structural zones, with structural complexity being a key factor in target area delineation. Specifically, the target areas contain a diverse and interwoven system of structures, including fault zones and remote sensing—interpreted structural lines trending in NE, NS, WE, and other directions. The stress concentration areas formed by the intersection of these structural lines often lead to the development of fracture systems, providing favorable pathways for the migration and enrichment of mineralizing fluids. In particular, at the intersections, the complexity of the structures often enhances the concentration of the local stress field, forming favorable mineralization spaces.
Secondly, the anomaly information of the target areas (including hydroxyl alteration and iron-staining alteration) provides an important basis for mineralization prediction. Through the analysis of remote sensing images and the extracted anomaly data, it can be found that most target areas show characteristics of hydrothermal metasomatism to varying degrees. Specifically, third- and second-level hydroxyl and iron-staining alteration anomalies are generally present in the area, indicating strong hydrothermal metasomatism, especially in the structural intersection areas, where the anomaly intensity is significantly enhanced. The spatial distribution of these anomaly areas is closely related to the mineralization potential, especially at the intersection of structural zones, hydrothermal activity, and the migration and enrichment of mineralizing fluids are usually more significant. In some target areas, the anomaly range is wide and the anomaly intensity is high, indicating that the area not only has the conditions for mineralization, but also may have strong space for the migration and enrichment of mineralizing fluids.
Take target area 7 (Figure 8) as an example. The structure of this target area is extremely complex. It is composed of two NW-trending and two WE-trending structural lines, forming a dense structural intersection area, which may form a combination system of main faults and secondary fractures. In addition, there are several circular structures and linear structures in this area, and there are intersections and tangents between linear and circular structures, which is a region with great potential for mineralization. In addition, the anomaly information in this area is significant, with hydroxyl and iron-staining alterations widely distributed, especially with strong third-level anomalies, making it an ideal mineralization area for the aggregation of various mineral types.
Taking into account the structural background, anomaly characteristics, and evidence of mineralization, and combining the results of interpretation and geological structural analysis, the mineralization potential was effectively assessed, and the boundaries of these target areas were ultimately determined. This approach not only provides a scientific basis for mineral resource exploration but also offers guidance for further field surveys. The integration of remote sensing data and geological analysis not only enables the efficient identification of potential mineralization areas at an early stage but also significantly enhances the accuracy and efficiency of geological exploration, providing solid technical support for the development and utilization of mineral resources.

7. Field Verification

In mineral exploration, the integrated application of remote sensing, airborne geophysics, and predictive modeling can identify potential mineralization anomalies at a regional scale [46]. However, these data-driven predictions must be systematically verified in the field to ensure their geological significance and mineral potential [47]. In this study, we selected high-potential areas with structural intersections, strong alteration, and distinct lithological boundaries based on the results of multi-source data overlay analysis, and conducted field investigations. The purpose was to verify whether there is mineralization within the defined mineralization target areas. Field investigations play an irreplaceable role in mineral prediction and exploration processes. They are not only a necessary test of the results of multi-source data integration but also a scientific basis for the selection of subsequent deep drilling sites.
During this field investigation (Figure 9), mineralization points were found in the No. 1 mineralization target area (Figure 9a), where obvious mineral assemblages and secondary mineralization characteristics were observed in the diorite fissures. The filling and metasomatic action of rock fissures are characterized by the presence of black medium–coarse-grained amphibole, quartz, and biotite. The surfaces of the fissures and their fillings are widely developed with secondary coating and vein filling of malachite, indicating a strong copper oxidation and secondary enrichment process. The primary mineral assemblage is mainly chalcopyrite, accompanied by a small amount of secondary sulfide minerals, and locally, there are gold-bearing sulfide associations. These characteristics indicate that the diorite fissures in this area are not only important channels for the transport and precipitation of mineralizing fluids but also favorable spaces for copper and gold mineralization. They have significant guiding significance for the study of subsequent mineralization mechanisms. In the No. 3 target area, a mineralization point was found (Figure 9b) with particularly significant copper enrichment characteristics, providing a high copper content for the host rock: andesite. The significance of this geochemical anomaly lies first in its clear spatial relationship with the main andesite unit, indicating a potential coupling mechanism between mineralization and magma rock. More importantly, this copper anomaly is not isolated but shows a multi-element combination anomaly. This geochemical association not only provides important clues for exploring the regional mineral material sources and transport mechanisms but also provides key evidence for further evaluating the mineral potential of the area and searching for related deposits. In the No. 4 target area, a small amount of azurite was observed (Figure 9c). Although its occurrence scale is limited, the presence of this secondary carbonate copper mineral is of great significance for indicating the secondary enrichment of the regional oxidation zone. Azurite usually forms during the oxidation and decomposition of copper minerals under surface or near-surface conditions. Therefore, its occurrence not only reflects the evolution of primary sulfide copper minerals in the later weathering–leaching environment but also provides key evidence for inferring the intensity of secondary enrichment and fluid evolution paths in the area. In addition, the identification of azurite may also provide geological guidance for finding potential high-grade oxidized copper mineralization zones in exploration work. In the No. 5 target area, a copper mineralization point was found (Figure 9d). It is worth noting that this anomaly is closely related to a regional fault zone and has a clear spatial symbiotic relationship with the host diorite body. This structural-body coupling relationship indicates that fault activity may have played an important role in the transport of mineralizing fluids and the precipitation of metal elements. Therefore, the area has high mineral exploration potential. Further analysis shows that this copper anomaly is not isolated but coexists with anomalies of silver, lead, zinc, arsenic, tin, and other elements, showing a multi-element combination enrichment. This polymetallic-associated geochemical anomaly not only reflects the complex sources and evolution processes of mineral materials but also provides key evidence for inferring the type of mineralization system in the area and evaluating its deep exploration prospects. In the No. 7 target area, two quartz vein-type mineralization points were identified (Figure 9e,f). One is a quartz vein extending from north to south, with a thickness of 0.1–1.0 m and a length of about 50 m, cutting through the gray granite diorite and distributed intermittently. The vein contains malachite, chalcopyrite, and molybdenite, showing typical copper-molybdenum mineralization characteristics and associated secondary oxidation. The other is a gray medium-grained granite diorite cut by a quartz vein about 0.1 m thick and 20 m long, also distributed discontinuously from north to south. Although no obvious metal minerals have been found so far, its development characteristics indicate that the area has been modified by hydrothermal action and may indicate potential mineralization activity.

8. Conclusions

This study focuses on the Tsagaankhairkhan Cu–Au deposit in Mongolia and proposes an integrated structural-alteration anomaly coupling approach for mineral prospectivity mapping based on multi-source remote sensing data. The research achieved several innovative outcomes and significant conclusions:
First, the effectiveness of multi-source remote sensing integration in geological exploration was systematically validated. By combining Landsat-8, GF-2, and Sentinel-2 datasets under the framework of spectral synergy theory, structural features were markedly enhanced. In particular, the interpretation accuracy of mineralization-related linear and circular structures was significantly improved compared to single-source data. This integration provides a novel technical pathway for remote sensing-based structural interpretation, especially in geologically complex terrains.
Second, the spatial coupling relationship between structural patterns and hydrothermal alteration anomalies, as well as their control on mineralization, was elucidated. Analysis of the Tsagaankhairkhan area revealed a strong spatial association of mineralization with fault zones, structural intersections, and hydrothermal alteration zones. This indicates that structural deformation and hydrothermal processes played a decisive role in ore-forming fluid migration and metal deposition, thereby advancing the understanding of the “structure–alteration–mineralization” coupling mechanism.
Third, by integrating structural analysis with alteration anomaly extraction, multiple high-potential target zones were delineated. Notably, structural intersection areas characterized by intense alteration anomalies and complex tectonic frameworks provide favorable conditions for ore-fluid transport and precipitation. These results enable an effective prediction of prospective mineralized belts within the study area, offering a clear exploration roadmap for subsequent field investigations.
Finally, field verification confirmed the reliability and practical applicability of the proposed predictive model. Significant Cu–Au mineralization points were discovered within the selected targets, showing strong consistency with remote sensing interpretation and prospectivity predictions. This not only demonstrates the applicability of the developed approach to the Tsagaankhairkhan deposit but also provides valuable guidance for mineral exploration in geologically analogous regions.
In summary, this research establishes an efficient and scientifically grounded mineral prediction framework by integrating multi-source remote sensing data with structural-alteration analysis, thereby offering robust theoretical and technical support for mineral exploration in the Tsagaankhairkhan area and beyond. Future studies should incorporate artificial intelligence and deep learning techniques to achieve quantitative and intelligent prospectivity modeling. Additionally, drilling verification will be essential to obtain orebody morphology, grade, and depth data, further enhancing the universality and accuracy of predictive models.

Author Contributions

Conceptualization, J.L., L.Z., C.L., and J.T.; methodology, J.L., L.Z., C.L., and J.T.; software, J.L. and L.Z.; validation, J.L., L.Z., and H.C.; formal analysis, J.L.; investigation, H.C., W.L. (Wei Li), and C.L.; resources, J.L., data curation, J.L. and L.Z.; writing—original draft preparation, J.L.; writing—review and editing, J.L., L.Z., and C.L.; visualization, J.L., L.Z., and C.L.; supervision, J.L., H.C., and W.L. (Wei Li); project administration, J.L., L.Z., and C.L.; funding acquisition, J.L. and W.L. (Wenbing Li). All authors have read and agreed to the published version of the manuscript.

Funding

This research was funded by Deep Earth Probe and Mineral Resources Exploration—National Science and Technology Major Project 2024ZD1001400 and supported by the Ministry of Education Industry, University Cooperative Education Program of China, under grant number 230902313153315.

Institutional Review Board Statement

Not applicable.

Informed Consent Statement

Not applicable.

Data Availability Statement

The data presented in this study are available from the corresponding author upon request.

Acknowledgments

The authors would like to express their sincere gratitude to the National Remote Sensing Data and Application Service Platform and the Yunnan Data and Application Center of the High Resolution Earth Observation System for providing data application services for the use of this research institute.

Conflicts of Interest

Li Wei is an employee of Yunnan Copper Industry Mineral Resources Exploration and Development Co., but the paper reflects the views of the scientists and not the company. The remaining authors declare that the research was conducted in the absence of any commercial or financial relationships that could be construed as a potential conflict of interest.

References

  1. Liang, S.; Wei, H.; Gan, F.; Chen, L.; Xiao, C. Preliminary Application Evaluation of GF-2 Satellite Data in Remote Sensing Geological Survey. Spacecr. Recovery Remote Sens. 2015, 36, 63–72. [Google Scholar]
  2. Pei, Q.; Shen, J.; Wang, S.; Fang, D.; Gao, Y.; Li, D.; Ma, S. Exploring Luorite Veins Using Multi-source Remote Sensing Astellite Data: A Case Study from theShuitou Fluorite Deposit in Inner Mongolia, China. Northwestern Geol. 2024, 57, 121–134. [Google Scholar]
  3. Vincent, R.K. Spectral ratio imaging methods for geological remote sensing from aircraft and satellites. In Proceedings of the Management Utilization of Remote Sensing Data Conference, Sioux Falls, SD, USA, 31 October 1973. [Google Scholar]
  4. Tangestani, M.H.; Moore, F. Comparison of three principal component analysis techniques to porphyry copper alteration mapping: A case study, Meiduk area, Kerman, Iran. Can. J. Remote Sens. 2001, 27, 176–182. [Google Scholar] [CrossRef]
  5. Loughlin, W. Principal component analysis for alteration mapping. Photogramm. Eng. Remote Sens. 1991, 57, 1163–1169. [Google Scholar]
  6. Crósta, A.P.; De Souza Filho, C.R.; Azevedo, F.; Brodie, C. Targeting key alteration minerals in epithermal deposits in Patagonia, Argentina, using ASTER imagery and principal component analysis. Int. J. Remote Sens. 2003, 24, 4233–4240. [Google Scholar] [CrossRef]
  7. Shahriari, H.; Honarmand, M.; Ranjbar, H. Comparison of multi-temporal ASTER images for hydrothermal alteration mapping using a fractal-aided SAM method. Int. J. Remote Sens. 2015, 36, 1271–1289. [Google Scholar] [CrossRef]
  8. Honarmand, M.; Ranjbar, H.; Shahriari, H.; Naseri, F. Evaluating the effect of using different reference spectra on SAM classification results: An implication for hydrothermal alteration mapping. J. Min. Environ. 2018, 9, 981–997. [Google Scholar]
  9. Pour, A.B.; Zoheir, B.; Pradhan, B.; Hashim, M. Editorial for the Special Issue: Multispectral and Hyperspectral Remote Sensing Data for Mineral Exploration and Environmental Monitoring of Mined Areas. Remote Sens. 2021, 13, 519. [Google Scholar] [CrossRef]
  10. Gabr, S.; Ghulam, A.; Kusky, T. Detecting areas of high-potential gold mineralization using ASTER data. Ore Geol. Rev. 2010, 38, 59–69. [Google Scholar] [CrossRef]
  11. Salehi, T.; Tangestani, M.H. Evaluation of WorldView-3 VNIR and SWIR Data for Hydrothermal Alteration Mapping for Mineral Exploration: Case Study from Northeastern Isfahan, Iran. Nat. Resour. Res. 2020, 29, 3479–3503. [Google Scholar] [CrossRef]
  12. Warner, T.A.; Skowronski, N.S.; Gallagher, M.R. High spatial resolution burn severity mapping of the New Jersey Pine Barrens with WorldView-3 near-infrared and shortwave infrared imagery. Int. J. Remote Sens. 2017, 38, 598–616. [Google Scholar]
  13. Zhang, W.; Jin, M.S.; Zhang, S.P.; Chen, L.; Zhong, C.; Dong, L.N. Application of high resolution remote sensing data to ore-prospecting prediction in East Kunlun metallogenic belt. Remote Sens. Land Resour. 2016, 28, 8. [Google Scholar]
  14. Sun, Y.B.; Wang, R.J.; Wei, B.Z.; Wang, B.; Dong, S.F.; Li, C.J.; Li, M.S. The application of hyperspectral remote sensing ground-air integrated prediction method to the copper gold deposit prospecting in Kalatag area, Xinjiang. Geol. China 2018, 45, 14. [Google Scholar]
  15. Li, H.W.; Zhao, Y.H.; Fang, Z.; Zheng, L.; Zhu, Y.P. Application of remote sensing technology in prospecting and exploration of porphyry copper-gold deposits in Mina Pirquitas, Northwest Argentina. Geol. Bull. China 2023, 43, 582–593. [Google Scholar]
  16. Moradpour, H.; Paydar, G.R.; Pour, A.B.; Kamran, K.V.; Hossain, M.S. Landsat-7 and ASTER remote sensing satellite imagery for identification of iron skarn mineralization in metamorphic regions. Geocarto Int. 2020, 37, 1971–1998. [Google Scholar] [CrossRef]
  17. Mars, J.C. Mineral and Lithologic Mapping Capability of WorldView 3 Data at Mountain Pass, California, Using True- and False-Color Composite Images, Band Ratios, and Logical Operator Algorithms. Econ. Geol. Bull. Soc. Econ. Geol. 2018, 113, 1587–1601. [Google Scholar]
  18. Amraoui, T.; Ibouh, H.; Farah, A.; Bammou, Y.; Shebl, A. Remote sensing mapping of structural and hydrothermal alteration in the mougueur inlier, Eastern high atlas, Morocco. Sci. Rep. 2025, 15, 14982. [Google Scholar] [CrossRef]
  19. Zhong, F.J.; Pan, J.Y.; Liu, X.S.; Zhang, Y.; Liu, G.Q.; Liu, Y. A Metallogenic Model Based on Comprehensive Information and Genesis Analysis for the Houerdaogou Copper-Gold Deposit in Inner Mongolia. Geol. Explor. 2014, 3, 432–444. [Google Scholar]
  20. Gao, K.; Duo, J.; Tang, J.X.; Zhang, Z.; Song, J.L.; Ding, S.; Song, Y.; Lin, B.; Feng, J. Alteration of Naruo Porphyry Cu (Au) Deposit in the Duolong Ore-concentration Area, Tibet. Bull. Mineral. Petrol. Geochem. 2016, 35, 1226–1237. [Google Scholar]
  21. Li, K.; Wang, G.W.; Chen, Y.Q.; Hao, Y.L.; Ma, M.; Zhu, Y.Y. The application of comprehensive geological information of remotesensing and metallogenic model to the prognosis of porphyry copper-gold deposits in Papua New Guinea. Geol. Bull. China 2015, 34, 6. [Google Scholar]
  22. Farahbakhsh, E.; Goel, D.; Pimparkar, D.; Muller, R.D.; Chandra, R. Convolutional neural networks for mineral prospecting through alteration mapping with remote sensing data. Remote Sens. Geoinf. Sci. 2025, 93, 379–400. [Google Scholar] [CrossRef]
  23. Wang, Q.; Tang, J.X.; Chen, Y.C.; Hou, J.F.; Li, Y.B. Mineralization Model and Exploration Directions of the Tibet Duolong Super-Large Copper (Gold) Mineralization District. Acta Petrol. Sin. 2019, 35, 18. [Google Scholar]
  24. Rajesh, H.M. Application of remote sensing and GIS in mineral resource mapping—An overview. J. Mineral. Petrol. Sci. 2004, 99, 83–103. [Google Scholar] [CrossRef]
  25. Booysen, R.; Gloaguen, R.; Lorenz, S.; Zimmermann, R.; Nex, P.A.M. The Potential of Multi-Sensor Remote Sensing Mineral Exploration: Examples from Southern Africa. In Proceedings of the IEEE International Symposium on Geoscience and Remote Sensing (IGARSS), Yokohama, Japan, 28 July–2 August 2019. [Google Scholar]
  26. Booysen, R.; Zimmermann, R.; Lorenz; Gloaguen, R.; Mckel, R. Towards Multiscale and Multisource Remote Sensing Mineral Exploration Using RPAS: A Case study in the Lofdal Carbonatite-Hosted REE Deposit, Namibia. Remote Sens. 2019, 11, 2500. [Google Scholar] [CrossRef]
  27. Sikakwe, G.U. Mineral exploration employing drones, contemporary geological satellite remote sensing and geographical information system (GIS) procedures: A review. Remote Sens. Appl. Soc. Environ. 2023, 31, 100988. [Google Scholar] [CrossRef]
  28. Lei, L.; Jun, Z.; Dong, J.; Dafang, Z.; Lamin, M.; Bing, Z. Targeting Mineral Resources with Remote Sensing and Field Data in the Xiemisitai Area, West Junggar, Xinjiang, China. Remote Sens. 2013, 5, 3156–3171. [Google Scholar]
  29. Gerel, O.; Pirajno, F.; Batkhishig, B.; Dostal, J. Mineral Resources of Mongolia; Springer: Singapore, 2021; Volume 461. [Google Scholar]
  30. Zhang, Q.H. Geography of Mineral Resources in Mongolia; Yellow River Publishing House: Zhengzhou, China, 2016. [Google Scholar]
  31. Roy, D.P.; Wulder, M.A.; Loveland, T.R.; Woodcock, C.E.; Zhu, Z. Landsat-8: Science and product vision for terrestrial global change research. Remote Sens. Environ. 2014, 145, 154–172. [Google Scholar] [CrossRef]
  32. Chen, Q.; Xia, J.; Zhao, Z.; Zhou, J.; Zhu, R.; Zhang, R.; Zhao, X.; Chao, J.; Zhang, X.; Zhang, G. Interpretation of hydrothermal alteration and structural framework of the Huize Pb–Zn deposit, SW China, using Sentinel-2, ASTER, and Gaofen-5 satellite data: Implications for Pb–Zn exploration. Ore Geol. Rev. 2022, 150, 105154. [Google Scholar] [CrossRef]
  33. Franks, S.; Rengarajan, R. Evaluation of Copernicus DEM and Comparison to the DEM Used for Landsat Collection-2 Processing. Remote Sens. 2023, 15, 2509. [Google Scholar] [CrossRef]
  34. Wang, Q.; Shi, W.; Li, Z.; Atkinson, P.M. Fusion of Sentinel-2 images. Remote Sens. Environ. 2016, 187, 241–252. [Google Scholar] [CrossRef]
  35. Sun, Y.; Tian, S.; Di, B. Extracting mineral alteration information using WorldView-3 data. Geosci. Front. 2017, 8, 1051–1062. [Google Scholar] [CrossRef]
  36. Zhang, B.; Zhang, Z.; Shuai, S.; Zhang, Y.M. Lithlogical Mapping by Using the Synergestic Landsat-8 and Worldview-2 Images. Geol. Sci. Technol. Inf. 2015, 34, 7. [Google Scholar]
  37. Ali, M.I.; Dirawan, G.D.; Hasim, A.H.; Abidin, M.R. Detection of Changes in Surface Water Bodies Urban Area with NDWI and MNDWI Methods. Int. J. Adv. Sci. Eng. Inf. Technol. 2019, 9, 946. [Google Scholar] [CrossRef]
  38. Zhao, Z.F. Research on Mineralization Remote Sensing Anomaly Information; Geological Publishing House: Beijing, China, 2008. [Google Scholar]
  39. Govil, H.; Gill, N.; Rajendran, S.; Santosh, M.; Kumar, S.J.O.G.R. Identification of new base metal mineralization in Kumaon Himalaya, India, using hyperspectral remote sensing and hydrothermal alteration. Ore Geol. Rev. J. Compr. Stud. Ore Genes. Ore Explor. 2018, 92, 271–283. [Google Scholar] [CrossRef]
  40. Wang, D.; Chen, J.; Dai, X. Extracting geological and alteration information and predicting antimony ore based on multisource remote sensing data in Huangyangling, Xinjiang. Front. Earth Sci. 2024, 12, 1366727. [Google Scholar] [CrossRef]
  41. Pan, Z.; Liu, J.; Ma, L.; Chen, F.; Zhu, G.; Qin, F.; Zhang, H.; Huang, J.; Li, Y.; Wang, J. Research on Hyperspectral Identification of Altered Minerals in Yemaquan West Gold Field, Xinjiang. Sustainability 2019, 11, 428. [Google Scholar] [CrossRef]
  42. Shebl, A.; Abdellatif, M.; Badawi, M.; Dawoud, M.; Fahil, A.S.; Csámer, A. Towards better delineation of hydrothermal alterations via multi-sensor remote sensing and airborne geophysical data. Sci. Rep. 2023, 13, 7406. [Google Scholar] [CrossRef]
  43. Bao, Q.; Yang, P.; Zhou, Z.; Lei, L.; Xia, Q.; Liu, Y.; Gong, Y.; Lu, J. Integrated application of alteration information from Landsat8-OLI remotesensing images and geochemical singularity anomaly information for the Shuiyuesi area of western Hubei Province. Geophys. Geochem. Explor. 2024, 48, 1302–1312. [Google Scholar]
  44. Khaleghi, M. Synergetic use of the Sentinel-2, ASTER, and Landsat-8 data for hydrothermal alteration and iron oxide minerals mapping in a mine scale. Acta Geodyn. Geomater. 2020, 17, 311–328. [Google Scholar] [CrossRef]
  45. Elbakhouch, N.; Ibouh, H.; Touil, A.; Chafiki, D. Structural and mineralogical mapping using multispectral satellite data (Aster, Landsat 8 OLI, and Sentinel 2B) combined with field work in the Western High Atlas, Morocco. Geologos 2024, 30, 119–136. [Google Scholar] [CrossRef]
  46. Eldosouky, A.M.; Eleraki, M.; Mansour, A.; Saada, S.A.; Zamzam, S. Geological controls of mineralization occurrences in the Egyptian Eastern Desert using advanced integration of remote sensing and magnetic data. Sci. Rep. 2024, 14, 16700. [Google Scholar] [CrossRef] [PubMed]
  47. Mami Khalifani, F.; Lentz, D.R.; Walker, J.A.; Khammar, F. Applying Mineral System Criteria to Develop a Predictive Modelling for Epithermal Gold Mineralization in Northern New Brunswick: Using Knowledge-Driven and Data-Driven Methods. Minerals 2025, 15, 345. [Google Scholar] [CrossRef]
Figure 1. Geographic location schematic: (a) location map of Mongolia in the world; (b) schematic of Mongolia’s boundaries; (c) Gobi–Altai Province is situated in the southwestern part of Mongolia, at the eastern foothills of the Altai Mountains; (d) location map of the Tsagaankhairkhan copper–gold district within Gobi–Altai Province; (e) Tsagaankhairkhan copper–gold deposit boundary map.
Minerals 15 01005 g001
Figure 2. Geological sketch of the Tsagaankhairkhan copper–gold mining area in Mongolia.
Minerals 15 01005 g002
Figure 3. Remote sensing geological structure interpretation result: (a) a certain scale of linear color lines or color boundary construction lines; (b) structural traces that are interrupted or abruptly changed along a certain interface; (c) structural lines characterized by varying widths, intermittent visibility, and discontinuous extension in linear imagery features; (d) circular structural lines with distinct shadow patterns, clear boundaries, and subtle small loops, where small loops are also developed within the larger loops; (e) geological structure interpretation diagram.
Minerals 15 01005 g003
Figure 4. Mineral reflection spectrum characteristics: (a) reflection spectrum characteristics of minerals containing hydroxyl groups; (b) reflection spectrum characteristics of minerals containing Fe2+ and Fe3+ ions.
Minerals 15 01005 g004
Figure 5. Hydroxyl alteration anomaly classification map of Sentinel-2 Data.
Minerals 15 01005 g005
Figure 6. Sentinel-2 data iron-staining alteration anomaly classification map.
Minerals 15 01005 g006
Figure 7. Comprehensive prediction of the mineralization target area delineation map.
Minerals 15 01005 g007
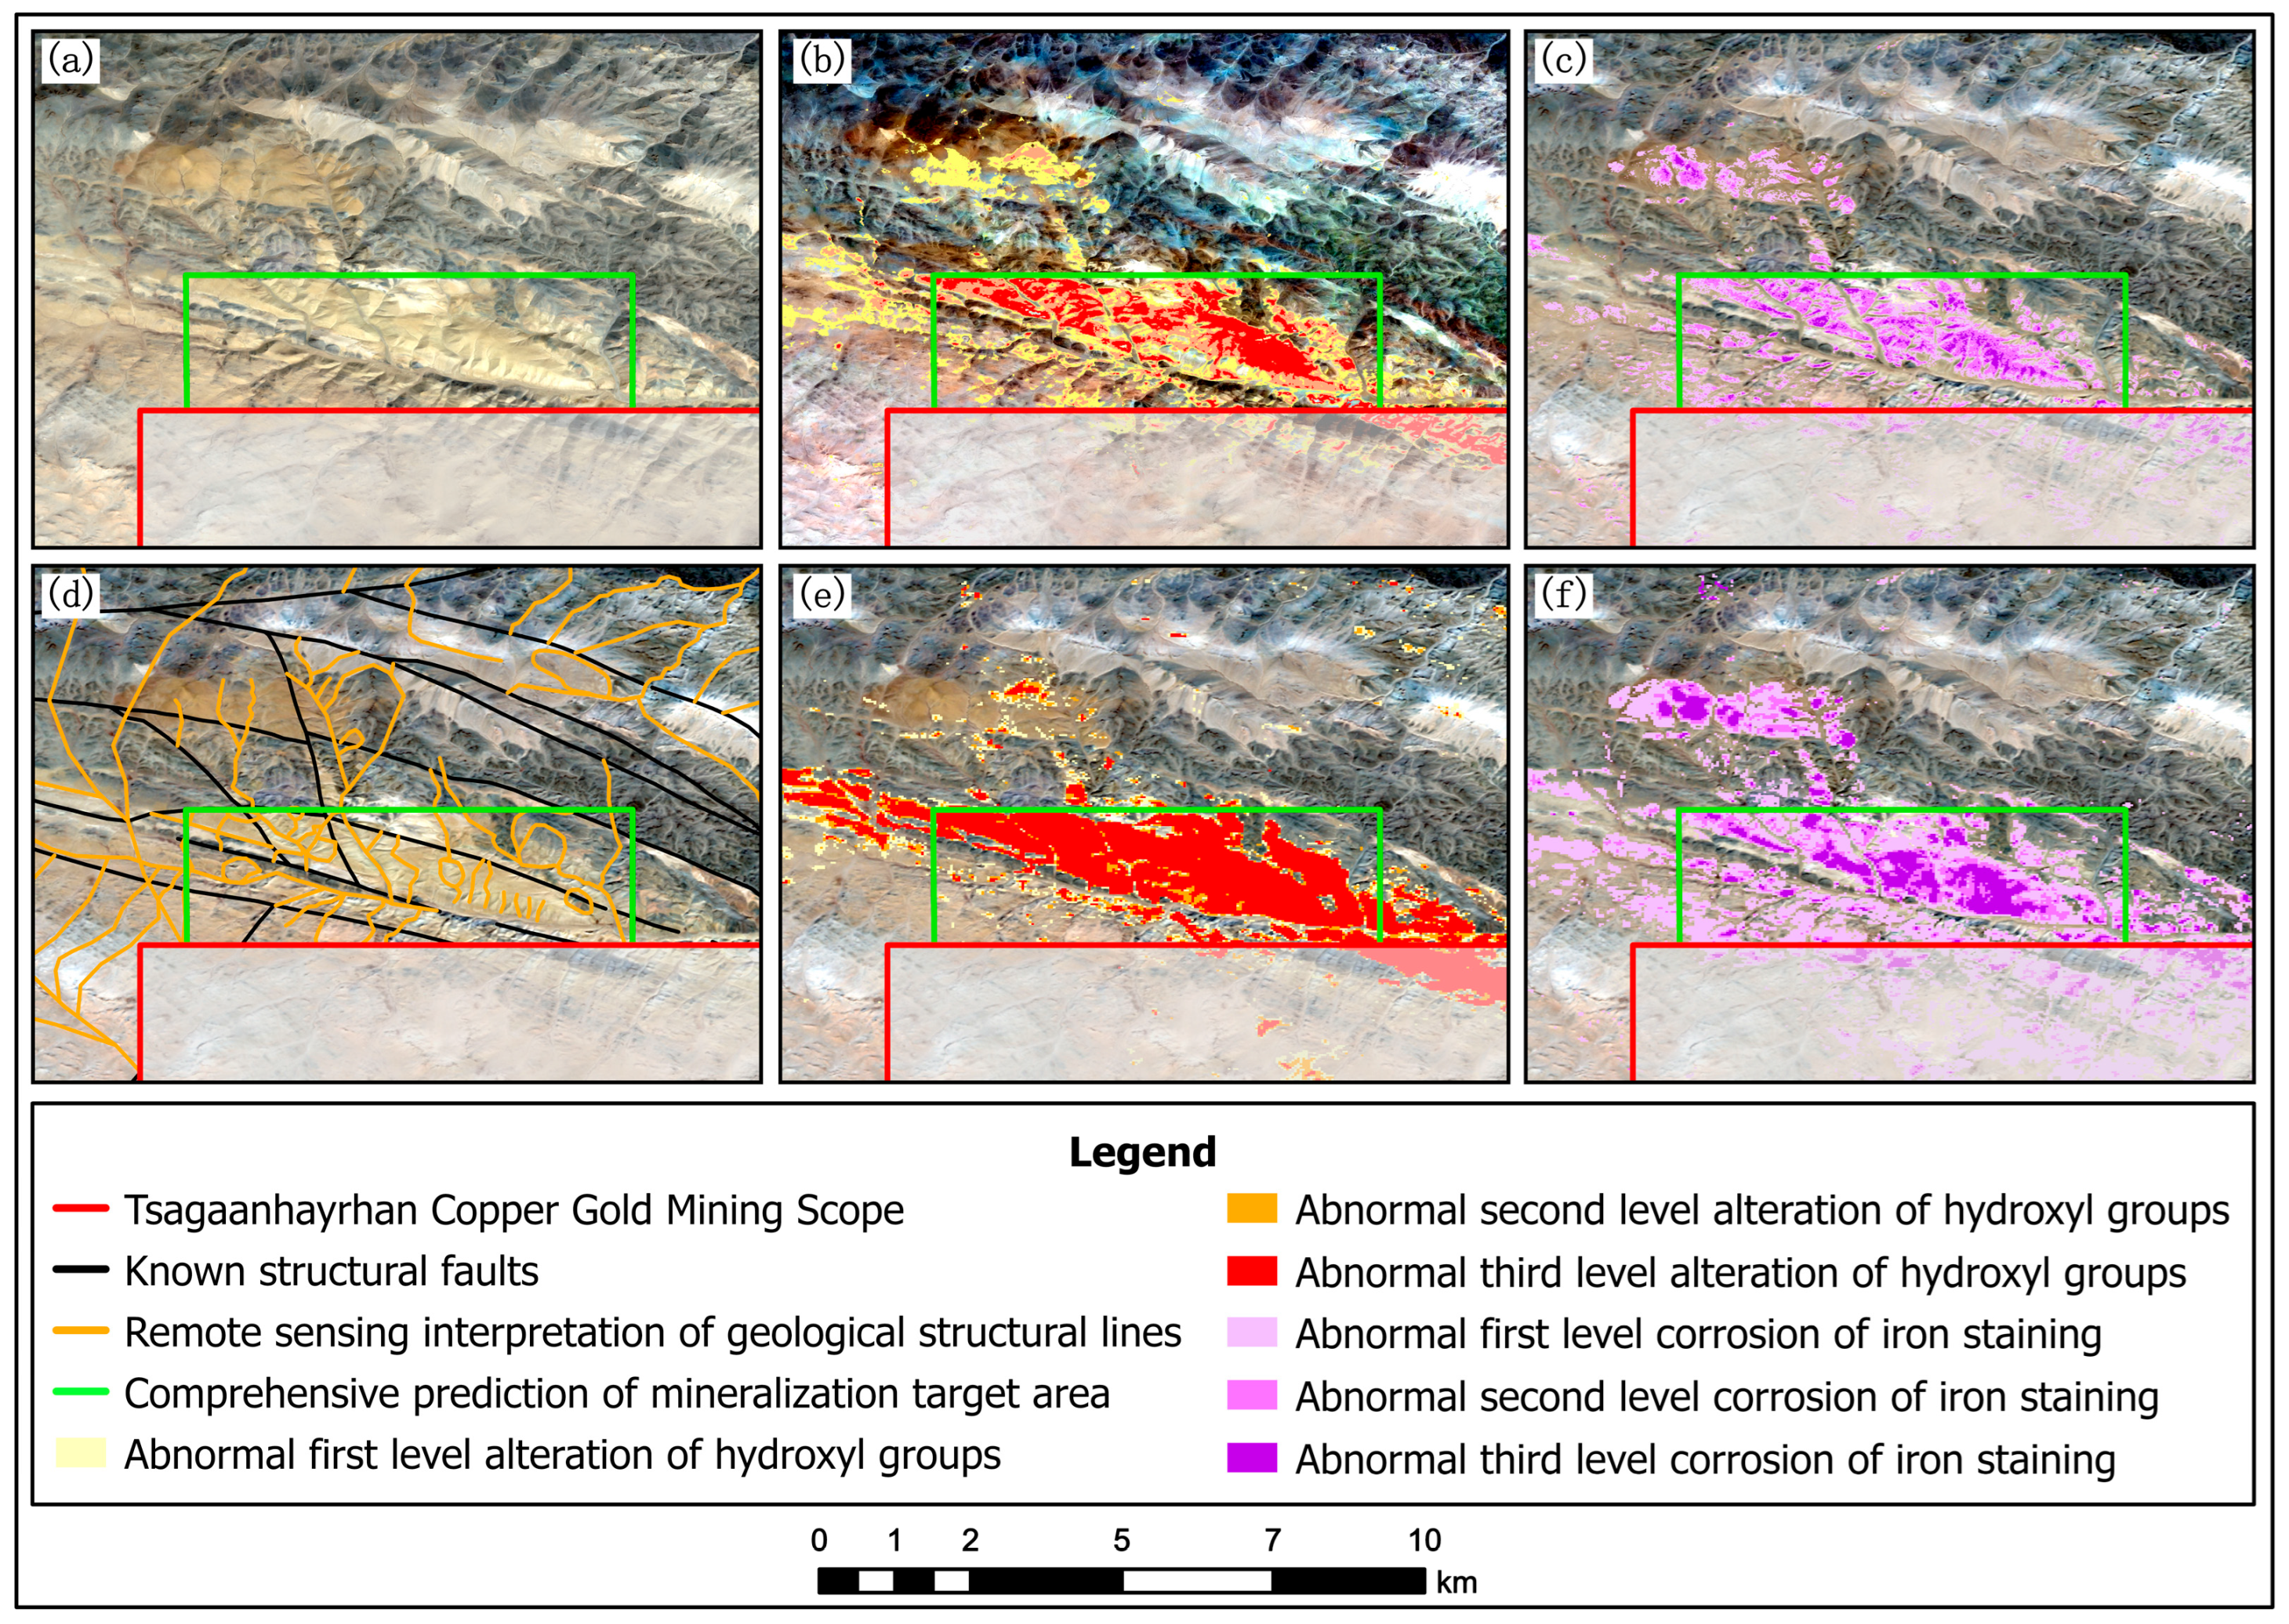
Figure 8. Mineralization prediction target area delineation map: (a) remote sensing image of the target area; (b) hydroxyl alteration anomaly information extracted from Sentinel-2 data for the target area; (c) iron-staining alteration anomaly information extracted from Sentinel-2 data for the target area; (d) geological structural lines interpreted from remote sensing data in the target area; (e) hydroxyl alteration anomaly information extracted from the target area based on Landsat-8 data; (f) iron-staining alteration anomaly information extracted from the target area based on Landsat-8 data.
Minerals 15 01005 g008
Figure 9. Field verification of mineralization points: (a) mineralization point in Target Area 1; (b) mineralization point in Target Area 3; (c) mineralization point in Target Area 4; (d) mineralization point in Target Area 5; (e,f) mineralization points in Target Area 7.
Minerals 15 01005 g009
Table 1. Landsat-8 satellite Data characteristics.
BandWavelength/μmResolution/mDetection Target
10.433~0.45330Mainly used for coastal zone observation
20.450~0.51530Used for water penetration, distinguishing soil vegetation, and identifying iron oxide in rocks
30.525~0.60030Vegetation growth status, distinguishing iron oxide rocks
40.630~0.68030In the chlorophyll absorption zone, used for observing bare soil, vegetation types, etc.
50.845~0.88530Estimating biomass, distinguishing wet soil, iron (III) oxide rocks, and concealed structures
61.560~1.66060Observing bare soil, water, identifying clouds and snow, and mineralization alteration zones
72.100~2.30030Rock types and hydrothermal alteration of rocks, identifying vegetation cover, and moist soil
80.500~0.6801515 m resolution, used to enhance resolution
91.360~1.39030Includes strong absorption features of water vapor that can be used for cloud detection
Table 2. GF2 satellite data characteristics.
Band NumberWavelength (μm)Resolution (m)Main Application
B1 (Blue)0.45–0.524Enabling joint extraction of lithology, structures and alteration zones: the blue band detects iron stains, green–red banding discriminates carbonate/silicified zones, and the NIR band quantitatively inverts OH/Fe3+ anomalies through vegetation; the panchromatic image finely traces faults, ring structures and mining facilities, supplying high-resolution “spatial–spectral” synergy for regional geological mapping, mineral prospecting and mine-environment monitoring.
B2 (Green)0.52–0.594
B3 (Red)0.63–0.694
B4 (NIR)0.77–0.894
Pan0.45–0.901
Table 3. Sentinel-2 satellite data characteristics.
Band NumberBandCentral Wavelength (μm)Band Width (nm)Spatial Resolution (m)
B1Coastal0.4432060
B2Blue0.496510
B3Green0.563510
B4Red0.66530100
B5Red edge 10.7051520
B6Red edge 20.741520
B7Red edge 30.7832020
B8NIR 10.84211510
B8ANIR 20.8652020
B9Water vapor0.9452060
B10Cirrus1.3752060
B11SWIR 11.613020
B12SWIR 22.199020
Table 4. Information of each band after resampling Sentinel-2 Data.
Original Band NameFused Band NameCentral Wavelength (μm)
B2B10.492
B3B20.559
B4B30.665
B8B40.833
B5B50.704
B6B60.739
B7B70.780
B8AB80.864
B11B91.610
B12B102.185
B1B110.442
B9B120.943
Table 5. Band correlation analysis.
BandB1B2B3B4B5B6B7
B11.0000000.9907010.9352070.8771000.6556760.5490660.564751
B20.9907011.0000000.9655410.9105660.6827250.5839130.603143
B30.9352070.9655411.0000000.9773910.7575750.6897610.708918
B40.8771000.9105660.9773911.0000000.7824930.7581820.780890
B50.6556760.6827250.7575750.7824931.0000000.8414400.701060
B60.5490660.5839130.6897610.7581820.8414401.0000000.942841
B70.5647510.6031430.7089180.7808900.7010600.9428411.000000
Table 6. Principal component transformation characteristic matrix for hydroxyl anomaly extraction from Sentinel-2 and Landsat-8 data.
Principal ComponentSentinel-2Landsat-8
B1B4B9B10B2B5B6B7
PC1−0.283534−0.484900−0.598561−0.5711440.1432280.5317850.650787−0.571144
PC2−0.395017−0.6943710.2127920.5626110.026235−0.7600820.1000970.562611
PC3−0.7492730.2773310.478221−0.3646680.9488020.050079−0.304368−0.364668
PC4−0.4496230.453662−0.664230.4735830.280307−0.3700970.688344−0.557349
Table 7. Principal component transformation feature matrix for iron-staining anomaly extraction from Sentinel-2 and Landsat-8 data.
Principal ComponentSentinel-2Landsat-8
B2B4B5B6B1B3B4B9
PC10.1702590.3706440.5912660.6957290.3107140.4535580.5318450.644114
PC20.5781390.700571−0.143214−0.3929950.5393220.4803070.103571−0.683893
PC30.1329410.066270−0.7859860.6001340.575345−0.002814−0.7443260.339027
PC4−0.7868250.606162−0.110087−0.036818−0.5306200.750721−0.3903750.049672
Table 8. Principal component standard deviation analysis table of hydroxyl alteration anomalies.
Data SourceBasic StatsMinMaxMeanStdDev
Sentinel-2PC1−13,546.7919926485.5551760.0000071859.010608
PC2−10,670.9902344966.9853520.000000246.592075
PC3−5088.9365232604.841797−0.000000205.832515
PC4−2118.5803222874.139893−0.00000099.489587
Landsat-8PC1−0.4277350.500932−0.0000000.092147
PC2−0.1819580.088208−0.0000000.020891
PC3−0.1845280.201090−0.0000000.017550
PC4−0.0564030.0947490.0000000.008028
Table 9. Hydroxyl alteration anomaly level classification.
Data SourceHydroxyl Alteration Anomaly LevelThreshold Segmentation
Sentinel-2No anomalyMinimum value~411.66503
First-level anomaly411.66503~514.5812875
Second-level anomaly514.5812875~617.497545
Third-level anomaly617.497545~Maximum Value
Landsat-8No anomalyMinimum Value~0.016056
First-level anomaly0.016056~0.02007
Second-level anomaly0.02007~0.024084
Third-level anomaly0.024084~Maximum Value
Table 10. Principal component standard deviation analysis table of iron-staining alteration anomalies.
Data SourceBasic StatsMinMaxMeanStdDev
Sentinel-2PC1−5995.79687515,263.517580.0000081715.217977
PC2−4457.88378911,560.53613−0.000000257.053817
PC3−3703.6518552205.008545−0.000000154.864138
PC4−3375.3178711188.8176270.00000082.488428
Landsat-8PC1−0.3931990.5257730.0000000.084746
PC2−0.1526020.199421−0.000000.025958
PC3−0.1492780.0939290.0000000.015022
PC4−0.0917570.1224010.0000000.005618
Table 11. Iron-staining alteration anomaly level classification.
Data SourceHydroxyl Alteration Anomaly LevelThreshold Segmentation
Sentinel-2No anomalyMinimum Value~126.732642
First-level anomaly126.732642~168.976856
Second-level anomaly168.976856~211.22107
Third-level anomaly211.22107~Maximum Value
Landsat-8No anomalyMinimum Value~0.008427
First-level anomaly0.008427~0.011236
Second-level anomaly0.011236~0.014045
Third-level anomaly0.014045~Maximum Value
Disclaimer/Publisher’s Note: The statements, opinions and data contained in all publications are solely those of the individual author(s) and contributor(s) and not of MDPI and/or the editor(s). MDPI and/or the editor(s) disclaim responsibility for any injury to people or property resulting from any ideas, methods, instructions or products referred to in the content.