Article

First Report of Fluorescent Sodalite from the Ditrău Alkaline Massif, Romania: A Mineralogical and Spectroscopic Investigation

by
Andrei Ionuț Apopei
* and
Dan Aștefanei
Department of Geology, Faculty of Geography and Geology, “Alexandru Ioan Cuza” University of Iaşi, 700505 Iaşi, Romania
*
Author to whom correspondence should be addressed.
Minerals 2025, 15(10), 1006; https://doi.org/10.3390/min15101006
Submission received: 13 August 2025 / Revised: 16 September 2025 / Accepted: 19 September 2025 / Published: 23 September 2025

Abstract

Sodalite is a common feldspathoid in alkaline systems, with some varieties exhibiting notable fluorescence due to impurity activators. This study reports the first documented occurrence and characterization of fluorescent sodalite from the classic Ditrău Alkaline Massif, Romania, where its optical properties were previously undescribed. Sodalite-bearing syenite samples from different perimeters of the massif were investigated using macroscopic UV fluorescence, petrographic microscopy, and vibrational spectroscopy (Raman and FT-IR). The sodalite occurs as a late-stage, interstitial and poikilitic mineral, often associated with alteration to cancrinite. Under long-wave UV (365 nm) light, it exhibits spatially variable fluorescence, from absent in parts of the western Prişca perimeter to strong, uniform orange in the eastern Aurora perimeter. Raman and FT-IR spectroscopy confirmed the mineral’s identity and revealed subtle spectral variations, particularly the presence of a minor cancrinite component in some analyses. The vibrant orange fluorescence is consistent with activation by disulfide radical anion ( S 2 · ) activators, formed in the sulfur- and chlorine-rich late-stage fluids characteristic of the massif’s evolution. The geographic variation in fluorescence intensity serves as a potential indicator of the geochemical heterogeneity of these fluids across the massif, linking the strongest fluorescence to the most evolved portions of the igneous complex. This finding opens a new avenue for using fluorescence as a tool for petrogenetic investigation in this classic locality.

1. Introduction

Sodalite-group minerals are feldspathoids characteristic of silica-undersaturated alkaline magmatic systems [1,2]. Their crystal structure consists of a framework of alternating AlO4 and SiO4 tetrahedra, forming cubo-octahedral cavities known as β-cages [3,4]. These cages encapsulate extra-framework cations (typically Na+) and anions (e.g., Cl, SO42−, S2−) that can act as chromophores or luminescence activators [5,6,7,8]. Sodalite is a characteristic mineral of alkaline magmatism, forming in rocks such as nepheline syenites either as a primary magmatic phase or as a late-stage hydrothermal/metasomatic product [9,10], often indicating volatile-rich conditions during the final stages of magma evolution [11,12].
Certain varieties of sodalite are renowned for their remarkable optical properties, including fluorescence (photoluminescence) and tenebrescence (reversible photochromism). Hackmanite, a sulfur-bearing variety of sodalite, is the most famous example, capable of changing color from white to purple or pink upon exposure to ultraviolet (UV) radiation, a phenomenon that fades upon exposure to visible light [13,14]. This tenebrescence is primarily caused by the formation of F-centers, which are electrons trapped at chlorine anion vacancies, with sulfur species acting as the essential electron donors for the process [5,7,15].
The fluorescence of sodalite-group minerals is equally significant and is strongly linked to the presence of specific chemical activators within the β-cages. The most characteristic and intensely studied emission is an orange to yellow-orange fluorescence observed under UV excitation. The fluorescence of sodalite has been reported since the early 20th century [16]. This luminescence is widely attributed to the disulfide radical anion ( S 2 · ) acting as the primary activator [1,3,17,18]. Other impurities can produce different colors, such as red luminescence from Fe3+, yellow from Mn2+, and blue from framework-related oxygen defects [7,15,19]. This phenomenon has gained popular attention through recent discoveries like “Yooperlites”, a fluorescent sodalite-bearing syenite pebbles from Michigan, USA, which exhibit a striking orange fluorescence under UV light [20,21].
A classic European locality for such alkaline rocks is the Ditrău Alkaline Massif (DAM) in the Eastern Carpathians, Romania. However, despite the detailed petrological and geochemical investigation of the DAM and the known occurrence of sodalite within it [22,23], a review of the available literature indicates that its optical properties, particularly any potential fluorescence or tenebrescence, have not been previously documented. This absence is underscored by early investigations into the massif’s fluorescent minerals. Notably, Brana [24], reporting on work from 1958, used a UV lamp to search for fluorescent zircon in syenitic alluvium from Ditrău. While observing a white fluorescence on altered nepheline, he explicitly contrasted this with the typical orange-red fluorescence of sodalite, which was absent in his findings. The lack of any report of fluorescent sodalite, coupled with historical observations suggesting its absence, represents a significant gap in the mineralogical knowledge of this classic European massif.
Therefore, this study aims to provide the first detailed report on fluorescent sodalite from the Ditrău Alkaline Massif. The objectives of this paper are:
  • To document and describe the macroscopic (visible light and UV fluorescence) and microscopic features of newly discovered fluorescent sodalite samples.
  • To confirm the mineral’s identity and characterize its vibrational properties using Raman and Fourier-Transform Infrared (FT-IR) spectroscopy.
  • To interpret the origin of the observed fluorescence, infer the likely luminescence activators, and discuss their implications for the Ditrău Massif’s geological evolution.

2. Materials and Methods

The abbreviations of minerals reported in the present study follow the list approved by the International Mineralogical Association (IMA) Commission on New Minerals, Nomenclature and Classification (CNMNC) [25].

2.1. Geological Setting and Samples

The Ditrău Alkaline Massif (DAM) in the Eastern Carpathians, Romania, represents a classic European alkaline igneous complex. It is characterized by a diverse suite of rocks ranging from ultramafics and gabbros to syenites and nepheline syenites, formed in a continental rift setting during the Triassic period (Figure 1) [11,26,27]. While early models suggested a prolonged magmatic history, recent high-precision U–Pb dating indicates a shorter primary magmatic span clustering around ~230 Ma [27,28]. The massif has a complex history involving magma differentiation, crustal contamination, and significant late- to post-magmatic hydrothermal and metasomatic overprinting [10,29].
This late-stage activity involved the circulation of volatile-rich hydrothermal and metasomatic fluids, which caused widespread alteration and remobilization of elements [10]. Fluid inclusion studies have confirmed the presence of high-salinity, carbonate-rich aqueous fluids that exsolved from the crystallizing magma, playing a critical role in the formation of secondary minerals like sodalite and cancrinite [10,31]. It is within this context of pervasive late-stage fluid-rock interaction that the potential for sodalite to act as a tracer for fluid chemistry arises. Previous studies of the DAM have reported the presence of sodalite as an accessory mineral in altered nepheline syenites, where it occurs with cancrinite as a replacement product of nepheline [10,11,31].
The four syenite samples investigated in this study were collected from three different perimeters within the Ditrău Alkaline Massif, Romania, representing distinct parts of the igneous complex (Table 1). Sample D1 was sourced from an old quarry in the Prişca perimeter (western part), while sample D1bis was collected from a nearby, closed mining gallery in the same perimeter; sample D2 was collected as a boulder from an old quarry on the Teasc creek in the Jolotca perimeter (north-western part); and sample D3 was obtained from an outcrop in the Belcina valley in the Aurora perimeter (eastern part), a region considered to host the most evolved intrusions of the complex [28].

2.2. Macroscopic and Microscopic Analysis

Macroscopic images of the hand specimens were taken under visible light and long-wave ultraviolet (LW-UV) illumination. The UV source was a custom-built lamp equipped with a Luminus SBT-10X-UV LED (Convoy, Guangzhou, China) emitting a peak wavelength of 365 nm (UVA). The LED was driven at a current of 3000 mA, and a Wood’s glass filter was used to block extraneous visible light, ensuring pure UV illumination for fluorescence photography. Three-dimensional models of the samples were generated using photogrammetry techniques as described by Apopei [32,33].
Observation on thin sections was conducted using transmitted light polarized microscopy (BX51 Olympus, Tokyo, Japan), equipped with UMPlanFl objectives (5×, 10×, and 20×). A circular cross-polarized filter (λ = 137 nm) was used to quantify the texture (i.e., reduction in minerals extinction and intensity of the interference colors). In addition to standard photomicrographs, the entire thin sections were digitally scanned to create high-resolution interactive images, which are available in the Appendix A (Table A1).

2.3. Vibrational Spectroscopy

Raman spectra were obtained at room temperature with a Raman Spectrograph Horiba Jobin-Yvon RPA-HE 532 (Horiba Ltd., Kyoto, Japan) with a multichannel air-cooled (−70 °C) CCD detector, using a Nd-Yag laser 532 nm excitation source and a nominal power of 100 mW. Spectra were obtained in the spectral range between 210 and 3400 cm−1 with a spectral resolution of 3 cm−1. The Raman system includes a “Superhead” fiber optic Raman probe for non-contact measurements with a 50× LWD Olympus objective, NA = 0.50, WD = 10.6 mm, and FIB50/10M optical fiber. The laser spot diameter on the sample surface was approximately 2–3 μm (the minimum theoretical spot diameter is 1.3 μm). Sulfur and cyclohexane were used for the calibration. Analyses targeted clear, inclusion-free areas within the sodalite grains to avoid alteration products. To mitigate potential laser-induced damage, the power on the sample was tested by incrementally increasing it; no photochemical degradation was observed, even at 100% of the nominal power (i.e., 53.6 mW on the sample’s surface). Final spectra were therefore acquired using a laser power of 80%–100% of the nominal power to achieve a high signal-to-noise ratio. Each spectrum is the result of 30 to 60 acquisitions, with an exposure time ranging from 2 to 5 s per acquisition. Spectra manipulations consist of basic data treatment, such as smoothing adjustments and peak fitting (Lorentz function).
The mid-IR spectra were collected with a Bruker Vertex 70 (BRUKER Optic, GmbH, Ettlingen, Germany) Fourier-transform infrared (FT-IR) spectrometer with a spectral resolution of 2 cm−1 and a spectral range between 370 and 4000 cm−1. The measurements were performed at room temperature using the KBr pellet method. The pellets were prepared by mixing 100 mg of FT-IR grade KBr (Aldrich, Saint Louis, MO, USA) with 1 mg of the sample. The mixture was thoroughly ground in an agate mortar and pelletized in a 13 mm stainless steel die (SPECAC, Orpington, UK) at a force of 9 tons using a hydraulic press. Each spectrum represents the average of 10 scans acquired per sample. The infrared spectra were analyzed with OPUS 6.5 software, and for the resulting spectra, we chose the type of transmittance spectrum. The fitting procedure for the spectra was not used.

3. Results

3.1. Macroscopic Features

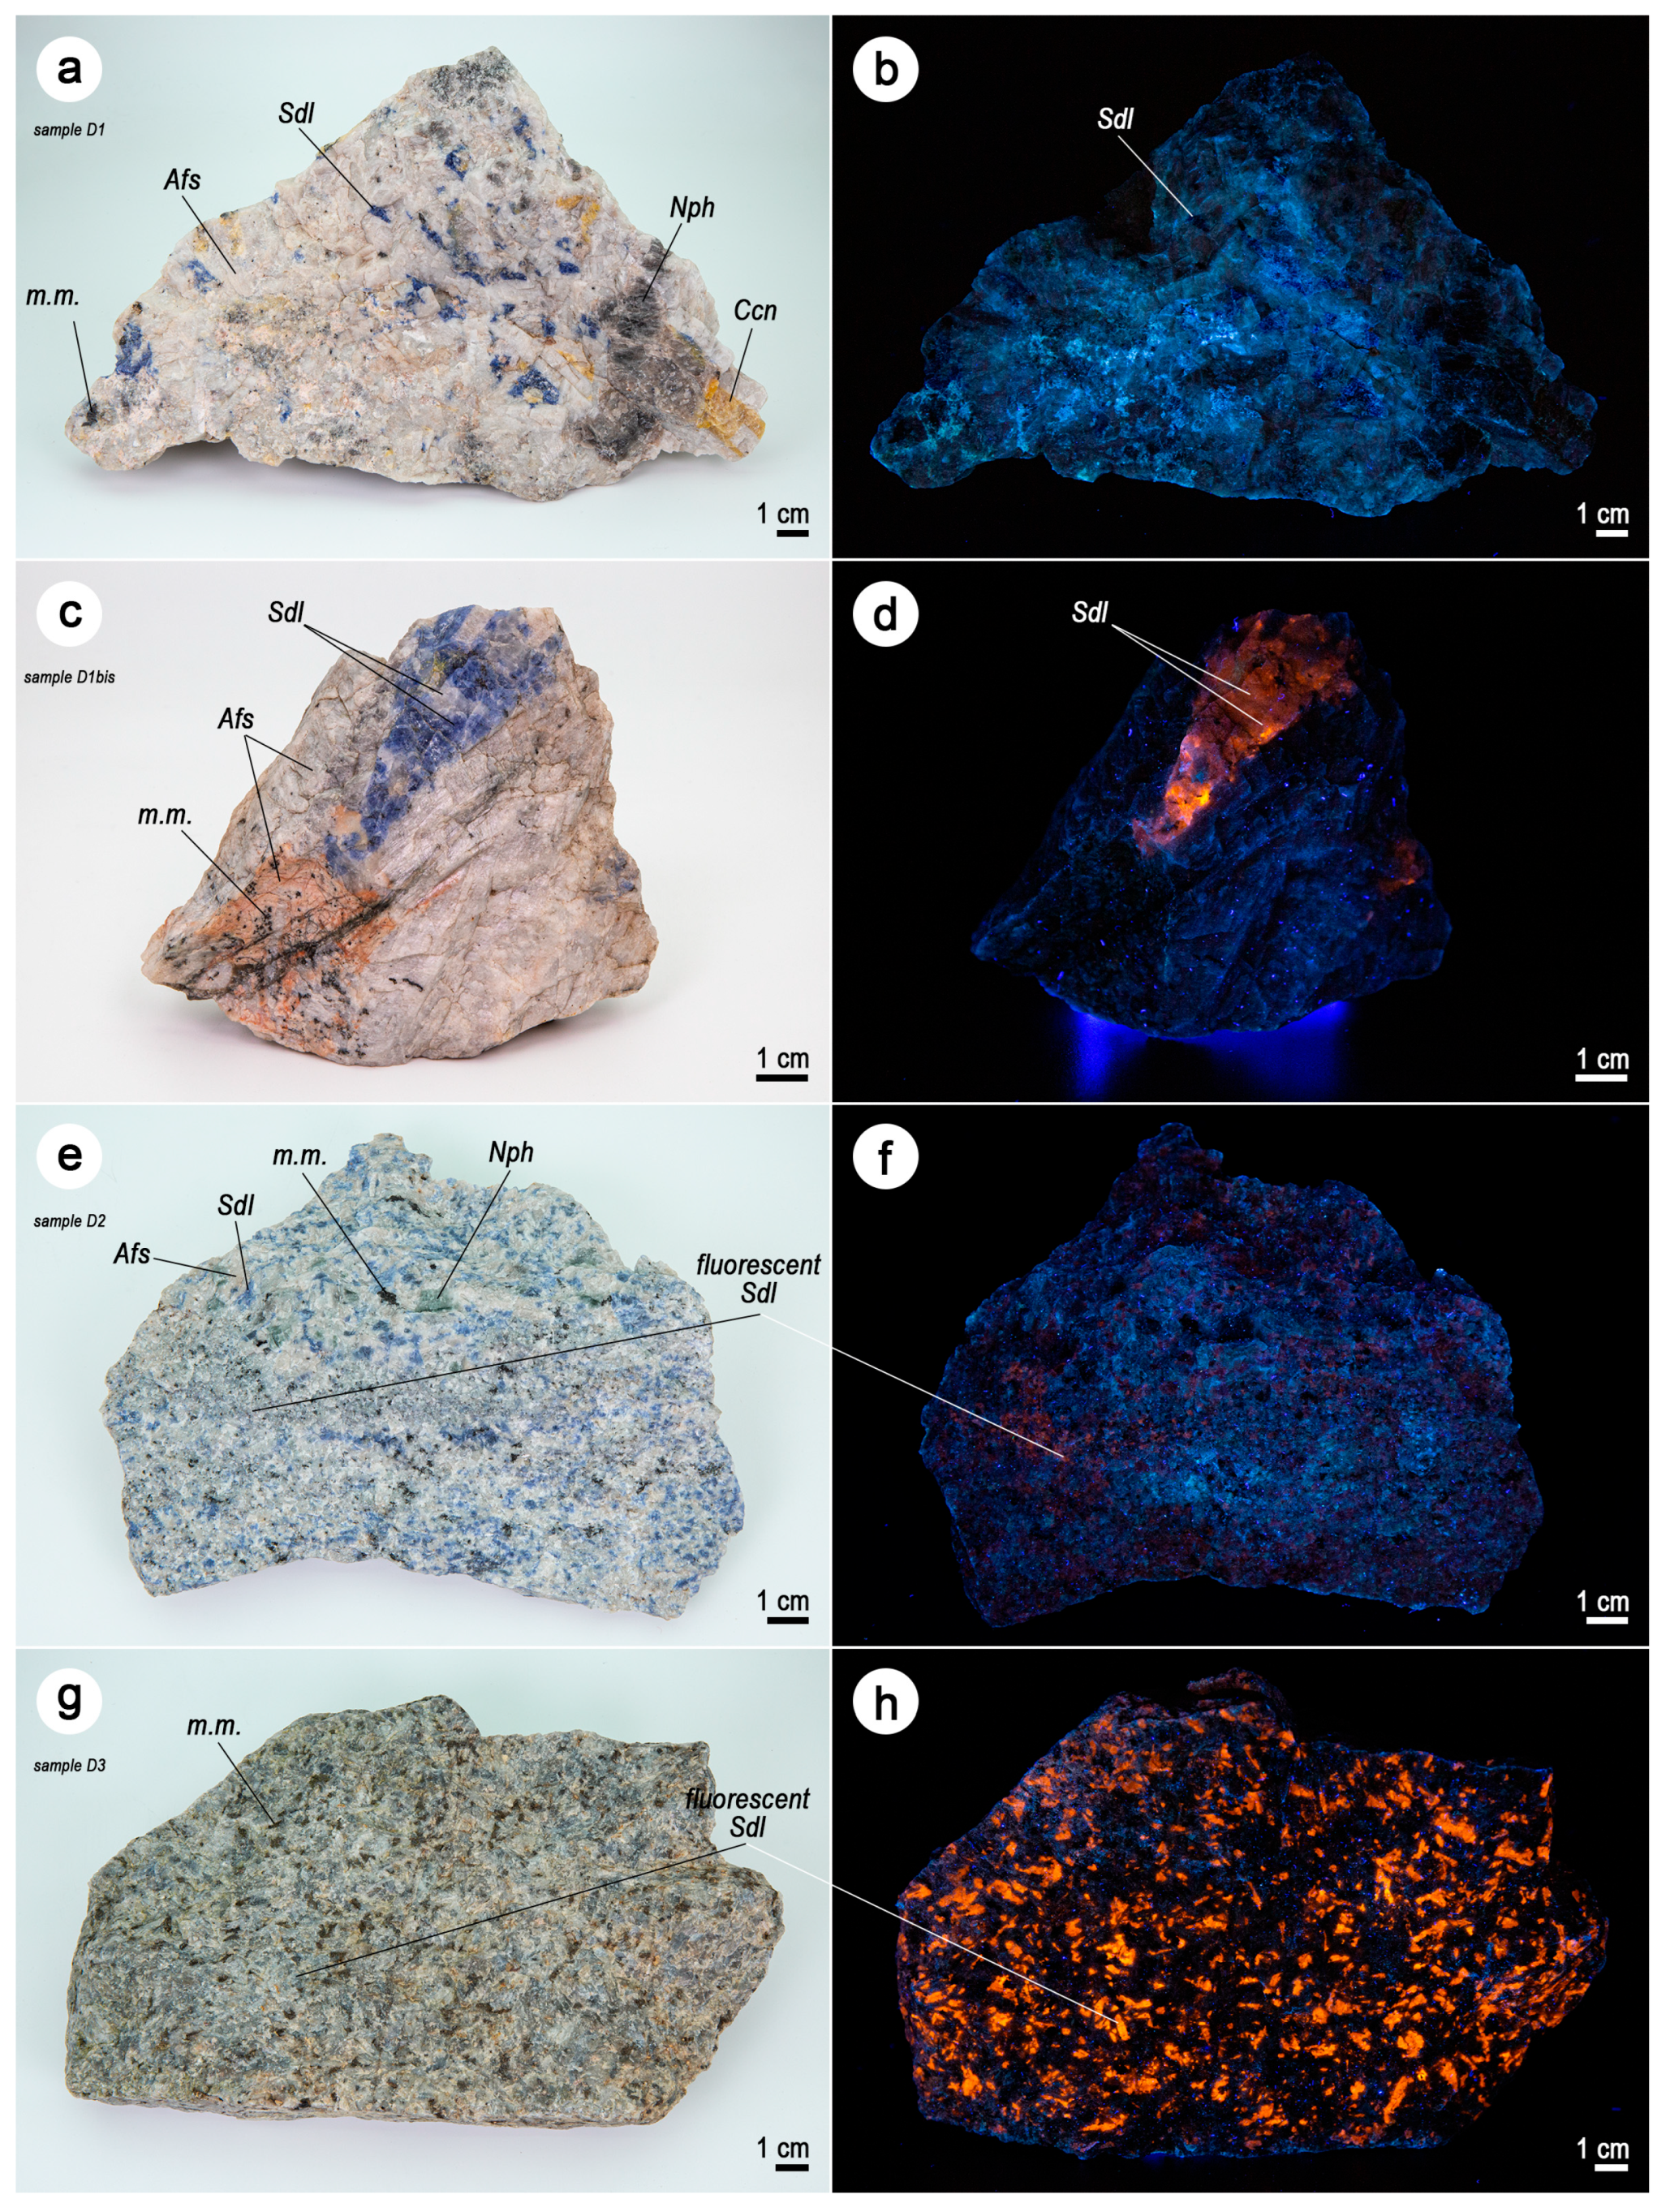
The four syenite samples investigated show distinct visual characteristics in both visible light and under long-wave ultraviolet (LW-UV) illumination (365 nm), as shown in Figure 2.
Sample D1, from a quarry in the Prişca perimeter (Ditrău valley), is a sub-pegmatitic nepheline syenite. In visible light (Figure 2a), it is composed of aggregates of blue sodalite (Sdl), white to grayish alkali feldspar (Afs) and nepheline (Nph), yellowish cancrinite (Ccn), and mafic minerals (m.m.). Under LW-UV illumination (Figure 2b), the blue sodalite shows no discernible fluorescence. Sample D1bis, from the same locality as D1, also has a sub-pegmatitic texture. It consists of prominent blue to light-bluish sodalite (Sdl) crystals associated with pinkish and white alkali feldspars (Afs) and mafic minerals (Figure 2c). In contrast to D1, both types of sodalite (i.e., blue and light-bluish) in this sample exhibit a strong, vibrant orange fluorescence under LW-UV light (Figure 2d).
Sample D2, from the Jolotca perimeter (Teasc creek), is a medium- to coarse-grained phaneritic nepheline syenite composed of blue sodalite (Sdl) disseminated among alkali feldspar (Afs), nepheline (Nph), and mafic minerals (Figure 2e). Under LW-UV light (Figure 2f), the sodalite grains show a weak-to-medium orange fluorescence.
Sample D3, from the Aurora perimeter (Belcina valley), is a medium- to coarse-grained phaneritic nepheline syenite. In visible light, the sodalite appears as grayish to light-bluish interstitial grains (Figure 2g). Under LW-UV illumination (Figure 2h), nearly all the sodalite grains exhibit a very strong and uniform orange fluorescence.

3.2. Petrographic Description

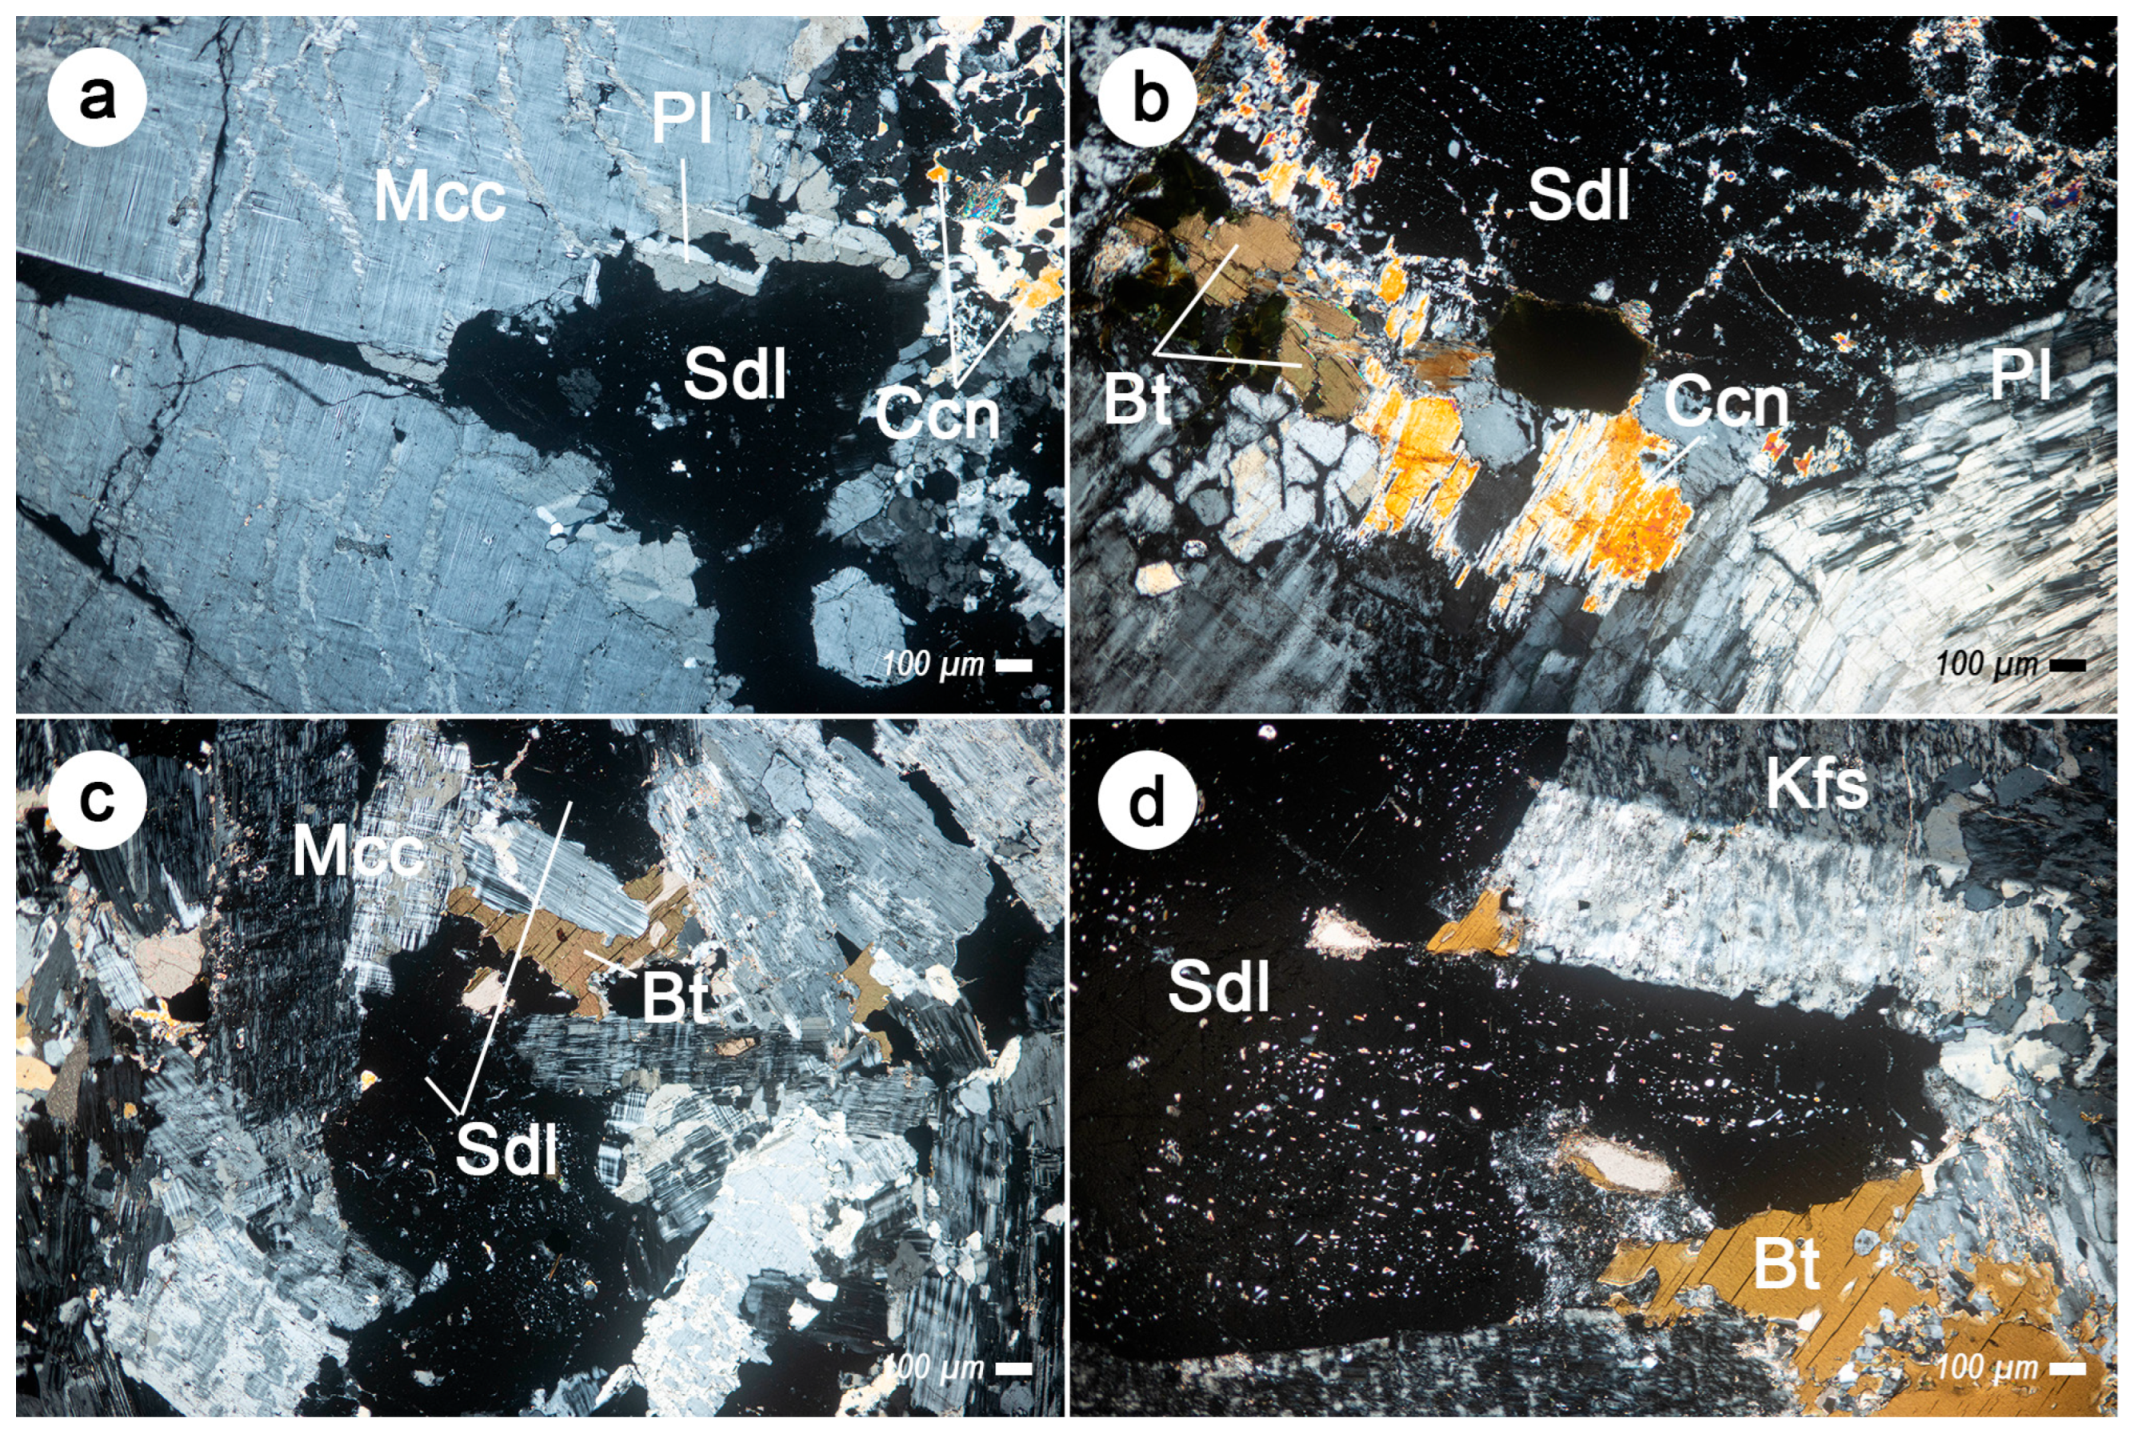
In transmitted polarized light, the samples show characteristic textures and mineral assemblages (Figure 3; Table A1).
Sample D1 (Figure 3a) is dominated by large, subhedral crystals of microcline (Mcc) that exhibit distinct perthite unmixing lamellae. Smaller plagioclase (Pl) crystals with polysynthetic twinning are also present. Sodalite (Sdl) and nepheline (Nph) occur as anhedral crystals in the interstitial spaces between the larger feldspars. The nepheline crystals often show a poikilitic texture, enclosing small accessory minerals. Alteration is common, with cancrinite (Ccn) forming rims at the boundaries of sodalite, nepheline, and alkali feldspars. Apatite and minor opaque minerals are present as accessories. Sample D1bis (Figure 3b) is texturally similar, with large alkali feldspar crystals showing a perthitic texture. Anhedral sodalite (Sdl) is associated with plagioclase (Pl), biotite (Bt), and rims of secondary cancrinite (Ccn). The sodalite crystals contain fine-grained accessory minerals that are concentrated along internal fractures. Opaque minerals are also present.
Sample D2 (Figure 3c) is characterized by interstitial sodalite (Sdl) occupying spaces between larger microcline (Mcc) feldspars. The primary mineral assemblage is associated with lesser amounts of biotite (Bt), nepheline, cancrinite, opaque minerals, and accessory titanite.
Sample D3 (Figure 3d) consists of a framework of large alkali feldspar crystals (Kfs) that display both perthitic textures and Carlsbad twinning. The sodalite (Sdl) in this sample is particularly notable, forming large, anhedral-to-subhedral crystals that exhibit a well-developed poikilitic texture, enclosing smaller, euhedral crystals of biotite (Bt). Other interstitial phases include nepheline, cancrinite, and accessory calcite. Similarly to sample D1, the nepheline here also contains poikilitically enclosed accessory minerals.

3.3. Raman Spectroscopy

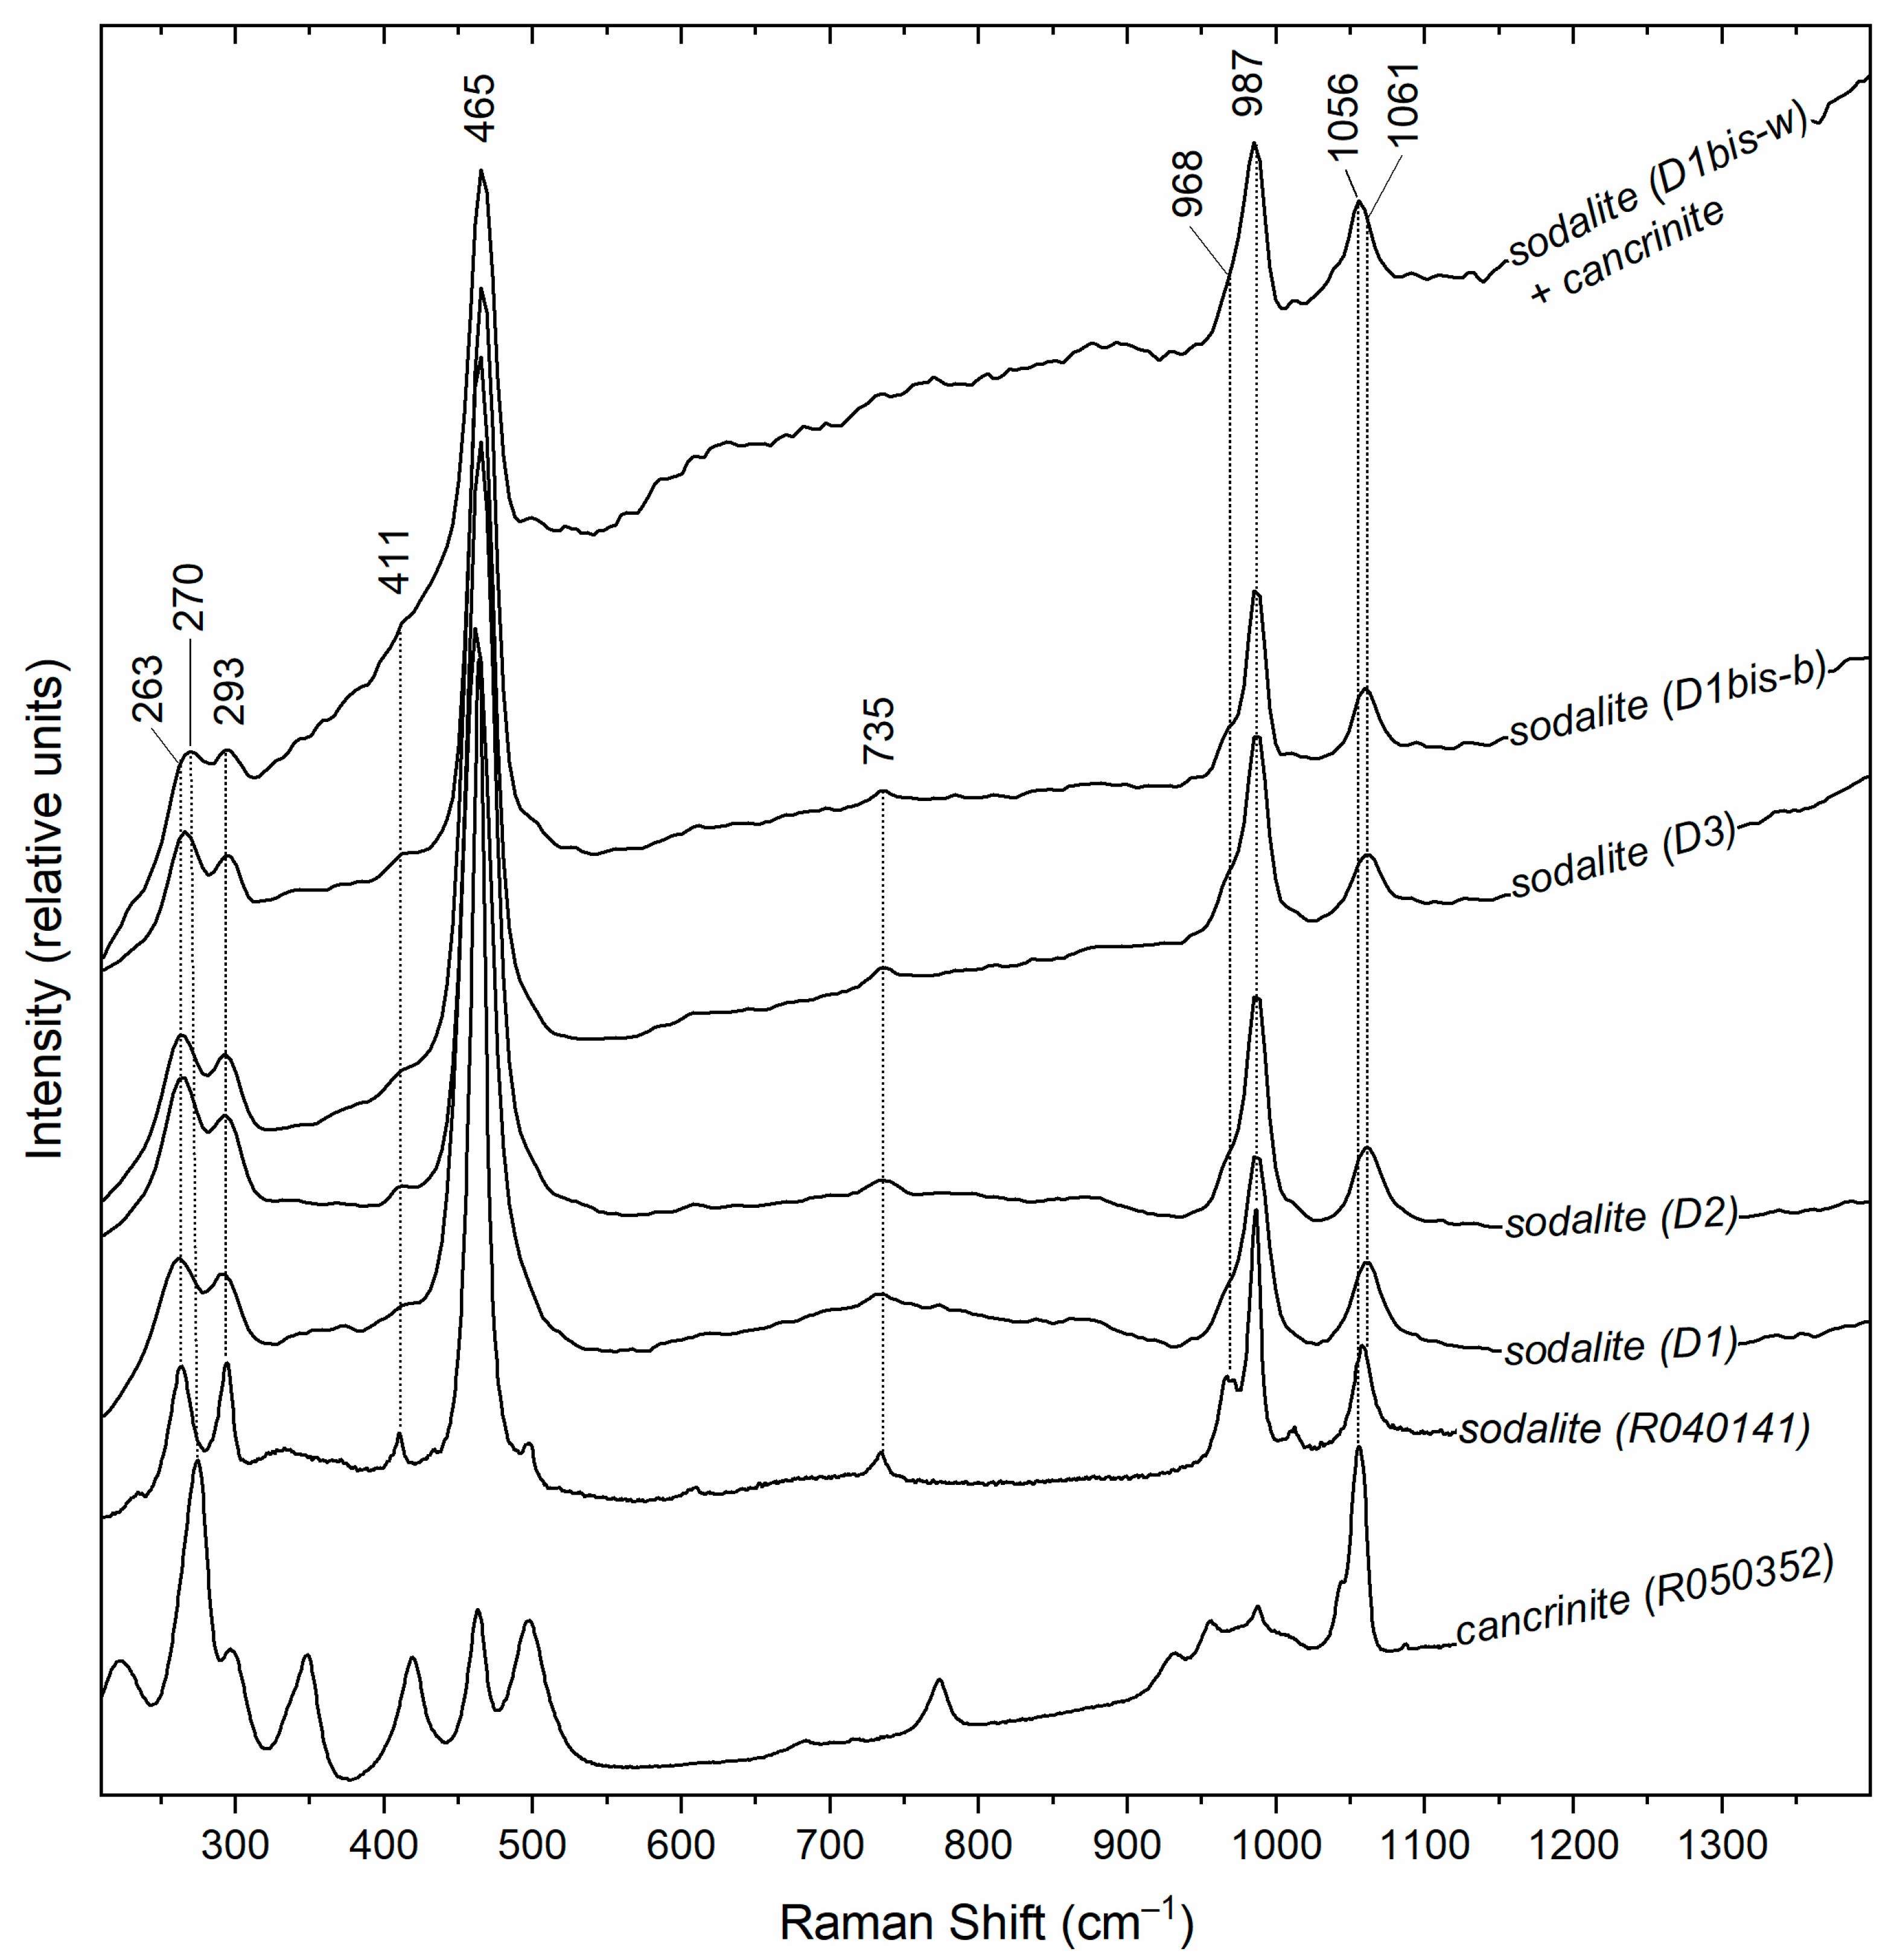
All Raman spectra display the characteristic signature of sodalite (Figure 4). For comparison, reference spectra of sodalite and cancrinite from the RRUFF database [34] are also plotted. They are dominated by a strong scattering band at 465 cm−1 and show a consistent pattern of other bands, including a medium-intensity peak at 987 cm−1 (with a shoulder, at 968 cm−1), and weaker peaks or shoulders at approximately 263, 293, 411, and 1061 cm−1. A very weak feature is also noted around 736 cm−1.
A detailed comparison of the two fluorescent varieties from sample D1bis reveals subtle but distinct spectral differences. The spectrum corresponding to the light-bluish sodalite (D1bis-w) shows minor peak shifts compared to the spectrum from the blue sodalite (D1bis-b). Specifically, the low-wavenumber peak at 263 cm−1 is shifted to 270 cm−1, and the high-wavenumber peak at 1061 cm−1 is shifted to 1056 cm−1 in the light-bluish variety.
The spectra of sodalite from samples D1, D2, and D3 are broadly similar to that of the blue sodalite variety (D1bis-b), showing no significant peak shifts.

3.4. FT-IR Spectroscopy

The FT-IR spectra for all sodalite samples are presented in Figure 5. All spectra show the characteristic transmittance bands for sodalite. They are dominated by a broad and very strong transmittance feature centered at 979 cm−1, with shoulders at approximately 1028 and 966 cm−1. The fingerprint region displays a series of well-defined bands, including a sharp, strong peak at 736 cm−1, a medium-intensity peak at 712 cm−1, and a strong peak at 668 cm−1. The low-wavenumber region contains medium-intensity bands at 465 and 437 cm−1 and a shoulder at 409 cm−1. Weaker features are also consistently observed near 623 and 575 cm−1. To aid in the interpretation of alteration-related features, a spectrum collected from a cancrinite-rich zone within sample D1bis is included for comparison.
Significant spectral differences are observed in the spectrum of the light-bluish sodalite (D1bis-w) compared to all other samples. In this spectrum, the peaks at 623 cm−1 and 575 cm−1 are notably sharper and well-resolved, whereas they appear as weak shoulders in the other spectra. Furthermore, several features appear only in the D1bis-w spectrum: a new shoulder is visible at approximately 763 cm−1, another shoulder appears at 688 cm−1, and the high-wavenumber shoulder is shifted from 1028 to 1034 cm−1.
The spectra for samples D1, D2, D3, and the blue sodalite from D1bis (D1bis-b) are all broadly similar to one another and lack the well-resolved features and additional shoulders seen in the D1bis-w spectrum.

4. Discussion

4.1. Vibrational Characteristics and Confirmation of Sodalite

The Raman and FT-IR spectra collected from all analyzed spots confirm the mineral’s identity as sodalite. The overall patterns and positions of the main vibrational bands are in excellent agreement with previously published data for natural and synthetic sodalite [1,9,15]. To facilitate a detailed analysis, the primary vibrational bands observed in the Raman and FT-IR spectra are assigned based on literature data in Table 2.
The spectra are dominated by bands corresponding to vibrations of the aluminosilicate framework. The most intense Raman peak at 465 cm−1 is assigned to symmetric T-O-T bending modes and vibrations of the [ClNa4]3+ extra-framework clusters [9,15]. The strong FT-IR transmittance band centered at 979 cm−1 and the medium-intensity Raman peak at 987 cm−1 correspond to the asymmetric νas(T-O-T) and symmetric ν1(T-O) stretching modes of the framework, respectively [35,36]. These features, along with the bands in the 650–750 cm−1 fingerprint region, unambiguously identify the mineral as sodalite.
We also note that our Raman analysis was conducted with a 532 nm laser. This wavelength is not optimal for inducing resonance with the S 2 · radical, which has an absorption maximum near 400 nm [37]. However, the 532 nm excitation is in resonance with the S 3 · radical, which exhibits a strong characteristic Raman peak at ~547 cm−1 [37]. The absence of this peak in our spectra allows us to rule out S 3 · as a significant species, indirectly supporting S 2 · as the more likely activator for the observed orange fluorescence.
Table 2. Vibrational band assignments for sodalite from the Ditrău Massif.
Observed Raman Peak (cm−1)Observed FT-IR Peak (cm−1)Assignment (Vibrational Mode)Reference(s)
263, 270, 293-Framework and [ClNa4]3+ cluster bending modes[1,9]
411409T-O-T/O-T-O framework bending[15,38]
-437T-O-T/O-T-O framework bending[35,39]
465465Symmetric T-O-T bending; [ClNa4]3+ cluster stretching[9,36]
-575, 623Cancrinite-like O-T-O bending; SO42−/S3 vibrations[35,40]
-668, 688Symmetric νs(T-O-T) stretching (fingerprint region)[35,41]
-712Symmetric νs(T-O-T) stretching (fingerprint region)[39,42]
736736, 763Symmetric νs(T-O-T) stretching (fingerprint region)[9,40]
968966Asymmetric/Symmetric T-O-T stretching[9,15]
987979Symmetric ν1(T-O)/Asymmetric νas(T-O-T) stretching[35,36]
1056, 10611028, 1034Asymmetric T-O stretching; possible CO32− contribution[9,43]

4.2. Interpretation of Spectral Variations

The vibrational spectra reveal that while all analyzed samples are sodalite, the light-bluish variety from sample D1bis (D1bis-w) is spectroscopically distinct. This difference is best explained by the presence of a minor but spectroscopically significant cancrinite component, an interpretation that is strongly supported by petrographic observations (Figure 3b) showing cancrinite forming as fine-grained alteration rims on sodalite crystals.
The influence of cancrinite is most apparent in the FT-IR spectrum of D1bis-w. The sharp, well-resolved peaks at 575 cm−1 and 623 cm−1, along with the appearance of new shoulders at 688 cm−1 and 763 cm−1, are all characteristic fingerprint bands of the cancrinite framework [35,40]. Because the FT-IR analysis was performed on a powdered KBr pellet, it is highly probable that fine-grained cancrinite from the alteration rims was included in the analyzed material, resulting in a mixed spectrum of both sodalite and cancrinite.
The subtle shifts observed in the Raman spectrum of the same D1bis-w variety (263 to 270 cm−1 and 1061 to 1056 cm−1) can also be attributed to this alteration process. The Raman signal originates unequivocally from the sodalite lattice; however, the positions of the vibrational bands are sensitive to the local structural environment. We interpret the observed minor peak shifts as arising from sodalite domains that are under localized lattice strain at the interface with the secondary cancrinite, which modifies T-O-T bond angles and leads to the observed spectral shifts [44]. This suggests the Raman analysis targeted a sodalite domain directly affected by this alteration.
Therefore, the unique spectral signature of the light-bluish sodalite (D1bis-w) is not indicative of a fundamentally different type of sodalite, but rather reflects the chemical and structural effects of incipient, late-stage alteration to cancrinite, a process directly observed in thin section.

4.3. The Origin and Variation of Fluorescence

It is important to state that the attribution of the orange fluorescence to the S 2 · radical in this study is based on a strong and consistent correlation established in decades of literature, rather than direct detection via methods like Electron Spin Resonance (ESR) or resonance Raman spectroscopy, which were unavailable for this work. The orange to yellow-orange luminescence is widely considered the characteristic fingerprint of S 2 · activators in sodalite [3,15,17,18,45].
The vibrant orange fluorescence observed in samples D1bis, D2, and D3 is a characteristic feature of sodalite activated by specific impurities within its crystal lattice. Based on extensive spectroscopic studies in the literature, this orange luminescence is unequivocally attributed to the presence of the disulfide radical anion ( S 2 · ) acting as a luminescence center within the sodalite β-cages [3,15,17,18]. The formation of this S 2 · activator requires the incorporation of sulfur into the sodalite structure during its growth in a suitable chemical environment.
The petrographic evidence provides a clear timeline for the creation of this environment. As observed in thin section (Figure 3), the interstitial and poikilitic texture of the sodalite provides clear evidence for its crystallization during the late stages of magma solidification, filling voids between pre-existing feldspar crystals. This strongly supports a secondary, hydrothermal/metasomatic origin rather than crystallization as an early primary magmatic phase. In alkaline magmatic systems like Ditrău, incompatible elements and volatiles, including sulfur and chlorine, are progressively excluded from the structure of crystallizing minerals and thus become concentrated in the residual melt and associated hydrothermal fluids [10,11]. This general model is strongly supported by specific geological and geochemical evidence from the Ditrău Massif itself. Crucially, fluid inclusion studies by Fall et al. [31] on nepheline from the Ditrău syenites identified primary, high-salinity aqueous fluids (20–40 wt.% NaCl equiv.) that exsolved from the magma at temperatures above 600 °C. These fluids were demonstrated to be rich in carbonate (evidenced by nahcolite daughter minerals) and sulfate, which was consumed during the alteration of nepheline to cancrinite [31]. Furthermore, extensive hydrothermal alteration linked to late-stage, volatile-rich potassic fluids that remobilized elements has been documented [10,28]. While comprehensive whole-rock data for volatiles is sparse, the reported presence of both sulfur (0.05 wt.%) and chlorine (0.02 wt.%) in a Ditrău nepheline syenite confirms the availability of these key elements in the bulk system [11]. This well-documented, sulfur- and chlorine-rich late-stage fluid environment provided the exact chemical ingredients for the formation of secondary sodalite via the reaction of nepheline with NaCl-rich fluids [7,46], and the subsequent formation of the disulfide radical anions ( S 2 · ) responsible for its vibrant fluorescence.
The variation in fluorescence intensity across the samples correlates with their geographic location within the Ditrău Alkaline Massif, suggesting a large-scale control by the magmatic and hydrothermal evolution of the complex. The most intense and uniform fluorescence is observed in sample D3 from the Aurora perimeter in the eastern part of the massif. This region is dominated by the most evolved nepheline syenites, where late-stage fluids would be expected to have the highest concentration of incompatible elements, including sulfur, leading to an optimal formation of S 2 · activators. In contrast, sample D2 from the north-western Jolotca perimeter shows a weaker fluorescence, suggesting a lower concentration of these S 2 · centers.
The most striking variation occurs in the western Prişca perimeter. Sample D1, collected from an open quarry, is entirely non-fluorescent, whereas sample D1bis, collected from a nearby closed mining gallery within the same perimeter, is strongly fluorescent. This proximity, on the scale of tens to hundreds of meters, quantitatively defines the “local scale” and highlights that in addition to any large-scale zoning, the late-stage fluid chemistry varied significantly. The lack of fluorescence in sample D1 is likely due to either a localized depletion of sulfur in the altering fluid or, more probably, the incorporation of quenching elements. Ferric iron ( F e 3 + ) is a well-documented inhibitor of S 2 · fluorescence in sodalite [3,7]. F e 3 + quenches fluorescence through two primary processes: (1) by competitive absorption of the UV excitation energy, as the O 2   F e 3 + charge transfer transition overlaps with the excitation bands of S 2 · , preventing the S 2 · centers from being excited [13], or (2) by acting as an electron trap ( F e 3 + +   e     F e 2 + ) or a center for non-radiative energy transfer, where an excited S 2 · center transfers its energy to a nearby F e 3 + ion, which then dissipates the energy as heat rather than light [13]. While a quantitative analysis is needed to confirm the presence and contribution of F e 3 + in our non-fluorescent samples, this explanation provides a chemically robust reason for the observed fluorescence heterogeneity. Distinguishing between these possibilities, or considering other factors like localized temperature or redox gradients, would require further detailed micro-analytical investigation.
While our samples show a compelling regional trend, the significant local-scale variation observed in the Prișca perimeter highlights the need for a more extensive and systematic sampling campaign across the massif to deconvolve local versus regional geochemical controls on fluorescence.
It is important to acknowledge the dual role of volatiles in this system. While sulfur acts as the luminescence activator, chlorine is an essential structural constituent of the host sodalite. The incorporation of sulfur often involves the substitution for chlorine and the creation of charge-balancing vacancies, which are themselves crucial for certain optical phenomena like tenebrescence [47,48]. Therefore, the resulting fluorescence is not controlled by sulfur availability alone, but by the coupled geochemistry of both sulfur and chlorine in the late-stage fluids. This spatial variation in fluorescence provides a new tool for tracing the geochemical heterogeneity of late-stage fluids within the Ditrău Alkaline Massif.

4.4. Comparison with Global Occurrences

The discovery of fluorescent sodalite in the Ditrău Alkaline Massif is best understood when placed in the context of other world-renowned occurrences. Globally, fluorescent sodalite-group minerals form in two primary geological settings: (1) within silica-undersaturated, alkaline igneous complexes and their associated pegmatites (e.g., [3,9]), and (2) in metasomatic rocks, typically marbles, that have been altered by alkali- and volatile-rich fluids (e.g., [9,13]). The Ditrău occurrence is a classic example of the first category.
The geological setting at Ditrău shows strong parallels to other major magmatic sodalite localities, most notably the Ilímaussaq alkaline complex in Greenland and the presumed source rock of the “Yooperlites” in Michigan, USA. In all these cases, the host rocks are silica-undersaturated and peralkaline (nepheline syenites or syenites), and the sodalite forms as a late-stage mineral [7,20]. The paragenesis is also strikingly similar: the sodalite crystallizes either from residual melts or, more commonly, through the hydrothermal or metasomatic alteration of earlier primary minerals like nepheline and albite by Na- and Cl-rich fluids [10,20]. The highly reduced, sulfide-rich environment described for Ilímaussaq is particularly analogous to the conditions required to form the sulfur-activated sodalite at Ditrău.
This magmatic-hydrothermal context contrasts sharply with the formation of gem-quality, tenebrescent hackmanite from localities like the Koksha Valley in Afghanistan. There, the sodalite-group minerals did not crystallize within an igneous intrusion but formed through the high-temperature metasomatism of carbonate host rocks (marble) by silica- and alkali-bearing fluids [49]. While the fundamental chemical ingredients are similar, this represents a distinct, contact-metamorphic pathway to forming fluorescent sodalite.
A similar metasomatic context is likely responsible for the famous tenebrescent hackmanite from Mogok, Myanmar. While the specific paragenesis is not detailed in the literature, the Mogok region is dominated by metamorphosed carbonate rocks, suggesting a formation environment analogous to that of Afghanistan [50]. The Myanmar material is particularly known for its strong photochromism (tenebrescence), a property not observed in the Ditrău samples, where a near-colorless state changes to purple upon UV exposure [8,50]. Despite these differences in geological setting and optical behavior, the underlying chemical control is consistent; the optical properties of Myanmar hackmanite are also fundamentally linked to the presence of sulfur within the sodalite structure, which is crucial for both its tenebrescence and fluorescence [8,50].
Ultimately, the formation of sulfur-activated fluorescent sodalite worldwide depends on a specific set of geological and geochemical requirements. The primary necessity is a silica-undersaturated and alkali-rich environment, which stabilizes sodalite over other feldspar minerals. Secondly, there must be a mechanism to concentrate volatiles, typically through the evolution of late-stage magmatic-hydrothermal fluids. Finally, these fluids must contain a sufficient supply of chlorine to be incorporated into the mineral’s framework and, crucially, sulfur to form the various radical anions (primarily S 2 · ) that act as luminescence activators [1,3]. The findings from the Ditrău Alkaline Massif align perfectly with this global model for magmatic occurrences, reinforcing its status as a classic, and now newly appreciated, locality for this fascinating optical phenomenon.

5. Conclusions

This study documents the first reported occurrence of fluorescent sodalite from the Ditrău Alkaline Massif, Romania. A multi-technique approach, combining macroscopic and microscopic observations with Raman and FT-IR spectroscopy, confirmed the mineral’s identity and established its paragenesis as a late-stage interstitial and poikilitic phase. The vibrant orange fluorescence, observed under long-wave UV light, is attributed to the presence of disulfide radical anion ( S 2 · ) activators, consistent with the late-stage, volatile-rich (S, Cl, Na) fluid environment known to exist during the final stages of the massif’s evolution. The distinct spatial variation in fluorescence intensity, from absent in the west to very strong in the more evolved eastern part of the massif, serves as a potential qualitative tracer for the heterogeneity of these late-stage fluids. This work adds a new dimension to the mineralogy of this classic alkaline complex and demonstrates the potential utility of fluorescence as a tool for petrogenetic investigation.

Author Contributions

Conceptualization, A.I.A. and D.A.; methodology, A.I.A. and D.A.; software, A.I.A.; validation, D.A.; formal analysis, A.I.A.; investigation, A.I.A. and D.A.; resources, D.A. and A.I.A.; data curation, D.A. and A.I.A.; writing—original draft preparation, A.I.A. and D.A.; writing—review and editing, A.I.A. and D.A.; visualization, A.I.A.; project administration, A.I.A. All authors have read and agreed to the published version of the manuscript.

Funding

This research received no external funding.

Data Availability Statement

The original contributions presented in this study are included in the article. Further inquiries can be directed to the corresponding author.

Conflicts of Interest

The authors declare no conflicts of interest.

Abbreviations

The following abbreviations are used in this manuscript:
DAMDitrău Alkaline Massif
FT-IRFourier-Transform Infrared
LW-UVLong-Wave Ultraviolet
UVUltraviolet

Appendix A

Table A1. Links to interactive 3D samples and the whole thin section scans.
Sample3D Sample URL 1Whole Thin Section Scan URL 1
Sample D1https://skfb.ly/p7NQThttps://macrockscopic.ro/public/ditrau/D1/
Sample D1bishttps://skfb.ly/pqAFHhttps://macrockscopic.ro/public/ditrau/D1bis/
Sample D2https://skfb.ly/p7NRDhttps://macrockscopic.ro/public/ditrau/D2/
Sample D3https://skfb.ly/p7NRMhttps://macrockscopic.ro/public/ditrau/D3/
1 URL’s accessed on 22 September 2025.

References

  1. Chukanov, N.V.; Aksenov, S.M. Structural features, chemical diversity, and physical properties of microporous sodalite-type materials: A review. Int. J. Mol. Sci. 2024, 25, 10218. [Google Scholar] [CrossRef]
  2. Deer, W.A.; Howie, R.A.; Zussman, J. Framework Silicates: Silica Minerals, Feldspathoids and the Zeolites; The Geological Society: London, UK, 2004. [Google Scholar]
  3. Zahoransky, T.; Friis, H.; Marks, M.A.W. Luminescence and tenebrescence of natural sodalites: A chemical and structural study. Phys. Chem. Miner. 2016, 43, 459–480. [Google Scholar] [CrossRef]
  4. Lezhnina, M.M.; Kynast, U.H. NIR- and upconverted luminescence from rare earth sodalites. Phys. Solid State 2005, 47, 1485–1488. [Google Scholar] [CrossRef]
  5. Chukanov, N.V.; Aksenov, S.M.; Rastsvetaeva, R.K. Structural chemistry, IR spectroscopy, properties, and genesis of natural and synthetic microporous cancrinite- and sodalite-related materials: A review. Microporous Mesoporous Mater. 2021, 323, 111098. [Google Scholar] [CrossRef]
  6. Kaiheriman, M.; Maimaitinaisier, A.; Rehiman, A.; Aierken, S. Photoluminescence properties of green and red luminescence from natural and heat-treated sodalite. Phys. Chem. Miner. 2013, 41, 227–235. [Google Scholar] [CrossRef]
  7. Finch, A.A.; Friis, H.; Maghrabi, M. Defects in sodalite-group minerals determined from X-ray-induced luminescence. Phys. Chem. Miner. 2016, 43, 481–491. [Google Scholar] [CrossRef]
  8. Blumentritt, F.; Fritsch, E. Photochromism and Photochromic Gems: A Review and Some New Data (Part 1). J. Gemmol. 2021, 37, 780–800. [Google Scholar] [CrossRef]
  9. Gritsenko, Y.D.; Eremina, E.N.; Vigasina, M.F.; Vyatkina, S.V.; Ogorodov, L.P.; Maltseva, V.V.; Melchakova, L.V. Sodalite: Spectroscopic and thermochemical investigations. Geochem. Int. 2023, 61, 735–743. [Google Scholar] [CrossRef]
  10. Honour, V.C.; Goodenough, K.M.; Shaw, R.A.; Gabudianu, I.; Hîrtopanu, P. REE mineralisation within the Ditrău Alkaline Complex, Romania: Interplay of magmatic and hydrothermal processes. Lithos 2018, 314–315, 360–381. [Google Scholar] [CrossRef]
  11. Morogan, V.; Upton, B.G.J.; Fitton, J.G. The petrology of the Ditrău alkaline complex, Eastern Carpathians. Mineral. Petrol. 2000, 69, 227–265. [Google Scholar] [CrossRef]
  12. Balassone, G.; Mormone, A.; Petti, C.; Bernardi, A.M.; Ghiara, M.R. Sodalite-group minerals from Somma-Vesuvius. Period. Mineral. 2015, 84, 427–440. [Google Scholar]
  13. Agamah, C.; Vuori, S.; Colinet, P.; Norrbo, I.; de Carvalho, J.M.; Okada Nakamura, L.K.; Lindblom, J.; van Goethem, L.; Emmermann, A.; Saarinen, T.; et al. Hackmanite—The natural glow-in-the-dark material. Chem. Mater. 2020, 32, 8895–8905. [Google Scholar] [CrossRef]
  14. Peterson, R.C. The structure of hackmanite, a variety of sodalite from Mont St-Hilaire, Quebec. Can. Mineral. 1983, 21, 549–552. [Google Scholar]
  15. Song, C.; Guo, Q.; Liu, Y.; Rao, Y.; Liao, L. Photochromism, UV-Vis, vibrational and fluorescence spectroscopy of differently colored hackmanite. Crystals 2023, 13, 1607. [Google Scholar] [CrossRef]
  16. Liebisch, T. Über die Fluoreszenz der Sodalith-und Willemitgruppe im ultravioletten Licht; Sitzungberichte der Königlich Preussischen Akademie der Wiessenschaften: Berlin, Germany, 1912; pp. 229–240. [Google Scholar]
  17. Sidike, A.; Sawuti, A.; Wang, X.M.; Zhu, H.J.; Kobayashi, S.; Kusachi, I.; Yamashita, N. Fine structure in photoluminescence spectrum of S2 center in sodalite. Phys. Chem. Miner. 2007, 34, 477–484. [Google Scholar] [CrossRef]
  18. Kirk, R.D. The luminescence and tenebrescence of natural and synthetic sodalite. Am. Mineral. 1955, 40, 22–31. [Google Scholar]
  19. Pizani, P.S.; Terrile, M.C.; Farach, H.A.; Poole, C.P. Color centers in sodalite. Am. Mineral. 1985, 70, 1186–1192. [Google Scholar]
  20. Ogihara, S. The origin of Yooperlite fluorescence. J. Gemmol. Soc. Jpn. 2019, 34, 21–26. [Google Scholar]
  21. Laughlin, R.; Carlson, S.; Dice, D. A new find of fluorescent sodalite from Michigan’s Upper Peninsula. Miner. News 2018, 34, 1–6. [Google Scholar]
  22. Jakab, G. Geneza Masivului Alcalin Ditrau; Editura Mark House: Gheorgheni, Romania, 2017. [Google Scholar]
  23. Koch, A. A ditrói Syenittömzs Kőzettani és Hegyszerkezeti Viszonyairól; Magyar Tudományos Akadémia Könyvkiadó Hivatala: Budapest, Hungary, 1879. [Google Scholar]
  24. Brana, V. Zăcămintele Nemetalifere din România [Non-Metallic Deposits in Romania]; Editura Tehnică: Bucharest, Romania, 1967; p. 266. [Google Scholar]
  25. Warr, L.N. IMA–CNMNC approved mineral symbols. Mineral. Mag. 2021, 85, 291–320. [Google Scholar] [CrossRef]
  26. Batki, A.; Pál-Molnár, E.; Dobosi, G.; Skelton, A. Petrogenetic significance of ocellar camptonite dykes in the Ditrău Alkaline Massif, Romania. Lithos 2014, 200–201, 181–196. [Google Scholar] [CrossRef]
  27. Pál-Molnár, E.; Kiri, L.; Lukács, R.; Dunkl, I.; Batki, A.; Szemerédi, M.; Almási, E.E.; Sogrik, E.; Harangi, S. Timing of magmatism of the Ditrău Alkaline Massif, Romania—A review based on new U–Pb and K/Ar data. Cent. Eur. Geol. 2021, 64, 18–37. [Google Scholar] [CrossRef]
  28. Klötzli, U.; Burda, J.; Li, Q.L.; Liu, Y.; Jakab, G.; Ionescu, L.; Tibuleac, P. Petrochronological Evidence for a Three-Stage Magmatic Evolution of the Youngest Nepheline Syenites from the Ditrău Alkaline Massif, Romania. Minerals 2022, 12, 657. [Google Scholar] [CrossRef]
  29. Ódri, Á.; Harris, C.; Le Roux, P. The role of crustal contamination in the petrogenesis of nepheline syenite to granite magmas in the Ditrău Complex, Romania: Evidence from O-, Nd-, Sr- and Pb-isotopes. Contrib. Mineral. Petrol. 2020, 175, 100. [Google Scholar] [CrossRef]
  30. Kräutner, H.; Bindea, G. Timing of the Ditrău alkaline intrusive complex (Eastern Carpathians, Romania). Slovak Geol. Mag. 1998, 4, 213–221. [Google Scholar]
  31. Fall, A.; Bodnar, R.J.; Szabó, C.; Pál-Molnár, E. Fluid evolution in the nepheline syenites of the Ditrău Alkaline Massif, Transylvania, Romania. Lithos 2007, 95, 331–345. [Google Scholar] [CrossRef]
  32. Apopei, A.I. Towards Mineralogy 4.0? Atlas of 3D Rocks and Minerals: Digitally Archiving Interactive and Immersive 3D Data of Rocks and Minerals. Minerals 2024, 14, 1196. [Google Scholar] [CrossRef]
  33. Apopei, A.I.; Buzgar, N.; Buzatu, A.; Maftei, A.E.; Apostoae, L. Digital 3D Models of Minerals and Rocks in a Nutshell: Enhancing Scientific, Learning, and Cultural Heritage Environments in Geosciences by Using Cross-Polarized Light Photogrammetry. Carpathian J. Earth Environ. Sci. 2021, 16, 237–249. [Google Scholar] [CrossRef]
  34. Lafuente, B.; Downs, R.T.; Yang, H.; Stone, N. 1. The power of databases: The RRUFF project. In Highlights in Mineralogical Crystallography; De Gruyter (O): Berlin, Germany, 2015; pp. 1–30. [Google Scholar]
  35. Barnes, M.C.; Addai-Mensah, J.; Gerson, A.R. A methodology for quantifying sodalite and cancrinite phase mixtures and the kinetics of the sodalite to cancrinite phase transformation. Microporous Mesoporous Mater. 1999, 31, 287–302. [Google Scholar] [CrossRef]
  36. Hettmann, K.; Wenzel, T.; Marks, M.; Markl, G. The sulfur speciation in S-bearing minerals: New constraints by a combination of electron microprobe analysis and DFT calculations with special reference to sodalite-group minerals. Am. Mineral. 2012, 97, 1653–1661. [Google Scholar] [CrossRef]
  37. Farsang, S.; Caracas, R.; Adachi, T.B.M.; Schnyder, C.; Zajacz, Z. S2 and S3 radicals and the S42− polysulfide ion in lazurite, haüyne, and synthetic ultramarine blue revealed by resonance Raman spectroscopy. Am. Mineral. 2023, 108, 2234–2243. [Google Scholar] [CrossRef]
  38. Porotnikova, T.P.; Derevyankin, V.A. Infrared absorption spectra of equilibrium solid phases of the Na2O-Al2O3-SiO2-H2O system. Sov. J. Non-Ferr. Met. 1975, 8, 38–41. [Google Scholar]
  39. Addai-Mensah, J.; Gerson, A.R.; Smart, R.S.C. The chemistry, crystallization, and physicochemical properties of sodium aluminosilicate solid phases. Ind. Eng. Chem. Res. 2002, 41, 3326–3334. [Google Scholar]
  40. Chukanov, N.V.; Aksenov, S.M.; Pekov, I.V. Infrared spectroscopy as a tool for the analysis of framework topology and extra-framework components in microporous cancrinite- and sodalite-related aluminosilicates. Spectrochim. Acta A Mol. Biomol. Spectrosc. 2023, 287, 121993. [Google Scholar] [CrossRef]
  41. Bellatreccia, F.; Della Ventura, G.; Di Muro, A.; Cavallo, A. H2O and CO2 in haüyne-sodalite solid solution. Period. Di Mineral. 2009, 78, 27–40. [Google Scholar]
  42. Hermeler, G.; Buhl, J.C.; Hoffman, W. Influence of carbonate on the synthesis of an intermediate phase between sodalite and cancrinite. Zeolites 1991, 11, 424–426. [Google Scholar] [CrossRef]
  43. Chukanov, N.V.; Shendrik, R.Y.; Vigasina, M.F.; Pekov, I.V.; Sapozhnikov, A.N.; Shcherbakov, V.D.; Varlamov, D.A. Crystal Chemistry, Isomorphism, and Thermal Conversions of Extra-Framework Components in Sodalite-Group Minerals. Minerals 2022, 12, 887. [Google Scholar] [CrossRef]
  44. Lilova, K.; Pierce, E.M.; Wu, L.; Jubb, A.M.; Subramani, T.; Navrotsky, A. Energetics of Salt-Bearing Sodalites, Na8Al6Si6O24X2 (X = SO4, ReO4, Cl, I): A Treatment Option for Pertechnetate-Enriched Nuclear Waste Streams. ACS Earth Space Chem. 2020, 4, 2153–2161. [Google Scholar] [CrossRef]
  45. Gaft, M.; Panczer, G.; Nagli, L.; Yeates, H. Laser-induced time-resolved luminescence of tugtupite, sodalite and hackmanite. Phys. Chem. Miner. 2008, 36, 127–141. [Google Scholar] [CrossRef]
  46. Sharp, Z.D.; Helffrich, G.R.; Bohlen, S.R.; Essene, E.J. The stability of sodalite in the system NaAlSiO4-NaCl. Geochim. Cosmochim. Acta 1989, 53, 1943–1954. [Google Scholar] [CrossRef]
  47. Williams, E.R.; Simmonds, A.; Armstrong, J.A.; Weller, M.T. Compositional and structural control of tenebrescence. J. Mater. Chem. 2010, 20, 10883–10887. [Google Scholar] [CrossRef]
  48. Curutchet, A.; Le Bahers, T. Modeling the Photochromism of S-Doped Sodalites Using DFT, TD-DFT, and SAC-CI Methods. Inorg. Chem. 2017, 56, 414–423. [Google Scholar] [CrossRef] [PubMed]
  49. Chukanov, N.V.; Sapozhnikov, A.N.; Shendrik, R.Y.; Vigasina, M.F.; Steudel, R. Spectroscopic and Crystal-Chemical Features of Sodalite-Group Minerals from Gem Lazurite Deposits. Minerals 2020, 10, 1042. [Google Scholar] [CrossRef]
  50. Kondo, D.; Beaton, D. Hackmanite/Sodalite from Myanmar and Afghanistan. Gems Gemol. 2009, 45, 38–43. [Google Scholar] [CrossRef]
Figure 1. Location map and geology of the DAM, with the sample locations: D1, D1bis, D2, and D3 (modified after [10,30]).
Minerals 15 01006 g001
Figure 2. Macroscopic appearance of the studied sodalite-bearing syenite samples in visible light (a,c,e,g) and under long-wave UV illumination (365 nm) (b,d,f,h). Note the variable orange fluorescence of sodalite. Samples shown are D1 (a,b) (https://skfb.ly/p7NQT, accessed on 22 September 2025), D1bis (c,d) (https://skfb.ly/pqAFH, accessed on 22 September 2025), D2 (e,f) (https://skfb.ly/p7NRD, accessed on 22 September 2025), and D3 (g,h) (https://skfb.ly/p7NRM, accessed on 22 September 2025). Mineral abbreviation: Sdl—sodalite; Nph—nepheline; Ccn—cancrinite; Afs—alkali-feldspar; m.m.—mafic minerals. QR codes link to interactive 3D models of each sample.
Minerals 15 01006 g002
Figure 3. Photomicrographs of syenite samples under crossed polarizers, where (a) sample D1; (b) sample D1bis; (c) sample D2; (d) sample D3. Mineral abbreviation: Sdl—sodalite; Ccn—cancrinite; Mcc—microcline; Pl—plagioclase; Bt—biotite; Kfs—K feldspar. Interactive whole thin section scans for each sample are available in the Appendix A (Table A1).
Minerals 15 01006 g003
Figure 4. Raman spectra of sodalite samples from Ditrău Alkaline Massif, compared with reference spectra for sodalite (RRUFF ID: R040141) and cancrinite (RRUFF ID: R050352) from the RRUFF database [34].
Minerals 15 01006 g004
Figure 5. FT-IR (transmittance) spectra of sodalite and cancrinite samples from Ditrău Alkaline Massif.
Minerals 15 01006 g005
Table 1. Sample locations from the Ditrău Alkaline Massif.
Sample IDPerimeterLocality
D1Prișca (Piricske)Ditrău (Ditró) valley
D1bisPrișca (Piricske)Ditrău (Ditró) valley
D2Jolotca (Orotva)Teasc (Tászok) creek
D3Aurora (Hajnal)Belcina/Belchia (Békény) valley
Disclaimer/Publisher’s Note: The statements, opinions and data contained in all publications are solely those of the individual author(s) and contributor(s) and not of MDPI and/or the editor(s). MDPI and/or the editor(s) disclaim responsibility for any injury to people or property resulting from any ideas, methods, instructions or products referred to in the content.