
Application of Multi-Source Data Mining Technology in the Optimization of Prospecting Target Areas for Copper Deposits in the Beishan Region of Gansu Province, China

Abstract
1. Introduction
2. Geology and Data
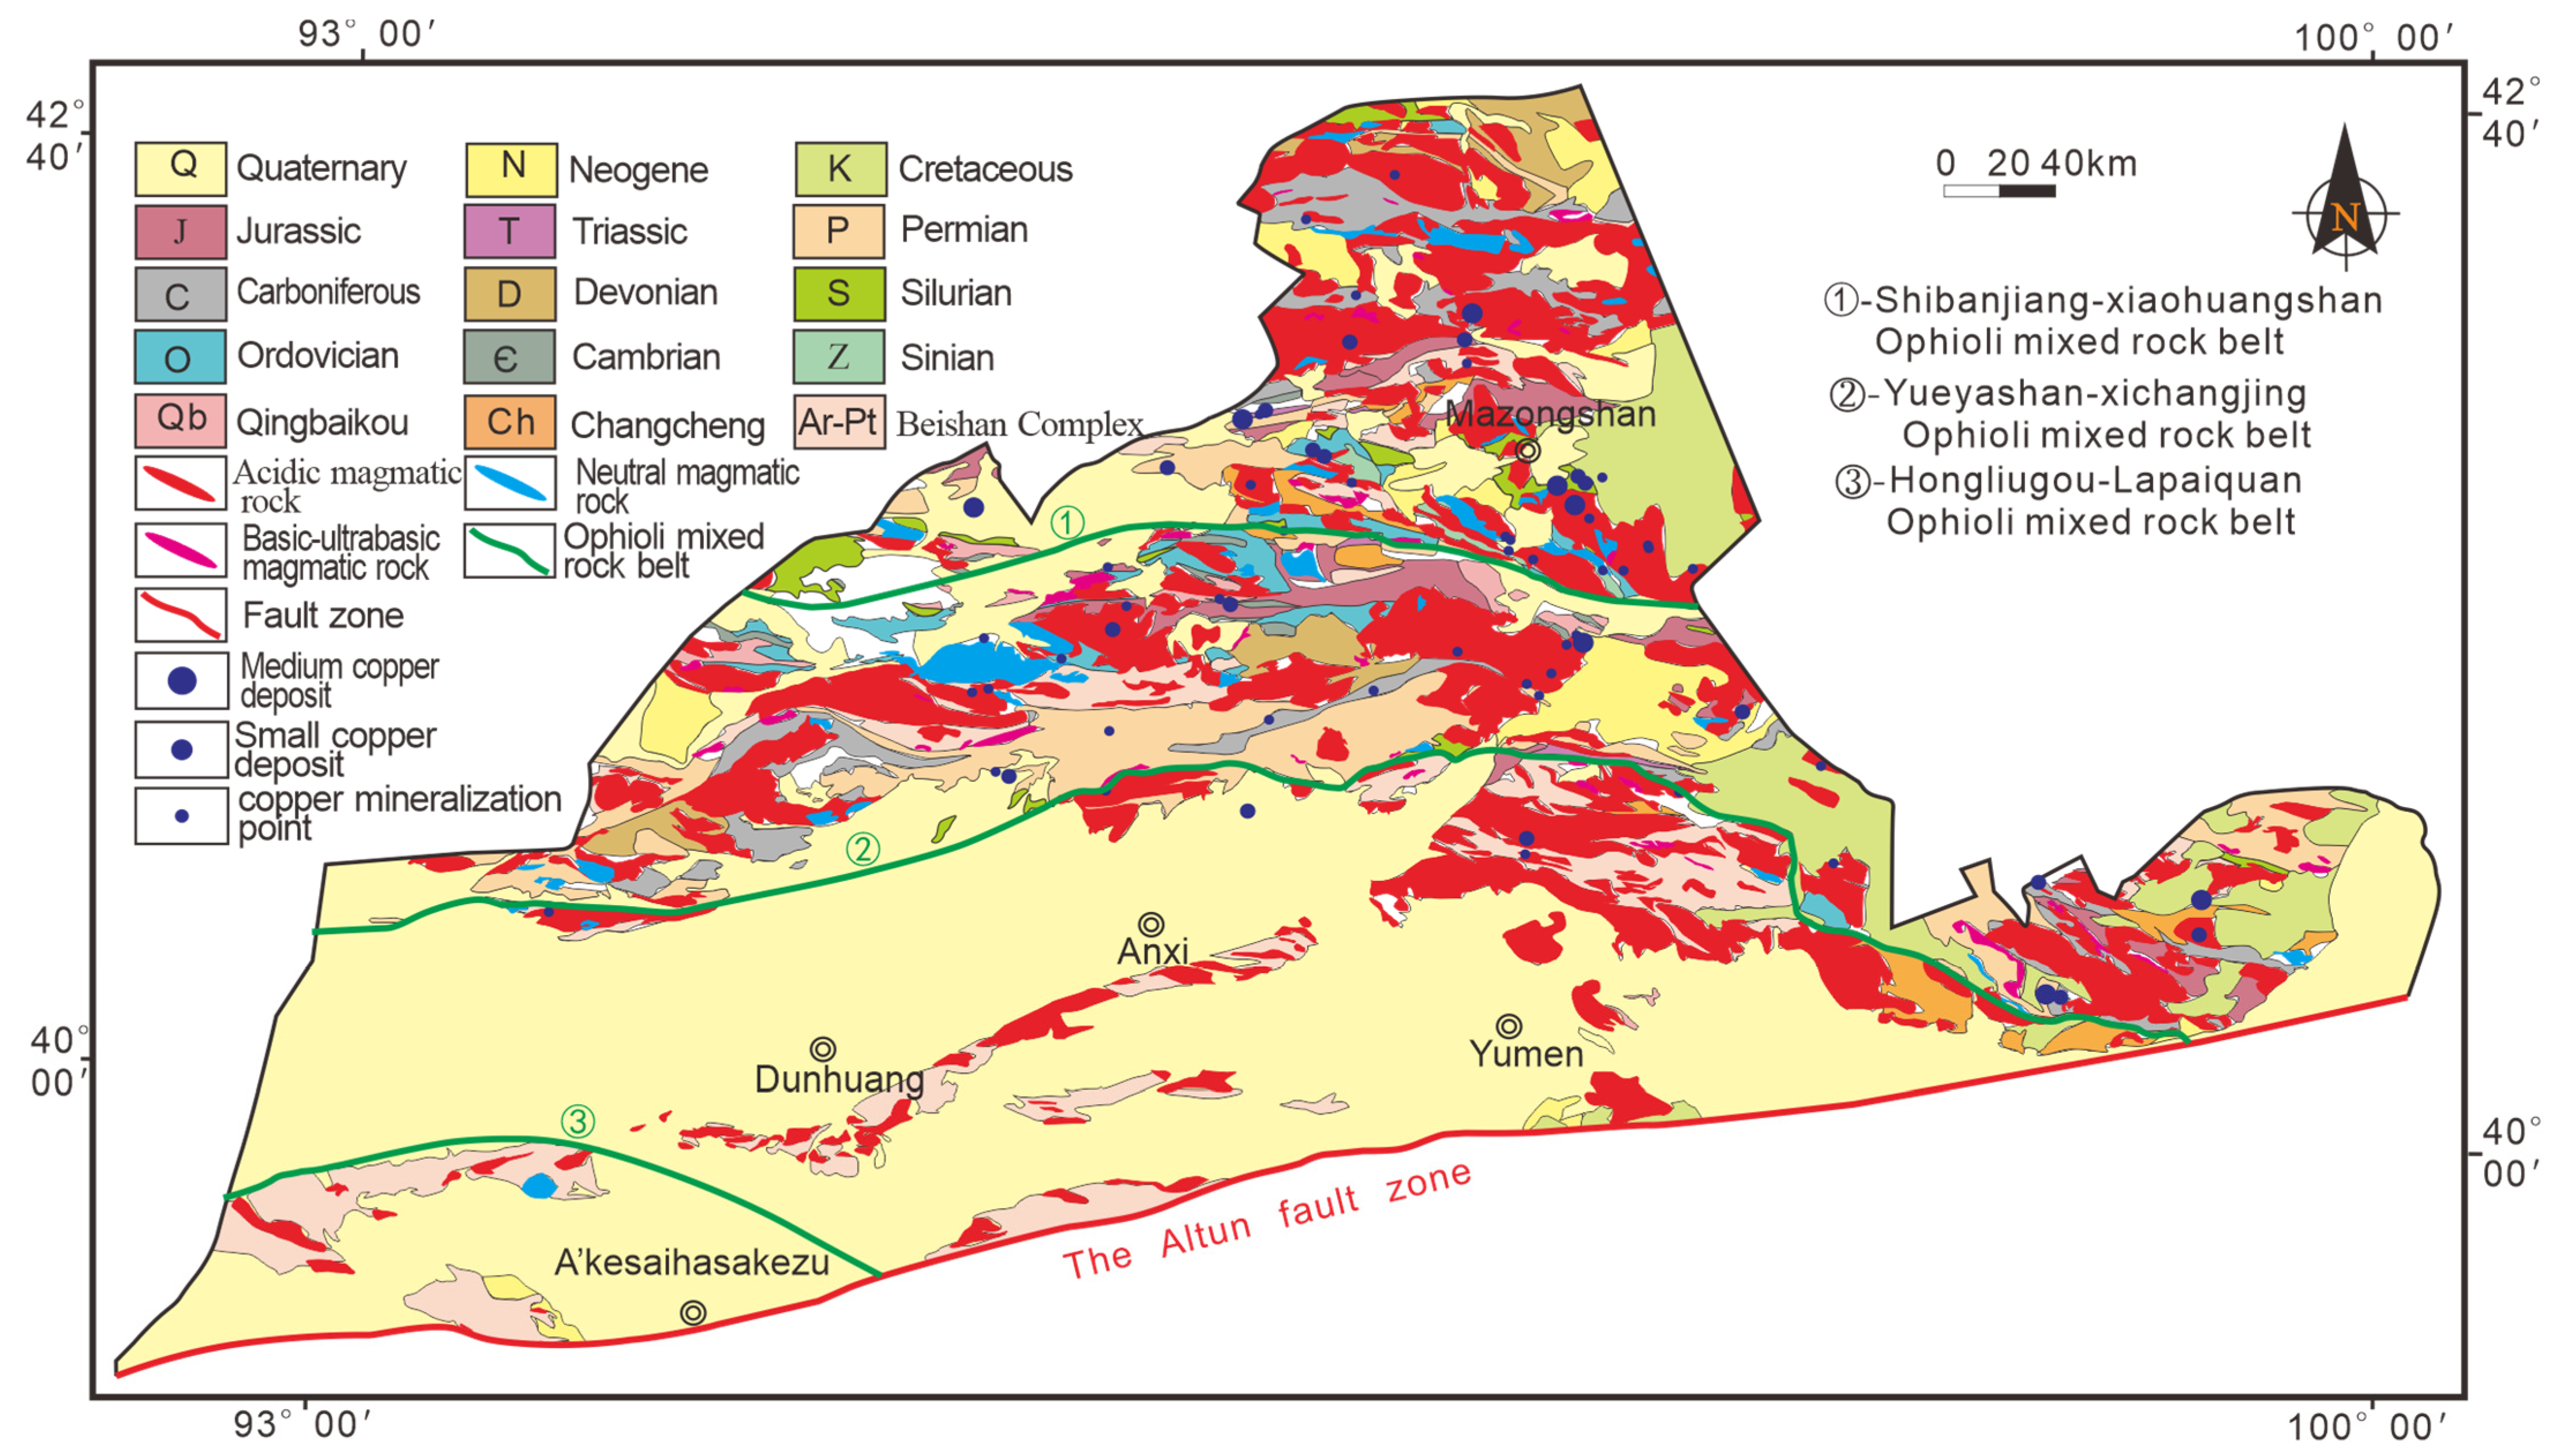
2.1. Geological Setting
2.2. Data Sources
- Regional geological data: Geological and mineral resources map of Gansu Province (1:1,000,000), tectonic phase map of Gansu Province (1:1,000,000), and a total of 32 sets of regional geological maps and descriptions at a scale of 1:200,000 covering the entire Beishan area.
- Mineral geological data: A total of 32 sets of 1:200,000 mineral geological maps and descriptions covering the entire Beishan area of Gansu Province, 10 sheets of 1:50,000 regional geological data, 15 sheets of 1:50,000 mineral prospecting survey data, approximately 30 detailed geological and mineral resources investigation documents, the mineral database of Gansu Province, and the mineral data from the geological records of Gansu Province.
- Geochemical exploration data: A 1:200,000 regional geochemical database for the Beishan area of Gansu Province, containing sample locations and test results for 39 elements including Au, Cu, U, Th, Ag, Mo, Sn, W, As, Sb, Bi, and Hg, for a total of 29,783 data points.
- Aeromagnetic data: There are 2,512,247 aerial magnetic measurement points in the Beishan area of Gansu Province at scales of 1:50,000 and 1:100,000.
3. Methodology
3.1. Research Ideas
3.2. Raw Data Processing
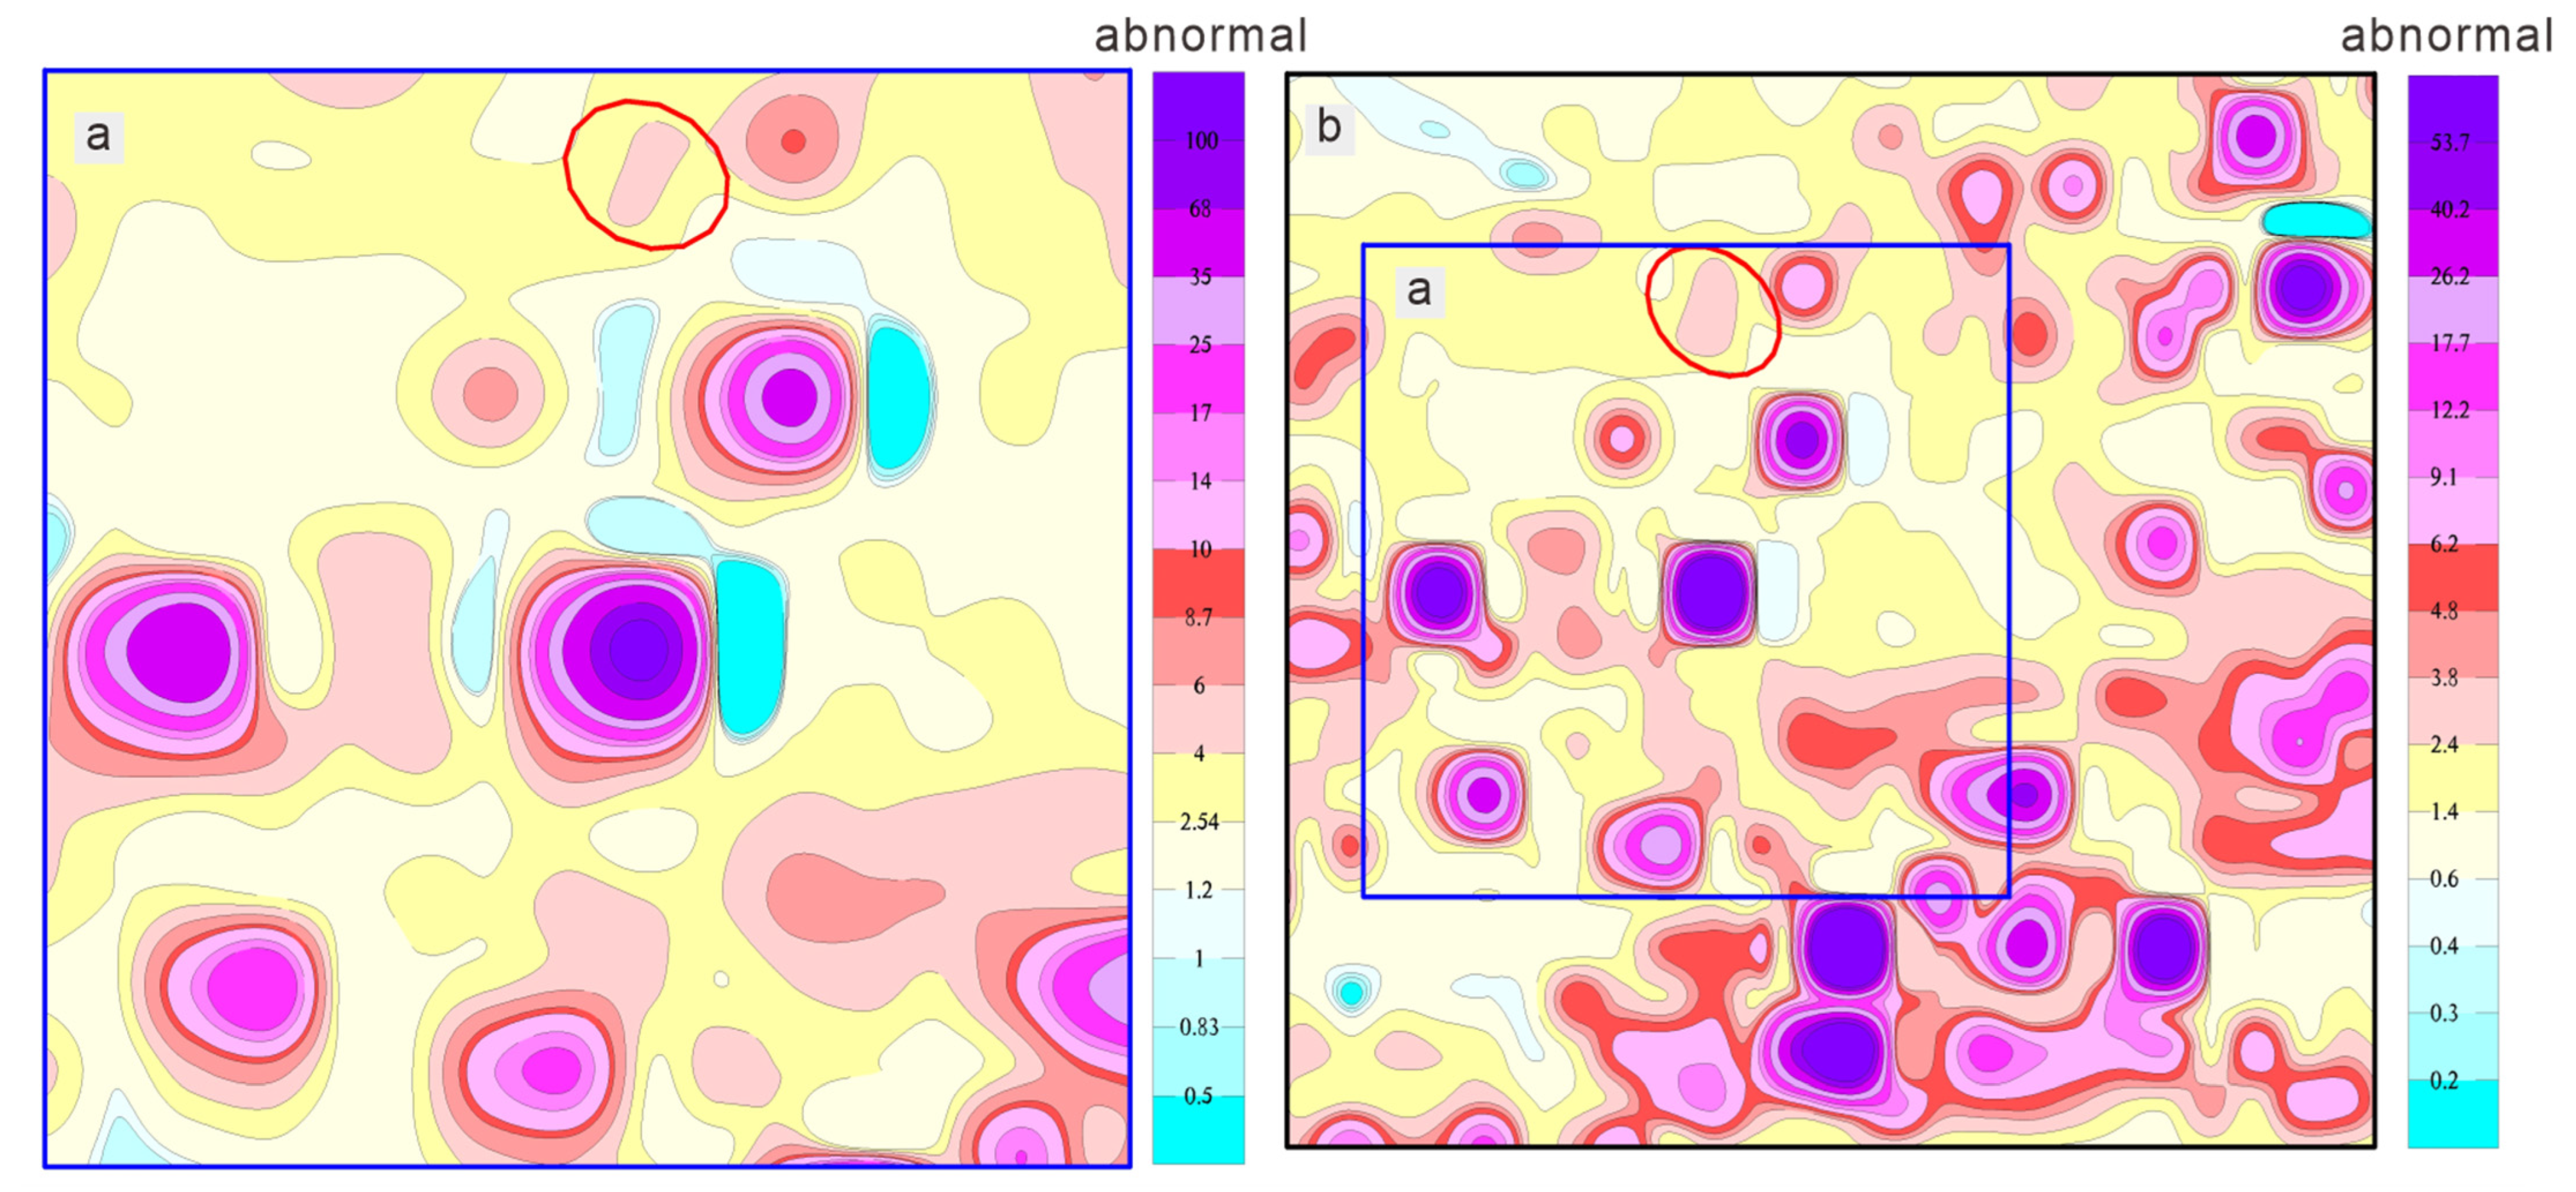
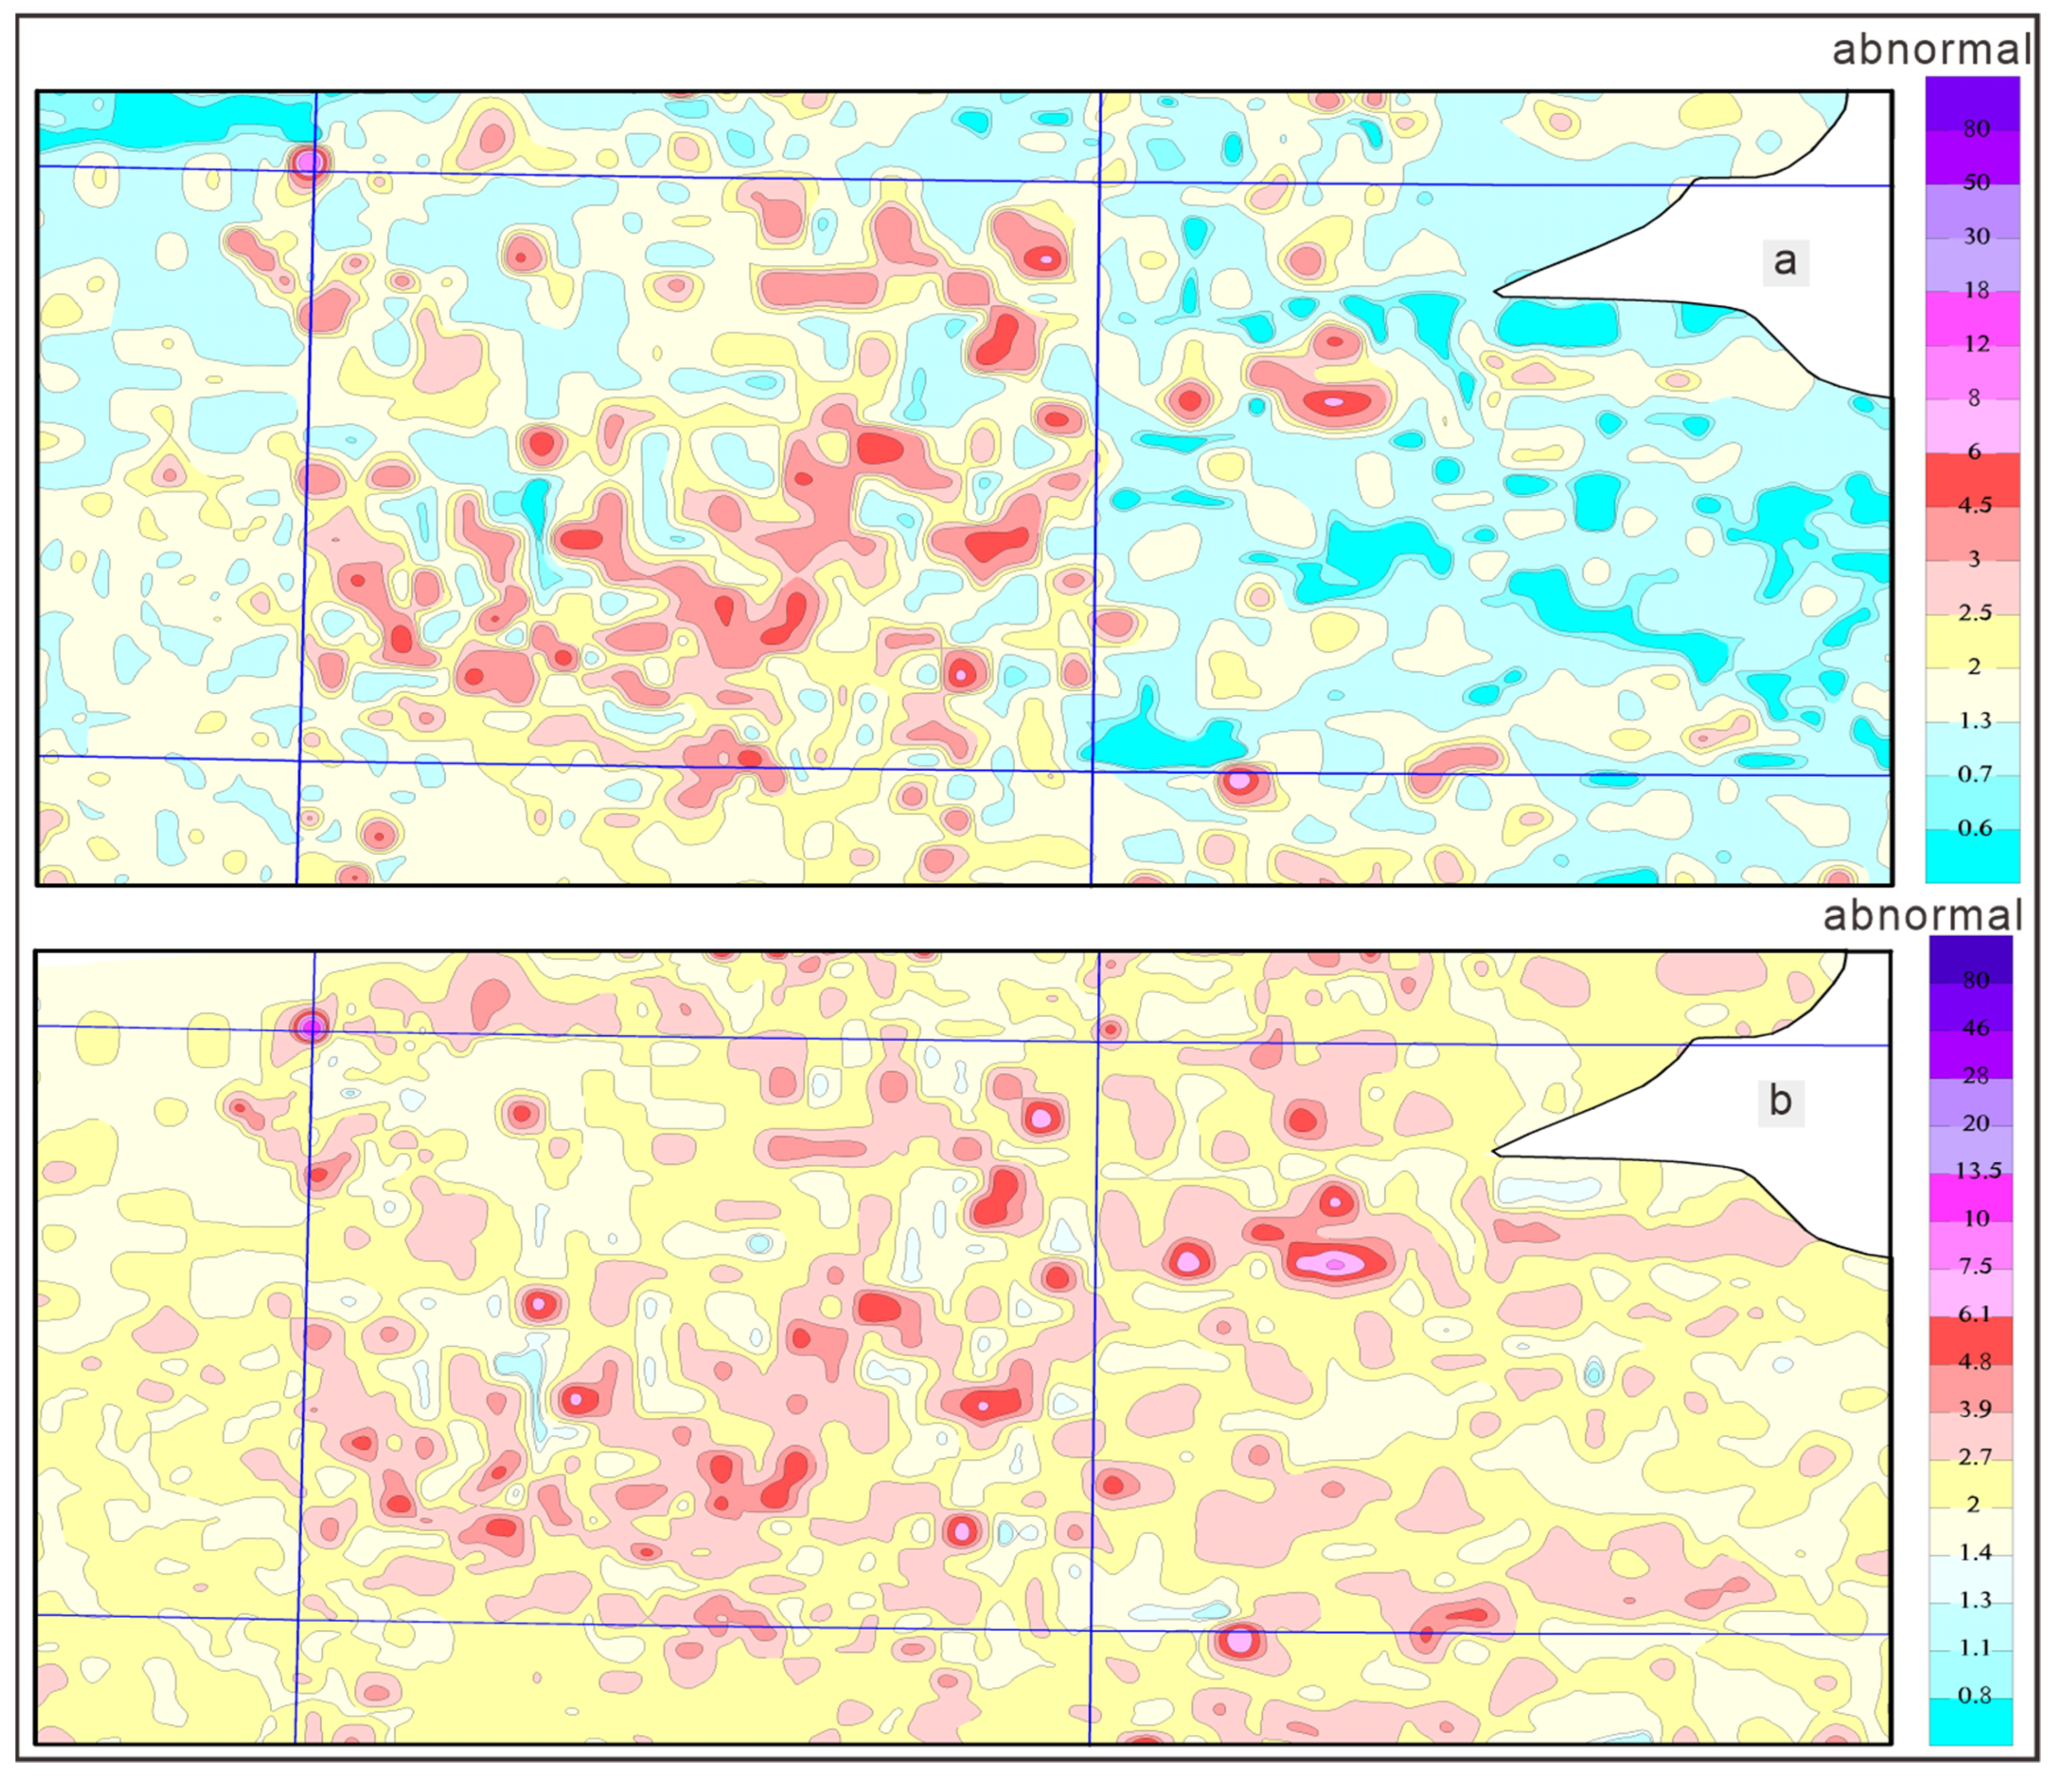
3.2.1. Raw Data Denoising and Its Effect
3.2.2. Information Extraction
3.2.3. Geochemistry of Related Elements and Remediated Cu Value
3.2.4. Specification of Unit Division
3.2.5. Combination of Aeromagnetic and Geochemical Data
4. Results and Discussion
4.1. Construction of a Quantitative Optimization Model for Prospecting Target Areas
4.2. Optimization of the Quantitative Models
4.2.1. Model I
4.2.2. Model II
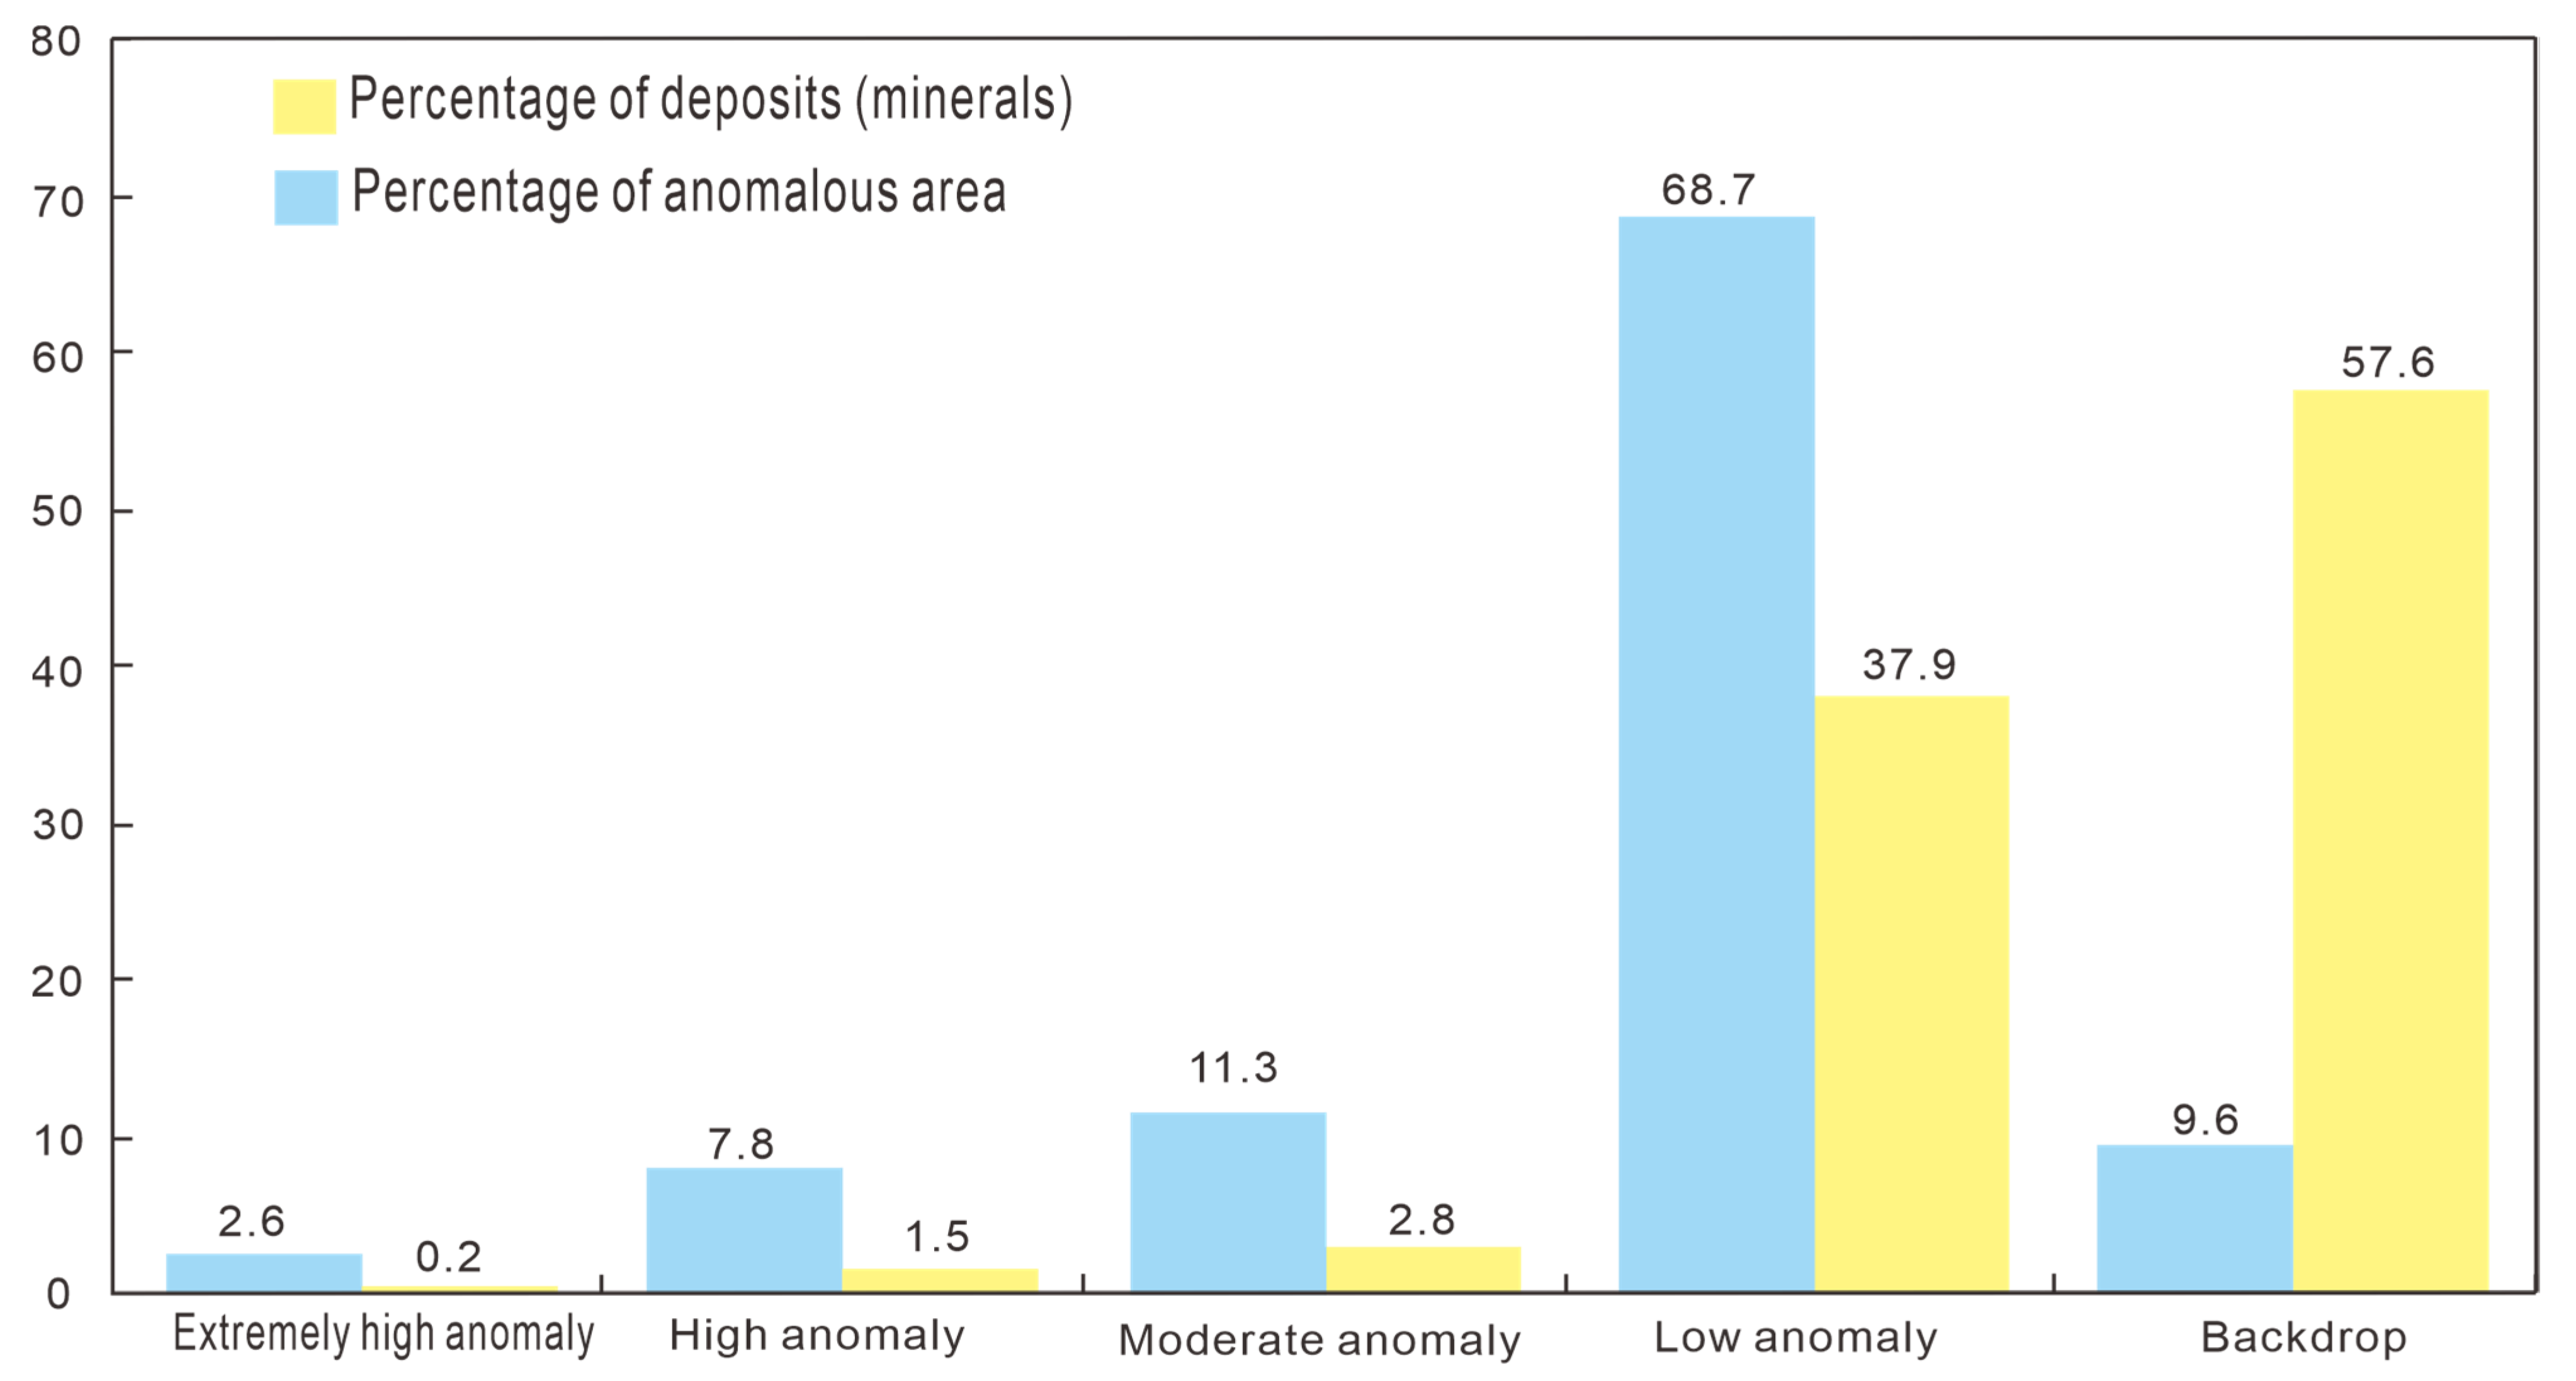
4.3. Validity of the Quantitative Models
4.4. Quantitative Optimization of Prospecting Target Areas
4.5. Field Verification of the Optimized Prospecting Target Areas
5. Conclusions
Author Contributions
Funding
Data Availability Statement
Acknowledgments
Conflicts of Interest
References
- Xu, X.-W.; Li, H.; Peters, S.G.; Qin, K.-Z.; Mao, Q.; Wu, Q.; Hong, T.; Wu, C.; Liang, G.-L.; Zhang, Z.-F.; et al. Cu-rich porphyry magmas produced by fractional crystallization of oxidized fertile basaltic magmas (Sangnan, East Junggar, PR China). Ore Geol. Rev. 2017, 91, 296–315. [Google Scholar] [CrossRef]
- Pour, A.B.; Hashim, M. Hydrothermal alteration mapping from Landsat-8 data, Sar Cheshmeh copper mining district, south-eastern Islamic Republic of Iran. J. Taibah Univ. Sci. 2015, 9, 155–166. [Google Scholar] [CrossRef]
- Fu, Y.; Cheng, Q.; Jing, L.; Ye, B.; Fu, H. Mineral Prospectivity Mapping of Porphyry Copper Deposits Based on Remote Sensing Imagery and Geochemical Data in the Duolong Ore District, Tibet. Remote Sens. 2023, 15, 439. [Google Scholar] [CrossRef]
- Austin, J.R.; Blenkinsop, T.G. Local to regional scale structural controls on mineralization and the importance of a major lineament in the eastern Mount Isa Inlier. Australia: Review and analysis with autocorrelation and weights of evidence. Ore Geol. Rev. 2009, 35, 298–316. [Google Scholar] [CrossRef]
- Liu, C.; Ji, X.; Dong, Y.; He, M.; Yang, M.; Wang, Y. Chinese mineral question and answering system based on knowledge graph. Expert Syst. Appl. 2023, 231, 120841. [Google Scholar] [CrossRef]
- Zhuang, C.; Liu, C.; Zhu, H.; Ma, Y.; Shi, G.; Liu, Z.; Liu, B. Constraint information extraction for 3D geological modelling using a span-based joint entity and relation extraction model. Earth Sci. Inf. 2024, 17, 985–998. [Google Scholar] [CrossRef]
- Sobhana, N.V.; Mitra, P.; Ghosh, S.K. Conditional random field based named entity recognition in geological text. Int. J. Comput. Appl. 2010, 1, 143–147. [Google Scholar] [CrossRef]
- Qiu, Q.; Tian, M.; Huang, Z.; Xie, Z.; Ma, K.; Tao, L.; Xu, D. Chinese engineering geological named entity recognition by fusing multi-features and data enhancement using deep learning. Expert Syst. Appl. 2024, 238, 121925. [Google Scholar] [CrossRef]
- Zhou, Y.Z.; Chen, S.; Zhang, Q.; Xiao, F.; Wang, S.G.; Liu, Y.P.; Jiao, S.T. Advances and prospects of big data and mathematical geoscience. Acta Petrol. Sin. 2018, 34, 255–263. [Google Scholar]
- Zhou, Y.Z.; Xiao, F. Overview: A glimpse of the latest advances in artificial intelligence and big data geoscience research. Earth Sci. Front. 2024, 31, 1–6. [Google Scholar]
- Abbaszadeh, M.; Hezarkhani, A.; Soltani-Mohammadi, S. An SVM-based machine learning method for the separation of alteration zones in Sungun porphyry copper deposit. Geochemistry 2013. 73, 545–554. [CrossRef]
- Zuo, R.G. Identifying geochemical anomalies associated with Cu and Pb-Zn skarn mineralization using principal component analysis and spectrum-area fractal modeling in the Gangdese Belt, Tibet (China). J. Geochem. Explor. 2011, 111, 13–22. [Google Scholar] [CrossRef]
- Filzmoser, P.; Hron, K.; Reimann, C. Robust factor analysis for compositional data. Comput. Geosci. 2009, 35, 1854–1861. [Google Scholar] [CrossRef]
- Maepa, F.; Smith, R.S.; Tessema, A. Support vector machine and artificial neural network modelling of orogenic gold prospectivity mapping in the Swayze greenstone belt, Ontario, Canada. Ore Geol. Rev. 2021, 130, 103968. [Google Scholar] [CrossRef]
- Chen, Z.; Wu, Q.; Han, S.; Zhang, J.; Yang, P.; Liu, X.; Lang, M. The metallogenic tectonic implication of the volcanic rocks of the Dahalajunshan Formation in the Early Carboniferous in the West Tianshan based on big data analytics. Arab. J. Geosci. 2022, 15, 1658. [Google Scholar] [CrossRef]
- Zhang, S.; Xiao, K.Y.; Carranza, E.J.M.; Yang, F. Maximum entropy and random forest modeling of mineral potential: Analysis of gold prospectivity in the Hezuo—Meiwu district west Qinling Orogen, China. Nat. Resour. Res. 2019, 28, 645–664. [Google Scholar] [CrossRef]
- Shabani, A.; Ziaii, M.; Monfared, M.S.; Shirazy, A.; Shirazi, A. Multi-Dimensional Data Fusion for Mineral Prospectivity Mapping (MPM) Using Fuzzy-AHP Decision-Making Method, Kodegan-Basiran Region. East Iran. Minerals 2022, 12, 1629. [Google Scholar] [CrossRef]
- Nti, I.K.; Quarcoo, J.A.; Aning, J.; Fosu, G.K. A mini-review of machine learning in big data analytics: Applications, challenges, and prospects. Big Data Min. Anal. 2022, 5, 81–97. [Google Scholar] [CrossRef]
- Zhang, S.; Carranza, E.J.M.; Xiao, K.Y.; Wei, H.T.; Yang, F. Mineral prospectivity mapping based on isolation forest and random forest: Implication for the existence of spatial signature of mineralization in Outliers. Nat. Resour. Res. 2023, 31, 1981–1999. [Google Scholar] [CrossRef]
- Qiu, Q.; Ma, K.; Lv, H.; Tao, L.; Xie, Z. Construction and application of a knowledge graph for iron deposits using text mining analytics and a deep learning algorithm. Math. Geosci. 2021, 55, 423–456. [Google Scholar] [CrossRef]
- Jean, G.E.; Bancroft, M. An XPS and SEM study of gold deposition at low temperatures on sulphide mineral surfaces: Concentration of gold by adsorption/reduction. Geochim. Cosmochim. Act. 1985, 49, 979–987. [Google Scholar] [CrossRef]
- Sadeghi, B.; Khalajmasoumi, M.; Afzal, P.; Moarefvand, P.; Yasrebi, A.B.; Wetherelt, A.; Foster, P.; Ziazarifi, A. Using ETM+ and ASTER sensors to identify iron occurrences in the Esfordi 1:100,000 mapping sheet of Central Iran. J. Afr. Earth Sci. 2013, 85, 103–114. [Google Scholar] [CrossRef]
- Hu, H.; Wen, Y.; Chua, T.S.; Li, X. Toward scalable systems for big data analytics: A technology tutorial. IEEE Access. 2014, 2, 652–687. [Google Scholar] [CrossRef]
- Rodriguer-galiano, V.F.; Chica, O.M.; Chica, R.M. Predictive modelling of gold potential with the integration of multisource information based on random forest: A case study on the Rodalquilar area, Southern Spain. Int. J. Geogr. Inf. Sci. 2014, 28, 1336–1354. [Google Scholar] [CrossRef]
- Carranza, E.J.M.; Laborte, A.G. Random forest predictive modeling of mineral prospectivity with small number of prospects and data with missing values in Abra (Philippines). Comput. Geosci. 2015, 74, 60–70. [Google Scholar] [CrossRef]
- Rodgiguez, G.; Sanchez, C.; Chica, O.M.; Chica, R.M. Machine learning predictive models for mineral prospectivity: An evaluation of neural networks random forest regression trees and supportvector machines. Ore Geol. Rev. 2015, 71, 804–818. [Google Scholar]
- Baumann, P.; Mazzetti, P.; Ungar, J.; Barbera, R.; Barboni, D.; Beccati, A.; Bigagli, L.; Boldrini, E.; Bruno, R.; Calanducci, A.; et al. Big data analytics for earth sciences: The Earth Server approach. Int. J. Digit. Earth 2016, 9, 3–29. [Google Scholar] [CrossRef]
- Li, T.F.; Xia, Q.L.; Zhao, M.Y.; Gui, Z.; Leng, S. Prospectivity mapping for tungsten polymetallic mineral resources Nanling Metallogenic Belt South China: Use of Random Forest Algorithm from a Perspective of Data Imbalance. Nat. Resour. Res. 2019, 29, 203–227. [Google Scholar] [CrossRef]
- Mohamed, A.; Najafabadi, M.K.; Wah, Y.B.; Zaman, E.A.K.; Maskat, R. The state of the art and taxonomy of big data analytics: View from new big data framework. Artif. Intell. Rev. 2020, 53, 989–1037. [Google Scholar] [CrossRef]
- Chen, G.X.; Huang, N.; Wu, G.P.; Luo, L.; Wang, D.T.; Cheng, Q.M. Mineral prospectivity mapping based on wavelet neural network and Monte Carlo simulations in the Nanling W-Sn metallogenic province. Ore Geol. Rev. 2022, 143, 104765. [Google Scholar] [CrossRef]
- Li, Y.S.; Peng, C.; Ran, X.J.; Xue, L.F.; Chai, S.L. Soil geochemical prospecting prediction method based on deep convolutional neural networks-Taking Daqiao Gold Deposit in Gansu Province, China as an example. China Geol. 2022, 5, 71–83. [Google Scholar]
- Ren, W.X.; Luo, J.M.; Sun, B.N.; Wang, H.T.; Wang, Y.X. A pplication of geochemical data in gold prospecting and target selecting: Taking the Yushishan area in Gansu Province as a case. Acta Petrol. Sin. 2018, 34, 3225–3234. [Google Scholar]
- Safari, S.; Ziaii, M.; Ghoorchi, M.; Sadeghi, M. Application of concentration gradient coefficients in mining geochemistry: A comparison of copper mineralization in Iran and Canada. J. Min. Environ. 2018, 9, 277–292. [Google Scholar]
- Zuo, R.; Xiong, Y. Big data analytics of identifying geochemical anomalies supported by machine learning methods. Nat. Resour. Res. 2018, 27, 5–13. [Google Scholar] [CrossRef]
- Ziaii, M.; Safari, S.; Timkin, T.; Voroshilov, V.; Yakich, T. Identification of geochemical anomalies of the porphyry-Cu deposits using concentration gradient modelling: A case study, Jebal-Barez area, Iran. J. Geochem. Explor. 2019, 199, 16–30. [Google Scholar] [CrossRef]
- Shirazi, A.; Hezarkhani, A.; Beiranvand, P.A.A. Fusion of Lineament Factor (LF) Map Analysis and Multifractal Technique for Massive Sulfide Copper Exploration: The Sahlabad Area, East Iran. Minerals 2022, 12, 549. [Google Scholar] [CrossRef]
- Huston, D.L.; Sie, S.H.; Suter, G.F.; Cooke, D.R.; Both, R.A. Trace elements in sulfide minerals from Eastern Australian volcanic-hosted massive sulfide deposits: Part I. Proton Microprobe analyses of pyrite, chalcopyrite, and sphalerite, and Part II. Selenium Levels in Pyrite: Comparison with δ34S values and implications for the source of sulfur in volcanogenic hydrothermal systems. Econ. Geol. 1995, 90, 1167–1196. [Google Scholar]
- Han, B.F.; Guo, Z.J.; Zhang, Z.C.; Zhang, L.; Chen, J.F.; Song, B. Age, geochemistry, and tectonic implications of a late Paleozoic stitching pluton in the North Tian Shan suture zone, Western China. Geol. Soc. Am. Bull. 2010, 122, 627–640. [Google Scholar] [CrossRef]
- Kwok, S.W.; Carter, C. Multiple decision trees. In Machine Intelligence and Pattern Recognition; Elsevier: Amsterdam, The Netherlands, 1990; Volume 9, pp. 327–335. [Google Scholar]
- Kempe, U.; Seltmann, R.; Graupner, T.; Rodionov, N.; Sergeev, S.A.; Matukov, D.; Kremenetsky, A.A. Concordant U-Pb SHRIMP ages of U-rich zircon in granitoids from the Muruntau gold district (Uzbekistan): Timing of intrusion, alteration ages, or meaningless numbers. Ore Geol. Rev. 2015, 65, 308–326. [Google Scholar] [CrossRef]
- Feng, W.Y.; Zheng, J.H.; Shen, P. Petrology, mineralogy, and geochemistry of the Carboniferous Katbasu Au-Cu deposit, western Tianshan, Northwest China: Implications for petrogenesis, ore genesis, and tectonic setting. Ore Geol. Rev. 2023, 161, 105659. [Google Scholar] [CrossRef]
- Laurent-Charvet, S.; Charvet, J.; Shu, L.S.; Ma, R.S.; Lu, H.F. Palaeozoic late collisional strike-slip deformations in Tianshan and Altay, Eastern Xinjiang, NW China. Terra Nova 2002, 14, 249–256. [Google Scholar] [CrossRef]
- Keith, M.; Smith, D.J.; Jenkin, G.R.T.; Holwell, D.A.; Dye, M.D. A review of Te and Se systematics in hydrothermal pyrite from precious metal deposits: Insights into ore-forming processes. Ore Geol. Rev. 2018, 96, 269–282. [Google Scholar] [CrossRef]
- Large, R.R.; Mukherjee, I.; Gregory, D.D.; Steadman, J.A.; Maslennikov, V.V.; Meffre, S. Ocean and atmosphere geochemical proxies derived from trace elements in marine pyrite: Implications for ore genesis in sedimentary basins. Econ. Geol. 2017, 112, 423–450. [Google Scholar] [CrossRef]
- Mao, Q.G.; Xiao, W.J.; Wang, H.; Ao, S.J.; Windley, B.; Song, D.F.; Sang, M.; Tan, Z.; Li, R.; Wang, M. Prolonged Late Mesoproterozoic to Late Triassic Tectonic Evolution of the Major Paleo-Asian Ocean in the Beishan Orogen (NW China) in the Southern Altaids. Front. Earth Sci. 2022, 9, 825852. [Google Scholar] [CrossRef]
- Kempe, U.; Graupner, T.; Seltmann, R.; Boorder, H.D.; Dolgopolova, A.; Zeylmans Van Emmichoven, M. The Muruntau gold deposit (Uzbekistan)- A unique ancient hydrothermal system in the southern Tien Shan. Geosci. Front. 2016, 7, 495–528. [Google Scholar] [CrossRef]
- Dong, L.L.; Wan, B.; Yang, W.Z.; Deng, C.; Chen, Z.; Yang, L.; Cai, K.D.; Xiao, W.J. Rb-Sr geochronology of single gold-bearing pyrite grains from the Katbasu gold deposit in the South Tianshan, China and its geological significance. Ore Geol. Rev. 2018, 100, 99–110. [Google Scholar] [CrossRef]
- Groves, D.I.; Foster, R.P. Archaean lode gold deposits. In Gold Metallogeny and Exploration; Foster, R.P., Ed.; Springer: Berlin/Heidelberg, Germany, 1991; pp. 63–103. [Google Scholar]
- Xu, X.W.; Ma, T.L.; Sun, L.Q. Characteristics and dynamic origin of the large−scale Jiaoluotage ductile compressional zone in the eastern Tianshan Mountains, China. J. Struct. Geol. 2003, 25, 1901–1915. [Google Scholar] [CrossRef]
- Yousefi, M.; Kreuzer, O.P.; Nykänen, V.; Hronsky, J.M.A. Exploration information systems-a proposal for the future use of GIS in mineral exploration targeting. Ore Geol. Rev. 2019, 111, 103005. [Google Scholar] [CrossRef]
- Windley, B.F.; Alexeiev, D.; Xiao, W.; Kröner, A.; Badarch, G. Tectonic models for accretion of the Central Asian Orogenic Belt. J. Geol. Soc. 2007, 164, 31–47. [Google Scholar] [CrossRef]
- Xiao, W.J.; Mao, Q.G.; Windley, B.F.; Han, C.M.; Qu, J.F.; Zhang, J.E.; Ao, S.J.; Guo, Q.Q.; Cleven, N.R.; Lin, S.F. Paleozoic multiple accretionary and collisional processes of the Beishan orogenic collage. Am. J. Sci. 2010, 310, 1553–1594. [Google Scholar] [CrossRef]
- He, Z.Y.; Zong, K.Q.; Jiang, H.Y.; Xiang, H.; Zhang, Z.M. Early Paleozoic tectonic evolution of the southern Beishan orogenic collage, Insights from the granitoids. Acta Petrol. Sin. 2014, 30, 2324–2338, (In Chinese with English Abstract). [Google Scholar]
- Wang, Q.S.; Zhang, J.; Cao, S.S.; Yu, L.D.; Sun, H.W. The element geochemistry, zircon U-Pb chronology and Nd-Hf isotope of the granitoids in Mazhuangshan area, Gansu Province. Acta Petrol. Sin. 2020, 36, 1445–1460, (In Chinese with English Abstract). [Google Scholar]
- He, Z.Y.; Klemd, R.; Zhang, Z.M.; Zong, K.Q.; Sun, L.X.; Tian, Z.L.; Huang, B.T. Mesoproterozoic continental arc magmatism and crustal growth in the eastern Central Tianshan Arc Terrane of the southern Central Asian Orogenic Belt, Geochronological and geochemical evidence. Lithos 2015, 236, 74–89. [Google Scholar] [CrossRef]
- Nie, F.J.; Jiang, S.H.; Zhao, S.M.; Bai, D.M.; Liu, Y.; Zhao, Y.M.; Wang, X.Y.; Su, X.X. Metallogenic Studies and Ore Prospecting in the Conjunction Area of Inner Mongolia Autonomous Region, Gansu Province and Xinjiang Uygur Autonomous Region (Beishan Mt), Northwest China; Beijing Geological Publishing House: Beijing, China, 2002; pp. 1–408, (In Chinese with English Abstract). [Google Scholar]
- Guo, Q.; Xiao, W.; Hou, Q.; Windley, B.F.; Han, C.; Tian, Z.; Song, D. Construction of Late Devonian Dundunshan arc in the Beishan orogen and its implication for tectonics of southern Central Asian Orogenic Belt. Lithos 2014, 184, 361–378. [Google Scholar] [CrossRef]
- Hu, Z.C.; Liu, Y.S.; Gao, S.; Liu, W.; Yang, L.; Zhang, W.; Tong, X.; Lin, L.; Zong, K.Q.; Li, M.; et al. Improved in situ Hf isotope ratio analysis of zircon using newly designed X skimmer cone and Jet sample cone in combination with the addition of nitrogen by laser ablation multiple collector ICP-MS. J. Anal. At. Spectrom. 2012, 27, 1391–1399. [Google Scholar] [CrossRef]
- Zhang, J.J.; Sun, S.J.; Zhang, L.P.; Deng, J.H.; Li, S.; Sun, W.D. Origin of transitional I-A-type syenite and its relationship to A-type intrusions in the Luzong Basin, the Lower Yangtze River Belt: Insights from geochemistry. Chem. Geol. 2023, 626, 121458. [Google Scholar] [CrossRef]
- Mingram, B.; Trumbull, R.B.; Littman, S.; Gerstenberger, H. A petrogenetic study of anorogenic felsic magmatism in the Cretaceous Paresis ring complex, Namibia, evidence for mixing of crust and mantle-derived components. Lithos 2000, 54, 1–22. [Google Scholar] [CrossRef]
- Yu, J.W.; Wang, Z.W.; Zhu, T.C.; Xing, K.; Meng, W.; Zhou, J.L.; Li, Y.G. Carboniferous Crustal Evolution in Northern Erenhot, Constraintfrom Zircon U-Pb Hf Isotopes of Volcano clastic Rocks in Halatumiao Group. J. Jilin Univ. (Earth Sci. Ed.) 2022, 54, 1153–1173, (In Chinese with English Abstract). [Google Scholar]
- Xi, Y.Z.; Li, Y.B.; Liu, J.J.; Wu, S.; Lu, N.; Liao, G.X.; Wang, Q.L. Application of Analytic Hierarchy Process in Mineral Prospecting Prediction Based on an Integrated Geology-Aerogeophysics-Geochemistry Model. Minerals 2023, 13, 978. [Google Scholar] [CrossRef]
- Agterberg, F. New applications of the model of de Wijs in regional geochemistry. Math. Geol. 2007, 39, 1. [Google Scholar] [CrossRef]
- Parsa, M.; Maghsoudi, A. Assessing the effects of mineral systems-derived exploration targeting criteria for random Forests-based predictive mapping of mineral prospectivity in Ahar-Arasbaran area, Iran. Ore Geol. Rev. 2021, 138, 104399. [Google Scholar] [CrossRef]
- Allard, D.; Comunian, A.; Renard, P. Probability aggregation methods in geoscience. Math. Geosci. 2012, 44, 545–581. [Google Scholar] [CrossRef]
- Chhabra, A.B.; Sreenivasan, K.R. Negative dimensions: Theory, computation, and experiment. Phys. Rev. A 1991, 43, 1114. [Google Scholar] [CrossRef] [PubMed]
- Chen, Y.; Lu, L.; Li, X. Application of continuous restricted Boltzmann machine to identify multivariate geochemical anomaly. J. Geochem. Explor. 2014, 140, 56–63. [Google Scholar] [CrossRef]
- Enkhsaikhan, M.; Liu, W.; Holden, E.J.; Duuring, P. Auto-labelling entities in low-resource text: A geological case study. Knowl. Inf. Syst. 2021, 63, 695–715. [Google Scholar] [CrossRef]
- Abedini, M.; Ziaii, M.; Negahdarzadeh, Y.; Ghiasi-Freez, J. Porosity classification from thin sections using image analysis and neural networks including shallow and deep learning in Jahrum formation. J. Min. Environ. 2018, 9, 513–525. [Google Scholar]
- Parsa, M.; Maghsoudi, A.; Yousefi, M. Spatial analyses of exploration evidence data to model skarn-type copper prospectivity in the Varzaghan district, NW Iran. Ore Geol. Rev. 2018, 92, 97–112. [Google Scholar] [CrossRef]
- Chorley, R.J.; Haggett, P. Trend-surface mapping in geographical research. Trans. Inst. Br. Geogr. 1965, 37, 47–67. [Google Scholar] [CrossRef]
- Journel, A.; Zhang, T. The necessity of a multiple-point prior model. Math. Geol. 2006, 38, 591–610. [Google Scholar] [CrossRef]


| Variant | Constant | Co | Zn | Ag | Sr | Mn | Bi | V | Ti | Be | Zr |
|---|---|---|---|---|---|---|---|---|---|---|---|
| factor | 20.13 | 0.45 | 0.12 | 0.04 | 0.005 | 0.005 | 2.91 | 0.21 | −0.004 | −1.19 | −0.01 |
| variant | Al2O3 | Fe2O3 | SiO2 | CaO | Ba | Ni | Cd | Hg | MgO | Mo | Cr |
| factor | 0.28 | 0.54 | −0.23 | −0.27 | 0.002 | 0.01 | −0.01 | 0.02 | −0.61 | 0.63 | 0.01 |
| variant | Au | Pb | Sn | P | K2O | B | La | U | Th | As | Na2O |
| factor | 0.09 | −0.04 | 0.30 | 0.002 | 0.48 | 0.02 | 0.02 | −0.20 | 0.04 | 0.10 | −0.51 |
| Model No. | Variables and Parameters | ||||||
|---|---|---|---|---|---|---|---|
| Model I | Variable | constant | Pb | ΔTd | ΔTx | Sn | Ti |
| Paramete | −1.71 | 0.06 | 0.004 | −0.004 | 0.20 | 0.0003 | |
| contribution | 32.23 | 27.66 | 19.69 | 8.99 | 6.01 | ||
| Variable | MgO | SiO2 | W | Mn | |||
| Paramete | −0.001 | 0.07 | −0.04 | 0.001 | |||
| contribution | 2.25 | 1.08 | 1.05 | 1.04 | |||
| Model II | Variable | constant | ΔTx | Fe2O3 | Cr | CaO | Cuh |
| Paramete | −2.83 | −0.004 | 0.54 | 0.02 | 0.10 | −0.07 | |
| contribution | 16.00 | 14.96 | 14.55 | 14.31 | 13.95 | ||
| Variable | MgO | Ni | Co | Al2O3 | P | ||
| Paramete | 0.16 | −0.03 | −0.09 | 0.002 | 0.001 | ||
| contribution | 6.30 | 6.04 | 5.93 | 5.10 | 2.86 | ||
| Class of Preferred Units | Number of Preferred Units | Ratio of Preferred Units to Total Projected Units | Number of Known Ore-Bearing Units | Ratio of Known Ore-Bearing Units to Preferred Units | Increase Multiplier for Known-Ore-Content Rate |
|---|---|---|---|---|---|
| Level I | 126 | 0.51% | 8 | 6.35% | 23.47 |
| Level II | 204 | 0.82% | 9 | 4.41% | 16.32 |
| Level III | 330 | 1.33% | 10 | 3.03% | 11.21 |
| Total | 660 | 2.66% | 27 | 4.09% | 15.13 |
| Class of Preferred Units | Number of Preferred Units | Ratio of Preferred Units to Total Projected Units | Number of Known Ore-Bearing Units | Ratio of Known Ore-Bearing Units to Preferred Units | Increase Multiplier for Known-Ore-Content Rate |
|---|---|---|---|---|---|
| Level I | 173 | 0.70% | 5 | 7.46% | 10.70 |
| Level II | 280 | 1.13% | 8 | 11.94% | 10.58 |
| Level III | 452 | 1.83% | 13 | 19.40% | 10.63 |
| Total | 905 | 3.65% | 26 | 38.81% | 10.63 |
| Class of Target Areas | Number of Preferred Target Areas | Ratio of Preferred Target Areas to Total Projected Target Areas | Number of Known Ore-Bearing Target Areas | Ratio of Known Ore-Bearing Target Areas to Preferred Target Areas | Increase Multiplier for Proportion of Target Areas with Minerals |
|---|---|---|---|---|---|
| Level I | 38 | 0.08% | 6 | 15.71% | 58.19 |
| Level II | 62 | 0.13% | 8 | 12.94% | 47.93 |
| Level III | 100 | 0.20% | 5 | 5.00% | 18.52 |
| Total | 200 | 0.40% | 19 | 9.50% | 35.19 |
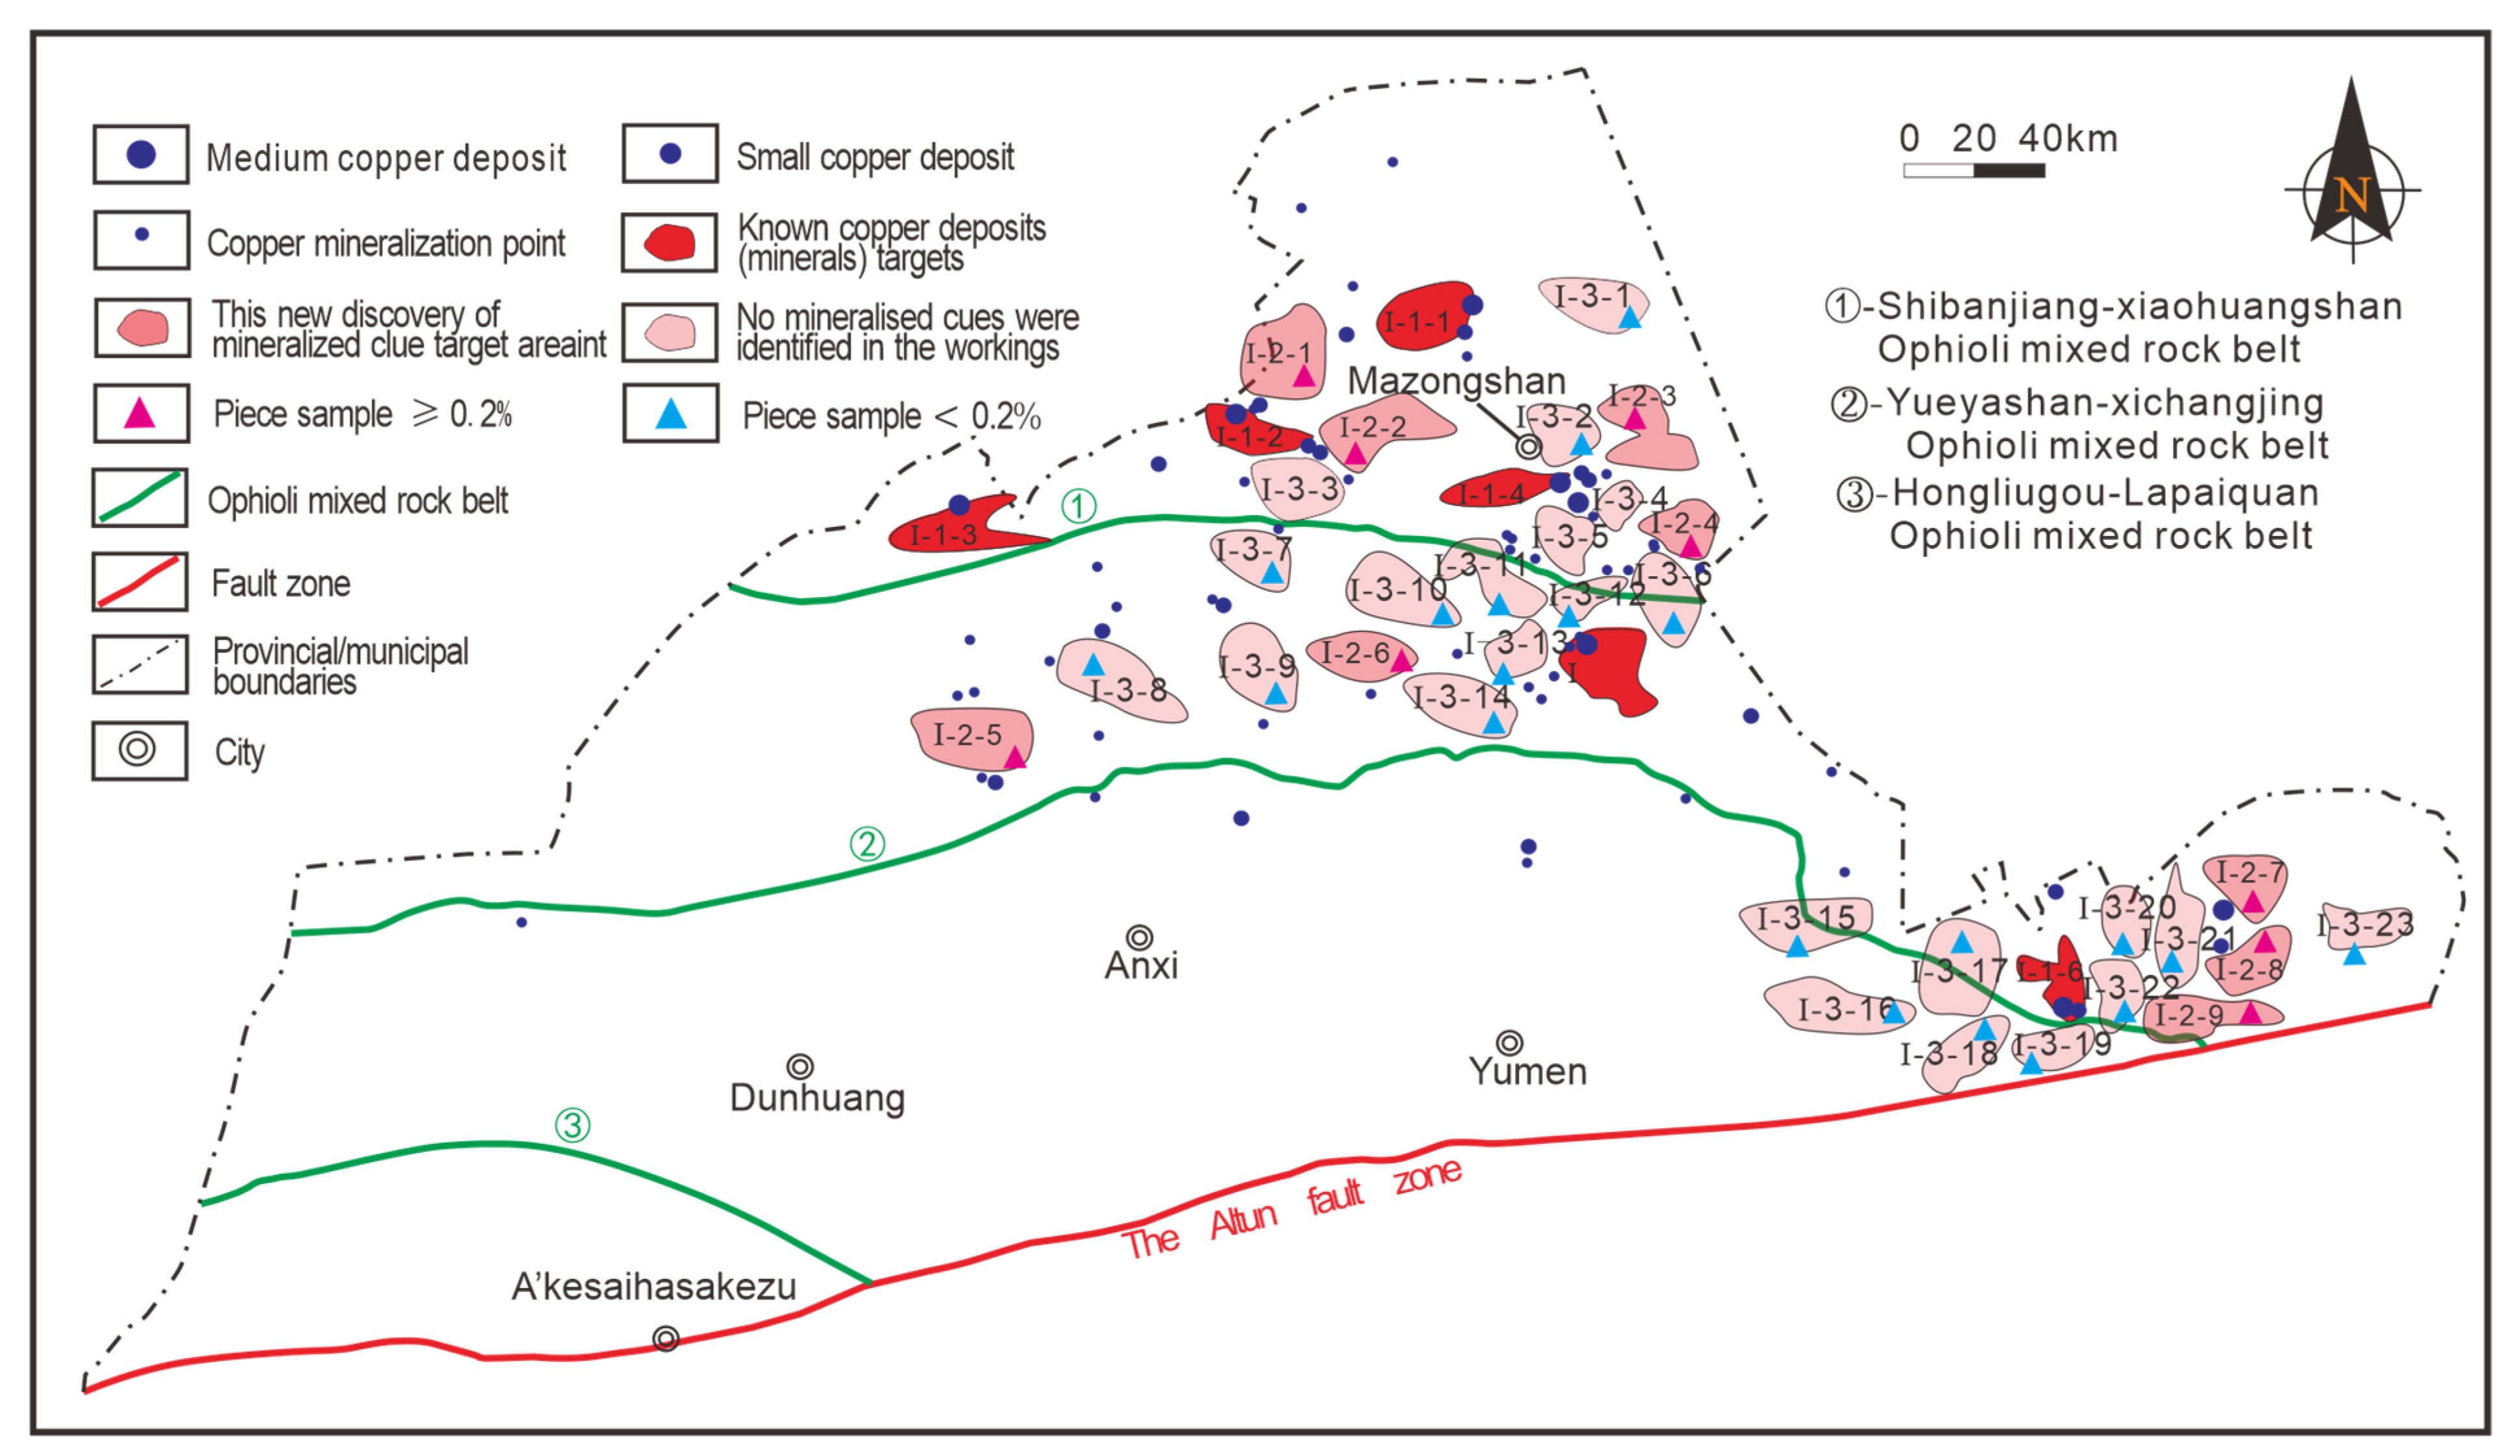
| Number of Target Area | Cu (10−2) | Number of Target Area | Cu (10−2) | Data Supplier |
|---|---|---|---|---|
| I-2-1 | 0.43–0.64 | I-2-2 | 0.33 | The Fourth Geological Survey Institute of Gansu Provincial Geology and Mining Bureau |
| I-2-3 | 0.28–0.35 | I-2-4 | 0.96–1.04 | |
| I-2-5 | 0.52–0.60 | I-2-6 | 0.42–1.21 | Geological Survey of Gansu Province |
| I-2-7 | 0.44–0.73 | I-2-8 | 0.22 | The Third Geological Survey Institute of Gansu Provincial Geology and Mining Bureau |
| I-2-9 | 0.83–1.76 | - | - |
Disclaimer/Publisher’s Note: The statements, opinions and data contained in all publications are solely those of the individual author(s) and contributor(s) and not of MDPI and/or the editor(s). MDPI and/or the editor(s) disclaim responsibility for any injury to people or property resulting from any ideas, methods, instructions or products referred to in the content. |
© 2025 by the authors. Licensee MDPI, Basel, Switzerland. This article is an open access article distributed under the terms and conditions of the Creative Commons Attribution (CC BY) license (https://creativecommons.org/licenses/by/4.0/).
Share and Cite
Zhu, L.; Han, R.; Zhang, Y.; Fu, H.; Luo, J.; Luo, Y.; Dai, T.; Li, H. Application of Multi-Source Data Mining Technology in the Optimization of Prospecting Target Areas for Copper Deposits in the Beishan Region of Gansu Province, China. Minerals 2025, 15, 467. https://doi.org/10.3390/min15050467
Zhu L, Han R, Zhang Y, Fu H, Luo J, Luo Y, Dai T, Li H. Application of Multi-Source Data Mining Technology in the Optimization of Prospecting Target Areas for Copper Deposits in the Beishan Region of Gansu Province, China. Minerals. 2025; 15(5):467. https://doi.org/10.3390/min15050467
Chicago/Turabian StyleZhu, Lihui, Runsheng Han, Yan Zhang, Hao Fu, Jianmin Luo, Yunzhi Luo, Taojie Dai, and Haidong Li. 2025. "Application of Multi-Source Data Mining Technology in the Optimization of Prospecting Target Areas for Copper Deposits in the Beishan Region of Gansu Province, China" Minerals 15, no. 5: 467. https://doi.org/10.3390/min15050467
APA StyleZhu, L., Han, R., Zhang, Y., Fu, H., Luo, J., Luo, Y., Dai, T., & Li, H. (2025). Application of Multi-Source Data Mining Technology in the Optimization of Prospecting Target Areas for Copper Deposits in the Beishan Region of Gansu Province, China. Minerals, 15(5), 467. https://doi.org/10.3390/min15050467