Abstract
Studies on emeralds from Habachtal (Austria) are scarce and non-exhaustive. However, they represent a significant interest to the community, as they have been assumed to be present in historical pieces of jewelry. Along with Egypt, Habachtal is suggested to be one of the main sources of gem-quality emeralds of archaeological significance. In this regard and due to their similar macroscopic look and geological context, it has always been challenging to distinguish Austrian and Egyptian emeralds set in historic jewelry. In this paper, a first comprehensive study of several Habchtal emeralds is presented based on a combination of classic gemology, chemistry and spectroscopy, using non-destructive to micro-destructive methods. Spectroscopic analyses, such as via Raman, FTIR and UV-Vis–NIR spectroscopies, showed that emeralds from Habachtal (Austria) contain Type II H2O molecules with alkalis and they are colored by chromium and iron, similarly to emeralds from Egypt. Under an optical microscope (and identified by Raman spectroscopy), actinolite needle-like inclusions are frequently observed in Austrian emeralds. Other inclusions, such as quartz, plagioclase, albite, phlogopite and pyrite, can also be observed in Austrian samples. Chemical analysis of Austrian emeralds’ trace elements by LA–ICP–MS show similar results to those from Egypt, with the exception of V, K and Rb, which show a lesser content in Austrian emeralds. Thanks to the determination of inclusions combined with a careful examination of specific chemistry, this study shows that Austrian emeralds can be distinguished from their Egyptian counterpart.
1. Introduction
1.1. General Information on Emeralds—Historical Sources
Emeralds are a gem variety of the beryl group of minerals, with the ideal chemical formula Be3Al2Si6O18 [1,2]. Based on their crystal structure and appearance, emeralds crystallize in hexagonal crystal system [3,4] and specifically in the dihexagonal-dipyramidal (6/m2/m2/m) class. Their crystals typically form hexagonal prisms (often with striations along the c-axis) [4]. Physically, emeralds are relatively hard but brittle due to fractures and various types of inclusions [5,6]. For some fine varieties of emeralds, these inclusions are often referred to as “jardin” (“Garden” in French) and there can be a combination of liquid, vapor and mineral inclusions, giving each emerald a unique appearance [7,8]. In most cases, the morphology and analysis of the inclusions in emeralds can be helpful to determine whether their origin is synthetic or natural [9,10], as well as for their geographical identification [11].
The crystal structure of emeralds (Figure 1) consists of SiO4 tetrahedra, which create six-membered rings that are aligned parallel to the c-axis [1,12]. Beryllium atoms reside at the centers of the tetrahedra, while aluminum atoms occupy the octahedral sites. Beryl’s crystal lattice along the c-axis has vacant spaces, known as “channels” [13,14]. Fourier transform infrared (FTIR) spectroscopy studies on beryl crystals have confirmed the presence of water molecules within the crystal structure [13,15,16]. These water molecules are classified into two distinct types: Type I and Type II [13,17,18]. Type I water molecules occur individually in the channels and the molecule’s symmetry axis is positioned perpendicular to the c-axis of the crystal. Type II water molecules are located, along with an alkali ion, in the channels of the crystal. The presence of an alkali ion (such as Li, Na, K, Rb and Cs) shifts the position of symmetry axis of the water molecule parallel to the c-axis of the crystal [15,18]. Trace elements, such as Cr3+ and V3+, are located as substitutes for aluminum in the beryl structure, and are the main cause of the characteristic green color in emerald varieties [13,17,19]. Traces of iron (Fe2+/Fe3+) may also contribute to the final color giving a yellowish or bluish tint, but the variety of beryl that is colored only by traces of iron falls under the term “Green beryl” rather than that of “Emerald” [1,2,19,20].
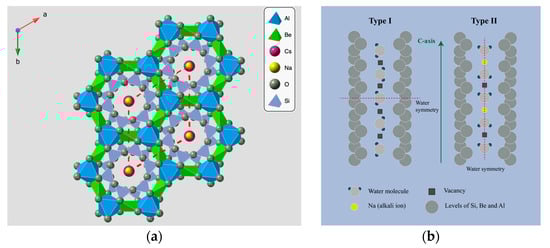
Figure 1.
Crystal Structure of beryl. (a) Crystal lattice of beryl perpendicular to c-axis. The red dashed lines show the channels in the structure of beryl occupied by alkali ions, such as Na+ and Cs+ (Designed in Crystal Maker, version: 11.1.1). (b) Type I and Type II water molecules in the channels (updated from Wood and Nassau, 1968, [13]. (Designed in Adobe Illustrator 2024, version: 28.6).
The unique combination of their chemical composition, crystal structure, and physical properties is the reason for the enduring appeal and high value of emeralds in the world of gemstones. Emeralds are undoubtedly one of the most popular gemstones in the trade. They have been discovered on almost every continent, but the most important deposits are currently found in Colombia, Zambia and Brazil. Smaller quantities are also mined in Afghanistan, Ethiopia, Madagascar, Russia and Zimbabwe [19,20].
From historical sources, it is believed that, in ancient times, the main deposits of emerald were in Egypt and in “Bactria” and “Scynthia” (the exact regions are not yet clearly identified, but the first could be located in the mountains of Afghanistan and Pakistan). Egypt’s ancient emerald mines, once the world’s primary source, played a vital role in trade and jewelry craftsmanship [21], influencing civilizations from the Roman times to the Middle Ages [22,23,24,25]. It has also been hypothesized that Austrian emeralds were used in jewelry before the 18th century [26]. Still, these results have been concluded solely based on oxygen isotope measurements—further examination with other methods might be needed for confirmation. Especially, there is no archaeological evidence which suggests that Habachtal deposits were mined in antiquity [8,27,28]. The Habachtal deposits in Austria, located in Hohe Tauern National Park (Salzburg), represent the oldest European mining activity dating back to the end of 18th century. Furthermore, this is the only place in Western Europe where emeralds can currently be economically exploited [29,30]. It could therefore be assumed to be a prime source for emeralds in Europe.
1.2. Geological Setting of Emeralds from Habachtal (Austria)
The primary deposit is situated near the tectonic contact between ortho-augen-gneisses and the lowest tectonic unit of the eastern Alps, better known as the Habach Formation, which is a series of amphibolite mica schists and phyllites with interlayered serpentinites [31,32]. Emerald secondary deposits in the Habachtal area, which are situated on the eastern slopes of a valley, around 70 km east of Innsbruck, were first reported in 1797 [27]. The primary emerald deposit of Habachtal was discovered a few years later, in the 1820s by Jakob Frischholz, who provided a detailed description of the site and of the extracted materials [27,33]. Open-pit mining activities for Austrian emeralds were first performed by Samuel Goldschmidt for a few years in the early 1860s [27], while systematic mining began in 1895. Between 1921 and 1927, efforts were made to explore mining opportunities, including a business plan aimed at producing both emeralds and industrial talc. However, no significant investment was made for talc production, and emerald mining only took place occasionally [33].
Today, the Habachtal emerald mine, after various ownerships and alternations of mining processes with periods of inactivity, is still in private possession [33,34]. The Habachtal emerald mine has been managed by the Steiner family from Bramberg since 1985. Alois Steiner and his son Andreas have supervised the mine’s operations since 2001 [33]. A team of three to four workers runs its small mining activities. The discoveries at the Habachtal mine are sold to mineral collectors, along with small amounts of material used to create jewelry, both in faceted and rough forms [8,33].
The genesis of the emerald deposits in Habachtal is connected with the Central and Western Tauern Window, thus the area was strongly influenced by Alpine regional metamorphism and syntectonic events [29,35,36]. This formation records both pre-Alpine and Alpine metamorphic events, with the dominant phase occurring during the Middle Alpine Barrovian-type metamorphism, which accounts for most of the emerald growth [31].
Emeralds were formed in metasomatic biotite, chlorite, actinolite and talc schists with intense schistosity (“black-wall” zone) due to regional metamorphism and deformation [1,2,29,32]. They grew during and after tectonic events, particularly at the boundary of gneiss rocks and biotite schists. Geochemical evidence suggests that the “black-wall” zone is enriched in Be, and developed between metapelites and mafic-volcanics, which originate from submarine volcanic activity [2,29,31,32,36]. The conversion of silicate minerals like muscovite to biotite and chlorite supports the formation of beryl, while chromium is considered to originate from altered meta-ultrabasic rocks (serpentinites and amphibolites) [1]. Grundmann and Morteani (1989) [29], argued for a regional metamorphic origin based on a multistage growth of emeralds with simultaneous deformation, such as sigmoidal inclusion trails. The absence of pegmatite rocks, which are considered the main source of Be, along with the absence of contact mineralization, is also evidence for the regional metamorphic origin of emeralds [29,30]. Fluid inclusions in the emeralds also suggest multiple deformation phases and similarities to Alpine metamorphic processes. Zwaan (2006) [30] claimed that, despite the lack of near clear pegmatites (the primary Be source) at the proximity, fluids can travel far away from them [1]. It is also noted that pegmatites are present in the Zentral gneiss, and the presence of up to 370 ppmw of cesium (Cs) in the Habachtal emeralds suggests a pegmatitic source [2,30,37], though C data show variability (79 to 157 ppmw) [2].
In the field, the emeralds of Habachtal can be located near the tectonic contact between ortho-augen-gneisses of the Zentral gneiss (central gneiss) and the Habach formation [31,32]. The primary host rock of the emeralds from this outcrop is a schist, which is composed of biotite, actinolite, tremolite, talc, chlorite, phengite, plagioclase, quartz, apatite and epidote [27,31,35].
The relative frequency of occurrence of the main minerals for the Habach formation is given in the following order [35]:
Beryl~Talc > Actinolite > Biotite ~ Chlorite > Phengite.
Along with emeralds, grey to blue aquamarines are also present, while other beryllium-containing minerals, like phenakite or chrysoberyl, are very rare. Occasionally, both beryl and emerald crystals are found together in the rock matrix, but crystals with zones of grey or bluish aquamarine and emerald are very rare. Most beryl crystals exhibit a chemical zonation with a decreasing Al concentration and an increasing Na + Mg + Fe concentration towards the edges [35].
Old and recent literature suggests that various types of inclusions can be observed in emeralds from Habachtal and the most frequent are mineral inclusions of actinolite–tremolite needles and biotite sheets [34,38,39,40]. In some cases, quartz, feldspar, apatite, epidote, chlorite, calcite, tourmaline, rutile, sphene and metallic mineral inclusions (pyrite, chromite, magnetite, ilmenite and chalcopyrite) can be observed but occur in smaller amounts [35,40]. Fluid and melt inclusions are not as common as mineral inclusions but, when present, are enriched in NaCl along with magnesite, trilithionite quartz, apatite and graphite as daughter phases [40]. Sometimes, the fluid inclusions are oriented parallel to the c-axis of the crystal. Inclusions with H2O and CO2 have also been observed [31], sometimes enriched in MgCO3, SiO2, NaCl, Na2CO3 and H3BO3, while the vapor phase is composed of CO2, N2 and CH4 [40]. Fluid inclusions trapped in Austrian emeralds can be divided into two generations [2,31]; the first generation with XCO2 below 4% and the later one with XCO2 up to 11 vol. %. The fluid inclusions are related to hydration phenomena due to alpine metamorphism [2,31]. The different growth stages of emeralds also represent different microstructures and inclusions [29]. The core of the emeralds (1st stage) contains randomly oriented inclusions of biotite, muscovite, chlorite, quartz, apatite, titanite and epidote. The core of the emeralds is surrounded by a zone (2nd stage) with a sigmoidal inclusions trail, along with actinolite inclusions, which indicate a syntectonic growth. The outer rim of the emeralds is usually an inclusion free zone (3rd stage), but the sigmoidal orientation of the previous stage of inclusions is clearly visible.
In the next sections of this article, a combination of results from microscopic, spectroscopic and chemical analysis of reliable Austrian emerald samples is presented for the first time. They have been compared to the results obtained with Egyptian emeralds because of their similar appearance and geological context. Both deposits are known to have produced emeralds of low quality with several inclusions, but they were cherished and widely used in jewelry for their vivid green color. The distinction between the two types of emeralds has not yet been established with certainty, but this article aims to offer reliable criteria for distinguishing them. These criteria could help with the better identification of emeralds of archaeological importance and offer further insight into the trading networks of the past.
2. Materials and Methods
For this study, 31 rough single-crystal emeralds and 2 emerald-bearing rocks were investigated (Figure 2) from Habachtal (Austria) for the Laboratoire Francais de Gemmologie (LFG) reference collection. The samples encompass a high degree of reliability, regarding the validity of their origin, as defined and classified by Vertriest et al., 2019 [41]. Samples collected in the field, directly by the gemmologist, are characterized as A-type and have the highest degree of reliability, while stones characterized as F-type come from international markets, which reference the geographic origin of the gems. In this study, 19 out of 31 samples belong to the A-type (all samples with PG and EF reference were collected by the authors directly at the mine) and 12 samples to the F-type (purchased from international markets, which reference the geographic origin of the gems).
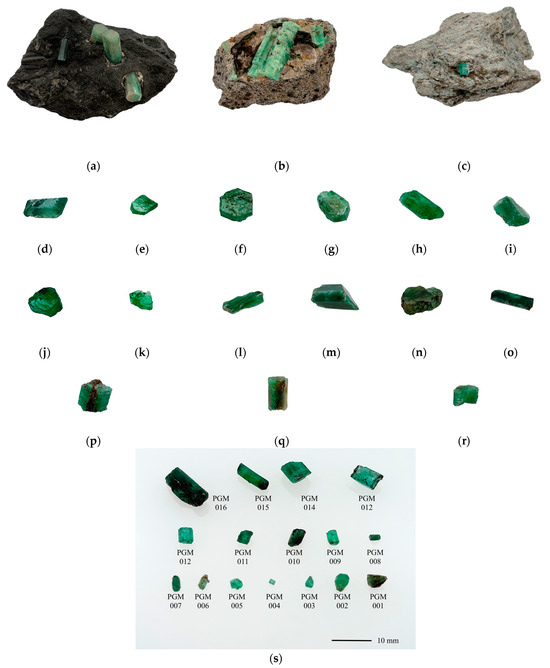
Figure 2.
Macroscopic pictures of the studied emerald samples from Austria. (a) ENSMP 13516 (92.41 × 62.89 × 47.23 mm), (b) PGM021 (55 × 33 × 42 mm), (c) PGM022 (60 × 42 × 38 mm), (d) N2EmBER#0001 (4.73 × 3.43 × 1.70 mm), (e) N2EmBER#0002 (4.29 × 3.74 × 1.33 mm), (f) N2EmBER#0003 (5.07 × 4.84 × 1.39 mm), (g) N2EmBER#0004 (4.35 × 3.08 × 2.56 mm), (h) N2EmBER#0005 (5.35 × 3.16 × 1.85 mm), (i) N2EmBER#0006 (6.88 × 4.73 × 2.13 mm), (j) N2EmBER#0007 (4.73 × 3.91 × 2.15 mm), (k) N2EmBER#0008 (4.08 × 3.15 × 1.52 mm), (l) N2EmBER#0057 (14.35 × 1.71 × 6.17 mm), (m) N2EmBER#0058 (15.19 × 7.08 × 8.41 mm), (n) N2EmBER#0059 (10.74 × 3.40 × 6.66 mm), (o) SK022 (13.82 × 5.48 × 3.50 mm), (p) EF-4185 (7.66 × 7.84 × 5.28 mm), (q) EF-4201 (8.01 × 4.45 × 3.85 mm), (r) EF-4202 (3.37 × 4.17 × 5.27 mm), (s) PGM001–PGM016. Photos by Maria Nikopoulou.
To complete this study, the Mineralogy Museum of the Paris School of Mines (Mines Paris—PSL) lent the LFG a rock containing emeralds from Habachtal (Austria), with the catalogue number ENSMP 13516. In this historic sample offered in 1887 by Professor Antoni Waga (1799–1890), the emerald crystals were glued onto the surface of the host rock for “scientific” purposes (in order to examine both the gem-quality emerald and the host rock on the same sample). The Mineralogy Museum also loaned 4 rough single-crystal emerald sample (Figure 3) from Egypt (previously studied by Nikopoulou et al., 2023) for LA–ICP–MS analysis and the results were compared with Austrian emeralds, in order to set the trace element discrimination criteria for these two historical localities. Information on the samples and the degree of their reliability [41] is given in Table 1.
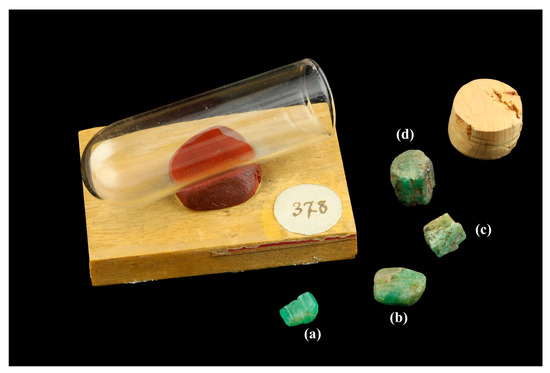
Figure 3.
Macroscopic images of Egyptian single-crystal emeralds from the Mineralogy Museum (Mines Paris—PSL). (a) ENSMP 72466_01 (7.25 × 3.73 × 4.33 mm), (b) ENSMP 72466_02 (7.29 × 5.43 × 5.55 mm), (c) ENSMP 72466_03 (9.94 × 5.69 × 7.38 mm), (d) ENSMP 72466_04 (10 × 7.98 × 8.32 mm). Photo: Mineralogy Museum of Mines Paris—PSL/E. Gaillou.

Table 1.
Emerald samples in this study and their reliability (1 carat = 0.2 g).
It was not possible to study all the samples with all the planned techniques, due to their size and/or the irregularity of their surfaces. For the optical observation of all samples and their inclusions, a Zeiss Stemi 508 binocular microscope (Carl Zeiss Microscopy Deutschland GmbH, Oberkochen, Deutschland) was used. The dimensions of the photos, which were taken with a microscope, are given as FOV (field of view). FOV represents the width of the photo measured in mm. Luminescence reaction was observed for 25 single-crystal emerald samples under a 6 W ultraviolet (UV) lamp (Vilber Lourmat VL-6.LC; Vilber Lourmat Deutschland GmbH, Eberhardzell, Germany) with long-wave ultraviolet (365 nm—LWUV) and short-wave ultraviolet (254 nm—SWUV) light, equipped with a CN-6 dark room (10 cm distance between samples and the lamp).
The Raman and Photoluminescence spectra were obtained from 21 out of 31 single-crystals (from Austria) and from host rock samples (from Austria). Both spectra were acquired by using a micro-Raman Renishaw inVia spectrometer (Renishaw plc, Wotton-under-Edge, Gloucestershire, UK), coupled with an optical microscope and with a 514 nm laser excitation (diode-pumped solid-state laser). Raman spectra from 100 to 2000 cm−1 region were obtained with 10 accumulation and 15 s exposure time with laser power at 100% and a region from 3000 to 3700 cm−1, with 10 accumulations and 10 s exposure time, with laser power at 100%. Raman spectra on the associated minerals from the 2 rocks were acquired from 100 to 4000 cm−1, with 10 accumulation and 15 s exposure time. Photoluminescence (PL) spectra (520–900 nm) were acquired with 10 s of exposure time, 1 accumulation and 0.1% laser power. A diamond was used for the calibration of the Raman spectrometer by considering its 1331.8 cm−1 Raman peak.
Fourier Transform Infrared Spectroscopy (FTIR) was applied to 25 out of 31 single-crystal samples using the Nicolet iS5 spectrometer (Thermo Fischer Scientific, Waltham, MA, USA) with 4 cm−1 resolution and 500 scans. For the Visible-Near Infrared (Vis-NIR) spectroscopy (from 365 to 1000 nm), which was applied to all 31 single-crystal samples, a mobile GemmoSphere instrument by Magilabs was used, equipped with an integrating sphere, and with an acquisition time of 0.05–0.50 s and 20 accumulations. Ultraviolet-visible (UV-Vis)-spectroscopy was conducted on 20 out of 31 single crystal samples (from Austria) by using Jasco V-630 from 250 to 850 nm with a data interval (DI) and spectral bandwidth (SBW) of 2 nm with 210 nm/min scan rate.
The chemical analysis of 8 single-crystal samples (from Austria) was conducted via Energy Dispersive X-ray Fluorescence Spectroscopy (EDXRF). We used sample holders of 5 mm diameter and a set of parameters were optimized for the most accurate analysis of examples of beryl. Various conditions were used for filters and voltage (no filter/4 kV, cellulose/8 8 kV, aluminum/12 kV, thin palladium/16 kV, medium palladium/20 kV, thick palladium/28 kV and thick copper/50 kV), with an acquisition time of about 20 min for each sample. All measured iron was calculated as FeO.
For a better determination and calculation of the trace elements (for 27 single-crystal Austrian emeralds and 4 single-crystal Egyptian emeralds), Laser Ablation—Inductively Coupled Plasma—Mass Spectrometry (LA–ICP–MS) was used. The LA–ICP–MS chemical analysis was performed at the Laboratory of Planetology and Geosciences (LPG UMR 6112), Nantes University, France, using a Quadropole Varian 820-MS (Varian Inc.; Palo Alto, CA, USA) Inductively Coupled Plasma-Mass Spectrometer (ICP-MS) coupled with a ArF excimer laser Analyte G2 equipped with the HelEx 2 volumes cell and operating at a wavelength of 193 nm (Teledyne Photon Machines, Bozeman, MT, USA). A laser spot of 40 μm in diameter was used, together with a fluence of around 9 J/cm2 and a 10 Hz repetition rate. For the ICP–MS operations, the forward power was set at ~1150 W, the dwell time for each isotope is fixed at 20 ms, the additional gas (argon) flow was ~1.0 L/min and the carrier gas (helium) was set at ~1 L/min. The acquisition signal is composed of 3 different parts: 30 s for blank, 30 s for signal and 30 s for washout. The criteria for the alignment and tuning sequence were established on NIST612 glass. The criteria were used to maximize the intensity counts for all elements, keep the U/Th ratio at around 1 and maintain the ThO/Th ratio below 0.5%. NIST 610 and NIST 612 glasses were used for calibration standards. The time-resolved signal was processed with GLITTER version 4.4.4 software using silicon (29Si) as the internal standard, applying 31.35 wt % theoretical value for beryl. Isotopes measured for all samples were 7Li, 23Na, 24Mg, 39K, 45Sc, 47Ti, 51V, 52Cr, 55Mn, 57Fe, 59Co, 60Ni, 66Zn, 69Ga, 85Rb and 133Cs.
3. Results and Discussion
3.1. Macroscopic, Microscopic and Gemmological Characteristics
The studied emerald crystals are semi-transparent to translucent and most of them present macroscopically a hexagonal prism habit with a dark green to slightly bluish green color. Interference colors can also be observed due to fissures and numerous fractures on the surface of the crystals. Some of these are cut perpendicular to the c-axis and a few crystals are polished parallel to the surfaces of the rough crystal. The size of the emeralds ranges from 1 mm to 25 mm. All samples are inert under SWUV and LWUV while most present dark areas which can be observed even with the naked eye due to the presence of various inclusions. Sometimes, the surface of the emeralds is partially covered by biotite sheets (identified by micro-Raman spectroscopy; see below) (Figure 4a).
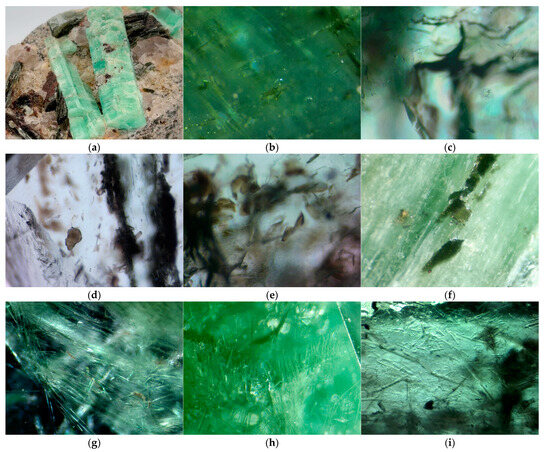
Figure 4.
Macroscopic and microscopic features of emeralds from Austria. (a) Emerald crystals in host rock. Mica sheets can be observed on the surface of the emeralds along with associated minerals such as quartz, feldspar and biotite (PGM021); FOV: 5 mm, (b) Two-phased fluid inclusions (N2EmBER#0001); FOV: 1.5 mm, (c) Two-phased fluid inclusions (N2EmBER#0058); FOV: 2 mm, (d) Biotite sheet inclusions (N2EmBER#0001); FOV: 2 mm, (e) Biotite sheet inclusions in random orientation (N2EmBER#0003); FOV: 1.5 mm, (f) Biotite sheets inclusions oriented parallel to the c-axis of the crystal (N2EmBER#0059); FOV: 2.5 mm, (g) Needle amphibole inclusions (N2EmBER#0002); FOV: 2.5 mm, (h) Amphibole needle inclusions (N2EmBER#0058); FOV: 2 mm, (i) Amphibole needle inclusions (N2EmBER#0005); FOV: 1.5 mm. Photos by Ugo Hennebois; LFG.
Under the microscope, various types of inclusions can be observed. Most of the samples show biotite sheet inclusions (Figure 4d,e), together with two-phased fluid inclusions in angular shapes and with random orientation (Figure 4b,c). In some cases, the biotite sheets may be oriented parallel to the c-axis of the beryl crystal (Figure 4f). Almost all samples show numerous inclusions of needle crystals (Figure 4g–i), which were identified as amphiboles (probably actinolite) by micro-Raman spectroscopy (see below). The minerals in the host rock samples were observed under the microscope and the main ones are quartz, feldspar (plagioclase) and mica (mainly phlogopite), also identified by micro-Raman spectroscopy (see below).
Emeralds which originate from Egypt present significantly different microscopic features compared to emeralds from Habachtal (Austria). Egyptian emeralds have fewer mineral inclusions and needle-like amphiboles have not yet been observed. They usually contain growth tubes and multiphase rectangular shaped inclusions [22,42].
3.2. Raman Spectroscopy
Micro-Raman spectra are presented from 200 to 1300 cm−1 for the typical Raman bands of the structure of beryl and from 3500 to 3700 cm−1 region for the OH-stretching vibrations; in these ranges, all samples showed similar Raman spectra.
Raman spectra in the area from 200 to 1300 cm−1 (Figure 5) present a peak at around 686 cm−1 attributed to ring vibrations and Be-O stretching vibrations [15,19,43,44,45,46]. The band at 1069 cm−1 is due to Si-O and/or Be-O stretching vibrations [19,42,43,44,45,46,47,48]. Additional bands at around 1010 and above 1100 cm−1 are common in natural emeralds are related to stretching vibrations of Si-O and inner vibrations, respectively [19,44,45,49], and weak Raman bands between 200 and 600 cm−1 are attributed to Si6O18 ring vibrations [19,44,49,50]. The relative intensity of the basic Raman peaks changes with the change in crystal orientation. It has been proposed that the alkali content in beryl, which corresponds to Type I and Type II water molecules, respectively, can be estimated by calculating the full width half maximum (FWHM) of the 1069 cm−1 peak [15,19,44]. Emeralds with low to medium alkali content have a FWHM < 22 cm−1, while emeralds with FWHM > 22 cm−1 have a high alkali content. The emerald samples from Habachtal present a medium to high amount of alkali content, as they have a FWHM > 22 cm−1 ranging from 22.15 to 23.41 cm−1.
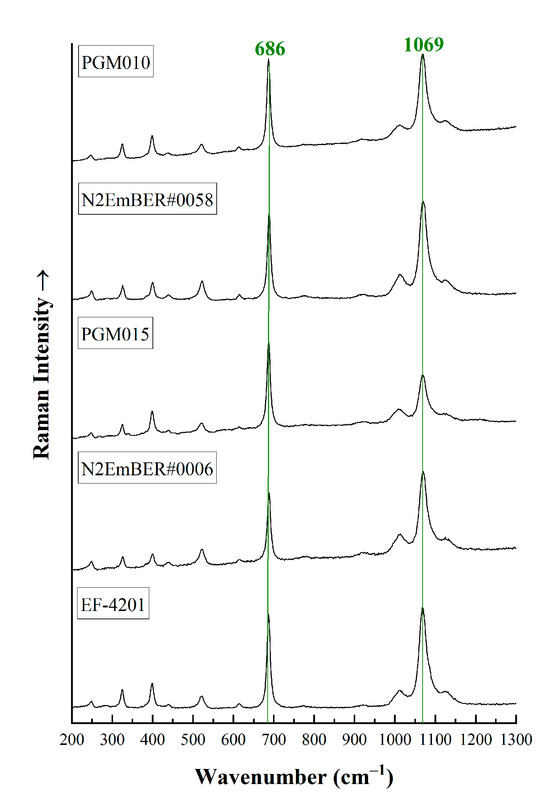
Figure 5.
Representative micro-Raman spectra from 200 to 1300 cm−1 of some emerald crystals from Austria. The main peaks at 686 cm−1 and 1069 cm−1 are mentioned. The spectra have been vertically offset for better clarity and they were acquired parallel or perpendicular to the c-axis of the crystals.
The Raman spectra area from 3500 to 3700 cm−1 (Figure 6) can also demonstrate the presence of alkali ions in the crystal structure based on the relative intensity of two sharp Raman bands at around 3598 and 3608 cm−1 [15,19,46,47]. The peak at around 3598 cm−1 is related to Type II water molecule vibrations (with the presence of an alkali ion nearby) [42,44], while the peak at 3608 cm−1 is related to Type I water molecule vibrations (absence of an alkali ion nearby). All studied samples from Habachtal (Austria) reveal higher intensity of the 3598 cm−1 peak compared to the 3608 cm−1 peak, which further confirms the presence of Type II water molecules [15,19,44,47].
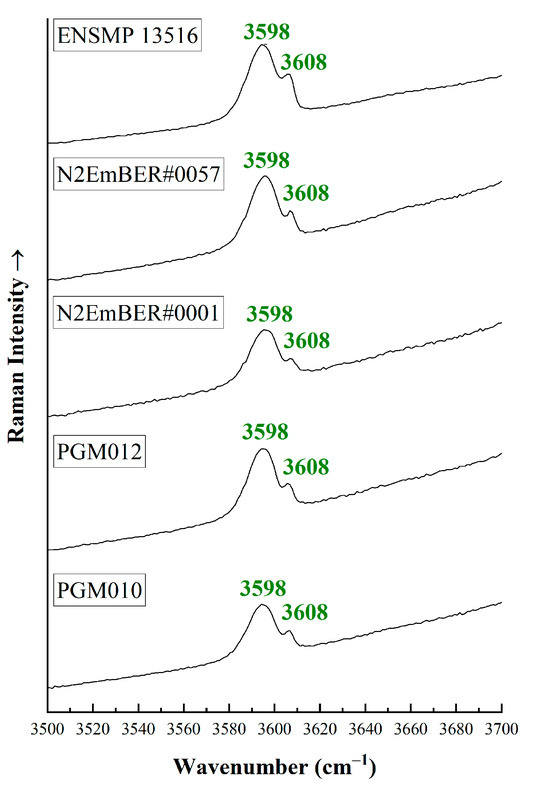
Figure 6.
Representative micro-Raman spectra from 3500 to 3700 cm−1 for some of the studied emeralds. The higher intensity of 3598 cm−1 compared to the 3608 cm−1 indicates the high alkali content in beryl crystals. The spectra have been vertically offset for better clarity and they were acquired parallel or perpendicular to the c-axis of the crystals.
Comparing the results of micro-Raman spectroscopy between the emeralds from Austria and those from Egypt [42], we can observe that they present a similar type of spectra. In both deposits, the crystals present higher intensity at the 3598 cm−1 peak, which corresponds to Type II water molecules in structure. Egyptian emeralds present a higher FWHM at 1069 cm−1, which ranges between 23 to 27 cm−1 and indicates a slightly higher concentration of alkalis in the crystals’ structure.
3.3. Photoluminescence (PL) Spectroscopy
PL spectroscopy from 600 to 900 nm (Figure 7) revealed two bands, one at around 680 with lower intensity and another at 684 nm with higher intensity. Both peaks are attributed to the presence of Cr3+ [19,45,51,52]. The peaks at 680 and 684 nm are better known as R2 and R1 lines, respectively [42,48,53]. The strong luminescence of chromium indicates that the studied beryl crystals can be characterized as emeralds. A broad band at around 740 nm is observed (known as Rn), also attributed to traces of Cr3+ [19,51,52,53]. The position of the R1 peak helps discriminate natural from synthetic emeralds [53]. In all analyzed emeralds, the R1 peak is higher than 683.7, so they can be considered as natural. According to Thomson et al. [53], the ratio of the relative heights of the R1/Rn peaks could also help determine the schist or non-schist origin of the emeralds, which correspond to high or low alkali concentrations (Type I and Type II water molecules) in the crystal structure, respectively. In the studied samples, the R1/Rn ranges from 0.36 to 0.46, revealing that the Austrian emeralds contain Type II water molecules in their structure [53]. Moreover, for all samples, the R1 peak position is above 684; therefore, we can further confirm that emeralds from Austria present high alkali content. According to previous research, the Egyptian emeralds [42] present similar spectra, with R1/Rn ratio ranging from 0.35 to 0.51.
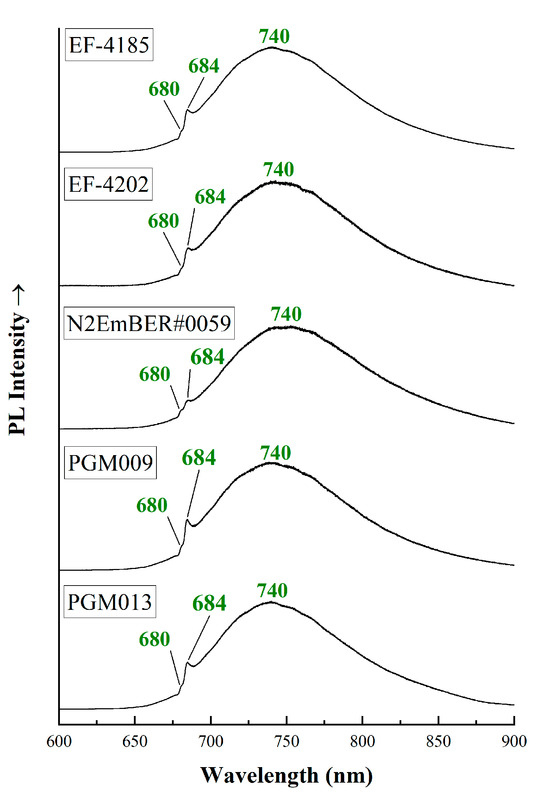
Figure 7.
PL spectra from micro-Raman instrument (laser excitation 514 nm). Peaks at around 680 nm and the broad peak at 740 nm are reported. The spectra have been vertically offset for better clarity and they were acquired parallel or perpendicular to the c-axis of the crystals.
3.4. Fourier Transform Infrared Spectroscopy (FTIR)
Most of the samples have irregular surface, thus the FTIR spectra are of low quality. Figure 8 shows the FTIR spectra of two samples in two regions, from 4500 to 7500 cm−1 and from 1300 to 1500 nm (approximately from 7700 to 6650 cm−1). Absorption bands at 5273 and 5590 cm−1 are related to the presence of Type I and Type II water molecules [19]. Peaks at 7072 cm−1 (1414 nm), 7092 cm−1 (1410 nm) and 7140 cm−1 (1400 nm) are attributed to Type II and Type I water molecules, respectively [9,19,54,55]. The higher the intensity of the peak at 7072 cm−1 (1414 nm), the higher the number of Type II water molecules in the emeralds’ channels. Similar spectra with higher intensity for the 7072 cm−1 (1414 nm) peak can also be observed in emeralds from Egypt [42].
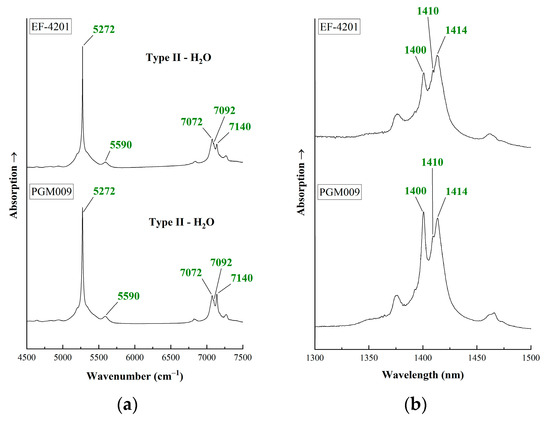
Figure 8.
FTIR spectra of emeralds from Habachtal (Austria). (a) FTIR spectra for the region from 4500 to 7500 cm−1. Green peaks at 5272, 5590, 7073 and 7140 cm−1 attributed to water molecules are reported; (b) FTIR spectra for the region from 1300 to 1500 nm (approximately 7500 to 6500 cm−1). Peaks attributed to water molecules are reported. The spectra have been offset vertically for better clarity.
3.5. Ultraviolet-Visible–Near-Infrared Spectroscopy (UV-Vis–NIR)
The emeralds from Habachtal (Austria) presented similar UV-Vis–NIR spectra (Figure 9). They show absorption bands at around 430 and 620 nm, which are both linked to Cr3+ in the octahedral site, as well as two sharp bands at around 680 nm due to R1 and R2 lines, also linked with chromium [9,11,19,42,48,54]. The broad band at 840 nm (near infrared, NIR) is due to the presence of iron [9,11,19,42,54]. In some cases, an absorption band at around 380 nm can be observed, which is related to the presence of Fe3+ [9,19,42,54], contributing to the yellow tint of the stone, but this is difficult to confirm due to the emeralds’ strong absorption in the UV region [42]. In Vis-NIR spectra, additional absorption peaks at around 960 nm due to the presence of water molecules can be observed [42,48,55].
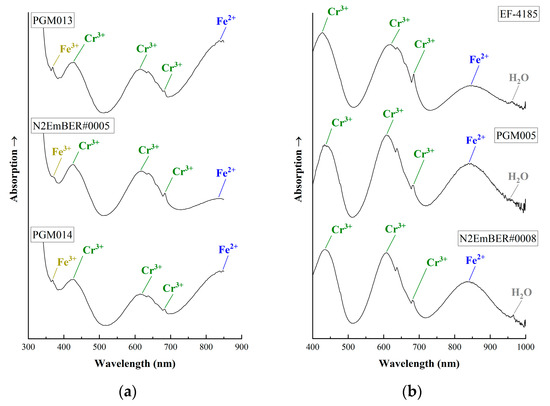
Figure 9.
UV-Vis–NIR spectra of emeralds from Habachtal (Austria). (a) UV-Vis spectra. The absorption bands of the Fe3+, Cr3+ and Fe2+ chromophore ions are reported. (b) Vis-NIR spectra using mobile instrument. The absorption bands of chromium and iron are mentioned. Additional absorption of water molecules at around 960 nm can be observed. The spectra have been offset vertically for better clarity and they were acquired parallel or perpendicular to the c-axis of the crystals.
UV-Vis–NIR spectra of emeralds from Egypt present similar absorption peaks to those from Austria, with chromium and iron being the main chromophore elements, while a slightly higher intensity of the Fe2+ absorption peak is observed in Egyptian emeralds [42].
3.6. Energy Dispersive X-Ray Fluorescence (EDXRF)
The results of the EDXRF analyses for 8 of the studied samples (Table 2) reveal high concentrations of FeO (up to 16,696 ppmw) and Cr2O3 (up to 2349 ppmw), which participate as coloring agents in the crystal structure of the emeralds. There is a lower participation of V2O3 (up to 309 ppmw). Detectable amounts of Rb2O were also calculated (up to 49 ppmw), while Cs2O presented a concentration of up to 450 ppmw, but in most cases the concentration is below the detection limit of the instrument.
Table 2.
Results of EDXRF of 8 Austrian emeralds from Habachtal in ppmw.
The chemical analyses of the samples by EDXRF reveal unusually high amounts of some elements due to the small size of the samples, which increases the uncertainty and error in the analyses. Moreover, most of the samples have many inclusions, as is usual for emeralds which originate from Austria. In addition, all elements were measured as oxides and calculated at 100%, which increases the error rate. In our case, the high number of mineral inclusions in the studied samples, together with the high penetration ability of the X-ray beam, also increase the content of specific elements. For the above reasons, only eight emerald samples were analysed with the EDXRF method based on their size, in order to prevent a high percentage of error; also, for each sample, the analysis point with the least number of inclusions was chosen to obtain the most accurate results.
Comparing the chemical results of emeralds from Austria to those from Egypt, it is apparent that emeralds from Egypt [42] show a higher concentration of V2O3 (172–665 ppmw) and a slightly higher amount of RbO2 (11–63 ppmw). The two emerald deposits present significant overlap, but in some cases, they can be distinguished, as Egyptian emeralds tend to have traces of V > 200 ppmw and traces of Rb > 20 ppmw.
3.7. Laser Ablation—Inductively Coupled Plasma—Mass Spectrometry (LA–ICP–MS)
The ICP method was used for the accurate calculation of trace elements in 27 emerald samples. All samples studied with the LA–ICP–MS technique revealed similar results (Table 3), which show that Austrian emeralds contain Na2O below 2.43% and MgO between 1.88% and 3.80%, with Na2O/MgO below 1 for all analyses, while Cr/V ratios range from 5.38 to 36.36 (see also Table S1). The sum of the concentrations of all alkali metals (Li + Na + K + Rb + Cs) ranges from 1.28% to 1.87%. The amount of Cs was considered at around 370 ppmw [30,56], and the LA–ICP–MS results of this study revealed concentrations from around 115 to 390 ppmw. Relatively low contents of Li (below 195 ppmw), V (below 250 ppmw), K (below 385 ppmw), and Rb (below 25 ppmw) were also observed.
Table 3.
Results of trace element analysis for 27 emeralds from Habachtal (Austria) measured by LA-ICP-MS in ppmw.
LA–ICP–MS analysis of Egyptian emeralds (Table 4) also presents low concentrations of Li (74.86–192.58 ppmw) but higher amounts of Rb (20.76–133.64 ppmw), V (255.44–429.82 ppmw), and K (196.47–1221.62 ppmw) compared to emeralds from Austria. Furthermore, the Egyptian emeralds show a relatively lower ratio of Cr/V (2.51–8.38), while the alkali content (Li + Na + K + Rb + Cs) has a narrower range from 1.47% to 1.83% (also see Table S2) compared to Austrian emeralds with a Na2O/MgO ratio ranging between 0.77 and 0.89.
Table 4.
Results of trace elements for 4 emerald crystals from Egypt measured by LA-ICP-MS in ppmw.
3.8. Associated Minerals and Minerals Inclusions Identified by Raman Spectroscopy
Two samples of the studied Austrian emeralds (PGM021 and PGM022) are embedded in host rocks and the paragenesis minerals of these rocks were identified by micro-Raman spectroscopy (Figure 10). This method revealed the presence of quartz, feldspar (plagioclase) and micas, such as biotite–phlogopite and phengite. The spectrum of feldspar corresponds to plagioclase (probably to albite) as it presents Raman bands at 292, 478 and 508 cm−1, which are related to different bending and rotational vibrational modes in the tetrahedral framework [57]. The phyllosilicate minerals investigated correspond to biotite–phlogopite, with main Raman peaks at 560, 678 and 787 cm−1 [58,59,60]. The high Raman spectra of mica samples present a sharp peak at 3705 cm−1 and a band of lower intensity at 3598 cm−1. These peaks are connected to OH-stretching vibrations, related to phlogopite [58,59,60,61]. A second type of mica was also detected by micro-Raman spectroscopy, which corresponds to the variety of phengite. Characteristic Raman bands are observed at 262, 410 and 700 cm−1. The high Raman spectra region shows a peak at 3615 cm−1 due to the OH-stretching vibrations of phengite [60,62].
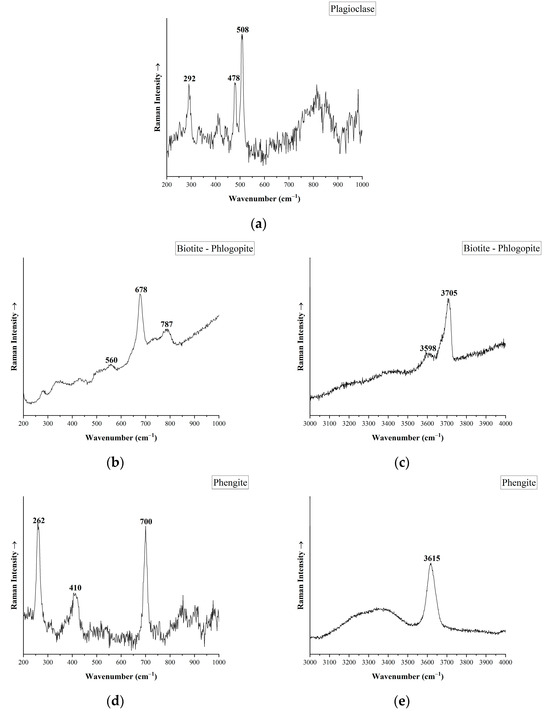
Figure 10.
Micro-Raman spectra of associated minerals from the host rock of Austrian emeralds. (a) Plagioclase-Albite (PGM021), (b) Low Raman spectra of Biotite-Phlogopite (PGM021), (c) High Raman spectra of Biotite-Phlogopite (PGM021), (d) Low Raman spectra of Phengite (PGM022), (e) High Raman spectra of phengite (PGM022).
These minerals were also found as inclusions in the emeralds along with other mineral inclusions which were tested with micro-Raman spectroscopy. The numerous needle-like crystal inclusions, which are described as amphiboles in the existing literature [34,38,39], presented similar Raman spectra and they were identified as actinolite [47,63], with main Raman bands at 224, 370, 394, 673, 930, 1058 cm−1 (Figure 11a). Raman spectra at high wavenumbers (from 3500 to 3700 cm−1) reveals two sharp peaks (Figure 11b) due to OH-stretching vibrations. The peak at 3675 cm−1 belongs to the tremolite–ferro-actinolite amphibole series, while the band at 3660 cm−1 is attributed to actinolite (rich in Fe) member [63]. The higher the intensity of the 3660 cm−1 peak, the stronger the presence of the ferro-actinolite member.
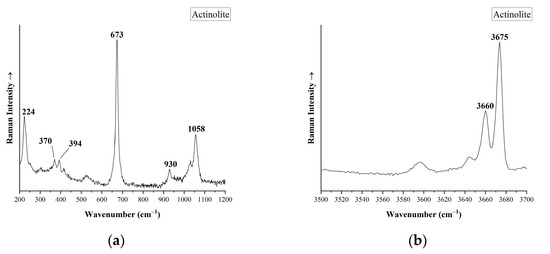
Figure 11.
Micro-Raman spectra of mineral amphibole inclusions in emeralds from Habachtal (Austria). (a) Raman spectra of actinolite in the region between 200 to 1200 cm−1 (N2EmBER#0002), (b) Raman spectra of actinolite in the region between 3500 to 3700 cm−1 (N2EmBER#0002). Basic Raman bands are mentioned.
3.9. Austrian Emeralds vs. Egyptian Emeralds
Spectroscopic, chemical and microscopic analyses of emeralds from Austria are scarce but they useful, as they can provide information on their chemical characteristics and structural features in order to distinguish them from emeralds of different origin. Our investigation suggests that the emeralds from Habachtal (Austria) have a schist-type origin with a relatively high concentration of alkalis, since the presence of Type II water molecules is higher than that of Type I. The alkali content in emeralds with Type II water molecules probably derives from hydrothermal fluids and/or magmatic intrusions (mostly pegmatites) [2]. All studied emerald samples from Austria are mainly colored by traces of chromium and iron. Observations under a gemological microscope along with micro-Raman analysis showed that Austrian emeralds contain a high quantity and great variety of mineral and fluid inclusions. Almost all samples present amphibole (actinolite) needles along with mica (phlogopite) inclusions. Additional analysed minerals present in the schist host are muscovite–phengite, quartz, and albite.
Considering the existing literature [2,8], based on their genesis, the emerald deposits can be classified in two main groups. The first group consists of Type I deposits, which are related to tectonic–magmatic geological environments together with granite-pegmatite intrusions. The second category are Type II deposits, in which the genesis of emeralds is related to tectonic–metamorphic events, such as metasomatism, shear zones and thrusts. The characterization of Austrian emerald deposits seems to be challenging according to the petrography of the region. The emerald deposits in Habachtal (Austria) are classified as Type IID and derive from the metamorphic remobilization of Type I deposits [2]. This theory states that initial Type I emerald deposits, which were related to hidden pegmatite or granite intrusions through mafic-ultramafic rocks (mostly amphibolites and mica schists), underwent metamorphic and tectonic events, which led to the formation of emeralds.
The genesis process of emerald deposits in Austria is quite similar to that of Egypt [1] and both deposits are classified as Type IID [2]. Both Austrian and Egyptian emeralds also present similar spectra, with Type II water molecules and chromium with iron related bands present with high intensities in Vis-NIR absorption spectra. Comparing chemical LA–ICP–MS data of emeralds from Egyptian and Austrian deposits, we observed that there is a significant overlap for most trace element concentrations. In general terms, traces of Rb, K and V could help distinguish emeralds from these two regions. Figure 12 shows binary plots of V versus Rb and V versus K trace element concentrations for the Egyptian and Austrian emeralds studied in this work. Considering the binary plots in the LA–ICP–MS results of this study, a distinct separation (clustering) between the two deposits is observed.
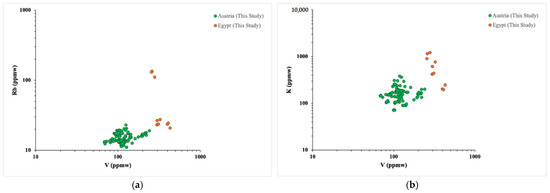
Figure 12.
Binary plots of trace elements in LA–ICP–MS results from emerald samples from Austria and Egypt. (a) V versus Rb binary plot, (b) V versus K binary plot.
The most important distinguishing feature between Austrian and Egyptian emeralds is the presence of different inclusions. In emeralds from Egypt, growth tubes and rectangular shaped multiphase fluid inclusions parallel to the c-axis of the crystal can be observed [22,42]. In contrast, emeralds from Habachtal present numerous actinolite needle-like inclusions and biotite sheets. Observation of inclusions together with measurement of trace elements and structural features could also prove useful in distinguishing Austrian emeralds from those of other deposits around the world.
4. Conclusions
In this article a dataset on reliable Austrian emeralds is presented. These data were compared with those obtained on emeralds from Egypt, since emeralds from both localities have similar appearance and are believed to have been used in ancient jewelry. Emeralds from Egypt and Austria presented here showed similar FTIR, Raman, PL and UV-Vis–NIR spectra. Chemical data were also very similar except for small differences in V, K and Rb content. Austrian emeralds contain less K, V and Rb than the emeralds from Egypt. It is important to note that the emeralds from the two mines present different internal characteristics; emeralds from Austria contain very frequently amphibole (actinolite) needles while those from Egypt contain tubes and rectangular shaped multiphase fluid inclusions parallel to the c-axis of the crystals. Additional reliable samples should be studied to further confirm these differences.
The differences presented above might help to further confirm or affirm the use of Austrian emeralds in antiquity. Note that, in order to confirm these first results obtained on a relatively small set of specimens, additional reliable samples should be studied.
Supplementary Materials
The following supporting information can be downloaded at: https://www.mdpi.com/article/10.3390/min15010022/s1, Table S1. LA–ICP–MS analysis in ppmw of the studied emerald samples from Habachtal, Austria; Table S2. LA–ICP–MS analysis in ppmw of the studied emerald samples from Egypt.
Author Contributions
M.N. formulated the paper, performed some of the experiments, performed data reduction, participated in the data interpretation, drew the figures and wrote the manuscript. S.K. and U.H. selected the samples, designed the experiments, performed some of the experiments, participated in the data interpretation and edited the manuscript. P.G., E.G., E.F., A.H., L.P., V.M., N.K. and A.D. participated in the data interpretation and edited the manuscript. All authors have read and agreed to the published version of the manuscript.
Funding
This research received no external funding.
Data Availability Statement
Data are contained within the article and supplementary materials.
Acknowledgments
The authors warmly thank Carole La responsible of the LA–ICP–MS facility at Laboratory of Planetology and Geosciences (LPG UMR 6112)—Nantes University for her valuable input during the analyses.
Conflicts of Interest
The authors declare no conflicts of interest.
References
- Groat, L.A.; Giuliani, G.; Marshall, D.D.; Turner, D. Emerald Deposits and Occurrences: A Review. Ore Geol. Rev. 2008, 34, 87–112. [Google Scholar] [CrossRef]
- Giuliani, G.; Groat, L.; Marshall, D.; Fallick, A.; Branquet, Y. Emerald Deposits: A Review and Enhanced Classification. Minerals 2019, 9, 105. [Google Scholar] [CrossRef]
- Sinkankas, J. Emerald and Other Beryls; Geoscience Press: Prescott, AZ, USA, 1981. [Google Scholar]
- Bauer, M. Precious Stones; Dover Publications, Inc.: New York, NY, USA, 1968. [Google Scholar]
- Webster, R.; Read, P. Gems: Their Sources, Descriptions, and Identification, 5th ed.; Butterworth-Heinemann: Oxford, UK, 1994. [Google Scholar]
- Read, P. Gemmology, 3rd ed.; NAG Press: London, UK, 1991. [Google Scholar]
- Lane, K. Emeralds. New World Objects of Knowledge: A Cabinet of Curiosities; Thurner, M., Pimentel, J., Eds.; University of London Press: London, UK, 2021; pp. 159–169. [Google Scholar]
- Giuliani, G. Émeraudes, Tout Un Monde; Les Editions du Piat, Galvenas-F-43200: Saint-Julien-de-Pinet, France, 2022. [Google Scholar]
- Saeseaw, S.; Pardieu, V.; Sangsawong, S. Three-Phase Inclusions in Emerald and Their Impact on Origin Determination. Gems Gemol. 2014, 50, 114–132. [Google Scholar] [CrossRef]
- Renfro, N.D.; Koivula, J.I.; Muyal, J.; McClure, S.F.; Schumacher, K.; Shigley, J.E. Inclusions in Natural, Synthetic, and Treated Emerald. Gems Gemol. 2016, 52, 402–403. [Google Scholar] [CrossRef]
- Saeseaw, S.; Renfro, N.D.; Palke, A.C.; Sun, Z.; McClure, S.F. Geographic Origin Determination of Emerald. Gems Gemol. 2019, 55, 614–646. [Google Scholar] [CrossRef]
- Aurisicchio, C.; Grubessi, O.; Zecchini, P. Infrared Spectroscopy and Crystal Chemistry of the Beryl Group. Can. Mineral. 1994, 32, 55–68. [Google Scholar]
- Wood, D.L.; Nassau, K. The Characterization of Beryl and Emerald by Visible and Infrared Absorption Spectroscopy. Am. Mineral. 1968, 53, 777–800. [Google Scholar]
- Don Goldman, S.; Rossman, G.R.; Parkin, K.M. Channel Constituents in Beryl. Phys. Chem. Miner. 1978, 3, 225–235. [Google Scholar] [CrossRef]
- Huong, L.T.-T.; Häger, T.; Hofmeister, W. Confocal Micro-Raman Spectroscopy: A Powerful Tool to Identify Natural And Synthetic Emeralds. Gems Gemol. 2010, 46, 36–41. [Google Scholar] [CrossRef]
- Fukuda, J.; Shinoda, K. Coordination of Water Molecules with Na+ Cations in a Beryl Channel as Determined by Polarized IR Spectroscopy. Phys. Chem. Miner. 2008, 35, 347–357. [Google Scholar] [CrossRef]
- Wang, H.; Shu, T.; Chen, J.; Guo, Y. Characteristics of Channel-Water in Blue-Green Beryl and Its Influence on Colour. Crystals 2022, 12, 435. [Google Scholar] [CrossRef]
- Della Ventura, G.; Radica, F.; Bellatreccia, F.; Freda, C.; Cestelli Guidi, M. Speciation and Diffusion Profiles of H2O in Water-Poor Beryl: Comparison with Cordierite. Phys. Chem. Miner. 2015, 42, 735–745. [Google Scholar] [CrossRef]
- Karampelas, S.; Al-Shaybani, B.; Mohamed, F.; Sangsawong, S.; Al-Alawi, A. Emeralds from the Most Important Occurrences: Chemical and Spectroscopic Data. Minerals 2019, 9, 561. [Google Scholar] [CrossRef]
- Karampelas, S.; Kiefert, L.; Bersani, D.; Vandenabeele, P. Gems and Gemmology; Springer International Publishing: Cham, Switzerland, 2020; ISBN 978-3-030-35448-0. [Google Scholar]
- Oller Guzmán, J. From the Sea, to the River, Throught the Desert. Some Issues Regarding the Emerald Trade Network in Roman Egypt. In Networked Spaces: The Spatiality of Networks in the Red Sea and Western Indian Ocean; MOM Editions: Lyon, France, 2022. [Google Scholar]
- Jennings, R.H.; Kammerling, R.C.; Kovaltchouk, A.; Calderon, G.P.; El Baz, M.K.; Koivula, J.I. Emeralds and Green Beryls of Upper Egypt. Gems Gemol. 1993, 29, 100–115. [Google Scholar] [CrossRef]
- Abdel Gawad, A.E.; Ene, A.; Skublov, S.G.; Gavrilchik, A.K.; Ali, M.A.; Ghoneim, M.M.; Nastavkin, A.V. Trace Element Geochemistry and Genesis of Beryl from Wadi Nugrus, South Eastern Desert, Egypt. Minerals 2022, 12, 206. [Google Scholar] [CrossRef]
- Khedr, M.Z.; Saleh, G.M.; Abdelfadil, K.M.; Takazawa, E.; Abdelrahman, K.; Tamura, A.; El-Shafei, S.A. The Geology and Mineral Chemistry of Beryl Mineralization, South Eastern Desert, Egypt: A Deeper Insight into Genesis and Distribution. Minerals 2024, 14, 465. [Google Scholar] [CrossRef]
- Harrell, J. Archaeological Geology of the World’s First Emerald Mine. Geosci. Can. 2004, 31, 69–76. [Google Scholar]
- Giuliani, G.; Chaussidon, M.; Schubnel, H.-J.; Piat, D.H.; Rollion-Bard, C.; France-Lanord, C.; Giard, D.; de Narvaez, D.; Rondeau, B. Oxygen Isotopes and Emerald Trade Routes Since Antiquity. Science 2000, 287, 631–633. [Google Scholar] [CrossRef]
- Schmetzer, K. History of Emerald Mining in the Habachtal Deposit of Austria, Part I. Gems Gemol. 2021, 57, 338–371. [Google Scholar] [CrossRef]
- Grundmann, G.; Koller, F. Exkursion: Das Smaragdbergwerk Im Habachtal, Land Salzburg, Österreich. Mitteilungen Der Osterr. Mineral. Ges. 2003, 148, 317–343. [Google Scholar]
- Grundmann, G.; Morteani, G. Emerald Mineralization during Regional Metamorphism; the Habachtal (Austria) and Leydsdorp (Transvaal, South Africa) Deposits. Econ. Geol. 1989, 84, 1835–1849. [Google Scholar] [CrossRef]
- Zwaan, J.C. (Hanco) Gemology, Geology and Origin of the Sandawana Emerald Deposits, Zimbabwe. Scr. Geol. 2006, 131, 1–211. [Google Scholar]
- Nwe, Y.Y.; Grundmann, G. Evolution of Metamorphic Fluids in Shear Zones: The Record from the Emeralds of Habachtal, Tauern Window, Austria. Lithos 1990, 25, 281–303. [Google Scholar] [CrossRef]
- Grundmann, G. Metamorphic Evolution of the Habach Formation A Review. Mitteilungen Der Osterr. Geol. Ges. 1989, 81, 133–149. [Google Scholar]
- Schmetzer, K. History of Emerald Mining in the Habachtal Deposit of Austria, Part II. Gems Gemol. 2022, 58, 18–46. [Google Scholar] [CrossRef]
- Gübelin, E.J. Emerald from Habachtal. J. Gemmol. 1956, 5, 342–361. [Google Scholar] [CrossRef]
- Franz, C.; Grundmann, G.; Ackermand, D. Rock Forming Beryl from a Regional Metamorphic Terrain (Tauern Window, Austria): Parageneses and Crystal Chemistry. TMPM Tschermaks Mineral. Und Petrogr. Mitteilungen 1986, 35, 167–192. [Google Scholar] [CrossRef]
- Grundmann, G.; Morteani, G. The Young Uplift and Thermal History of the Central Eastern Alps (Austria/Italy), Evidence from Apatite Fission Track Ages. Jahrb. Der Geol. Bundesanst. 1985, 128, 197–216. [Google Scholar]
- Aurisicchio, C.; Conte, A.M.; Medeghini, L.; Ottolini, L.; De Vito, C. Major and Trace Element Geochemistry of Emerald from Several Deposits: Implications for Genetic Models and Classification Schemes. Ore Geol. Rev. 2018, 94, 351–366. [Google Scholar] [CrossRef]
- Gübelin, E. On the Nature of Mineral Inclusions in Gemstnes. J. Gemmol. 1969, 11, 149–192. [Google Scholar] [CrossRef]
- Kane, R.E.; Boehm, E.W.; Overlin, S.D.; Dirlam, D.M.; Koivula, J.I.; Smith, C.P. A Gemological Pioneer: Dr. Edward J. Gübelin. Gems Gemol. 2005, 41, 298–327. [Google Scholar] [CrossRef]
- Thomas, R.; Davidson, P.; Rericha, A. Emerald from the Habachtal: New Observations. Miner. Pet. 2020, 114, 161–173. [Google Scholar] [CrossRef]
- Vertriest, W.; Palke, A.C.; Renfro, N.D. Field Gemology: Building a Research Collection and Understanding the Development of Gem Deposits. Gems Gemol. 2019, 55, 490–511. [Google Scholar] [CrossRef]
- Nikopoulou, M.; Karampelas, S.; Gaillou, E.; Hennebois, U.; Maouche, F.; Herreweghe, A.; Papadopoulou, L.; Melfos, V.; Kantiranis, N.; Nectoux, D.; et al. Non-Destructive Study of Egyptian Emeralds Preserved in the Collection of the Museum of the Ecole Des Mines. Minerals 2023, 13, 158. [Google Scholar] [CrossRef]
- Jehlička, J.; Culka, A.; Bersani, D.; Vandenabeele, P. Comparison of Seven Portable Raman Spectrometers: Beryl as a Case Study. J. Raman Spectrosc. 2017, 48, 1289–1299. [Google Scholar] [CrossRef]
- Bersani, D.; Azzi, G.; Lambruschi, E.; Barone, G.; Mazzoleni, P.; Raneri, S.; Longobardo, U.; Lottici, P.P. Characterization of Emeralds by Micro-Raman Spectroscopy. J. Raman Spectrosc. 2014, 45, 1293–1300. [Google Scholar] [CrossRef]
- Moroz, I.; Roth, M.; Boudeulle, M.; Panczer, G. Raman Microspectroscopy and Fluorescence of Emeralds from Various Deposits. J. Raman Spectrosc. 2000, 31, 485–490. [Google Scholar] [CrossRef]
- Hagemann, H.; Lucken, A.; Bill, H.; Gysler-Sanz, J.; Stalder, H.A. Polarized Raman Spectra of Beryl and Bazzite. Phys. Chem. Miner. 1990, 17, 395–401. [Google Scholar] [CrossRef]
- Huong, L.T. Microscopic, Chemical and Spectroscopic Investigations on Emeralds of Various Origins. Ph.D. Thesis, Pharmazie und Geowissenschaften der Johannes Gutenberg-Universität Mainz, Mainz, Germany, 2008. [Google Scholar]
- Nikopoulou, M.; Karampelas, S.; Tsangaraki, E.; Papadopoulou, L.; Katsifas, C.; Nazlis, I.; Touloumtzidou, A.; Melfos, V.; Kantiranis, N. Study of Green-coloured Gems of the Roman Period from the Collections of the Archaeological Museum of Thessaloniki (Greece) and Their Possible Geographic Origin. J. Raman Spectrosc. 2024, 55, 1341–1354. [Google Scholar] [CrossRef]
- Moroz, I.; Panczer, G.; Roth, M. Laser-Induced Luminescence of Emeralds from Different Sources. J. Gemmolgy 1998, 26, 316–320. [Google Scholar] [CrossRef]
- Bersani, D.; Lottici, P.P. Applications of Raman Spectroscopy to Gemology. Anal. Bioanal. Chem. 2010, 397, 2631–2646. [Google Scholar] [CrossRef] [PubMed]
- Wood, D.L. Absorption, Fluorescence, and Zeeman Effect in Emerald. J. Chem. Phys. 1965, 42, 3404–3410. [Google Scholar] [CrossRef]
- Karampelas, S.; Gaillou, E.; Herreweghe, A.; Maouche, F.; Hennebois, U.; Leblan, S.; Sainte Beuve, B.M.; Lechartier, M.; Nectoux, D.; Delaunay, A. A Gemological and Spectroscopic Study with Mobile Instruments of “Emeralds” from the Coronation Crown of Napoleon III. Gems Gemol. 2022, 58, 168–183. [Google Scholar] [CrossRef]
- Thompson, D.B.; Kidd, J.D.; Åström, M.; Scarani, A.; Smith, C.P. A Comparison of R-Line Photoluminescence of Emeralds from Different Origins. J. Gemmol. 2014, 34, 334–343. [Google Scholar] [CrossRef]
- Van Meerbeeeck, M. IR and UV-Vis Spectroscopy of Gem Emeralds: A Tool to Differentiate Natural, Synthetic and/or Treated Stones. Master’s Thesis, Universiteit Gent, Ghent, Belgium, 2009. [Google Scholar]
- De Araújo Neto, J.F.; Barreto, S.d.B.; Carrino, T.A.; Müller, A.; Santos, L.C.M.d.L. Mineralogical and Gemological Characterization of Emerald Crystals from Paraná Deposit, NE Brazil: A Study of Mineral Chemistry, Absorption and Reflectance Spectroscopy and Thermal Analysis. Braz. J. Geol. 2019, 49, e20190014. [Google Scholar] [CrossRef]
- Calligaro, T.; Dran, J.-C.; Poirot, J.-P.; Querré, G.; Salomon, J.; Zwaan, J.C. PIXE/PIGE Characterisation of Emeralds Using an External Micro-Beam. Nucl. Instrum. Methods Phys. Res. B 2000, 161–163, 769–774. [Google Scholar] [CrossRef]
- Bersani, D.; Aliatis, I.; Tribaudino, M.; Mantovani, L.; Benisek, A.; Carpenter, M.A.; Gatta, G.D.; Lottici, P.P. Plagioclase Composition by Raman Spectroscopy. J. Raman Spectrosc. 2018, 49, 684–698. [Google Scholar] [CrossRef]
- Tutti, F.; Lazor, P. Temperature-Induced Phase Transition in Phlogopite Revealed by Raman Spectroscopy. J. Phys. Chem. Solids 2008, 69, 2535–2539. [Google Scholar] [CrossRef]
- McKeown, D.A.; Bell, M.I.; Etz, E.S. Raman Spectra and Vibrational Analysis of the Trioctahedral Mica Phlogopite. Am. Mineral. 1999, 84, 970–976. [Google Scholar] [CrossRef]
- Tlili, A.; Smith, D.C.; Beny, J.-M.; Boyer, H. A Raman Microprobe Study of Natural Micas. Miner. Mag. 1989, 53, 165–179. [Google Scholar] [CrossRef]
- Wang, A.; Freeman, J.J.; Jolliff, B.L. Understanding the Raman Spectral Features of Phyllosilicates. J. Raman Spectrosc. 2015, 46, 829–845. [Google Scholar] [CrossRef]
- Li, H.; Zhang, L.; Christy, A.G. The Correlation Between Raman Spectra and the Mineral Composition of Muscovite and Phengite. In Ultrahigh-Pressure Metamorphism; Elsevier: Amsterdam, The Netherlands, 2011; pp. 187–212. [Google Scholar]
- Bersani, D.; Andò, S.; Scrocco, L.; Gentile, P.; Salvioli-Mariani, E.; Fornasini, L.; Lottici, P.P. Composition of Amphiboles in the Tremolite–Ferro–Actinolite Series by Raman Spectroscopy. Minerals 2019, 9, 491. [Google Scholar] [CrossRef]
Disclaimer/Publisher’s Note: The statements, opinions and data contained in all publications are solely those of the individual author(s) and contributor(s) and not of MDPI and/or the editor(s). MDPI and/or the editor(s) disclaim responsibility for any injury to people or property resulting from any ideas, methods, instructions or products referred to in the content. |
© 2024 by the authors. Licensee MDPI, Basel, Switzerland. This article is an open access article distributed under the terms and conditions of the Creative Commons Attribution (CC BY) license (https://creativecommons.org/licenses/by/4.0/).