
The Dependence of Ilmenite’s Dissolution Rate in Hydrochloric Acid on the Fe(III)/Fe(II) Ratio, with Fe K-Edge XANES Pre-Edge Peak Analysis

 ,
,
Abstract
1. Introduction
2. Materials and Methods
2.1. Ilmenite
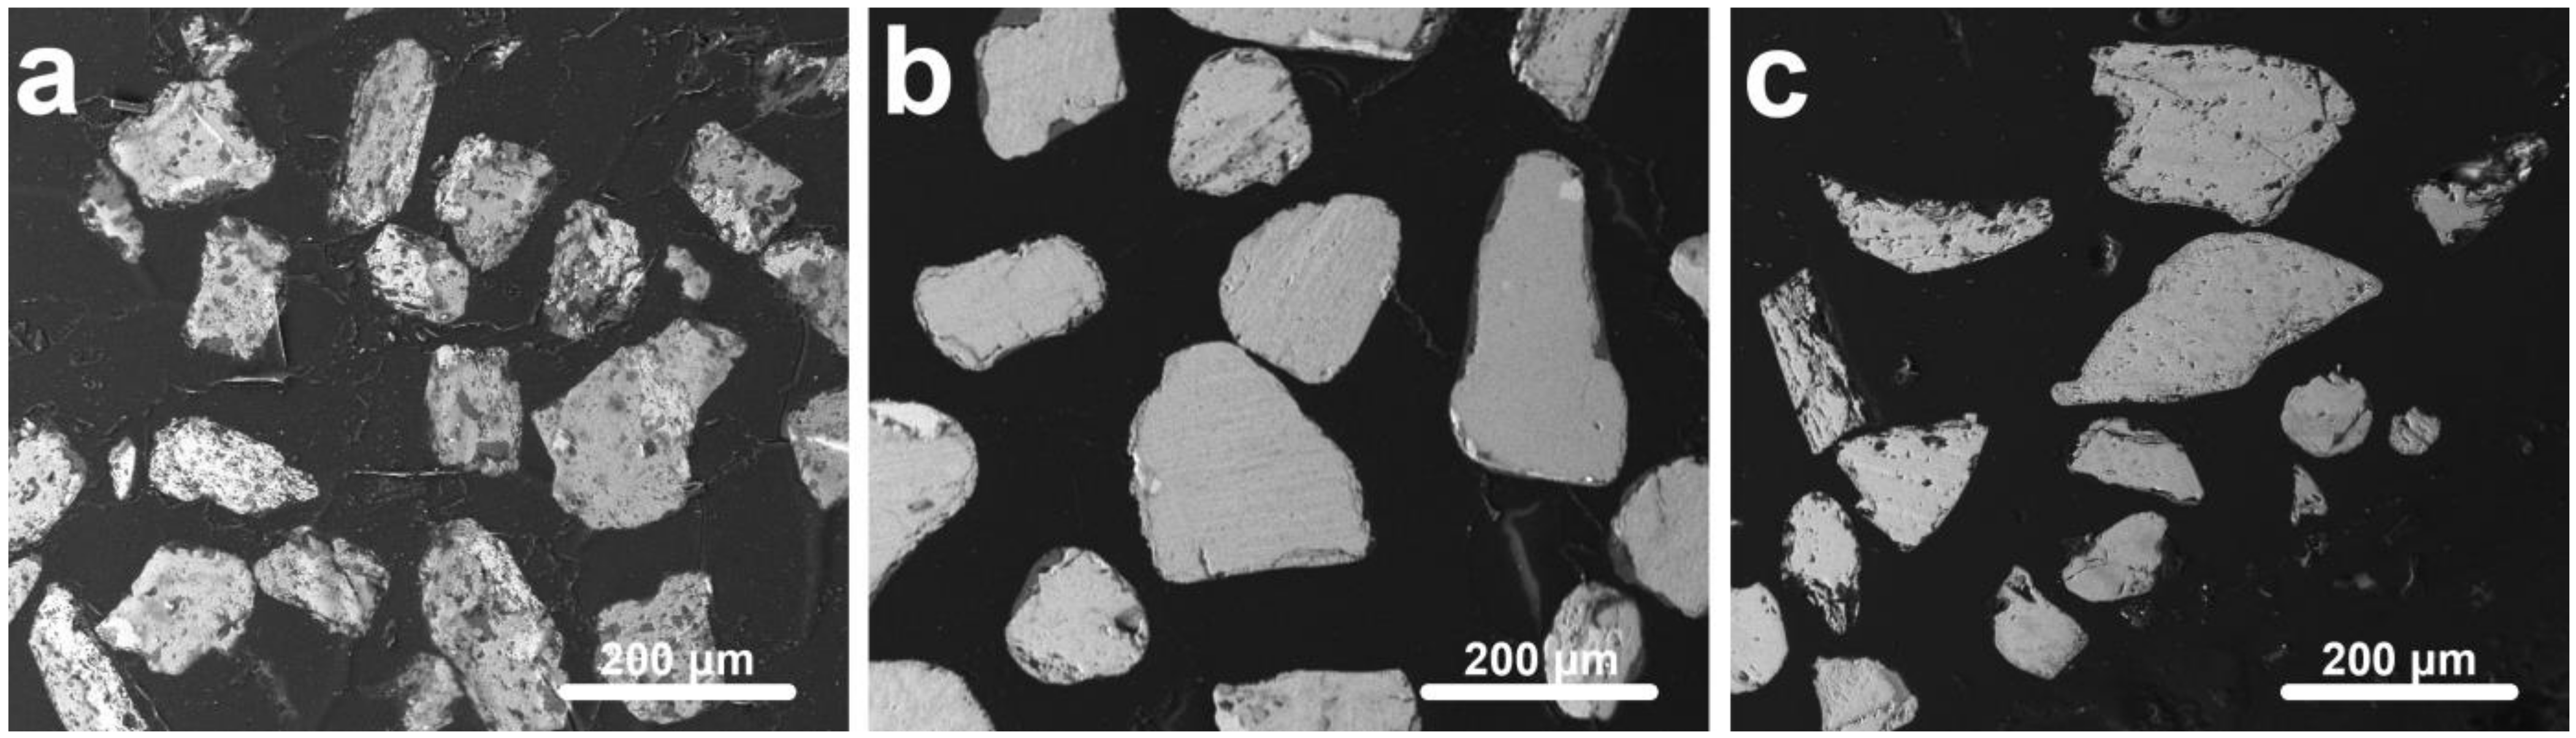
2.2. SEM/EDS
2.3. Dissolution Procedure
2.4. Dissolution Kinetics
2.5. X-Ray Absorption Spectroscopy (XAS)
3. Results and Discussion
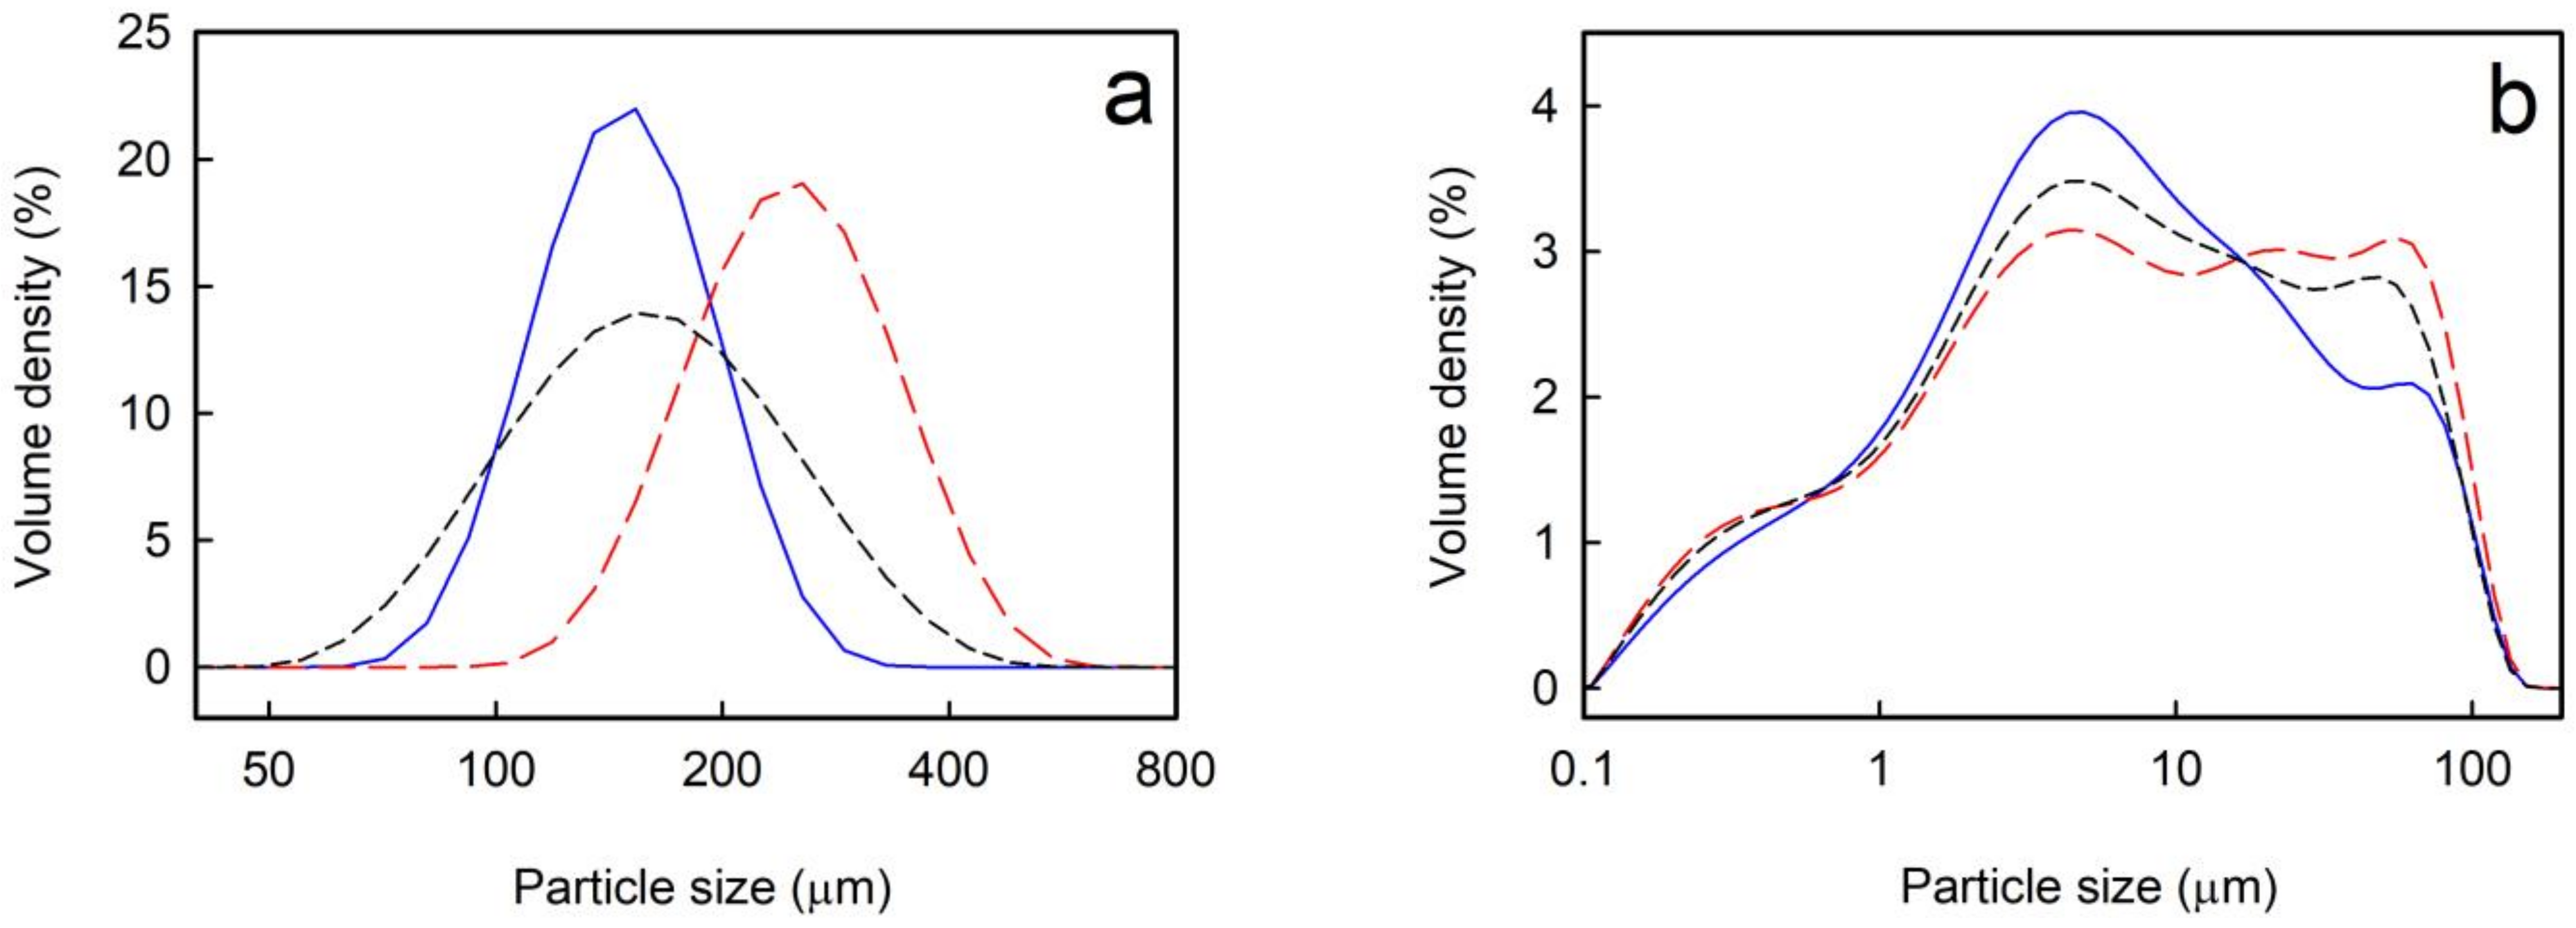
3.1. Particle Size Distribution
3.2. Ilmenite Composition
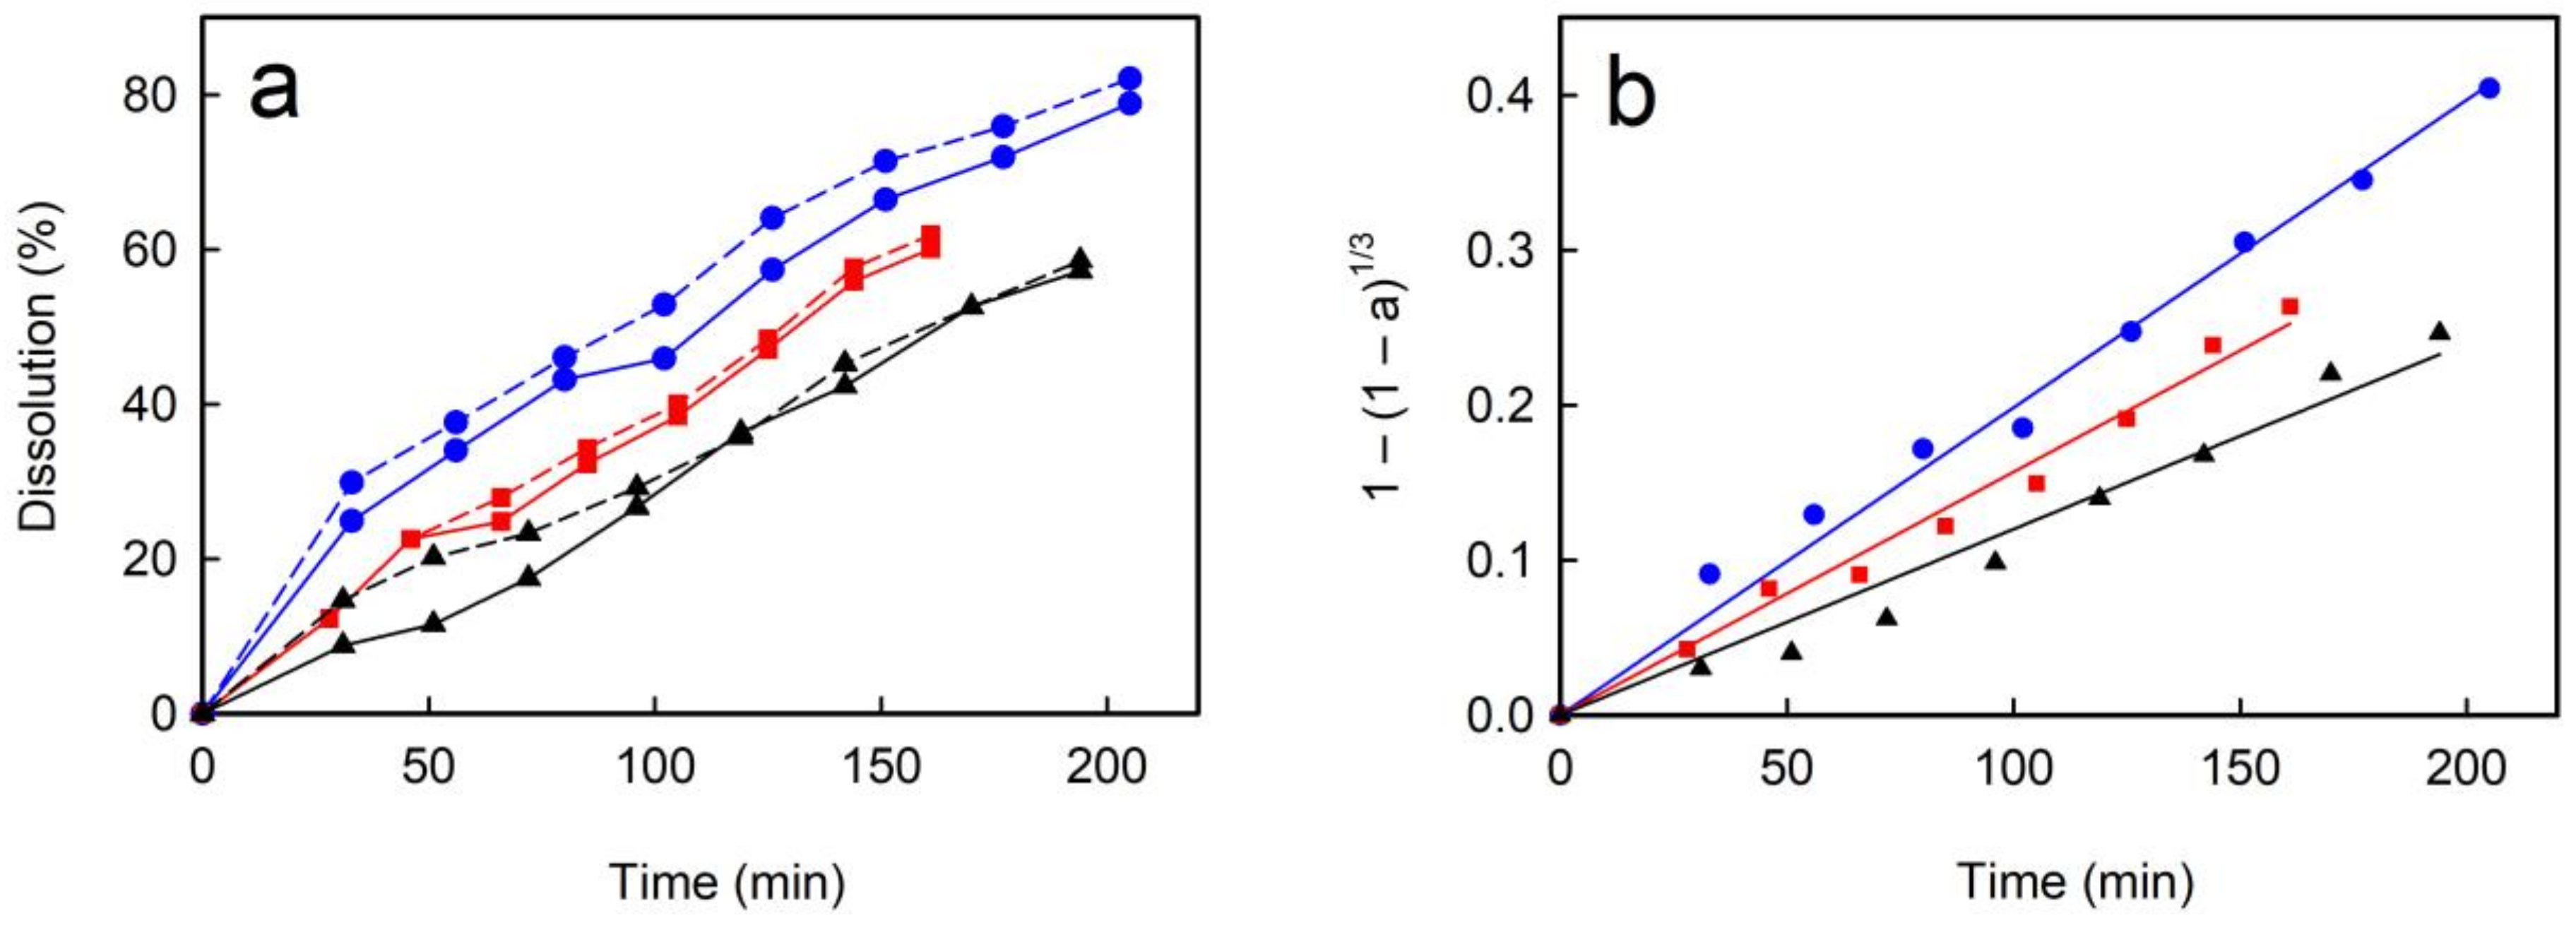
3.3. Dissolution Kinetics
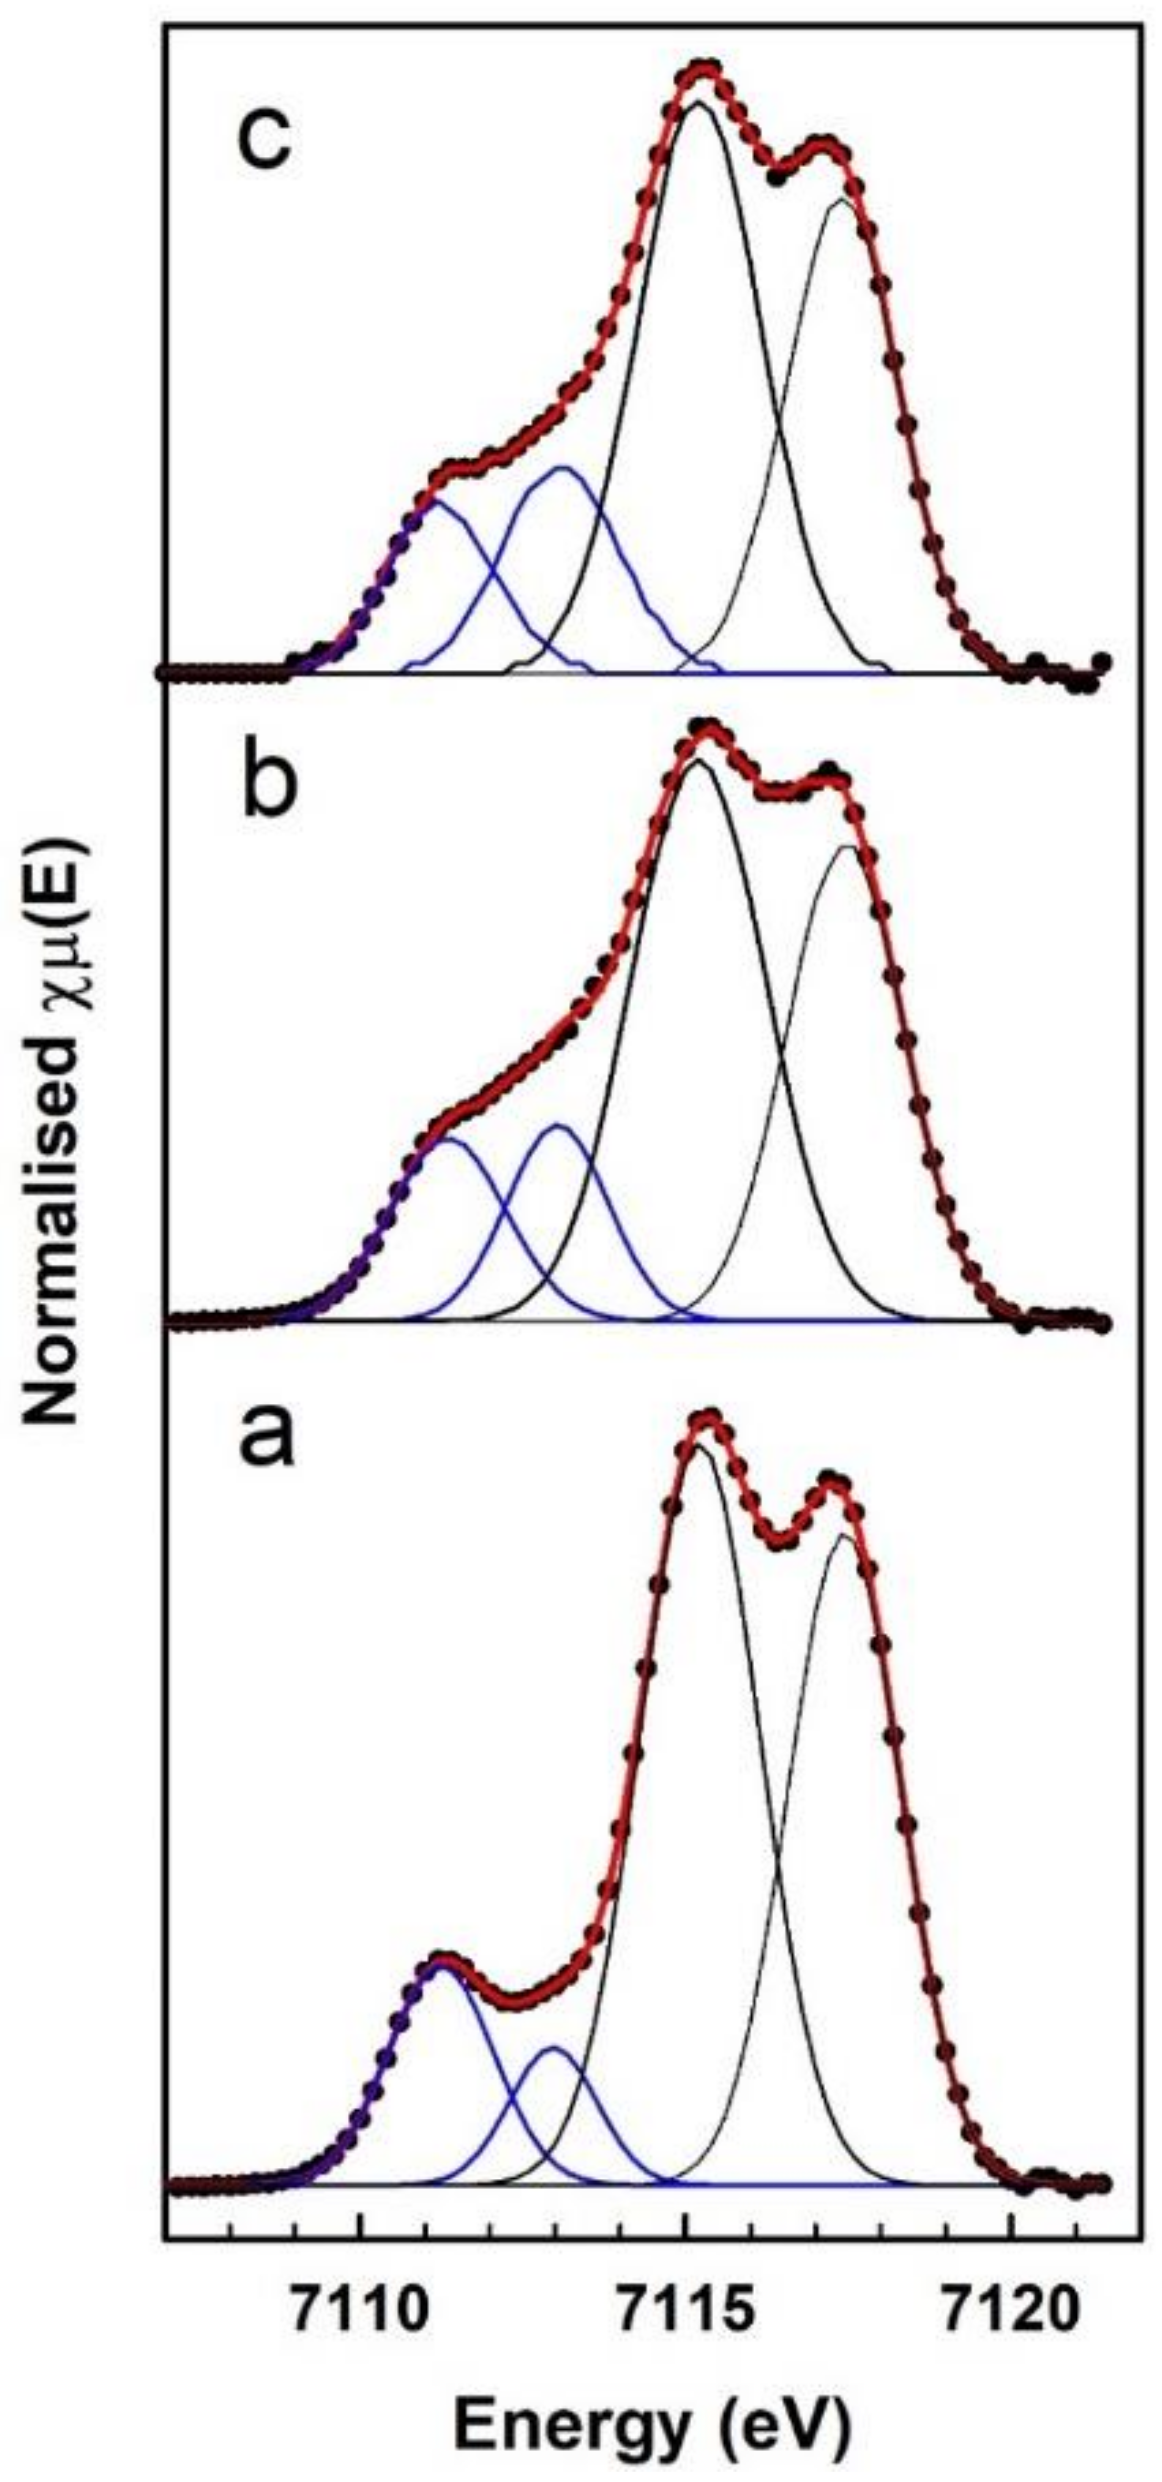
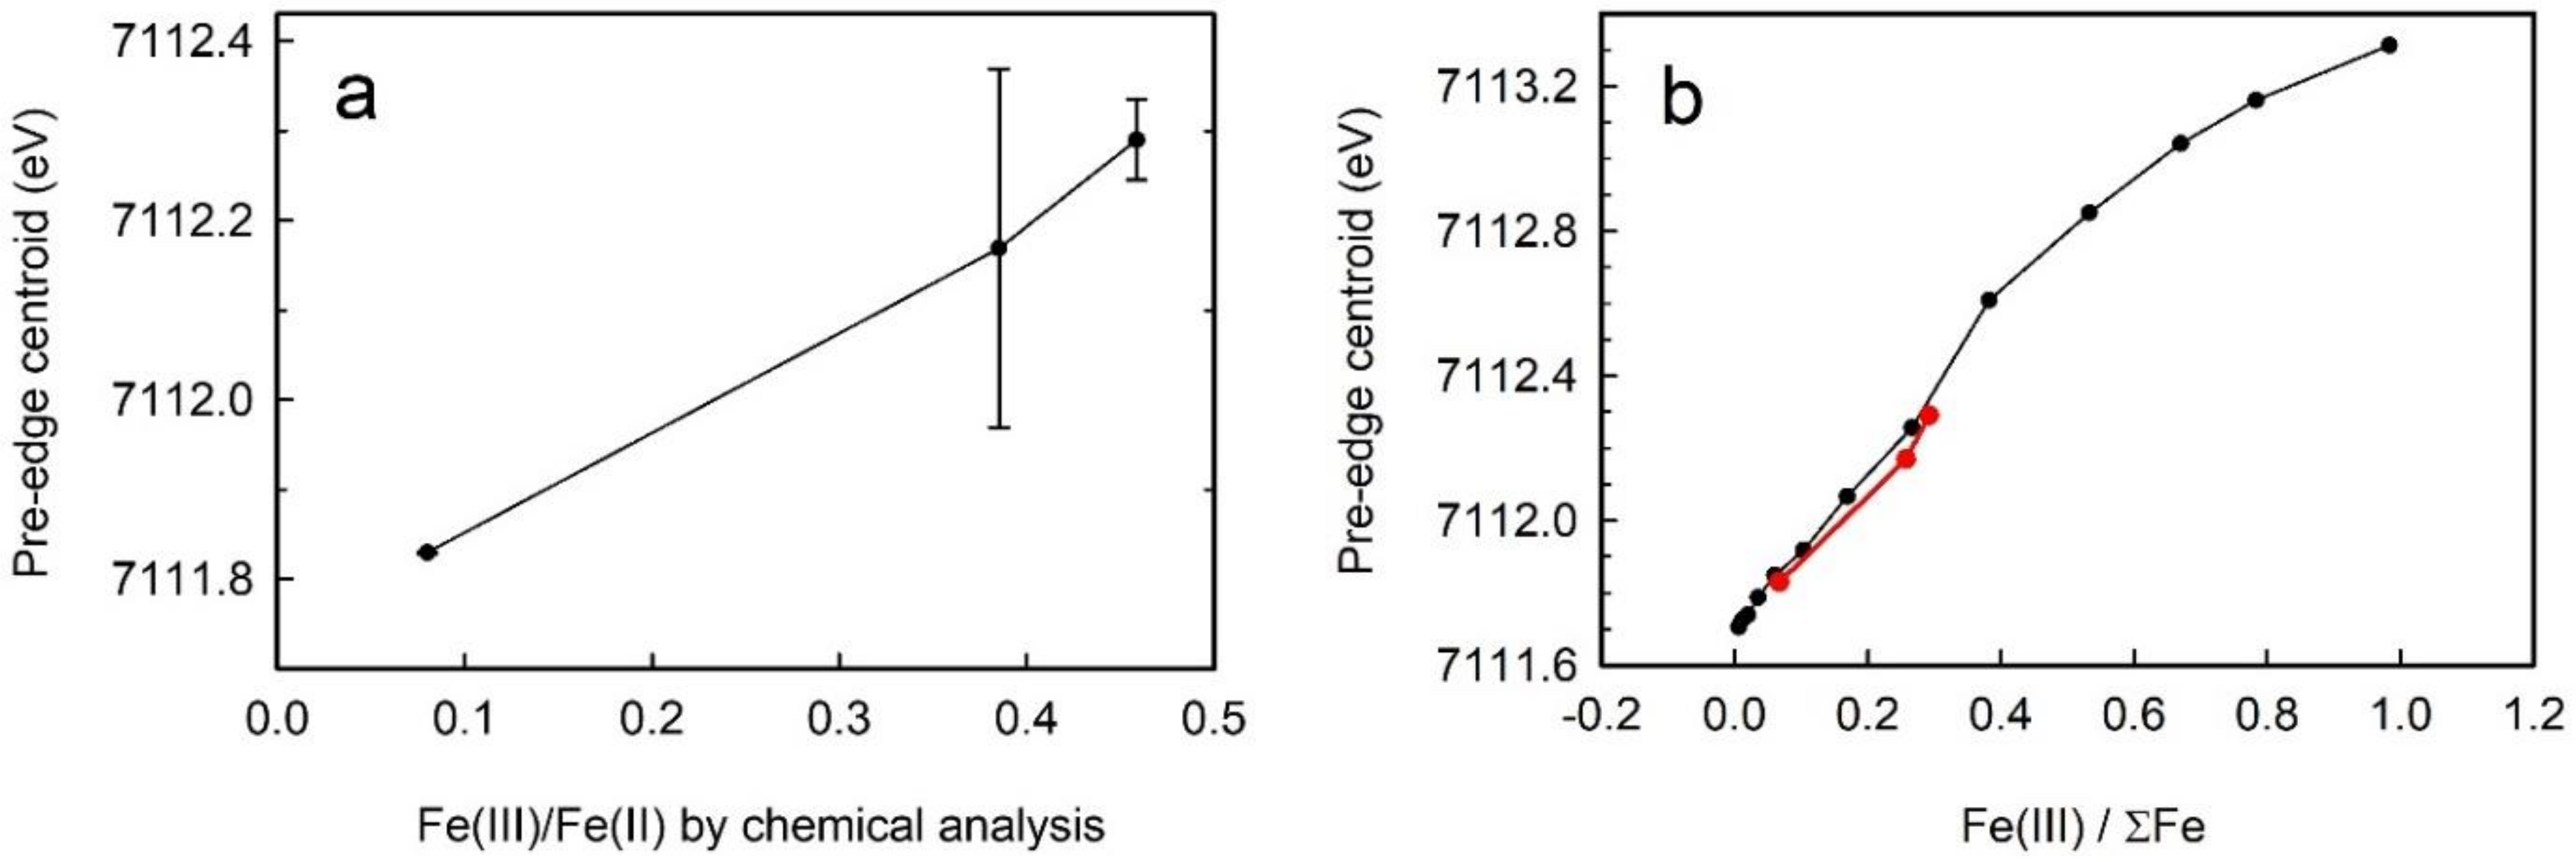
3.4. Fe(III)/Fe(II) Measurement by XANES
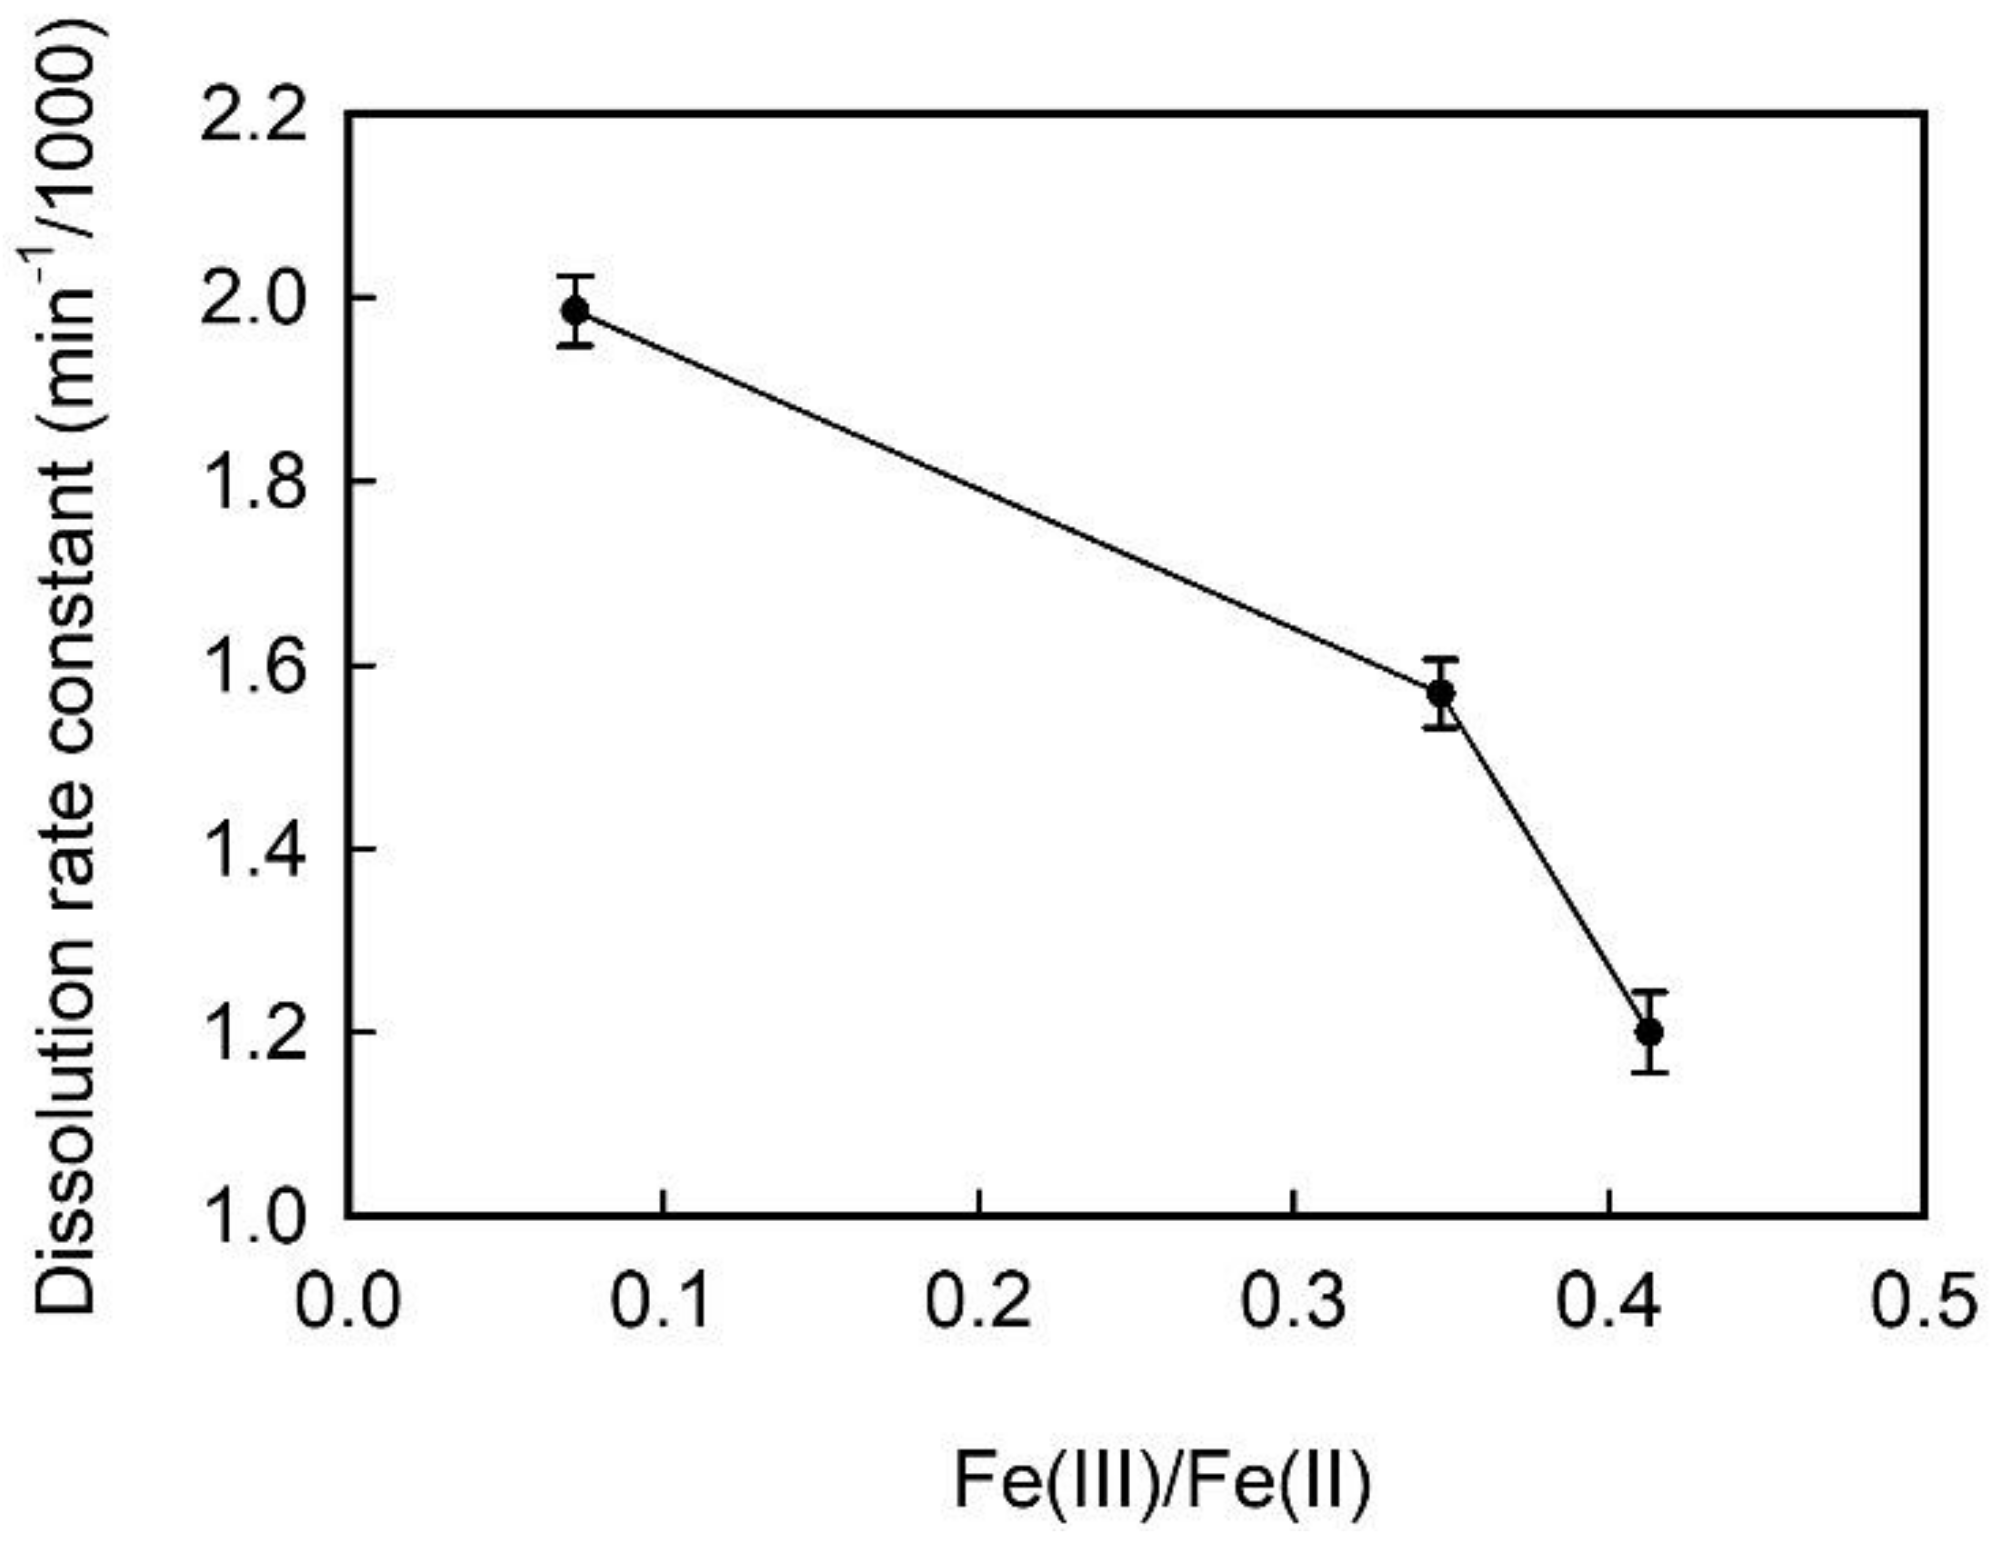
3.5. Relationship Between Oxidation State and Dissolution Kinetics
4. Conclusions
Author Contributions
Funding
Data Availability Statement
Acknowledgments
Conflicts of Interest
References
- Directorate-General for Internal Market, Industry, Entrepreneurship and SMEs. “Proposal for a regulation of the European Parliament and of the Council establishing a framework for ensuring a secure and sustainable supply of critical raw materials and amending Regulations (EU) 168/2013, (EU) 2018/858, 2018/1724 and (EU) 2019/1020”. In 52023PC0160; European Commission: Brussels, Belgium, 2023. [Google Scholar]
- Mauk, J.L.; Karl, N.A.; San Juan, C.A.; Knudsen, L.; Schmeda, G.; Forbush, C.; Van Gosen, B.S.; Mullins, M.; Scott, P. The Critical Minerals Initiative of the US Geological Survey’s Mineral Deposit Database Project: USMIN. Min. Metall. Explor. 2021, 38, 775–797. [Google Scholar] [CrossRef]
- Gambogi, J. Titanium Mineral Concentrates; United States Geological Survey: Reston, VA, USA, 2023.
- Perks, C.; Mudd, G. Soft rocks, hard rocks: The world’s resources and reserves of Ti and Zr and associated critical minerals. Int. Geol. Rev. 2022, 64, 987–1008. [Google Scholar] [CrossRef]
- Wells, H.C.; Haverkamp, R.G. Characterization of the heavy mineral suite in a holocene beach placer, Barrytown, New Zealand. Minerals 2020, 10, 86. [Google Scholar] [CrossRef]
- Grapes, R.; Watanabe, T. Paragenesis of titanite in metagraywackes of the Franz Josef-Fox Glacier area, southern Alps, New Zealand. Eur. J. Mineral. 1992, 4, 547–555. [Google Scholar] [CrossRef]
- Angusamy, N. Placer deposits of southern Tamil Nadu coast, India. Mar. Georesources Geotechnol. 2006, 24, 77–102. [Google Scholar] [CrossRef]
- Haverkamp, R.G.; Kruger, D.; Rajashekar, R. The digestion of New Zealand ilmenite by hydrochloric acid. Hydrometallurgy 2016, 163, 198–203. [Google Scholar] [CrossRef]
- Haverkamp, R.G.; Wallwork, K.; Waterland, M.; Gu, Q.; Kimpton, J.A. Controlled hydrolysis of TiO2 from HCl digestion liquors of ilmenite. Ind. Eng. Chem. Res. 2022, 61, 6333–6342. [Google Scholar] [CrossRef]
- Janssen, A.; Putnis, A. Processes of oxidation and HCl-leaching of Tellnes ilmenite. Hydrometallurgy 2011, 109, 194–201. [Google Scholar] [CrossRef]
- van Dyk, J.P.; Vegter, N.M.; Pistorius, P.C. Kinetics of ilmenite dissolution in hydrochloric acid. Hydrometallurgy 2002, 65, 31–36. [Google Scholar] [CrossRef]
- Olanipekun, E. A kinetic study of the leaching of a Nigerian ilmenite ore by hydrochloric acid. Hydrometallurgy 1999, 53, 1–10. [Google Scholar] [CrossRef]
- Nguyen, T.H.; Lee, M.S. A review on the recovery of titanium dioxide from ilmenite ores by direct leaching technologies. Miner. Process. Extr. Metall. 2019, 40, 231–247. [Google Scholar] [CrossRef]
- Ogasawara, T.; de Araujo, R.V.V. Hydrochloric acid leaching of a pre-reduced Brazilian ilmenite concentrate in an autoclave. Hydrometallurgy 2000, 56, 203–216. [Google Scholar] [CrossRef]
- Wahyuningsih, S.; Pramono, E.; Firdiyono, F.; Sulistiyono, E.; Rahardjo, S.B.; Hidayattullah, H.; Anatolia, F.A. Decomposition of ilmenite in hydrochloric acid to obtain high grade titanium dioxide. Asian J. Chem. 2013, 25, 6791–6794. [Google Scholar] [CrossRef]
- Sarker, M.K.; Rashid, A.K.M.B.; Kurny, A.S.W. Kinetics of leaching of oxidized and reduced ilmenite in dilute hydrochloric acid solutions. Int. J. Min. Process. 2006, 80, 223–228. [Google Scholar] [CrossRef]
- Duncan, J.F.; Metson, J.B. Acid attack on New-Zealand ilmenite.1. The mechanism of dissolution. N. Z. J. Sci. 1982, 25, 103–109. [Google Scholar]
- Sasikumar, C.; Rao, D.S.; Srikanth, S.; Mukhopadhyay, N.; Mehrotra, S.P. Dissolution studies of mechanically activated Manavalakurichi ilmenite with HCl and H2SO4. Hydrometallurgy 2007, 88, 154–169. [Google Scholar] [CrossRef]
- Daba, K.; Ramakokovhu, M.M.; Mojisola, T.; Shongwe, M.B.; Ntholeng, N. Iron extraction from South African ilmenite concentrate leaching by hydrochloric acid (HCl) in the presence of reductant (metallic Fe) and additive (MgSO4). Minerals 2022, 12, 1336. [Google Scholar] [CrossRef]
- Wilke, M.; Farges, F.; Petit, P.-E.; Brown Jr, G.E.; Martin, F. Oxidation state and coordination of Fe in minerals: An Fe K-XANES spectroscopic study. Am. Mineral. 2001, 86, 714–730. [Google Scholar] [CrossRef]
- Cottrell, E.; Kelley, K.A.; Lanzirotti, A.; Fischer, R.A. High-precision determination of iron oxidation state in silicate glasses using XANES. Chem. Geol. 2009, 268, 167–179. [Google Scholar] [CrossRef]
- Newville, M. Larch: An analysis package for XAFS and related spectroscopies. J. Phys. Conf. Ser. 2013, 430, 012007. [Google Scholar] [CrossRef]
- Deslattes, R.; Kessler, E.; Indelicato, P.; Billy, L.; Lindroth, E.; Anton, J.; Coursey, J.; Schwab, D.; Chang, J.; Sukumar, R. X-Ray Transition Energies Database; National Institute of Standards and Technology (NIST), Physical Measurement Laboratory: Gaithersburg, ML, USA, 2005.
- Kraft, S.; Stümpel, J.; Becker, P.; Kuetgens, U. High resolution X-ray absorption spectroscopy with absolute energy calibration for the determination of absorption edge energies. Rev. Sci. Instrum. 1996, 67, 681–687. [Google Scholar] [CrossRef]
- Berry, A.J.; Stewart, G.A.; O’Neill, H.S.C.; Mallmann, G.; Mosselmans, J.F.W. A re-assessment of the oxidation state of iron in MORB glasses. Earth Planet. Sci. Lett. 2018, 483, 114–123. [Google Scholar] [CrossRef]
- Hunault, M.O.; Khan, W.; Minar, J.; Kroll, T.; Sokaras, D.; Zimmermann, P.; Delgado-Jaime, M.U.; de Groot, F.M. Local vs. nonlocal states in FeTiO3 probed with 1s2pRIXS: Implications for photochemistry. Inorg. Chem. 2017, 56, 10882–10892. [Google Scholar] [CrossRef] [PubMed]
- Phoohinkong, W.; Boonyarattanakalin, K.; Mekprasart, W.; Pavasupree, S.; Pecharapa, W. Nonlocal XANES pre-edge feature of FeTiO3 ilmenite-type at Ti and Fe K-edge. Radiat. Phys. Chem. 2020, 174, 108919. [Google Scholar] [CrossRef]
- Wilson, N.; Muscat, J.; Mkhonto, D.; Ngoepe, P.; Harrison, N. Structure and properties of ilmenite from first principles. Phys. Rev. B 2005, 71, 075202. [Google Scholar] [CrossRef]
- Rao, D.; Vijaya Kumar, T.; Subba Rao, S.; Bhaskar Raju, G.; Prabhakar, S. Alteration characteristics of Manavalakurichi beach placer illmenite, Tamilnadu. J. Appl. Geochem. 2005, 7, 195–200. [Google Scholar]
- Sasikumar, C.; Rao, D.S.; Srikanth, S.; Ravikumar, B.; Mukhopadhyay, N.K.; Mehrotra, S.P. Effect of mechanical activation on the kinetics of sulfuric acid leaching of beach sand ilmenite from Orissa, India. Hydrometallurgy 2004, 75, 189–204. [Google Scholar] [CrossRef]
- Frost, M.; Grey, I.; Harrowfield, I.; Mason, K. The dependence of alumina and silica contents on the extent of alteration of weathered ilmenites from Western Australia. Mineral. Mag. 1983, 47, 201–208. [Google Scholar] [CrossRef]
- Paus, R.; Ji, Y.; Vahle, L.; Sadowski, G. Predicting the solubility advantage of amorphous pharmaceuticals: A novel thermodynamic approach. Mol. Pharm. 2015, 12, 2823–2833. [Google Scholar] [CrossRef]

| Element as Oxide | Barrytown BT (wt%) | Kanyakumari TIS (wt%) | Tuticorin TVP (wt%) |
|---|---|---|---|
| TiO2 | 47.1 | 51.5 | 46.1 |
| Fe2O3 | 3.0 | 12.7 | 15.8 |
| FeO | 37.5 | 32.9 | 34.4 |
| Al2O5 | 2.3 | 0.5 | 0.4 |
| SiO2 | 5.2 | 1.1 | 1.1 |
| P2O5 | 0.2 | <0.1 | <0.1 |
| V2O5 | 0.1 | 0.2 | 0.3 |
| MnO | 1.7 | n.a. | n.a. |
| CaO | 1.1 | n.a. | n.a. |
| K2O | 0.3 | n.a. | n.a. |
| MgO | 0.2 | n.a. | n.a. |
| Sum | 98.7 | 98.9 | 98.0 |
Disclaimer/Publisher’s Note: The statements, opinions and data contained in all publications are solely those of the individual author(s) and contributor(s) and not of MDPI and/or the editor(s). MDPI and/or the editor(s) disclaim responsibility for any injury to people or property resulting from any ideas, methods, instructions or products referred to in the content. |
© 2024 by the authors. Licensee MDPI, Basel, Switzerland. This article is an open access article distributed under the terms and conditions of the Creative Commons Attribution (CC BY) license (https://creativecommons.org/licenses/by/4.0/).
Share and Cite
Sun, T.Y.; Wykes, J.L.; Wolmarans, K.; Kappen, P.; Haverkamp, R.G. The Dependence of Ilmenite’s Dissolution Rate in Hydrochloric Acid on the Fe(III)/Fe(II) Ratio, with Fe K-Edge XANES Pre-Edge Peak Analysis. Minerals 2025, 15, 20. https://doi.org/10.3390/min15010020
Sun TY, Wykes JL, Wolmarans K, Kappen P, Haverkamp RG. The Dependence of Ilmenite’s Dissolution Rate in Hydrochloric Acid on the Fe(III)/Fe(II) Ratio, with Fe K-Edge XANES Pre-Edge Peak Analysis. Minerals. 2025; 15(1):20. https://doi.org/10.3390/min15010020
Chicago/Turabian StyleSun, Thomas Y., Jeremy L. Wykes, Karla Wolmarans, Peter Kappen, and Richard G. Haverkamp. 2025. "The Dependence of Ilmenite’s Dissolution Rate in Hydrochloric Acid on the Fe(III)/Fe(II) Ratio, with Fe K-Edge XANES Pre-Edge Peak Analysis" Minerals 15, no. 1: 20. https://doi.org/10.3390/min15010020
APA StyleSun, T. Y., Wykes, J. L., Wolmarans, K., Kappen, P., & Haverkamp, R. G. (2025). The Dependence of Ilmenite’s Dissolution Rate in Hydrochloric Acid on the Fe(III)/Fe(II) Ratio, with Fe K-Edge XANES Pre-Edge Peak Analysis. Minerals, 15(1), 20. https://doi.org/10.3390/min15010020