Article

Vibrational Analysis of Natural Rhodochrosites by Raman Spectroscopy

by
Julliana F. Alves
,
Linus Pauling F. Peixoto
and
Luiz Fernando C. de Oliveira
*
NEEM—Núcleo de Espectroscopia e Estrutura Molecular, Departamento de Química, ICE, Universidade Federal de Juiz de Fora, Juiz de Fora 36036-330, MG, Brazil
*
Author to whom correspondence should be addressed.
Minerals 2024, 14(7), 703; https://doi.org/10.3390/min14070703
Submission received: 5 June 2024 / Revised: 5 July 2024 / Accepted: 9 July 2024 / Published: 11 July 2024

Abstract

:
This study investigates an unusual behavior observed in the Raman spectra of natural rhodochrosites under ambient conditions and varying temperature and pressure. While the typical MnCO3 spectrum is maintained, the relative intensities of libration (L) and translation (T) bands exhibit significant variations, potentially linked to changes in the Mn2+ state within the crystal lattice. Mapping experiments under ambient conditions revealed intensity inversions in lattice modes depending on the sampling region and excitation wavelength. Initially attributed to laser-induced degradation, this phenomenon was ruled out by temperature-dependent Raman spectroscopy, which showed no significant intensity changes even under conditions promoting sample degradation. Further investigations under hydrostatic pressure revealed a decrease in L band intensity, potentially indicating crystal compaction and modified cation–anion interactions. Thermodynamic parameters were calculated using both linear and quadratic fitting methods, demonstrating that while linear fitting provides acceptable results for temperature-dependent analysis, a quadratic approach is crucial for pressure-induced changes, influencing the value of calculated Gruneisen and anharmonicity parameters. This work highlights the sensitivity of Raman spectroscopy to subtle changes within the rhodochrosite structure and provides valuable insights into the intricate interplay of temperature, pressure, and Mn ion configuration in this mineral.

Graphical Abstract

1. Introduction

Manganese is abundant in the Earth’s crust and mantle. It is mostly found in the oceanic crust as oxides and in marine sediments as Mn-carbonate [1]. Carbon in the mantle exists as accessory phases like graphite, diamond, or carbonate minerals due to low solubility in mantle silicate minerals. Understanding their behavior in the lower mantle is crucial for modeling the global carbon cycle [2]. Rhodochrosite and Mn-oxides are stable in high pressure and temperature. Carbonates’ stability is studied under high pressure, considering the cation’s nature on the structures of high-pressure phases and their stability range [1,2,3,4,5,6].
Generally, rhodochrosite (MnCO3) mineral attracts attention due to the Mn2+ size, which is an intermediary size between Mg2+ and Ca2+. That characteristic could make it a model compound for understanding the differences in the vibrational behaviors of other carbonate minerals like Magnesite (MgCO3) and calcite (CaCO3) because the cation ratio is often associated with the carbonate Raman shift [2]. However, rhodochrosite is a unique mineral and exhibits fascinating properties because manganese presents distinct spin states and complex phase transitions [2].
Crystals have anisotropy that determines their physical properties and is also dependent on the thermodynamic and kinetic conditions of the growth process, generating different crystalline morphologies, for example [7,8,9]. Previous research conducted by Alves and colleagues has shown that rhodochrosite can display anisotropic behavior in Raman spectra. This means that at room temperature and pressure, there can be variations in the relative intensity of the translation and libration Raman modes depending on the region of the sample and the specific excitation source used during the measurement, which is unusual for the inelastic scattering theory, since both modes are related to Eg symmetry [10].
In the context of Raman measurements as a function of temperature, it is noteworthy that most of the studies begin at room temperature and proceed with a gradual increase in temperature [6,11,12,13,14]. Then, this study aims to investigate, by the Raman spectra of different mineral samples, the vibrational behavior of rhodochrosite also in sub-zero temperatures in addition to different pressure value conditions and calculate thermodynamical features, such as the Gruneisen parameters and the intrinsic anharmonicity, for each vibrational mode by the Equations (1)–(3) [15,16].
γ P = 1 α ν 0 ν T
γ T = K t ν 0 ν P
a = α γ T γ P
where γ P is the isobaric Gruneisen parameter, γ T is the isothermal Gruneisen parameter, a is the intrinsic anharmonicity, ν is the vibrational frequency, ν 0 is the vibrational frequency at ambient conditions, T is the temperature, P is pressure, α is the thermal expansion coefficient, and K t is the bulk modulus.
Additionally, it presents new data on the Raman spectra of different rhodochrosite samples under room temperature and pressure conditions. These results build on previous research on the impact of manganese ions on the mineral’s vibrational characteristics.

2. Materials and Methods

A group of six natural rhodochrosite samples were analyzed. The sample information is in Table S1. For comparison purposes, a Sigma-Aldrich, Darmstadt, Germany—manganese carbonate was also analyzed.
The Raman spectra were obtained using two Raman spectrometers: an interferometric and macroscopic system RFS 100 FT Raman from Brucker working with a 1064 nm excitation source, 500 mW of laser power, 512 accumulated spectra, and 1 cm−1 of spectral resolution; and a dispersive system SENTERRA also from Brucker working with 785, 632.8, and 532 nm excitation sources using a 50× magnification objective (numerical Aperture = 0.51), 100 mW and 20 mW of laser power for 785 nm and 632.8 and 532 nm excitation sources, respectively, and 100 s of integration time. Changes in these conditions are discussed in the text.
Raman with a variation in temperature was performed in a Linkam accessory, model FTIR600, with a liquid nitrogen system with temperature values varying from −180 °C to 375 °C. For measurements varying the pressure, Almax easyLab diamond anvil cell, model LeverDAC-Maxi, and nujol (mineral oil) were used as pressure-transmitting medium (PTM), and the Rubi crystal fluorescence was used for calibrating pressure [17].
In addition to the Raman spectroscopy, energy dispersive X-ray microanalysis (EDX) was obtained for all the mineral samples with a Hitachi tabletop microscope using 15 kV as beam condition. The spectra were collected in a 60× magnification scanning electronic microscopy image. The results can be seen in Supplementary Materials.

3. Results and Discussion

3.1. Raman Mapping

The analysis of rhodochrosite samples was performed using Raman mapping in different laser excitations. 
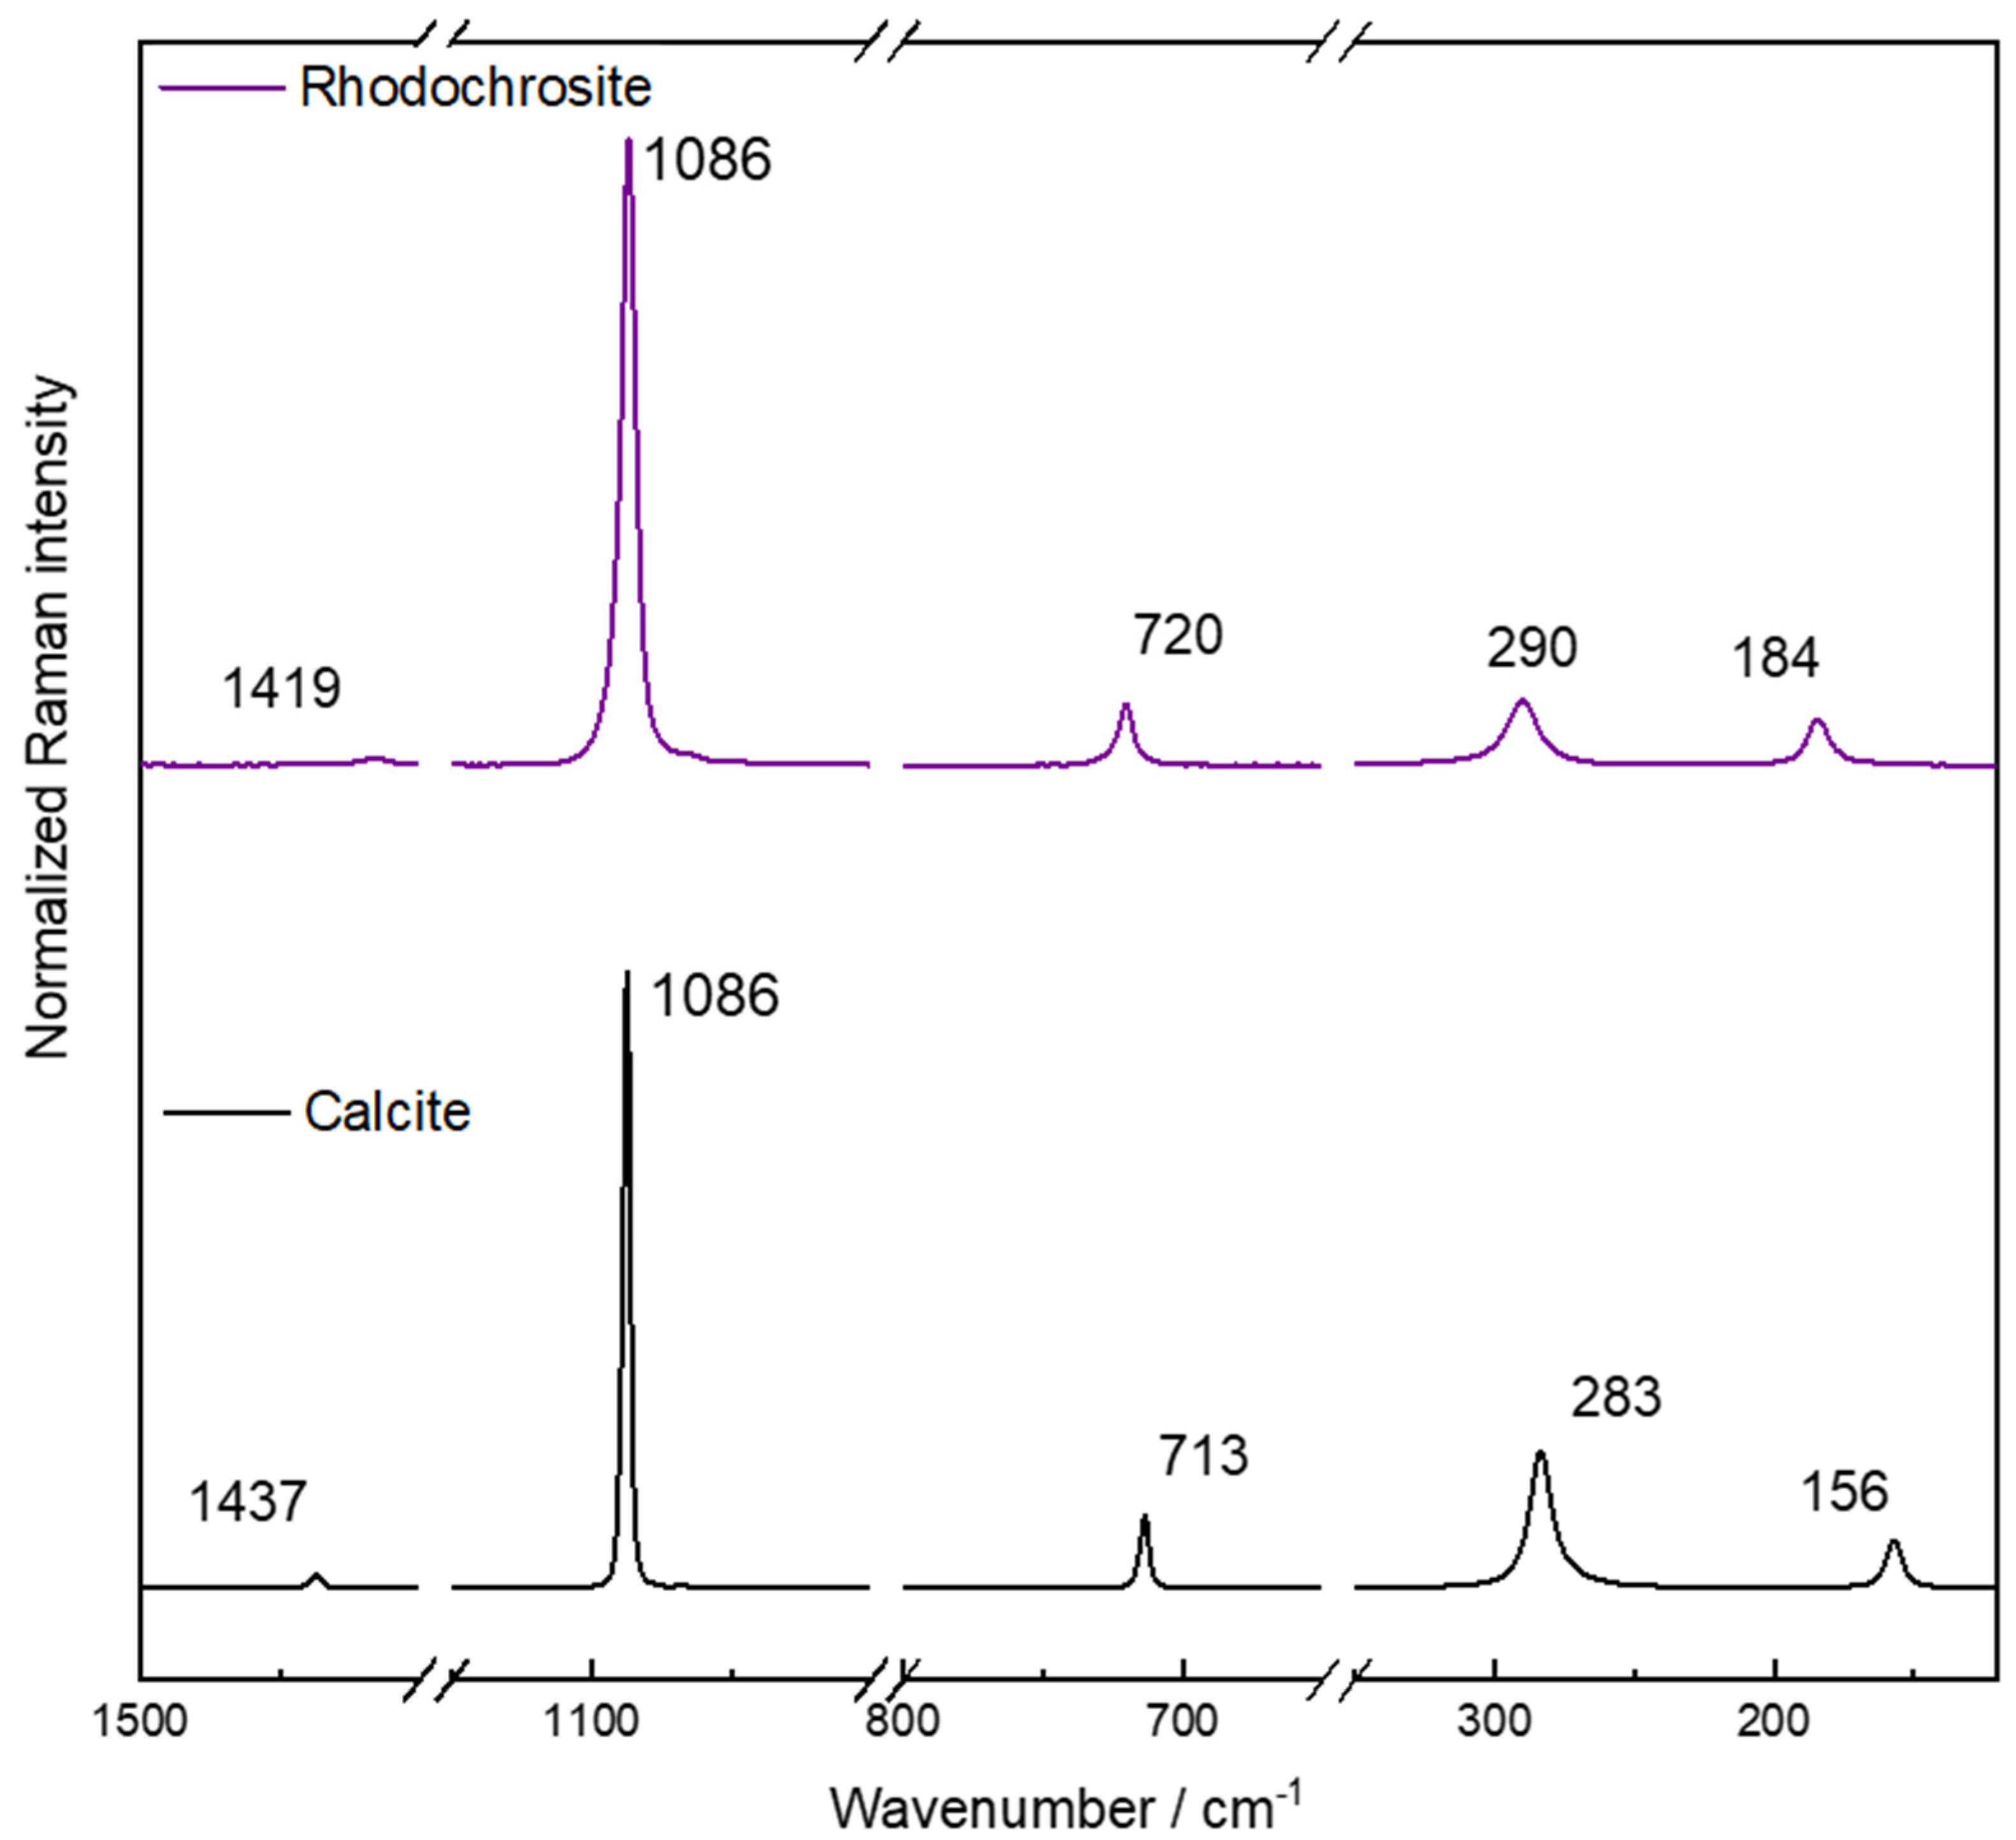
Figure 1 shows a typical Raman spectrum of natural rhodochrosite where are observed the main vibrational modes. There are three internal modes in 1419, 1086, and 720 cm−1 attributed, respectively, to the asymmetrical and symmetrical stretching of the C-O bond and O-C-O angle bending modes. At the low wavenumber region, there are two lattice modes in 290 and 184 cm−1 attributed to libration and translation modes. Using as reference a calcite mineral—also in Figure 1—the differences in wavenumber are important to differentiate these minerals. The Raman shift of CO32− modes in the rhodochrosite spectrum is unusual considering a cation substitution and the shift as a function of the cation ratio. The symmetrical stretching (νsy) presents no difference besides the full width in half maximum (FWHM) value. That can be interpreted as a change in crystal lattice flexibility and an increase in the entropy of the system. For the asymmetric stretching (νas) mode of the CO bond and bending (δOCO) of the OCO angle, the shift of the Raman band follows two distinct behaviors: while νas is shifted to a lower wavenumber, configuring a weakening of the bond force constant, δOCO is shifted to a higher wavenumber, verifying an increase in the energy value associated with the vibrational transition. It is understood, therefore, that the change generated by the presence of Mn2+ in the mineral structure leads to a weakening of the C-O bond by shifting the νas band to a lower frequency value, in addition to a movement restriction for δOCO of the planar carbonate, verified by shifting this Raman mode to a higher wavenumber.
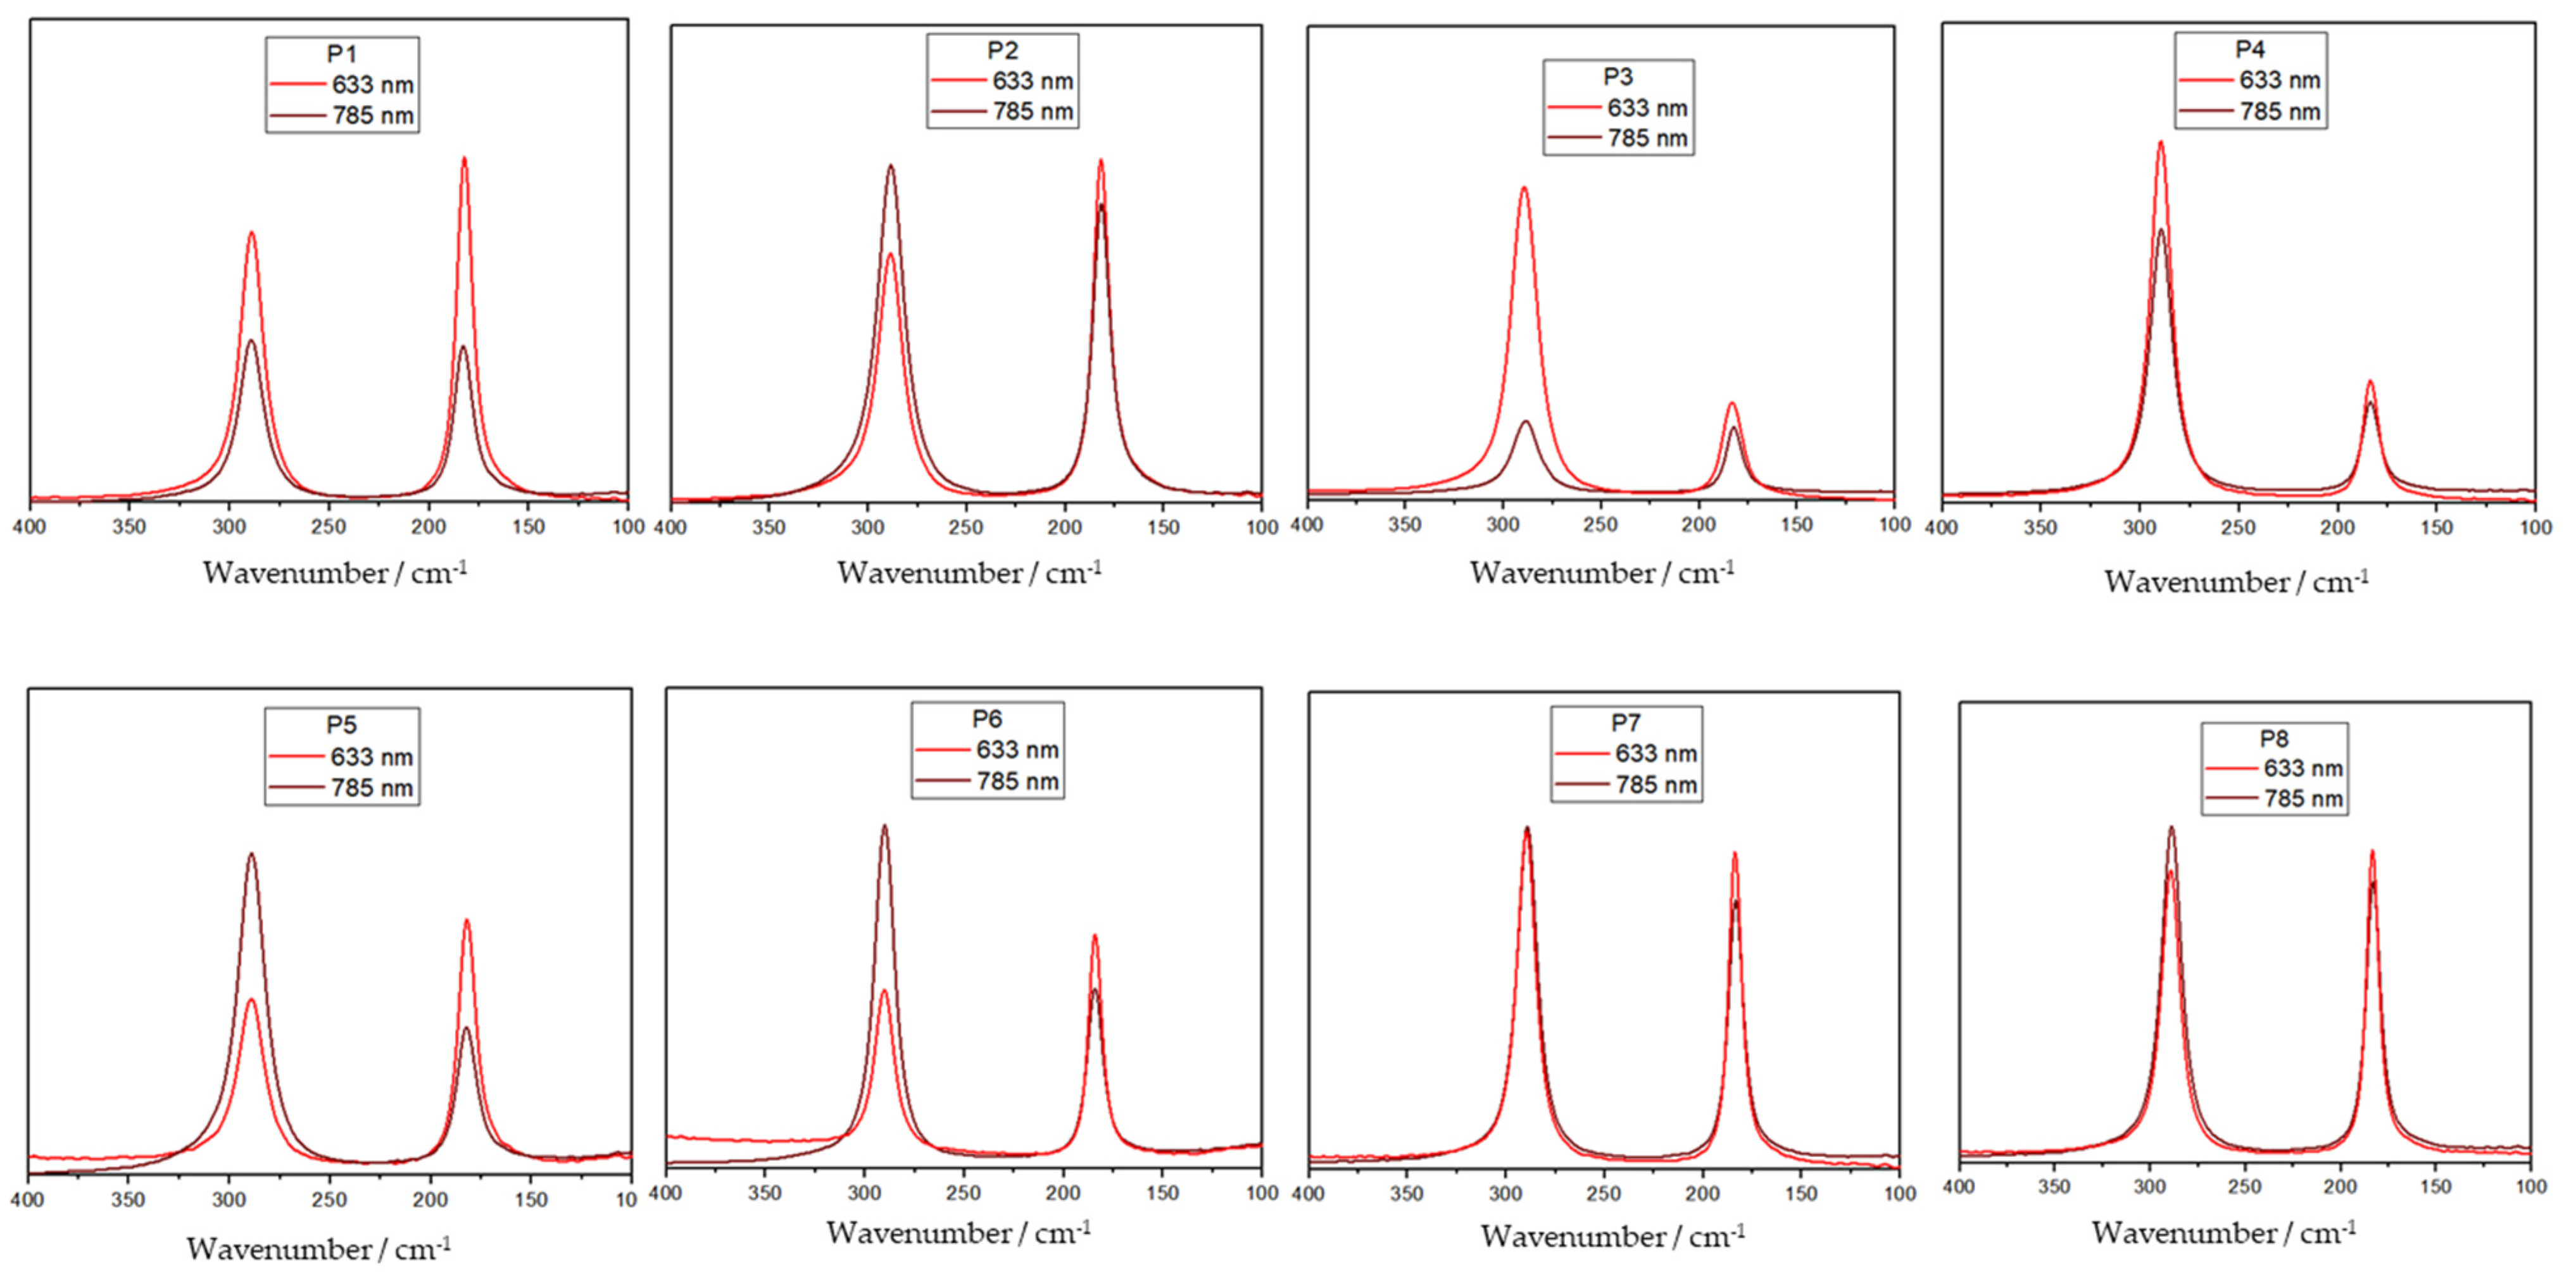
The samples were submitted to several different Raman measurements changing the excitation source. It was observed that there is an inversion of the relative intensity of the libration and translation modes. Figure 2 shows an example for sample A of spectra obtained at 785 and 633 nm in eight different points of the sample. No treatment was performed. The data suggest an influence of both region and excitation source.
The differences discussed here arise from the fact that both the modes share the same symmetry. It is important to note that the intensity of a Raman band is linked to polarizability, which, by definition, is associated with the vibrational mode’s symmetry. That is also the parameter used to identify the symmetry of the different observed bands in the spectrum. Therefore, an inversion of the relative intensity of the translational and libration bands should not be expected and cannot be related to crystal orientation.
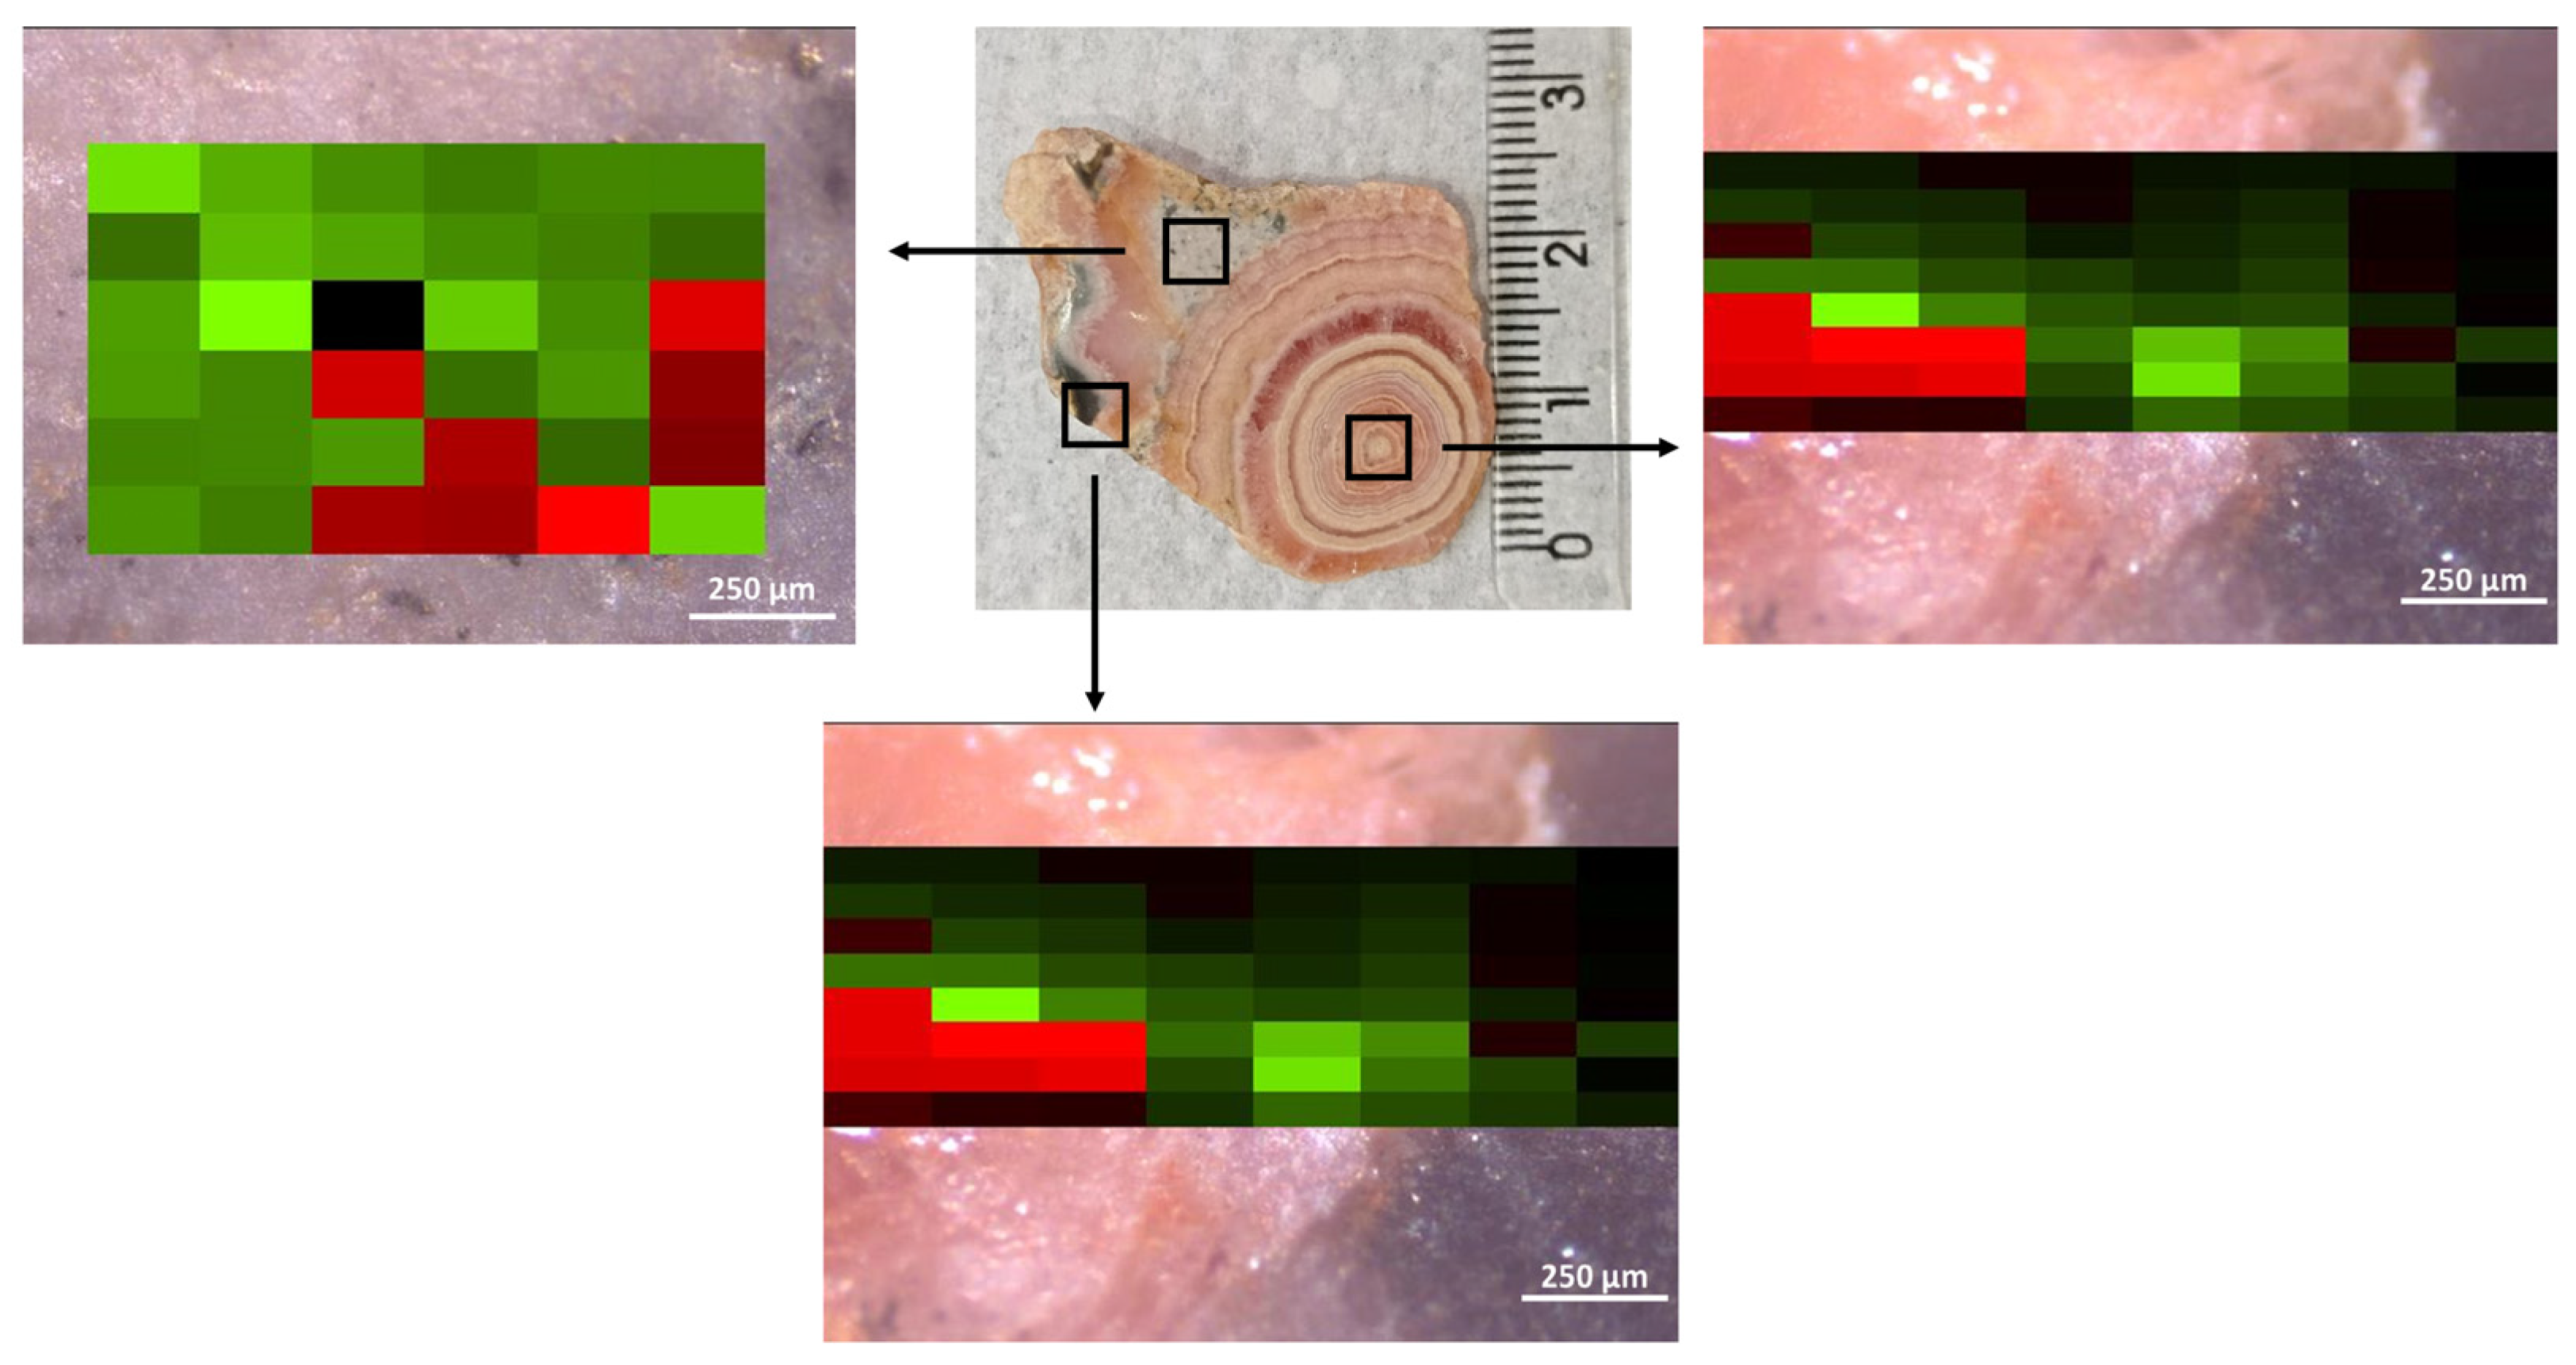
A set of Raman maps was obtained for the rhodochrosite samples under different measurement conditions to verify the previous observation. The main difference also was observed in the relative intensity for the libration (L) (290 cm−1) and translation (T) (184 cm−1) modes. The Raman images of samples A and B were obtained using a 532 nm excitation source, and the results are shown in Figure 3 as an example. The intensities of the T and L bands were analyzed after baseline correction, and a color scale of green and red pixels was used to compare the bands’ intensity. A software (OPUS, ver. 8.8, available on the Raman instrument) was used to produce the colored maps. The intensity values used to create the maps were determined by measuring the height of the band after a baseline correction as a straight line within an interval containing the Raman band—320 to 260 cm−1 for the L band and 200 to 165 cm−1 for the T band. Although the software does not provide a scale for the colored maps, the purpose of the figure, in this case, is to demonstrate that there are spectra where the T band is more intense than the L band, and vice versa. The intensity of the bands is represented by the vibrancy of the pixel color. If the pixel is very bright red, the L band is way more intense than the T band. Dark pixels, appearing black, indicate that the intensity of the two bands is very similar, as the red and green colors cancel each other out.
As mentioned earlier, the observation is unusual due to vibrational mode symmetry. The phenomena were observed in all the rhodochrosite samples. Small variations in the crystal lattice may be causing changes in the relative intensity of these modes, which is supported by the low cation ratio of manganese.
Additionally, knowing that manganese oxides are known to be sensitive to certain laser power values [18,19], that characteristic could be extended to carbonate systems. Therefore, the high power (20 mW) being used may be interfering with the ionic interaction between Mn2+ and CO32− planes in a similar manner. The intensity of radiation and localized heat could be causing stress in the crystal lattice, leading to the changes in the relative intensity of the two phonons. The stress level is sufficient to cause the observed phenomena without being strong enough to cause sample degradation. Compared with the results obtained from a standard sample (Sigma-Aldrich), the resistance of the sample changes completely. Figure S1 shows the Raman spectra at 532, 633, and 785 nm from the same region of the powdered sample. In this case, the measurement was obtained in the lowest possible laser power because the sample showed sensibility to the laser power and to higher accumulation time. Then, 0.2 mW for 532 and 633 mW, and 1 mW for 785 mW was used.
These results seem to be related to the MnCO3 structure because it is present in all the natural rhodochrosite samples in different degrees. Figure 4 shows the result for sample D and Figure S2—in Supplementary Materials—shows the results for samples C and E.
For sample E, some grey regions of the sample presented an additional Raman band at 350 cm−1 (Figure S3), but the typical rhodochrosite Raman spectrum was maintained. There are two possible reasons for that. The first reason could be the presence of other carbonate minerals, such as siderite. However, this argument is weakened by the absence of other bands on higher wavenumber regions and the apparent homogeneity of crystal formation.
To verify this first possibility, a few EDX data were collected with the main goal of looking for different compositions. Table S2 shows the results obtained for the mineral samples. There were no significant differences in composition observed, except for manganese carbonate. Some regions had less than 1% (atomic) of another metal. However, the presence of this metal was very small and could potentially be an experimental error, as the equipment used lacks considerable sensitivity and resolution. This result was expected because the Raman spectra results did not show significant deviations in FWHM and Raman shift. Therefore, it is possible that even if there is a small contamination, it would not significantly alter the Raman spectrum. Some samples exhibited higher concentrations of carbon atoms, but it is believed that this could be due to interference from the carbon adhesive tape used during the measurement and the thickness of some samples.
The second reason is related to the different spin states of manganese, which can be affected by the temperature and pressure conditions during the mineral sample formation [5]. This can result in a different electronic configuration of the manganese cation, altering the color of the mineral. At this point in the discussion, some considerations must be made. If the laser power used causes variation in the relative intensity of the T and L bands, that occurs due to the interaction between the radiation and the matter (similarly to photosensitivity) or due to local heating concentrated in the region of the laser spot. Compared with the sensibility of the powdered Sigma-Aldrich sample, it is possible to say that a part of the resistance of the sample in the interaction process between radiation and matter, mainly regarding light scattering, is a result of the size of the crystal. In the first scenario, simply heating the rhodochrosite sample would create fluctuations in the relative intensity values. The second case would refer to the Raman phenomenon itself, being of great value in the study of rhodochrosite behavior in different temperatures using Raman, in addition to obtaining thermodynamic properties of the mineral.

3.2. Temperature and Pressure Raman Spectrum

Regarding the impact of laser power on the relative intensities of the lattice modes, it was observed that there is no significant difference in T and L intensities when using a lower laser power (5 mW) and varying the system temperature at values close to the known degradation. Thus, it is more likely that the phenomenon discussed in the previous topic is similar to photosensitivity rather than a photothermal process. That also explains the two bands observed in the synthetic sample Raman spectra in 933 and 660 cm−1. This can be interpreted as indicative of manganese oxide formation due to photosensitivity.
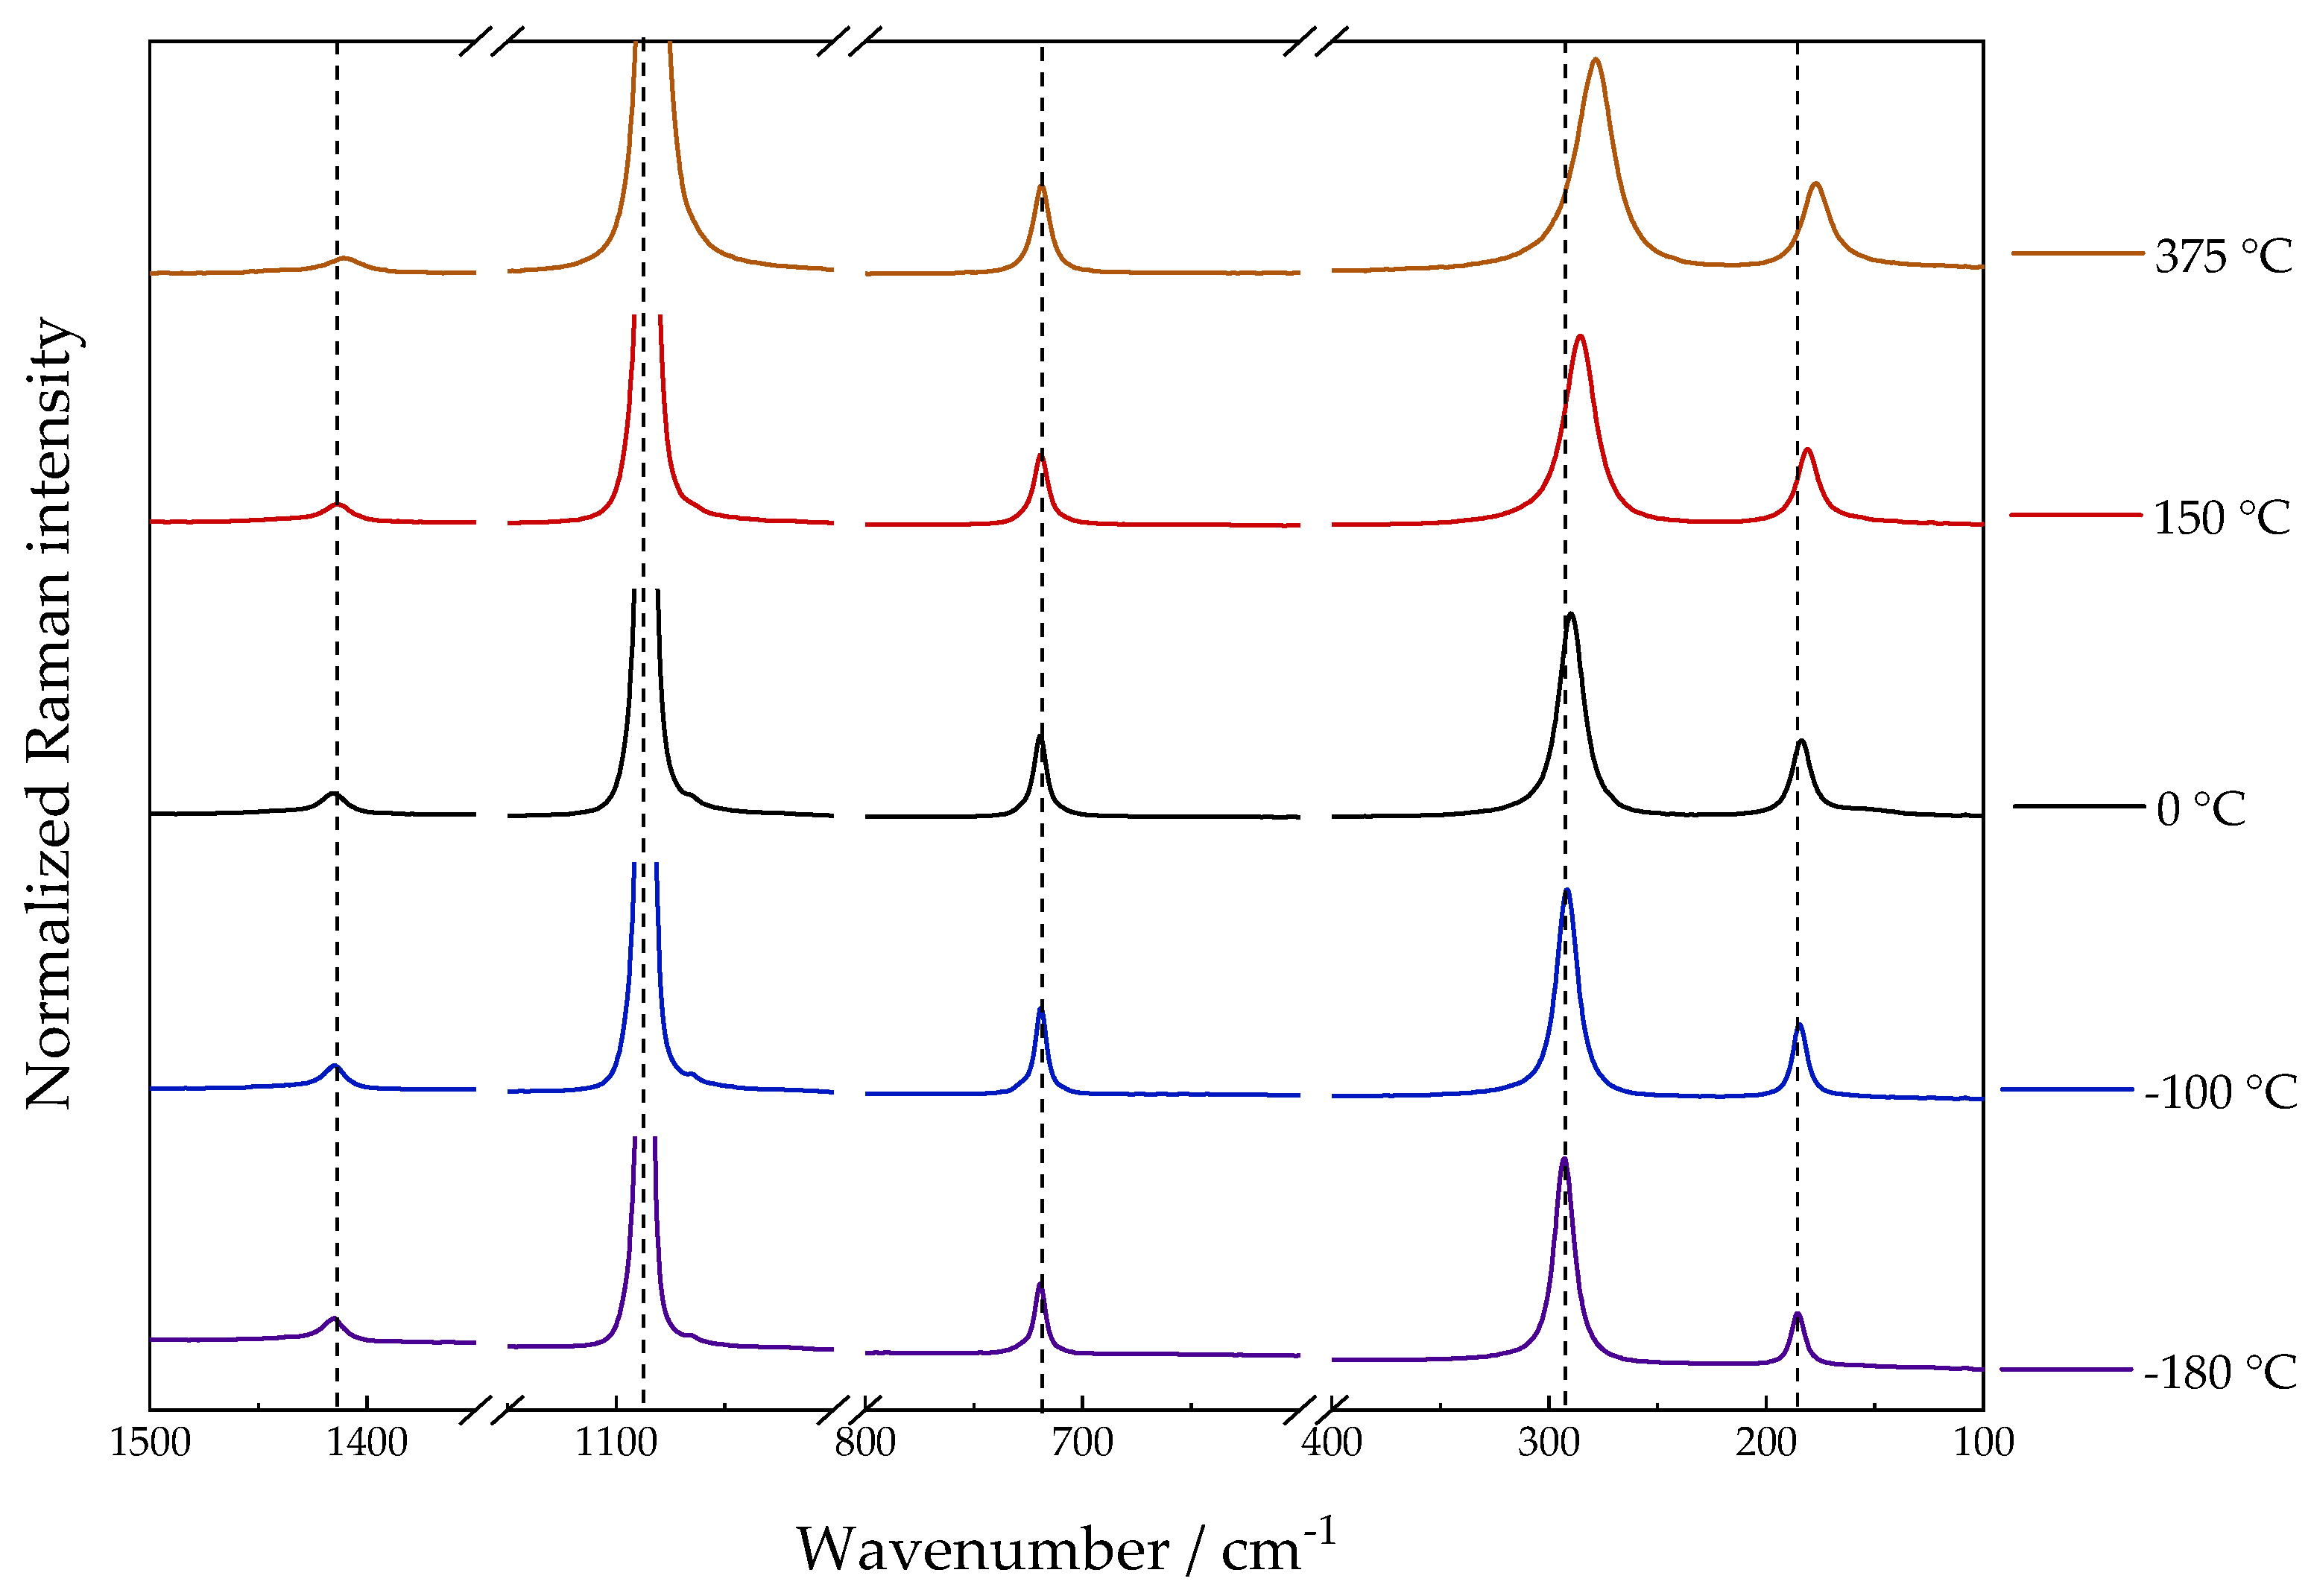
Figure 5 shows the results of the high and sub-zero temperature values. The observed behavior is similar to the previous literature; the wavenumber decreases with increasing temperature. Rhodochrosite degradation occurred during the measurement at 400 °C and was identified by the presence of MnO2 characteristic band in 654 cm−1 as shown in Figure S4 [18,19]. Notably, the indicative band for the formation of manganese oxide in the spectrum of the synthetic sample (660 cm−1) differs from that obtained in the spectrum of natural rhodochrosite degraded in the heating experiment (645 cm−1). These results also suggest that the degradation process caused by the excitation line differs from the degradation process caused by heating.
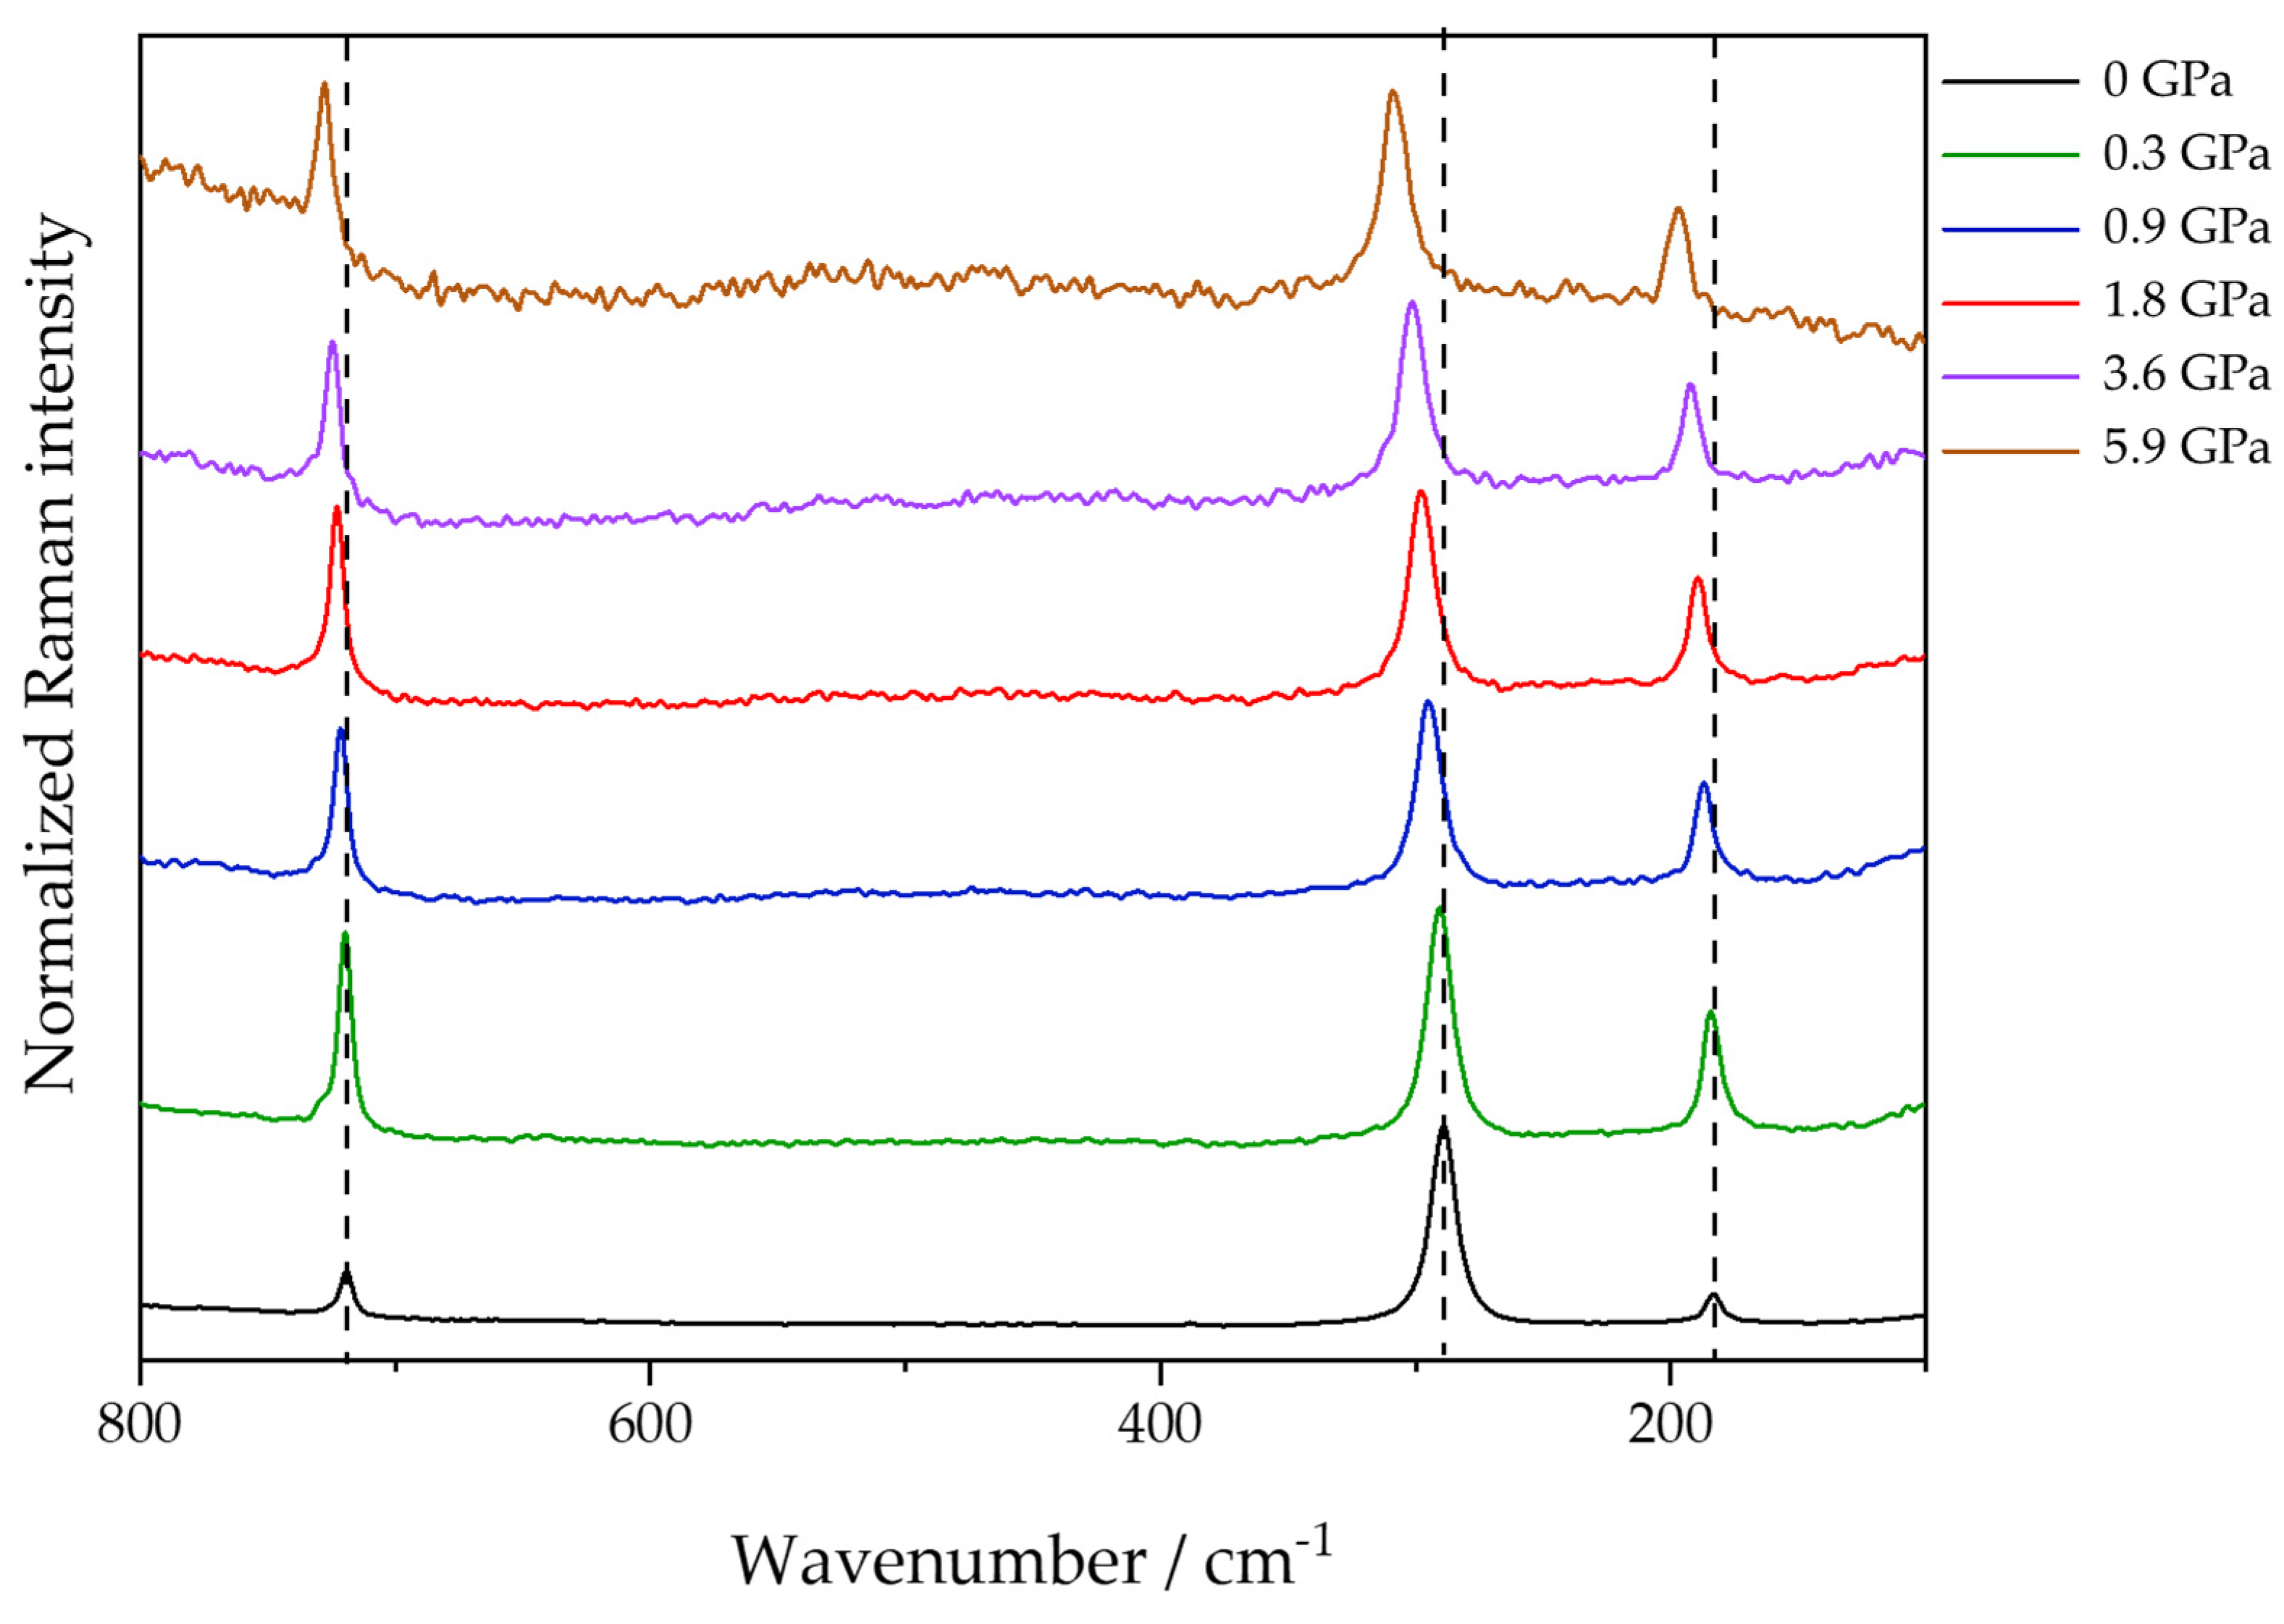
On the other hand, there are differences in the relative intensity of the external modes associated with the Raman shift, as shown in Figure 6. In contrast to isobaric temperature changes, during an isothermal pressure change, the Raman bands shift to higher wavenumbers. This indicates that more energy is needed for the vibrational transition. Comparing the two experiments, an increase in temperature causes a relaxation of the crystalline structure, resulting in lower vibrational frequencies and broader bands—an effect that is due to the increase in entropy—while the increase in pressure causes the opposite phenomena, restricting the vibrational movement and increasing the wavenumber values. It is worth noting that the stress caused by the increase in pressure under the crystalline lattice resulted in a decrease in the intensity of the libration band when compared to the translation and bending modes. All three of these bands are attributed to vibrational modes of Eg symmetry and, taking into account that the pressure exerted was hydrostatic (using nujol as PTM, the pressure exerted is hydrostatic up to 6.5 GPa [20]), the observation is due to the objective of the experiment and not an operational failure.
The results obtained for both pressure application and temperature variation also lead to further discussion regarding the statistical treatment of the data in question. Wang and colleagues [6] published results that refined previous publications, revealing a nonlinear relationship between wavenumber variation and temperature. In our work, we compare both linear (y = ax + b) and nonlinear (y = ax2 + bx + c) fittings and 
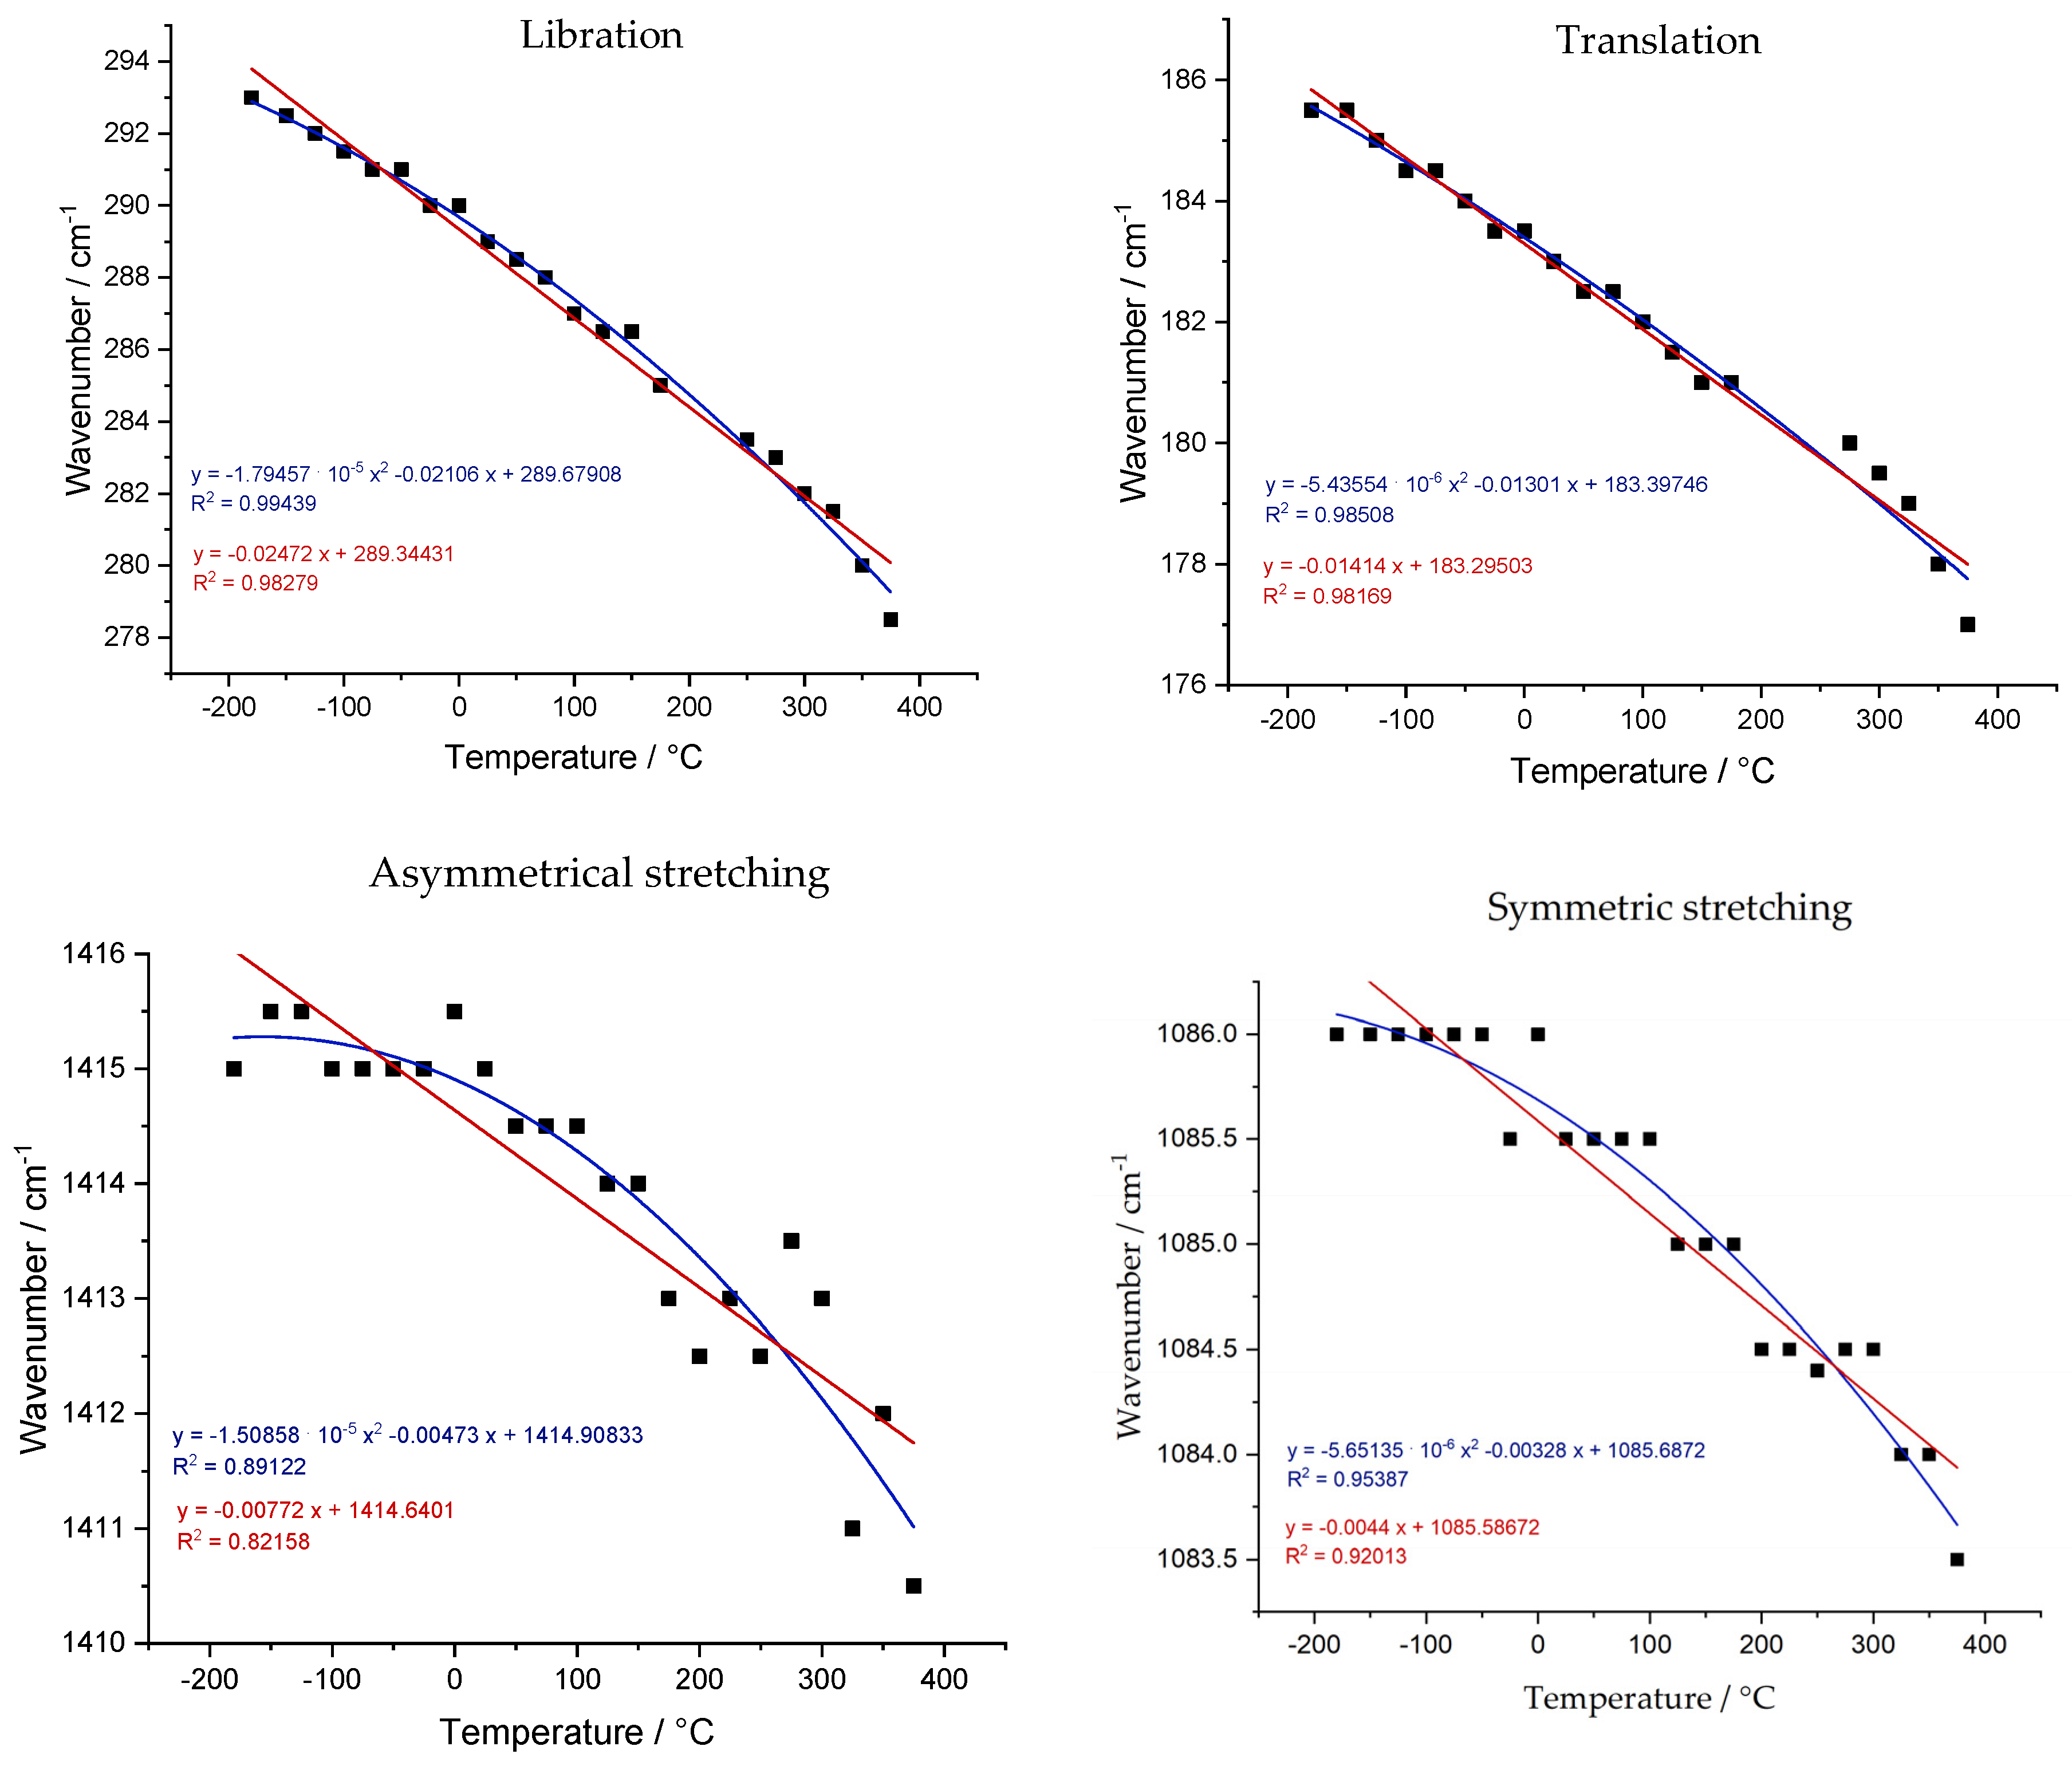
Table S3 summarizes the fitting parameters. Fitting results for temperature dependence are represented in Figure 7. For the libration mode, the difference is remarkable. The correlation coefficient (R2) is increased from 0.98279 to 0.99439. For the translation mode, it was not that significant; R2 changes from 0.98169 to 0.98508. Compared with the previous literature, the value of the “a” coefficient obtained in this work (−0.02472 for the L mode and −0.01414 for the T mode) is very similar to the result of the work of Farsang et al. [12] (−0.0293 for the L mode and −0.0198 for the T mode). That is important since this work brings new data on sub-zero temperature values and the observed behavior is still similar. However, in a comparison with Wang’s work, the results are quite different in the context of a nonlinear fitting. For example, the “a” coefficients of the T mode fitting differ in magnitude order (−1.08 × 10⁻⁵ in Wangs and −5.43554 × 10⁻⁶ in this work). In instrumental terms, many parameters influence the fluctuations between the results obtained in different works. In some cases, the temperature marked by the thermocouple is not exactly the temperature sample. This is a factor minimized through calibrations. For the measurements in our work, Raman spectra were obtained in three regions of the sample to verify homogeneity in the vibrational frequency value for each temperature. In this case, with the given stabilization time, there was no discernible difference between the three measurements at the same temperature.
There are a few highlights in comparison to the internal modes. The result for the bending mode was discarded as there was almost no variation in the vibrational frequency according to the temperature variation. This observation is expected as this has also been reported in previous publications [2,5,6,11,12,13,14]. For the linear fitting, the consideration is the same as the one made previously for the external modes. Thus, slope values very close to those obtained in previous works are observed, with even better statistical factors. While Farsang et al. [12] presented R2 equal to 0.13 and 0.82 for the asymmetric and symmetric stretching modes, respectively, this work presents the R2 values of 0.82158 and 0.92013 for the same vibrational modes. In general, the data show behavior very close to linearity, as the values of “a” are orders of magnitude smaller than the other coefficients in the obtained equations.
When it comes to nonlinear fitting, the only reference is the work of Wang et al. However, just like external modes, the values vary in terms of magnitude and sign (positive or negative). It is possible that, in addition to the instrumental issues mentioned, small variations in the composition of the mineral sample are interfering with the results. The sample used in our work was a small piece of sample A, and the main composition can be seen in the Supplementary Materials. In the case of internal modes, the sensitivity of the vibrational mode to temperature variation is not significant. However, as significant differences between the two results were also observed for the external modes, it is worth considering the significant importance of more data for values below ambient temperature to endorse the statistical treatment of the collected data.
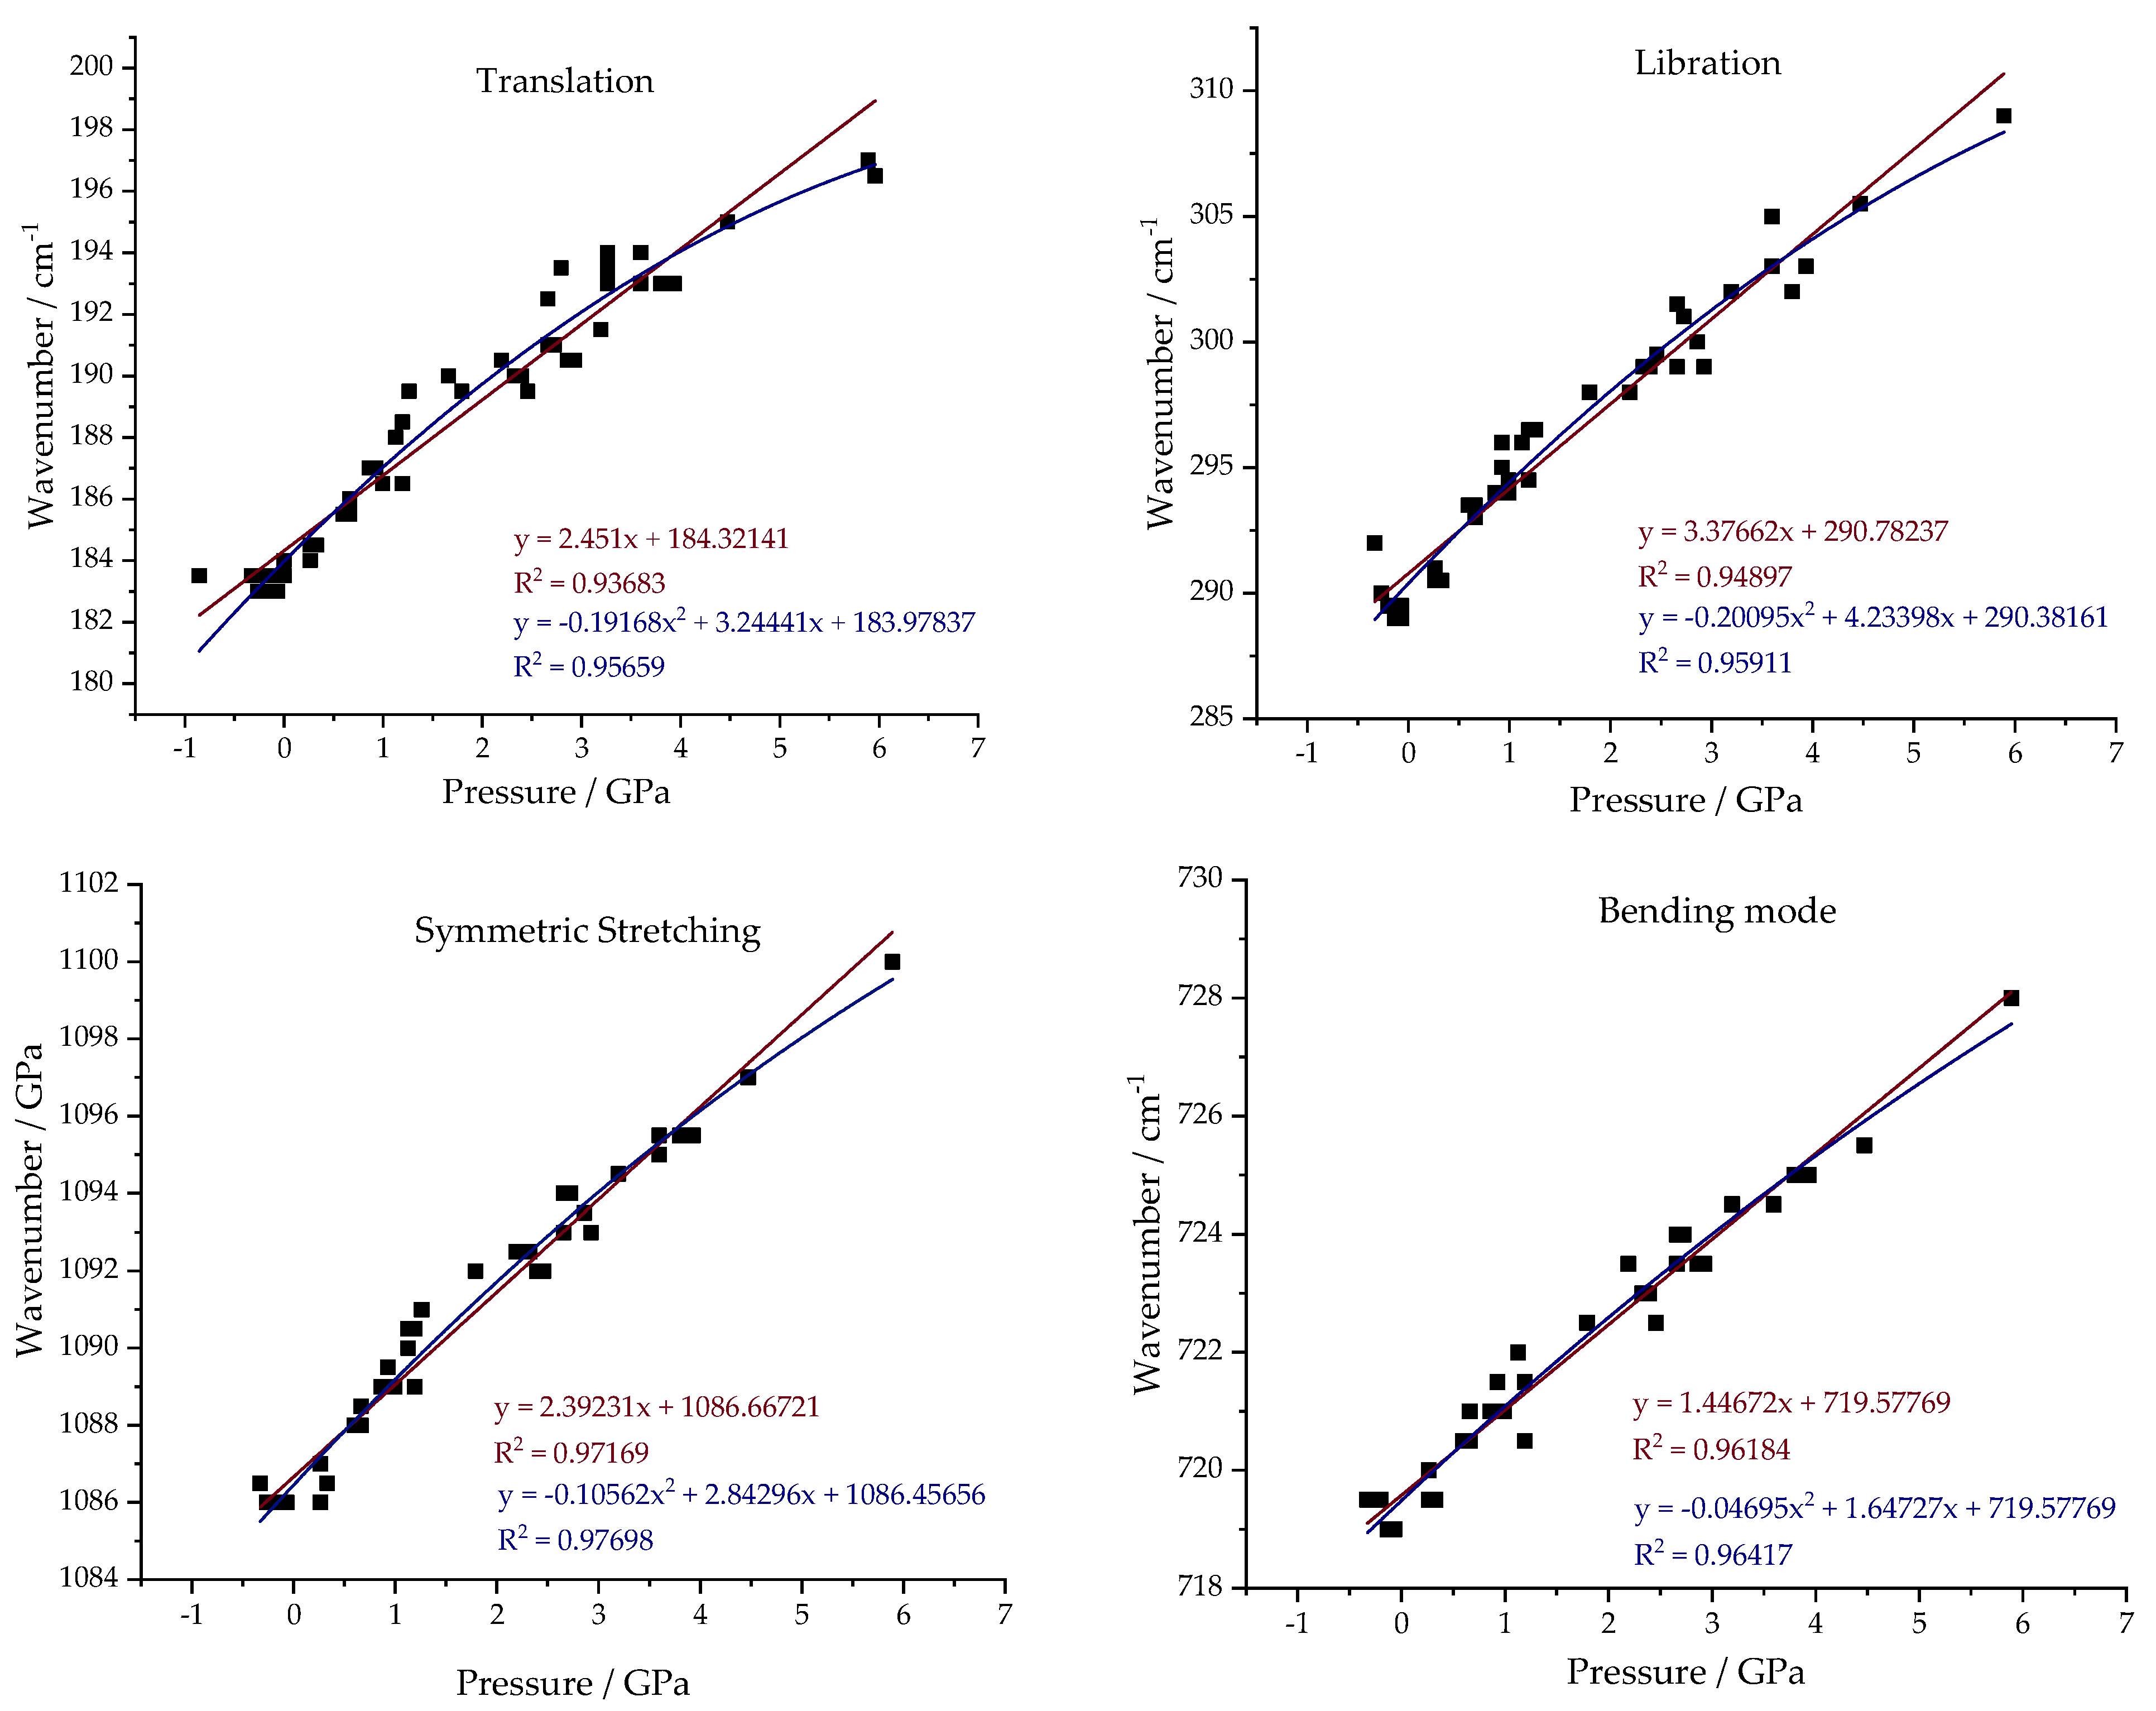
Figure 8 shows the pressure fitting results. Just as in the case of temperature variation, pressure variation modifies the external and internal modes of the mineral in different ways. In the case of the T and L bands, these are much more susceptible to variations in the vibrational frequency value according to the pressure variation. The data were analyzed using two types of statistical fitting—linear and quadratic—similar to the approach used for temperature variation. As there was no prior literature utilizing quadratic fitting, it was important to apply the same approach used for temperature to the pressure case. As in the previous case, an improvement in the correlation coefficient value is observed for all the modes, both internal and external. Comparing the results for the T and L bands, the slope values in the linear fit are higher for the libration band, implying a greater sensitivity of the vibrational mode to pressure variation. In the case of the internal modes, the symmetric stretching mode was found to be more sensitive to pressure variation. As before, an increase in the correlation coefficient value was also observed, but the difference was not as significant. It is interesting to note that all the quadratic fits obtained had negative “a” value, meaning they are quadratic functions with concavities facing downwards.
For comparison purposes, Table S4 presents a comparison of the obtained value of “a” and R2 with references. To ensure comparability, only the values obtained for a linear fit are presented. It is observed that, for most cases, there is a closer proximity of results when comparing this work with those developed by Zhao et al. and Liu et al., with the other references having slightly larger values [11,14].
The change between the two fitting types modifies the calculation of some thermodynamic factors obtained from the derivatives of these functions; then, it was considered important to calculate and compare these parameters. Table 1 presents the results obtained considering a linear adjustment for the isobaric and isothermal Gruneisen parameters ( γ P and γ T , respectively) and anharmonicity ( a ) using as reference the Equations (1)–(3) [6,15,16]. ν0 was considered the wavenumber value at ambient conditions. The bulk modulus ( K t ) was approximated to 110 GPa and the thermal expansion coefficient ( α ) was approximated to 2.09 [6]. As expected, the values of γ P are much smaller and contribute little to anharmonicity. Comparing internal and external modes, the anharmonicity is bigger for the external modes. That can be associated with the lower value of the energy of that vibrational transition. An analogy that facilitates interpretation is the following: Two main factors contribute to the energy value of a vibrational transition: the reduced mass and the strength constant of the chemical bond. For a collective mode—a lattice phonon—it is no longer the constant of a chemical bond, but rather an interaction force between the planes of carbonate ions and manganese ions. When a weaker chemical interaction, such as one with a lower force constant, is considered, the changes in temperature and pressure conditions will have a more significant impact. This is because the centers of mass are more easily displaced compared to the vibration of a typical covalent bond. This facility also allows for greater anharmonicity. It was because of this interaction between carbonate and manganese that initially the heating factor was considered as justification for the modification of the relative intensity. In this type of system, the presence of the manganese ion modifies the force constants involved in the vibrational modes of the carbonate ion. The crystalline structure of different carbonates is modified mainly by the distance between the planes of carbonate ions due to the size of the cation between the planes. It is also worth highlighting that, in this interpretation, only the module of the anharmonicity is considered. All the results for the vibrational modes analyzed led to negative anharmonicity values. However, it is important to say that the closer the Gruneisen parameter values are, the more the anharmonicity approaches zero and the more harmonic the system is.
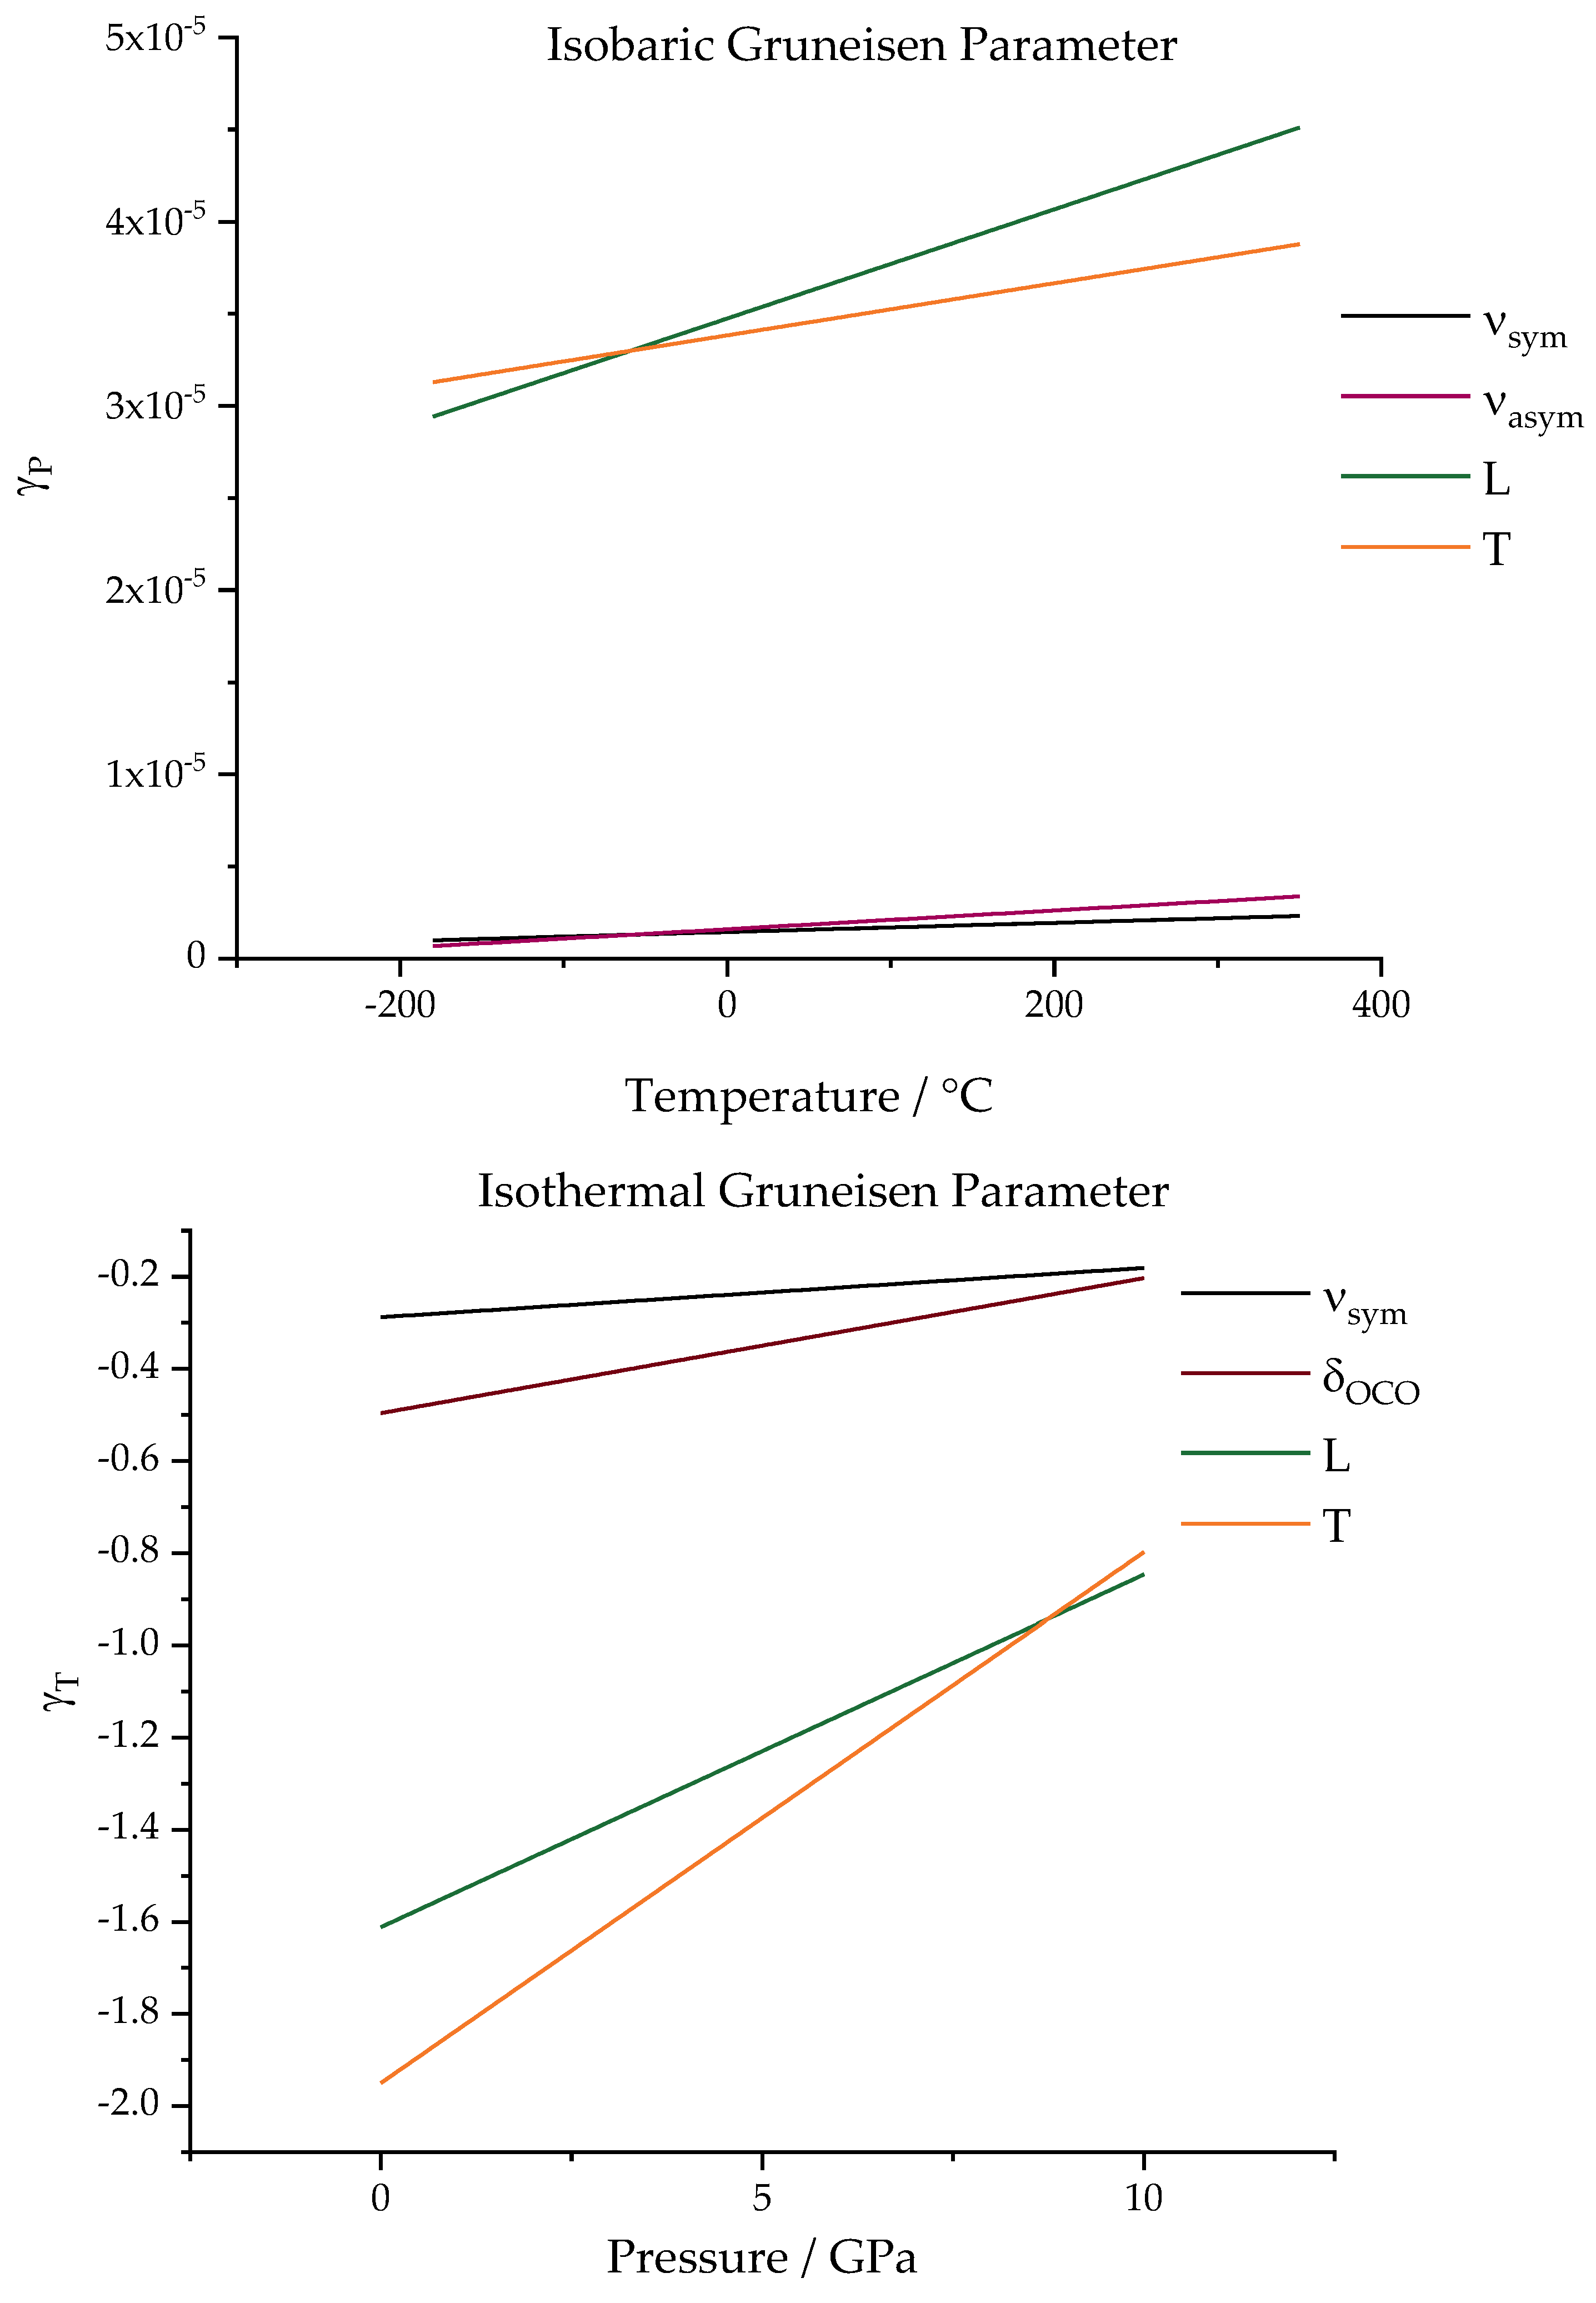
The isobaric and isothermal Gruneisen parameters can be seen as the linear functions of temperature and pressure when the quadratic fitting is considered. Figure 9 presents the plotted functions for each analyzed vibrational mode calculated by 50 values applied to the obtained function. The differences are notable not only in a comparison between internal and external modes but also when comparing the isothermal and isobaric experiments.
The first observation that can be made is regarding the variation in the range considered. The functions were plotted in the studied ranges (−180 to 350 °C for temperature and from 0 to 6 GPa for pressure). For the isobaric process, a significant temperature variation is required for a significant change to be observed. Almost no difference is observed for the internal modes, which brings them even closer to a constant value. Therefore, Wang’s proposal to consider a nonlinear adjustment; in this case, is not significant. For external modes, in the temperature range worked, the values vary between 2.6 × 10⁻⁵ and 4.6 × 10⁻⁵. Despite this, when the proposal is extended to the case of pressure variation, for the studied range (which can be considered a short range when compared to other studies), the isothermal Gruneisen parameter undergoes more significant variations with pressure variation, ranging from −2.0 to −0.8 for external modes.
Disposing the functions associated with the variation in the Gruneisen parameters, it is possible to calculate the intrinsic anharmonicity also as a function of temperature and pressure. In this instance, the approximate value of 2.09 for the thermal expansion coefficient was also used as a reference. Figure 10 displays the variations in the anharmonicity for the libration mode as an example. Notably, a variation in pressure results in a significantly more pronounced increase in anharmonicity than an increase in temperature, which can be imperceptible. With this function plotted, the difference in terms of the orders of magnitude becomes clearer when we compare the dependence of temperature and pressure conditions on the anharmonicity of the system. Even treating the temperature in linear fitting, a very significant temperature change would be necessary to cause a significant difference in anharmonicity. On the other hand, it was observed that, in the case of pressure, a nonlinear fitting can make a difference even in small pressure variations.
Summing up, the results suggest that, for rhodochrosites, the quadratic fitting proposed by Wang for temperature dependence is not significant, because the systems behavior is similar to a constant function. That approach is more adequate to evaluate the pressure dependence.

4. Conclusions

Considering all the experiments developed in this work, it was possible to establish a discussion between an unusual phenomenon observed in the Raman spectrum of natural rhodochrosites and the stresses caused in their crystalline lattice, either by the variations in temperature and pressure, or by the interaction between the radiation itself and the matter. The mappings carried out under ambient conditions showed a variation in the relative intensities of the libration and translation bands of several natural rhodochrosites. These samples had different colors and came from different places, but the Raman spectrum obtained remained the typical MnCO3 spectrum. The spectra had the same bands, but in the case of network modes, the relative intensities even suffered relative intensity inversions depending on the region where the spectrum was obtained and also on the excitation line used in the measurement. The possibility of the modification being a consequence of the partial (and not visual) degradation of the sample due to the laser power used was raised. However, the hypothesis was discarded after obtaining the results for the Raman spectra at different temperatures. In the latter case, low laser power was used, and the sample was heated until degradation. Throughout the range, no significant change in the relative intensities of the T and L bands was observed. It is considered, then, that the phenomenon observed may be a consequence of the variations in the conformation of the manganese ion present in the crystalline structure, since it is a metal of transition with the possibility of spin modification, for example. Following the proposal to understand the behavior of the crystalline network in the face of thermodynamic changes, spectra were obtained at different pressure values, respecting the hydrostatic pressure limit of the PTM used (nujol). Although the results for temperature did not show changes in the relative intensities of the T and L bands, the pressure spectra showed a decrease in the relative intensity of the L band. As this is a hydrostatic compression, it is possible that the variation in relative intensity is a consequence of the compaction of the crystal, which may be causing a modification not only in the interaction between cations and anions but also between cations or anions on the same plane. Following up on the results obtained through the Raman spectra under different temperature and pressure conditions, some thermodynamic parameters were also determined. The results obtained are in accordance with the literature already available, but considerations were made about the type of statistical treatment of the data. It is common for data to be fitted linearly, but treatment improvement was observed in a quadratic fit. It is observed that, for temperature, a linear or quadratic adjustment does not significantly interfere with the results obtained for the Gruneisen and intrinsic anharmonicity parameters. However, for the pressure variation, a considerable dependence was observed for these parameters.

Supplementary Materials

The following supporting information can be downloaded at: https://www.mdpi.com/article/10.3390/min14070703/s1, Figure S1: Sigma-Aldrich Raman spectra obtained at 532, 633, and 785 nm, using 0.2 mW and 1 mW, respectively, and 40 accumulated spectra with 10 s of accumulation time; Figure S2: (A) Rhodochrosite sample C; (B) rhodochrosite sample E; (C) a 10 × 10 grid Raman image for samples C and (D) E obtained at a 532 nm excitation source—the image refers to a 4× magnification objective but the Raman spectra were measured with a 50× magnification objective, with 20 mW of laser power, 3 accumulated spectra, and 5 s of accumulation time presenting the comparison-integrated L and T bands; Figure S3: A. Rhodochrosite sample E; Raman image obtained at a 532 nm excitation source-the Raman spectra were measured with a 50× magnification objective, with 20 mW of laser power, 3 accumulated spectra, and 5 s of accumulation time. Figure S4: Raman spectrum of the degraded sample during 400 °C measurement obtained at a 532 nm excitation source 50× magnification objective, with 5 mW of laser power, 3 accumulated spectra, and 5 s of accumulation time; Table S1: Sample information; Table S2: Energy dispersive spectra (EDX) data; Table S3: Fitting parameters for both the linear and nonlinear fitting of the variation in the vibrational wavenumber as a temperature function; Table S4: Fitting parameters for the linear fitting of the variation in the vibrational wavenumber as pressure function.

Author Contributions

Conceptualization, J.F.A. and L.F.C.d.O.; methodology, J.F.A.; software, J.F.A.; validation, J.F.A., L.F.C.d.O. and L.P.F.P.; formal analysis, J.F.A., L.F.C.d.O. and L.P.F.P.; investigation, J.F.A.; resources, L.F.C.d.O.; data curation, J.F.A., L.F.C.d.O. and L.P.F.P.; writing—original draft preparation, J.F.A.; writing—review and editing, L.F.C.d.O. and L.P.F.P.; visualization, J.F.A.; supervision, L.F.C.d.O.; project administration, L.F.C.d.O.; funding acquisition, L.F.C.d.O. All authors have read and agreed to the published version of the manuscript.

Funding

This research was funded by FAPEMIG, grant number APQAPQ-03079-23, and CNPq, grant numbers 406853/2021-5 and 303569/2022-0.

Data Availability Statement

Publicly available datasets were analyzed in this study.

Acknowledgments

The authors are in debt to CNPq, FAPEMIG, CAPES, FINEP, and Petrobras (Brazilian agencies) for instrumental facilities. J.F.A. acknowledges CAPES for a scholarship.

Conflicts of Interest

The authors declare no conflicts of interest.

References

  1. Bataleva, Y.V.; Kruk, A.N.; Novoselov, I.D.; Palyanov, Y.N. Formation of Spessartine and CO2 via Rhodochrosite Decarbonation along a Hot Subduction P-t Path. Minerals 2020, 10, 703. [Google Scholar] [CrossRef]
  2. Farfan, G.A.; Boulard, E.; Wang, S.; Mao, W.L. Bonding and Electronic Changes in Rhodochrosite at High Pressure. Am. Mineral. 2013, 98, 1817–1823. [Google Scholar] [CrossRef]
  3. Yuan, X.; Xiong, X.; Zhang, G.; Mayanovic, R.A. Application of calcite, Mg-calcite, and dolomite as Raman pressure sensors for high-pressure, high-temperature studies. J. Raman Spectrosc. 2020, 51, 1248–1259. [Google Scholar] [CrossRef]
  4. Gillet, P. Stability of magnesite (MgCOr) at mantle pressure and temperature conditions: A Raman spectroscopic study. Am. Mineral. 1993, 78, 1328–1331. [Google Scholar]
  5. Litasov, K.; Shatskiy, A.; Podborodnikov, I.; Arefiev, A. Phase diagrams of carbonate materials at high pressures, with implications for melting and carbon cycling in the deep earth. In Geophysical Monograph Series; John Wiley & Sons Inc.: Hoboken, NJ, USA, 2020; Volume 249, pp. 137–165. [Google Scholar]
  6. Wang, C.; Ren, L.; Walters, J.B.; Zhang, L.; Tao, R. In Situ Raman Vibrational Spectra of Siderite (FeCO3) and Rhodochrosite (MnCO3) up to 47 GPa and 1100 K. Am. Mineral. 2023, 108, 312–325. [Google Scholar] [CrossRef]
  7. Battey, M.H.C.W. Correns. Introduction to Mineralogy, Crystallography, and Petrology, 2nd Ed. in Co-Operation with Josef Zemann (Part One) and Sigmund Koritnig (Mineral Tables). Translated by William D. Johns. London (Alien & Unwin), 1969. Mineral. Mag. 1970, 37, 861–862. [Google Scholar] [CrossRef]
  8. Bulakh, A.; Wenk, H.-R. Minerals: Their Constitution and Origin; Cambridge University Press: Cambridge, UK, 2004. [Google Scholar]
  9. Nesse, W.D. Introduction to Optical Mineralogy; Oxford University Press: Oxford, UK, 1991; ISBN 9780199846283. [Google Scholar]
  10. Alves, J.F.; Edwards, H.G.M.; Korsakov, A.; de Oliveira, L.F.C. Revisiting the Raman Spectra of Carbonate Minerals. Minerals 2023, 13, 1358. [Google Scholar] [CrossRef]
  11. Zhao, C.; Li, H.; Jiang, J.; He, Y.; Liang, W. Phase Transition and Vibration Properties of MnCO3 at High Pressure and High-Temperature by Raman Spectroscopy. High Press. Res. 2018, 38, 212–223. [Google Scholar] [CrossRef]
  12. Farsang, S.; Facq, S.; Redfern, S.A.T. Raman Modes of Carbonate Minerals as Pressure and Temperature Gauges up to 6 GPa and 500 °C. Am. Mineral. 2018, 103, 1988–1998. [Google Scholar] [CrossRef]
  13. Farsang, S.; Widmer, R.N.; Redfern, S.A.T. High-Pressure and High-Temperature Vibrational Properties and Anharmonicity of Carbonate Minerals up to 6 GPa and 500 °C by Raman Spectroscopy. Am. Mineral. 2021, 106, 581–598. [Google Scholar] [CrossRef]
  14. Liu, J.; Lin, J.-F.; Mao, Z.; Prakapenka, V.B. Thermal Equation of State and Spin Transition of Magnesiosiderite at High Pressure and Temperature. Am. Mineral. 2014, 99, 84–92. [Google Scholar] [CrossRef]
  15. Gillet, P. Raman spectroscopy at high pressure and high temperature. Phase transitions and thermodynamics properties of minerals. Phys. Chem. Miner. 1996, 23, 263–275. [Google Scholar] [CrossRef]
  16. Stacey, F.D.; Hodgkinson, J.H. Thermodynamics with the Grüneisen parameter: Fundamentals applications to high-pressure physics and geophysics. Phys. Earth Planet. Inter. 2019, 286, 42–68. [Google Scholar] [CrossRef]
  17. Liu, L.; Bi, Y.; Xu, J. Ruby fluorescence pressure scale: Revisited. Chin. Phys. B 2013, 22, 056201. [Google Scholar] [CrossRef]
  18. Post, J.E.; McKeown, D.A.; Heaney, P.J. Raman spectroscopy study of manganese oxides: Tunnel structures. Am. Mineral. 2020, 105, 1175–1190. [Google Scholar] [CrossRef]
  19. Bernardini, S.; Bellatreccia, F.; Casanova Municchia, A.; Della Ventura, G.; Sodo, A. Raman spectra of natural manganese oxides. J Raman Spectrosc. 2019, 50, 873–888. [Google Scholar] [CrossRef]
  20. Broadhurst, E.T.; Wilson, C.J.G.; Zissimou, G.A.; Padrón Gómez, M.A.; Vasconcelos, D.M.L.; Constantinides, C.P.; Koutentis, P.A.; Ayala, A.P.; Parsons, S. Co-Crystals and Salts of Hydroxybenzoic Acids with Nitro-Substituted Pyridines. Cryst. Growth Des. 2023, 23, 1915–1924. [Google Scholar] [CrossRef] [PubMed]
Figure 1. Rhodochrosite and calcite typical Raman spectrum from 1500 to 50 cm−1 range obtained at 1064 nm excitation source, with 500 mW of laser power, 512 accumulated spectra, and 1 cm−1 spectral resolution. The spectra were normalized by the height of the νsy band.
Minerals 14 00703 g001
Figure 2. Rhodochrosite Raman spectra for sample A obtained at 785 and 633 nm excitation sources with 100 and 20 mW of laser power, 10 accumulated spectra of 10 s of accumulation time, and 3 cm−1 spectral resolution.
Minerals 14 00703 g002
Figure 3. (A) Rhodochrosite sample A; (B) rhodochrosite sample b; (C) a 10 × 10 grid Raman image for samples A and (D) B obtained at a 532 nm excitation source—the image refers to a 4× magnification objective but the Raman spectra were measured with a 50× magnification objective, with 20 mW of laser power, 3 accumulated spectra, and 5 s of accumulation time—presenting the comparison between L and T bands intensities.
Minerals 14 00703 g003
Figure 4. Rhodochrosite sample D; Raman image obtained at a 532 nm excitation source—the image refers to a 4× magnification objective, but the Raman spectra were measured with a 50× magnification objective, with 20 mW of laser power, 3 accumulated spectra, and 5 s of accumulation time—presenting the comparison-integrated L and T bands.
Minerals 14 00703 g004
Figure 5. Raman spectra in different values of temperature (−180–375 °C) from 1500 to 100 cm−1. A fragment of sample A was used in this experiment. The Raman data were obtained at a 532 nm excitation source with 5 mW of laser power and 10 accumulated spectra with 10 s of acquisition time for each one. The Raman spectra were normalized by the height of the L band.
Minerals 14 00703 g005
Figure 6. Raman spectra in different values of pressure (0 GPa–5.9 GPa) from 800 to 100 cm−1. A fragment of sample A was used in this experiment. The Raman data were obtained at a 633 nm excitation source with 5 mW of laser power and 3 accumulated spectra with 20 s of acquisition time, using a 10× objective. The Raman spectra were normalized by the height of the L band.
Minerals 14 00703 g006
Figure 7. Variation in vibrational frequency as a function of temperature for each vibrational mode of rhodochrosite. A fragment of sample A was used in this experiment. In blue, the polynomial fitting of the type y = ax2 + bx + c is presented, and in red, the linear fitting of the type y = ax + b. The Raman data were obtained at a 532 nm excitation source with 5 mW of laser power and 10 accumulated spectra with 10 s of acquisition time for each one.
Minerals 14 00703 g007
Figure 8. Variation in vibrational frequency as a function of pressure in each vibrational mode of rhodochrosite. A fragment of sample A was used in this experiment. In blue, the polynomial fitting of the type y = ax2 + bx + c is presented, and in red, the linear fitting of the type y = ax + b. The Raman data were obtained at a 633 nm excitation source with 5 mW of laser power and 3 accumulated spectra with 20 s of acquisition time for each one. Specifically, when using the pressure accessory, it was necessary to replace the 50× magnification objective with a 10× one.
Minerals 14 00703 g008
Figure 9. Isobaric and isothermal Gruneisen parameter graphical representations for each analyzed vibrational mode.
Minerals 14 00703 g009
Figure 10. Anharmonicity as a function of temperature and pressure was calculated for the libration mode.
Minerals 14 00703 g010
Table 1. Isobaric and isothermal Gruneisen parameters and anharmonicity calculated by the linear fitting results.
Vibrational Mode γ T γ P a
Asymmetrical stretching-2.6 × 10⁻⁶-
Symmetrical stretching−0.241.8 × 10−6−0.50
Bending mode−0.20--
Libration−1.284.1 × 10−5−2.68
Translation−1.473.7 × 10−5−3.07
Disclaimer/Publisher’s Note: The statements, opinions and data contained in all publications are solely those of the individual author(s) and contributor(s) and not of MDPI and/or the editor(s). MDPI and/or the editor(s) disclaim responsibility for any injury to people or property resulting from any ideas, methods, instructions or products referred to in the content.

