Abstract
The Amapá margin, part of the Brazilian Equatorial Margin (BEM), is a key region that plays a strategic role in the global climate balance between the North and South Atlantic Ocean as it is strictly tied to equatorial heat conveyance and the fresh/salt water equilibrium with the Amazon River. We performed a new scientific expedition on the Amapá continental shelf (ACS, northern part of the Amazon continental platform) collecting sediment and using instrumental observation at an unstudied site. We show here the preliminary outcomes following the applied methodologies for investigation. Geophysical, geological, and biological surveys were carried out within the ACS to (1) perform bathymetric and sonographic mapping, high-resolution sub-surface geophysical characterization of the deep environment of the margin of the continental platform, (2) characterize the habitats and benthic communities through underwater images and biological sampling, (3) collect benthic organisms for ecological and taxonomic studies, (4) define the mineralogical and (5) elemental components of sediments from the study region, and (6) identify their provenance. The geophysical data collection included the use of bathymetry, a sub-bottom profiler, side scan sonar, bathythermograph acquisition, moving vessel profiler, and a thermosalinograph. The geological data were obtained through mineralogical, elemental, and grain size analysis. The biological investigation involved epifauna/infauna characterization, microbial analysis, and eDNA analysis. The preliminary results of the geophysical mapping, shallow seismic, and ultrasonographic surveys endorsed the identification of a hard substrate in a mesophotic environment. The preliminary geological data allowed the identification of amphibole, feldspar, biotite, as well as other minerals (e.g., calcite, quartz, goethite, ilmenite) present in the substrata of the Amapá continental shelf. Silicon, iron, calcium, and aluminum composes ~85% of sediments from the ACS. Sand and clay are the main fraction from these sediments. Within the sediments, Polychaeta (Annelida) dominated, followed by Crustacea (Arthropoda), and Ophiuroidea (Echinodermata). Through TowCam videos, 35 taxons with diverse epifauna were recorded, including polychaetes, hydroids, algae, gastropods, anemones, cephalopods, crustaceans, fishes, and sea stars.
1. Introduction
The Brazilian Equatorial Margin (BEM) developed during rifting and spreading of the South Atlantic Ocean at the end of the Early Cretaceous [1]. The main rifting phase resulted in the development of five coastal sedimentary basins, named, from east to west: Potiguar, Ceará, Barreirinhas, Pará-Maranhão, and Foz do Amazonas [2,3]. The BEM is located within the latitudinal range of the Intertropical Convergence Zone (ITCZ). Studies show a link between the latitudinal position of the ITCZ and the meridional displacement of warmer waters, which correlates with rainfall volume [4,5,6]. In particular, the western BEM is influenced by the Amazon River plume, an intense freshwater discharge flowing westwards alongside the North Brazilian Current (NBC, Figure 1) [7,8,9]. The NBC is a high-intensity stream flowing from the Tropical Atlantic Ocean towards the North Atlantic Ocean, which transports heat and salt from the equator to feed the Gulf Stream in the Gulf of Mexico. In general, the BEM may influence the mechanisms triggering the formation of deep-water masses such as North Atlantic Deep Water, thus influencing the global climate [10,11,12,13]. A cruise campaign was recently conducted with the general objective of investigating areas of possible occurrences of biogenic formations in the Brazilian Equatorial Margin (BEM or MEq in Portuguese) region, through high-resolution geophysical mapping, as well as imaging the area and collecting benthic organisms. The comprehension of ecosystem dynamics, especially in marine sediments at substantial depths, also relies significantly on understanding the composition of microbial communities [14]. In these environments, the presence of chemosynthetic bacteria and archaea is pivotal, as they play a crucial role in the energy processes essential for sustaining these ecosystems [15]. This ecosystem is found in mesophotic zones, which is consensually defined as a zone in tropical and subtropical regions extending between a 30–40 m and ~150 m water depth [16]. Defining the possible actions for the future survival of this marine ecosystem is strongly dependent on accurate characterization. For this reason, it is important to map its spatial distribution and extension to orient future research and inform management plans and conservation measures [17,18,19].
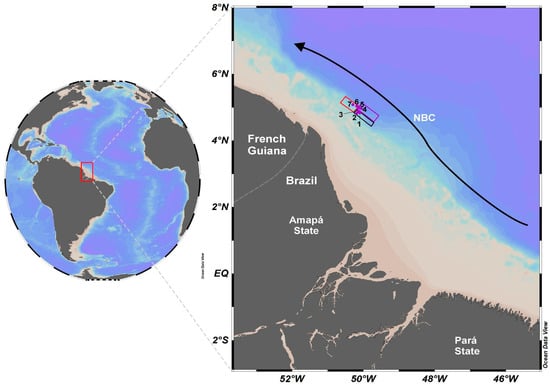
Figure 1.
Location map of study sites 1–7 (purple circles) within Amazon continental shelf, which are near the limit between Brazil and French Guiana. Black, purple, and red rectangles represent the areas 1, 2, and 3, respectively. Black arrow indicates the North Brazil Current (NBC) and light brown represents the Amazon River plume along the Brazilian coastal region.
The Amazon River cone influences microbial communities, causing observable salinity variations [20]. This setting hosts both methane-producing and methane-consuming microorganisms, which contribute to methane cycling, while denitrifying and sulfate-reducing bacteria impact nitrogen and sulfur cycling, influencing the biogeochemical cycles at submarine depths [21]. Despite the variability in microbial communities, the study explored the unidentified populations in this remote area, highlighting the uncertainty surrounding the microbial diversity and functional roles in Amazon marine sediment at this depth, underscoring the importance of microbiology in deciphering the natural intricacies [22]. This expedition report details the geophysical, geological, and ecological surveys along the BEM, carried out on board the NPqHo Vital de Oliveira from June 3rd to 28th 2023 on the Amapá continental shelf (ACS). This site has never been surveyed; thus, little is known about the geological features or organism communities from this area. Thus, the specific objectives were (a) to perform the bathymetric mapping and high-resolution sub-surface geophysical characterization of deep environments in the BEM; (b) identify the mineralogical and elemental components of sediments; (c) characterize the habitats and benthic communities through underwater images and biological sampling; (d) collect benthic organisms for ecological and taxonomic studies of the Amazon mesophotic zone; and (e) identify their provenance, the latter related to the hydrodynamic variability from the NBC based on the retrieved sediments.
2. Areas of Interest
The study region of the scientific cruise was located along the BEM near the Oiapoque region, Amapá State in Brazil and the northern Brazilian maritime border with French Guiana. This study region was subdivided into three areas (named areas 1, 2, and 3, Figure 1) to facilitate the organization of data acquisition. Located on the wide Amazonian continental shelf (~300 km), this region evolved from a carbonate to a siliciclastic system during the early Late Miocene (9.5–8.3 Ma) [23,24,25,26]. At this time, under lowstand sea level, an incised canyon system directed sediment influx toward the slope and basin floor [27]. Shelf edge reef buildups occurred peripherally to the deep Amazon Fan and were gradually overlain by siliciclasts during the Neogene and Quaternary highstands [27,28]. Recently, a study of the French Guiana Shelf revealed beachrock from the last glacial maximum sea level drop [29]. At present, the high sediment load from the river settles relatively quickly on the inner and mid shelves, resulting in an unstable muddy benthic habitat, with previous findings of high bacterial biomass and low diversity and an abundance of epifauna and meiofauna [30,31,32]. The region is also subjected to a highly energetic physical regime because of the fast-flowing NBC, strong wind stress, and high semidiurnal tidal ranges. Such conditions create a high-stress habitat for benthic megafauna, especially in the areas with soft, fluid sediments. The high sedimentation and sediment reworking on the inner and mid shelves have been comprehensively surveyed in the last decades, including the core river–ocean biogeochemical processes [30].
An extensive biogenic formation was recently described [22,33,34] along the continental shelf that extends from Amapá to Maranhão, called the “Great Amazon Reef System” or by the acronym GARS. Since then, there has been an intense debate between environmentalists, the government, and the oil industry around the region’s environmental sensitivity to possible oil spills. Given the current controversy between, on the one hand, the need for biodiversity conservation and, on the other, the interest in economic development in the region, it is understood that there is an intermediate path that consists of supporting the characterization and adequate mapping of the environmental resources existing along the BEM, as well as carrying out cutting-edge research aimed at understanding the sensitivity of those ecosystems to the oil industry activities. This has generated scientific subsidies necessary for research supporting the sustainable use of the Blue Amazon, in partnership with the Brazilian Navy [35].
3. Methods
The methodologies associated with geophysics, geology, and biology (Figure 2) used in the work allowed us to perform a preliminary characterization of the ACS. More specifically, those methodologies allowed the study of geophysics mapping, hydrodynamic reconstruction, provenance of sediments, elementary geochemistry, mineralogy, ecology, and taxonomy, which led to the recognition of the morphological, geological, and biological features of the edge of the continental platform.
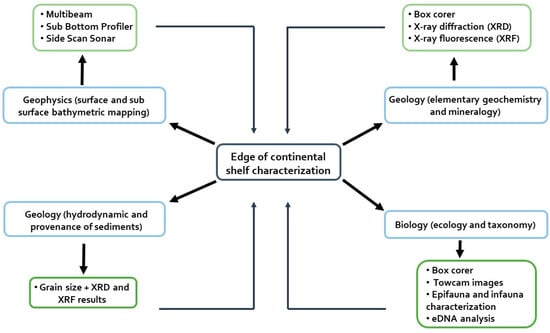
Figure 2.
Flowchart with all the methodologies associated with geophysics, geology, and biology (light green squares) used in this study to perform the characterization of the ACS. Those results allowed recognition of the morphological, geological, and biological features of the edge of the continental platform through geophysical mapping, hydrodynamic reconstruction, provenance of sediments, elementary geochemistry, mineralogy, ecology, and taxonomy (light blue squares).
3.1. Geophysics
3.1.1. Bathymetry
Multibeam bathymetric data were acquired throughout the study region using EM-710 (70–100 kHz) and EM-122 (12 kHz) echosounders. The EM-710 was used for shallow water up to 400 m and the EM-122 was used for water depths from 200 m onwards. During the emission of pulse lengths, a 55° angular sector was adopted for each side, and adjacent lines were covered with a minimum overlap of 20%.
The multibeam echosounder also generates backscatter data, which provide valuable insights into the substrate composition as it is an important tool for seabed mapping substrate [36,37]. This methodology involves the generation of an initial acoustic pulse (~80 µs). This signal returns to the multibeam echosounder and is analyzed based on the intensity of the sonar pulse amplitude. A weak return signal (low amplitude) indicates the presence of a soft bottom substrate, while a strong return signal (high amplitude) suggests the presence of a hard bottom substrate [38]. Multibeam bathymetric data and backscatter data were acquired through the software Seafloor Information System (SIS 5, version 5.9.1). Both data types were processed and analyzed within the software CARIS (version 2.3). Tide correction was performed manually by the Navy hydrographic surveyor on board the research vessel. As the study region is very dynamic, it was necessary to use additional data to validate and correct the sound velocity value in the water, which was then used to calibrate the multibeam bathymetric and backscatter data. The sound velocity was corrected through an Expendable Bathythermograph (XBT) and Expendable Sound Velocimeter (XSV) and moving vessel profiler (MVP) (shown in Section 3.1.4). Multibeam and backscatter, as well as the rest of the geophysical analysis and interpretations were performed in the Centro Oceanográfico de Registros Estratigráficos (CORE) laboratory at Instituto Oceanográfico, Universidade de São Paulo.
3.1.2. Sub Bottom Profiler
Seismic reflection is based on the emission, propagation, and reflection of acoustic waves through various geological layers. For seismic surveying, we utilized the Kongsberg Maritime AS (Kongsberg, Norway) SBP-122 Sub-Bottom Profiler. Shallow reflection seismic acquisition was carried out continuously by using the sub-bottom profiler for bottom depths between 100 and 200 m throughout the entire area planned. At strategic locations, acquisition was paused for geological sampling, during which the vessel remained in the dynamic positioning mode. The acquisition parameters were manually adjusted by naval operators to keep the bottom and sub bottom layers captured by the SBP aligned within the Acquisition Window, even in the presence of the observed depth variations. The conversion of raw data was performed using the KM SBP OPU acquisition software, version 1.6.7, and the data processing was carried out using the RadExPro (v 2022.1) seismic processing software.
3.1.3. Side Scan Sonar
The side scan sonar (SSS) data were acquired using a single-beam transducer operating at 455 kHz to provide the high-resolution imaging of the objects on the surface of the seafloor. The acoustic waves emitted are absorbed, scattered, and reflected by the seafloor. The physical parameters, such as return time and intensity of the acoustic signal, are used to generate the resulting sonogram. The initial acquisition strategy aimed for complete coverage of area 1, starting from the shallower parts and progressing to the deeper ones, with an average seafloor depth of 200 m and an initial line spacing of 121 m, maintaining an overlap of approximately 115% between the swaths to avoid gaps in the sonar mosaic. However, due to the extended time required for acquisition, we chose to modify this data collection to disregard the complete coverage of the area with SSS data in favor of incorporating the full coverage of the bathymetric data, maintaining an overlap of at least 20%. This resulted in an increase in the spacing between the acquisition lines, adjusted from the initial 130 to 340 m. The data generated via the SSS were acquired and processed within the software, SonarWiz (version 5). These preliminary data were analyzed during the expedition.
3.1.4. Bathythermograph Acquisition System (XBT and XSV)
The MK21 is a portable oceanographic data acquisition system capable of measuring crucial information such as temperature, conductivity, and sound velocity. These measurements are obtained through probes launched from the ship’s deck. During the commission, XBT and XSV probes were employed. The XBT and XSV casts occurred as necessary to update the values of the sound velocity in the water for equipment calibration. The XBT measures water temperature and depth, using the change in resistance of a copper wire on an unwinding spool falling at a constant rapid rate towards the seafloor at a known velocity. It is particularly useful in locations with known and constant salinity, indirectly calculating the sound velocity in the region. The XSV directly measures the sound velocity in the water, again using a copper wire falling at a constant known velocity, but in this case connected to a piezoelectric ceramic transducer pulsing at 6.5 MHz. The resulting acoustic signal travels to a brass receptor, then is reflected back (total path 2 inches) to trigger the initiation of a new pulse, creating a “sing around” of the signal at a frequency that varies according to the differences in temperature and salinity. The variation in this frequency (between 27 and 30 Hz according to the manufacturer) is the variable factor used to calculate the sound velocity, proving valuable in areas where the salinity varies with the depth, as was the case during this commission. Manufactured by Lockheed Martin Sippican, Inc. (Bethesda, MD, USA), the model used was the MK21 Ethernet Surface 1U DAQ.
3.1.5. Moving Vessel Profiler (MVP)
The moving vessel profiler, model MVP 300 (AML Oceanographic, Dartmouth, Canada), is an automatic profiling system capable of providing water column profiles while the ship is in motion (supporting speeds of up to 12 knots). It offers profiles of sound velocity, CTD (conductivity, temperature, and depth), a particle counter, fluorimetry, and other parameters. This autonomous equipment can be controlled via the computer without the need for personnel on the deck. During the commission, the AML SV&P Micro Sensor and AML CTD Micro Sensor were used as sensors integrated into the equipment, both from AML Oceanographic (Applied Microsystems Ltd., Sidney, BC, Canada). The MVP deployments occurred as needed to update the sound velocity profile for loading into the Echo Sounder and SBP.
3.1.6. Thermosalinograph
The thermosalinograph continuously acquires the seawater temperature and conductivity data. In the case of the ship, it is connected to the sea chest, measuring data to a depth of 4 m below the waterline. The model used on board was the SBE 21 SeaCAT Thermosalinograph (Sea-Bird Electronics, Bellevue, WA, USA).
3.2. Biological and Geological Sampling (Box Core)
The Brazilian Navy ship, NPqHo Vital de Oliveira, is equipped with a Box Core (model 80.100, KC Denmark, DK) with a capacity of 40 L (Figure 3A), using the 80.101-50 sample tube box (40 × 37 × 56 cm). At each site, the box core was deployed twice, once for geological, chemical, and microbiological assessment (Figure 3B) and once for infaunal assessment. One site included 3 deployments due to the poor sediment retention. Once the box core containing sediment was retrieved and secured onboard, the sediment box was carefully detached from the frame and placed on the deck as rapidly as possible, ready for subsampling. The recovery from the box core was low at sites 4 and 5 (Figure 3C) due to the presence of a ferruginous crust (Figure 3D) on the seafloor.
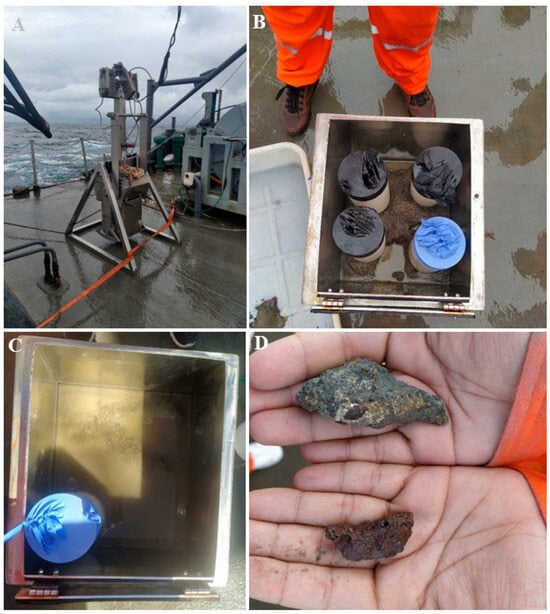
Figure 3.
(A) KC Denmark Box Corer (40 L, sampling box dimensions 40 × 37 × 56 cm), (B) subsamples carried out from an entire box corer. In each box we collected four small cores to perform different analysis, (C) diminished sediment recovery due the presence of hard ground, and (D) ferruginous crusts that prevented retention of intact sediment cores at points 3 and 4.
3.2.1. Epifauna and Infauna Characterization
From one of the two box cores at each site (Table 1), sediment was collected in whole. This sediment was then analyzed immediately for the presence of infauna. First, any organisms present on the surface were separated and immediately taken to the laboratory onboard for photographing prior to fixation (Figure 4). Sediment was then sampled to a depth several centimeters below the anoxic layer, which indicated the limit of the majority of bioturbation activities; this was observed as a distinct color and grain size change at a variable depth, always greater than 10 cm below the surface at these sites. The sediment was gently elutriated, then sieved through a series of two mesh sizes (1.0 and 0.5 mm) to separate the infauna into size classes. These were then placed in either 99% alcohol or in seawater in cases where photography was desired prior to fixation. All the organisms were identified and separated under a Nikon optical microscope in the onboard laboratory to the lowest taxonomic level possible. All samples were then fixed with 99% alcohol to allow the option of genomic methods being used for later identification in the laboratory.

Table 1.
Box cores collected in survey areas 1, 2, and 3 with details such as the recovery, coordinates depths, and collections performed. Falcon tubes were 60 mL and contained 30 g of sediment, PVC core tubes had 9.65 cm internal diameters and extended the full vertical extent of the box corer. An X indicates when samples were collected for bacterial and eDNA analyses.
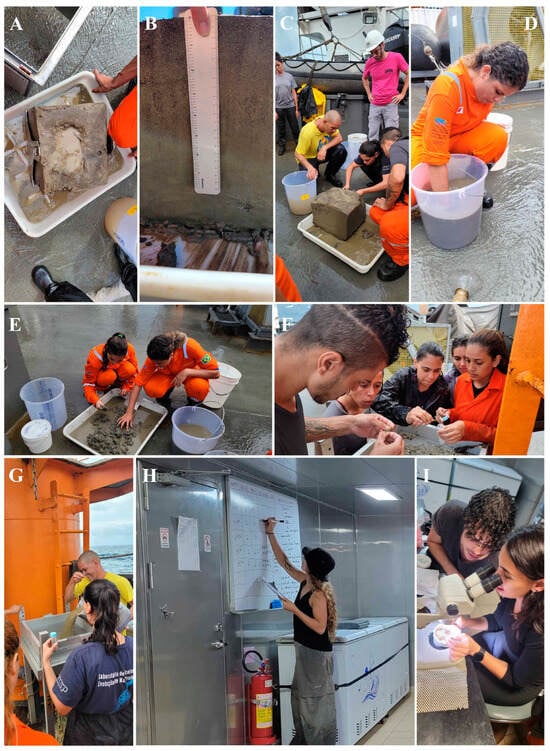
Figure 4.
Sampling of macrofauna with a box corer during the research campaign. (A) Total sediment sample from the box core for faunal sampling; (B) selection of the bioturbated upper portion of the sediment for sieving; (C) cutting and removing the sediment layer of interest; (D) sediment elutriation; (E) capture of living organisms identified in the sediment; (F,G) screening of the sediment in the set of 1.0 and 0.5 mm sieves; (H) registration of collection information; and (I) screening and identification in the Vital de Oliveira wet laboratory of live taxa before preservation.
3.2.2. Microbiological, eDNA, and Geological Sampling
From the other box core at each site (Table 1), a sterile surface sediment collection was performed using a sterile spoon and 3 falcon tubes to collect sediment for eDNA samples until a depth of 2 cm, filling each tube with approximately 30 g of sediment. The collection was performed with the use of face masks, gloves, and lab coats to maintain clean conditions. PVC core tubes (9.65 cm ID) were then inserted into the box for multiple analyses, including separate core tubes for microbiological analyses, geological processes, foraminifera, and sediment chemistry including grain size. The collection designated for microbiological analyses was collected first, using a face mask, then capped before the other PVC cores were inserted to avoid contamination. One plastic bag containing approximately 200 g of top sediment was also collected from each of these boxes for X-ray diffraction (XRD), X-ray fluorescence (XRF), and grain size analyses. The core tubes were then removed and immediately frozen vertically upright at −20 °C until they could be transported to laboratories for subsampling and further analyses. Any remaining sediment was designated for infaunal analysis and processed through elutriation and sieving as described above.
Microbial Analysis
The cores collected for the microbiological analyses were stored in a −20 °C freezer on board and −80 °C freezer as soon as they were received by the Ecologia Microbiana (LECOM) laboratory at Universidade de São Paulo. With the purpose of characterizing the microbial community in different layers of the sediment, they were subsequently sliced into 10 cm sections while still frozen. Samples from each layer were then extracted from inside the tubes, taking care to discard the lateral regions that were in contact with the PVC, as well as the upper and lower layers that had contact with the air. This procedure was conducted within a laminar flow hood. Subsequently, DNA extraction was performed using the DNeasy PowerSoil Pro Kit (QIAGEN©, Hilden, Germany), following the manufacturer’s provided protocol. The genomic DNA integrity was determined after agarose gel electrophoresis (0.8% TRIS-EDTA) and stained with Sybr Green (Thermo Fisher Scientific, São Paulo, Brazil). DNA quantification was performed using the Qubit dsDNA HS assay kit (Thermo Fisher Scientific, São Paulo, Brazil), following the manufacturer’s protocol.
eDNA Analysis
For DNA extraction, we will employ at least two commercial kits, namely the DNeasy PowerSoil Pro Kit (QIAGEN©, Hilden, Germany) and the Zymo Quick-DNA Miniprep (Zymo Research, Irvine, CA, USA), adhering to the respective manufacturer’s protocols. DNA quantification will be executed using the Qubit dsDNA HS assay kit (Thermo Fisher Scientific, São Paulo, Brazil). The samples are currently pending processing as they are integral to a specialized study aimed at optimizing eDNA techniques for the assessment and monitoring of marine environments.
The acquired DNA will be amplified via PCR, utilizing both universal eukaryotic primers [39] and primers tailored for specific organism groups, such as general vertebrates [40], fishes [41], and scleractinian corals [42]. Finally, sequencing will be conducted on the Illumina MiSeq platform using the v2 Reagent Kit for 2 × 150 bp paired-end sequencing, in accordance with the manufacturer’s protocol (Illumina, San Diego, CA, USA).
Mineralogical Analysis
Three samples from the uppermost depth interval from sites 5, 6, and 7 were collected and analyzed through X-ray diffraction. At the Institute of Energy and Environment (Universidade de São Paulo), the samples were dried in an oven at 60 °C for 24 h, powdered, sieved (150 µm mesh), and stored until analyzed, using a Bruker D8 Advance Eco Diffractometer equipped with a LYNXEYE XE detector and theta-theta system. The X-ray patterns were obtained by applying CuKα radiation (40 kV, 25 mA) using a 2.5o collimator, 0.02 mm Ni filter, 0.2° primary slit, and 9.5 mm secondary slit. The samples were rotated during the scanning between 2° and 100° 2θ, with a 0.02° 2θ step and 3.1 s of acquisition time. The obtained data were processed using X’Pert software HighScore Plus (version 3.0.5) to identify the minerals based on the d-spacing. All expressive peaks with respective d-spacing were compared with the Crystallographic Open Database.
This technique allows the identification of the minerals present in the sediment, as X-rays will diffract according to the crystalline structure of each mineral. The XRD technique is based on the emission of X-rays on a previously treated sample. The X-ray beam diffracts in multiple directions, and the equipment’s detector records the intensities received at different angles of dispersion. From the diffraction patterns, it is possible to determine the distance between the planes of atoms in the crystalline arrangement through Bragg’s Law (nλ = 2d.sinθ), in which the order of diffraction is represented by n, and the wavelength (λ) is related to the distance between the crystal planes (d or 2θ) and the diffraction angle of the X-ray beams, θ [43].
Elemental Analysis
The same samples from sites 5 and 6 were analyzed under X-ray fluorescence (XRF) in the CORE laboratory using the XRF Supermini 200. Each sample was powdered for approximately 10 min; then, two tablets were formed from the powdered samples, which were then heated to avoid surface moisture content. The tablets were then inserted into the XRF to identify the most abundant elements comprising both samples.
This technique consists of detecting the characteristic X-ray from chemical elements through the photoelectric effect, as each element releases a specific quantity of energy, which allows its identification [44]. The energy source (X-ray) excites an electron from the innermost shell energy level (layer of lower energy, e.g., K, L, M) of the component atoms; its ejection generates a vacancy in that shell, destabilizing the atom. This empty space will thus be filled by an electron from an outer shell energy level that will necessarily release energy (photon) as it transitions to the lower energy layer [45]. This energy is measured using its characteristic line transitions. Thus, if an electron transitions from energy level L to K, Kα emission lines are registered by the detector. If this transition takes place from energy level M to K, then Kβ lines are recorded [45]. All the results are presented in counts per second.
Grain Size Analysis
Grain size analyses were carried out on the aforementioned samples through a Microtrac MRB Bluewave SIA at the CORE laboratory based on the grain size scale from [46]. The obtained data were statistically treated using the Sysgran software version 3.0 [47]. The pre-treatment involved the addition of Sodium pyrophosphate to both samples to disaggregate the sediments, which assists in the correct analysis of particle size. All samples were chemically cleaned to remove organic matter using a solution of 10% hydrogen peroxide (H2O2) [48]; then carbonates were removed (decarbonation step) using a solution of 10% hydrochloric acid (HCl) [49,50] to avoid interference with the results obtained. Between the steps, the samples were washed with pure water (Milli-Q).
3.3. Macro- and Megafauna Characterization through Bottom Imaging
Bottom imagery was collected in an area of interest within Area 2, with the aim of characterizing the community of benthic and bentho-pelagic megafauna though the TowCam (Figure 5). A rounded negative feature, consistent with a “pockmark”, was identified in bathymetric mapping, thus the transect line was selected to attempt to pass over this pockmark feature. The TowCam system (prototype model BMPTech, Campo Grande, Brazil) consists of a rectangular frame with rear “wings” comprising the towed vehicle, containing an HD video camera (1080p video and 4k photos), two high-power LED light sources, and a PSA-916 Sonar Altimeter (Teledyne, North Falmouth, MA, USA). The live video image is used to control decision-making regarding tow speed and altitude above the seafloor during the dive. This vehicle is towed by a fiber optic umbilical cable operated with an associated winch (prototype model BMPTech, Campo Grande, Brazil, 2.1 × 1.2 × 1.3 m). It holds 1300 m of cable (electromechanical + optical fiber) sufficient for operation at depths between 250 and 1300 m.
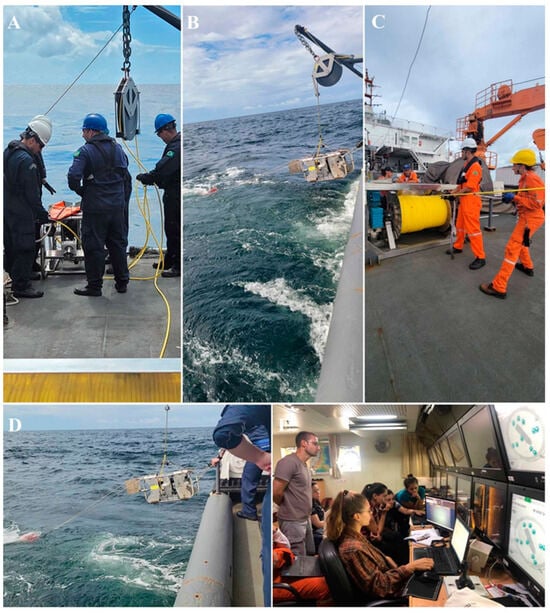
Figure 5.
TowCam system in operation.: (A) TowCam system near people for scale (B) TowCam deployment (C) winch with 1300 m of optical fiber umbilical; (D) TowCam retrieval (E) Dry lab TowCam Operations control and live annotation.
The TowCam was deployed along a transect line roughly aligned with the current direction during the campaign and towed at the minimum speed possible that allowed directional control by the ship, just under 1 kn countercurrent. As it is towed, with no independent maneuvering system, there is no possibility of stopping or returning to any feature of interest, only filming along the transect covered. The transect line was approximately 6 km long, but the descent began 1 mile before the starting point of the transect to adjust the positioning of the ship and stabilize the TowCam in the water. The TowCam was deployed with the vessel in motion at 1 knot. Due to the strong current in the region, which varied from 4.2 to 5.5 knots during the deployment, the TowCam winch cable angle was shallow, resulting in the TowCam following the ship at a distance of 500 to 800 m; it thus took a significant amount of time, ~45 min, for the TowCam to reach the seafloor and stabilize through paying out and taking in the winch cable so that the equipment remained at a stable depth close to the bottom. The altimeter became operational when it was approximately 30 m from the bottom and was used, along with the visual image, as a guide for altitude control over the seafloor via the winch. After stabilization, imaging of the bottom continued for 3 h, attempting to maintain the TowCam approximately 1 m from the seafloor.
Live annotation was performed using trained observers to note the species present along the transect. However, due to the rapid transect velocity and high density of organisms, the video was then reanalyzed in the Ecologia e Evolução de Mar Profundo (LAMP) laboratory at Universidade de São Paulo to identify species to the lowest taxonomic level possible given the image resolution, using the initial annotations as the base. All videos were annotated to record and note the GPS position of every organism with sufficient image focus and illumination to allow identification.
4. Preliminary Results
4.1. Geophysics
4.1.1. Bathymetry
The geomorphic features identified in the multibeam bathymetry datasets have enabled a detailed mapping of the area located on the outer shelf and upper slope along the coast of Amapá. Geomorphic and geological features have been categorized into an extensive rocky structure with a broad latitudinal extension, submarine canyons, erosive seabed scars and depressions (Figure 6). The backscatter data outlines, on a black-and-white scale, the variations in contrast between high and low amplitudes related to the strength of returning sound signals. The presence of a more resistant substrate was identified, displaying significantly higher contrast than the surrounding area, with an intense reflection, indicating the presence of a rocky structure (Figure 7).
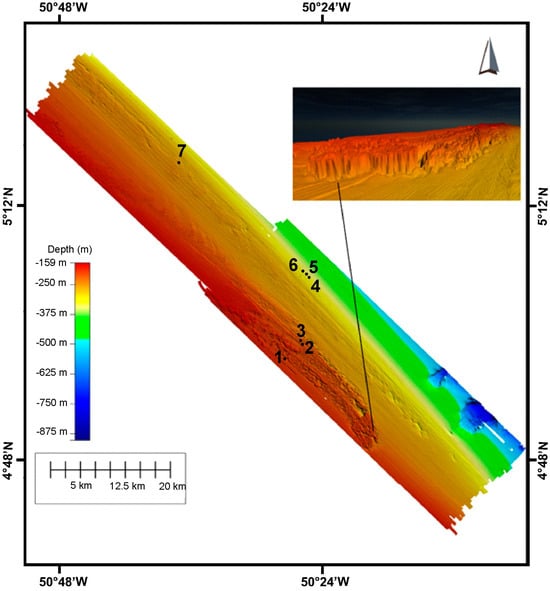
Figure 6.
Bathymetric map of the whole three study areas showing the seven (7) study sites in which we collected sediment samples through the box corer. The right panel indicates the three dimensional hardground structure commonly present in the study area 1.
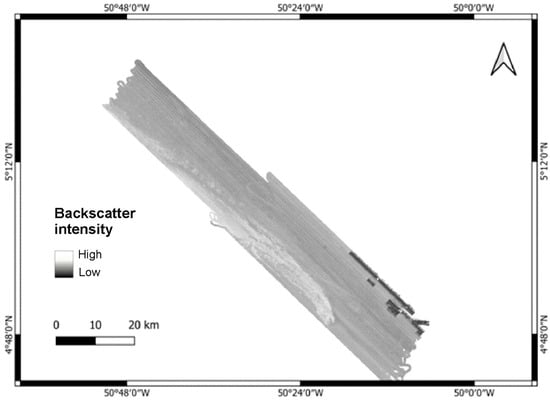
Figure 7.
Backscatter map of the region, where the rocky bed exhibits higher contrast than the rest of the area with a very strong reflection.
4.1.2. Sub-Bottom Profiler
The analysis of shallow seismic data suggests the presence of a complex topography in the form of a predominantly rocky bottom with interspersed muddy areas in association to the extensive structures observed in the bathymetric profile. The seismic data indicate the presence of irregular structures that, at certain moments during the acquisition, exhibited high acoustic reflectivities (Figure 8). This suggests that the irregularities detected in the seismic data may be attributed to specific subsurface features causing variations in the reflection of acoustic waves.
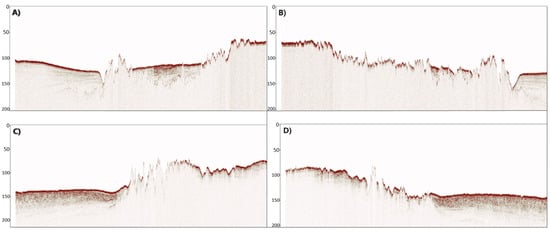
Figure 8.
Seismic data from the study area 1 illustrating lines of interest from the acquisition: (A) L418, (B) L420, (C) L442, and (D) L444, showing high acoustic reflectivities.
4.1.3. Side Scan Sonar
The initial analysis of side-scan sonar data indicated the presence of a target with strong reflectivity, contrasting with weaker reflectivity in the surrounding areas (Figure 9). The robust reflectivity signal suggests the existence of a rigid substrate, such as rock, while the weaker signal indicates the presence of a softer substrate, such as sand and mud. Additionally, as observed in the bathymetry, backscatter, and shallow seismic analyses, the sonar data also indicate the presence of hard substrate in the region.
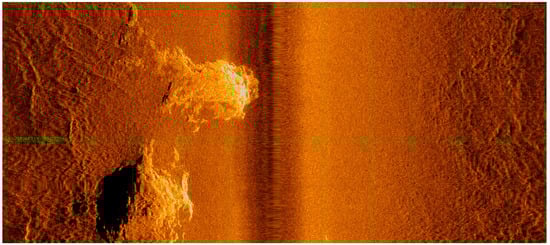
Figure 9.
Side scan sonar raw data from the study region illustrating line 11, highlighting a reflective target in a lighter color, which is indicative of the presence of hard ground. Light green lines indicate the grid spacing of 25 m.
The side-scan sonar data exhibited random bottom imaging records at some points during the acquisition. This is attributed to bottom currents in the region that caused the side scan to move farther from the seafloor to the point where sonographic data quality was compromised.
4.1.4. Temperature, Salinity and Speed of Sound in Water (XBT, XSV, MVP and Thermosalinograph)
During the initial survey in area 1, we encountered challenges stemming from the pronounced salinity fluctuations in the area, reaching 32 Practical Salinity Units (PSU) with an abrupt drop to 17 PSU in a specific region. This variability posed a hurdle in accurately measuring the speed of sound propagation in water during data acquisition, necessary for the reliability of acoustic data acquisition. To address this complexity, we implemented direct velocity measurements using the Expendable Sound Velocimeter (XSV) and smart sensor, a velocity measurement device attached to the ship’s gondola. We also conducted secondary measurements, such as of temperature, using the Expendable Bathythermograph (XBT) and the thermosalinometer, devices that collect data on seawater temperature and conductivity, enabling the calculation of sound velocity. When employing the XBT, we compared the calculated velocity with that measured by the smart sensor. If the difference exceeded 3 m/s, data from the XBT were disregarded. The water velocity measurements generally ranged between 1529 and 1544 m/s. The deployment of the moving vessel profiler (MVP), equipped with a sensor for direct velocity measurement, allowed for the correction of the sound velocity data in water. This enabled the simultaneous and continuous operation of the EM-710 Multibeam Echo Sounder, sub-bottom profiler, and side scan sonar. Although the acquisition area was situated beyond the bounds of the Amazon River cone, its significant influence is evident, reflected in the notable salinity variations observed in the region.
4.2. Biological and Geological Sampling (Box Core)
4.2.1. Epifauna and Infauna Characterization
The infaunal macrofauna were characterized mainly by Polychaeta (Annelida), followed by Crustacea (Arthropoda), and Ophiuroidea (Echinodermata, Figure 10). In area 1 (~205 m depth), Sipuncula (Annelida) was the most dominant group with an 8-fold abundance compared with the other taxa; Spionidae annelids and Bivalvia were also abundant. In area 2 (~300 m depth), polychaete annelids were the dominant taxon with a large number of unidentified families (Figure 11); however, the identified annelid families, Spionidae and Cirratulidae, as well as Crustacea and Tanaidacea were also recorded in larger numbers. Unidentified polychaetes also dominated area 3 (~300 m depth), followed by the genus, Eunice (Eunicidae), and the families, Spionidae and Capitellidae. Crustaceans and ophiuroids were also noted in several samples, but occurred in low numbers (Figure 12).
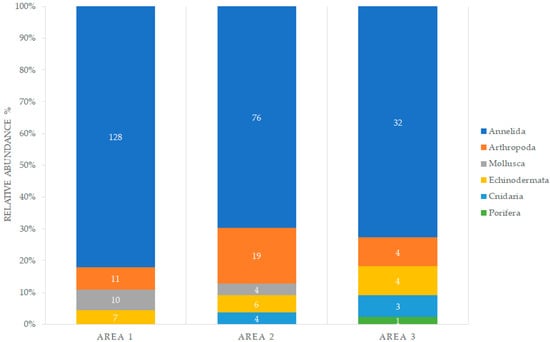
Figure 10.
Relative abundance of macrofauna by phyla, collected with a box corer in areas 1, 2, and 3.
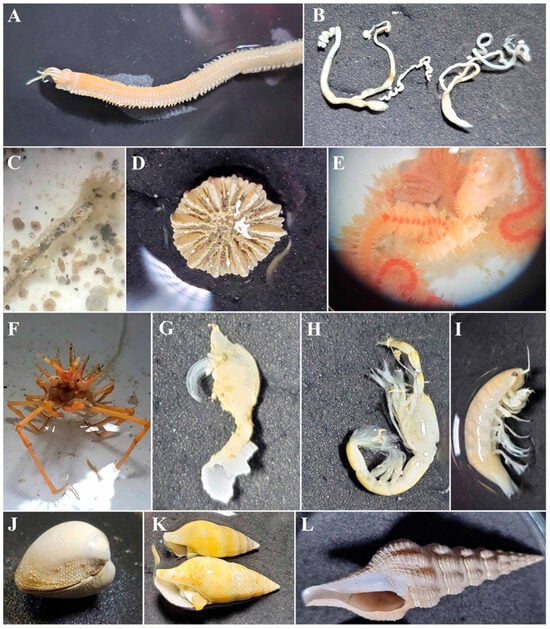
Figure 11.
Examples of macrofauna collected with the box corer in areas 1, 2, and 3. Phyla Annelida: (A) Eunice sp.; (B) Priapulidae; (C) polychaete tube. Phylum Cnidaria: (D) Scleractinia, prov. Deltocyathus. Phylum Echinodermata: (E) Ophiuroidea. Phylum Arthropoda, Class Crustacea: (F) Piscidae crab; (G) Cirripedia; (H) Decapoda Thalassinidea; (I) Isopoda. Phylum Mollusca: (J) Bivalvia; (K,L) Gastropoda.
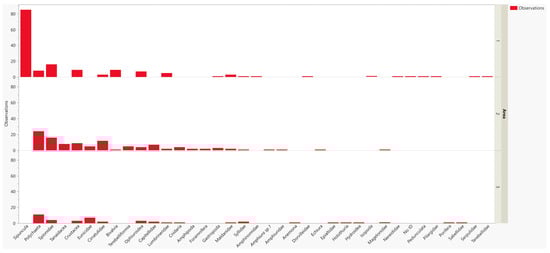
Figure 12.
Total abundance graph of organisms sampled by box corer, separated into areas 1, 2, and 3. “Polychaeta” refers to polychaetes that have not yet been identified to the family (or genus) level.
4.2.2. Microbiological and eDNA
Microbial and eDNA analyses are still ongoing. In marine sediment collected at approximately 300 m depth, various microbial groups with specific functions are commonly found. The bacteria and archaea engaged in chemosynthesis play a crucial role in these environments, utilizing inorganic chemical compounds such as sulfides to derive energy, thereby supporting the ecosystems at considerable depths. Once the influence of the Amazon River cone was reported, reflections in the microbial community will be observed as the probable presence of methane-producing (methanogenic) and methane-consuming (methanotrophic) microorganisms. Nitrogen and sulfur cycling is influenced by denitrifying and sulfate-reducing bacteria, further impacting the biogeochemical cycles in the deep sea. However, the microbial communities in marine sediments can vary significantly, and given the absence of prior results in this specific area, predicting the specific outcomes becomes challenging and important. The extent of the microbial diversity and the functional roles of these communities in the Amazon marine sediment at this depth remain uncertain, underscoring the significance of the current study.
Our eDNA study focused on leveraging the sediment samples to refine the methods in sample collection, DNA extraction, and the analysis of the extracted DNA. In this setting, environmental DNA (eDNA) encompasses both intrasediment organismal DNA and extracellular DNA from larger organisms, typically present in low concentrations in these environments. We aimed to assess whether our collection volume (aligned with metagenomic analysis standards), along with our preservation and extraction methods, and the potential requirement for DNA amplification, will enable the efficient detection of eDNA.
4.2.3. Mineralogical, Elemental, and Grain Size Analysis
Mineralogical analysis revealed that sample MEQ 5B-3 was composed of calcite, quartz, biotite, amphibole, labradorite, andesine, ilmenite, and chlorite (Figure 13). The sample MEQ 6A-1 showed a similar composition to the previously described sample. The main minerals found with distinguished peaks were quartz, calcite, goethite, ilmenite, chlorite, biotite, andesine, and labradorite (Figure 14).
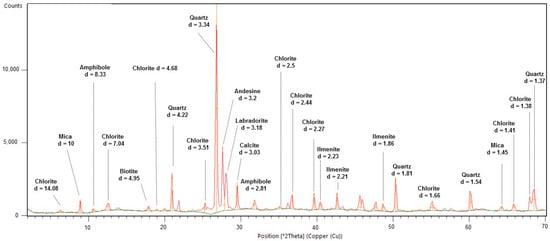
Figure 13.
XRD result from top depth sample from core MEQ 5B-3 with major mineralogy and its associated d-spacing value. Light green line represents the background of the sample. The red line indicates the intensity peaks of minerals.
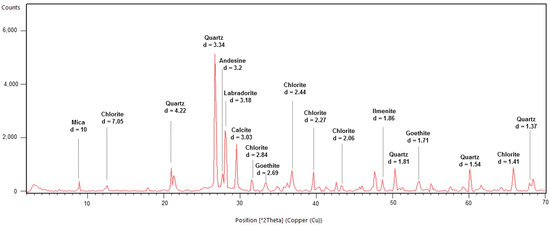
Figure 14.
XRD results from top sample MEQ 6A-1 displaying the major groups of minerals found (feldspar, chlorite) as well as goethite, calcite, and quartz with their respective d-spacing values. Light green line represents the background of the sample. The red line indicates the intensity peaks of minerals.
The XRF results from the top of core MEQ 5B-3 revealed six major elements (Figure 15), which showed the highest kilo counters per second (kcps), as follows: silicon (Si, 57.12 kcps), iron (Fe, 20.87kcps), calcium (Ca, 20.11 kcps), aluminum (Al, 19.92 kcps), chlorine (Cl, 8.51 kcps), and potassium (K, 3.97 kcps). The lowest intensities were shown by strontium (Sr, 1.18 kcps), sulfur (S, 0.57 kcps), magnesium (Mg, 0.55 kcps), zirconium (Zr, 0.42 kcps), titanium (0.35 kcps), rubidium (Rb, 0.31 kcps), sodium (Na, 0.29 kcps), yttrium (Y, 0.22 kcps), bromine (Br, 0.21 kcps), phosphorus (P, 0.18 kcps), zinc (Zn, 0.11 kcps), manganese (Mn, 0.09 kcps), copper (Cu, 0.08 kcps), and arsenic (As, 0.07 kcps). The XRF results from the top of core MEQ 6A-1 were very similar to those for MEQ 5B-3 and for this reason are not described here.
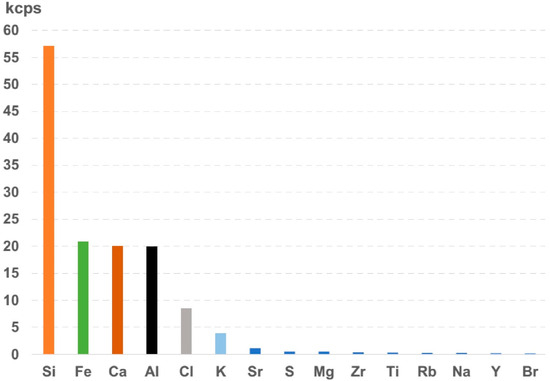
Figure 15.
XRF results from top sample MEQ 5B-3 in which Si, Fe, Ca, Al, Cl, and K are the main elements present and display the highest intensities.
The grain size analysis from both top depth intervals from MEQ 5B-3 and MEQ 6A-1 showed that they contain similar percentages of components (Figure 16) and poorly sorted grains, and were classified as very fine sand. The sample MEQ 5B-3 comprised sand (85.97%), silt (13.07%), and clay (0.96%), whereas the sample MEQ 6A-1 comprised sand (86.47%), silt (10.51%), clay (2.16%), and gravel (0.86%).
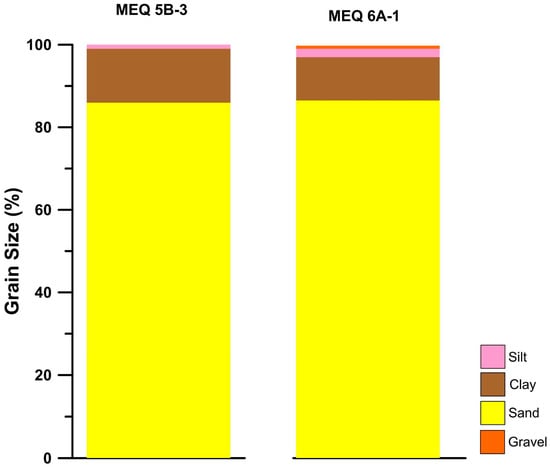
Figure 16.
Grain size results from top depth samples from sites 5 and 6, showing minor differences between both samples.
The characterization of these materials, associated with the information from backscatter and other geophysical data, shows a mixture of terrigenous origin and excludes a biological origin, signifying that the probable contribution of the Amazon River sediments is very strong and overtakes the biological formation. Further analysis of organic carbon isotopes and neodymium and strontium isotopes should confirm that the sediments are derived from the Amazon River and possibly other sources. That information is crucial and provides clues that allow us to preliminarily define a silicon–iron–carbonate hardground or beachrock in a mesophotic hardground. If this is confirmed, it would be possible to associate this with a southern extension of the beachrock of the last glacial maximum sea level fall that was identified in French Guiana [29].
4.2.4. Macro- and Megafauna Characterization through Bottom Imaging
The TowCam launch allowed 3 h of bottom imaging from a 2.6 km long transect in area 2 (Figure 17). In total, 3641 organisms were recorded, distributed in 35 taxons. The registered epifauna included frequent observations of the annelid, polychaete Eunicidae (identified using box core samples), followed by fish from the genus, Saurida, and potentially multiple species but all visually similar given the image resolution obtained. Also noted frequently were crustaceans (noting decapod shrimp, Galatheidae, and Majidae, Figure 18). Along with the polychaetes noted, several organisms were recorded as commonly attached to the associated tubes. Among them are two possibly different species of hydroids, Phaeophyceae algae (brown algae), Actinoscyphia anemones, and other polychaetes species, which indicates that Eunice sp.1 plays an important role as an ecosystem engineer in the area. The sea stars, Nymphaster and Coronaster, as well as ophiuroids were observed in open seafloor areas, as opposed to being on the surface of sessile species. The fauna distribution was apparently homogenous, with no aggregated population recorded, and with a high abundance on the filmed seafloor, ca. 1.400 specimens/km. Gaps in the organism annotations along the transect line (Figure 17) correspond to moments when the altitude of the camera was too far above the seafloor to allow identification rather than an absence of organisms.
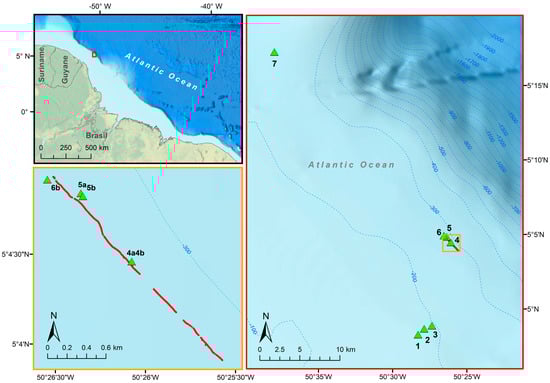
Figure 17.
The TowCam video sampling transect, shown in red at three different scales, extended approximately 2.6 km, with an average depth of 280 m. The transect is illustrated with respect to the South American coastline (upper left map),the overall sampling area (right map) and with respect to the 300 m isobath (lower left map). Box corer samples (green triangles) were collected at 7 locations (right map), three of which occurring along the transect line (lower left map), identified by their box core sample IDs. The red dots along the transect mark the distribution of organisms recorded in the images. The two gaps within the transect are indicative of regions where visibility was too poor to identify the presence of organisms rather than an absence of fauna.
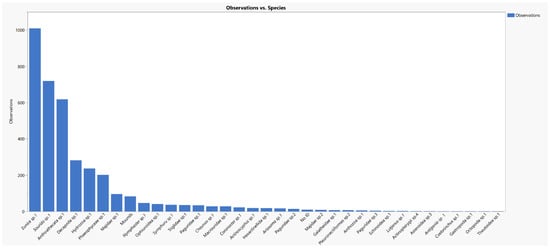
Figure 18.
Abundance of the benthic macro- and megafauna recorded using the BMPTech TowCam in area 2, graphed on a logarithmic scale.
Until the TowCam reached the bottom, large planktonic organisms recorded were identified as salps and ctenophores. In addition to the fauna, several “mounds” on the bottom were registered, which were probably related to the reproductive behavior of certain species of fish in the area [51,52].
5. Conclusions
The preliminary geophysical mapping through bathymetric, shallow seismic, and ultrasonographic surveys allowed the characterization of the mesophotic environment of the continental margin region. The analysis of backscatter and XRD data enabled the identification of the contrast variations between a soft seafloor and a substrate with rocky structures, which are preliminarily interpreted as silicon–iron–carbonate hardground or, possibly, beachrock.
The preliminary geological characterization from the top samples from three cores through specific analyses allowed an initial identification of the main minerals, including calcite, quartz, biotite, chlorite, goethite, amphibole, andesine, labradorite, and ilmenite, along the BEM. The sediments analyzed from the BEM were mainly composed of silicon, iron, calcium, aluminum, and potassium. These preliminary results give clues as to their origin and the associated paleoenvironment. The grain size analysis indicated high hydrodynamic energy as evidenced by the proportionally high sand fraction. Future work will be carried out at a high-resolution scale to elucidate the mineralogical and elemental variations preliminarily observed during the development of the present research.
Multiple methods were used to characterize the local diversity. Through filming with the TowCam in area 2, 35 taxons with diverse epifauna were recorded, including polychaetes, hydroids, algae, gastropods, anemones, cephalopods, crabs, fishes, and sea stars. The presence of corals was not detected through the TowCam videos. Of note, the tubes of Eunice polychaetes acted as a solid substrate for other sessile organisms such as hydroids and anemones. The box core samples provided insights into the infaunal macrofauna present, which are not detectable through filming. Sipuncula (Annelida) dominated in area 1, while polychaete annelids dominated in areas 2 and 3. Crustacea (Arthropoda) and Ophiuroidea (Echinodermata) were also present but in lower numbers. The wider spatial distribution between the box core sampling points also allows extrapolation of the representativeness or heterogeneity of the study region. In addition to those two, we will also have insights into biological communities from molecular methodologies. Environmental DNA (eDNA) has the potential to extend our understanding of the fauna, as it can access information about microeukaryotes. Microbial analysis will provide details on the composition and functional potential of the communities of bacteria, archaea, and viruses. The use of these methods together thus will allow a more complete understanding of the biological presence and variability.
Author Contributions
Conceptualization: L.J., H.M.C.d.B.N. and G.d.H.C.; methodology: A.Q.A., E.H.M., F.C.C.e.C., H.M.C.d.B.N., G.d.H.C., F.A.L., L.G.W., A.C.S., L.G.S., C.F.d.S., T.S.F., L.S., M.A.d.C.M., G.P.D., P.D., C.R.J., R.G.M.L., D.C.d.F., M.R.d.S., K.A.J., I.C.L., K.K.C.S., M.C.P., Y.d.S.A., N.M.L.C., T.R.M.C., K.L.C.F.d.C., R.C.M., I.G.S., L.G.M., S.P.R., M.R.S.d.S., M.M.d.A., V.H.P. and P.Y.G.S.; validation and formal analysis: L.G.W., L.G.S., C.F.d.S., A.C.S., A.Q.A., F.A.L. and L.G.S.; investigation: L.G.W., L.G.S., C.F.d.S., A.C.S., T.S.F., L.S. and A.Q.A.; resources: L.J. and P.Y.G.S.; data curation: L.G.W. and A.Q.A.; writing—original draft preparation: A.Q.A., F.A.L., L.G.W. and R.G.M.L.; writing—review and editing: A.Q.A., F.A.L., L.G.W., C.F.d.S. and L.J.; visualization: A.C.S., C.F.d.S., L.G.W., P.D., A.Q.A. and F.A.L.; supervision: L.G.W., A.Q.A., L.J. and M.A.d.C.M.; project administration: L.J. and E.H.M.; funding acquisition: L.J. and P.Y.G.S. All authors have read and agreed to the published version of the manuscript.
Funding
The BEM cruise was funded by the cooperation among the Brazilian government, Fundação de Amparo à Pesquisa do Estado de São Paulo (FAPESP—grant 2016/24946-9), and Petrobrás-CENPES. D.C.F. is also supported by the project Sentinelas da Amazônia Azul (monitoramento visual de cetáceos)—UFRN. Funds for the TowCam operations and the scientific crew mobility were provided by the iAtlantic project (Integrated Assessment of Atlantic Marine Ecosystems in Space and Time—European Union’s Horizon 2020—grant agreement no 818123).
Data Availability Statement
Data are contained within the article.
Acknowledgments
The authors thank the Brazilian Navy and the Crew of the Brazilian vessel, NPqHo Vital de Oliveira (H-39), for their support and dedication during the twenty-five-day scientific cruise. The authors thank Gilberto Bergamo and Arthur Güth (LAMP laboratory, Universidade de São Paulo) for the identification of certain characteristic organisms, and Arthur Güth again for some of the map creation.
Conflicts of Interest
Eduardo H. Marcon, Fernando Collo Correa e Castro, Halesio Milton C. de Barros Neto, Guarani de Hollanda Cavalcante, Marco A. de C. Merschmann, Celio Roberto Jonck are employees of CENPES/Petrobrás. The authors declare no conflict of interest.
Correction Statement
This article has been republished with a minor correction to resolve spelling and grammatical errors. This change does not affect the scientific content of the article.
References
- Basilone, L.; Roberts, G.G.; Maia de Almeida, N.; Fernandes, V.; de Souza, A.C.B.; Alves, D.P.V.; Jovane, L. Cretaceous to Recent tectono-sedimentary history and subsidence of the Barreirinhas, Ceará and Potiguar Basins, Brazilian Equatorial Margin. Basin Res. 2023, 36, e12810. [Google Scholar] [CrossRef]
- Soares Junior, A.V.; Costa, J.B.S.; Hasui, Y. Evolução da Margem Atlântica Equatorial do Brasil: Três fases distensivas. Geociências 2008, 27, 427–437. [Google Scholar]
- Jovane, L.; Figueiredo, J.J.P.; Alves, D.P.V.; Iacopini, D.; Giorgioni, M.; Vannucchi, P.; Moura, D.S.; Bezerra, F.H.R.; Vital, H.; Rios, I.L.A.; et al. Seismostratigraphy of the Ceará Plateau: Clues to Decipher the Cenozoic Evolution of Brazilian Equatorial Margin. Front. Earth Sci. 2016, 4, 90. [Google Scholar] [CrossRef]
- McQuate, G.T.; Hayden, B.P. Determination of intertropical convergence zone rainfall in northeastern Brazil using infrared satellite imagery. Arch. Meteorol. Geophys. Bioclimatol. Ser. B 1984, 34, 319–328. [Google Scholar] [CrossRef]
- Wang, X.F.; Auler, A.S.; Edwards, R.L.; Cheng, H.; Cristalli, P.S.; Smart, P.L.; Richards, D.A.; Shen, C.C. Wet periods in northeastern Brazil over the past 210 kyr linked to distant climate anomalies. Nature 2004, 432, 740–743. [Google Scholar] [CrossRef] [PubMed]
- McGee, D.; Donohoe, A.; Marshall, J.; Ferreira, D. Changes in ITCZ location and cross-equatorial heat transport at the Last Glacial Maximum, Heinrich Stadial 1, and the mid-Holocene. Earth Planet. Sci. Lett. 2014, 390, 69–79. [Google Scholar] [CrossRef]
- Stramma, L.; England, M. On the water masses and mean circulation of the South Atlantic Ocean. J. Geophys. Res. Ocean 1999, 104, 20863–20883. [Google Scholar] [CrossRef]
- Talley, L.D. Some aspects of ocean heat transport by the shallow, intermediate and deep overturning circulations. Geophys. Mono. Ser. 1999, 112, 1–22. [Google Scholar] [CrossRef]
- Arz, H.W.; Gerhardt, S.; Pätzold, J.; Röhl, U. Millennial-scale changes of surface-and deep-water flow in the western tropical Atlantic linked to Northern Hemisphere high-latitude climate during the Holocene. Geology 2001, 29, 239–242. [Google Scholar] [CrossRef]
- von der Heydt, A.; Dijkstra, H.A. The effect of gateways on ocean circulation in the late Oligocene and early Miocene. Paleoceanography 2006, 21, PA1011. [Google Scholar] [CrossRef]
- Pérez-Díaz, L.; Eagles, G. South Atlantic paleobathymetry since early Cretaceous. Sci. Rep. 2017, 7, 11819. [Google Scholar] [CrossRef]
- Uenzelmann-Neben, G.; Weber, T.; Grützner, J.; Thomas, M. Transition from the Cretaceous ocean to Cenozoic circulation in the western South Atlantic—A twofold reconstruction. Tectonophysics 2017, 716, 225–240. [Google Scholar] [CrossRef]
- Alves, D.P.V.; Maselli, V.; Iacopini, D.; Viana, A.R.; Jovane, L. Oceanographic exchanges between the Southern and Northern Atlantic during the Cenozoic inferred from mixed contourite-turbidite systems in the Brazilian Equatorial Margin. Mar. Geol. 2023, 456, 106975. [Google Scholar] [CrossRef]
- Hoshino, T.; Doi, H.; Uramoto, G.I.; Wörmer, L.; Adhikari, R.R.; Xiao, N.; Morono, Y.; D’Hondt, S.; Hinrichs, K.U.; Inagaki, F. Global diversity of microbial communities in marine sediment. Proc. Natl. Acad. Sci. USA 2020, 117, 27587–27597. [Google Scholar] [CrossRef] [PubMed]
- Polimene, L.; Sailley, S.; Clark, D.; Mitra, A.; Allen, J.I. Biological or microbial carbon pump? The role of phytoplankton stoichiometry in ocean carbon sequestration. J. Plankton Res. 2017, 39, 180–186. [Google Scholar] [CrossRef]
- Lesser, M.P.; Slattery, M.; Leichter, J.J. Ecology of mesophotic coral reefs. J. Exp. Mar. Biol. Ecol. 2009, 375, 1–8. [Google Scholar] [CrossRef]
- Aylesworth, L.; Phoonsawat, R.; Suvanachai, P.; Vincent, A.C.J. Generating spatial data for marine conservation and management. Biodivers. Conserv. 2017, 26, 383–399. [Google Scholar] [CrossRef]
- Manea, E.; Bianchelli, S.; Fanelli, E.; Danovaro, R.; Gissi, E. Towards an ecosystem-based marine spatial planning in the deep Mediterranean Sea. Sci. Total Environ. 2020, 715, 136884. [Google Scholar] [CrossRef] [PubMed]
- Oppel, S.; Bolton, M.; Carneiro, A.P.B.; Dias, M.P.; Green, J.A.; Masello, J.F.; Phillips, R.A.; Owen, E.; Quillfeldt, P.; Beard, A.; et al. Spatial scales of marine conservation management for breeding seabirds. Mar. Policy 2018, 98, 37–46. [Google Scholar] [CrossRef]
- Curtin, T.B. Physical observations in the plume region of the Amazon River during peak discharge—I. Water masses. Cont. Shelf Res. 1986, 6, 73–86. [Google Scholar] [CrossRef]
- Cavan, E.L.; Laurenceau-Cornec, E.C.; Bressac, M.; Boyd, P.W. Exploring the ecology of the mesopelagic biological pump. Prog. Oceanogr. 2019, 176, 102125. [Google Scholar] [CrossRef]
- Francini-Filho, R.B.; Asp, N.E.; Siegle, E.; Hocevar, J.; Lowyck, K.; D’Avila, N.; Vasconcelos, A.A.; Baitelo, R.; Rezende, C.E.; Omachi, C.Y.; et al. Perspectives on the Great Amazon Reef: Extension, Biodiversity, and Threats. Front. Mar. Sci. 2018, 5, 142. [Google Scholar] [CrossRef]
- Cruz, A.M.; Reis, A.T.; Suc, J.P.; Silva, C.G.; Praeg, D.; Granjeon, D.; Rabineau, M.; Popescu, S.M.; Gorini, C. Neogene evolution and demise of the Amapá carbonate platform, Amazon continental margin, Brazil. Mar. Pet. Geol. 2019, 105, 185–203. [Google Scholar] [CrossRef]
- Milliman, J.D.; Summerhayes, C.P.; Barreto, H.T. Quaternary sedimentation on the Amazon continental margin: A model. Geol. Soc. Am. Bull. 1975, 86, 610–614. [Google Scholar] [CrossRef]
- Figueiredo, J.; van der Ven, P.; Soares, E. Late Miocene onset of the Amazon River and the Amazon deep-sea fan: Evidence from the Foz do Amazonas Basin. Geology 2009, 37, 619–622. [Google Scholar] [CrossRef]
- Gorini, C.; Haq, B.U.; Reis, A.T.dos; Silva, C.G.; Cruz, A.; Soares, E.; Grangeon, D. Late Neogene sequence stratigraphic evolution of the Foz do Amazonas Basin, Brazil. Terra Nova 2014, 26, 179–185. [Google Scholar] [CrossRef]
- Maslin, M.A.; Durham, E.; Burns, S.J.; Platzman, E.; Grootes, P.; Greig, S.E.J.; Nadeau, M.-J.; Schleicher, M.; Pflaumann, U.; Lomax, B.; et al. Paleoreconstruction of the Amazon River freshwater and sediment discharge using sediments recovered at site 942 on the Amazon Fan. J. Quat. Sci. 2000, 15, 419–434. [Google Scholar] [CrossRef]
- Barreto, L.A.; Milliman, J.D.; Amaral, C.A.B.; Francisconi, O. Upper continental margin sedimentation off Brazil, northern Brazil. Contr. Sedimentol. 1975, 4, 11–43. [Google Scholar]
- Giresse, P.; Loncke, L.; Heuret, A.; Longueville, F.; Casanova, A.; Sadaoui, M. Beachrocks of the last low sea level, substrate of the Great Amazon Reef system along the outer Guiana shelf. Geo-Mar. Lett. 2023, 43, 10. [Google Scholar] [CrossRef]
- Nittrouer, C.A.; DeMaster, D.J. The Amazon shelf setting: Tropical, energetic, and influenced by a large river. Cont. Shelf Res. 1996, 16, 553–573. [Google Scholar] [CrossRef]
- Aller, J.Y.; Stupakoff, I. The distribution and seasonal characteristics of benthic communities on the Amazon shelf as indicators of physical processes. Cont. Shelf Res. 1996, 16, 717–751. [Google Scholar] [CrossRef]
- Santos Filho, J.R.D.; Anjos, J.V.M.; Silva, C.G.; Filho, A.K.D.B.; Dias, G.T.M.; Figueiredo, A.G.; Cecílio, A.B. Resizing the extension of the mesophotic “reefs” in the Brazilian equatorial margin using bioclastic facies and seabed morphology. Res. Sq. 2022, preprint. [Google Scholar]
- Moura, R.L.; Amado-Filho, G.M.; Moraes, F.C.; Brasileiro, P.S.; Salomon, P.S.; Mahiques, M.M.; Bastos, A.C.; Almeida, M.G.; Silva, J.M., Jr.; Araujo, B.F.; et al. An extensive reef system at the Amazon River mouth. Sci. Adv. 2016, 2, e1501252. [Google Scholar] [CrossRef] [PubMed]
- Banha, T.N.S.; Luiz, O.J.; Asp, N.E.; Pinheiro, H.T.; Magris, R.A.; Cordeiro, R.T.S.; Mahiques, M.M.; Mies, M.; Giglio, V.J.; Omachi, C.Y.; et al. The Great Amazon Reef System: A fact. Front. Mar. Sci. 2022, 9, 1088956. [Google Scholar] [CrossRef]
- Wiesebron, M.L. Blue Amazon: Thinking the defense of Brazilian maritime territory. Austral Braz. J. Strategy Int. Relat. 2013, 2, 101–124. [Google Scholar]
- Diesing, M.; Mitchell, P.J.; O’Keeffe, E.; Gavazzi, G.O.A.M.; Bas, T.L. Limitations of predicting substrate classes on a sedimentary complex but morphologically simple seabed. Remote Sens. 2020, 12, 3398. [Google Scholar] [CrossRef]
- Trzcinska, K.; Janowski, L.; Nowak, J.; Rucinska-Zjadacz, M.; Kruss, A.; von Deimling, J.S.; Pocwiardowski, P.; Tegowski, J. Spectral features of dual-frequency multibeam echosounder data for benthic habitat mapping. Mar. Geol. 2020, 427, 106239. [Google Scholar] [CrossRef]
- Kågesten, G. Geological Seafloor Mapping with Backscatter Data from a Multibeam Echo Sounder. Ph.D. Thesis, Gothenburg University, Göteborg, Sweden, 2008. [Google Scholar]
- Bakker, J.; Wangensteen, O.S.; Baillie, C.; Buddo, D.; Chapman, D.D.; Gallagher, A.J.; Guttridge, T.L.; Hertler, H.; Mariani, S. Biodiversity assessment of tropical shelf eukaryotic communities via pelagic eDNA metabarcoding. Ecol. Evol. 2019, 9, 14341–14355. [Google Scholar] [CrossRef] [PubMed]
- Valsecchi, E.; Bylemans, J.; Goodman, S.J.; Lombardi, R.; Carr, I.; Castellano, L.; Galimbert, A.; Galli, P. Novel universal primers for metabarcoding environmental DNA surveys of marine mammals and other marine vertebrates. Environ. DNA 2020, 2, 460–476. [Google Scholar] [CrossRef]
- Miya, M.; Sato, Y.; Fukunaga, T.; Sado, T.; Poulsen, J.Y.; Sato, K.; Minamoto, T.; Yamamoto, S.; Yamanaka, H.; Araki, H.; et al. MiFish, a set of universal PCR primers for metabarcoding environmental DNA from fishes: Detection of more than 230 subtropical marine species. R. Soc. Open Sci. 2015, 2, 150088. [Google Scholar] [CrossRef] [PubMed]
- Shinzato, C.; Narisoko, H.; Nishitsuji, K.; Nagata, T.; Satoh, N.; Inoue, J. Novel mitochondrial DNA markers for scleractinian corals and generic-level environmental DNA metabarcoding. Front. Mar. Sci. 2021, 8, 758207. [Google Scholar] [CrossRef]
- Seeck, O.H.; Murphy, B. X-Ray Diffraction: Modern Experimental Techniques, 1st ed.; Jenny Stanford Publishing: New York, NY, USA, 2015. [Google Scholar] [CrossRef]
- Melo Júnior, A.S. Análise Quantitativa Do Material Particulado na Região de Campinas Através das Técnicas de Microfluorescência de Raios-X e Reflexão Total Usando Radiação Síncrotron. Ph.D. Thesis, Unicamp, Campinas, SP, Brazil, 2007. [Google Scholar]
- Beckhoff, B.; Kanngießer, H.B.; Langhoff, N.; Wedell, R.; Wolff, H. Handbook of Practical X-Ray Fluorescence Analysis; Springer: Berlin/Heidelberg, Germany, 2006. [Google Scholar]
- Wentworth, C.K. A Scale of Grade and Class Terms for Clastic Sediments. J. Geol. 1922, 30, 377–392. [Google Scholar] [CrossRef]
- Camargo, M.G. Sysgran: Um Sistema de Código Aberto para Análises Granulométricas do Sedimento. Rev. Bras. Geociências 2006, 36, 371–378. [Google Scholar] [CrossRef]
- Sasaki, S. Hydrogen peroxide treatment on typical Hokkaido soils. Soil Sci. Plant Nutr. 1961, 6, 106–113. [Google Scholar] [CrossRef]
- Rau, G.H.; Mearns, A.J.; Young, D.R.; Olson, R.J.; Schafer, H.A.; Kaplan, I.R. Animal 13C/12C correlates with trophic level in pelagic food webs. Ecology 1983, 64, 1314–1318. [Google Scholar] [CrossRef]
- Jackson, D.; Harkness, D.D.; Mason, C.F.; Long, S.P. Spartina anglica as a carbon source for salt-marsh invertebrates: A study using δ13C values. Oikos 1986, 46, 163–170. [Google Scholar] [CrossRef]
- Clark, E.; Stoll, M.J.; Alburn, T.K.; Petzold, R. Mound-building and feeding behavior of the two stripe goby, Valenciennea helsdingenii, in the south Red Sea. Environ. Biol. Fishes 2000, 5, 131–141. [Google Scholar] [CrossRef]
- Scott, W.B.; Scott, M.G. Atlantic fishes of Canada. Can. Bull. Fish. Aquat. Sci. 1988, 219, 731. [Google Scholar]
Disclaimer/Publisher’s Note: The statements, opinions and data contained in all publications are solely those of the individual author(s) and contributor(s) and not of MDPI and/or the editor(s). MDPI and/or the editor(s) disclaim responsibility for any injury to people or property resulting from any ideas, methods, instructions or products referred to in the content. |
© 2024 by the authors. Licensee MDPI, Basel, Switzerland. This article is an open access article distributed under the terms and conditions of the Creative Commons Attribution (CC BY) license (https://creativecommons.org/licenses/by/4.0/).