1. Introduction
In recent years, the proportion of open-pit mining in the world’s mining industry has been increasing, resulting in a large amount of waste and causing a series of environmental problems, such as the spontaneous combustion of coal gangue [
1], release of excessive soil heavy metals [
2], ecological damage [
3], acid mine drainage (AMD) [
4], collapse of mining areas [
5] and other issues. Over the past decades, many scientists from the United States, Canada, Australia and other countries have been working on coal waste management and environmental issues in depth [
6]. For example, the establishment of coal-based solid waste dams and coal slurry impoundments [
7], coal-based solid waste as construction materials (cement [
8], road base materials [
9], asphalt [
10], environmental brick [
11], coal waste-derived soil-like substrate [
12], microbiological liquefaction of lignite and mechanochemical oxidative modification for the treatment of solid waste resources [
13,
14], backfilled roadways [
15], AMD industrial extraction of metal elements [
16] and dewatering for landfill [
17], etc.
After high-intensity mining, open-pit coal mines leave a considerable amount of coal resources within the mining boundary. Due to the previous lack of coal mining theory and poor mining technologies, coal resources have been wasted [
18]. At this time, waste is backfilled to the stope and adit, which not only improves the recovery rate of coal resources but also realizes the comprehensive utilization of solid waste mine resources as CPB [
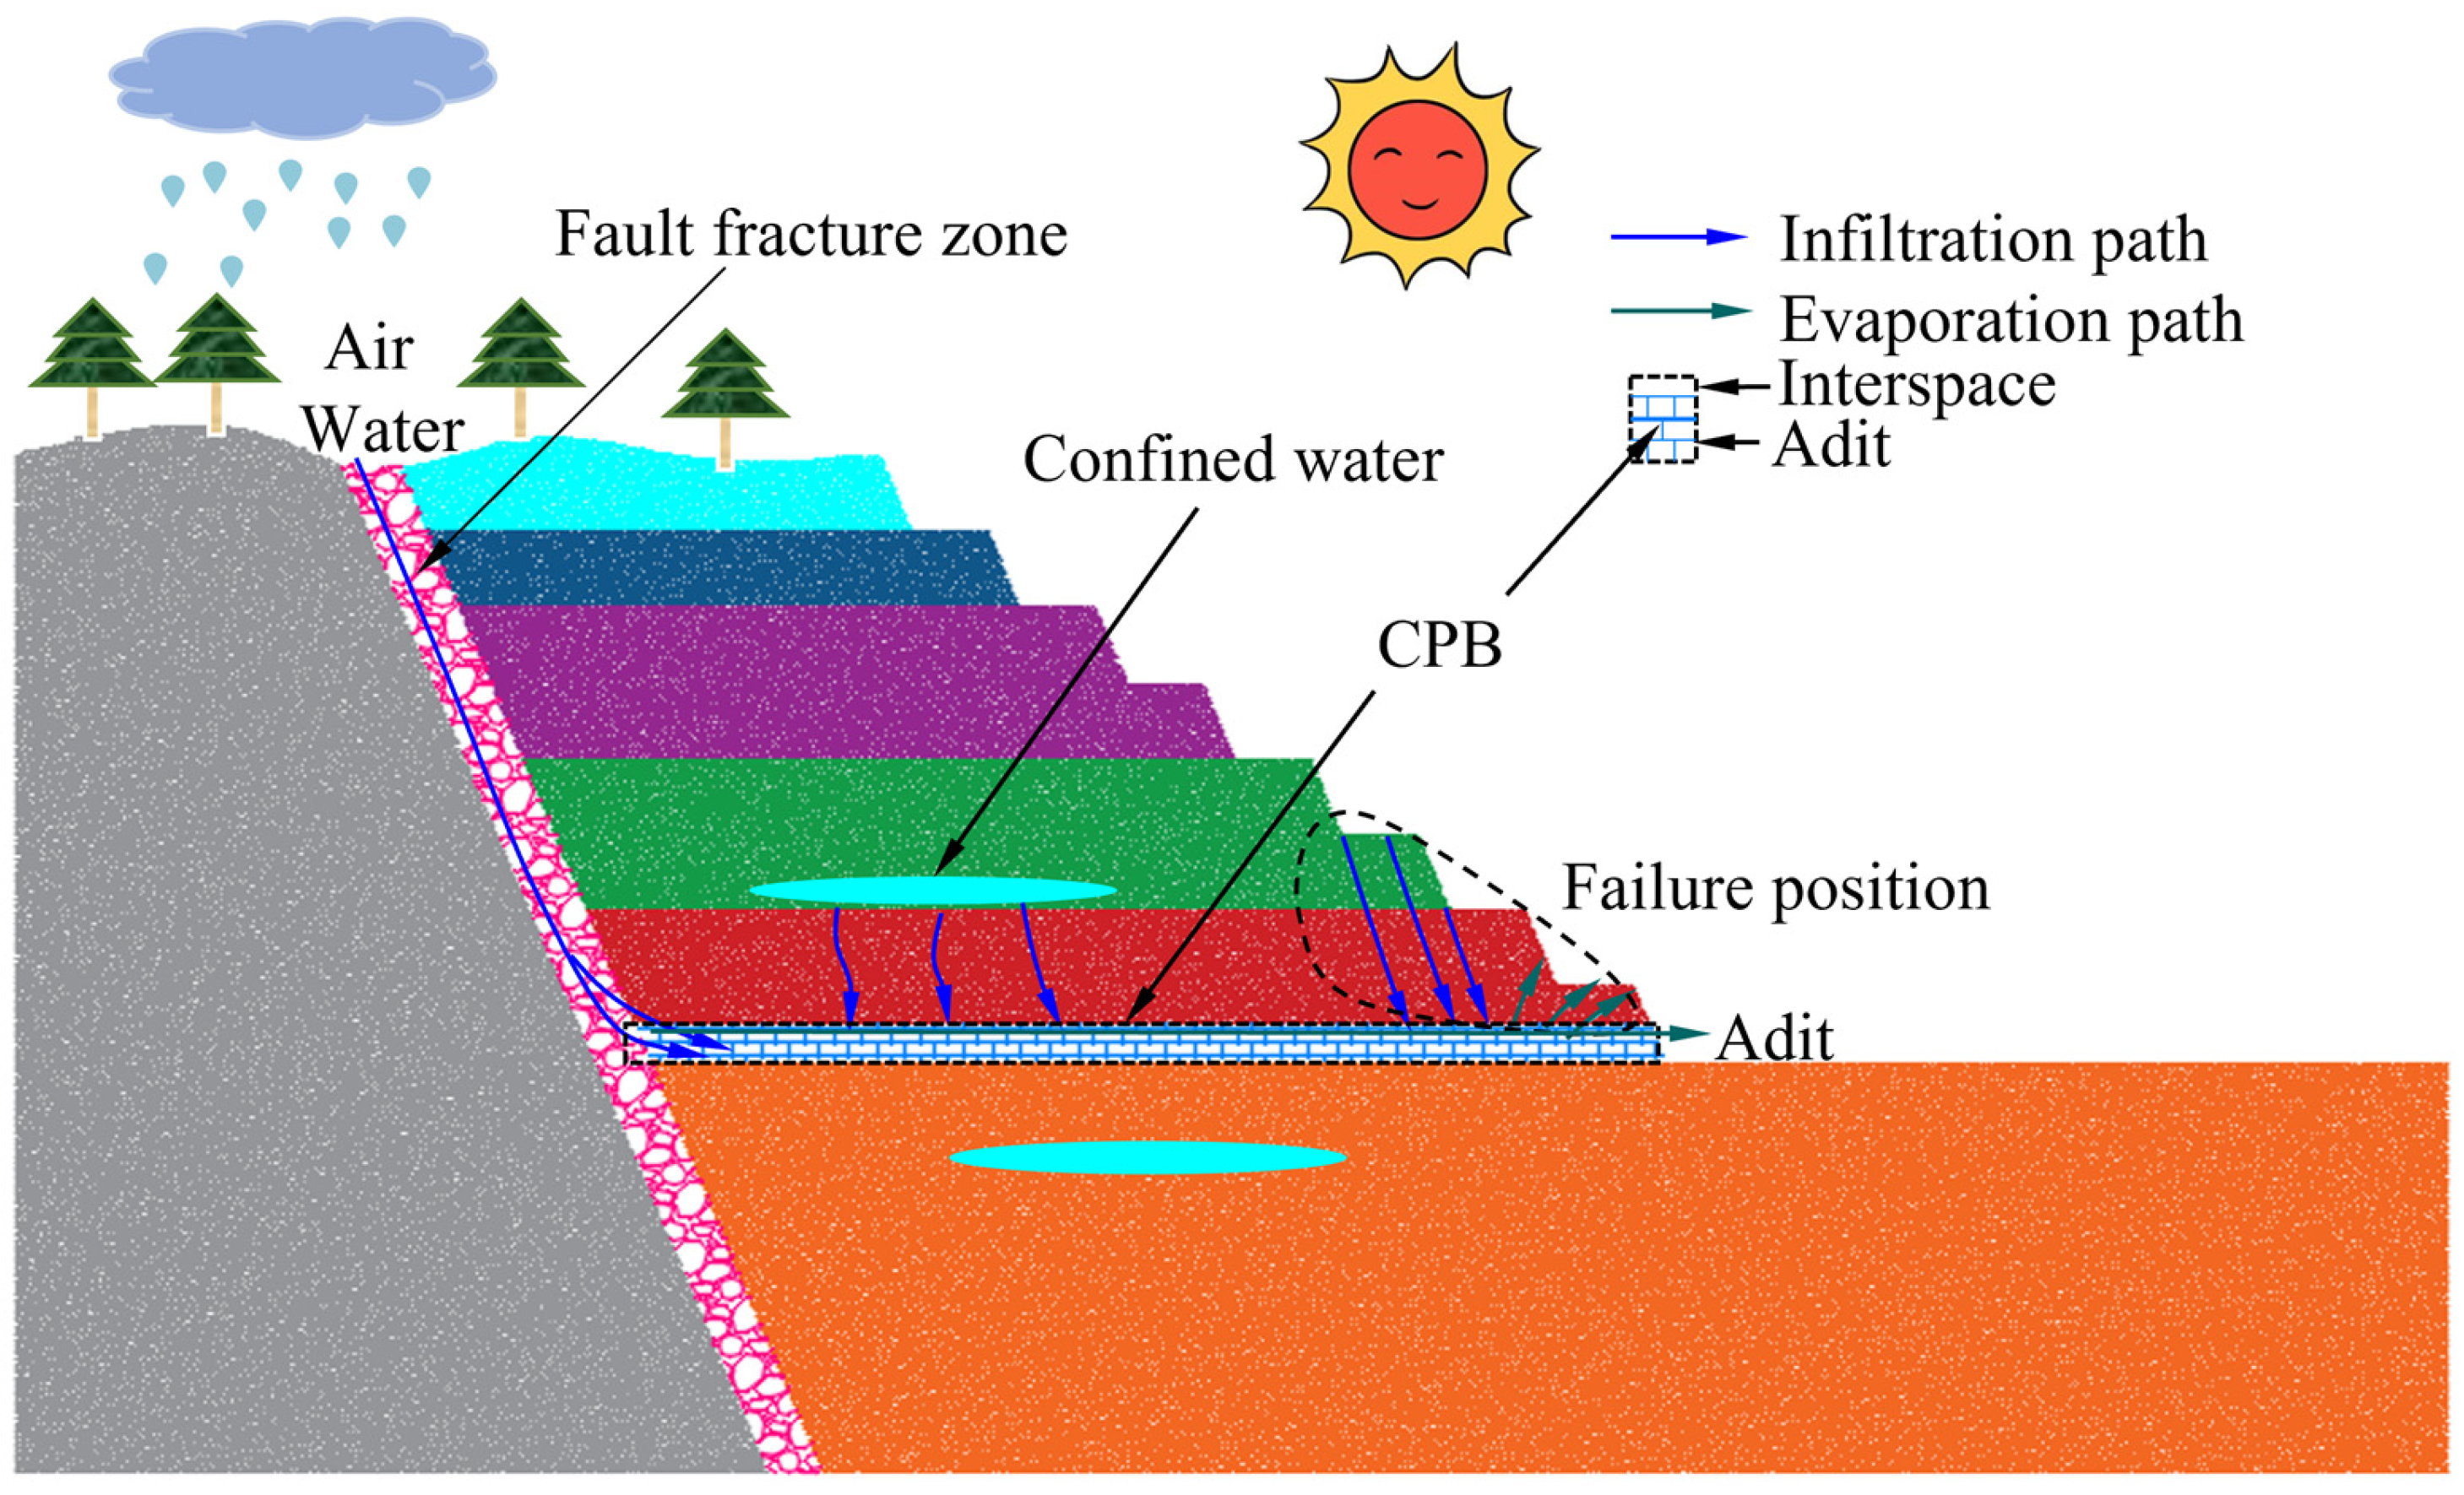
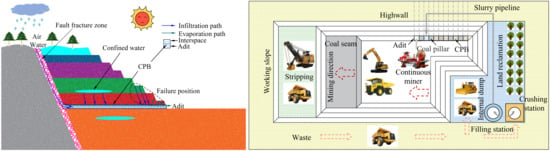
19]. However, in the process of coal mining, in the complex geological environment, rainfall easily infiltrates into the interior of the mining chamber along fault fracture zones and slope steps [
20]. At the same time, groundwater easily infiltrates the adit along fractures after coal mining [
21]. The exposure of CPB to air and water cause it to repeatedly undergo wetting–drying cycles [
22], so the CPB is degraded by the water–rock chemical reaction [
23], as shown in
Figure 1. Therefore, it is necessary to study the solid waste utilization method of open-pit coal mines and CPB performance under wetting–drying cycles.
Most of the striped rock layers in open-pit coal mines belong to geological soft rock, often containing a large amount of expansive clay minerals, which easily soften, expand and disintegrate in water [
24]. Currently, with CPB with waste as the aggregate, clay minerals and their influence on its performance need to be considered [
25]. Previous studies on backfill materials containing clay minerals under wetting–drying cycles mainly focused on the effect of gypsum on backfill. Aldaood et al. [
26] showed that, under wetting–drying cycles, the higher the gypsum content, the greater the crack propagation and the smaller the unconfined compressive strength (UCS) of the soil sample. Durgun [
27] found that polypropylene reduces the negative effects of wetting–drying cycles on gypsum-containing basalt pumice, reducing the loss of flexural strength to less than 7%. Li et al. [
28] believed that extending the curing period of gypsum-treated soil samples from 7 days to 21 days could reduce the formation of vertical cracks during soaking. Ying et al. [
29] indicated that wetting–drying cycles softened gypsum-treated soil and that seawater was more likely to cause macropore development than deionized distilled water. Although these studies have increased the understanding of the effect of wetting–drying cycles on gypsum-treated soil, there has been no relevant experimental study on the effect of CPB containing clay minerals, and the degree and mechanism of deterioration need further study.
Studies have shown that wetting–drying cycles have a significant effect on the water physical and mechanical properties of rocks [
30]. With the increase in the number of wetting–drying cycles, the water absorption and porosity of rock [
31,
32], the crack propagation radius decreases [
33], and the mechanical properties, such as UCS, EM, cohesion and internal friction angle, gradually decrease [
34,
35]. The dissolution and loss of soluble minerals and increased permeability are the key factors for the deterioration effect of a wetting–drying cycle [
36]. However, for soft rock with a high clay mineral content, the expansion/contraction behavior of clay mineral particles is more serious [
37,
38]. Although CPB and rock have some similar characteristics, because CPB is a prefabricated material, its particle size composition and cementing material composition are very different from rock. Therefore, clay minerals and cementing materials are important to study to understand the effect of wetting–drying cycles on CPB with waste as an aggregate. At present, the mechanism of the physical and mechanical properties of CPB under this condition is not clear, and the test method can be further explored.
Many scholars have studied CPB damage evolution. Aldhafeeri and Fall [
39] examined the relationship between sulfide-containing CPB reactivity and mechanical damage. Fu et al. [
40] established a damage evolution model of CPB with a layered structure and introduced the concepts of initial damage, load damage and total damage. Wang et al. [
41] and Zhou et al. [
42] established a damage model based on the acoustic emission ringing count rate and studied the variation in damage variables and the fractal dimension during CPB damage. Yin et al. [
43] proposed a CPB segmented damage constitutive model considering fiber content. Zhang et al. [
44] established a CPB damage model considering initial pore damage. The above studies focused on only mechanical damage and did not involve wetting–drying cycle damage. Therefore, it is necessary to consider the establishment of a CPB damage model under wetting–drying cycles.
In view of the existing technical defects and knowledge shortcomings, we propose a method of solid waste utilization in open-pit coal mines. The water absorption crack development, dynamic evolution law of porosity, mechanical property and failure characteristics, damage evolution law and scanning electron microscopy (SEM) structure deterioration analysis of CPB with marl as aggregate under wetting–drying cycles are studied. The purpose of this work is to improve the recovery efficiency of coal resources, realize solid waste utilization, clarify the deterioration effect and damage degree of the wetting–drying cycle on CPB and promote the coordinated development of coal resource exploitation and environmental protection.
4. Discussion
The common methods for recovering coal resources in the highwall of open-pit coal mines include continuous miner highwall mining [
52], timeliness slope theory [
63], steep end-slope mining [
64] and filling roadway mining [
65]. Timeliness slope theory and steep end-slope mining technology further increase the mining angle of the slope and complete the coal mining of the limit mining angle of the highwall within a certain period but cannot solve the problem of coal mining under the highwall [
66]. The filling roadway mining technology of highwall roadways overcomes the limit of steep end-slope mining technology, but it is restricted according to the relevant national regulations and mining costs [
67]. At present, continuous miner highwall mining is used to mine near-horizontal and gently inclined coal seams in the highwall, and many coal pillars are retained, making the recovery rate of the coal resources less than 50% [
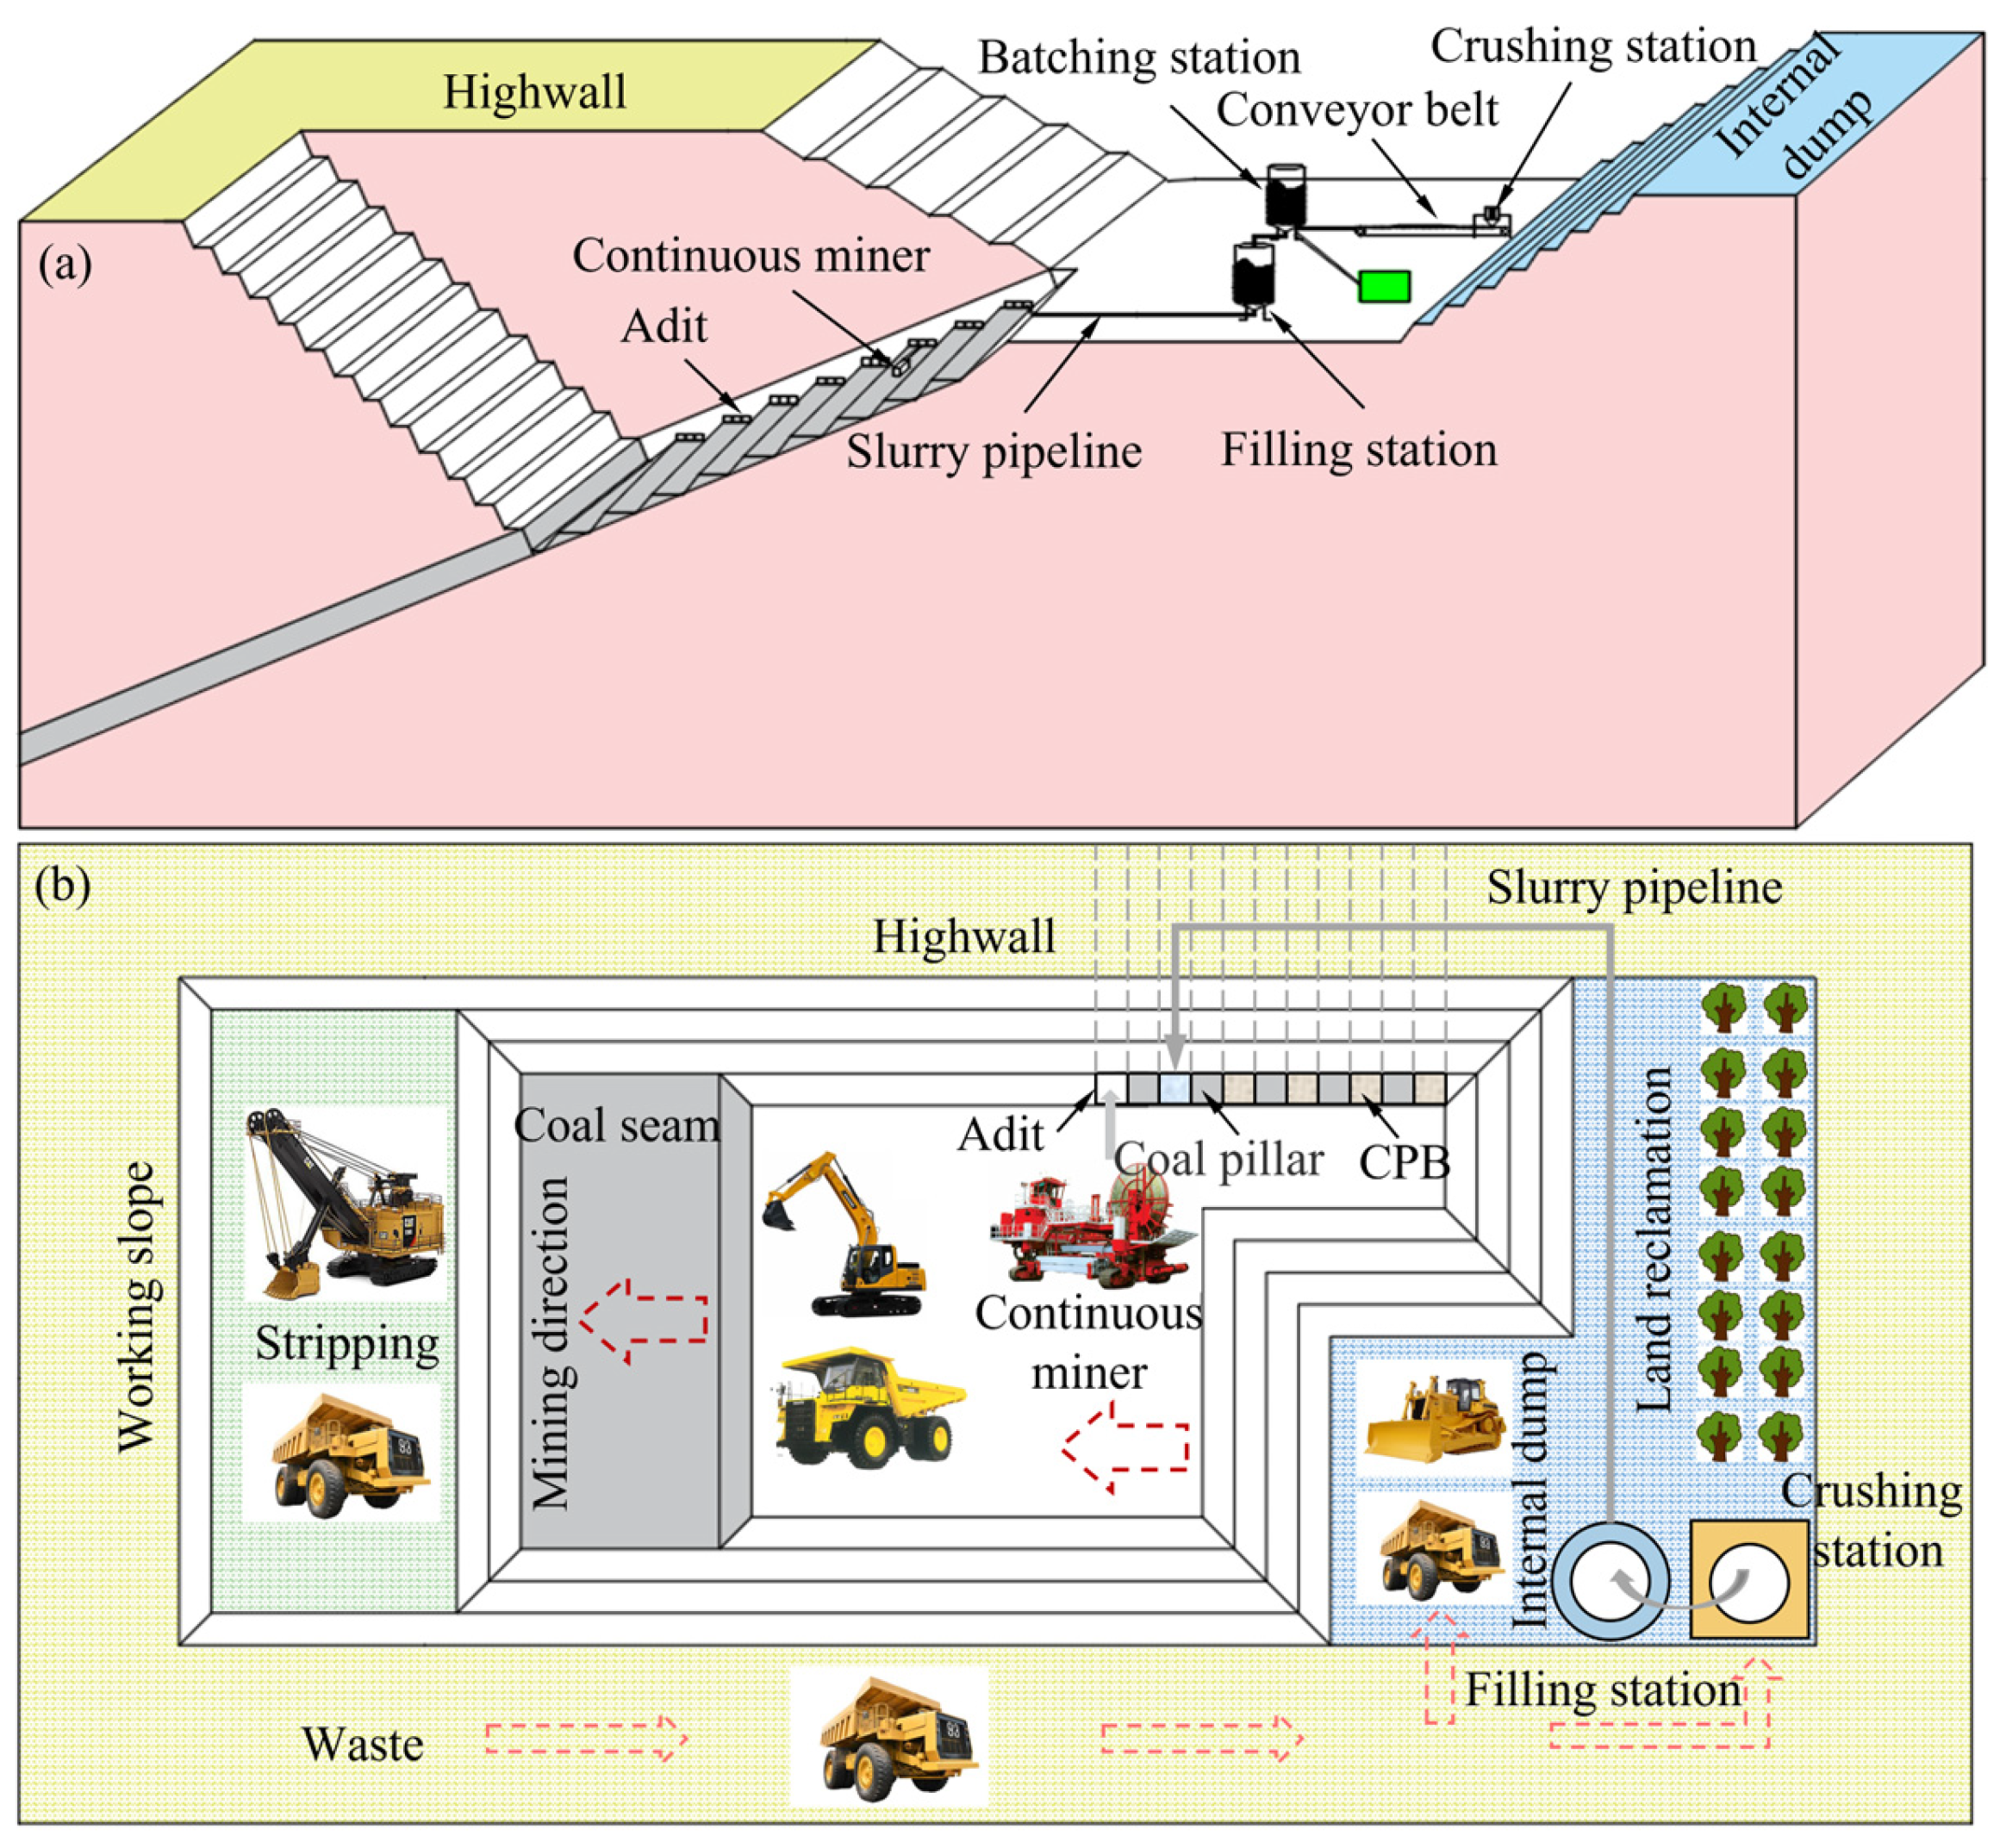
51]. Therefore, based on the technology of continuous highwall mining of the overlying coal seam under the highwall, the waste is used as CPB aggregate to backfill the adit (
Figure 4a) to realize the utilization of solid waste and the recovery of coal resources with maximum efficiency. To better realize the concept of ecological restoration during mining and reclamation [
68], in the integrated collaborative operation of stripping–mining–transportation–filling/dumping–reclamation in open-pit mines (
Figure 4b), it is necessary to emphasize the coordination, cooperation and synchronization among various mining processes and reclamation processes. The synergistic attributes and the synergistic effects generated reflect the spatiotemporal relationship among the stripping, mining, transportation, filling, dumping and reclamation projects in open-pit mines. An orderly design considering time, space and level is established, and unified planning and parallel operation are carried out to form a process system of collaborative mining of the same open-pit mine, the coordinated disposal of solid waste and common reclamation.
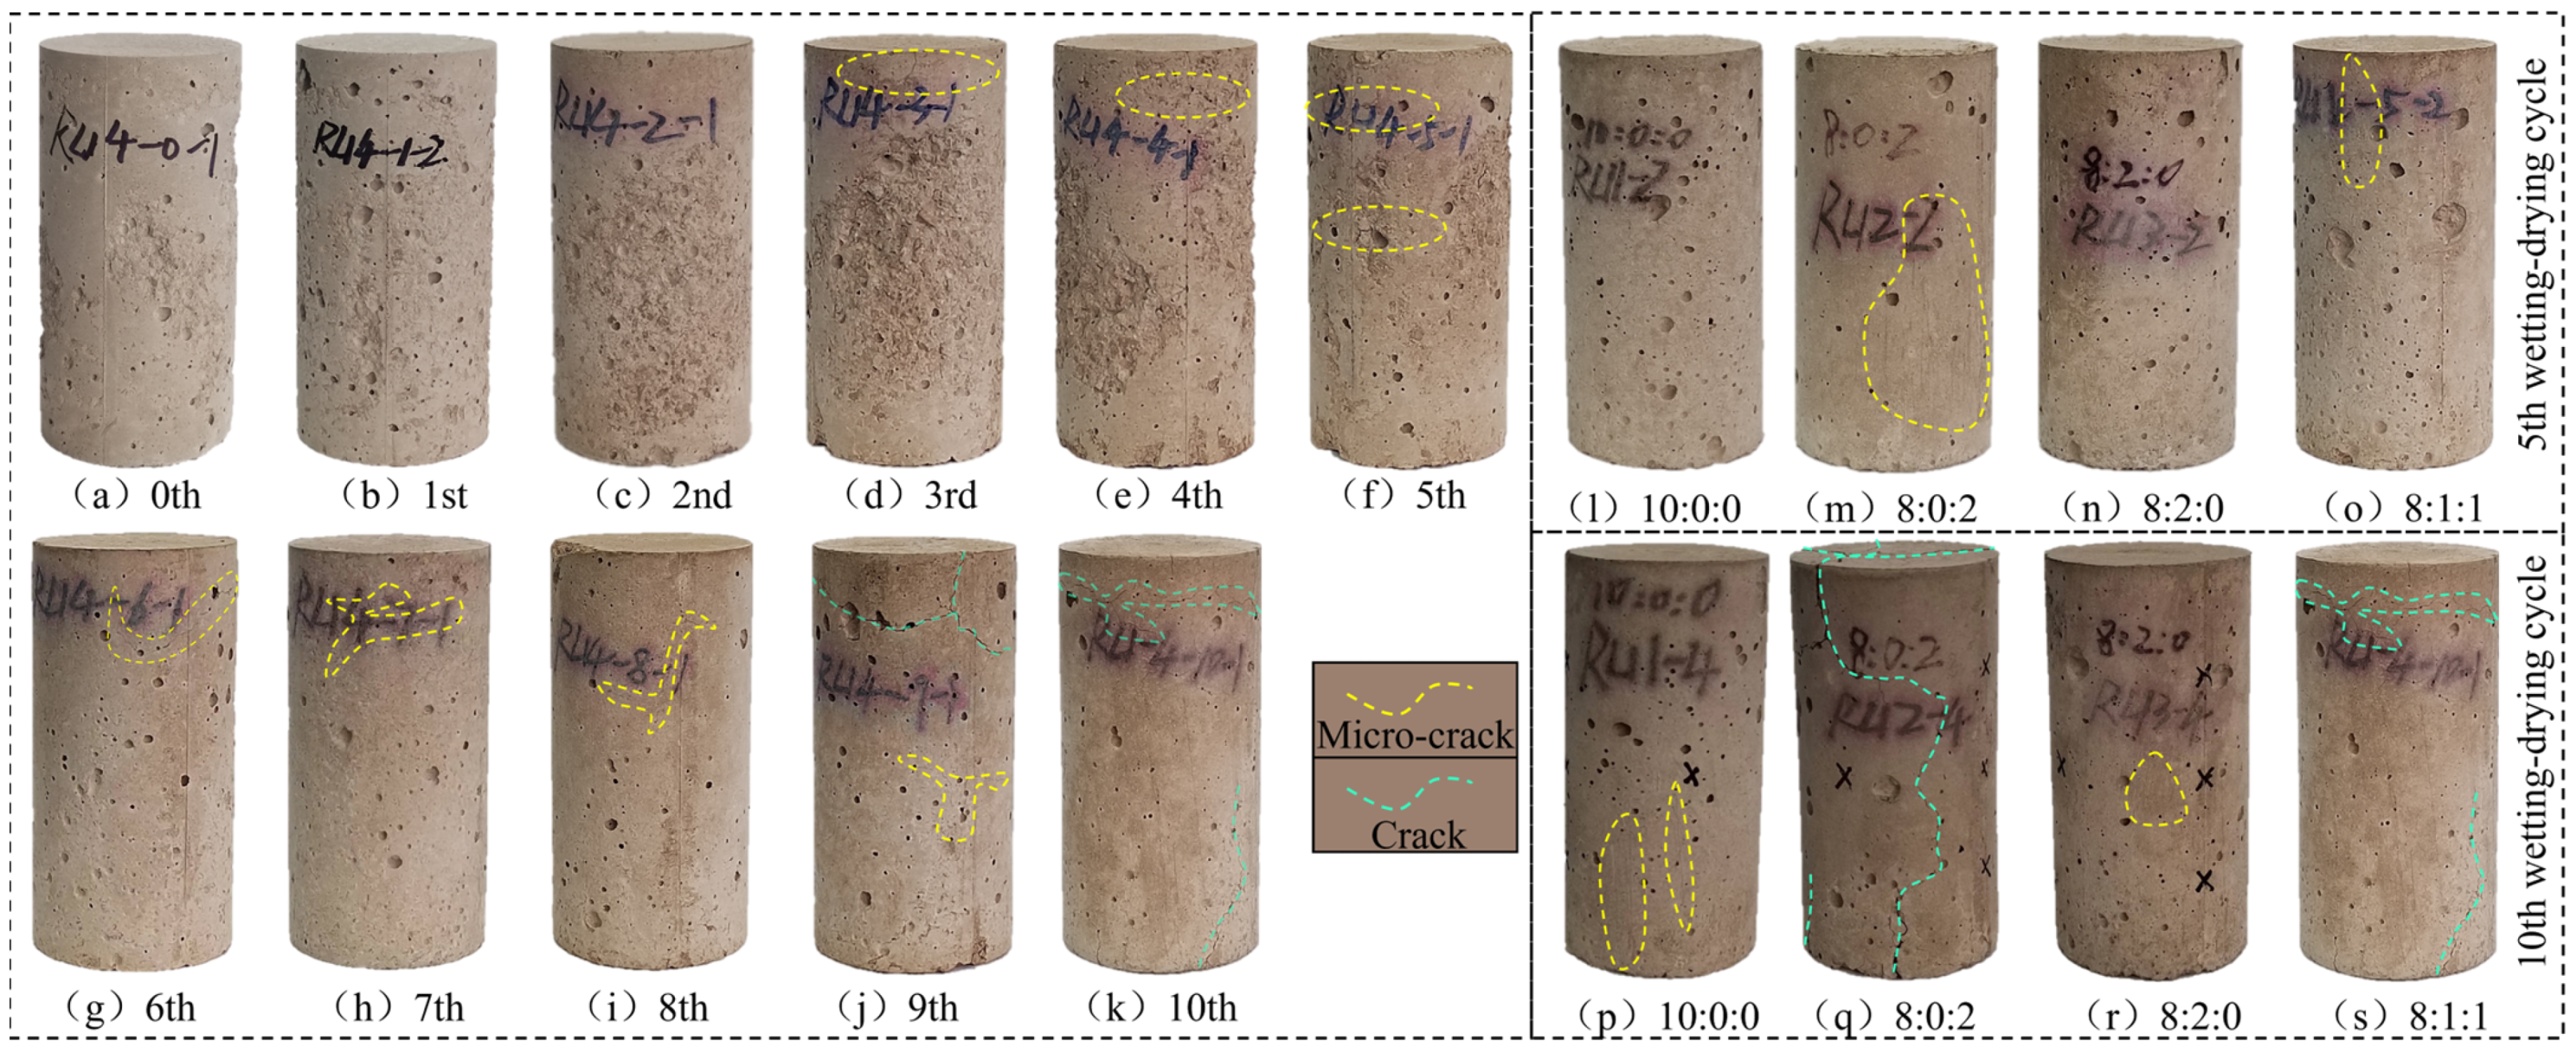
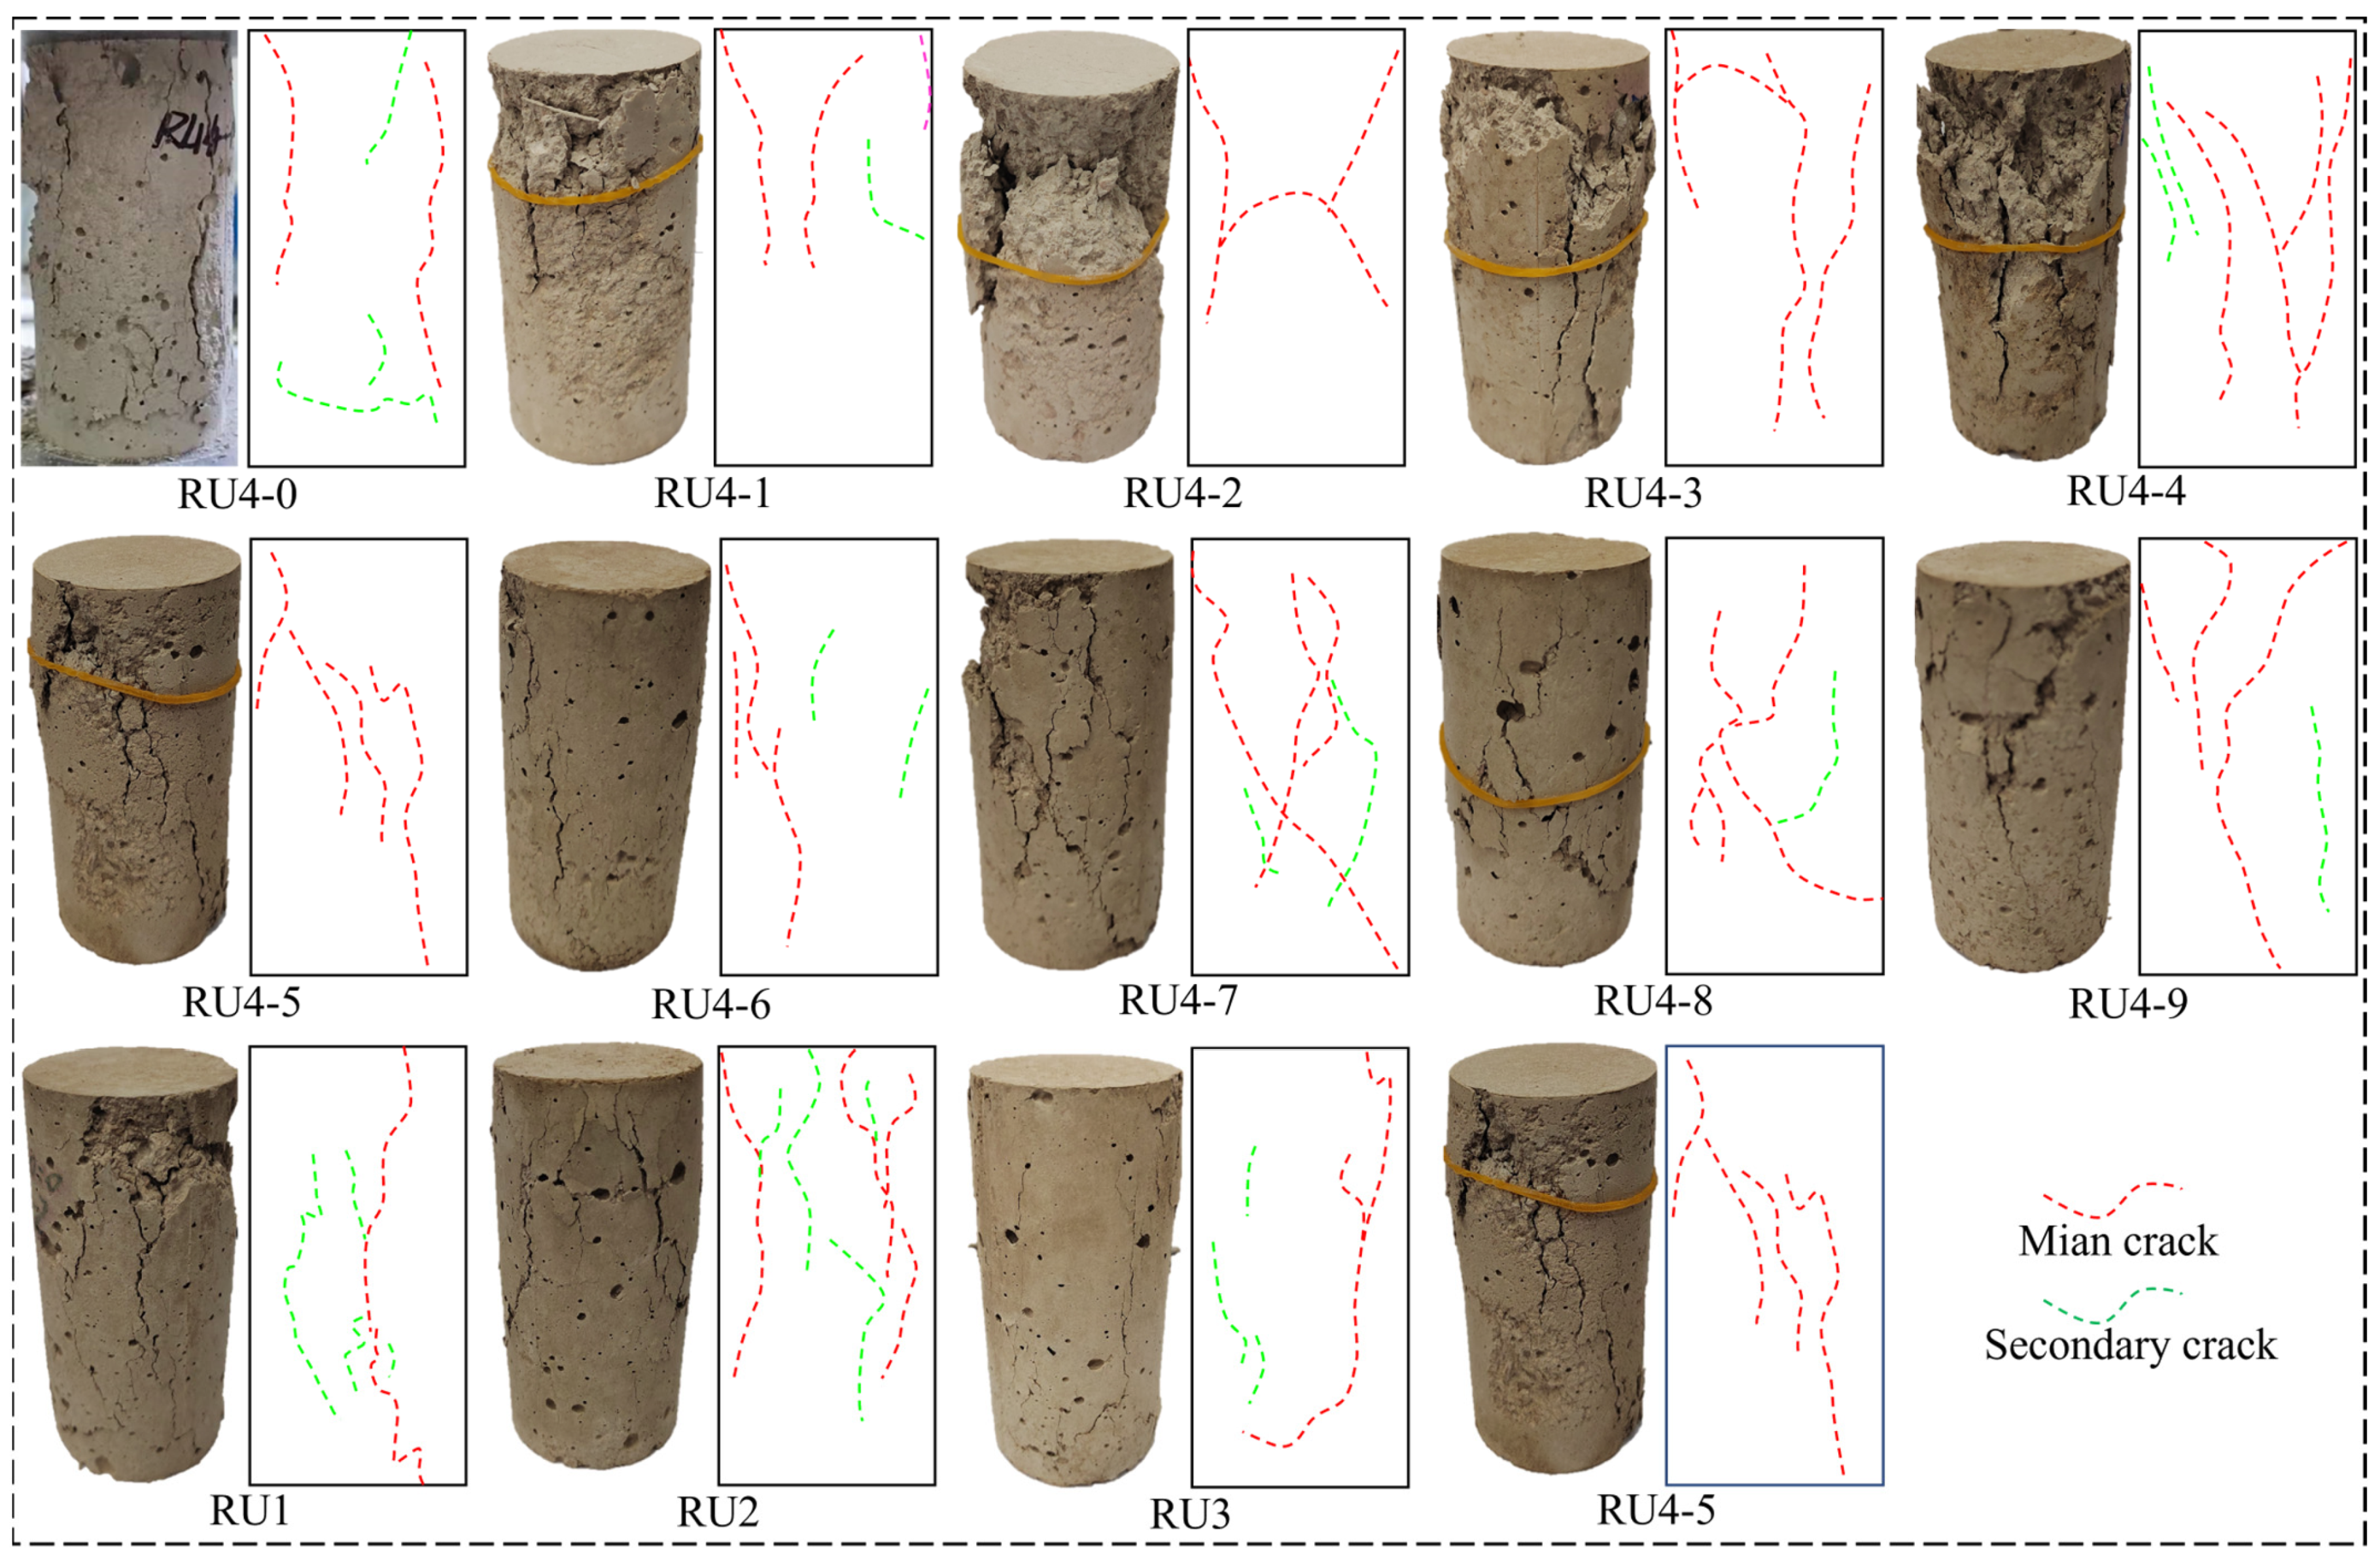
A wetting–drying cycle had a significant effect on the physical and macroscopic mechanical properties of CPB. In a wetting–drying cycle, CPB samples produced a certain number of microcracks and cracks, as shown in
Figure 5a–k. This was because there was no water bonding on the surface of a CPB sample, but there was a temperature difference between the inside and outside of the sample, resulting in thermal expansion and contraction. The surface of the sample lost water quickly, and the surface tension was less than the internal tension. Under the combined action of gravity and tension at the bottom of the sample, many microcracks were generated. With the increase in the number of wetting–drying cycles, the position of microcracks on the surface of CPB samples was continuously damaged by wetting–drying cycles, resulting in the water–rock chemical reaction of clay minerals and gypsum on the surface, so that microcracks gradually expanded into cracks [
26]. The main reason for the cracks in
Figure 5l–s was that the greater the proportion of gypsum in the CPB samples, the greater the promoting effect of temperature on the formation of ettringite [
69]. The greater the number of wetting–drying cycles, the higher the probability of expansion of the ettringite in the sample, which caused the internal stress in the CPB samples to expand and crack the original skeleton of the sample, resulting in expansion cracking [
70,
71]. With the development of microcracks and cracks on the surface of CPB samples, gypsum aggravates the propagation of cracks, which is extremely unfavorable to the integrity of the samples.
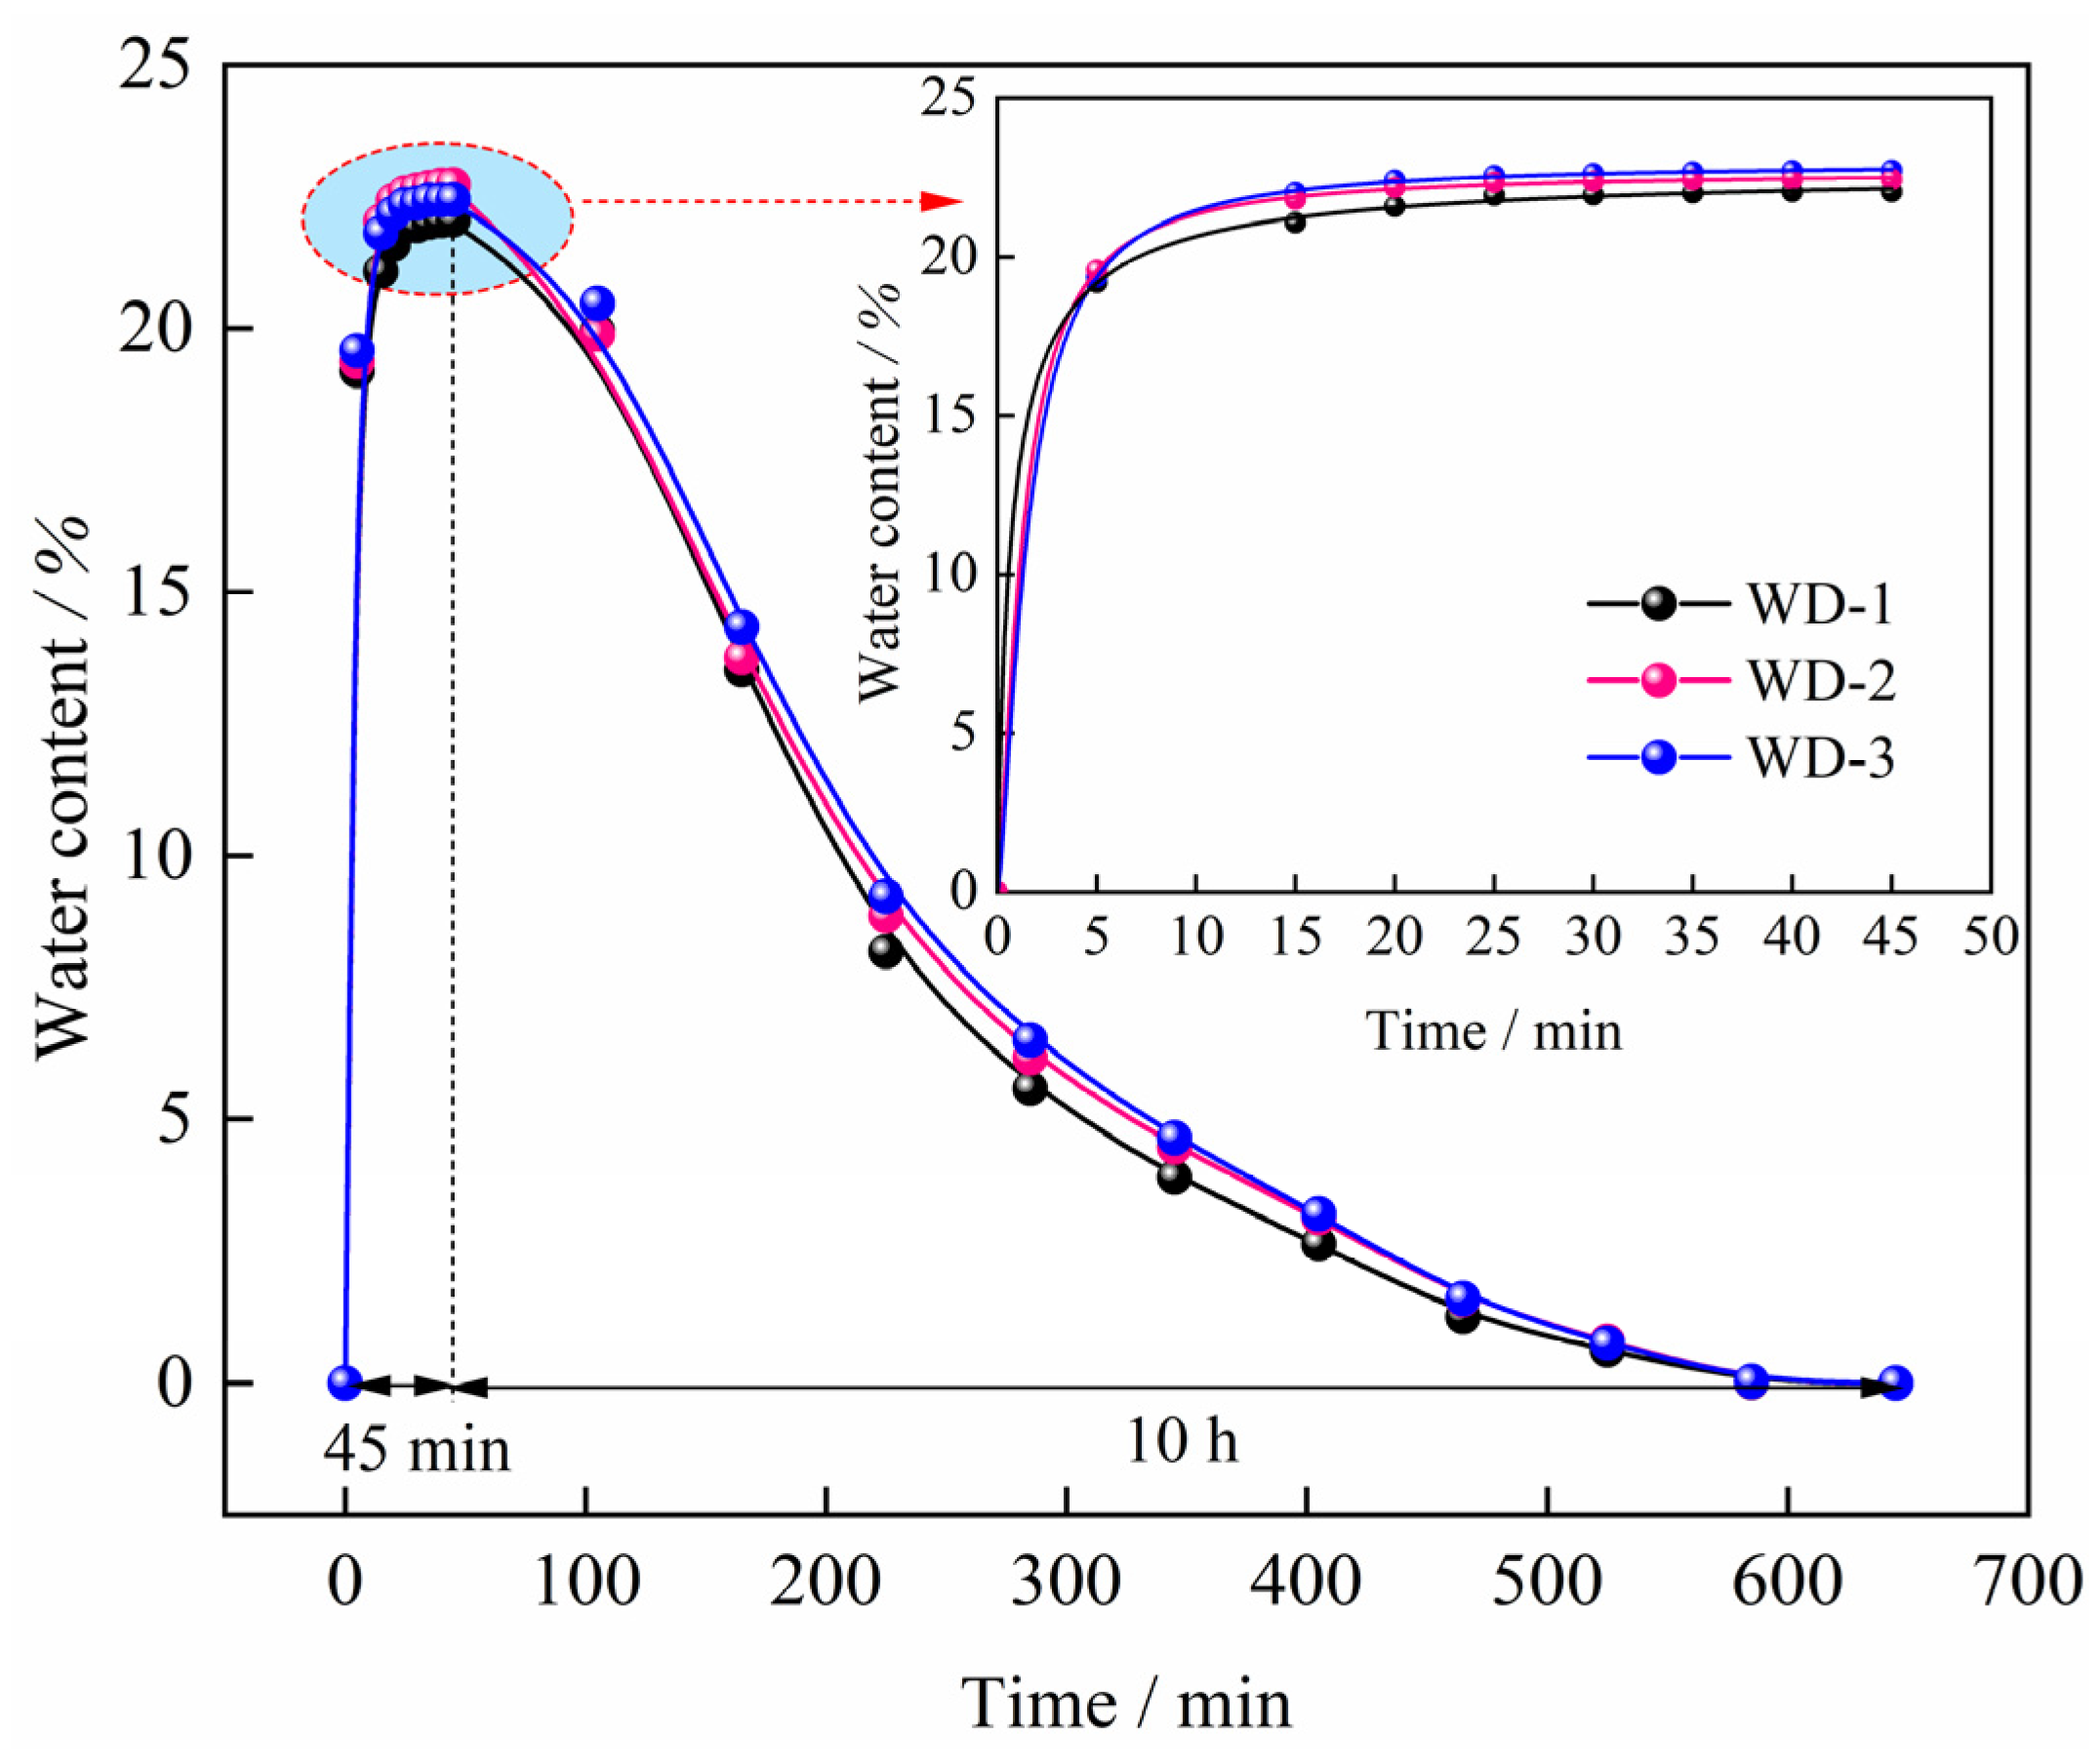
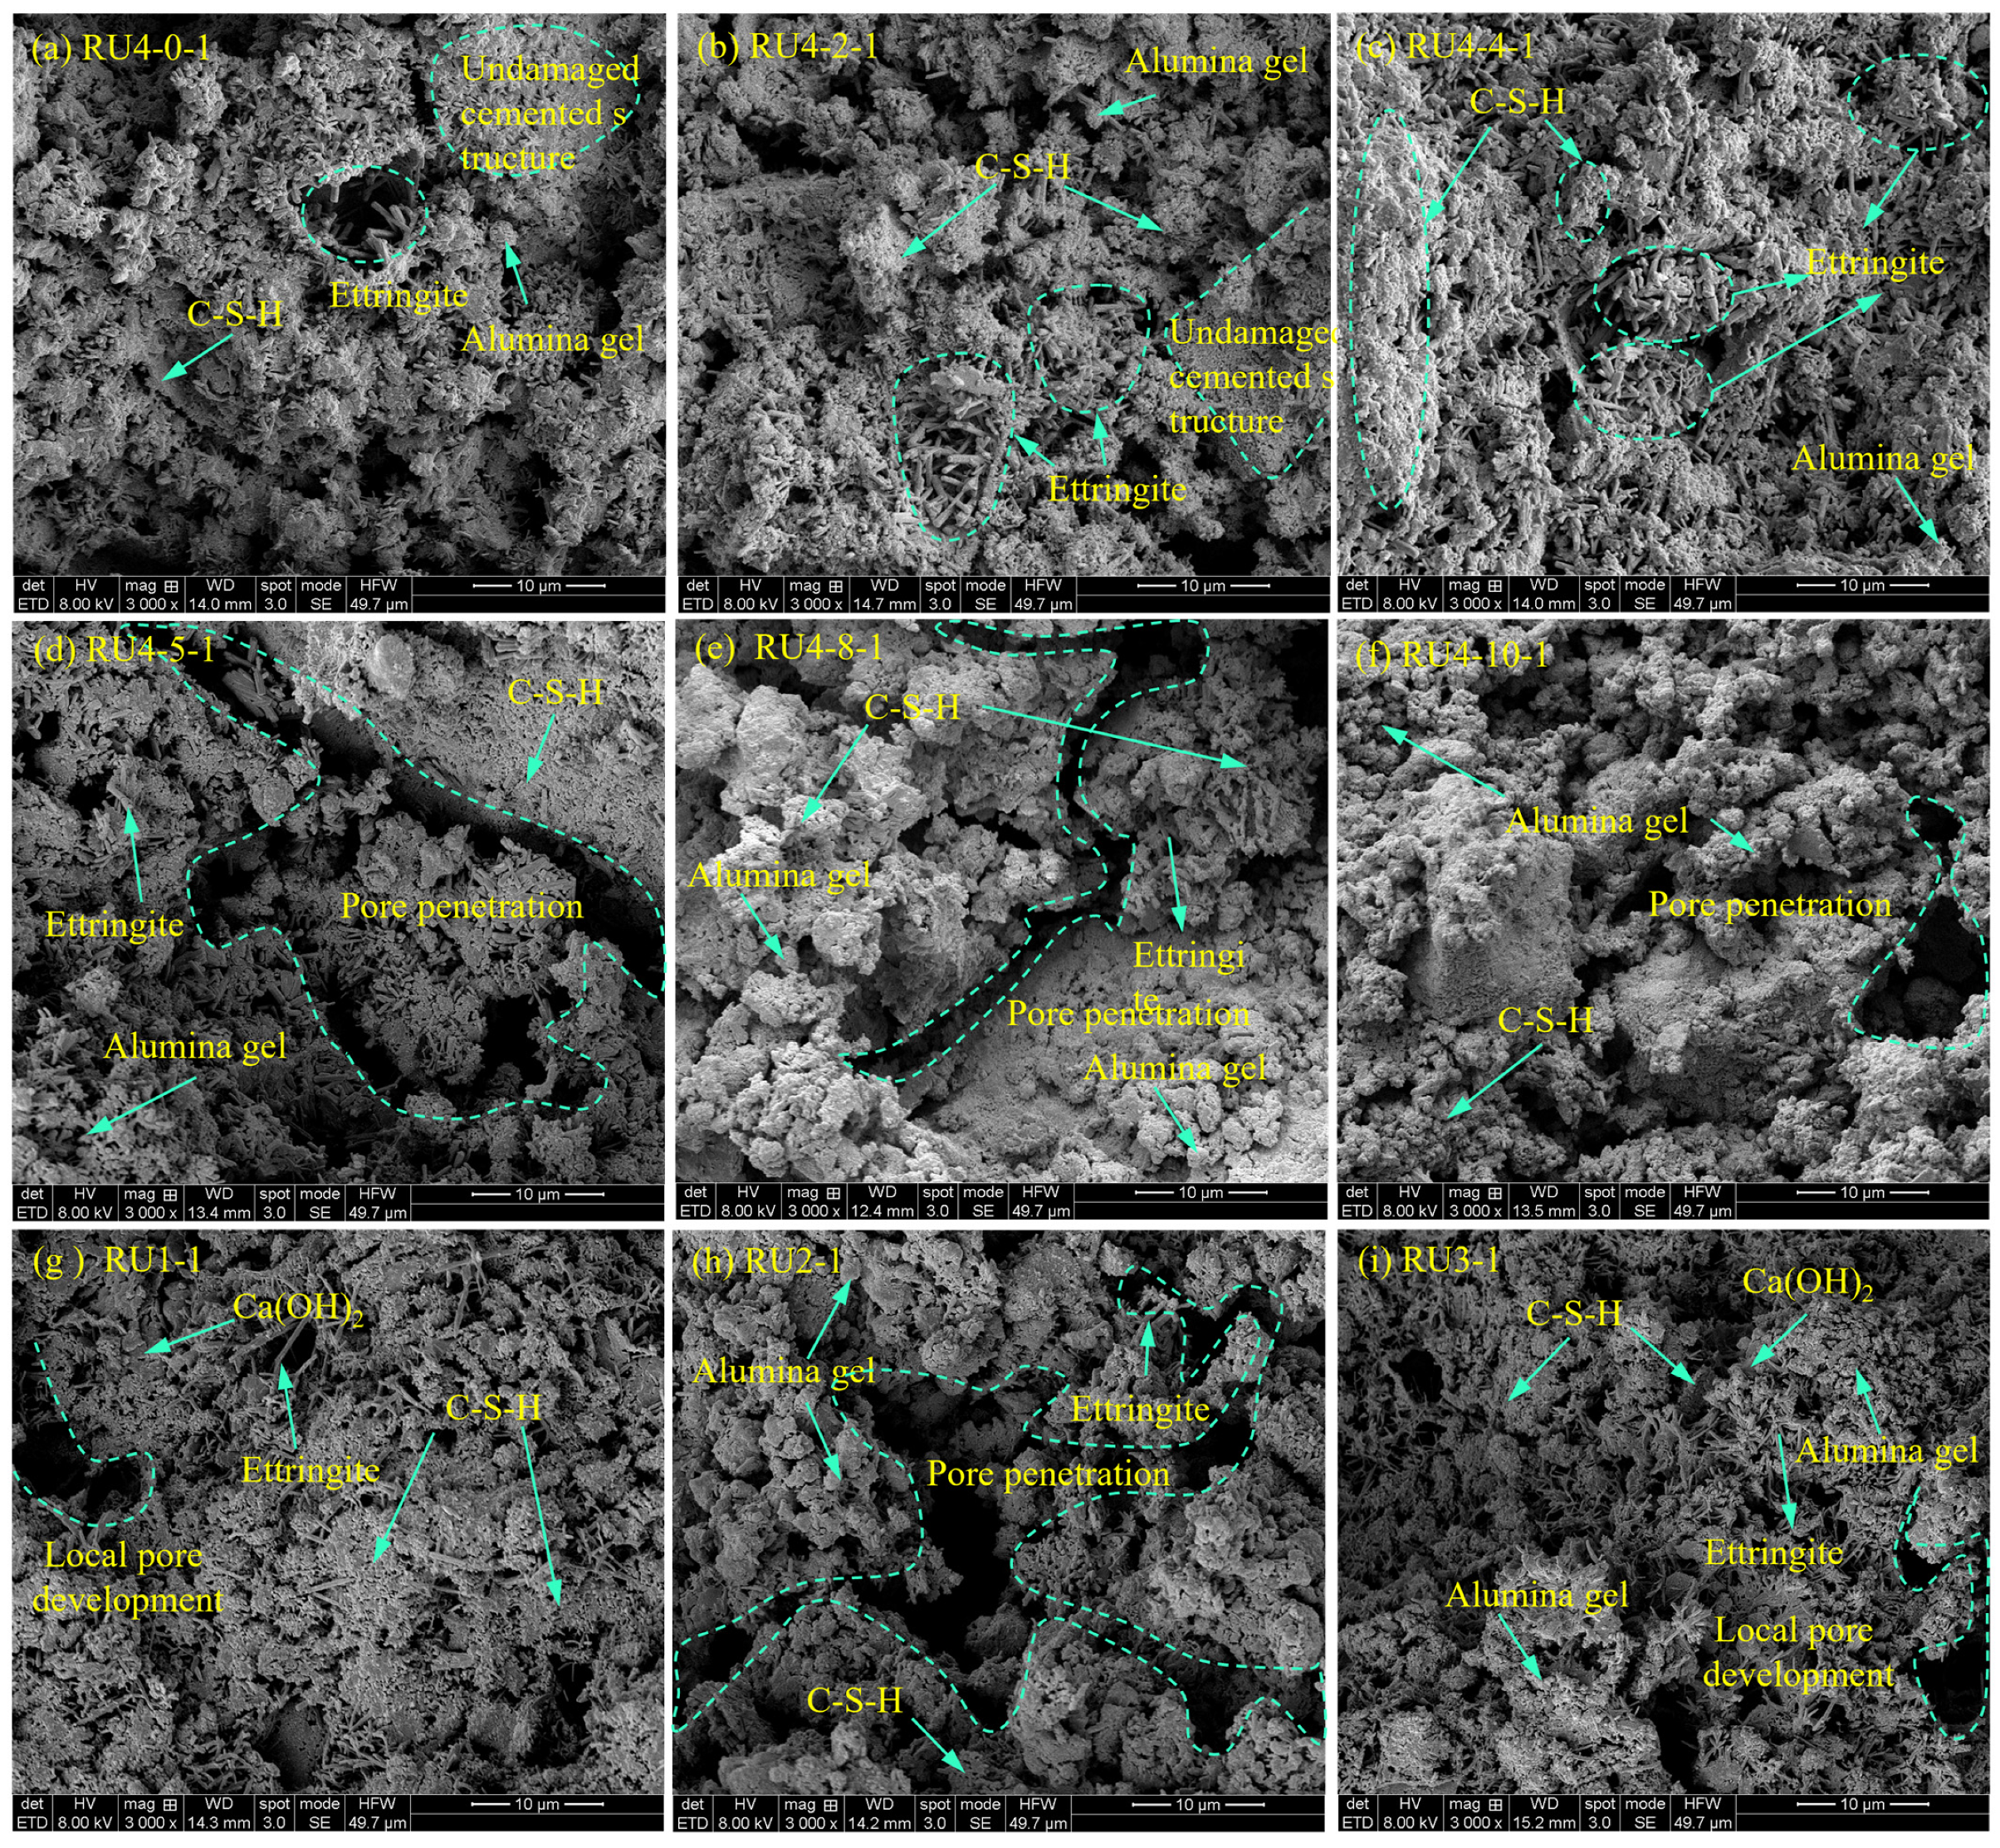
According to past research on cementing materials under wetting–drying cycles, the main reasons for the deterioration of CPB in stage i are the loss of small particles from the CPB skeleton, the water–rock chemical reactions of clay minerals and the development of microcracks and cavities. CPB is formed by the consolidation and demolding of particles with different sizes as aggregates under the hydration reaction of composite cementitious materials. Among them, particles with particle sizes less than 0.3 mm account for 13.93%, which form noncritical cements with composite cementing materials [
22] and fill the spaces between larger particles. During a drying–wetting cycle, these noncritical cements are destroyed, and small particles are detached from the cements [
72] and are transported to the distilled water through pores and microcrack channels, resulting in noncritical cements. A loose, weak cementation ability can also be observed in
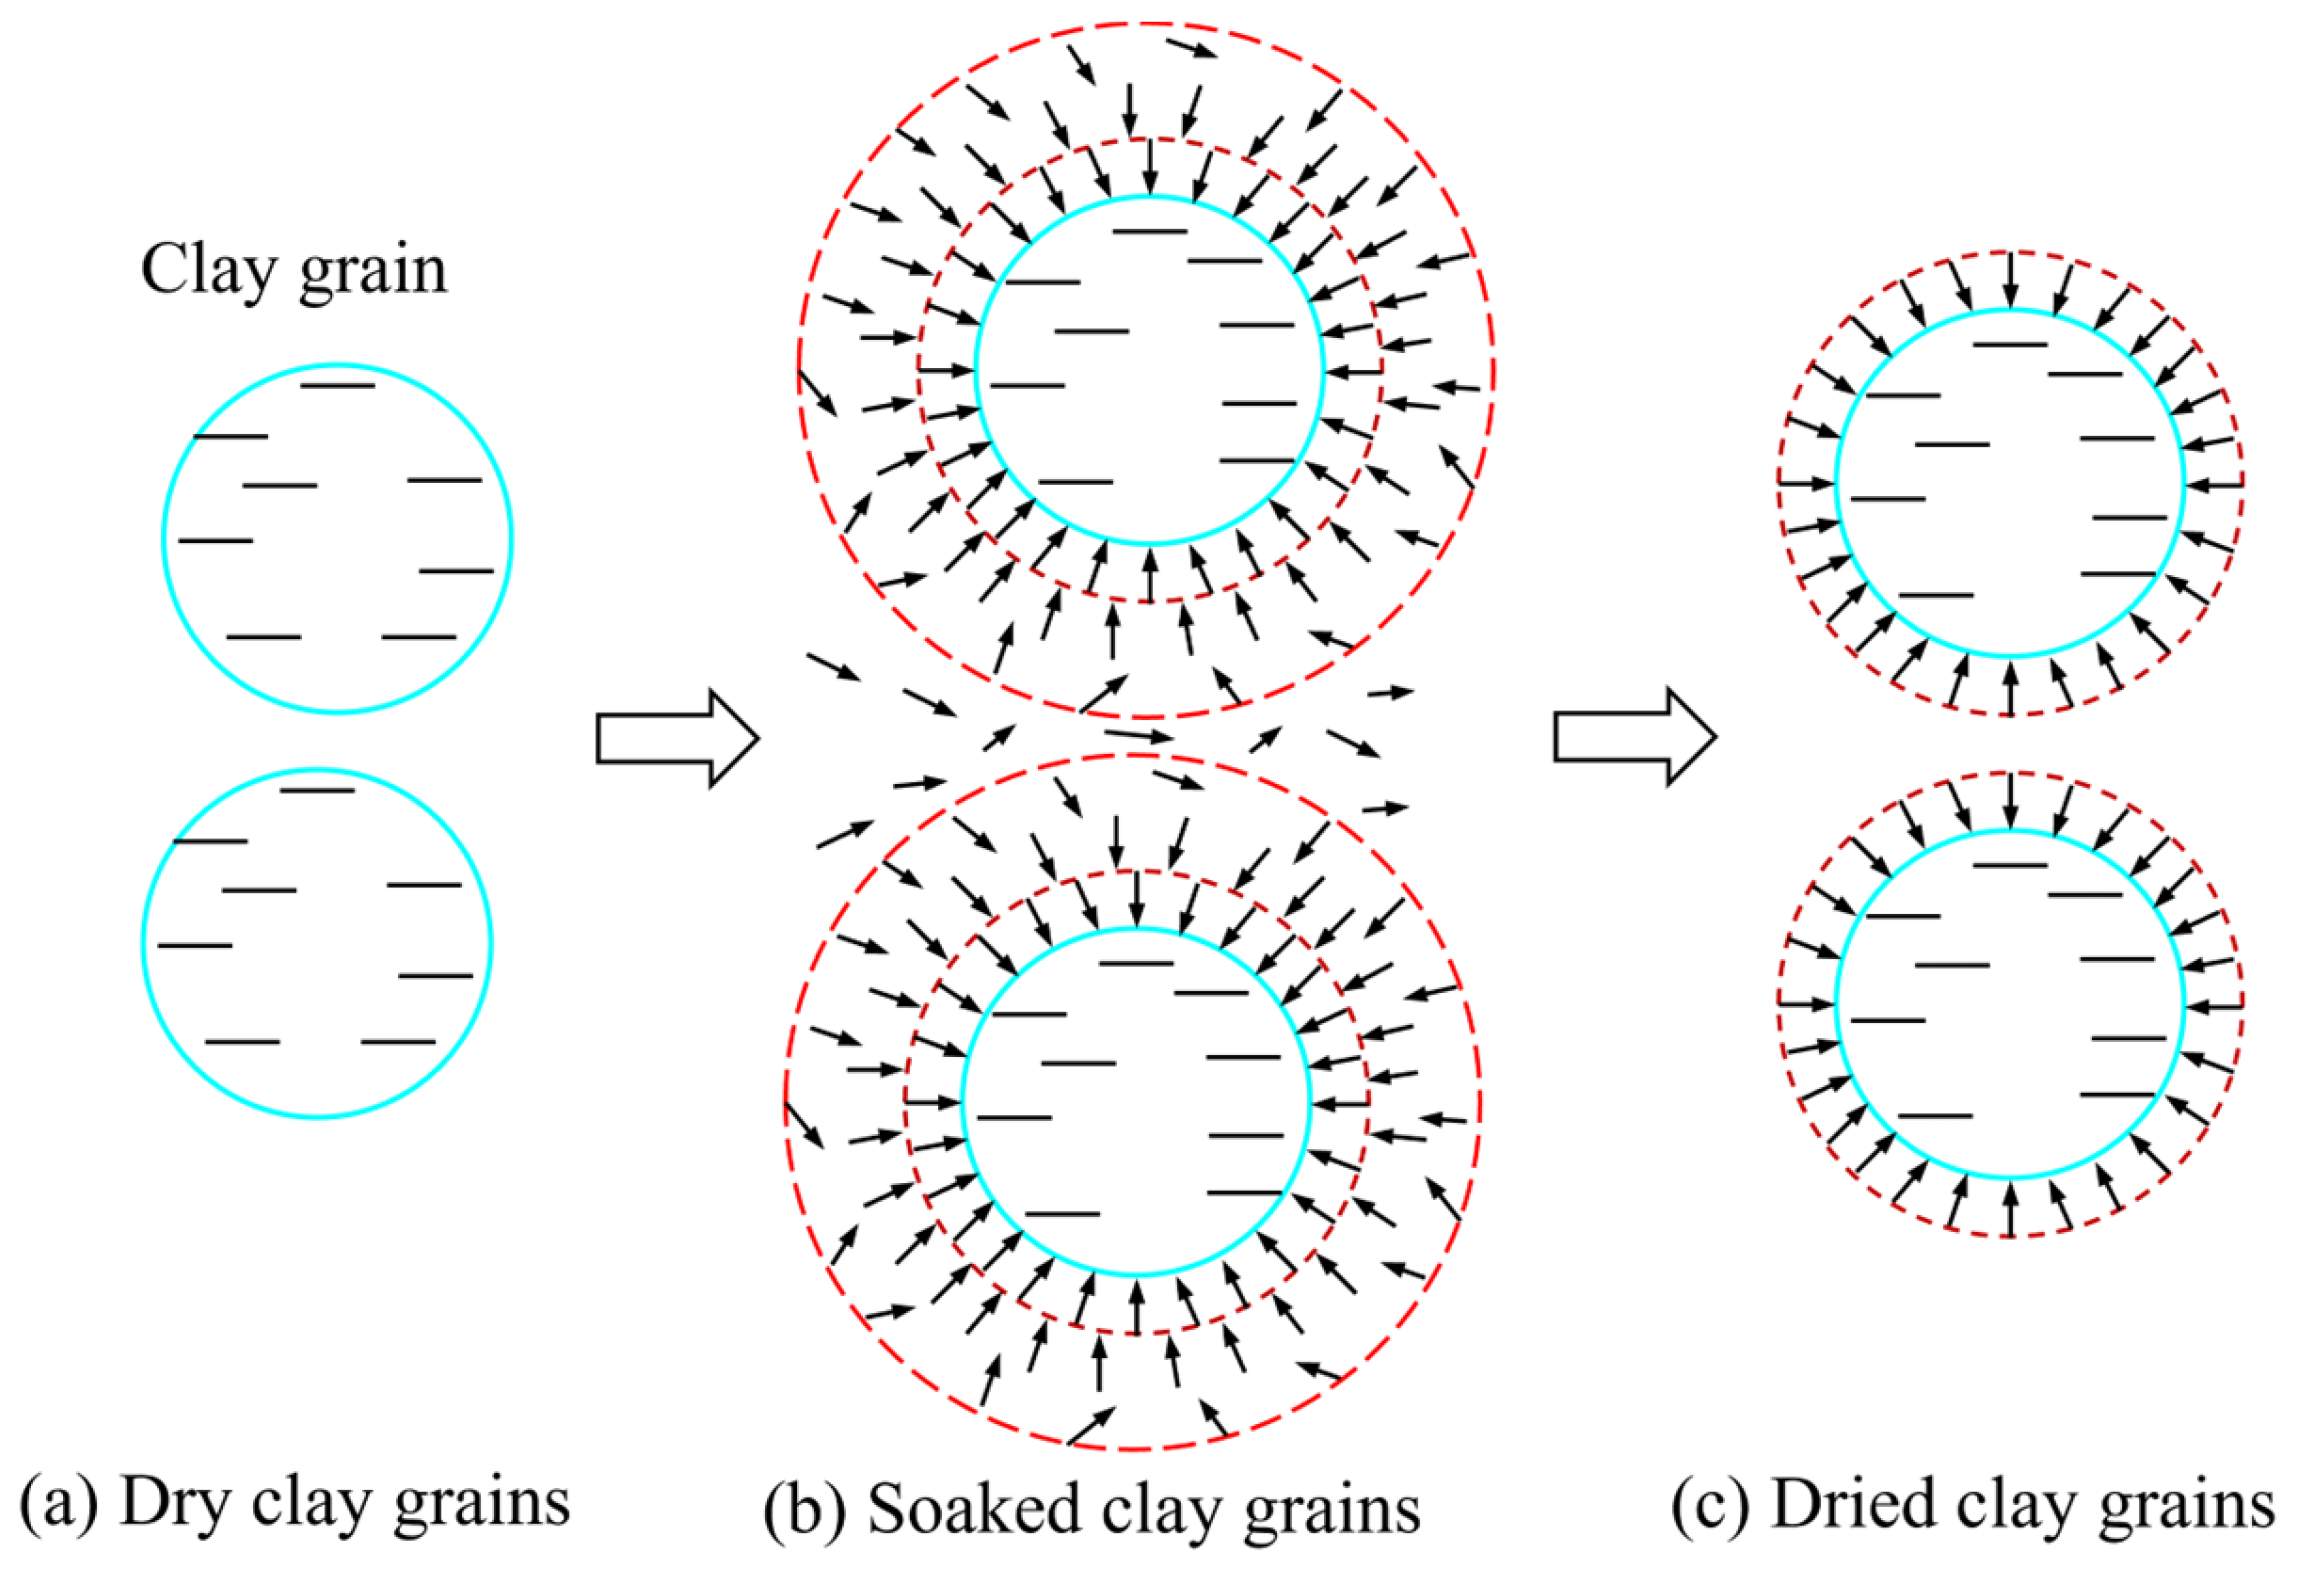
Figure 12a–c. According to the mineral composition analysis of marl, it contains 24.50% clay minerals, and these clay minerals include illite (44%), illite–smectite mixed-layer minerals (36%) and kaolinite (20%), as shown in
Figure 2. Illite and illite–smectite mixed-layer minerals are highly hydrophilic minerals [
24]. During the immersion process, it was found that the color of the distilled water mixture gradually turned pale yellow after immersion, which was speculated to be caused by the loss of the water–rock chemical reaction from illite and illite–smectite mixed-layer minerals to distilled water [
32]. This phenomenon caused the disintegration of illite and illite–smectite mixed-layer minerals, a loss of connection between clay particles or between clay particles and noncritical cements [
37], the expansion of noncritical cements and an increase in noncritical cement pores [
29]. Under the action of wetting–drying cycles, the clay particles repeatedly underwent expansion–contraction or even disintegration (the process mechanism is shown in
Figure 13), until they detached from the cement. Under the action of water gravity, the water carried small particles, such as detached clay particles, flowing from the pores and initial microcracks [
73], resulting in the loss of some fine aggregate particles inside the CPB before the four wetting–drying cycles. In addition to the weakening of the cementation ability of the noncritical cements, the microcracks and voids generated inside the CPB during the consolidation and demolding process still dominated the mechanical failure performance of the first three wetting–drying cycles [
31,
60].
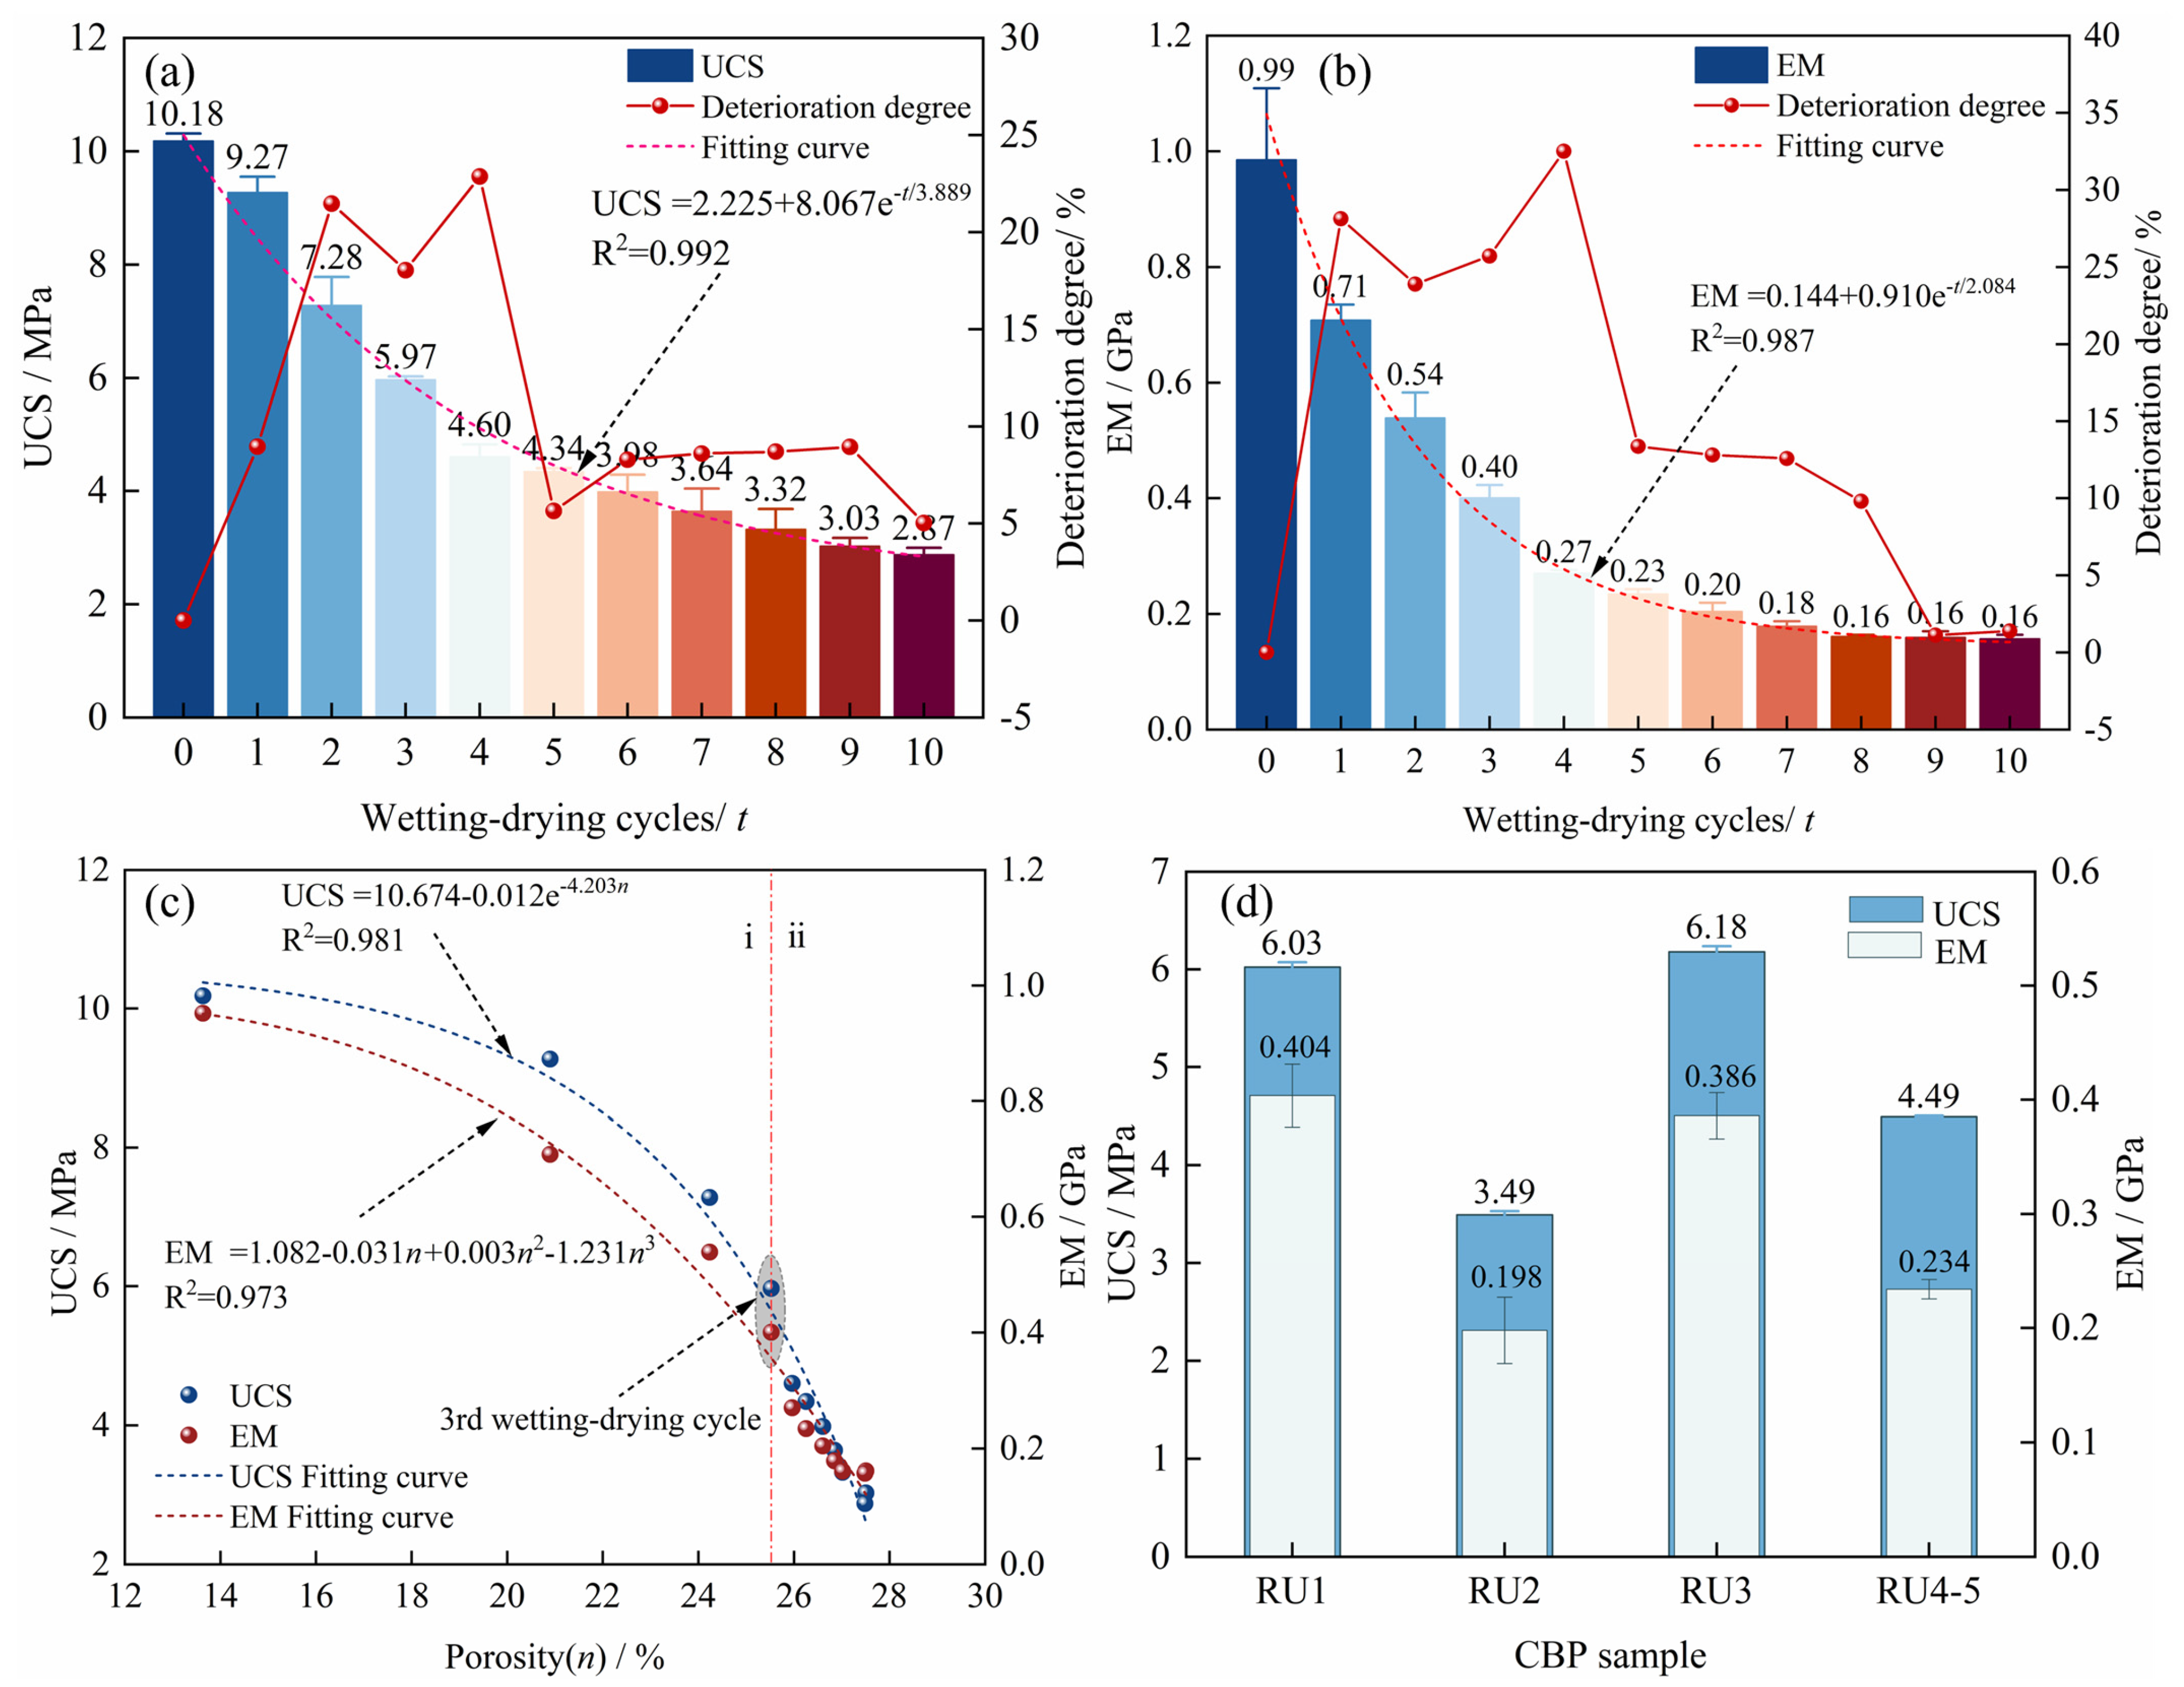
In the degradation stage (stage ii), the loss of small particles, clay minerals and cements in the CPB decreased, and its UCS and EM decreased rapidly. Because cement is the main component of CPB, it is mainly the hydration product of the composite binder [
74]. As the number of wetting–drying cycles increases, the hydration products in the cement at the critical steady state frequently undergo a water absorption–dehydration process, and these hydration products are easily converted at a certain [
75]. When the ettringite growth reaches a certain level, at temperatures above 65 °C, some of the ettringite will decompose to form delayed ettringite [
76]. When the temperature reaches 95 °C, the ettringite will disappear quickly and become difficult to observe [
69]. Some other ettringite absorbs a large amount of water molecules, causing repulsion between the particles, resulting in expansion [
77] and causing the cement in the critical stable state to be destroyed (
Figure 12d–f), resulting in an increase in the number of internal cracks in the CPB and the gradual development of microcracks. Finally, although the number of wetting–drying cycles increased, the UCS and EM basically remained stable, indicating that the key cements and aggregates in the CPB form a relatively stable skeleton [
22] and are not easily affected by wetting–drying cycles.
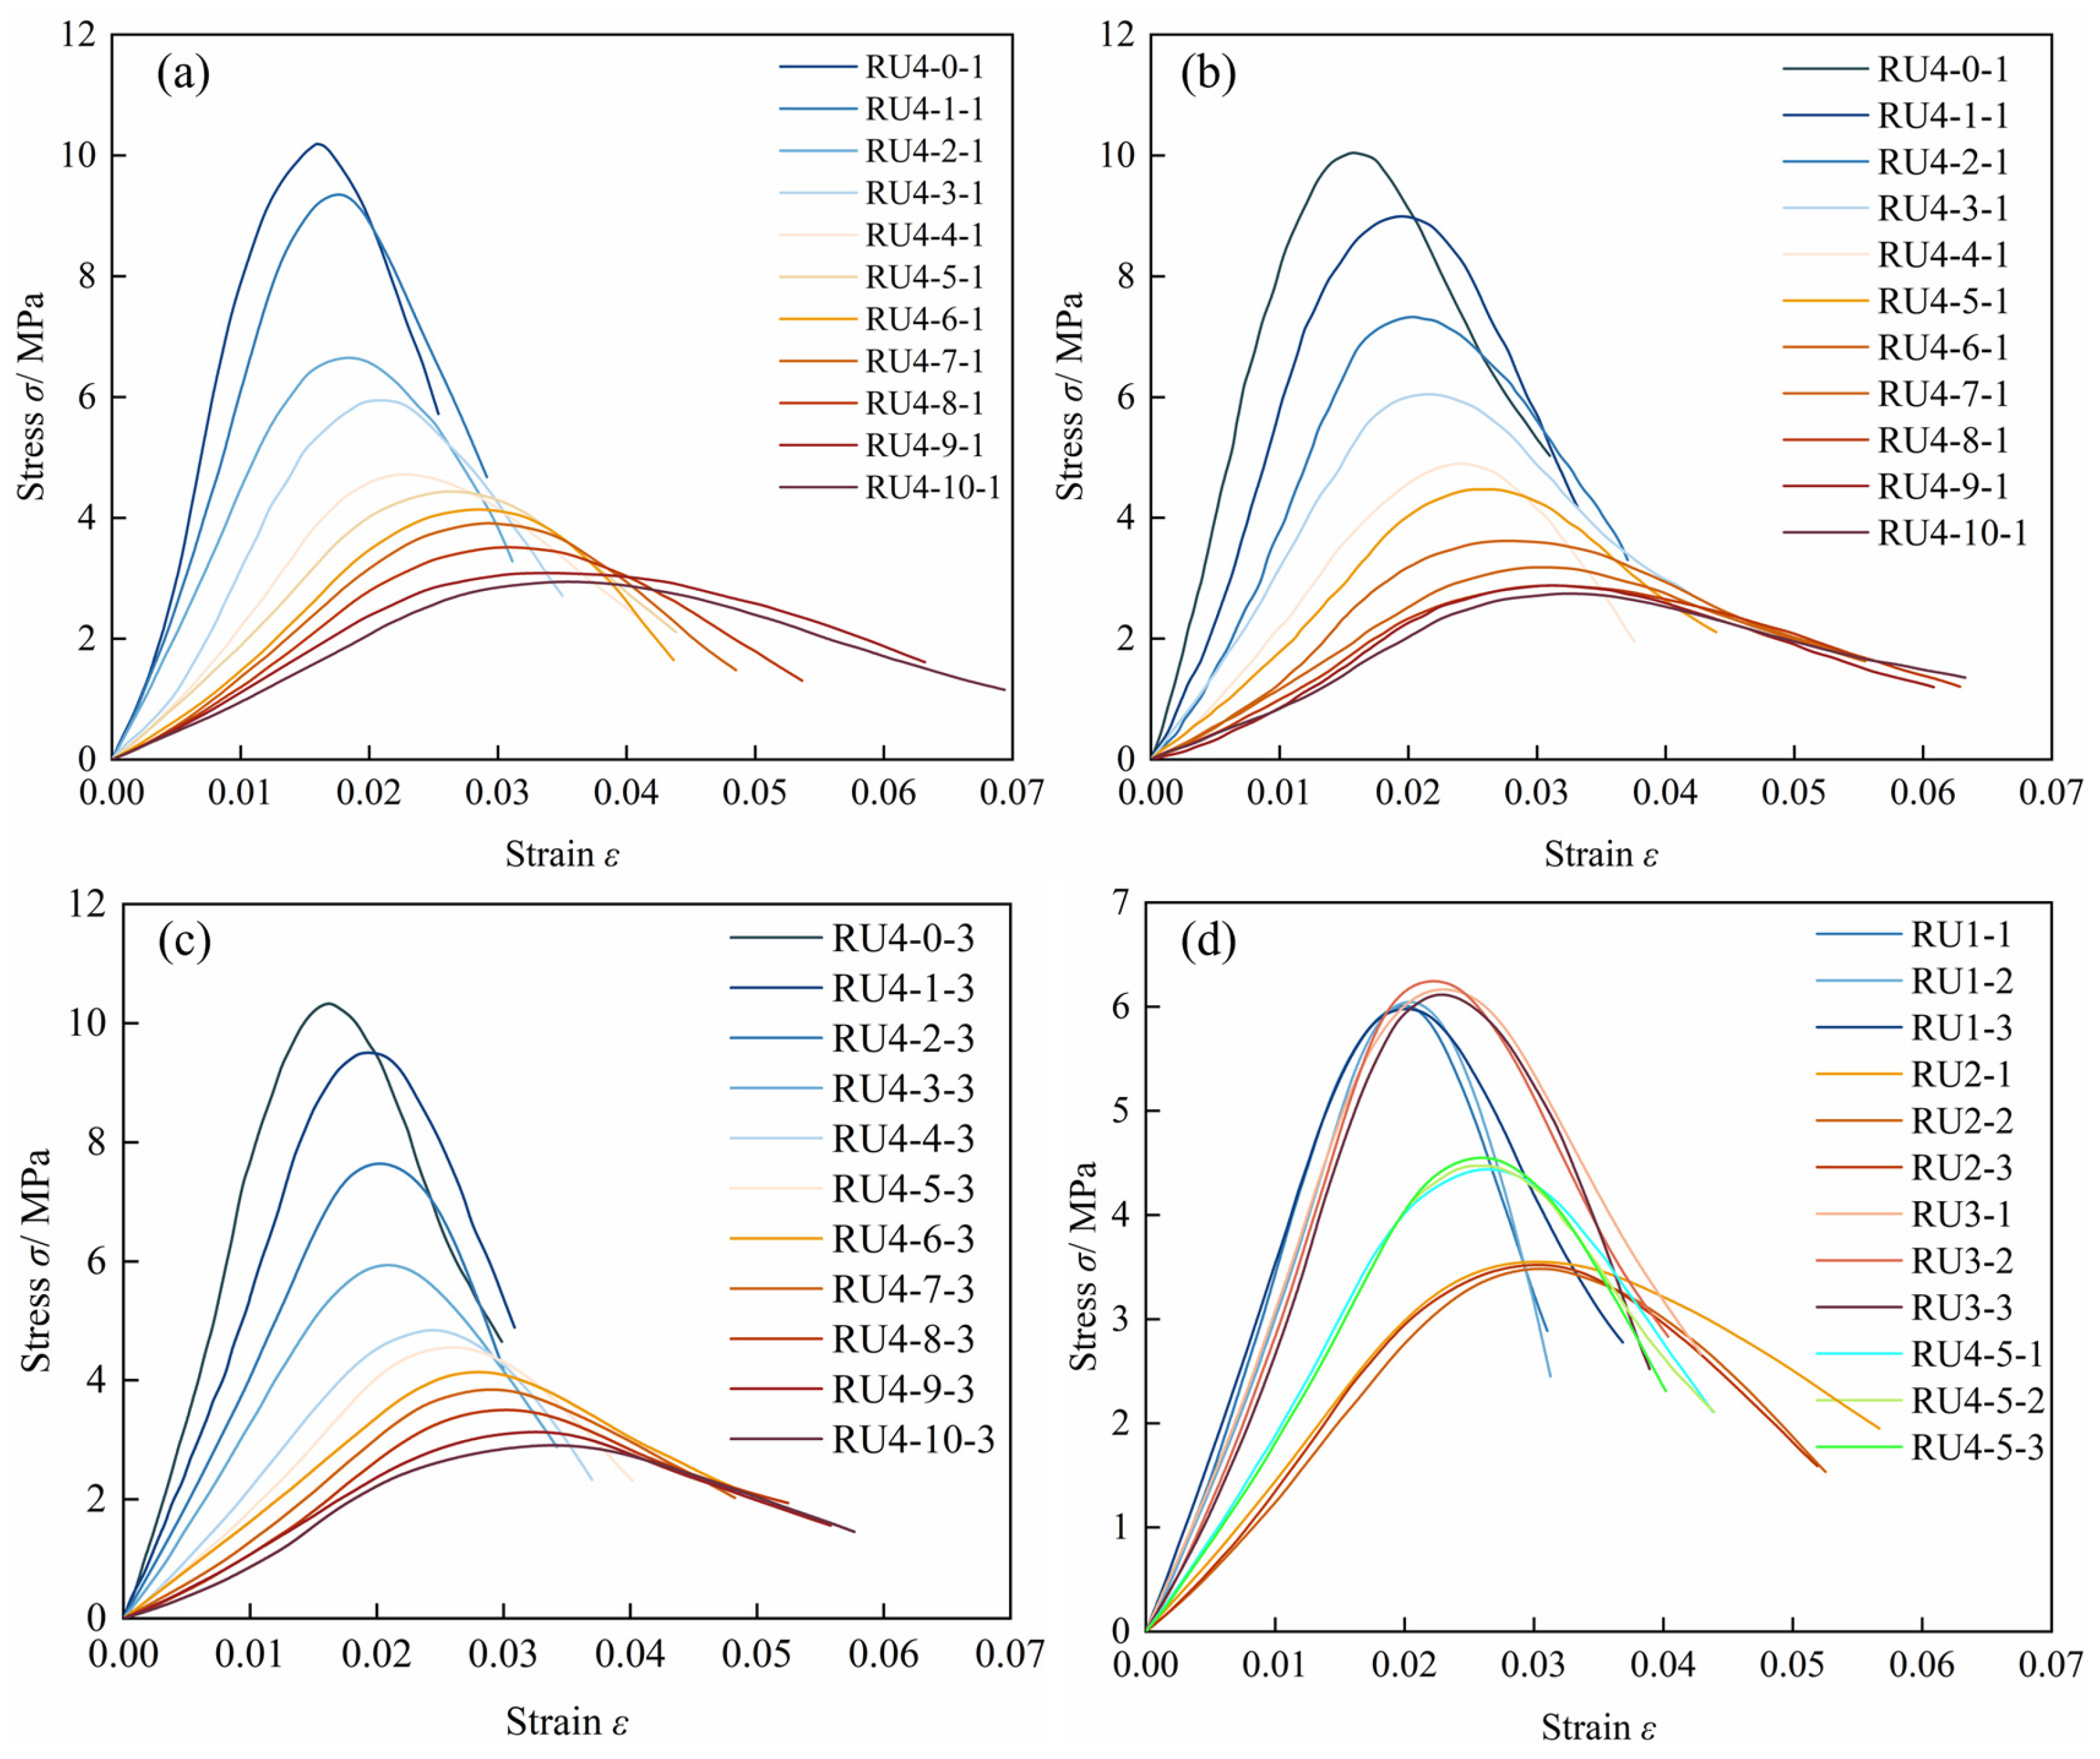
CPB with composite cementitious ordinary Portland cement and sulfoaluminate cement has better resistance to the deterioration of wetting–drying cycles, while CPB with gypsum has poor water resistance (
Figure 5l–s) (Durgun, 2020), and the more gypsum that is added, the less stable the strength of CPB (
Figure 9d). From the variation in UCS and EM, EM is more sensitive to gypsum incorporation than UCS. Although some hydration products in CPB with normal Portland cement and sulfoaluminate cement are degraded, they still maintain a relatively complete cementation structure, so they can maintain a higher UCS and EM. However, too much ettringite may be generated in CPB with too much added gypsum [
78], which accelerates the development of pores and microcracks and destroys the bonding structure (
Figure 12g–i), resulting in a weakened resistance to deformation and decreased compression resistance.
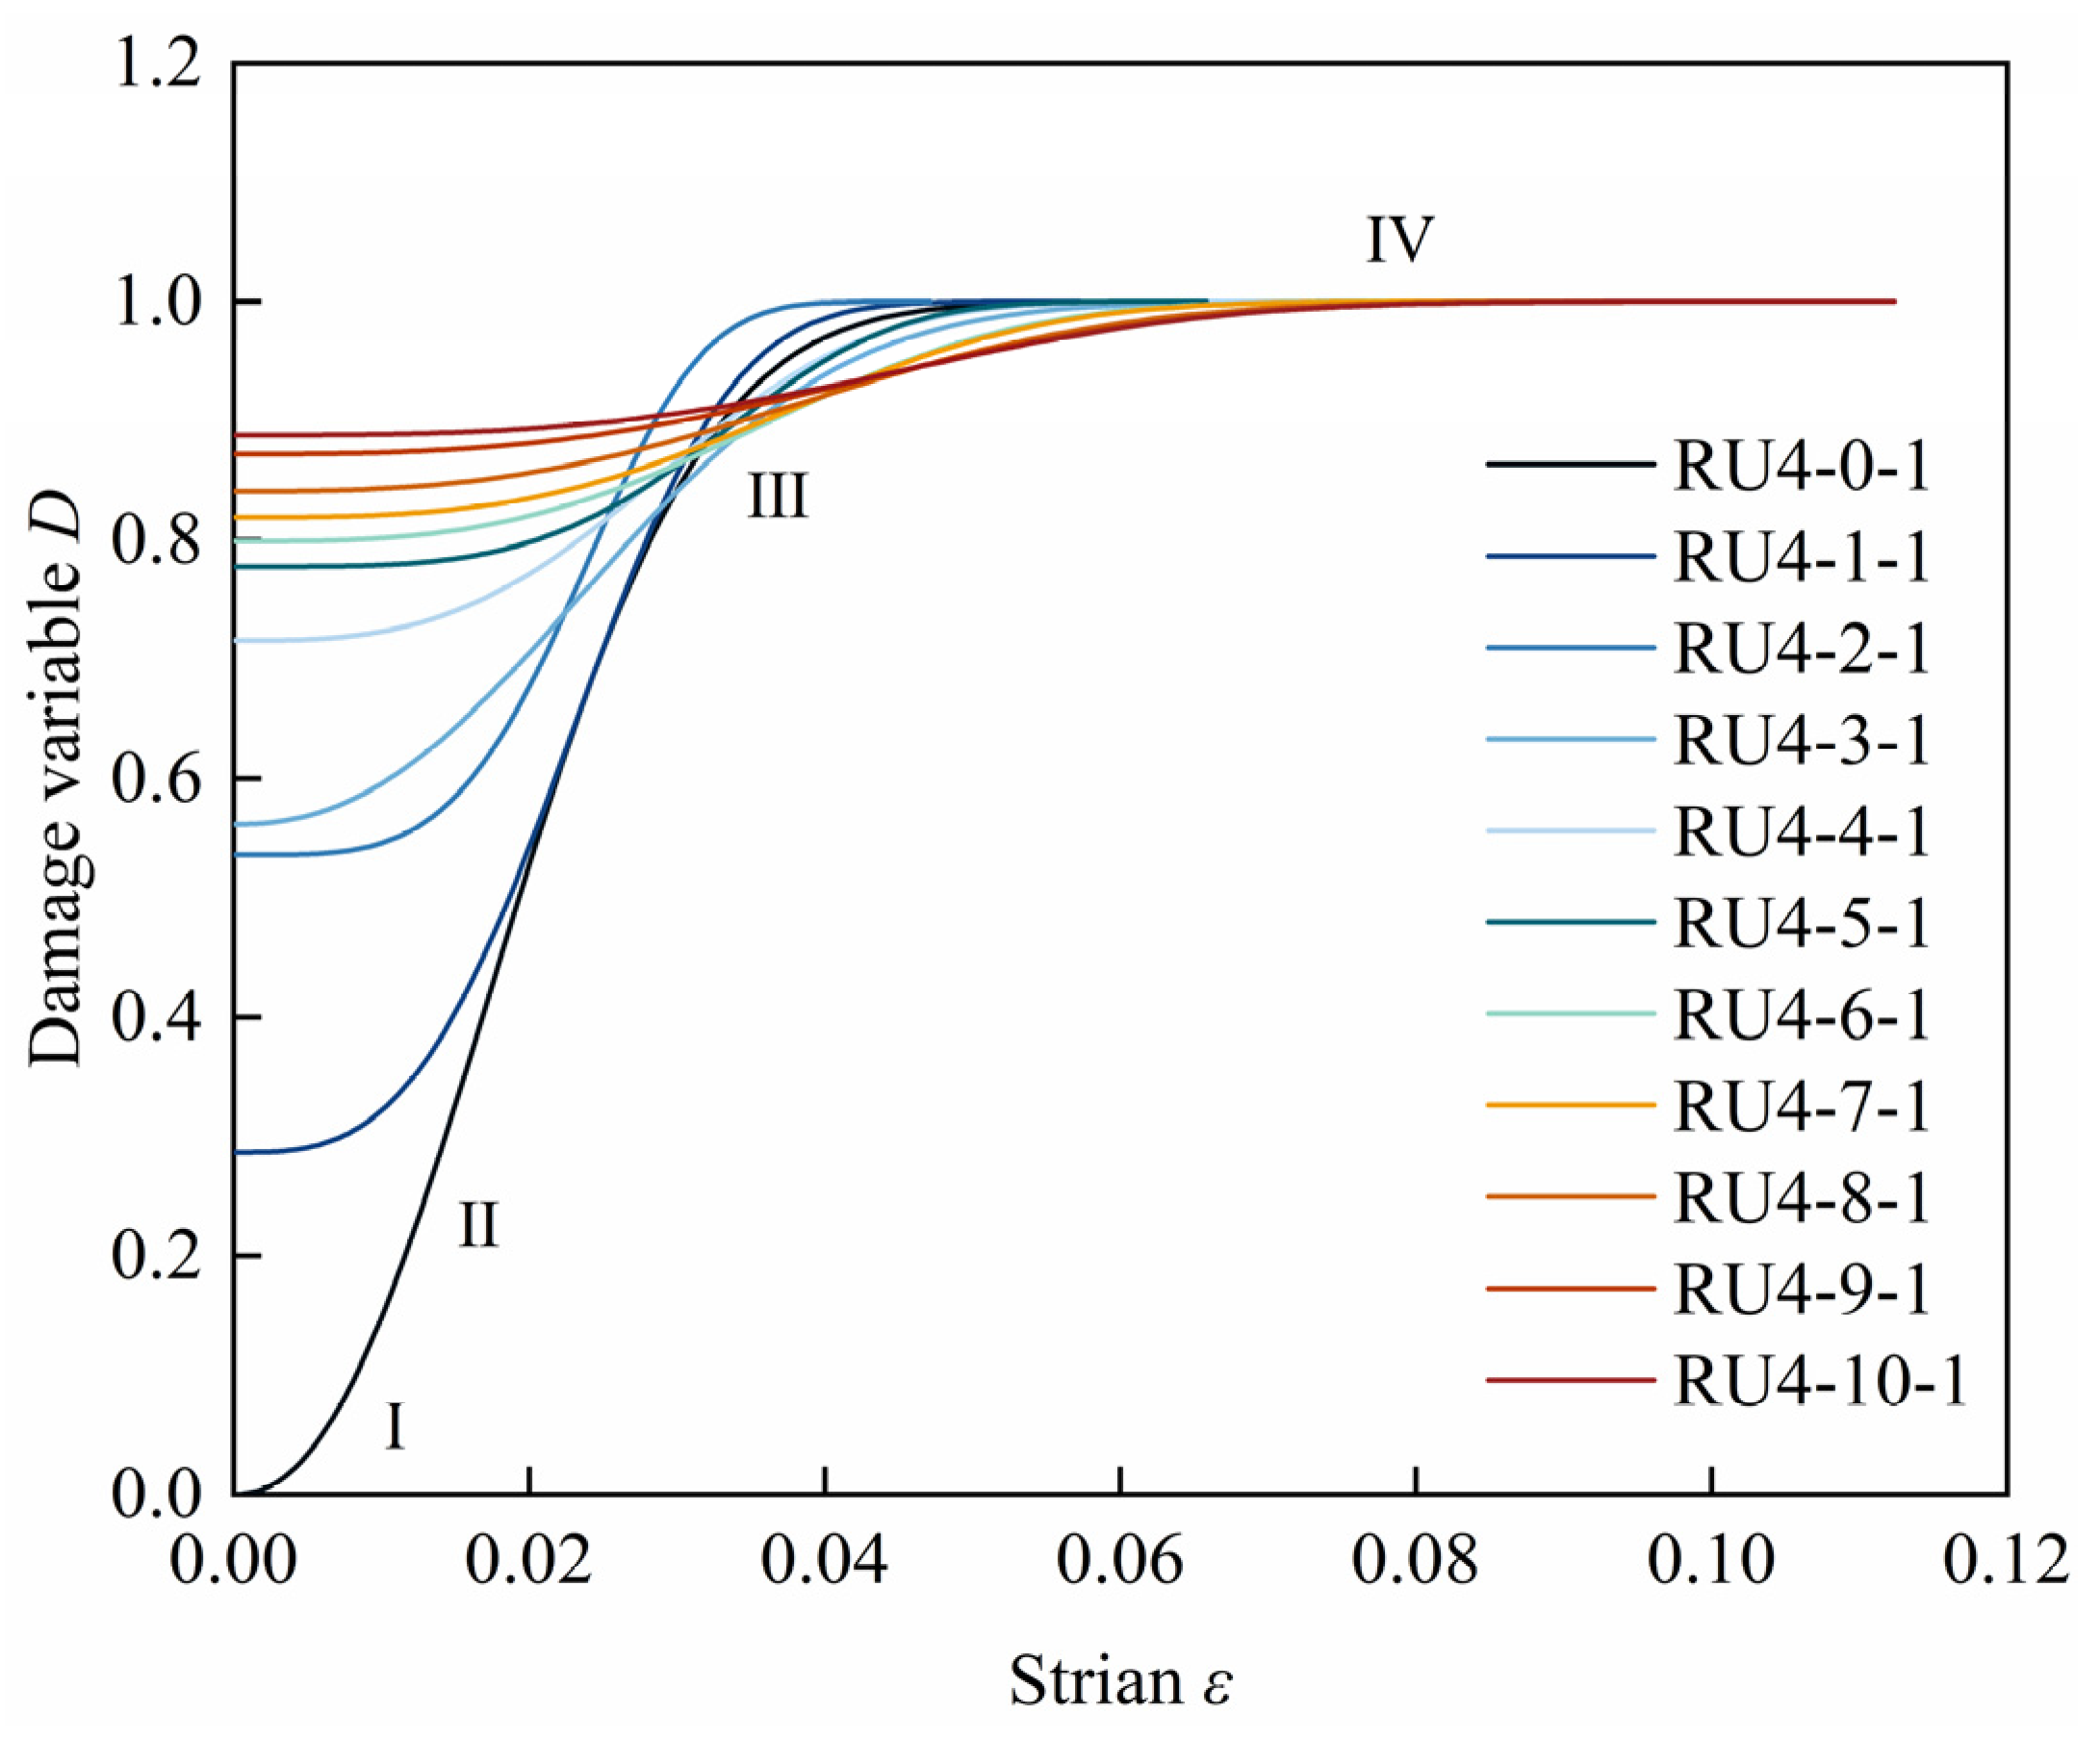
There were significant differences in
DW between different wetting–drying cycles, and
DW increased with an increasing number of wetting–drying cycles [
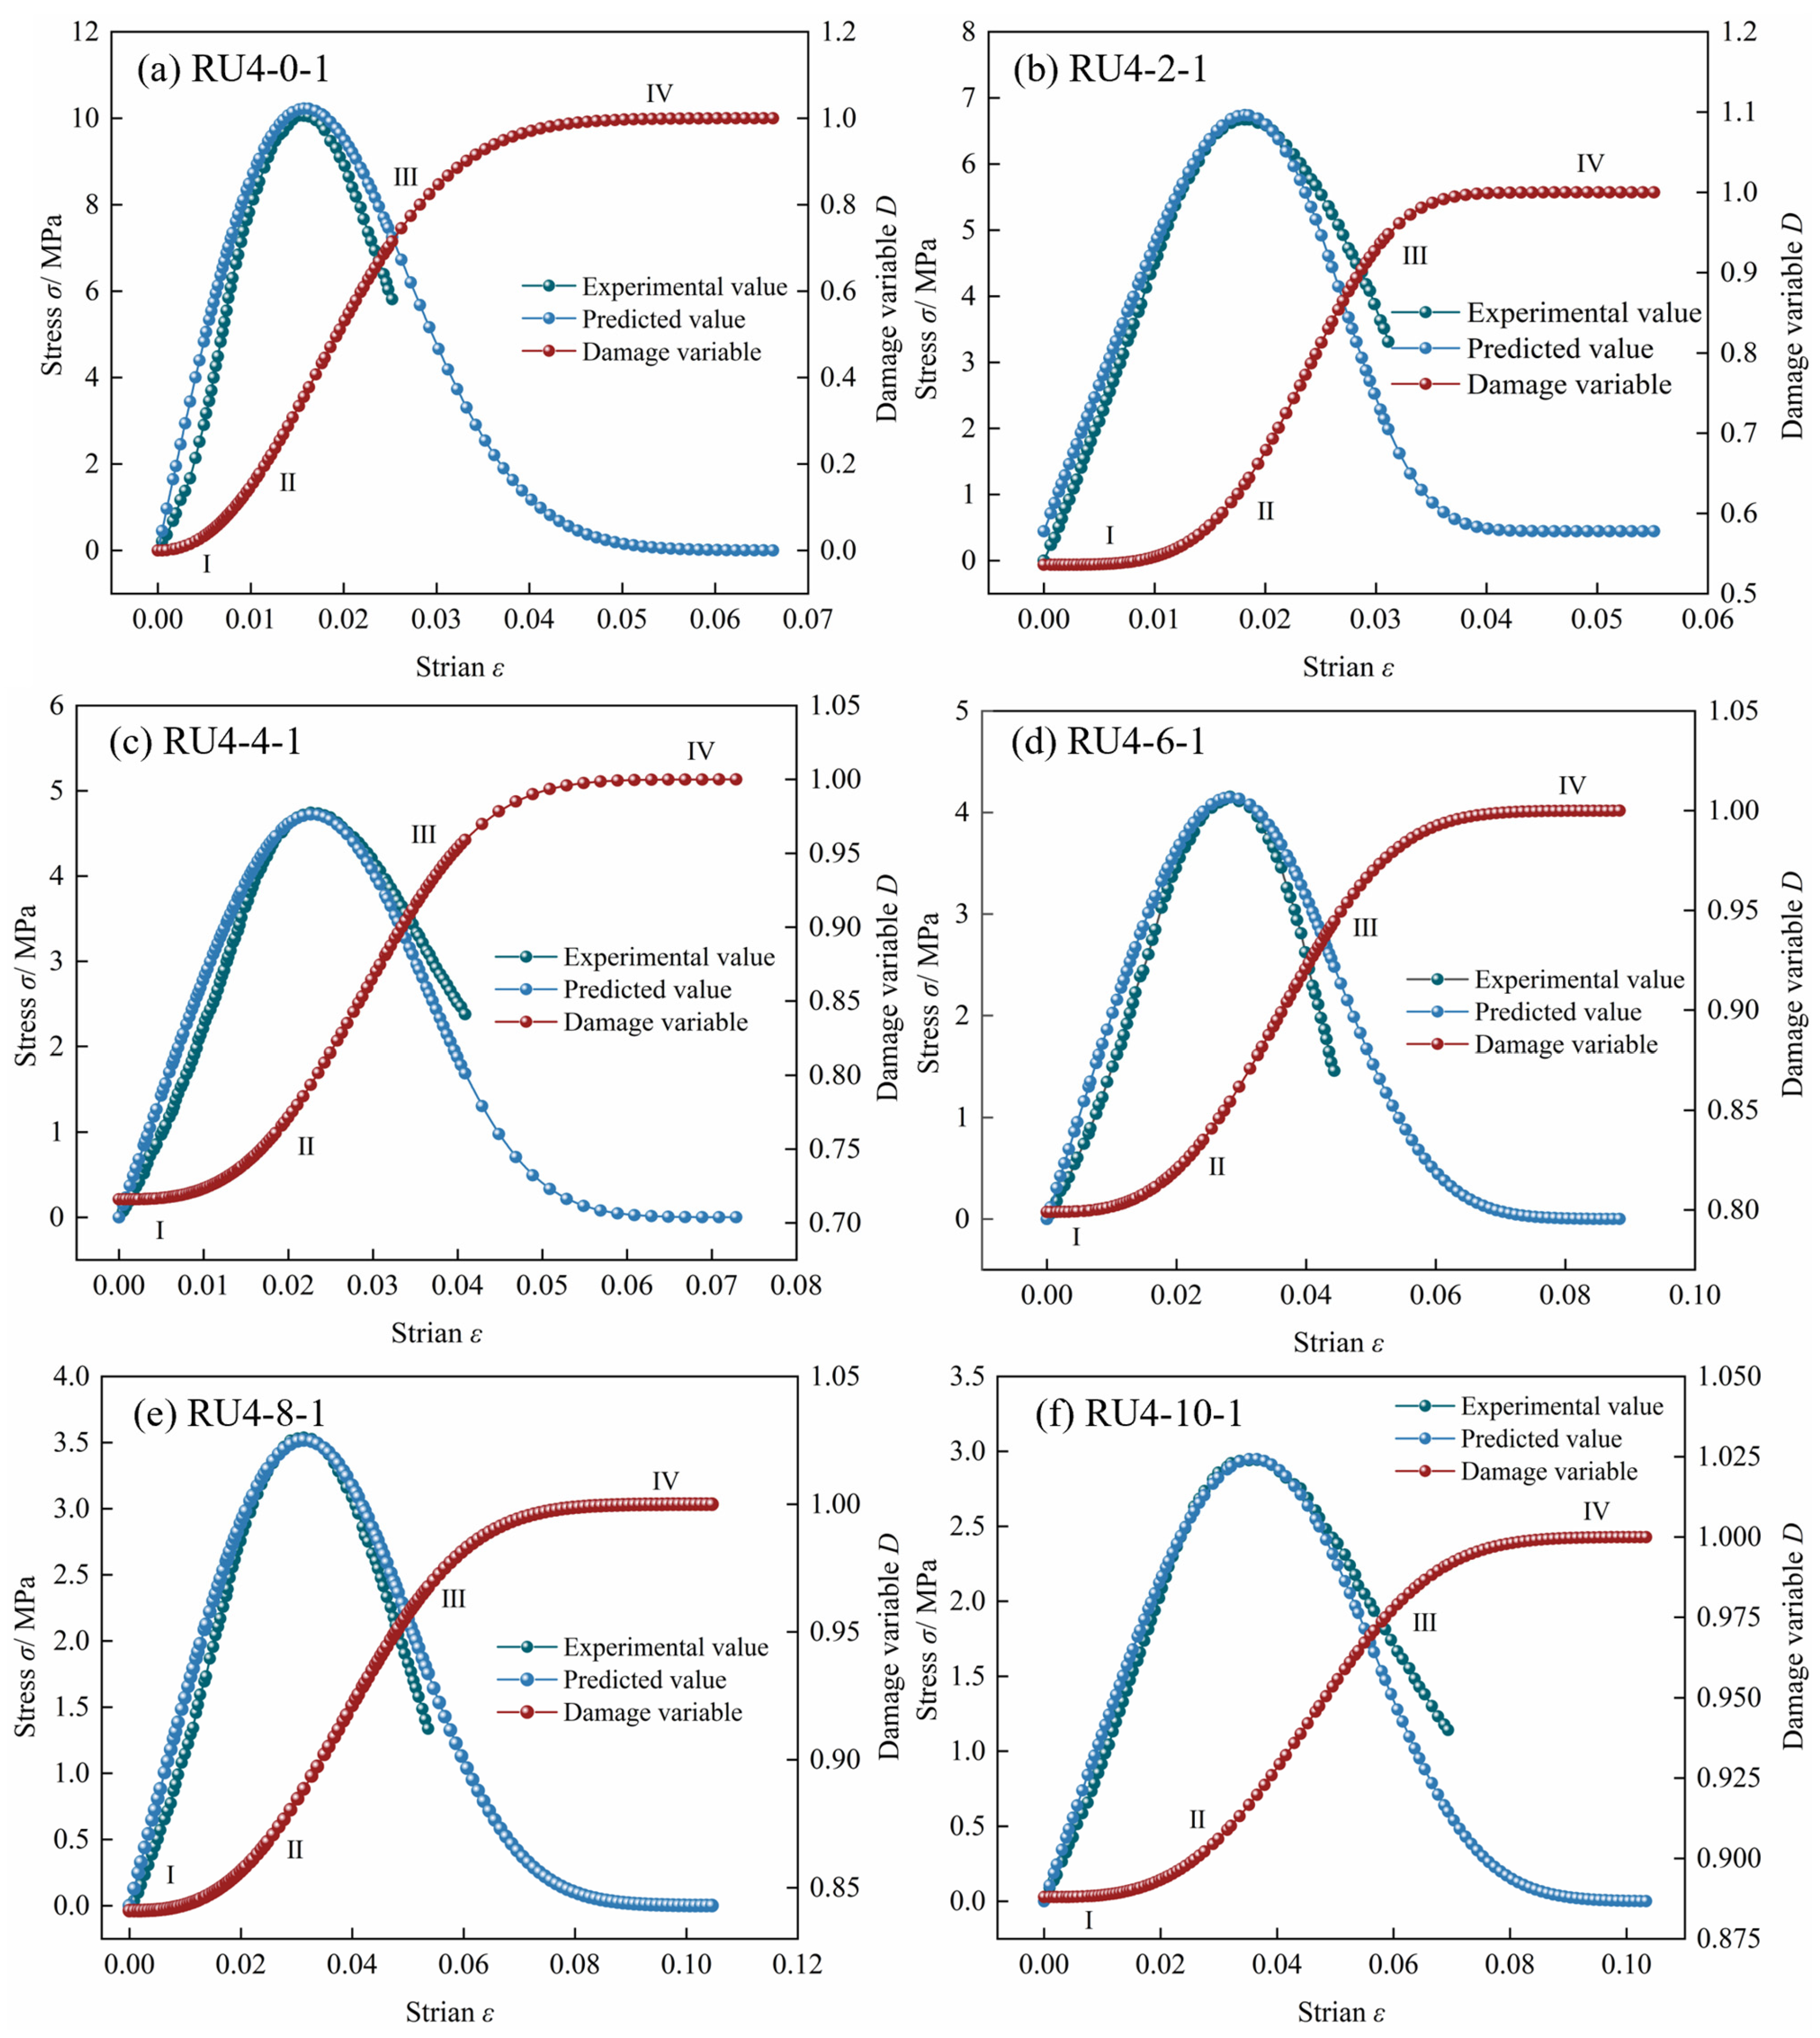
79]. With the increase in axial strain, the total damage variable evolution curve of CPB presented an ‘S’ shape, and Song et al. [
80] and Wang et al. [
41]) also obtained this conclusion. CPB deformation to failure is a progressive damage process [
81].
Based on the above, for the CPB backfill of open-pit coal mines with frequent groundwater activities and frequent rainfall, especially backfill with aggregates with a high clay mineral content, it is necessary to strengthen waterproofing and drainage measures. The upper bench of the adit is also protected by a flood dam, and flood protection is provided at the adit entrance to ensure that surface precipitation does not enter the adit and affect the stability of the coal pillar, the filling body and the roof of the adit. The exposed areas of the filled adit are protected by sprayed concrete to minimize the deterioration of the filling body wetting–drying cycles weathering. Carefully consider the amount of gypsum added, and pay attention to CPB softening in water to prevent slope failure due to the deterioration of the physical and mechanical properties of the CPB and weak layer sliding.


