Article

Analysis of the Source Apportionment and Pathways of Heavy Metals in Soil in a Coal Mining Area Based on Machine Learning and an APCS-MLR Model

1
Anhui Province Engineering Laboratory for Mine Ecological Remediation, Anhui University, Hefei 230601, China
2
School of Environment and Energy Engineering, Anhui Jianzhu University, Hefei 230601, China
*
Author to whom correspondence should be addressed.
Minerals 2024, 14(1), 54; https://doi.org/10.3390/min14010054
Submission received: 15 November 2023 / Revised: 25 December 2023 / Accepted: 28 December 2023 / Published: 31 December 2023

Abstract

:
Long-term coal mining activities have led to severe heavy metal pollution in the soil environment of coal mining areas, posing significant threats to both ecological environments and human health. In this study, surface soil samples were collected from the overlying soil of coal gangue and the surrounding areas of the Panyi coal mine in Huainan. The concentrations of Cd, Zn, Cu, Ni, and Pb elements were determined. A self-organizing map (SOM) and an absolute principal component score multiple linear regression (APCS-MLR) receptor model were employed for the quantitative analysis of the soil’s heavy metal pollution sources and contributions. Additionally, this study focused on the analysis of the pathways of the relatively serious pollution of Cd. The results revealed that the average concentrations of heavy metals (Cd, Pb, Zn, Cu, Cr, and Ni) in the study area were 4.55, 0.59, 1.54, 0.69, 0.59, and 0.71 times the local soil background values, respectively. The concentrations of Cd and Zn exceeded the risk screening values at some sampling points, with exceedance rates of 44% and 8%, respectively, indicating a relatively serious Cd contamination. The sources of heavy metals in the soil in the study area were classified into four categories: mining activities, agricultural activities, weathering of natural matrices, and other unknown sources, with average contributions of 55.48 percent, 24.44 percent, 8.91 percent and 11.86 percent, respectively. Based on the spatial distribution of Cd, it was inferred that atmospheric deposition is one of the important pollution pathways of Cd in the study area. Cd profile distribution patterns and a surface water pollution survey showed that the farmland areas were affected by the irrigation water pathway to some extent. The vertical distribution of heavy metal content in the forest area showed a strong disorder, which was related to the absorption function of plant roots. The results of this study can help to improve the environmental management of heavy metal pollution so as to protect the ecological environment and human health.

1. Introduction

The extraction of coal resources, while promoting local economic development, also gives rise to a range of environmental pollution issues [1,2,3]. By-products generated from coal mining, such as coal gangue, contain significant accumulations of heavy metals (HMs) that, under the influence of rainfall and leaching, are continuously released into the surrounding water bodies, atmosphere, and soil environments [4,5]. Due to the non-biodegradable and persistent nature of heavy metals, this pollution persists even after the cessation of the pollution source [6,7]. HMs in the soil can pose threats to human health through the food chain or other pathways, affecting the normal functioning of human organs and potentially leading to cancer [8,9,10,11,12,13]. Human activities such as coal mining, metal smelting, and agricultural fertilization contribute significantly to the introduction of HMs into surrounding environmental media through various pollution pathways, triggering a series of biogeochemical processes in the environment. A comprehensive understanding of the sources and pathways of HMs is crucial for achieving refined environmental management of heavy metal pollution, ultimately safeguarding both ecological environments and human health.
The sources of heavy metals in soil can be classified into two categories: the weathering of bedrock processes and anthropogenic inputs [14]. Methods such as correlation analysis and geostatistics are commonly used to assist in identifying types and quantities of pollution sources but cannot provide the contribution rates of pollution sources to HMs [15]. With the improvement in sample pre-treatment methods and the advancement of mass spectrometry analysis techniques, stable isotope methods have offered a new perspective for the quantitative analysis of heavy metal sources [16,17,18]. However, as an emerging technology in source apportionment, stable isotope methods still have limitations, such as interference in source apportionment results caused by isotope fractionation during heavy metal migration and transformation processes, and there is a need for a more comprehensive metal isotope source fingerprint [19]. Receptor models can calculate the quantity and contribution rate of pollution sources, and among them, the APCS-MLR method is widely used in current research on heavy metal source apportionment, including positive matrix factorization (PMF), unmixing (UNMIX), and APCS-MLR [20,21]. APCS-MLR has the advantage of overcoming the shortcomings of factor analysis in the case of unknown sources, but it lacks accuracy in interpreting model results [22]. Therefore, to address the limitations of receptor models, researchers often introduce other technical methods to achieve an accurate analysis of heavy metal pollution sources. In recent years, some machine learning methods such as SOM, random forest (RF), and conditional inference trees (CIT) have garnered scholars’ attention in the field of source apportionment of soil heavy metal pollution. SOM is a widely used self-organizing neural network method and an unsupervised learning algorithm that can use clustering functions to classify and identify heavy metal sources in soil [23]. SOM can effectively mine data features and correlations, showing strong applicability in pattern classification and element identification. The joint application of APCS-MLR and SOM helps enhance the accuracy of source apportionment for heavy metal pollution in soil. Clearly defining the pollution pathways of soil HMs from the source to the endpoint contributes to a better understanding of the spatial distribution evolution of soil HMs. However, knowledge of this intermediate process is currently lacking. Analyzing changes in soil profiles in terms of heavy metal content is an effective method for pollution pathway analysis. Some studies have inferred atmospheric deposition surface source pollution and Cd inputs such as irrigation water in farmland in the study area by comparing the vertical distribution differences in HMs in soil profiles under different land use types [24].
Huainan City is an important coal mining and production base in East China. Due to intensive coal mining and processing activities, coupled with agricultural development, heavy metal pollution in soil has gradually increased. Additionally, coal mining can lead to varying degrees of land subsidence, forming extensive subsidence water areas. Due to the region’s high groundwater level, well-developed surrounding water systems, and large coal mining volume, the subsidence area in the mining district has reached 300 km² [25]. The Panyi coal mine, located in the northern part of Huainan City, is one of the first fifteen modern model mines designated in the national coal system. The mining activities in this area have caused significant damage to the local ecological environment. A previous study investigated the soil quality of a number of mining areas, including the Panyi coal mine, and found heavy metal contamination [26]. Therefore, it is crucial to investigate the heavy metal pollution status and sources in the Panyi coal mine area.
The primary objective of this study is to determine the sources of soil HMs and their pollution contribution rates. The specific aims are (i) to determine the concentrations of HMs in the soil of the study area; (ii) to quantitatively analyze the sources of soil HMs; and (iii) to clarify the pathways of heavy metal pollution in the study area. The results of this study will elucidate the characteristics of heavy metal element pollution in the soil of coal mining areas, quantitatively analyze the sources of heavy metal pollution of soil, and analyze the pathways of heavy metal pollution. This information will provide theoretical support for government agencies in the prevention and control of heavy metal pollution in soil.

2. Materials and Methods

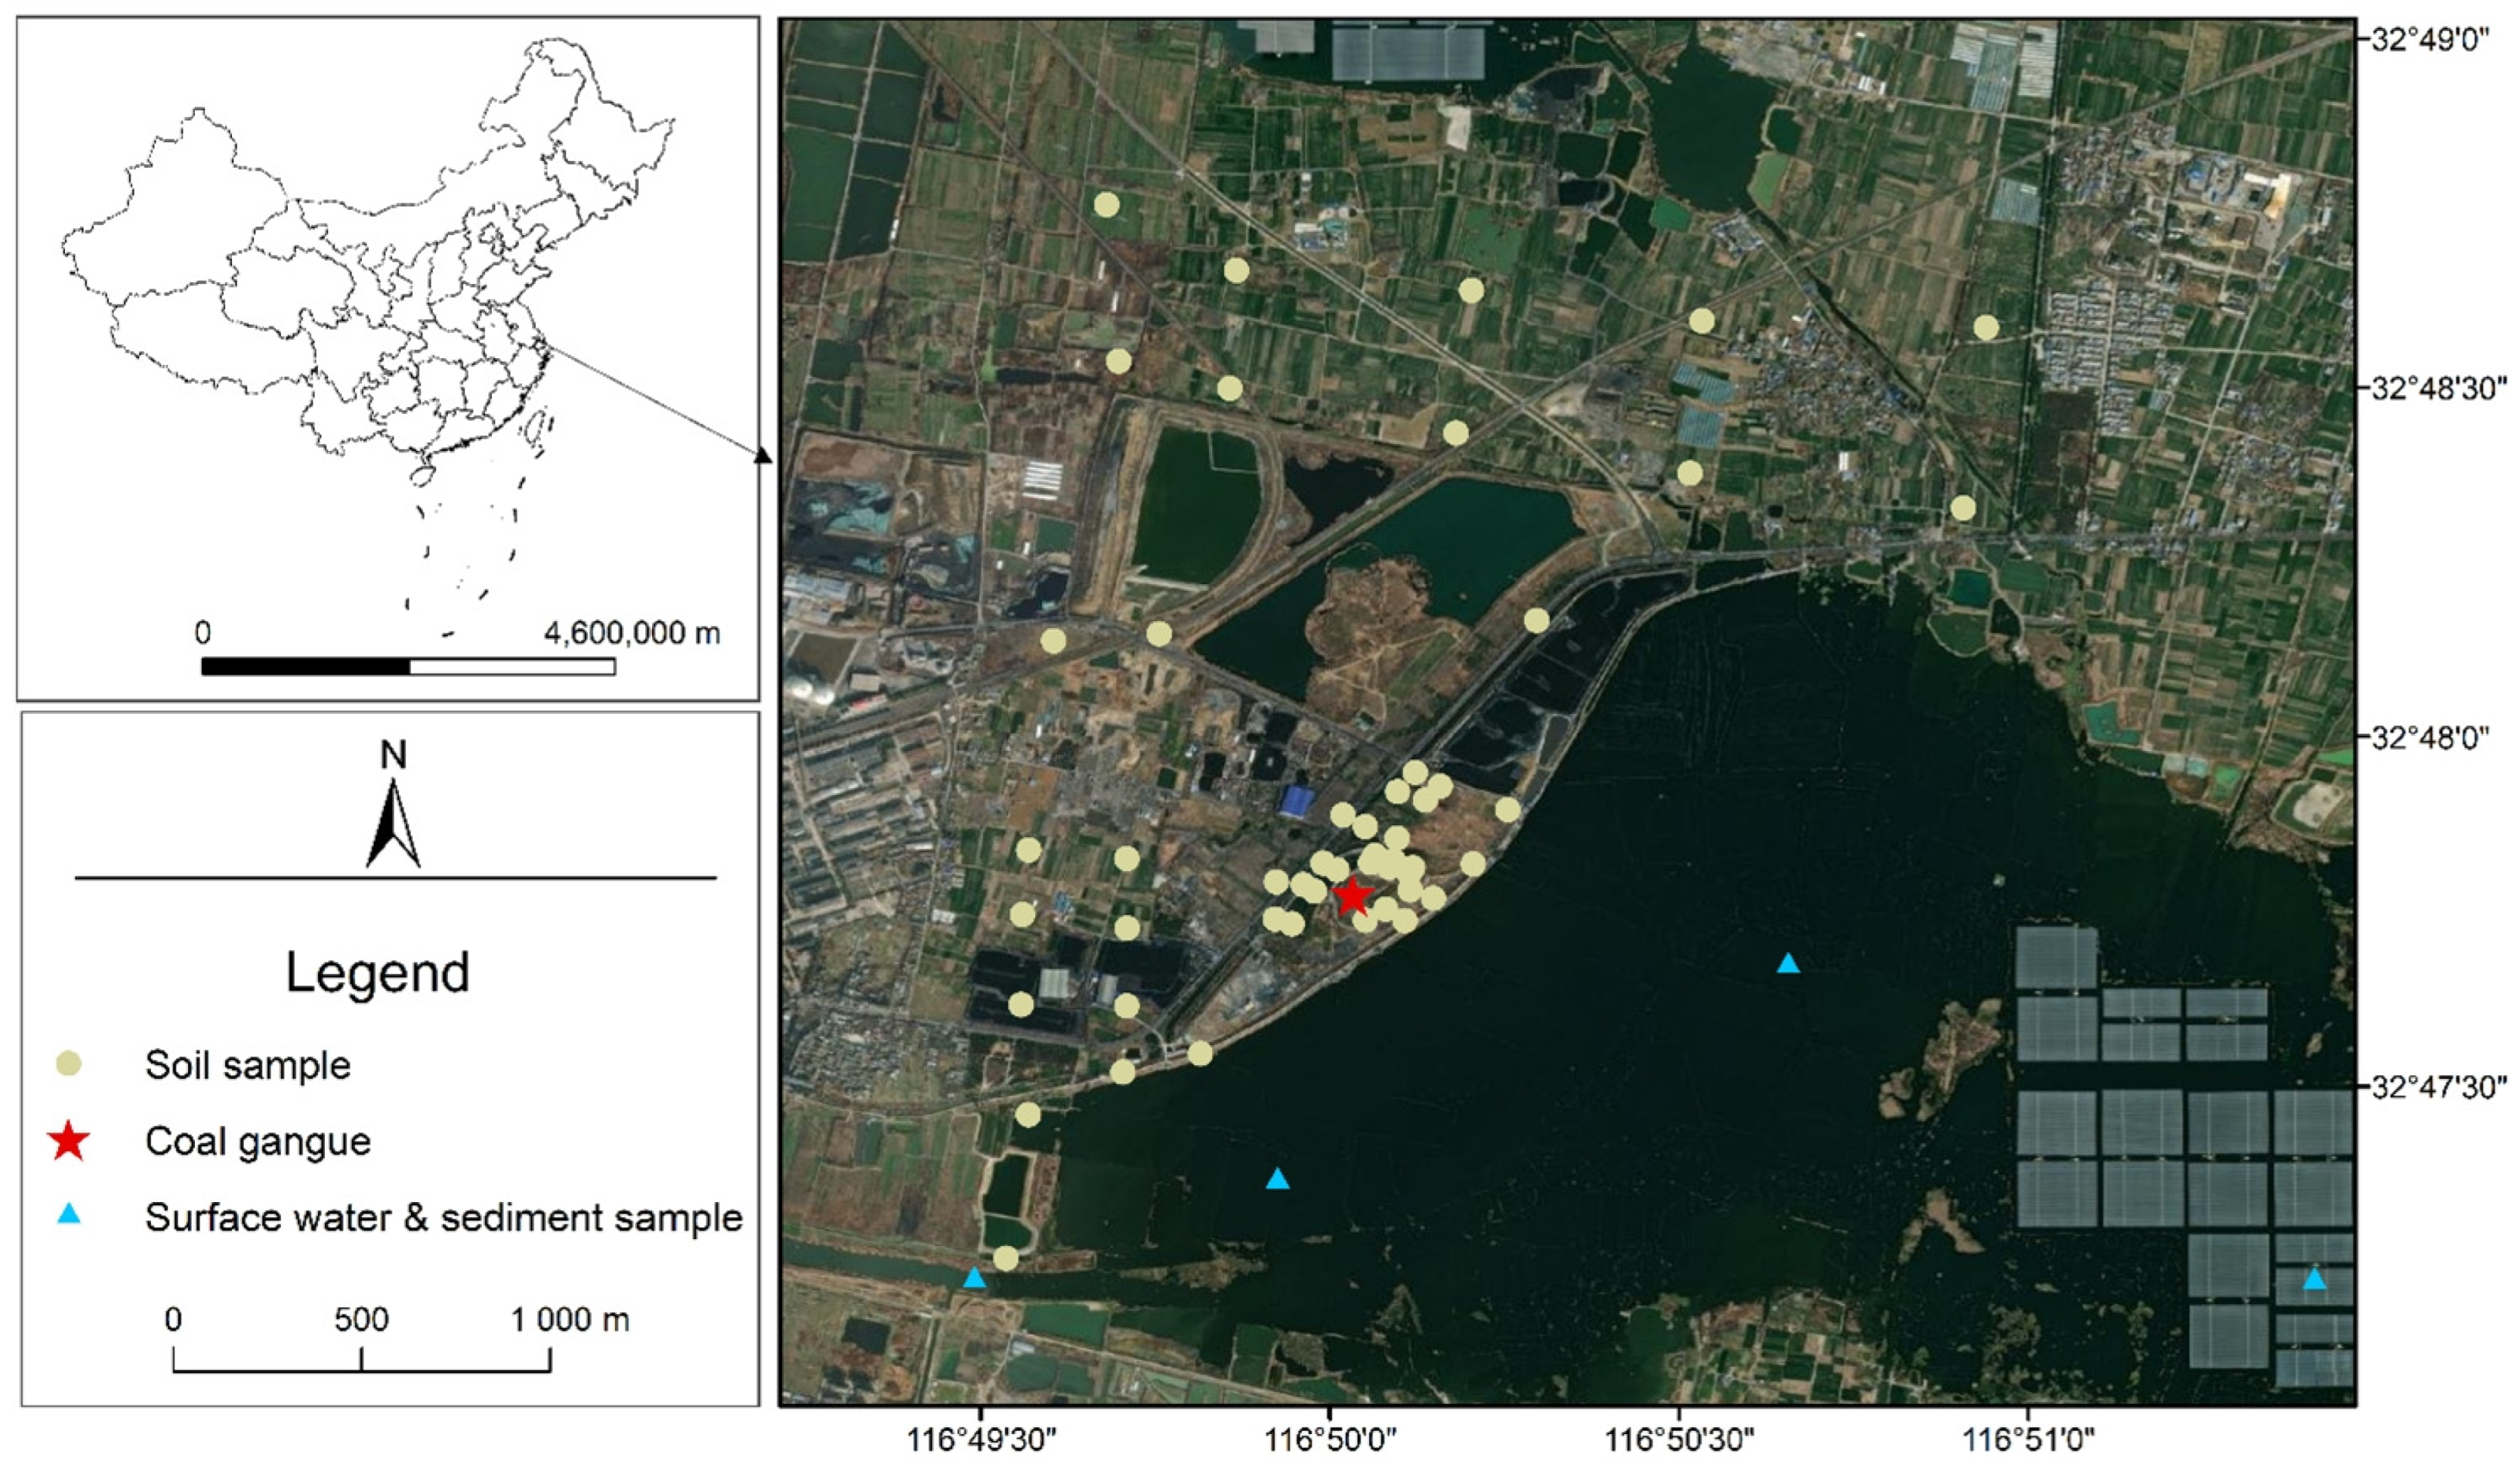
2.1. Overview of the Study Area

The Pan Ji (116°21′–117°11′ E, 32°32′–33°06′ N) is situated in the middle reaches of the Huai River, in the northern part of Huainan City, covering a total area of 590 square kilometers. The district falls within the subtropical monsoon climate zone, characterized by long winters and summers, short springs and autumns, and four distinct seasons. The annual average temperature is 15.1 °C, with an average annual precipitation of 905.6 mm and an average frost-free period of 215.5 days. Geographically, the area is located at the southern end of the Huang-Huai Plain, with a terrain that slopes gently from northwest to southeast, with a gradient of one in five thousand and elevations ranging from 18 to 22 m above sea level. The district has a subsidence area of approximately 3235 hectares formed by coal mining-induced subsidence. Pan Ji is a major coal and electricity hub with seven large coal mines and the Anhui (Huainan) Modern Coal Chemical Industry Park. The water surface area in the subsidence zone formed by coal mining-induced subsidence is approximately 3235 hectares, constituting 12.5% of the total area. The district’s water area covers 67.65 km².The predominant soil type in Pan Ji District is yellow-brown soil, and the vegetation is characterized by temperate deciduous broadleaf forests, with mainly artificial forests. The cultivated land area in Pan Ji District is approximately 450,000 mu, primarily used for the cultivation of crops such as wheat, rice, legumes, oilseeds, and vegetables. The coal industry holds a significant share in the industrial composition, with production having maintained stable growth in recent years.

2.2. Sample Collection and Processing

Based on the preliminary investigation of the basic geographical conditions of the study area and the actual conditions on-site, a sampling plan was determined. Soil sample collection was conducted, taking into consideration different land use functional zones, including farmland, forest land, and coal gangue accumulation areas. The sampling points in the study area were determined using a combination of grid point and zoning point methods, considering the size and shape of functional zones. The sampling work was completed in June 2023, with the collection of a total of 50 surface soil samples (0–20 cm), including 15 samples from the surfaces of coal gangue accumulations. The five-point sampling method was employed, and excess samples were removed using the quartering method after thorough mixing. Due to the influence of topography, the spatial distribution of HMs in the coal gangue accumulation area showed significant variation. Therefore, two layers (upper and lower) were collected in the coal gangue accumulation area based on topographic conditions. In addition, profile samples were collected in three land use types: farmland, forested areas around coal gangue mountains, and surfaces of coal gangue accumulations. The profiles were sampled at five depths: 0–20, 20–40, 40–60, 60–80, and 80–100 cm. Simultaneously, to analyze pollution pathways, water and sediment samples were collected from the surrounding subsidence zone. Surface water and sediment sampling points were positioned at the same horizontal level as much as possible, with four points collected along the direction of water flow. The collected soil and sediment samples were stored in polyethylene plastic bags, while surface water samples were poured into 500 mL polyethylene plastic bottles and adjusted to a pH below 2 by adding concentrated nitric acid. GPS coordinates were recorded using GPS to indicate the latitude and longitude of each sampling point. The locations of the sampling points are shown in Figure 1.
Surface water samples were filtered through a 0.45 μm membrane before being prepared for machine testing. Soil and sediment samples, after natural drying, were processed by removing plant residues, stones, bricks, and other debris using forceps. After grinding, the samples were passed through a 100-mesh nylon sieve and stored in polyethylene self-sealing bags at low temperatures for later use. The soil and sediment samples were digested using an HNO3–HCl–HF–HClO4 digestion system, and the contents of Cd, Zn, Cu, Cr, Ni, and Pb elements in the samples were determined using inductively coupled plasma mass spectrometry (ICP-MS, Agilent 7500cx; Santa Clara, CA, USA). During the testing process, to ensure data accuracy and minimize the impact of sensitivity drift, every 10 samples were tested along with an additional measurement of a known concentration of standard solution (QC) for external standard correction. The National Soil Reference Material (GSS-3a) was used for quality control, with parallel samples conducted every 5 samples to control errors within around 5%.

2.3. SOM

SOM is an unsupervised neural network based on competitive learning, proposed by Kohonen in 1982. It can obtain clustering by seeking the optimal set of reference vectors according to the topological relationships in original data. The key distinctions between SOM and traditional clustering methods lie in the fact that SOM attempts to find nodes in the sample space that represent the features of the data, thus forming a multidimensional distribution function describing the entire dataset. Unlike traditional clustering methods, SOM does not make assumptions about the data, and the results obtained are not dependent on the distribution or statistical model of the data. These advantages, combined with its simple computational process, robust fault tolerance, and memory association, enable SOM to be successfully applied to complex data analysis. In this study, SOM was used to identify patterns of soil HMs. The number of neurons in the output layer was selected according to the following formula:
m = 5 × n
In the above formula, m represents the number of SOM nodes and n represents the number of input data. In this study, a neural structure consisting of 6 rows and 6 columns was chosen for the SOM experiments.

2.4. APCS-MLR

In recent years, many scholars have utilized a method that combines the development of APCS based on principal component analysis (PCA) with MLR, known as APCS-MLR, to achieve pollution source apportionment. The APCS-MLR model uses PCA to obtain APCS, which was then used as the independent variable in a multiple linear regression analysis with heavy metal element content as the dependent variable. This analysis yielded the contribution rates of different pollution sources. The formula for the APCS-MLR is the following:
C i = m = 1 n ( a i m × A P C S i m ) + b i
In the formula above, Ci represents the measured content of the i-th heavy metal; bi is the constant term in the multiple regression; “aim” is the regression coefficient of pollution source m for the i-th heavy metal; APCSim is the absolute principal component score of the pollution source m for the i-th heavy metal; and n is the number of factors.
P C i m = a i m × A P C S i m ¯ b i + m = 1 n a i m × A P C S i m ¯
In the formula above, PCim represents the contribution rate of pollution source m to the heavy metal element i; |bi| is the absolute value of the constant term in multiple regression; and APCSim is the average of the absolute principal component scores of pollution source m for the i-th heavy metal.
P C i m = b i b i + m = 1 n a i m × A P C S i m ¯
In the formula, PCim represents the contribution rate of unidentified sources (unknown sources) to the heavy metal element i.

3. Results and Discussion

3.1. Soil Heavy Metal Content Characteristics

The descriptive statistical results of the heavy metal content in the surface soil of the study area are presented in Table 1. The average order of heavy metal content in the soil was Zn (124.52 mg∙kg −1) > Cr (38.15 mg∙kg −1) > Ni (18.26 mg∙kg −1) > Pb (18.02 mg∙kg −1) > Cu (16.72 mg∙kg −1) > Cd (0.277 mg∙kg −1). Compared to the local soil background values, the average contents of Cd, Pb, Zn, Cu, Cr, and Ni were approximately 4.55, 0.59, 1.54, 0.69, 0.59, and 0.71 times higher, respectively, indicating a certain level of accumulation of Cd and Zn in the study area. In comparison to the “National Soil Environmental Quality Standards” (GB15618-2018) [27], 22 samples (44%) exceeded the risk screening value for Cd and four samples (8%) exceeded the corresponding value for Zn.
The coefficient of variation (CV, % = standard deviation/mean) can indicate the degree of dispersion among data as a measure of the influence of human activities. The CV of Zn (75.79%) was the highest, that of Cr (31.3%) was the lowest, and those of the other HMs, Cu, Pb, Cd, and Ni, were 37.2%, 35.3%, 35.1%, and 31.8%, respectively. It is generally recognized that a CV ≤ 16% is considered as weak variation, 16% < CV < 36% is considered as moderate variation, and a CV ≥ 36% is considered as strong variation [28]. The higher the CV, the higher the degree of influence by anthropogenic activities. The HMs Zn and Cu in the study area belonged to strong variability, which was influenced by anthropogenic factors; the other HMs belonged to medium variability, which might have been influenced by both natural and anthropogenic factors [29].

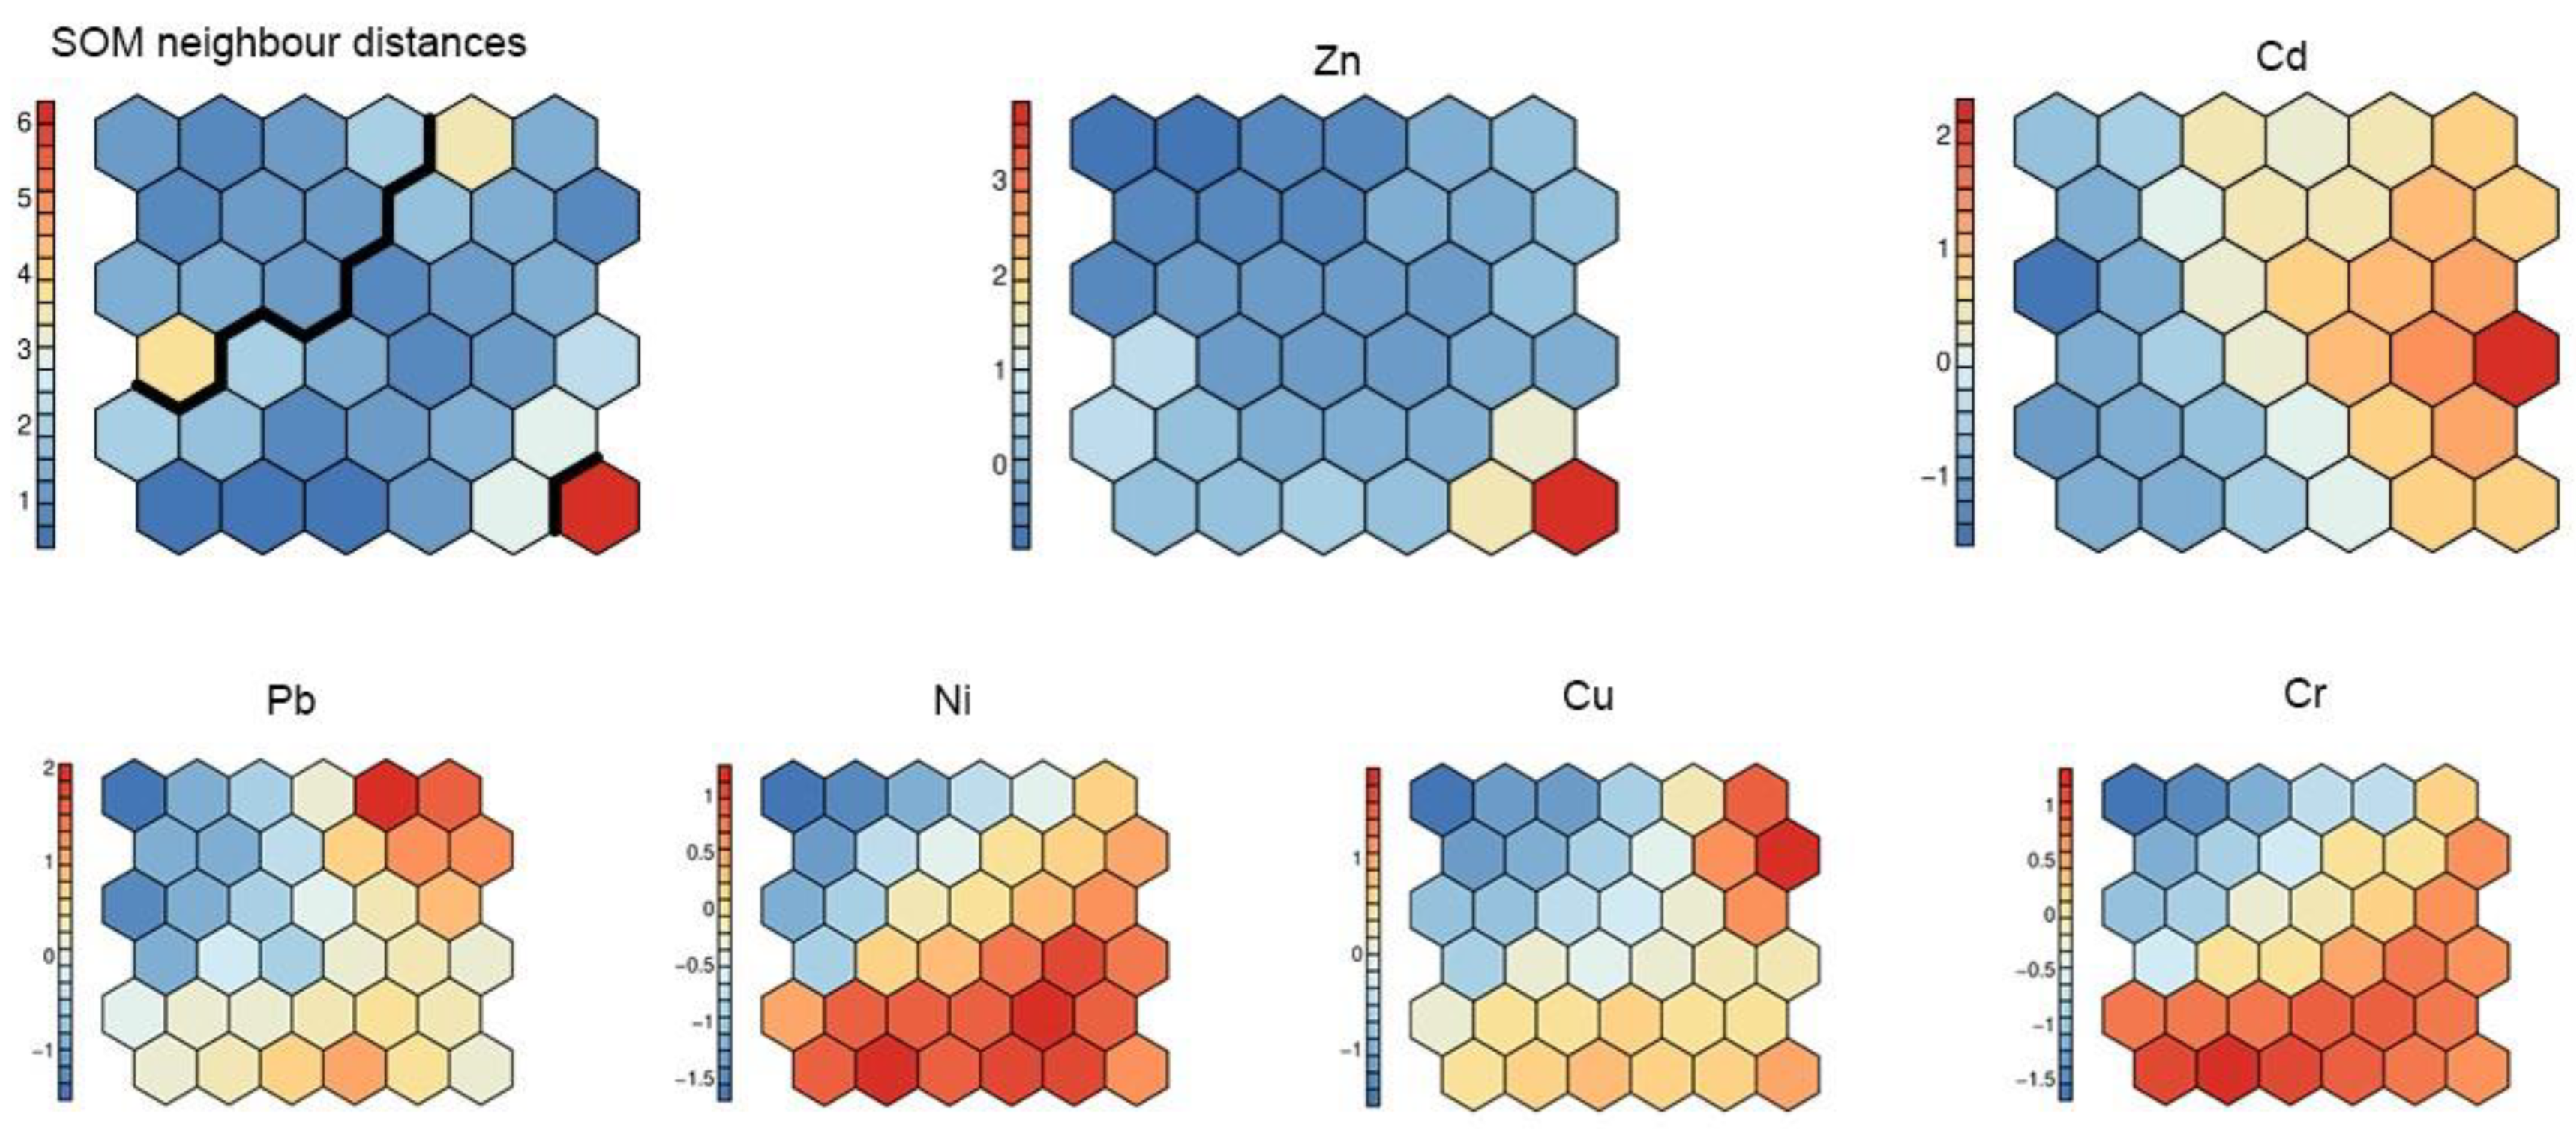
3.2. Soil Heavy Metal Classification and Distribution Based on SOM

The component plane output of SOM analysis is shown in Figure 2. Each SOM matrix consisted of the component values of 36 neurons, and the SOM plane used a color gradient to indicate the importance of the variables transmitted by each neuron. In the component plane, similar colors indicate positive correlations between variables, while different colors indicate negative correlations. By comparing the color gradients of the SOM, it is possible to visualize the qualitatively weighted relational information between nodes and to classify the SHM into three interpretable groups. As shown in Figure 2, certain similar patterns can be distinguished. For example, chromium and nickel show similar color gradients and their distribution patterns show the highest concentrations in the lower right, indicating a strong positive correlation between these two elements. In contrast to the distributions of the other HMs, zinc shows a marked difference in its topological distribution pattern, with relatively low zinc values over most of the map, except for one high neuron in the lower right, suggesting a different mechanism influencing changes in zinc concentration. Cd is highly concentrated in the right half of the map, similar to the compositional planar distributions of copper and lead, suggesting that these HMs share the same mechanism of concentration change. The spatial distributions of chromium and nickel are extremely similar and they are strongly correlated.

3.3. Source Analysis of HMs

3.3.1. Principal Component Analysis

The data on HMs in the soil were standardized, and KMO and Bartlett’s sphericity tests were conducted. The KMO measure of 0.713 and Bartlett’s test of sphericity p < 0.05 indicated that the data were suitable for PCA. The number of principal components extracted is generally determined by eigenvalues greater than 1. However, the results of the principal component analysis showed that only one component had an eigenvalue greater than 1 and the variance contribution of that component was less than 60%. Three principal components were extracted because the SOM plot produced three sample clusters and the principal component analysis results showed that the cumulative variance contribution of the first three principal components was more than 85%. The eigenvalues of these three principal factors were 3.555, 0.923, and 0.752, with a cumulative variance contribution rate of 87.153%, explaining most of the information for the six HMs (Table 2).
The first principal component analysis (PCA1) explained 59.24% of the variance, much higher than the other components. Ni, Cr, Cu, and Pb had high positive loadings on PCA1, with values of 0.931, 0.932, 0.834, and 0.656, respectively. The average values of Cr, Ni, Cu, and Pb in the study area were lower than the local background values, and the coefficients of variation for Cr, Ni, Cu, and Pb were low, indicating that they were less affected by human activities. The SOM analysis results showed a similar color gradient between Cr and Ni, indicating a strong correlation between these two elements. Previous studies have suggested that Cr and Ni in the soil are mainly controlled by natural sources [30,31]. In addition, weathering of soil-forming parent rocks has been reported as a source of Pb and Cu in soils [32,33]. Therefore, the PCA1 can be interpreted as representing a natural parent material source for soil formation.
The second principal component analysis (PCA2) explained 15.38% of the variance, with Cd having the highest loading of 0.943, while the other HMs had weaker loadings. The SOM analysis results indicated that Cd exhibited a significantly different color gradient than other HMs, suggesting different mechanisms influencing Cd concentration changes. The average Cd concentration exceeded the background value in the study area, with some sampling points surpassing the risk screening values for agricultural land, indicating that Cd is likely influenced by human activities. Given that the study area is a coal mining region, long-term coal mining activities have led to a substantial input of Cd into the surrounding soil [34]. Additionally, waste generated from coal mining contains high concentrations of Cd and Pb, and these HMs accumulate in the waste, migrating to the surrounding soil through weathering and rainfall percolation. Previous studies have indicated that the accumulation of coal gangue is a primary cause of elevated Cd levels in surrounding soil, and it contributes to the accumulation of Pb and other HMs [35]. Therefore, PCA2 can be inferred as representing a pollution source related to mining activities.
The third principal component analysis (PCA3) explains 12.53% of the variance, with Zn having the highest loading of 0.968, while the other HMs had weaker loadings. The SOM output plane shows that most values of Zn on the map are low, except for a high-value point in the lower right corner, indicating that the source of Zn in the soil is different from other HMs. The Zn content of HMs in the soil samples in the study area exceeded the local background values, and a few points exceeded the risk screening values. Additionally, the coefficient of variation for Zn exceeded 70%, higher than other HMs. Therefore, the PCA3 can be considered as a source related to human activities. In the central and northern parts of the study area, where there are numerous farmlands, agricultural activities are intense. Studies have shown that pesticides and fertilizers contain certain amounts of Zn, and their long-term use can lead to the accumulation of Zn in the soil [36,37]. In addition, the spatial distribution map (Figure S1) of HMs shows areas of high values of Zn in the farmland area, suggesting that the accumulation of Zn may have been influenced by agricultural activities. Thus, the PCA3 can be interpreted as a source of pollution from agricultural activities.

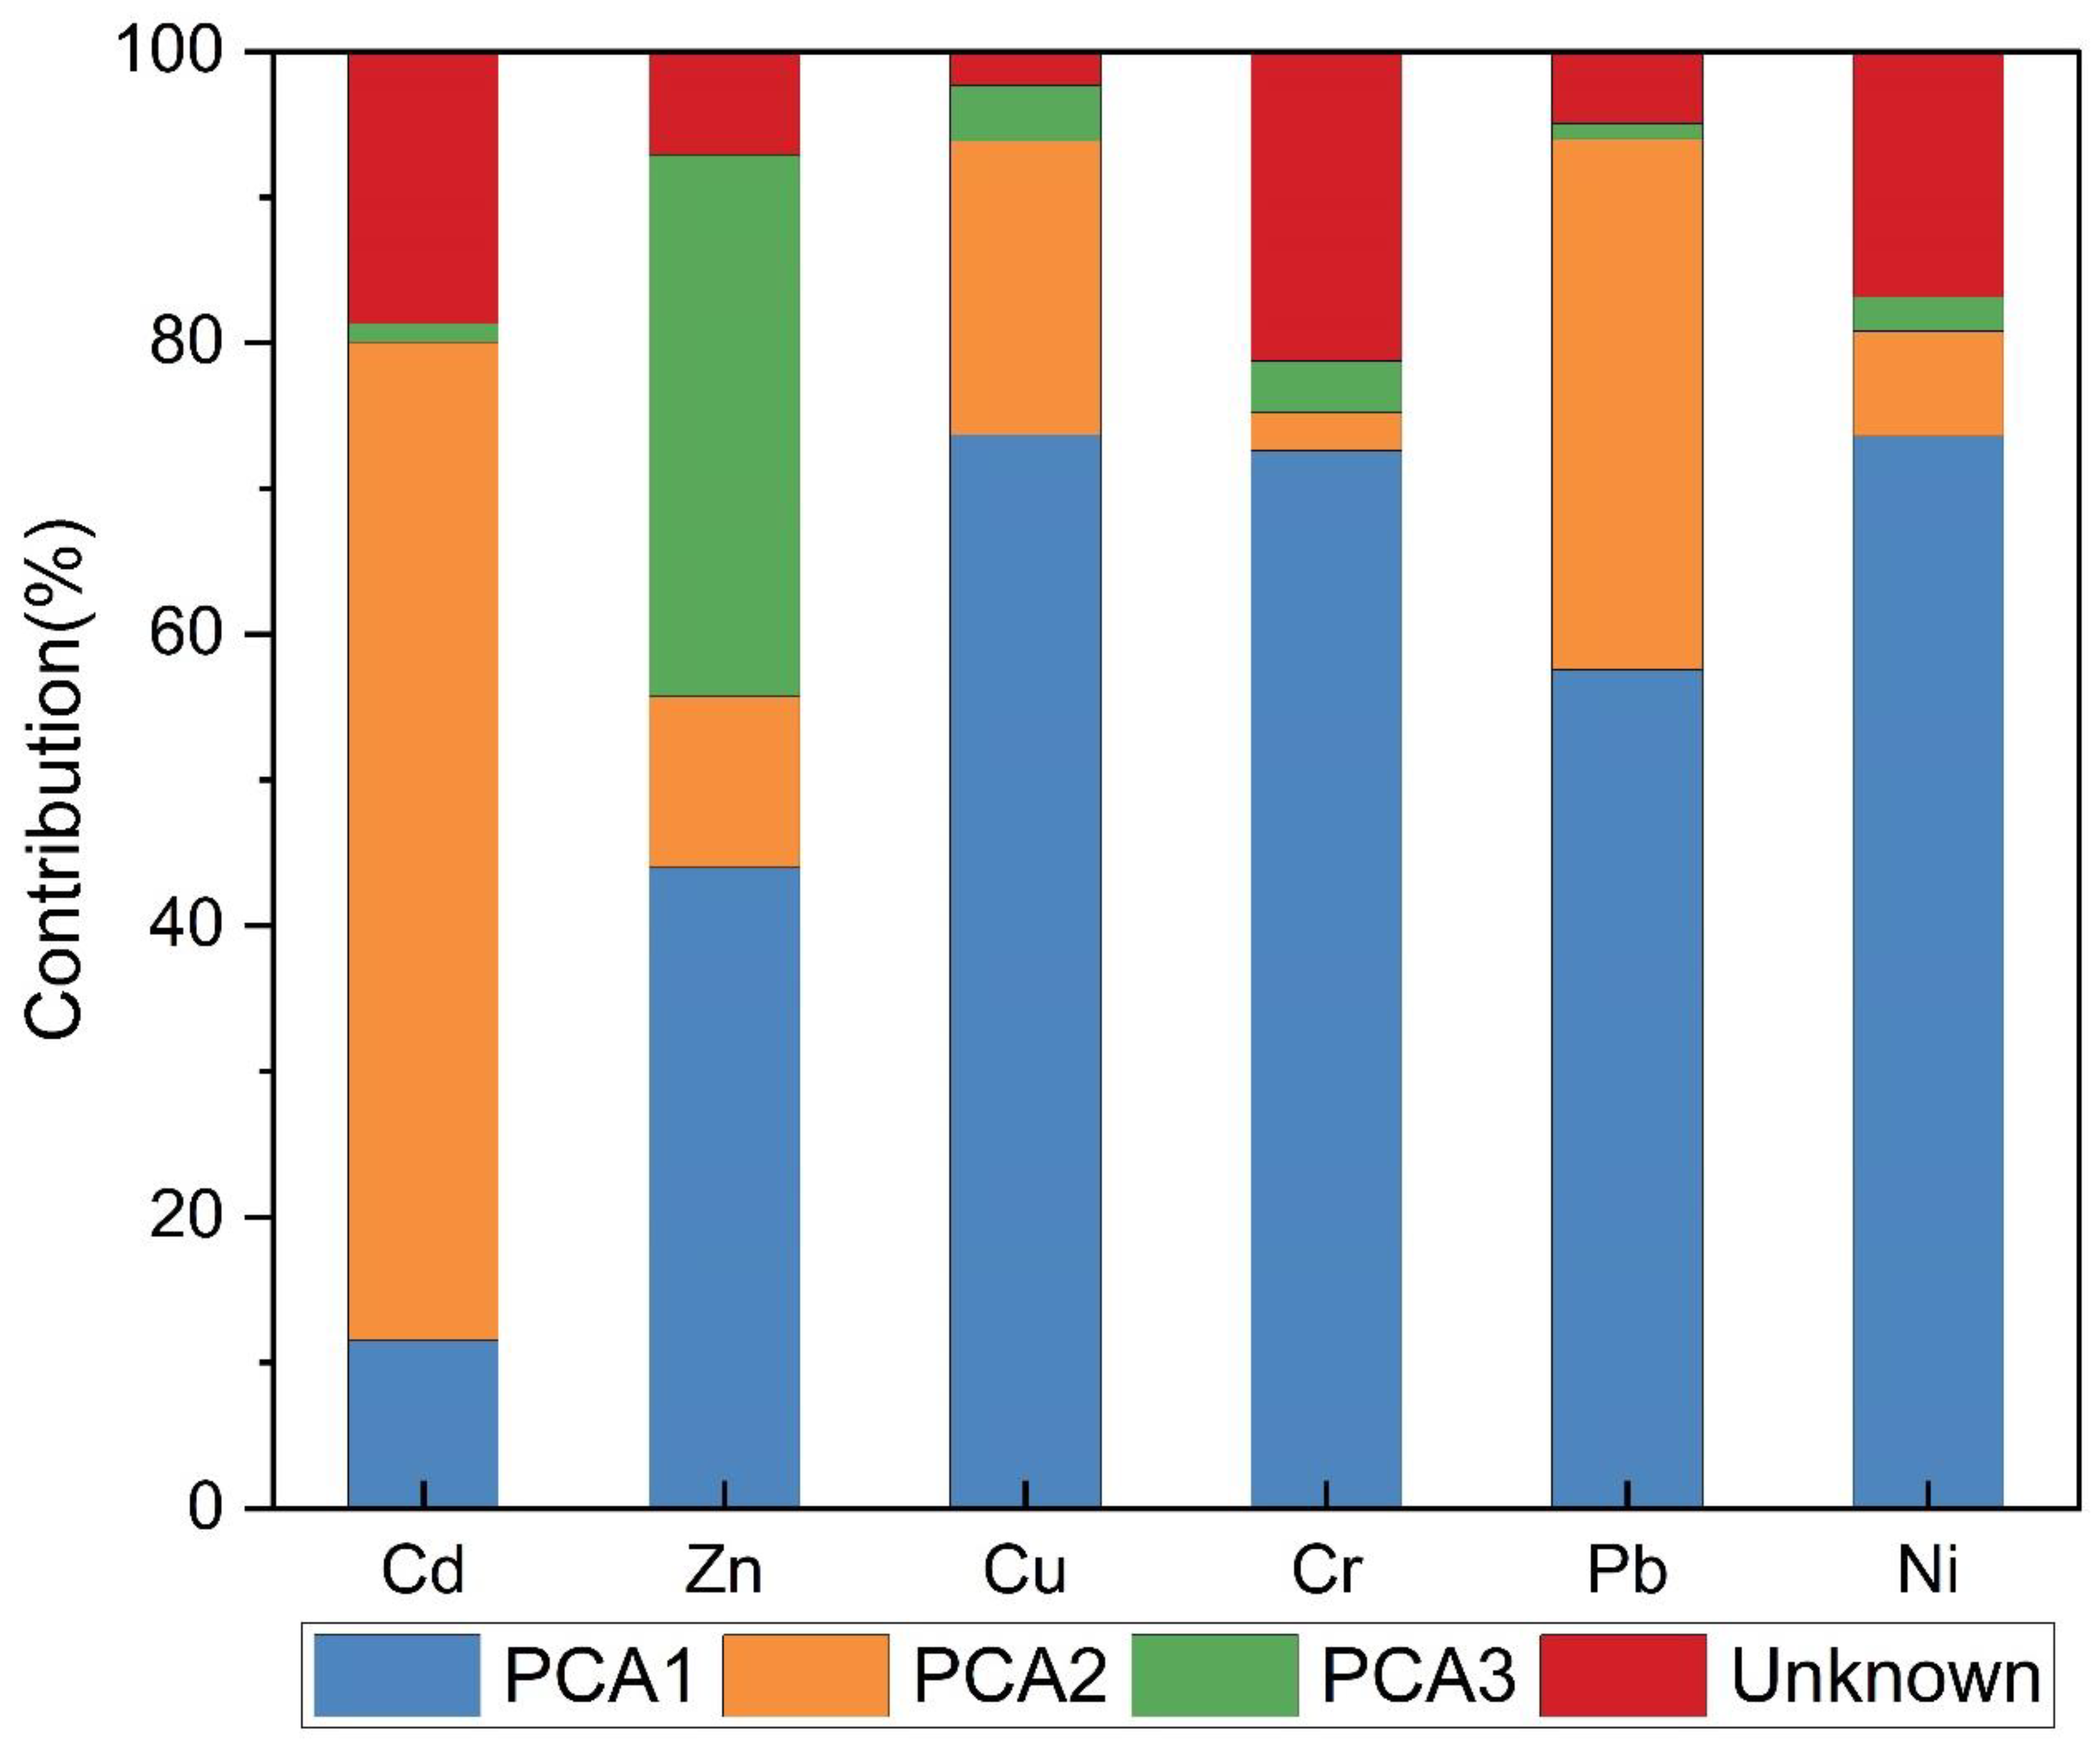
3.3.2. APCS-MLR Source Analysis

Quantitative calculation of pollution source contributions using the APCS-MLR receptor model revealed R2 values of 0.906, 0.997, 0.804, 0.916, 0.894, and 0.662 for Cd, Zn, Cu, Cr, Ni, and Pb, respectively. Except for Pb, all other HMs had R2 values greater than 0.8, and the ratios of predicted to actual concentrations for each heavy metal were close to 1 (Table S1), indicating a high accuracy in the source analysis results.
The contributions of each factor to the heavy metal elements are shown in Figure 3, including contributions from three pollution sources determined by PCA and one unknown pollution source. The contribution rates for PCA1, PCA2, PCA3, and the unknown source were 55.48%, 24.44%, 8.91%, and 11.86%, respectively.
The soil HMs Cu, Cr, Pb, and Ni in the study area were primarily influenced by natural factors, with contribution rates of 73.67%, 72.60%, 57.55%, and 73.59%, respectively. Additionally, the PCA1 explained the sources of some Zn and Cd in the study area. Studies have indicated that weathering of parent materials, such as carbonate rocks, can lead to the enrichment of Cd in surrounding soils [38]. Wang et al. found that natural parent materials contribute to Zn in the soils of the Huainan Luan Mining Area [39]. The PCA2, representing mining activities combined with mixed sources of coal gangue deposition, had the highest contribution rate to Cd, accounting for 68.52%. Furthermore, it contributed to the other HMs Zn, Cu, Cr, Ni, and Pb by 11.74%, 20.17%, 2.60%, 36.42%, and 7.20%, respectively. Mining activities can have various adverse effects on the surrounding environment and serve as a source of pollution for multiple HMs, including Zn, Cu, Cr, and Pb [40]. This explanation aligns well with the results of the PCA2 source contribution analysis in this study. The PCA3, representing the pollution source of agricultural activities, had a higher contribution to Zn, accounting for 37.18%. Additionally, the PCA3 had lower contributions to the other five HMs. The use of pesticides and fertilizers can lead to slight enrichment of Cd, Cu, Cr, and Ni in the soil [41,42]. Huainan Panji is one of the important power hubs, and coal-fired power generation may lead to the migration of HMs from coal to the surrounding soil. In addition, there is a provincial road in the study area with frequent traffic activities. Based on actual investigations and data collection around the study area, the unknown source might be related to coal combustion [43,44,45], automobile exhaust emissions [46,47,48], tire wear [49], and household waste (such as batteries) [50], which are potential sources of HMs according to previous studies.

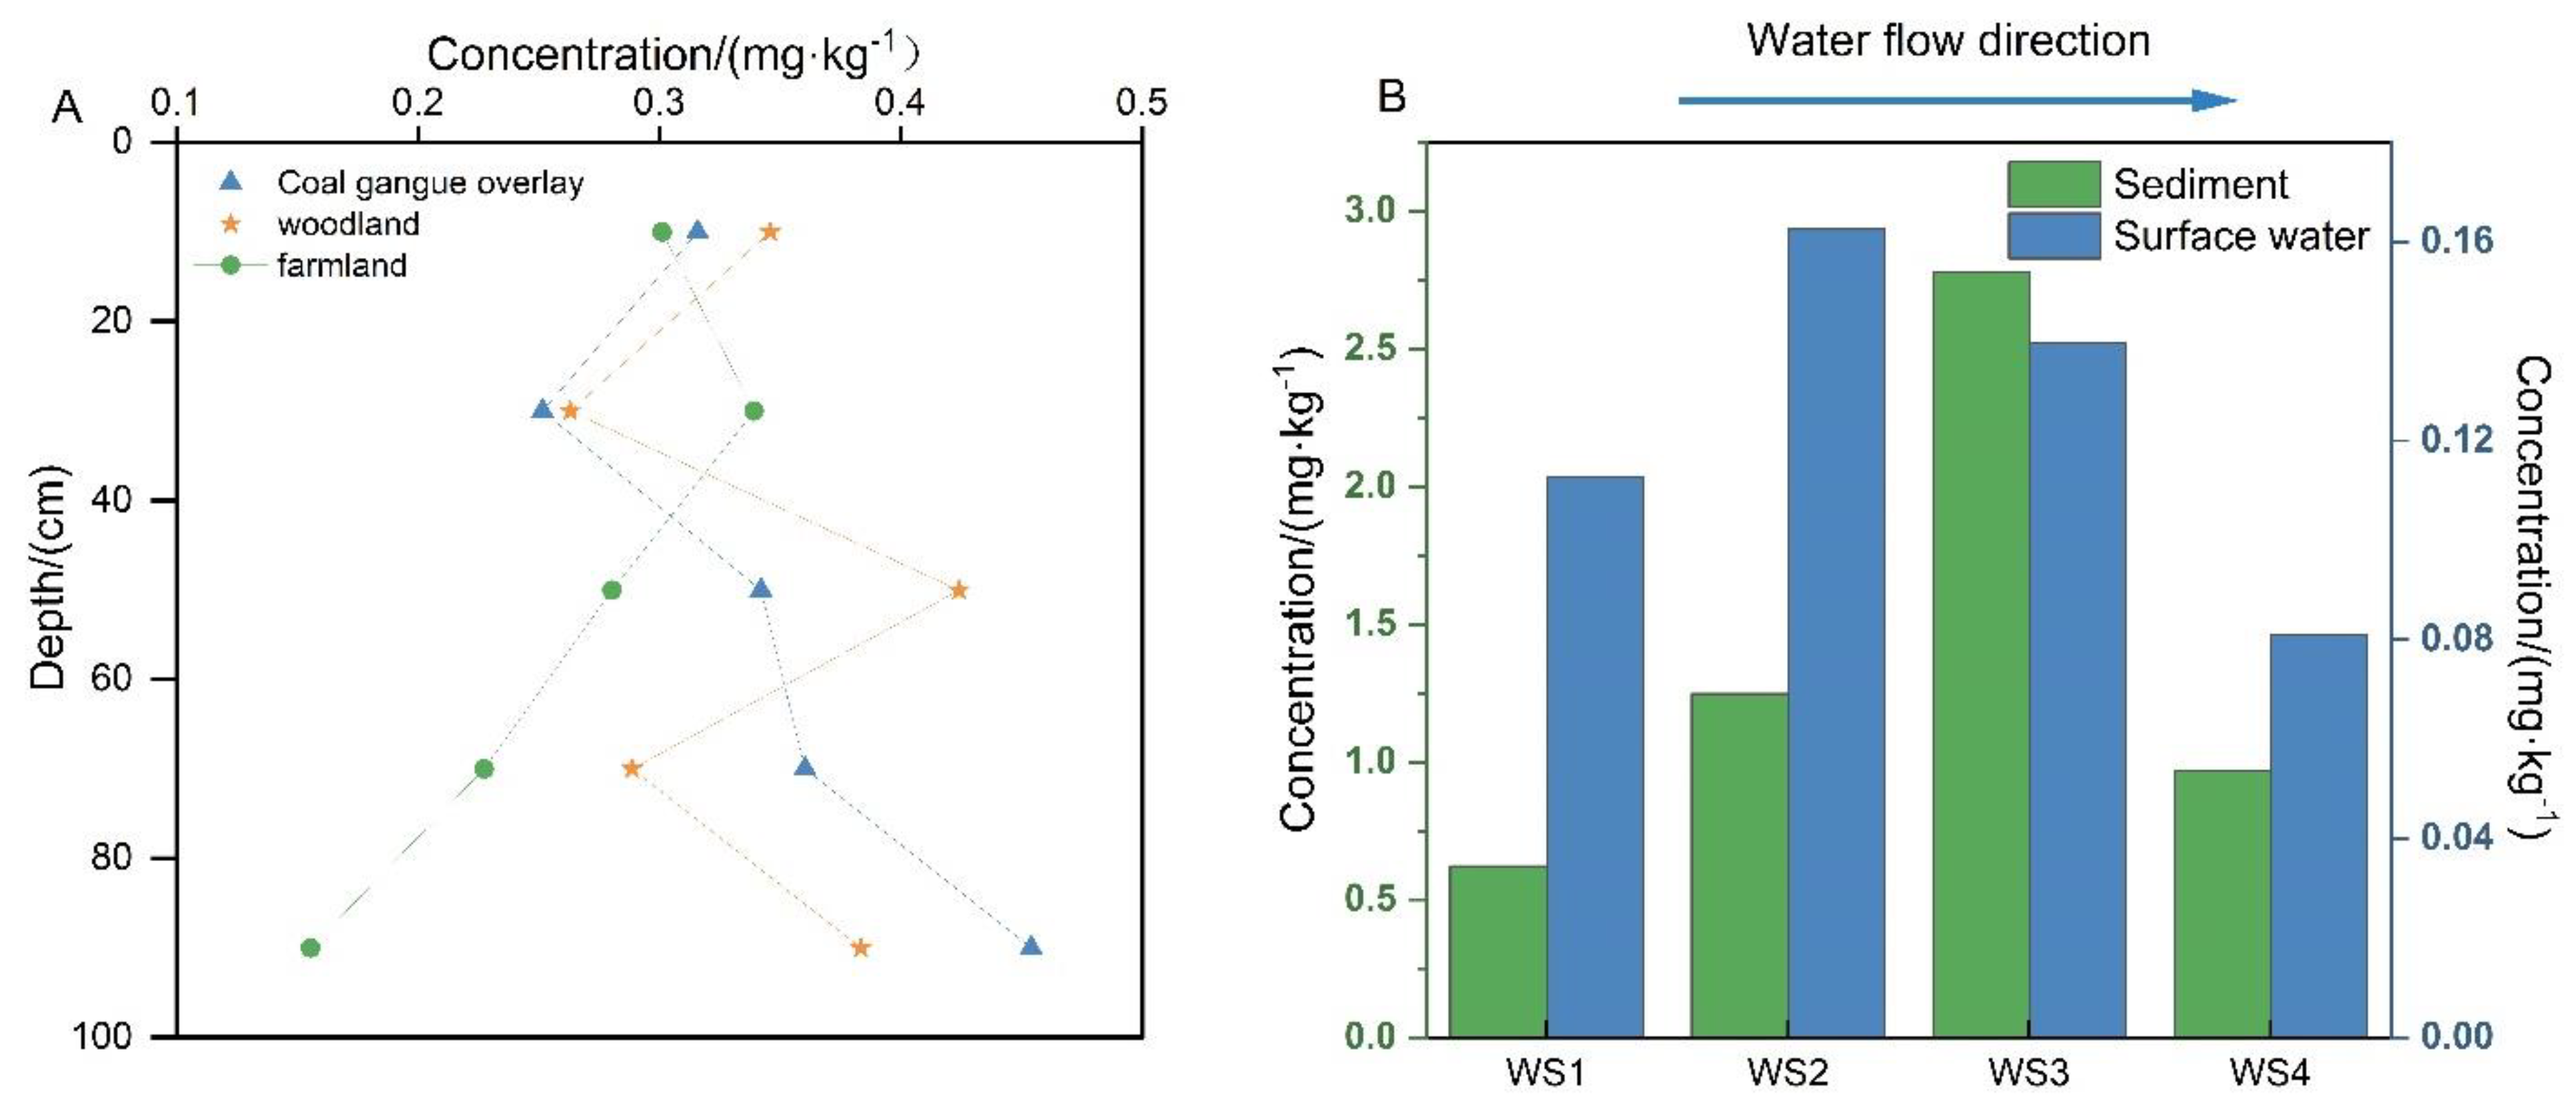
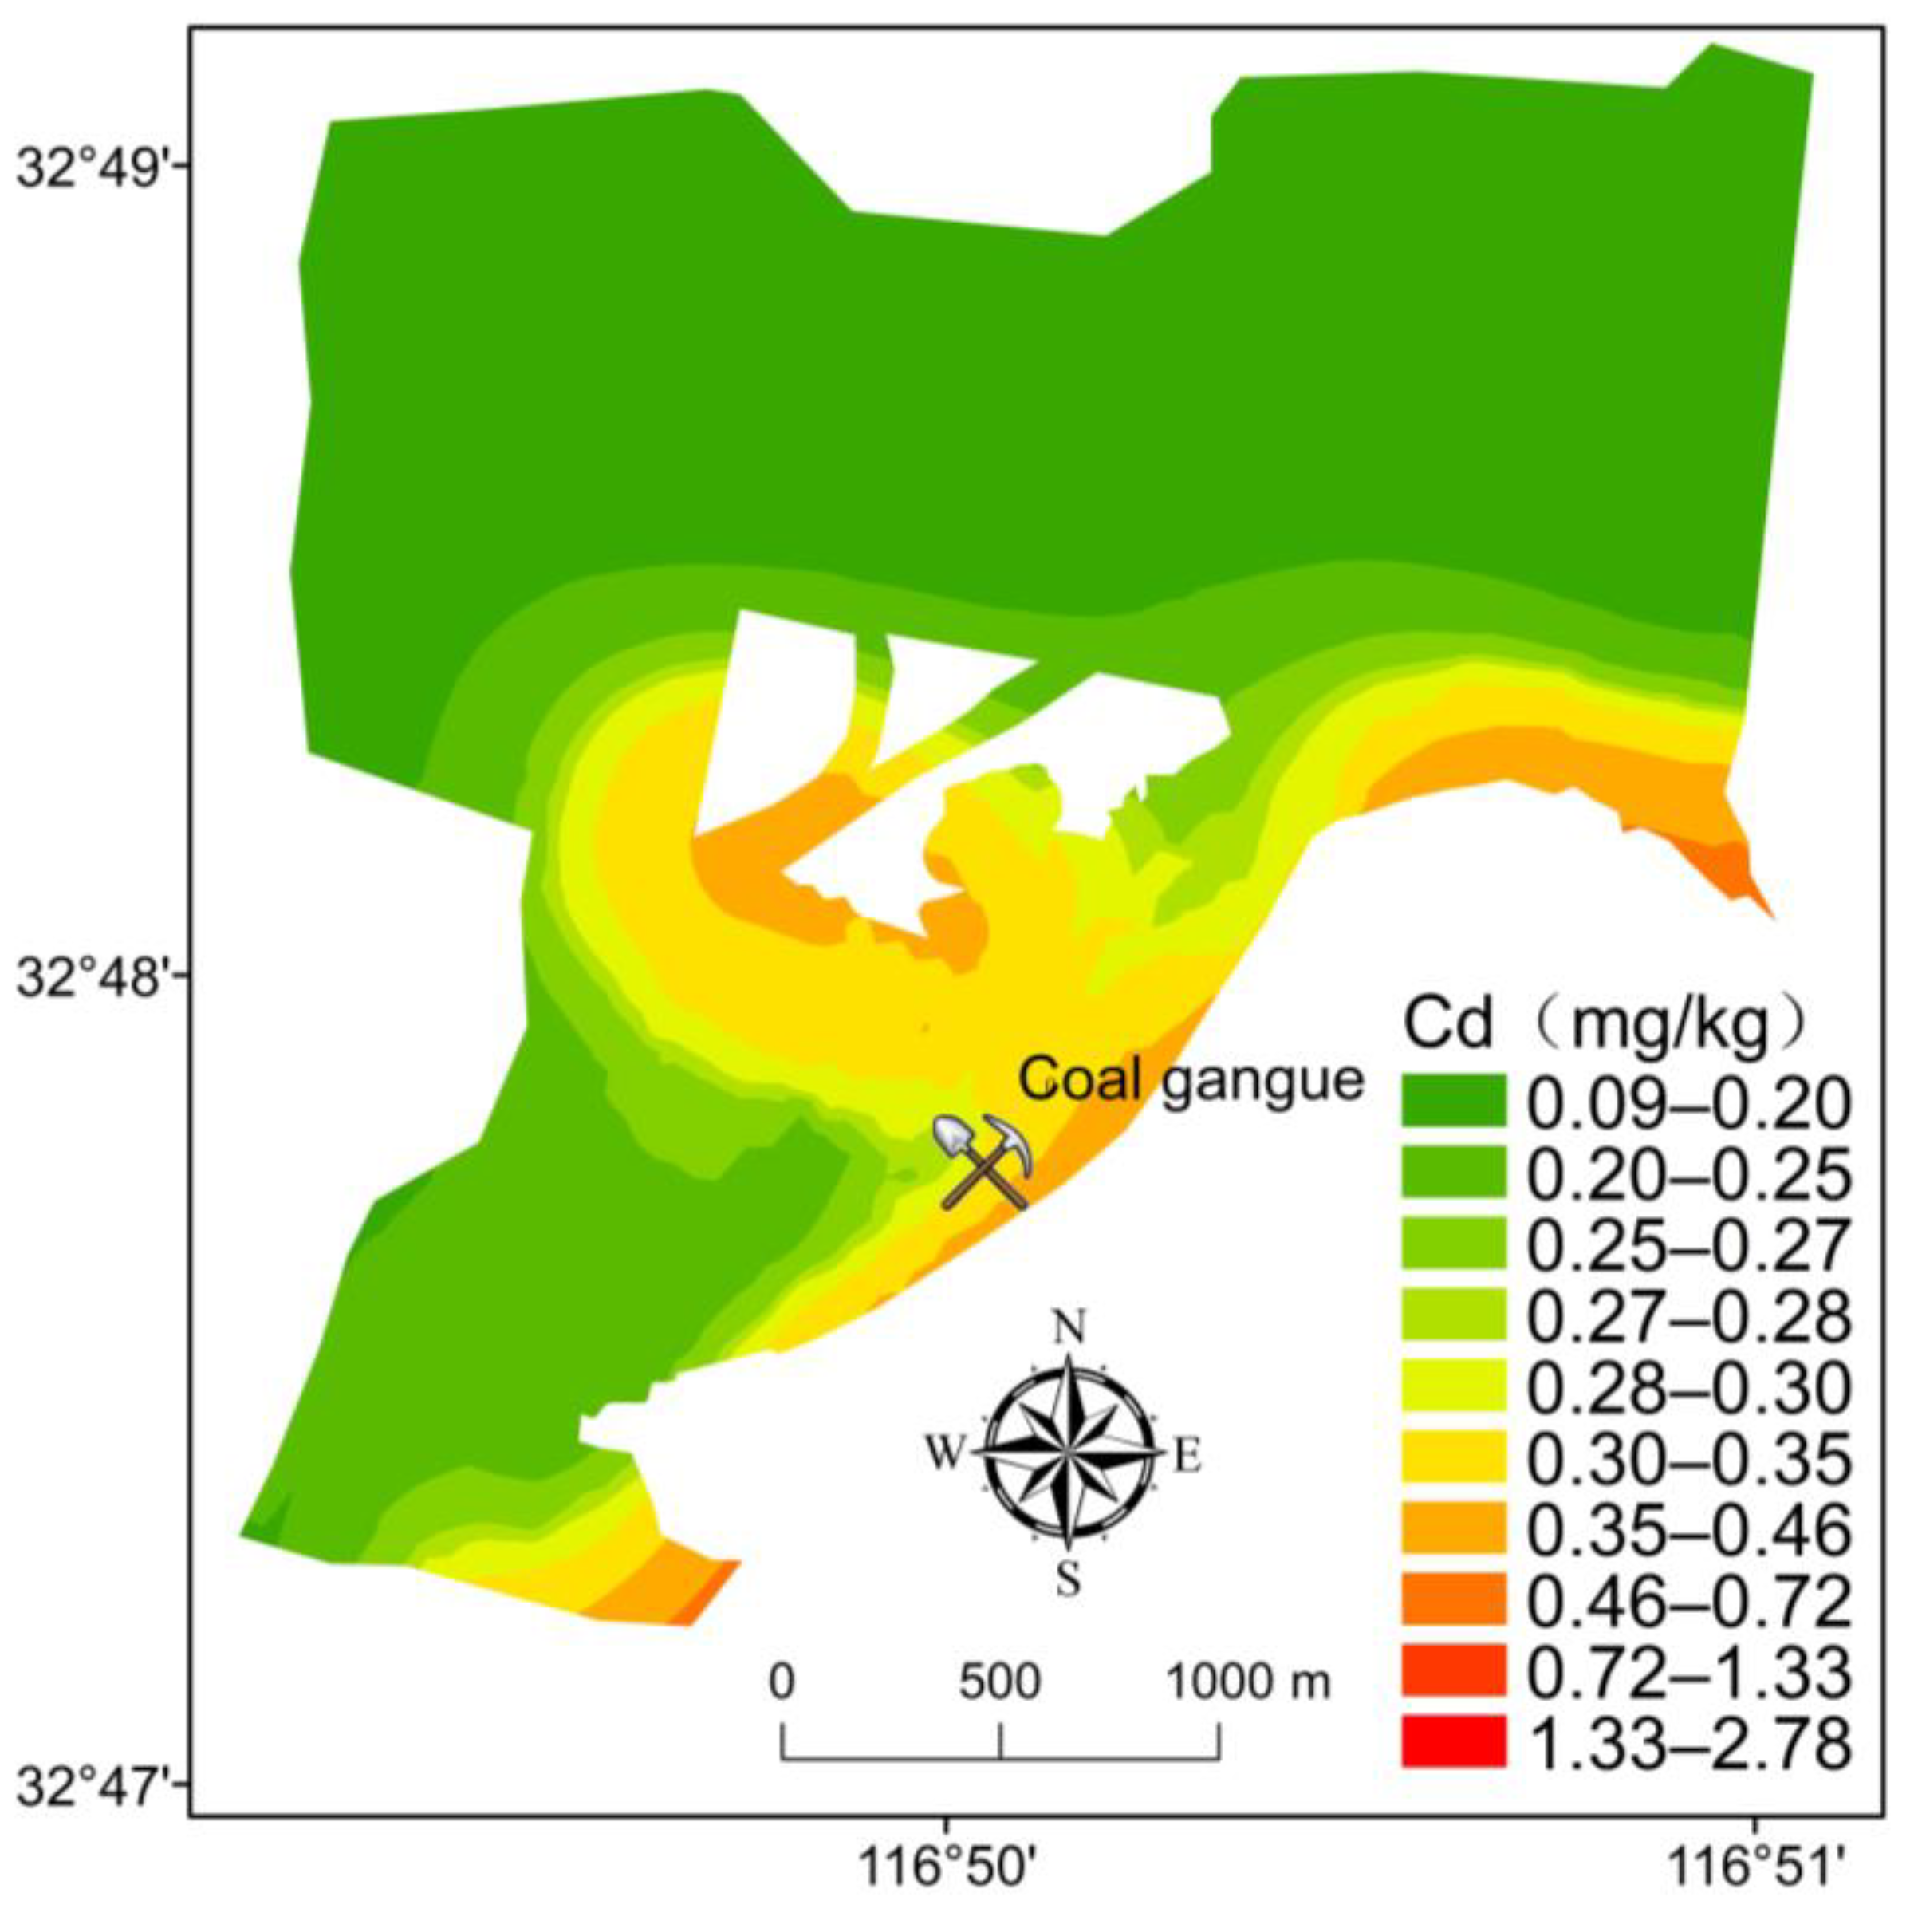
3.4. Cd Pollution Pathways and Migration Characteristics

Soil metal profile analysis is an effective method to study metal sources and pollution pathways. The research area is severely polluted by the heavy metal Cd, which has high biotoxicity compared to other HMs [51]. Therefore, special attention was given to the pollution pathways and migration characteristics of Cd in the research area. Figure 4A displays the variation in Cd content in three different land use areas in the research area, and its content was higher than in the local background values. The profile content variation trend of Cd was site-specific. The Cd content in the surface soil of the coal gangue mountain showed a trend of first decreasing and then increasing with the increase in profile depth. In the farmland area, the Cd content increased first and then decreased with the depth, while in the peripheral forest area of the coal gangue mountain, there was no regular change in Cd content. Compared with the depth of 20–40 cm, the surface Cd content in the coal gangue mountain and the peripheral forest areas is enriched to some extent, indicating the possible input through atmospheric deposition. After field visits, it was found that although the coal gangue accumulation area had undergone surface soil treatment, there were still exposed areas with coal gangue, and HMs could enter the soil through pathways such as atmospheric deposition [52]. A large number of gangue particles enter the surrounding soil through long-term wind action, causing heavy metal pollution [53]. It has been reported that atmospheric deposition is the main pathway for human input of HMs into the surface environment. In addition, the predicted spatial distribution of Cd (Figure 5) shows that Cd radiates from the gangue hills to the northwest (main wind direction), which well explains that atmospheric deposition is one of the pollution pathways of Cd in the study area.
Based on the tracing results, the contribution rate of agricultural sources to Cd input was low, the collected farmland soil samples also had higher Cd content than the local soil background values, and the spatial distribution map of heavy metal pollution shows that Cd pollution in farmland areas was more likely to be affected by non-point source pollution. Secondly, in the soil profile analysis, the Cd content in the farmland profile below 40 cm gradually decreased with the increase in depth and approached the background value. Therefore, other pollution pathways need to be considered for Cd pollution in farmland areas. The research area has developed water systems, and HMs in coal gangue can enter the surrounding water and then be input into the soil through irrigation. The irrigation water for farmland areas in the research area was mainly taken from the surrounding subsidence water bodies. The Cd content in sediments and water bodies of the main subsidence waters in the study area is shown in Figure 4B, and the Cd content in the collected surface water and sediment samples exceeded the standard according to the Environmental Quality Standard for Surface Waters (Grade III) and the background values of the reference sediments. Therefore, the Cd pollution in farmland areas may be influenced by the irrigation water pathway. This phenomenon may be related to plant root uptake due to the high tree and herb cover in forested areas [54,55]. It has been demonstrated that plants can recycle the heavy metal Cd from deeper soils to upper soils, resulting in a decrease in Cd levels at certain depths. This well explains the irregularity of the Cd profile distribution in forest soils [56].

4. Conclusions

The average concentrations of HMs Cd, Pb, Zn, Cu, Cr, and Ni in the soils of the study area were 4.55, 0.59, 1.54, 0.69, 0.59, and 0.71 times higher than the background values of the local soils, respectively. The exceedance rates of Cd and Zn were 44% and 8%, respectively, indicating serious problems of Cd and Zn pollution. The sources of HMs in the soil of the study area included pollution from mining activities, agricultural activities, natural matrix soil sources, and other sources, with average contributions of 55.48 percent, 24.44 percent, 8.91 percent, and 11.86 percent, respectively. The spatial distribution of Cd levels indicated that atmospheric deposition is one of the pollution pathways of Cd in the study area. In addition, the pattern of profile distribution of Cd and the investigation of surface water contamination showed that the farmland area was affected by irrigation water pathway to some extent. The irregular distribution of heavy metal Cd content in soil profiles in forest areas is related to the uptake effect of plant roots.

Supplementary Materials

The following supporting information can be downloaded at: https://www.mdpi.com/article/10.3390/min14010054/s1, Figure S1: Spatial distribution prediction map of Zn content in the research area; Table S1: Comparison of predicted and actual values of the APCS-MLR model; Table S2: APCS-MLR modeling heavy metal pollution source contributions.

Author Contributions

Y.C.: Methodology, formal analysis, software, formal analysis, writing—original draft, and visualization. J.Z.: Data curation, validation, and writing—review and editing. X.C.: Supervision. L.Z.: Conceptualization, resources, project administration, and funding acquisition. All authors have read and agreed to the published version of the manuscript.

Funding

This work was supported by the National Natural Science Foundation of China (Nos. 42277075 and 42072201) and the National Key Research and Development Program of China (2021YFC3201005).

Data Availability Statement

Data are contained within the article and supplementary materials.

Conflicts of Interest

The authors declare no conflicts of interest.

References

  1. You, M.; Hu, Y.; Wang, Z.; Zhang, W. Characterization and Ecological Risk Assessment of Toxic Metal Contaminants in the Soil Around the Coal Gangue Hill in Huainan, Central China. Water Air Soil Pollut. 2023, 234, 667. [Google Scholar] [CrossRef]
  2. Ouyang, Z.; Gao, L.; Yang, C.; Yang, C. Distribution, sources and influence factors of polycyclic aromatic hydrocarbon at different depths of the soil and sediments of two typical coal mining subsidence areas in Huainan, China. Ecotoxicol. Environ. Saf. 2018, 163, 255–265. [Google Scholar] [CrossRef]
  3. Xu, Z.; Qian, Y.; Hong, X.; Luo, Z.; Gao, X.; Liang, H. Contamination characteristics of polycyclic aromatic compounds from coal sources in typical coal mining areas in Huaibei area, China. Sci. Total Environ. 2023, 873, 162311. [Google Scholar] [CrossRef] [PubMed]
  4. Jiang, X.; Lu, W.; Zhao, H.; Yang, Q.; Yang, Z. Potential ecological risk assessment and prediction of soil heavy-metal pollution around coal gangue dump. Nat. Hazards Earth Syst. Sci. 2014, 14, 1599–1610. [Google Scholar] [CrossRef]
  5. Xu, J.; Gui, H.; Chen, J.; Li, C.; Li, Y.; Zhao, C.; Guo, Y. A combined model to quantitatively assess human health risk from different sources of heavy metals in soils around coal waste pile. Hum. Ecol. Risk Assess. 2021, 27, 2235–2253. [Google Scholar] [CrossRef]
  6. Hu, Y.; You, M.; Liu, G.; Dong, Z. Characteristics and potential ecological risks of heavy metal pollution in surface soil around coal-fired power plant. Environ. Earth Sci. 2021, 80, 566. [Google Scholar] [CrossRef]
  7. Ayomi, J.; Prasanna, E.; Godwin, A.A.; Ashantha, G. Assessment of ecological and human health risks of metals in urban road dust based on geochemical fractionation and potential bioavailability. Sci. Total Environ. 2018, 635, 1609–1619. [Google Scholar]
  8. Yang, S.; He, M.; Zhi, Y.; Scott, X.C.; Gu, B.; Liu, X.; Xu, J. An integrated analysis on source-exposure risk of heavy metals in agricultural soils near intense electronic waste recycling activities. Environ. Int. 2019, 133, 105239. [Google Scholar] [CrossRef]
  9. Ngole-Jeme, V.M.; Fantke, P. Ecological and human health risks associated with abandoned gold mine tailings contaminated soil. PLoS ONE 2017, 12, e0172517. [Google Scholar] [CrossRef]
  10. Qi, M.; Wu, Y.; Zhang, S.; Li, G.; An, T. Pollution Profiles, Source Identification and Health Risk Assessment of Heavy Metals in Soil near a Non-Ferrous Metal Smelting Plant. Int. J. Environ. Res. Public Health 2023, 20, 1004. [Google Scholar] [CrossRef]
  11. George, M. Unravelling the impact of potentially toxic elements and biochar on soil: A review. Environ. Chall. 2022, 8, 100540. [Google Scholar] [CrossRef]
  12. Yang, F.; Yun, Y.; Li, G.; Sang, N. Heavy metals in soil from gangue stacking areas increase children’s health risk and cause developmental neurotoxicity in zebrafish larvae. Sci. Total Environ. 2021, 794, 148629. [Google Scholar] [CrossRef] [PubMed]
  13. Long, Z.; Huang, Y.; Zhang, W.; Shi, Z.; Yu, D.; Chen, Y.; Liu, C.; Wang, R. Effect of different industrial activities on soil heavy metal pollution, ecological risk, and health risk. Environ. Monit. Assess. 2021, 193, 20. [Google Scholar] [CrossRef] [PubMed]
  14. Birke, M.; Reimann, C.; Rauch, U.; Ladenberger, A.; Demetriades, A.; Jähne-Klingberg, F.; Oorts, K.; Gosar, M.; Dinelli, E.; Halamić, J.; et al. GEMAS: Cadmium distribution and its sources in agricultural and grazing land soil of Europe—Original data versus clr-transformed data. J. Geochem. Explor. 2017, 173, 13–30. [Google Scholar] [CrossRef]
  15. Hu, S.; Chen, X.; Jing, F.; Liu, W.; Wen, X. An assessment of spatial distribution and source identification of five toxic heavy metals in Nanjing, China. Environ. Eng. Res. 2020, 26, 200135. [Google Scholar] [CrossRef]
  16. Araújo, D.F.; Knoery, J.; Briant, N.; Vigier, N.; Ponzevera, E. “Non-traditional” stable isotopes applied to the study of trace metal contaminants in anthropized marine environments. Mar. Pollut. Bull. 2022, 175, 113398. [Google Scholar] [CrossRef] [PubMed]
  17. Wang, L.; Jin, Y.; Weiss, D.J.; Schleicher, N.J.; Wolfgang, W.; Wu, L.; Guo, Q.; Chen, J.; David, O.C.; Hou, D. Possible application of stable isotope compositions for the identification of metal sources in soil. J. Hazard. Mater. 2021, 407, 124812. [Google Scholar] [CrossRef]
  18. Yin, X.; Wei, R.; Chen, H.; Zhu, C.; Liu, Y.; Wen, H.; Guo, Q.; Ma, F. Cadmium isotope constraints on heavy metal sources in a riverine system impacted by multiple anthropogenic activities. Sci. Total Environ. 2021, 750, 141233. [Google Scholar] [CrossRef]
  19. Li, W.; Gou, W.; Li, W.; Zhang, T.; Yu, B.; Liu, Q.; Shi, J. Environmental applications of metal stable isotopes: Silver, mercury and zinc. Environ. Pollut. 2019, 252, 1344–1356. [Google Scholar] [CrossRef]
  20. Men, C.; Liu, R.; Xu, L.; Wang, Q.; Guo, L.; Miao, Y.; Shen, Z. Source-specific ecological risk analysis and critical source identification of heavy metals in road dust in Beijing, China. J. Hazard. Mater. 2020, 388, 121763. [Google Scholar] [CrossRef]
  21. Yao, C.; Shen, Z.; Wang, Y.; Mei, N.; Li, C.; Liu, Y.; Ma, W.; Zhang, C.; Wang, D. Tracing and quantifying the source of heavy metals in agricultural soils in a coal gangue stacking area: Insights from isotope fingerprints and receptor models. Environ. Chall. 2023, 863, 160882. [Google Scholar] [CrossRef] [PubMed]
  22. Yan, Y.; Zhang, X.W.; Guo, B.L. Applications of lead-cadmium-zinc-mercury stable isotopes in source identification of heavy metal pollutions. Environ. Chem. 2020, 39, 2712–2721. [Google Scholar]
  23. Shi, T.; Zhang, J.; Shen, W.; Wang, J.; Li, X. Machine learning can identify the sources of heavy metals in agricultural soil: A case study in northern Guangdong Province, China. Ecotoxicol. Environ. Saf. 2022, 245, 114107. [Google Scholar] [CrossRef] [PubMed]
  24. Zhang, M.; Wang, M.; Chen, W.; Niu, J. Characteristics and Inputs of Cd Contamination in Paddy Soils in Typical Mining and Industrial Areas in Youxian County, Hunan Province. Chin. J. Envir. Sci. 2015, 36, 1425–1430. [Google Scholar]
  25. An, S.; Jiang, C.; Zhang, W.; Chen, X.; Zheng, L. Influencing factors of the hydrochemical characteristics of surface water and shallow groundwater in the subsidence area of the Huainan Coalfield. Arab. J. Geosci. 2020, 13, 191. [Google Scholar] [CrossRef]
  26. Xiong, H.; Hu, H.; Wang, Z.; Wang, X. Research on distribution characteristics and pollution source of heavy metal pollution in soil in Huainan coal mining area. J. Hefei Univ. Technol. 2015, 38, 686–693. [Google Scholar]
  27. Soil Environmental Quality Risk Control Standard for Soil Contamination of Agricultural Land. Available online: https://www.mee.gov.cn/ywgz/fgbz/bz/bzwb/trhj/201807/t20180703_446029.shtml (accessed on 27 December 2023).
  28. Liu, X.; Gao, W.; Wei, T.; Dong, Z.; Shao, Y. Distribution characteristics of heavy metals in Tibetan Plateau surface soils and its significance for source tracing of heavy metal deposition in surrounding glacial areas. Chin. Environ. Sci. Available online: https://kns.cnki.net/kcms2/article/abstract?v=OHSidZhWKUmKwDaksBwOJc6bFH5cgSbuUbZTRY0hZTybFwg2_BbZallOaUDbgxUkJ2N2WMREjdlOjp68wu95HoworTZ1HfCAraKEtojkaEMUquMMWeRc6YkBmxHlCaINKCFncfLPIkM=&uniplatform=NZKPT&language=CHS (accessed on 27 December 2023). [CrossRef]
  29. Chen, L.; Ma, K.; Ma, J.; Wang, J.; Li, H.; Jia, B.; Ni, X.; Ma, J.; Liang, X. Risk Assessment and Sources of Heavy Metals in Farmland Soils of Yellow River Irrigation Area of Ningxia. Envir. Sci. 2023, 44, 356–366. [Google Scholar]
  30. Liu, H.; Zhang, Y.; Yang, J.; Wang, H.; Li, Y.; Shi, Y.; Li, D.; Holm, P.E.; Ou, Q.; Hu, W. Quantitative source apportionment, risk assessment and distribution of heavy metals in agricultural soils from southern Shandong Peninsula of China. Sci. Total Environ. 2021, 767, 144879. [Google Scholar] [CrossRef]
  31. Wang, Y.; Zhang, L.; Wang, J.; Lv, J. Identifying quantitative sources and spatial distributions of potentially toxic elements in soils by using three receptor models and sequential indicator simulation. Chemosphere 2020, 242, 125266. [Google Scholar] [CrossRef]
  32. Jiang, S.; Luo, J.; Ye, Y.; Yang, G.; Pi, W.; He, W. Using Pb Isotope to Quantify the Effect of Various Sources on Multi-Metal Polluted soil in Guiyu. Bull. Environ. Contam. Toxicol. 2019, 102, 413–418. [Google Scholar] [CrossRef] [PubMed]
  33. Punia, A.; Siddaiah, N.S.; Singh, S.K. Source and Assessment of Metal Pollution at Khetri Copper Mine Tailings and Neighboring Soils, Rajasthan, India. Bull. Environ. Contam. Toxicol. 2017, 99, 633–641. [Google Scholar] [CrossRef] [PubMed]
  34. Liu, Y.; Xia, Y.; Wang, Z.; Gao, T.; Zhu, J.; Qi, M.; Sun, J.; Liu, C. Lithologic controls on the mobility of Cd in mining-impacted watersheds revealed by stable Cd isotopes. Water Res. 2022, 220, 118619. [Google Scholar] [CrossRef] [PubMed]
  35. Ma, J.; Shen, Z.; Wang, S.; Deng, L.; Sun, J.; Liu, P.; She, Z. Source apportionment of heavy metals in soils around a coal gangue heap with the APCS-MLR and PMF receptor models in Chongqing, southwest China. J. Mt. Sci. 2023, 20, 1061–1073. [Google Scholar] [CrossRef]
  36. Jiang, Y.; Chao, S.; Liu, J.; Yang, Y.; Chen, Y.; Zhang, A.; Cao, H. Source apportionment and health risk assessment of heavy metals in soil for a township in Jiangsu Province, China. Chemosphere 2017, 168, 1658–1668. [Google Scholar] [CrossRef] [PubMed]
  37. Alengebawy, A.; Abdelkhalek, S.T.; Qureshi, S.R.; Wang, M. Heavy Metals and Pesticides Toxicity in Agricultural Soil and Plants: Ecological Risks and Human Health Implications. Toxics 2021, 9, 42. [Google Scholar] [CrossRef]
  38. Liao, R.; Ratié, G.; Shi, Z.; Sipkova, A.; Vankova, Z.; Chrastny, V.; Zhang, J.; Komarek, M. Cadmium isotope systematics for source apportionment in an urban–rural region. Appl. Geochem. 2022, 137, 105196. [Google Scholar] [CrossRef]
  39. Wang, D.; Zheng, L.; Ren, M.; Li, C.; Dong, X.; Wei, X.; Zhou, W.; Cui, J. Zinc in Soil Reflecting the Intensive Coal Mining Activities: Evidence from Stable Zinc Isotopes Analysis. Ecotoxicol. Environ. Saf. 2022, 239, 113669. [Google Scholar] [CrossRef]
  40. Liu, B.; Jiang, S.; Guan, D.; Song, X.; Li, Y.; Zhou, S.; Wang, B.; Gao, B. Geochemical fractionation, bioaccessibility and ecological risk of metallic elements in the weathering profiles of typical skarn-type copper tailings from Tongling, China. Sci. Total Environ. 2023, 894, 164859. [Google Scholar] [CrossRef]
  41. Kubier, A.; Wilkin, R.T.; Pichler, T. Cadmium in soils and groundwater: A review. Appl. Geochem. 2019, 108, 104388. [Google Scholar] [CrossRef]
  42. Su, C.; Wang, J.; Chen, Z.; Meng, J.; Yin, G.; Zhou, Y.; Wang, T. Sources and health risks of heavy metals in soils and vegetables from intensive human intervention areas in South China. Sci. Total Environ. 2023, 857, 159389. [Google Scholar] [CrossRef] [PubMed]
  43. Jia, J.; Xiao, B.; Yu, Y.; Zou, Y.; Yu, T.; Jin, S.; Ma, Y.; Gao, X.; Li, X. Heavy metal levels in the soil near typical coal-fired power plants: Partition source apportionment and associated health risks based on PMF and HHRA. Environ. Monit. Assess. 2023, 195, 207. [Google Scholar] [CrossRef] [PubMed]
  44. Chen, J.; Zhang, B.; Zhang, S.; Zeng, J.; Chen, P.; Liu, W.; Wang, X. A complete atmospheric emission inventory of F, As, Se, Cd, Sb, Hg, Pb, and U from coal-fired power plants in Anhui Province, eastern China. Environ. Geochem. Health 2021, 43, 1817–1837. [Google Scholar] [CrossRef] [PubMed]
  45. Deng, W.; Li, X.; An, Z.; Yang, L. The occurrence and sources of heavy metal contamination in peri-urban and smelting contaminated sites in Baoji, China. Environ. Monit. Assess. 2016, 188, 251. [Google Scholar] [CrossRef] [PubMed]
  46. Wang, J.; Yu, D.; Wang, Y.; Du, X.; Li, G.; Li, B.; Zhao, Y.; Wei, Y.; Xu, S. Source analysis of heavy metal pollution in agricultural soil irrigated with sewage in Wuqing, Tianjin. Sci. Rep. 2021, 11, 17816. [Google Scholar] [CrossRef] [PubMed]
  47. Yu, D.; Wang, J.; Wang, Y.; Du, X.; Li, G.; Li, B. Identifying the Source of Heavy Metal Pollution and Apportionment in Agricultural Soils Impacted by Different Smelters in China by the Positive Matrix Factorization Model and the Pb Isotope Ratio Method. Sustainability 2021, 13, 6526. [Google Scholar] [CrossRef]
  48. Zhang, X.; Yan, Y.; Wadood, S.A.; Sun, Q.; Guo, B. Source apportionment of cadmium pollution in agricultural soil based on cadmium isotope ratio analysis. Appl. Geochem. 2020, 123, 104776. [Google Scholar] [CrossRef]
  49. Zhao, D.; Wu, Q.; Zheng, G.; Zeng, Y.; Wang, H.; Mei, A.; Gao, S.; Zhang, X.; Zhang, Y. Quantitative Source Apportionment and Uncertainty Analysis of Heavy Metal(loid)s in the Topsoil of the Nansi Lake Nature Reserve. Sustainability 2022, 14, 6679. [Google Scholar] [CrossRef]
  50. Clemens, S.; Aarts, M.G.M.; Thomine, S.; Verbruggen, N. Plant science: The key to preventing slow cadmium poisoning. Trends Plant Sci. 2013, 18, 92–99. [Google Scholar] [CrossRef]
  51. Huang, J.; Wu, Y.; Sun, J.; Li, X.; Geng, X.; Zhao, M.; Sun, T.; Fan, Z. Health risk assessment of heavy metal(loid)s in park soils of the largest megacity in China by using Monte Carlo simulation coupled with Positive matrix factorization model. J. Hazard. Mater. 2021, 415, 125629. [Google Scholar] [CrossRef]
  52. Qin, M.; Jin, Y.; Peng, T.; Zhao, B.; Hou, D. Heavy metal pollution in Mongolian-Manchurian grassland soil and effect of long-range dust transport by wind. Environ. Int. 2023, 177, 108019. [Google Scholar] [CrossRef] [PubMed]
  53. Shang, Y.; Sang, N. Characteristics of heavy metal contamination in soil and plant toxicity in the vicinity of a coal gangue pile. Environ. Sci. 2022, 43, 3773–3780. [Google Scholar]
  54. Wei, S.; Teixeira da Silva, J.A.; Zhou, Q. Agro-improving method of phytoextracting heavy metal contaminated soil. J. Hazard. Mater. 2008, 150, 662–668. [Google Scholar] [CrossRef] [PubMed]
  55. Cai, Z.; Lei, S.; Zhao, Y.; Gong, C.; Wang, W.; Du, C. Spatial Distribution and Migration Characteristics of Heavy Metals in Grassland Open-Pit Coal Mine Dump Soil Interface. Int. J. Environ. Res. Public Health 2022, 19, 4441. [Google Scholar] [CrossRef]
  56. Imseng, M.; Wiggenhauser, M.; Keller, A.; Müller, M.; Rehkämper, M.; Murphy, K.; Kreissig, K.; Frossard, E.; Wilcke, W.; Bigalke, M. Fate of Cd in Agricultural Soils: A Stable Isotope Approach to Anthropogenic Impact, Soil Formation, and Soil-Plant Cycling. Environ. Sci. Technol. 2018, 52, 1919–1928. [Google Scholar] [CrossRef]
Figure 1. Map of sampling sites.
Minerals 14 00054 g001
Figure 2. SOM map of heavy metal content of soil.
Minerals 14 00054 g002
Figure 3. APCS-MLR pollution source contribution rates.
Minerals 14 00054 g003
Figure 4. (A) Variation in Cd content in different regional profiles; (B) Cd content in surface water and sediments of the subsidence area in the research area.
Minerals 14 00054 g004
Figure 5. Spatial distribution prediction map of Cd content in the research area.
Minerals 14 00054 g005
Table 1. Descriptive statistics of heavy metal content in the study area.
CdZnCuCrPbNi
Min0.09525.374.7413.15.306.26
Max0.581564.0032.5756.939.7827.10
Mean0.277124.5216.7238.1518.0218.26
Standard deviation0.09794.376.2311.946.365.80
Coefficient of variation (%)35.1375.7937.2331.2935.2731.76
Background value 10.06180.824.264.930.525.47
1 Data published by the Anhui Environmental Monitoring Center (1992).
Table 2. Principal component analysis matrix of soil HMs in the study area.
HMPCA1PCA2PCA3
Cd0.1310.9430.067
Zn0.2330.0750.968
Cu0.8340.2750.213
Cr0.9320.040.225
Pb0.6560.4990.06
Ni0.9310.110.146
Initial Eigenvalues3.5550.9230.752
Cumulative Variance (%)59.24474.62887.153
Disclaimer/Publisher’s Note: The statements, opinions and data contained in all publications are solely those of the individual author(s) and contributor(s) and not of MDPI and/or the editor(s). MDPI and/or the editor(s) disclaim responsibility for any injury to people or property resulting from any ideas, methods, instructions or products referred to in the content.

