Article

Infrared and Raman Spectroscopy of Mullite Ceramics Synthesized from Fly Ash and Kaolin

Department of Chemistry and Physico-Chemical Processes, Faculty of Materials Science and Technology, VŠB-Technical University of Ostrava, 17. listopadu 2172/15, 708 00 Ostrava, Czech Republic
Minerals 2023, 13(7), 864; https://doi.org/10.3390/min13070864
Submission received: 22 May 2023 / Revised: 19 June 2023 / Accepted: 22 June 2023 / Published: 26 June 2023
(This article belongs to the Special Issue Clay Minerals and Waste Fly Ash Ceramics, Volume II)

Abstract

:
Infrared spectroscopy and Raman spectroscopy were used to characterize mullite ceramics prepared from fly ash and kaolin by annealing at 1000 °C, 1100 °C, 1200 °C, and 1300 °C. IR spectroscopy confirmed the presence of SiO4 tetrahedra and AlO6 octahedra in samples. The presence of mullite has been confirmed at all temperatures. The presence of quartz has been confirmed up to a temperature of 1100 °C, and the presence of an amorphous form of SiO2 has been confirmed at temperatures of 1200 °C and 1300 °C. The transformation of quartz into the amorphous form of SiO2 at temperatures above 1100 °C is assumed. Transformation was performed on the percentage intensity decrease of the bending vibration of Si-O-Si (at about 450 cm−1) and Al-O-Si (at about 550 cm−1). Raman spectroscopy confirmed the presence of mullite at different stages of structural ordering (a well-ordered structure at a temperature of 1100 °C and a disordered structure at a temperature of 1300 °C).

1. Introduction

Fly ash (FA) is one of the byproducts obtained from burning coal at power plants; other byproducts include, for example, bottom ash and boiler slag. Fly ash is a well-defined inorganic dust composed of spherical glassy particles [1], which are formed as oxidic products of coal combustion from minerals present in coal [2].
Fly ash has a similar chemical and mineralogical composition as traditional ceramic raw materials and is a frequently used ingredient in ceramics [3]. Typical architectural ceramics contain three main components: filler (e.g., quartz), binder (e.g., clay), and fluxing agent (e.g., feldspars) [4]. Fly ash (as a high-temperature product) does not have the plasticity of a clay binder [5]; therefore, a mixture of fly ash and kaolin is used. Kaolins generally contain kaolinite (about 75% w/w) and accompanying minerals from original rocks (as quartz, muscovite, illite, or feldspar) [6]. During thermal treatment, kaolinite transforms directly into mullite at temperatures below 900 °C [7].
From a mineralogical point of view, fly ash contains crystalline and amorphous (glassy) components. The main oxide components of FA are SiO2, Al2O3, Fe2O3, CaO, MgO, Na2O, and K2O, and the crystalline phases are mullite (3Al2O3·2SiO2) and quartz (SiO2) [8]. The glassy phases have been characterized as high-silica glass and calcium aluminate glass [1]. Both the chemical and mineralogical composition depend on many factors, of which the type of coal burned and the combustion process used are the most significant [9].
The phase composition of ceramic materials is generally studied using X-ray diffraction (XRD) analysis, scanning electron microscopy (SEM), infrared (IR) spectroscopy, and so on. IR spectroscopy is particularly useful for the analysis of amorphous materials and is also very often used for the analysis of aluminosilicates [10,11] and the mineral composition of coal and coal ash [12,13,14,15,16,17,18,19]. The use of Raman spectroscopy for the analysis of aluminosilicates can be complicated by the possible occurrence of fluorescence, which can overlap most of the Raman spectral information [20]. Despite this, Raman spectroscopy has been used in some studies for the description of fly ash or mullite ceramics [2,21,22,23].
The present study deals with analyses of the structural properties of FA and FA-kaolin (FA-K) ceramics using IR and Raman spectroscopy. The objective of the study is characterization of the component changes in the spectra of FA and FA-K ceramics annealed from 1000 to 1300 °C by combined use of IR and Raman spectroscopy techniques, which are still insufficiently represented in the literature.

2. Materials and Methods

2.1. Materials and Sample Preparation

FA and kaolins for this study were identical with those in the previous study [24]. FA comes from the combustion of black coal in a coal power station (Dětmarovice Power Station, Dětmarovice, Czech Republic); FA was collected from an electrostatic precipitator.
The three kaolin samples (K1, K2, and K3) from the Czech kaolin deposits were purchased from the company LB Minerals, Ltd. (Horní Bříza, Czech Republic). Two samples (K1 and K2) originate from the kaolin Pilsen Basin, and one sample (K3) originates from the Karlovy Vary region. The elemental composition of the used kaolins and fly ash (in oxide form) is given in Table 1. All three used kaolins contain kaolinite in an average amount of 75% by mass [6] and also some other minerals, in particular quartz, muscovite, and orthoclase [24].
Sample preparation was also identical to that in [24]. The kaolin samples K1, K2, and K3 and FA were prepared in an FA:K mass ratio of 9:1 for the mixtures (designated FA-K1, FA-K2, and FA-K3). Each mixture was homogenized for 1 h in a bottle at a rotation speed of 40 r·min−1 (Heidolph Reax overhead shaker, REAX 20/4, Merck KGaA, Darmstadt, Germany) and then mixed in an agate planetary ball mill (FRITSCH-Pulverisette 6) for 15 min at a rotation speed of 300 r·min−1. Samples were next prepared in a slurry with the addition of 20% by mass of distilled water. The slurry was manually pressed into the cubic voids (20 mm × 20 mm × 20 mm) of metal molds. The samples in molds were left for 24 h at room temperature and then dried at 110 °C for 5 h in an oven. Dry samples were taken out of the molds and sintered in an electrical laboratory furnace LH15/13 at a heating ramp 12 °C/min to the desired temperature (of 1000 °C, 1100 °C, 1200 °C, or 1300 °C) and maintained at this temperature for 2 h. The samples were then powdered in an agate mortar with pestle. The list of samples is given in Table 2.

2.2. Method (IR and Raman Spectroscopy)

IR spectra of all samples were collected by the potassium bromide pellets technique. Exactly 2.0 mg of sample was ground with 200 mg of dried potassium bromide. This mixture was used to prepare the potassium bromide pellet (diameter: 1 cm). The pellet was pressed by 8 tons for 30 s under vacuum. The infrared spectra were collected using FT-IR spectrometer Nicolet iS50 (Thermo Scientific, Madison, WI, USA) with DTGS detector. The following parameters were used for measurement: spectral region, 4000–400 cm−1; spectral resolution, 4 cm−1; 64 scans; Happ–Genzel apodization. Regarding the treatment of spectra, a polynomial (second-order) baseline was used, with subtraction of the spectrum of pure potassium bromide.
The Raman spectra were measured on the dispersive Raman spectrometer DXR SmartRaman (ThermoScientific, Madison, WI, USA) with CCD detector using a backscattering configuration. The wavelength of the excitation laser was 780 nm, the grating 400 lines/mm, the aperture 25 μm, the exposure time 1 s, and the number of exposures 100. An empty sample compartment was used for background measurement. The spectra were corrected for fluorescence by spectral software OMNIC (v.9.2; Thermo Scientific, Madison, WI, USA).

3. Results and Discussion

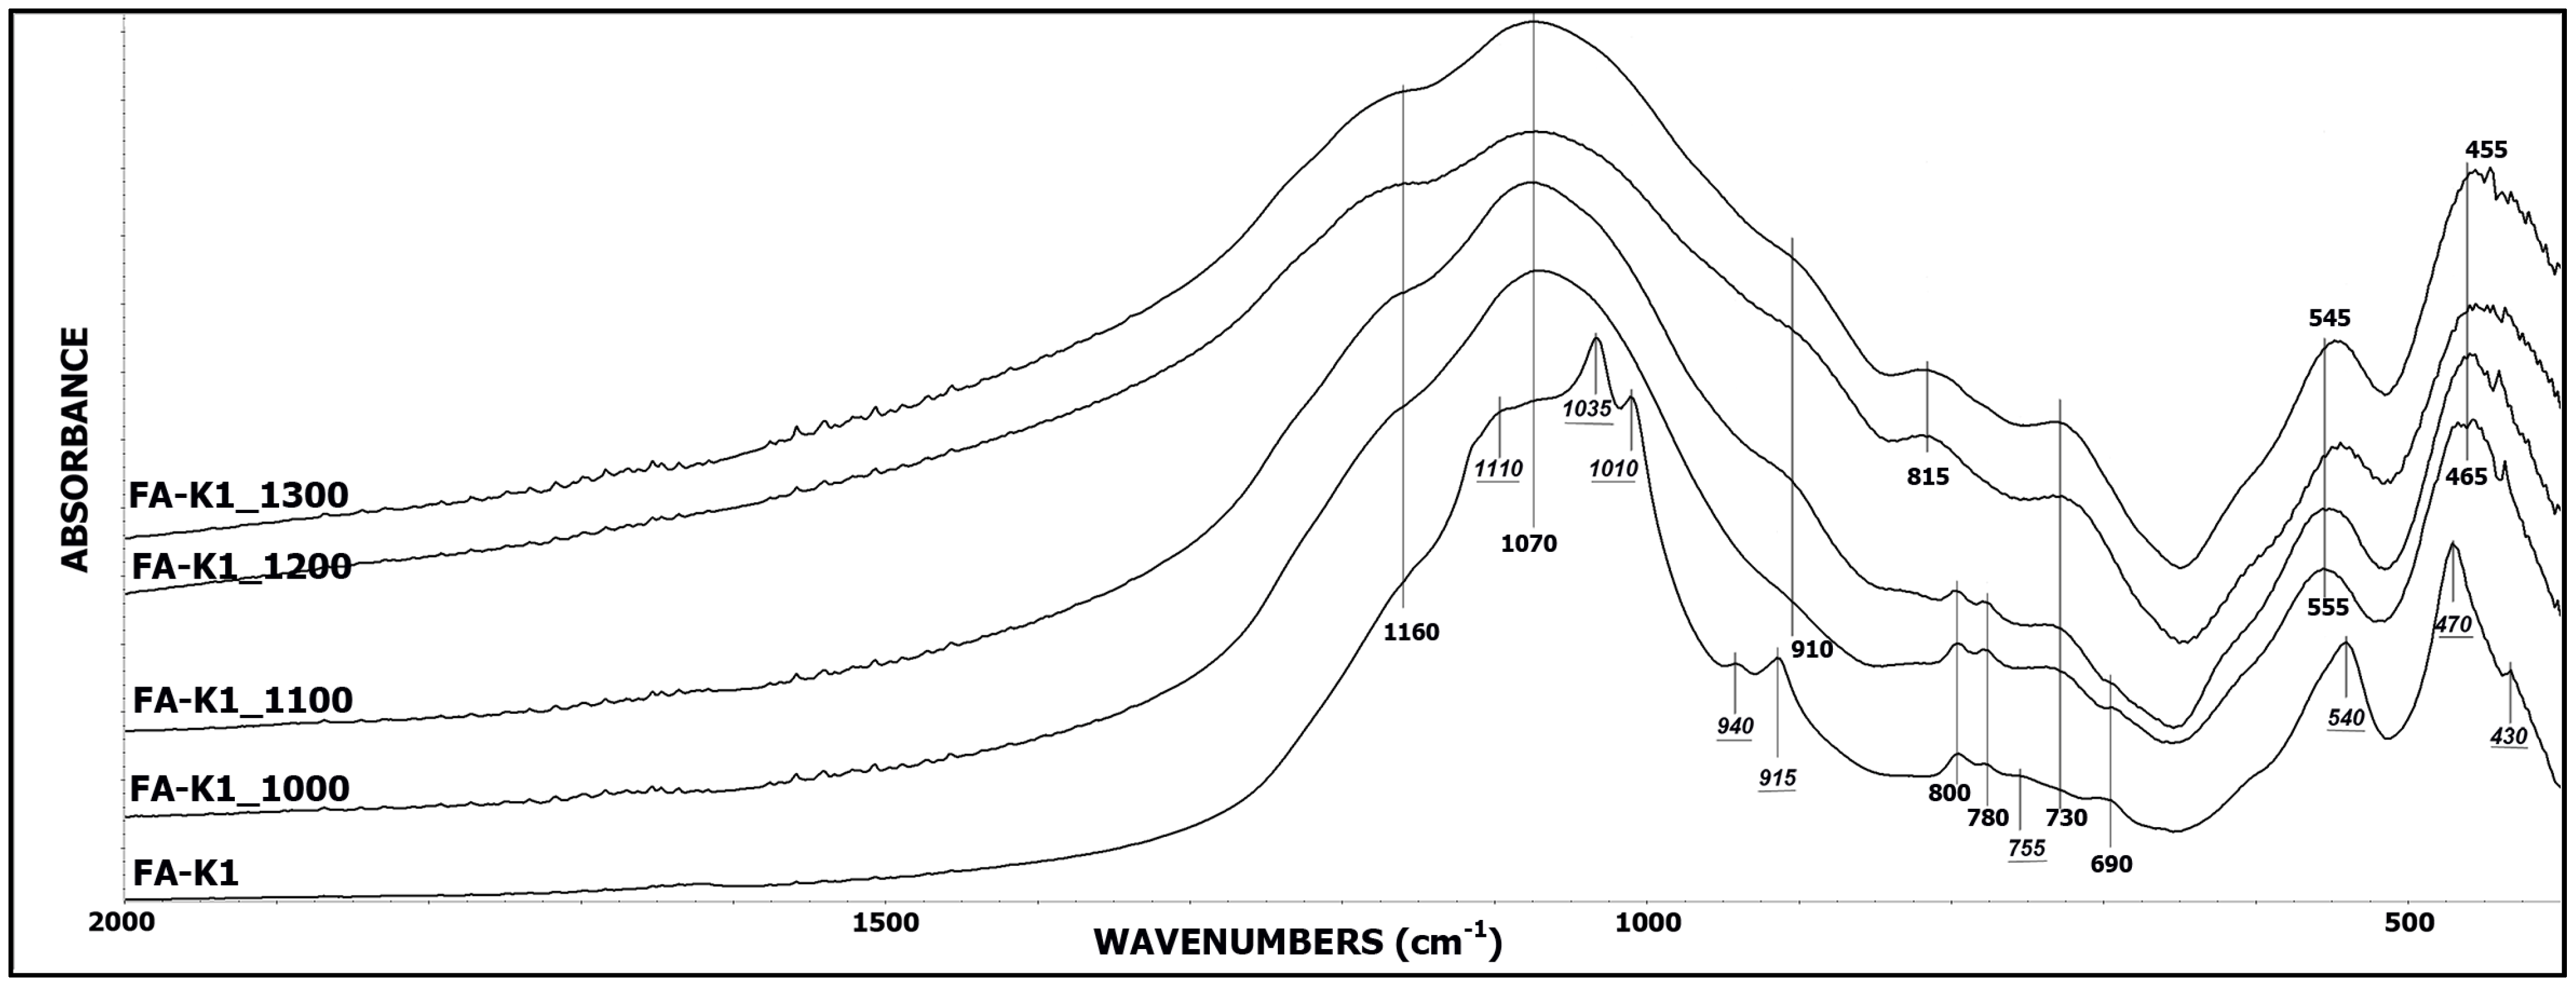
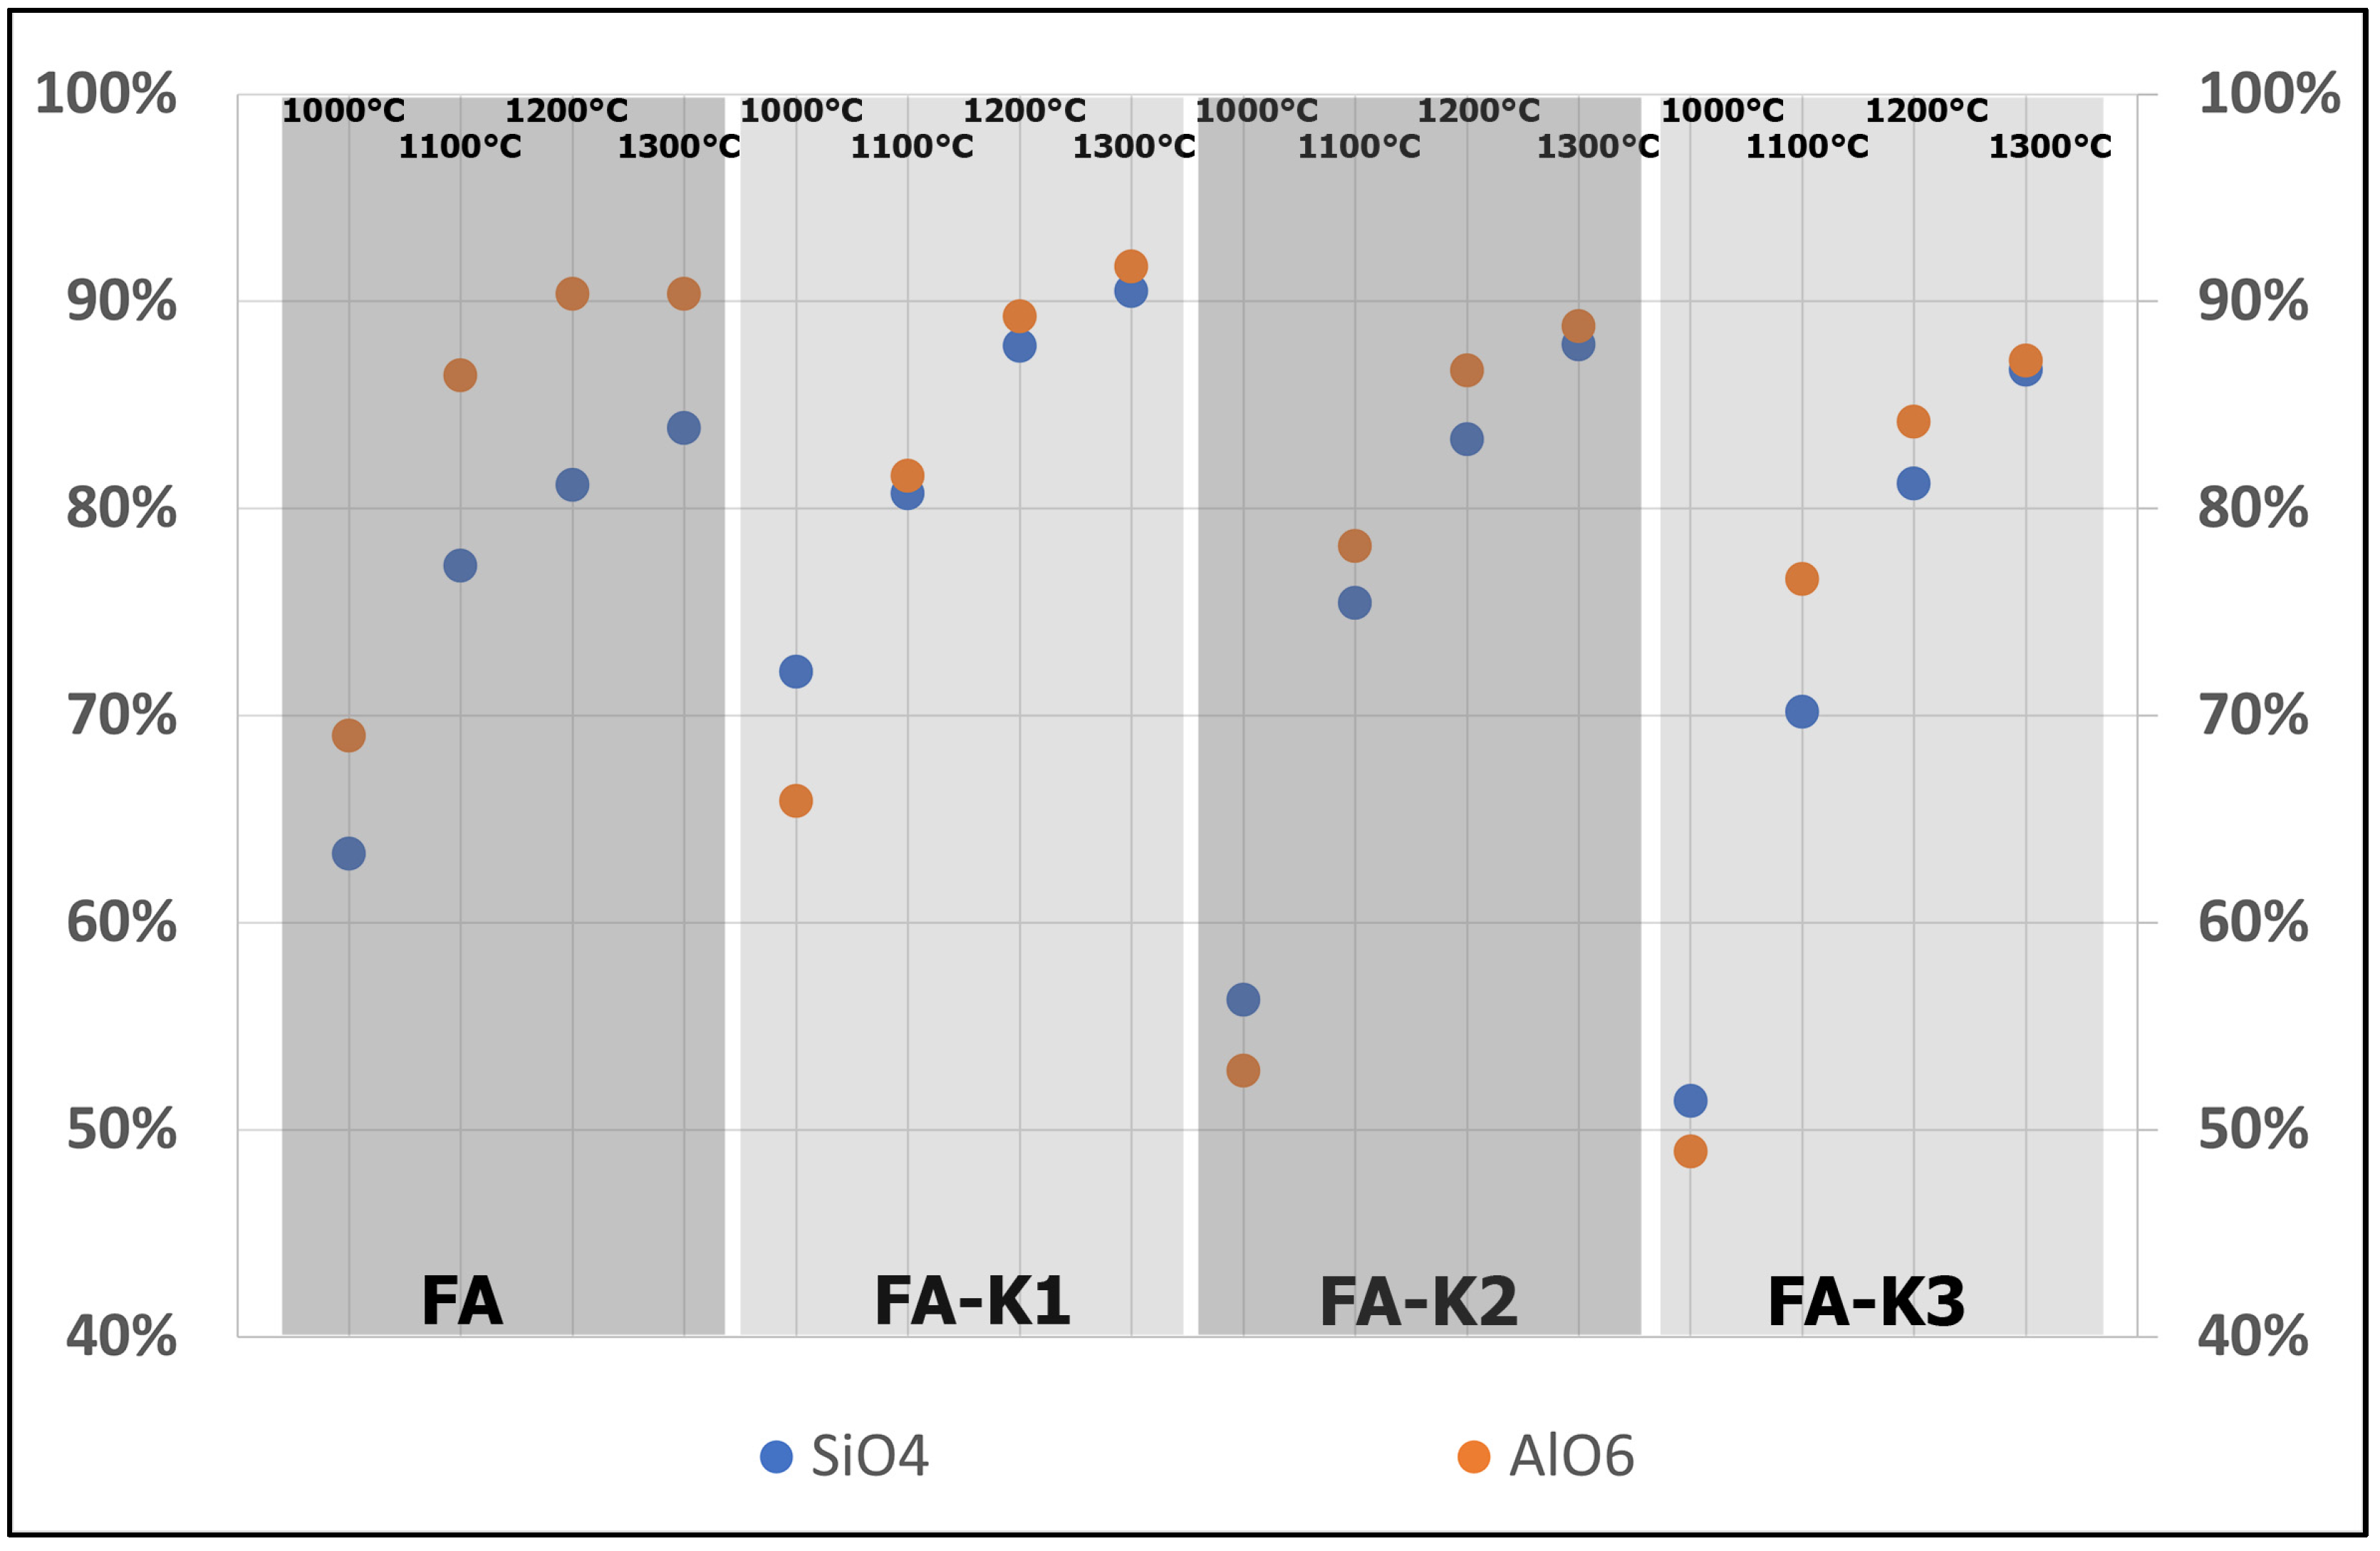
3.1. IR Spectroscopy

IR spectra of all prepared samples contain spectral bands that are particularly concentrated in the spectral region below 1500 cm−1, where positions of the spectral bands of stretching and deformation vibration of Si-O and Al-O bonds are located.
IR spectra of sample of fly ash (without thermal treatment) and fly ash samples annealed at 1000, 1100, 1200, and 1300 °C (FA, FA_1000, FA_1100, FA_1200, and FA_1300) are shown in Figure 1.
The spectra of all FA samples are very similar and exhibit spectral bands characteristic for the vibration of the Si-O bond in SiO4 tetrahedra and the Al-O bond (both in AlO4 tetrahedra and AlO6 octahedra) [1,23,25,26,27,28,29,30,31,32,33,34,35].
The most intensive band at 1070 cm–1 has two spectral shoulders observed on the side of higher wavenumbers (at 1160 cm−1) and on the side of lower wavenumbers (at 910 cm−1). The bands at 1070 cm−1 and 1160 cm−1 are due to asymmetrical stretching vibration of the Si-O-Si bond in SiO4 tetrahedra (transverse and longitudinal mode, respectively). The band at 910 cm−1 is assigned to the deformation vibration of the Al-O bond in AlO6 octahedra. The bands at 1070 cm−1 and 1160 cm−1 are generally typical for different forms of SiO2. The band at 910 cm−1 is characteristic for aluminosilicates or for mullite [32].
The weak doublet at 800 cm−1 and 780 cm−1 and the weak band at 815 cm−1 are associated with the symmetric stretching vibration of Si-O-Si bridges in SiO4 tetrahedra. The doublet at 800 cm−1 and 780 cm−1 is significantly characteristic for quartz [32]; the band at 815 cm−1 is significant for the amorphous form of SiO2 [31]. The bands confirm the presence of quartz in samples up to a temperature of 1100 °C and its subsequent transformation to the amorphous form of SiO2.
Other weak bands are seen at 730 cm−1 and 690 cm−1. The band at 730 cm−1 is due to deformation vibration of the Al-O in tetrahedra and confirms the substitution of Al for Si in the SiO4 tetrahedra of mullite [32]. The band at 690 cm−1 is due to perpendicular deformation vibration of the Si-O in SiO4 tetrahedra and is very typical for quartz [33]. The band at 730 cm−1 is presented in all spectra; the band 690 cm−1 is presented only in the spectra up to temperature 1100 °C. This fact also confirms the previously mentioned trend that quartz is present in samples only up to a temperature of 1100 °C, and then it changes to the amorphous form of SiO2.
The medium intensive bands at about 550 cm−1 and 460 cm−1 are assigned to the bending vibration of Al-O-Si and Si-O-Si, respectively. The vibration at about 550 cm−1 is characteristic for AlO6 octahedra and is very typical (among others) for aluminosilicates [11] or for mullite [28]. The spectral shift (of approx. 10 cm−1) of both bands (at about 550 cm−1 and 460 cm−1) to the lower wavenumbers occurs with increasing temperature of sample treatment. The spectral shift of other bands in the spectra of fly ash samples was not observed.
IR spectra of samples of FA with kaolin K1 (without thermal treatment and annealed at different temperatures) are shown in Figure 2. The IR spectra of samples prepared from FA and the other kaolin (K2 and K3) are almost identical.
Compared to the spectra in Figure 1, the spectrum of sample FA-K1 (as well as the spectra of FA-K2 and FA-K3, which are not presented in Figure 2) contains some spectral bands that are not presented in the spectra of annealed samples. The wavenumbers of these spectral bands are labeled by underlined italics font in Figure 2. The following literature sources were used for assignment of the spectral bands: [11,36,37]. The most intensive band at 1035 cm−1 has two spectral shoulders: one on the side of higher wavenumbers (at 1110 cm−1) and one on the side of lower wavenumbers (at 1010 cm−1). The band at 1035 cm−1 is due to asymmetrical in-plane stretching vibration of the Si-O in SiO4 tetrahedra, whereas the shoulder at 1010 cm−1 is associated with a symmetrical mode of the same type of vibration. The shoulder at 1110 cm−1 belongs to the longitudinal mode of stretching vibration of the Si-O in SiO4 tetrahedra. The weak bands at 940 cm−1 and at 915 cm−1 are both assigned to deformation vibration of O-H in the inner hydroxyl groups, and the very weak bands at 755 cm−1 and at 690 cm−1 are due to a perpendicular mode of deformation vibration of the Si-O in SiO4 tetrahedra. The medium band at 540 cm−1 is associated with bending of the Al-O-Si bond, where Al is octahedrally coordinated with oxygen, whereas Si is tetrahedrally coordinated with oxygen [11]. The medium band at 470 cm−1 is due to bending of the Si-O-Si bond of coordinated Si in SiO4 tetrahedra. The weak shoulder at 430 cm−1 belongs to deformation vibration of the Si-O in SiO4 tetrahedra. All the above-mentioned spectral bands are generally typical for aluminosilicates (especially for clay minerals) [11,36]. Moreover, the bands at 940 cm−1 and at 915 cm−1 are very characteristic for kaolinite [11,36].
The rest of the bands in the spectrum of sample FA-K1 were characterized in more detail in the assignment of the spectral bands of FA samples (see Figure 1 description). The spectra of annealed samples FA-K1_1000, FA-K1_1100, FA-K1_1200, and FA-K1_1300 exhibit the same spectral characteristics and spectral trends as the spectra of annealed FA samples. The assignment of all bands presented in the spectra of annealed samples is described above (see the description of spectra of samples containing only FA).
The spectra are presented in so-called “full range” mode in Figure 1 and Figure 2. This mode allows a detailed view of each band in each spectrum but does not consider their real intensity. The intensity of the bands changes depending on the annealing temperature used in the sample preparation. The band intensities dramatically decrease with increasing temperature of the sample treatment. The band at about 450 cm−1 and the band at about 550 cm−1 were used to demonstrate the decrease of intensity of spectral bands in samples annealed at different temperatures. The band at about 450 cm−1 was used as an example for the demonstration of trends in the bands of SiO4 tetrahedra; the band at about 550 cm−1 was used as example for the demonstration of trends in the bands of AlO6 octahedra. The percentage decrease (related to the band intensity of selected bands in the sample without thermal treatment) is given in Table 3.
The trend of the percentage decrease of bands’ intensities is graphically represented in Figure 3.
The significant decrease of selected band intensities with increasing sample treatment temperature is evident for all samples. The intensity decrease is about 90% at the highest annealing temperature in all samples and in both selected bands. A relatively big difference is visible between the intensity decrease of SiO4 tetrahedra and that of AlO6 octahedra in the FA samples. The intensity decrease of the AlO6 band is bigger than SiO4 for all annealing temperatures. The decrease of spectral band intensities is relatively similar for both selected bands in the FA-K samples. The decrease of intensity of the SiO4 tetrahedron band is bigger (than the decrease of intensity of the AlO6 octahedron band) for samples annealed at a temperature of 1000 °C. At temperatures above 1000 °C, a bigger decrease of bands’ intensity is observed for the AlO6 octahedron band.
The decrease of bands’ intensities is caused by a transformation of the crystalline state of compounds into an amorphous state. The transformation manifested by decreasing of bands’ intensities accompanied by increasing of their width in IR spectra was described in [31,32,35]. Due to the weak intensities of selected bands of SiO4 tetrahedra and AlO6 octahedra, the increase of spectral width can be much more difficult to express by numerical value (for example, by full width at half height (FWHH)). IR spectra clearly evidence the increase of spectral band width with increasing temperature of sample treatment in Figure 1 and Figure 2.
Based on the above observations, it can be assumed that during thermal sample treatment, a part of the aluminosilicates present in the samples was transformed from the crystalline phase to the amorphous phase. It is also evident that the amount of amorphous phase in samples increased with increasing annealing temperature.

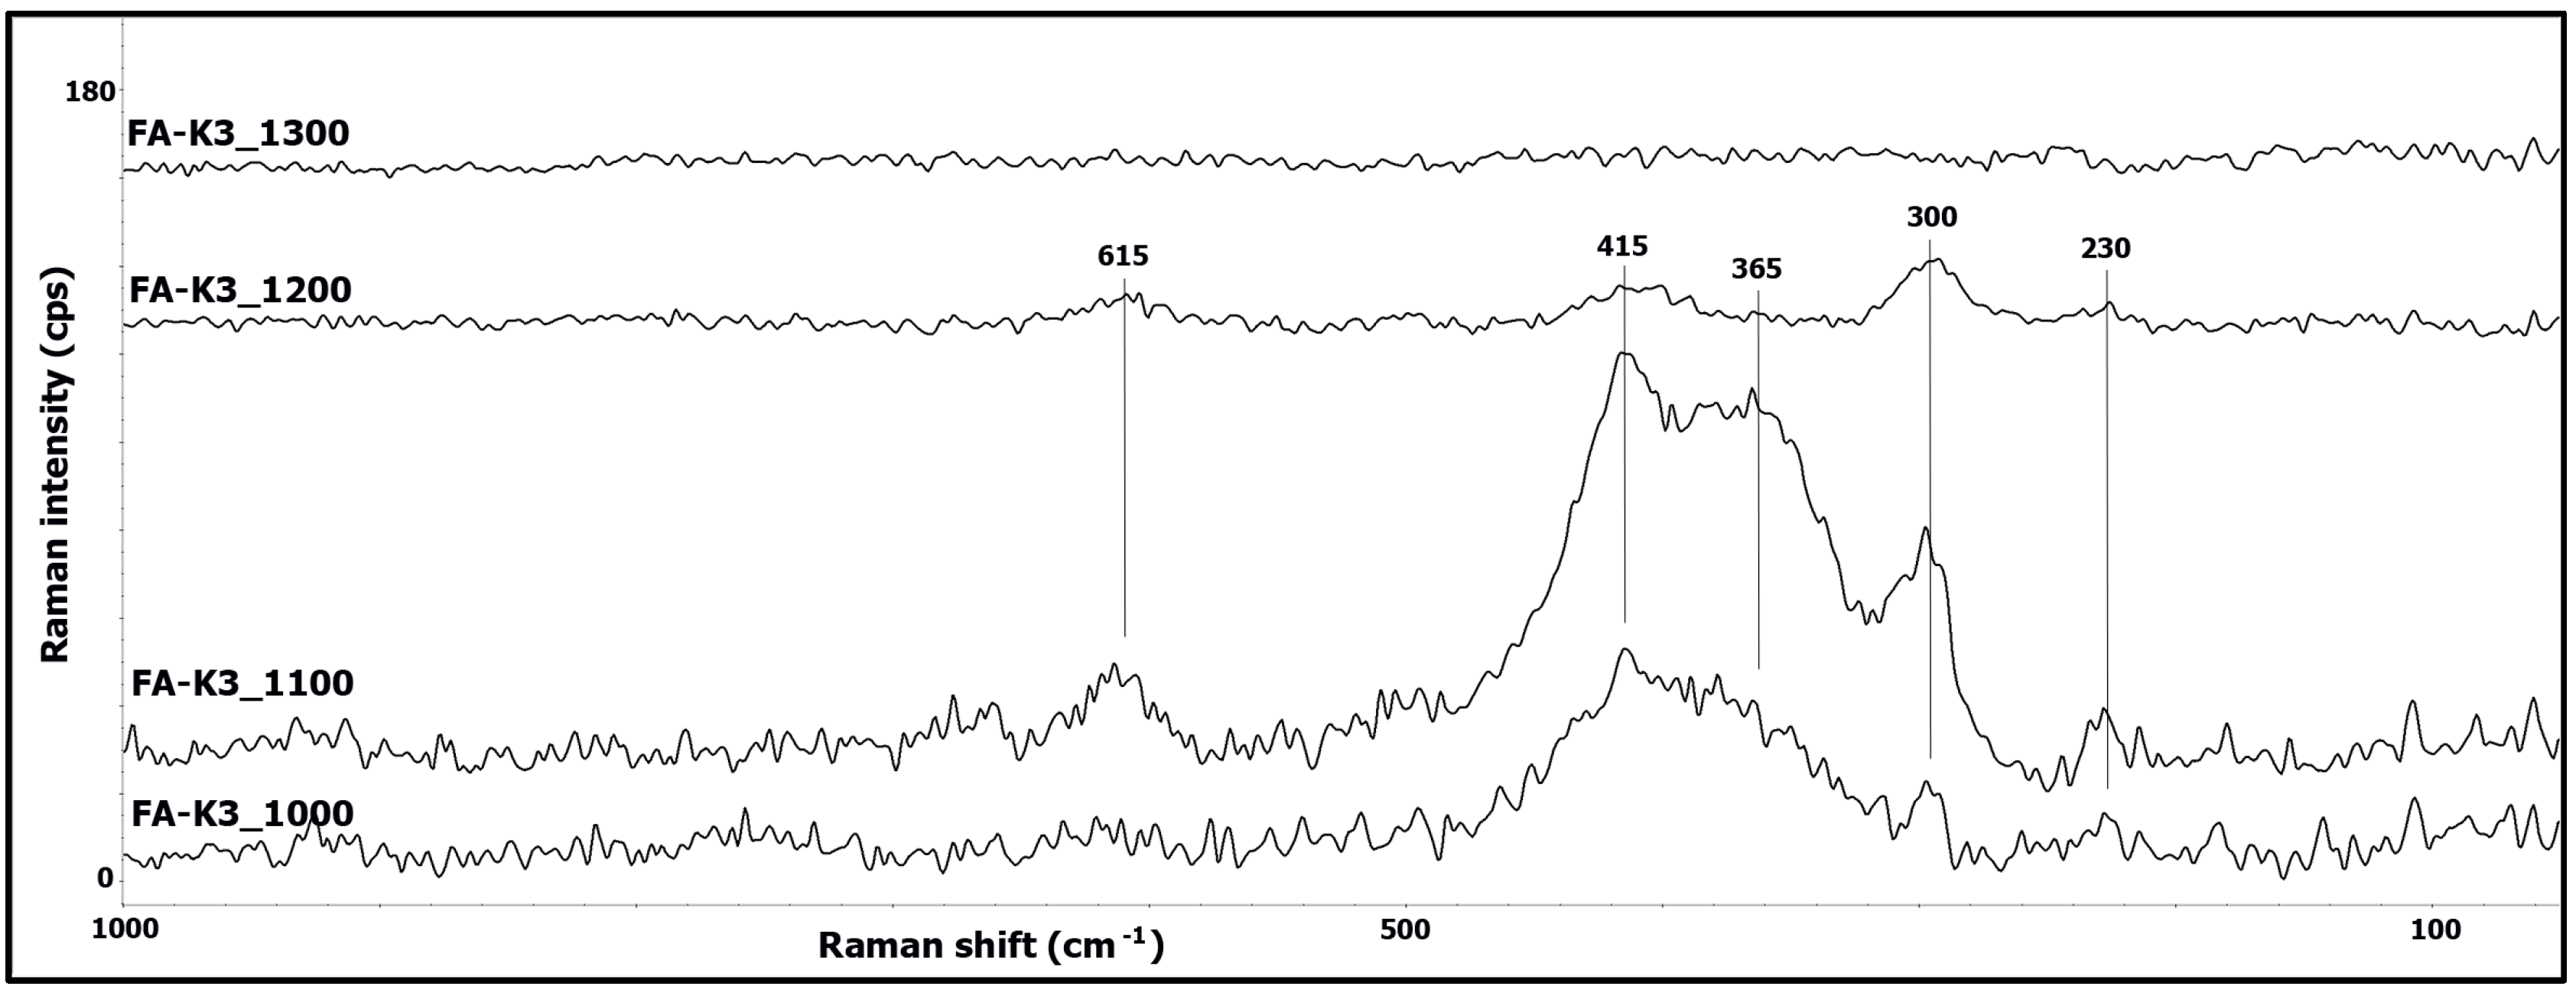
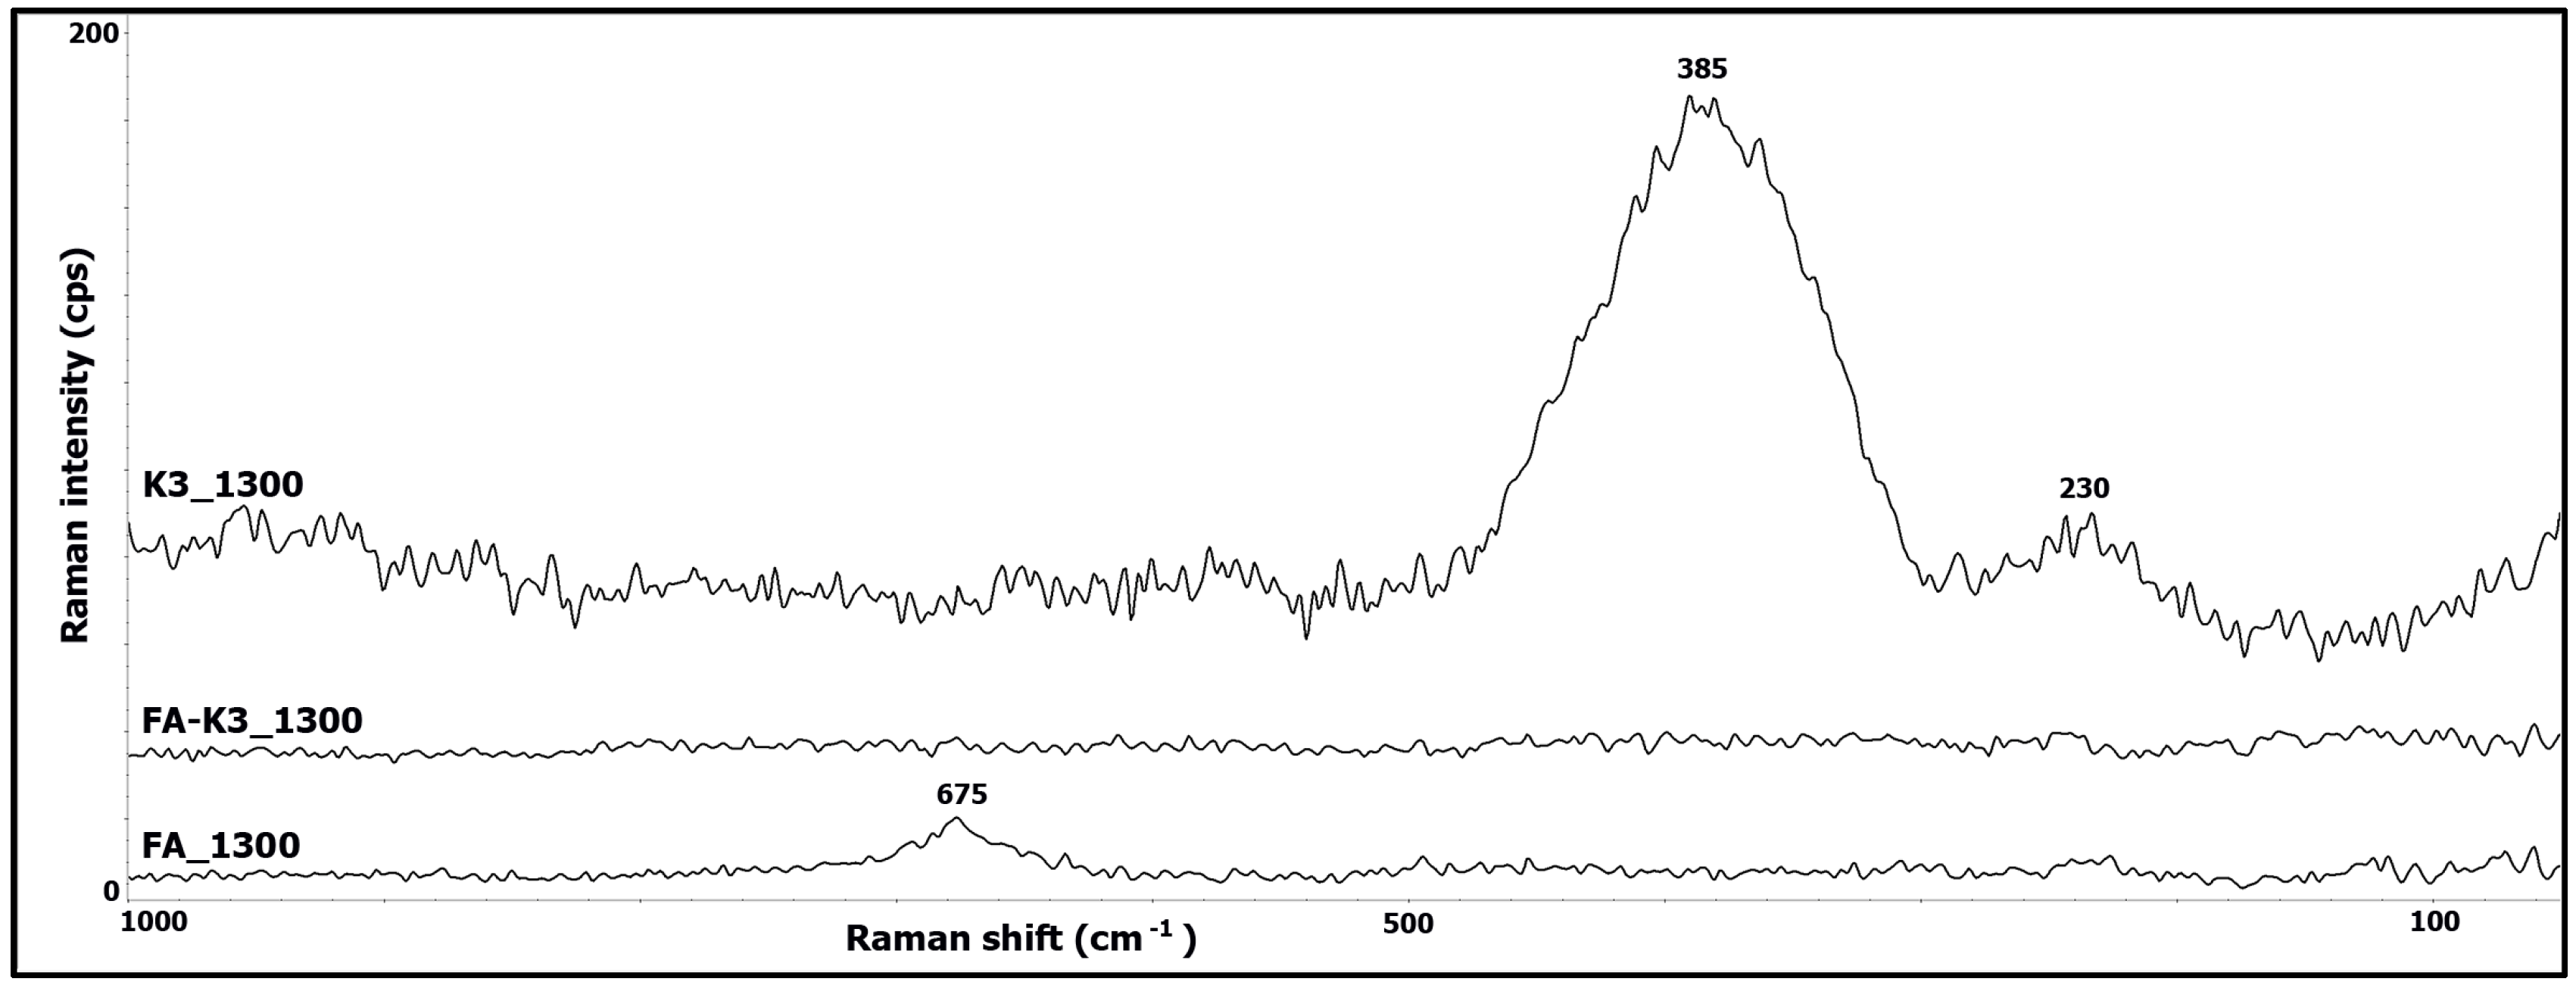
3.2. Raman Spectroscopy

Raman spectra (measured in the spectral region 1000–50 cm−1) contain higher or lower levels of fluorescence, and therefore software fluorescence correction of the measured spectra was applied. The highest level of fluorescence contains spectra of no annealed samples; Raman spectral bands was completely overlapped by fluorescence in these spectra. The lowest level of fluorescence was in the spectra of samples annealed in 1300 °C. Fluorescence in Raman spectra of aluminosilicates is a common (but very complicated and complex) phenomenon [20]. The origin of the fluorescence of aluminosilicates is rarely discussed in the literature, and there is not unified opinion on what causes the fluorescence [20]. Nevertheless, several Raman studies of mullite ceramics have been carried out previously [38,39,40,41,42]. Uncorrected Raman spectra of all annealed samples (FA, FA-K1, FA-K2, and FA-K3) are given in the Supplementary Materials Figures S1–S4.
The Raman spectra of the FA and FA-K samples were very similar. Therefore, Raman spectra of FA-K3_1000, FA-K3_1100, FA-K3_1200, and FA-K3_1300 are presented as examples in Figure 4.
The intensities of Raman bands change with the annealing temperature of the sample. The bands’ intensities increase up to a temperature of 1100 °C, and then they dramatically decrease. No spectral bands are seen in the spectra of the sample annealed at 1300 °C. All spectral bands presented in Figure 4 are due to the lattice vibration of the Si-O and Al-O bonds of mullite. The band at 615 cm−1 is due to the lattice vibration of the Al-O in mullite tetrahedra, in which Si was substituted by Al [38]. The strongest band at 415 cm−1 is assigned to the vibration of SiO4 tetrahedra in crystalline mullite [38,40,41,42], similar to the band at 300 cm−1. The presence of an amorphous (glassy) form of mullite can be assumed by the band at 365 cm−1, which is due to vibration of SiO4 tetrahedra [38]. The band at 230 cm−1 belongs to the lattice vibration of the Al-O in the AlO6 octahedra of mullite [38,41]. All samples show spectral bands confirming the presence of mullite. The variable intensities of the spectral bands in particular spectra are most likely related to the structural order of mullite. Raman spectroscopy is very sensitive to symmetric or well-ordered structures but less so to low-ordered (or disordered) structures. Therefore, spectral bands of disordered structures tend to be less intense, noisy, and broad [43]. Based on the above-mentioned facts, the well-ordered structure can be expected in samples annealed at a temperature of 1100 °C (Figure 4); on the contrary, a strongly disordered structure is formed at a temperature of 1300 °C.
All spectra of samples annealed in 1100 °C (Figure 5) are almost identical, and the assignment of all the spectral bands is the same as the bands’ assignment in Figure 4. The only spectral difference can be observed in the spectrum of sample FA_1100. The band of vibration of SiO4 tetrahedra in glassy mullite (at 365 cm−1) is weak and is almost completely overlapped by the band of SiO4 tetrahedron vibration in crystalline mullite (at 400 cm−1). Therefore, it can be assumed that FA-K samples contain significantly more amorphous (glassy) mullite than FA samples. All spectra are very noisy and broad, which suggests the probability of disordered structure in the samples [43].
Spectral comparison of samples FA_1300, kaolin K3_1300, and FA-K3_1300 annealed at a temperature of 1300 °C is also very interesting, as shown in Figure 6.
The spectrum of kaolin (K3_1300) contains a strong and very broad band at 385 cm−1, which is assigned to the vibration of SiO4 tetrahedra in glassy mullite [38], and a very weak band at 230 cm−1 (lattice vibration of Al-O in AlO6 octahedra of mullite [38,41]). The spectrum of fly ash (FA-1300) contains only a very weak band at 675 cm−1, which is due to the vibration of AlO6 octahedra in mullite, sillimanite, or andalousite [38]. No spectral bands are seen in the spectrum of FA-K3_1300. All spectra are very noisy, and spectral bands in the spectra of K3_1300 and FA_1300 are relatively broad, as seen in Figure 6. All these mentioned spectral features again point to a very disordered structure, where the most significant disordered structure can be assumed in the FA-K3_1300 samples.

4. Conclusions

This study (by vibrational spectroscopy) follows a detailed XRD study of the same samples [24]. The results of both studies are very similar and complement each other.
All the spectral bands in the IR spectra of FA and FA-K samples confirmed the presence of compounds containing SiO4 tetrahedra and AlO6 octahedra in samples. The spectral bands at 940 cm−1 and at 915 cm−1 confirmed the presence of kaolinite in the samples without thermal treatment. The double-band at 800 cm−1 and 780 cm−1 and the band at 690 cm−1 confirmed the presence of quartz in the samples annealed up to a temperature of 1100 °C. The bands at 910 cm−1 and at 730 cm−1 confirmed the presence of mullite in all samples. The intensity of IR spectral bands dramatically decreased with the increase of annealing temperature, which is most likely related to the presence of amorphous phase. The formation of amorphous phases was graphically demonstrated by the decrease of intensities of selected bending vibration of AlO6 octahedra at about 550 cm−1 and bending vibration of SiO4 tetrahedra at about 450 cm−1.
Raman spectra (due to the presence of fluorescence) did not offer such significant informative values as IR spectra. Raman spectra of the samples annealed at different temperatures confirmed the presence of mullite at different stage of structure ordering. The well-ordered structure of mullite was predicted in FA-K samples annealed at a temperature of 1100 °C, while disordered structure was predicted in FA-K samples annealed at a temperature of 1300 °C.

Supplementary Materials

The following supporting information can be downloaded at: https://www.mdpi.com/article/10.3390/min13070864/s1, Figure S1. Uncorrected Raman spectra of annealed FA samples; Figure S2. Uncorrected Raman spectra of annealed FA-K1 samples; Figure S3. Uncorrected Raman spectra of annealed FA-K2 samples; Figure S4. Uncorrected Raman spectra of annealed FA-K3 samples.

Funding

This research received no external funding.

Conflicts of Interest

The authors declare no conflict of interest.

References

  1. Panda, L.; Dash, S. Characterization and utilization of coal fly ash: A review. Emerg. Mater. Res. 2020, w9, 921–934. [Google Scholar] [CrossRef]
  2. Potgiered-Vermaak, S.S.; Potgieter, J.H.; Belleil, M.; DeWeerdt, F.; Van Grieken, R. The application of Raman spectrometry to the investigation of cement Part II: A micro-Raman study of OPC, slag and fly ash. Cem. Concr. Res. 2006, 26, 663–670. [Google Scholar] [CrossRef]
  3. Hossain, S.S.; Roy, P. Sustainable ceramics derived from solid wastes: A review. J. Asian Ceram. Soc. 2020, 8, 984–1009. [Google Scholar] [CrossRef]
  4. Kamseu, E.; Leonelli, C.; Boccaccini, D.N.; Veronesi, P.; Miselli, P.; Pellacani, G.; Melo, U.C. Characterization of porcelain composition using two China clays from Cameroon. Ceram. Int. 2007, 33, 851–857. [Google Scholar] [CrossRef]
  5. Luo, Y.; Zheng, S.; Ma, S.; Liu, C.; Wang, X. Ceramics tiles derived from coal fly ash: Preparation and mechanical characterization. Ceram. Int. 2017, 43, 11935–11966. [Google Scholar] [CrossRef]
  6. Valášková, M.; Klika, Z.; Novosad, B.; Smetana, B. Crystallization and quantification of crystalline and non-crystalline phases in kaolin-based cordierites. Materials 2019, 12, 3104. [Google Scholar] [CrossRef] [Green Version]
  7. Schneider, H.; Komarneni, S. (Eds.) Mullite; Wiley VCH: Weinheim, Germany, 2005. [Google Scholar]
  8. Zacco, A.; Borgese, L.; Giaconcelli, A.; Struis, R.P.W.J.; Depero, L.E.; Bontempi, E. Review of fly ash inertisation treatments and recycling. Environ. Chem. Lett. 2014, 12, 153–175. [Google Scholar] [CrossRef]
  9. Vassilev, S.V.; Vassileva, C.G. A new approach for the classification of coal fly ashes based on their orogin, composition, properties, and behavior. Fuel 2007, 86, 1490–1512. [Google Scholar] [CrossRef]
  10. Painter, P.C.; Coleman, M.M.; Jenkins, R.G.; Walker, P.L. Fourier transform infrared study of acid-demineralization coal. Fuel 1978, 57, 125–126. [Google Scholar] [CrossRef]
  11. Madejová, J.; Komadel, P. Baseline study of the clay minerals society source clays: Infrared methods. Clays Clay Miner. 2001, 49, 410–432. [Google Scholar] [CrossRef]
  12. Mukherjee, S.; Srivastava, S. Minerals transformations in northeastern region coals of India on heat treatment. Energy Fuels 2006, 20, 1089–1096. [Google Scholar] [CrossRef]
  13. Bai, J.; Li, W.; Li, B. Characterization of low-temperature coal ash behaviors at high temperatures under reducing atmosphere. Fuel 2008, 87, 583–591. [Google Scholar] [CrossRef]
  14. D’Alessio, A.; Vergamini, P.; Benedetti, E. FT-IR investigation of the structural changes of Sulcis and South Africa coals under progressive heating in vacuum. Fuel 2000, 79, 1215–1220. [Google Scholar] [CrossRef]
  15. Cooke, N.E.; Fuller, O.M.; Gaikwad, R.P. FI-IR spectroscopic analysis of coals and coal extracts. Fuel 1986, 65, 1254–1260. [Google Scholar] [CrossRef]
  16. Fysil, S.A.; Swinkels, D.A.J.; Fredericks, P.M. Near-Infrared diffuse reflectance spectroscopy of coal. Appl. Spectrosc. 1985, 39, 354–357. [Google Scholar]
  17. Fredericks, P.M.; Le, J.B.; Osborn, P.R.; Swinkels, D.A.J. Materials characterization using factor analysis of FT-IR spectra. Patr 1: Results. Appl. Spectrosc. 1985, 39, 303–310. [Google Scholar] [CrossRef]
  18. Alciaturi, C.E.; Escobar, M.E.; Vallejo, R. Predisction of coal properties by derivate DRIFT spectroscopy. Fuel 1996, 74, 491–499. [Google Scholar] [CrossRef]
  19. Cloke, M.; Gilfillan, A.; Lester, E. The characterization of coals and density separated coal fractions using FTIR and manual and automated petrographic analysis. Fuel 1997, 76, 1289–1296. [Google Scholar] [CrossRef]
  20. Ritz, M.; Vaculíková, L.; Kupková, J.; Plevová, E.; Bartoňová, L. Different level of fluorescence in Raman spectra of montmorillonites. Vib. Spectrosc. 2016, 84, 7–15. [Google Scholar] [CrossRef]
  21. Žyrkowski, M.; Costa Neto, R.; Santos, L.F.; Witkowski, K. Characterization of fly-ash cenospheres from coal-fired power plant unit. Fuel 2016, 174, 49–53. [Google Scholar] [CrossRef]
  22. Tai, F.C.; Wei, C.; Chang, S.H.; Chen, W.S. Raman and X-ray diffraction analysis on unburned carbon powder refined from fly ash. J. Raman Spectrosc. 2010, 41, 933–937. [Google Scholar] [CrossRef]
  23. Yin, Y.; Yin, J.; Zhang, W.; Tian, H.; Hu, Z.; Ruan, M.; Xu, H.; Liu, L.; Yan, X.; Chen, D. FT-IR and micro-Raman spectroscopic characterization of minerals in high-calcium coal ashes. J. Energy Inst. 2018, 91, 389–396. [Google Scholar] [CrossRef]
  24. Valášková, M.; Blahůšková, V.; Vlček, J. Effects of kaolin additives in fly ash on sintering and properties of mullite ceramics. Minerals 2021, 11, 887. [Google Scholar] [CrossRef]
  25. Agarwal, A.; Davis, K.M.; Tomozawa, M. A simple IR spectroscopic method for determining fictive temperature of silica glasses. J. Non-Cryst. Solids 1995, 185, 191–198. [Google Scholar] [CrossRef]
  26. Hemmati, M.; Austen Angell, C. IR absorption of silicate glasses studies by ion dynamics computer simulation. I. IR spectra of SiO2 glass in the rigid ion model approximation. J. Non-Cryst. Solids 1997, 217, 239–249. [Google Scholar] [CrossRef]
  27. Morioka, T.; Kimura, S.; Tsuda, N.; Kaito, C.; Saito, Y.; Koike, C. Study of the structure of silica film by infrared spectroscopy and electron diffraction analyses. Mon. Not. R. Astron. Soc. 1998, 299, 78–82. [Google Scholar] [CrossRef]
  28. Jin, X.H.; Gao, J.; Guo, J.K. The structural change of diphasic mullite gel studies by XRD an IR spectrum analysis. J. Eur. Ceram. 2002, 22, 1307–1311. [Google Scholar] [CrossRef]
  29. Tomozawa, M.; Hong, J.W.; Ryu, S.R. Infrared (IR) investigation of the structural changes of silica glasses with fictive temperature. J. Non-Cryst. Solids 2005, 351, 1054–1060. [Google Scholar] [CrossRef]
  30. Isahykyan, A.R.; Beglaryan, H.A.; Pirumyan, P.A.; Papakhchyan, L.R.; Zulumyan, N.H. An IR spectroscopic study of amorpous silicas. Russ. J. Phys. Chem. 2011, 85, 72–75. [Google Scholar] [CrossRef]
  31. Musić, S.; Filipović-Vinceković, N.; Sekanović, L. Precipitation of amorphous SiO2 particles and their properties. Braz. J. Chem. Eng. 2011, 28, 89–94. [Google Scholar] [CrossRef]
  32. Mozgawa, W.; Król, M.; Dyczek, J.; Deja, J. Investigation of the coal ashes using IR spectroscopy. Spectrochim. Acta A 2014, 132, 889–894. [Google Scholar] [CrossRef]
  33. Mozgawa, W.; Sirarz, M.; Król, M. Spectroscopic Characterization of Silicate Amorphous Materials. In Molecular Spectroscopy-Experiment and Theory: From Molecules to Functional Materials; Kolezynski, A., Król, M., Eds.; Springer International Publishing: Cham, Switzerland, 2019; Volume 26, pp. 457–481. [Google Scholar]
  34. Yin, Y.; Yin, H.; Wu, Z.; Qi, C.; Tian, H.; Zhang, W.; Hu, Z.; Feng, L. Characterization of coals and coal ashes with high Si content using combined second-derivative infrared spectroscopy and Raman spectroscopy. Crystals 2019, 9, 513. [Google Scholar] [CrossRef] [Green Version]
  35. Ellerbrock, R.; Stein, M.; Schaller, J. Comparing amorphous silica, short-range-ordered silicates and silicic acid species by FTIR. Sci. Rep. 2022, 12, 11708. [Google Scholar] [CrossRef]
  36. Vaculíková, L.; Plevová, E. Identification of clay minerals and micas in sedimentary rocks. Acta Geodyn. Geomater. 2005, 2, 167–175. [Google Scholar]
  37. Cuadros, J.; Vega, R.; Toscano, A. Mid-infrared features of kaolinite-dickite. Clays Clay Miner. 2015, 63, 73–84. [Google Scholar] [CrossRef]
  38. Colomban, P. Structure of oxide gels and glasses by infrared and Raman scattering. J. Mater. Sci. 1989, 24, 3011–3020. [Google Scholar] [CrossRef]
  39. Shoval, S.; Boudeulle, M.; Panczer, G. Identification of the thermal phases in firing kaolinite to mullite by using micro-Raman spectroscopy and curve fittiing. Opt. Mater. 2011, 34, 404–409. [Google Scholar] [CrossRef]
  40. Bost, N.; Duraipandian, S.; Gumbretiere, G.; Poirier, J. Raman spectra of synthetic and natural mullite. Vib. Spectrosc. 2016, 82, 50–52. [Google Scholar] [CrossRef]
  41. Murshed, M.M.; Šehović, M.; Fischer, M.; Senyshyn, A.; Schneider, H.; Gesing, T.M. Thermal behavior of mullite between 4 K and 1320 K. J. Am. Ceram. 2017, 100, 5259–5273. [Google Scholar] [CrossRef]
  42. Biswal, B.; Mishra, D.K.; Das, S.N.; Bhuyan, S. Structural, micro-structural, optical and dielectric behavior of mullite ceramics. Ceram. Int. 2021, 47, 32252–32263. [Google Scholar] [CrossRef]
  43. Jorio, A.; Saito, R.; Dresselhaus, G.; Dresselhaus, M.S. Raman Spectroscopy in Graphene Related System, 1st ed.; Wiley-VCH.: Weinheim, Germany, 2011; pp. 299–325. [Google Scholar]
Figure 1. IR spectra of FA, FA_1000, FA_1100, FA_1200, and FA_1300.
Minerals 13 00864 g001
Figure 2. IR spectra of samples FA-K1, FA-K1_1000, FA-K1_1100, FA-K1_1200, and FA-K1_1300.
Minerals 13 00864 g002
Figure 3. The percentual decrease of band intensity of bending vibration mode of SiO4 tetrahedra and AlO6 octahedra with increasing annealing temperature of samples.
Minerals 13 00864 g003
Figure 4. Raman spectra of samples FA-K3_1000, FA-K3_1100, FA-K3_1200, and FA-K3_1300.
Minerals 13 00864 g004
Figure 5. Raman spectra of samples FA_1100, FA-K1_1100, FA-K2_1100, and FA-K3_1100.
Minerals 13 00864 g005
Figure 6. Raman spectra of samples FA_1300, FA-K3_1300, and K3_1300.
Minerals 13 00864 g006
Table 1. The elemental composition (mass %) of fly ash (FA) and kaolin samples (K) [24].
SampleSiO2TiO2Al2O3Fe2O3CaOMgOK2ONa2OSO3P2O5
FA44.831.2623.937.162.831.813.030.680.720.69
K149.521.0130.570.760.230.231.483.76<0.1<0.1
K249.630.7529.700.710.260.282.363.96<0.1<0.1
K348.510.8734.030.800.300.352.74<0.1<0.1<0.1
Table 2. List of samples.
Description of SampleAnnealing TemperatureSample Name
Fly ash-FA
1000 °CFA_1000
1100 °CFA_1100
1200 °CFA_1200
1300 °CFA_1300
Fly ash with kaolin K1-FA-K1
1000 °CFA-K1_1000
1100 °CFA-K1_1100
1200 °CFA-K1_1200
1300 °CFA-K1_1300
Fly ash with kaolin K2-FA-K2
1000 °CFA-K2_1000
1100 °CFA-K2_1100
1200 °CFA-K2_1200
1300 °CFA-K2_1300
Fly ash with kaolin K3-FA-K3
1000 °CFA-K3_1000
1100 °CFA-K3_1100
1200 °CFA-K3_1200
1300 °CFA-K3_1300
Table 3. Absorbances and intensity decrease percentage of the selected bands.
Sample NameBand at about 550 cm−1Band at about 450 cm−1
Absorbance % Decrease Absorbance % Decrease
FA0.180-0.581-
FA_10000.06663%0.18069%
FA_11000.04177%0.07986%
FA_12000.03481%0.05690%
FA_13000.02984%0.05690%
FA-K10.337-0.624-
FA-K1_10000.09472%0.21366%
FA-K1_11000.06581%0.11582%
FA-K1_12000.04188%0.06789%
FA-K1_13000.03291%0.05292%
FA-K20.240-0.509-
FA-K2_10000.10556%0.24053%
FA-K2_11000.05975%0.11178%
FA-K2_12000.04083%0.06887%
FA-K2_13000.02988%0.05789%
FA-K30.218-0.474-
FA-K3_10000.10651%0.24249%
FA-K3_11000.06570%0.11177%
FA-K3_12000.04181%0.07584%
FA-K3_13000.02987%0.06187%
Disclaimer/Publisher’s Note: The statements, opinions and data contained in all publications are solely those of the individual author(s) and contributor(s) and not of MDPI and/or the editor(s). MDPI and/or the editor(s) disclaim responsibility for any injury to people or property resulting from any ideas, methods, instructions or products referred to in the content.

