
Adding Value to Mine Waste through Recovery Au, Sb, and As: The Case of Auriferous Tailings in the Iron Quadrangle, Brazil


 ,
,  ,
,  ,
,
Abstract
1. Introduction
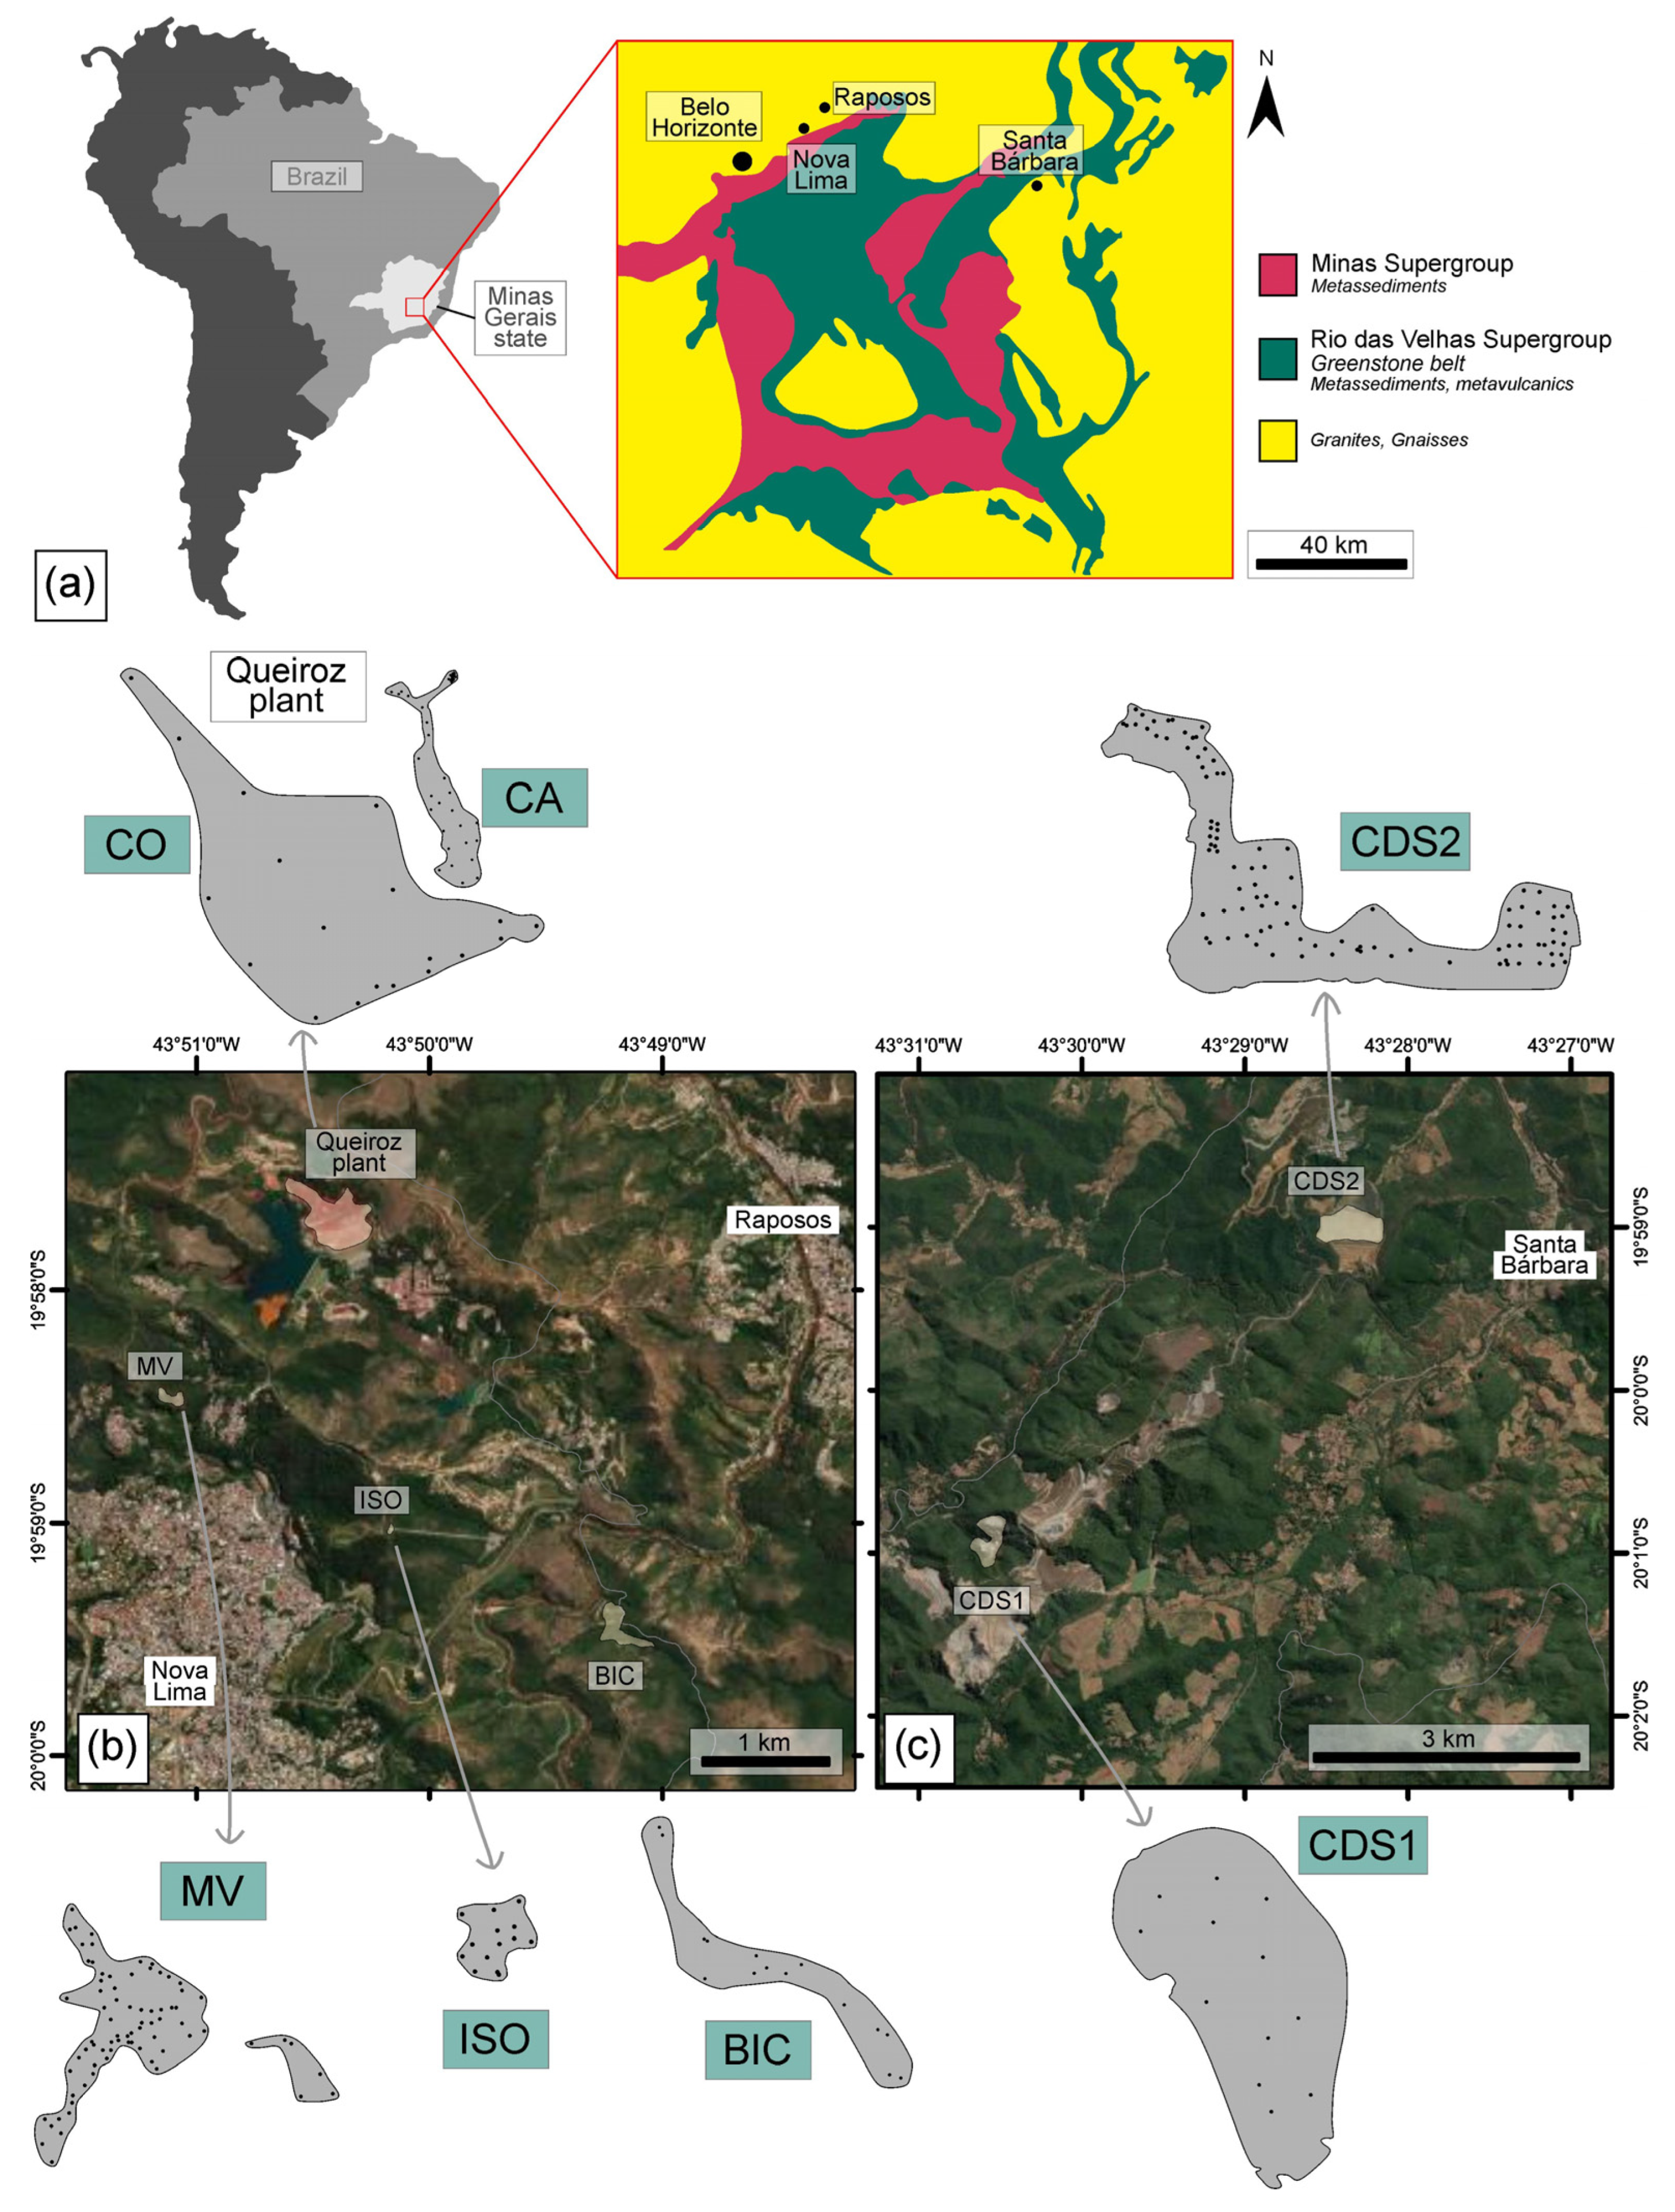
2. Study Area
3. Methodology
3.1. Characterization of Tailing Samples
3.1.1. Sampling
3.1.2. Sample Composition
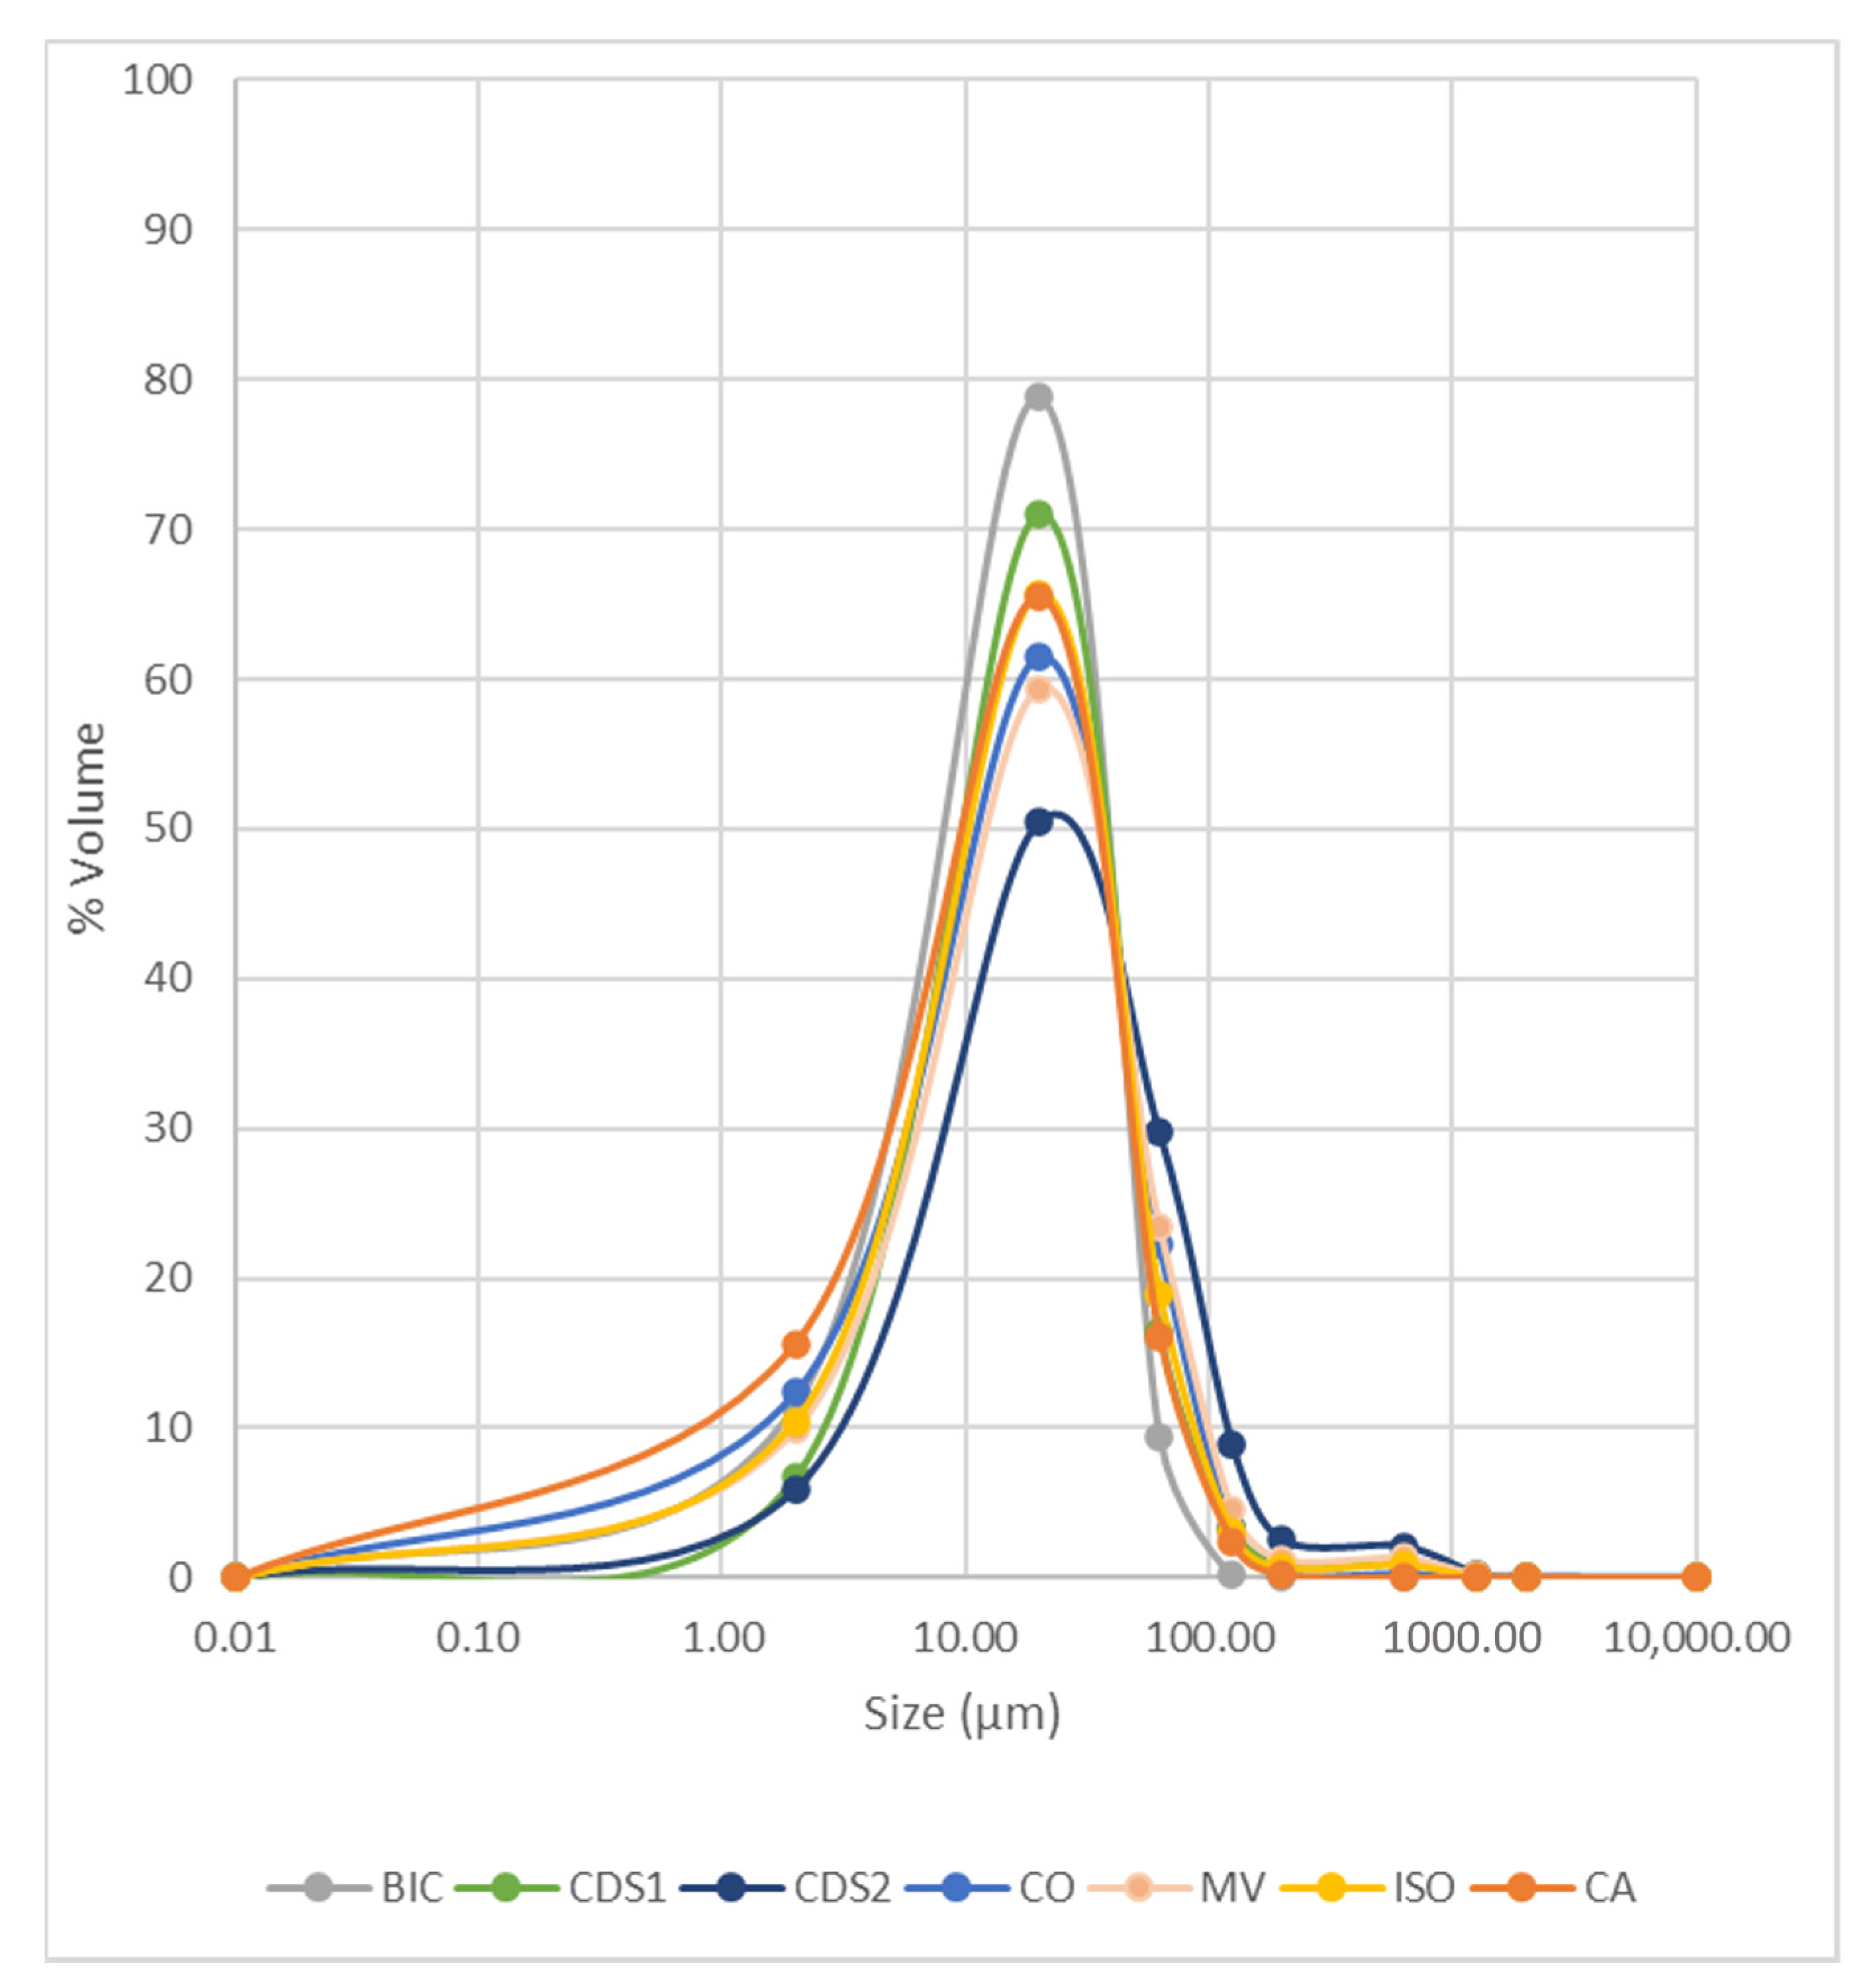
3.1.3. Particle Size Distribution
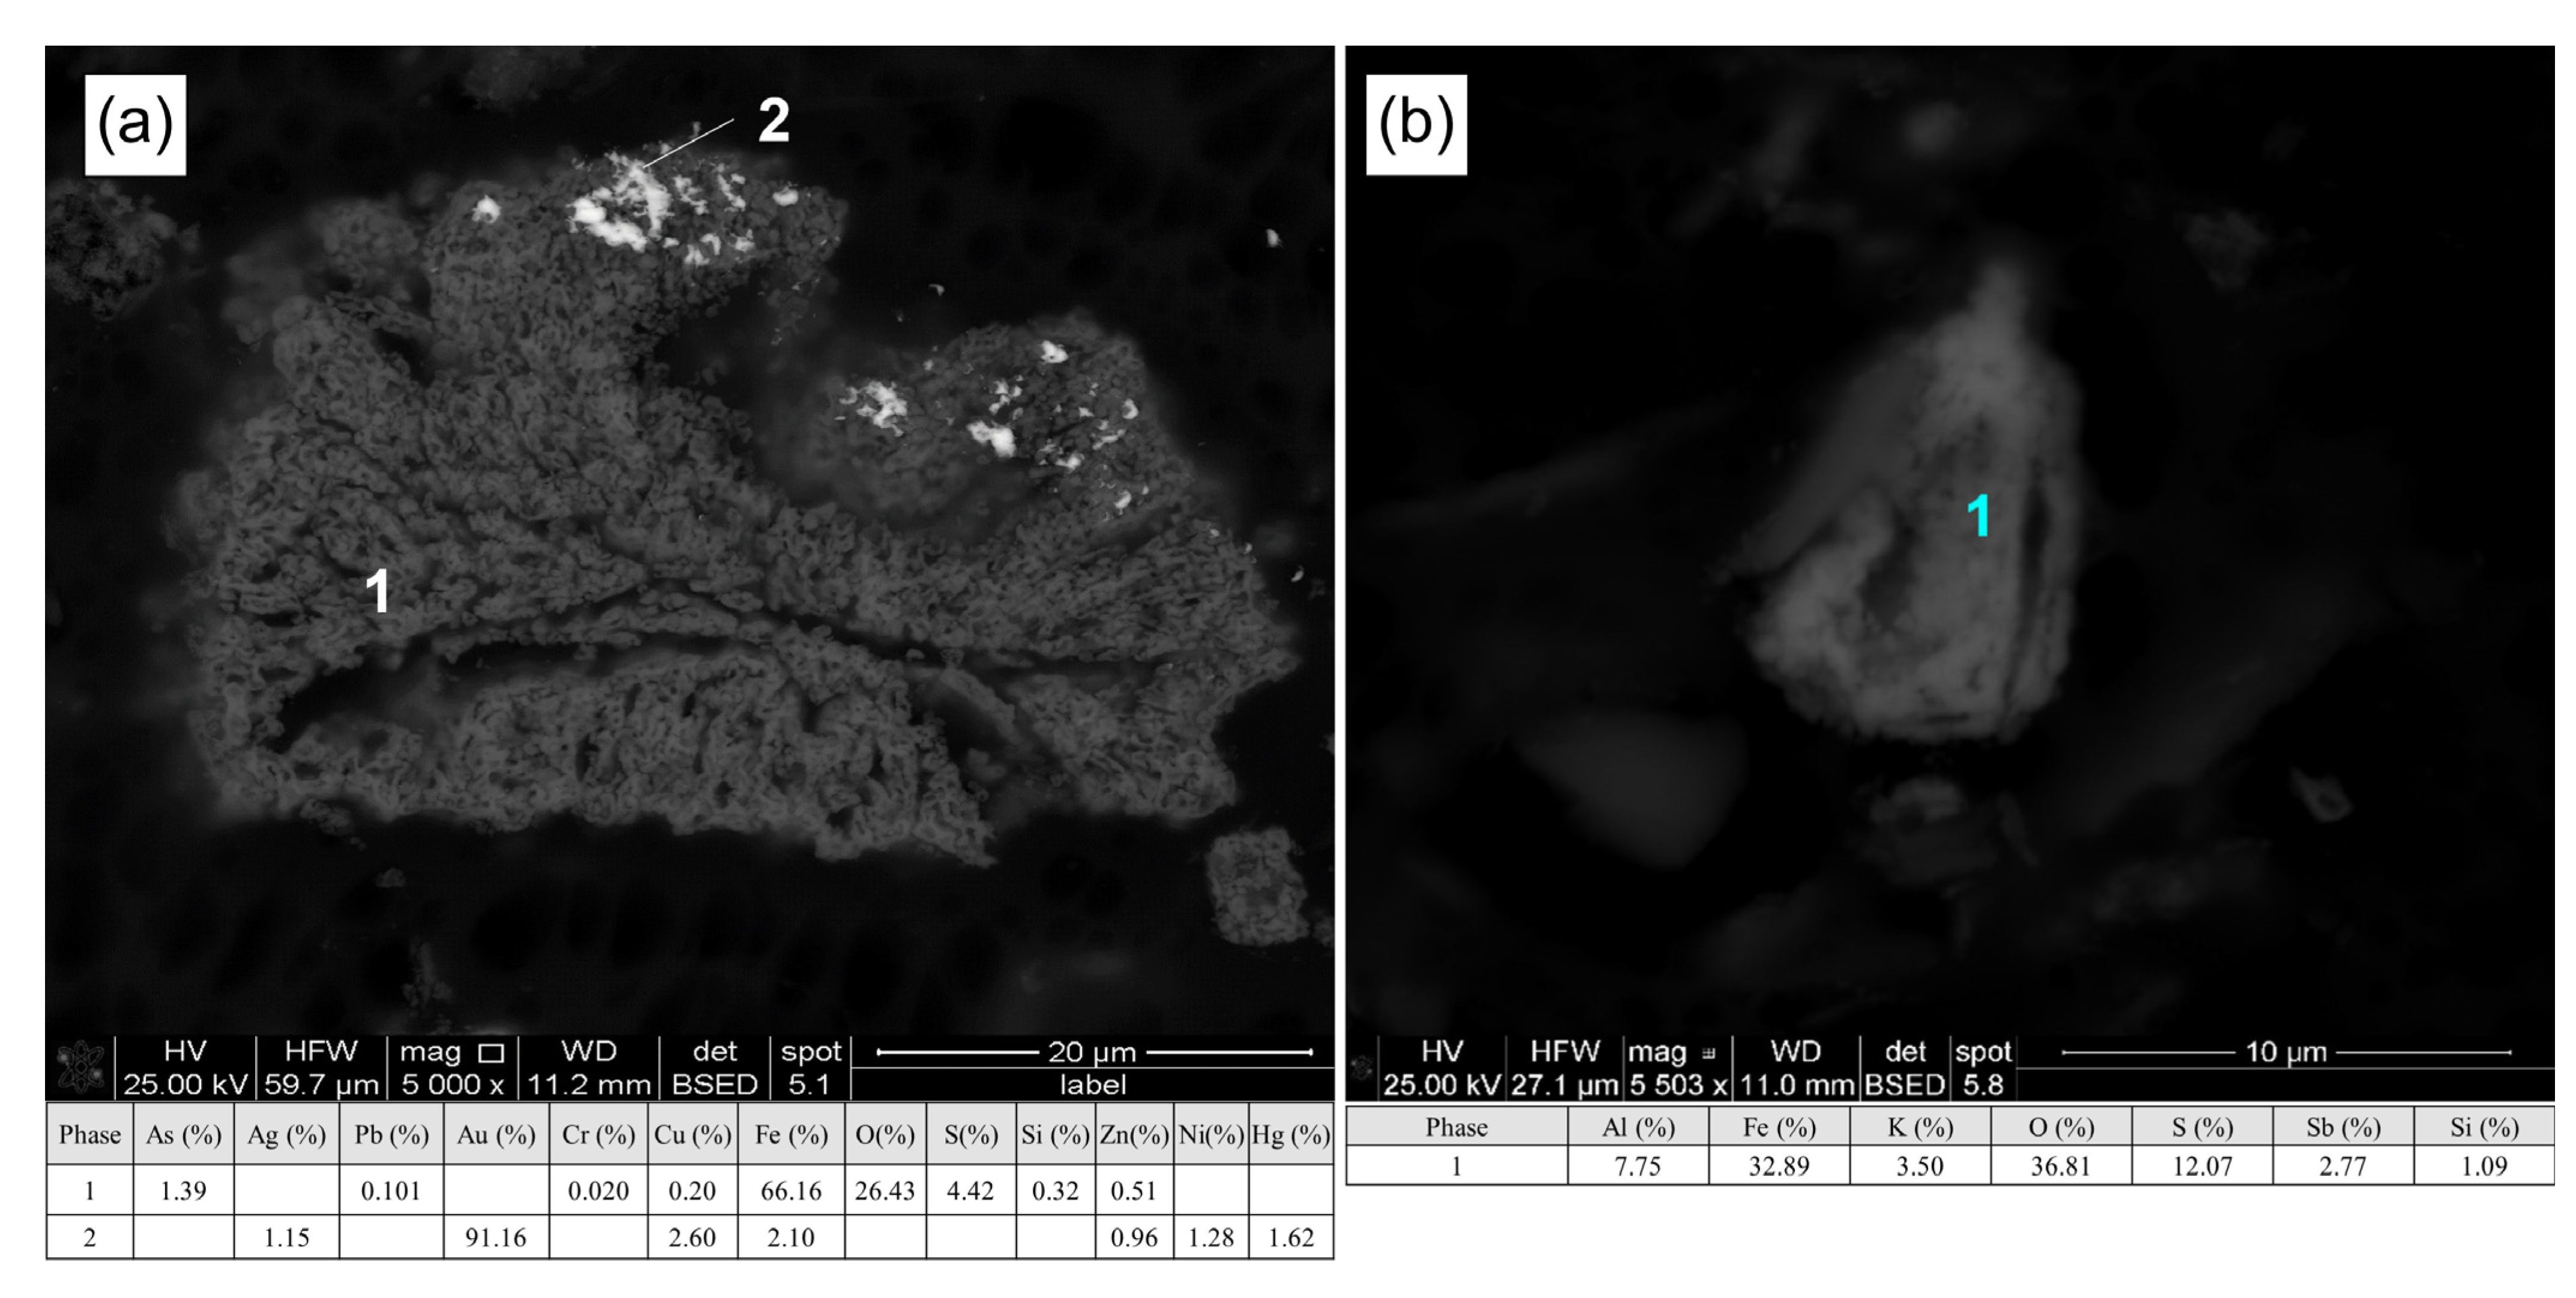
3.1.4. Mineralogy
3.2. Assessment of Potential Recovery/Reuse
3.2.1. Gold Extraction
3.2.2. Recovery and Stabilization of Arsenic and Antimony
3.2.3. Recovery of Gangue Minerals
4. Results and Discussion
4.1. Main Properties of Tailing Materials
4.1.1. Chemical Composition
4.1.2. Grain Size Distribution
4.1.3. Mineralogical Composition
- There is a predominance of 24 common minerals among the structures, with Quartz, Iron Oxides, Muscovite, Ankerite, Chlorite, Siderite, and Albite being the main ones;
- Depending on the structure, Quartz is commonly found in fractions above 6 µm and can be a potential product for applications in, e.g., civil construction. Previous research [52] suggests that tailings should have a SiO2 concentration above 15% and a maximum size of less than 1 mm to be used as an aggregate. The inclusion of tailings as fine aggregate in concrete has been shown to increase compressive strength. It is generally recommended to substitute no more than 30% of the fine aggregates with tailings to maintain durability. Additionally, the solidification of metals within the tailings can be beneficial, and the clinker can be produced using the tailings;
- Minerals from the Muscovite and Chlorite Groups are the most commonly found in fractions below 6 µm and can be utilized in products such as fertilizers and rock meal. Research [52] identified important specifications for these types of products, including the presence of Ca and Mg as carbonates, high alkalinity, good availability of P, average availability of K, and the presence of micronutrients such as Zn, B, Cu, Fe, and Mn;
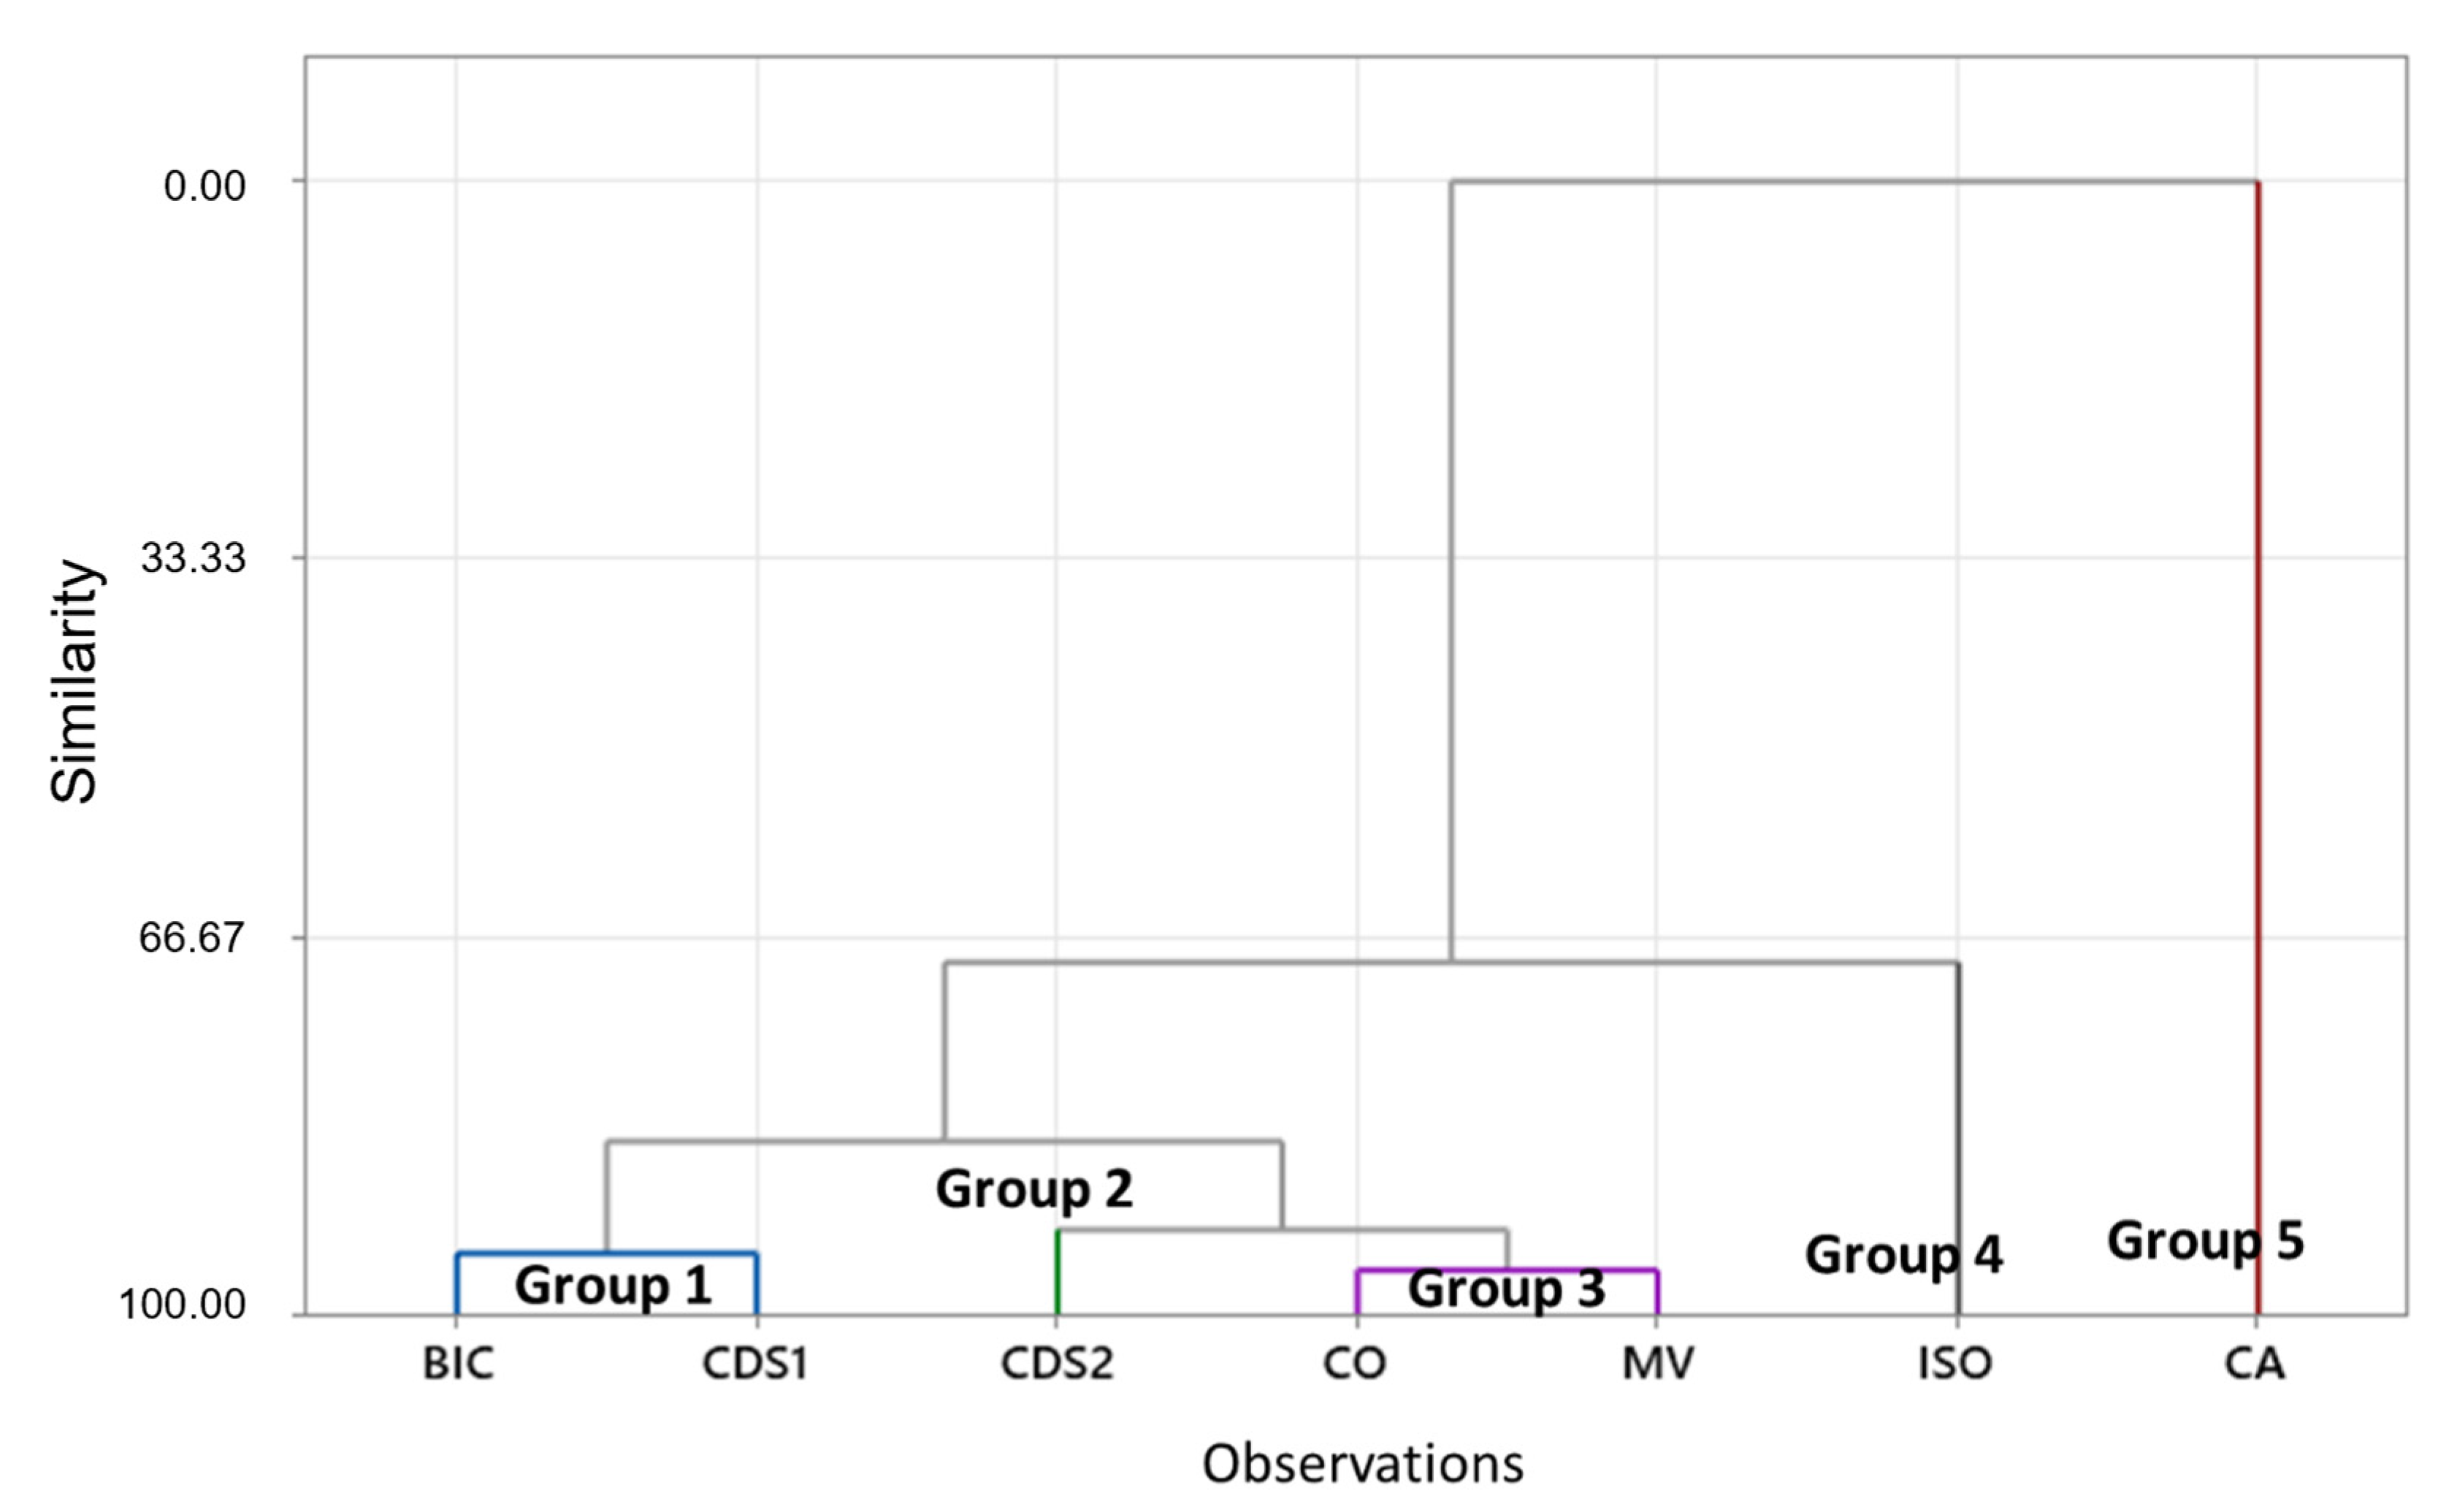
- The distribution of sulfides, if present, varies depending on each structure. Generally, they are found in finer fractions at BIC, CDS1, MV, and ISO, while coarser fractions contain sulfides in other structures. These sulfides may indicate the presence of noble metals such as Au, particularly because they are derived from this metal treatment process;
- CDS2 samples contain minerals and Sb compounds in finer fractions;
- CA samples are rich in Fe Oxides in fractions coarser than 6 µm.
- Consequently, this analysis allows for the identification of different potential products that can be derived from a single source.
4.2. Tests for Potential Recovery/Reuse
4.2.1. Au Recovery
4.2.2. Arsenic and Antimony Recovery
4.2.3. Selective Grinding, Pneumatic and Triboelectrostatic Separation—Other Products and Opportunities
5. Conclusions
Supplementary Materials
Author Contributions
Funding
Data Availability Statement
Acknowledgments
Conflicts of Interest
References
- Gomes, A.C.F. Estudo de Aproveitamento de Rejeito de Mineração. Master’s Thesis, Universidade Federal de Minas Gerais, Belo Horizonte, Brazil, February 2017. [Google Scholar]
- Gorakhki, M.H.; Bareither, C.A. Sustainable reuse of mine tailings and waste rock as water-balance covers. Minerals 2017, 7, 128. [Google Scholar] [CrossRef]
- Circular Economy of Metals and Responsible Mining. Available online: https://blogs.egu.eu/network/gfgd/2018/04/24/circular-economy-of-metals-and-responsible-mining/ (accessed on 1 April 2023).
- Mineração no Brasil Colonial. Available online: https://brasilescola.uol.com.br/historiab/mineracao-no-brasil-colonial.htm (accessed on 10 April 2023).
- Jones, H.; Boger, D.V. Sustainability and waste management in the resource industries. Ind. Eng. Chem. Res. 2012, 51, 10057–10065. [Google Scholar] [CrossRef]
- Silva, A.P.M.; Viana, J.P.; Cavalcante, A.L.B. Diagnóstico dos Resíduos Sólidos da Atividade de Mineração de Substâncias Não Energéticas; Instituto de Pesquisa Econômica Aplicada: Brasília, Brazil, 2012; 46p. [Google Scholar]
- Shafiee, S.; Topal, E. An overview of global gold market and gold price forecasting. Resour. Policy 2010, 35, 178–189. [Google Scholar] [CrossRef]
- Moraes, S.L.; Motta, F.G.; Massola, C.P.; Saccoccio, E.M.; Júnior, M.C. Rejeitos de mineração: Um olhar do cenário brasileiro-Parte I: Cadeia produtiva. In Anais dos Seminários de Redução, Minério de Ferro e Aglomeração, Proceedings of the 18° Simpósio de Mineração, São Paulo, Brasil, 2–6 Editora Blucher Octomber 2017; Institute for Technological Research: São Paulo, Brazil, 2017. [Google Scholar] [CrossRef]
- ANM. Available online: https://www.gov.br/anm/pt-br (accessed on 12 April 2023).
- Mesquita, P.P.D.; Carvalho, P.S.L.; Ogando, L.D. Desenvolvimento e inovação em mineração e metais. BNDES Set. 2021, 43, 325–361. [Google Scholar]
- Lalancette, J.M.; Lemieux, D.; Nasrallah, K.; Curiel, G.G.; Barbaroux, R. Method for Vitrification of Arsenic And Antimony. U.S. Patent 9981295 B2, 29 May 2015. Available online: https://patents.google.com/patent/US9981295B2/en (accessed on 1 January 2020).
- Lemos, M.G.; Valente, T.M.F.; Marinho Reis, A.P.; Fonsceca, R.; Dumont, J.M.; Ferreira, G.M.M.; Delbem, I.D. Geoenvironmental study of gold mining tailings in a circular economy context: Santa Barbara, Minas Gerais, Brazil. Mine Water Environ. 2021, 40, 257–269. [Google Scholar] [CrossRef]
- Lemos, M.; Valente, T.; Marinho Reis, P.; Fonseca, R.; Delbem, I.; Ventura, J.; Magalhães, M. Mineralogical and geochemical characterization of gold mining tailings and their potential to generate acid mine drainage (Minas Gerais, Brazil). Minerals 2021, 11, 39. [Google Scholar] [CrossRef]
- Parviainen, A.; Soto, F.; Caraballo, M.A. Revalorization of Haveri Au-Cu mine tailings (SW Finland) for potential reprocessing. J. Geochem. Explor. 2020, 218, 106614. [Google Scholar] [CrossRef]
- Study on the Critical Raw Materials for the EU 2023—Final Report. Available online: https://single-market-economy.ec.europa.eu/publications/study-critical-raw-materials-eu-2023-final-report_en (accessed on 14 June 2023).
- European Commission. Communication from the Commission to the European Parliament, the Council, the European Economic and Social Committee and the Committee of the Regions: Critical Raw Materials Resilience: Charting a Path Towards Greater Security and Sustainability, 474 Final; European Commission: Brussels, Belgium, 2020; 28p. [Google Scholar]
- Antunes, M.; Fernandes, R.; Pinheiro, A.; Valente, T.M.F.; Nascimento, S. Potential of reuse and environmental behavior of ochre-precipitates from passive mine treatment. In IMWA 2010 Proceedings, Proceedings of the International Mine Water Association Symposium—Mine Water and Innovative Thinking, Sydney, Canada, 5–9 September 2010; Wolkersdorfer, C., Freund, A., Eds.; Wolkersdorfer & Freund: Aachen, Germany; pp. 205–208.
- Nwaila, G.T.; Ghorbani, Y.; Zhang, S.E.; Frimmel, H.E.; Tolmay, L.C.; Rose, D.H.; Nwaila, P.C.; Bourdeau, J.E. Valorisation of mine waste-Part I: Characteristics of, and sampling methodology for, consolidated mineralised tailings by using Witwatersrand gold mines (South Africa) as an example. J. Environ. Manag. 2021, 295, 113013. [Google Scholar] [CrossRef]
- Sibanda, L.K.; Broadhurst, J.L. Exploring an alternative approach to mine waste management in the South African gold sector of the article. In Proceedings of the 11th ICARD|IMWA|MWD Conference–“Risk to Opportunity”, Pretoria, South Africa, 10–14 September 2018; Wolkersdorfer, C., Sartz, L., Weber, A., Burgess, J., Tremblay, G., Eds.; pp. 1130–1135. [Google Scholar]
- Dehghani, A.; Ostad-Rahimi, M.; Mojtahedzadeh, S.H.; Gharibi, K.K. Recovery of gold from the Mouteh Gold Mine tailings dam. J. South. Afr. Inst. Min. Metall. 2009, 109, 417–421. [Google Scholar]
- Cairncross, K.H.; Tadie, M. Life cycle assessment as a design consideration for process development for value recovery from gold mine tailings. Miner. Eng. 2022, 183, 107588. [Google Scholar] [CrossRef]
- Muir, A.; Mitchell, J.; Flatman, S.R.; Sabbagha, C. A practical guide to re-treatment of gold processing residues. Miner. Eng. 2005, 18, 811–824. [Google Scholar] [CrossRef]
- PanAfrican Resources Mineral Resources and Mineral Reserves Report for the Year Ended 30 June 2018. Available online: https://www.miningnewsfeed.com/reports/annual/Pan-African-Resources-MRMR-report-2018.pdf (accessed on 12 April 2023).
- Monte, M.B.M.; Grisol, S.; Duque, T.F.M.B.; Fenelon, P.A.; Junior, G.G.O. Flotação seletiva para o reprocessamento de rejeitos provenientes do processo de lixiviação da Kinross Paracatu. Braz. Appl. Sci. Rev. 2020, 4, 2720–2728. [Google Scholar] [CrossRef]
- Ince, C. Reusing gold-mine tailings in cement mortars: Mechanical properties and socio-economic developments for the Lefke-Xeros area of Cyprus. J. Clean. Prod. 2019, 238, 117871. [Google Scholar] [CrossRef]
- Mapinduzi, R.P.; Bujulu, P.; Mwegoha, W.J. Potential for reuse of gold mine tailings as secondary construction materials and Phytoremediation. Int. J. Environ. Sci. 2016, 7, 49–61. [Google Scholar] [CrossRef]
- Yao, G.; Liu, Q.; Wang, J.; Wu, P.; Lyu, X. Effect of mechanical grinding on pozzolanic activity and hydration properties of siliceous gold ore tailings. J. Clean. Prod. 2019, 217, 12–21. [Google Scholar] [CrossRef]
- Sánchez-Peña, N.E.; Narváez-Semanate, J.L.; Pabón-Patiño, D.; Fernández-Mera, J.E.; Oliveira, M.L.S.; Boit, K.; Tutikian, B.F.; Crissien, T.J.; Pinto, D.C.; Serrano, I.D.; et al. Chemical and nano-mineralogical study for determining potential uses of legal Colombian gold mine sludge: Experimental evidence. Chemosphere 2018, 191, 1048–1055. [Google Scholar] [CrossRef]
- Swaroop, G.; Bulbule, K.A.; Parthasarathy, P.; Shivakumar, Y.; Muniswamy, R.; Annamati, R.; Priyanka, D. Application of Gold Ore Tailings (GOT) as a source of micronutrients for the growth of plants. Int. J. Sci. World 2013, 1, 68–78. [Google Scholar]
- Goldfarb, R.J.; Groves, D.I.; Gardoll, S. Orogenic gold and geologic time: A global synthesis. Ore Geol. Rev. 2001, 18, 1–75. [Google Scholar] [CrossRef]
- Lobato, L.M.; Ribeiro-Rodrigues, L.C.; Vieira, F.W.R. Brazil’s premier gold province. Part II: Geology and genesis of gold deposits in the Archean Rio das Velhas greenstone belt, Quadrilátero Ferrífero. Miner. Depos. 2001, 36, 249–277. [Google Scholar] [CrossRef]
- Roeser, H.M.P.; Roeser, P.A. O Quadrilátero Ferrífero-MG, Brasil: Aspectos sobre sua história, seus recursos minerais e problemas ambientais relacionados. Geonomos 2010, 18, 33–37. [Google Scholar] [CrossRef]
- Moura, W. Especiação de Cianeto para Redução do Consumo no Circuito de Lixiviação de Calcinado da Usina do Queiróz. Master’s Thesis, Universidade Federal de Minas Gerais, Belo Horizonte, Brazil, 2005. [Google Scholar]
- Lemos, M.; Valente, T.; Reis, P.; Fonseca, R.; Pantaleão, J.P.; Guabiroba, F.; Filho, J.G.; Magalhães, M.; Delbem, I. Caracterização Mineralógica, Geoquímica e Potencial de Valorização de Resíduos de Mineração de Ouro (Minas Gerais, Brasil). In Proceedings of the XXIX Encontro Nacional de Tratamento de Minérios e Metalurgia Extrativa, Armação dos Búzios, Brazil, 25–28 September 2022. [Google Scholar]
- Ashanti, A.G. AngloGold Ashanti AngloGold Ashanti Recommendations; AngloGold Ashanti: Johannesburg, South Africa, 2016. [Google Scholar]
- Valente, T.M.; Antunes, M.; Sequeira Braga, A.; Prudêncio, M.I.; Marques, R.; Pamplona, J. Mineralogical attenuation for metallic remediation in a passive system for mine water treatment. Environ. Earth Sci. 2012, 66, 39–54. [Google Scholar] [CrossRef]
- Hastie, T.; Tibshirani, R.; Friedman, J. The Elements of Statistical Learning: Data Mining, Inference, and Prediction, 2nd ed.; Springer: New York, NY, USA, 2009; 764p. [Google Scholar]
- Lemos, M.; Valente, T.; Reis, P.M.; Fonseca, R.; Pantaleão, J.P.; Guabiroba, F.; Filho, J.G.; Magalhães, M.; Afonseca, B.; Silva, A.R.; et al. Geochemistry and mineralogy of auriferous tailings deposits and their potential for reuse in Nova Lima Region, Brazil. Sci. Rep. 2023, 13, 4339. [Google Scholar] [CrossRef]
- Cho, H.C.; Oh, W.; Han, O.H.; Kang, H.H.; Lee, J.S. Recovery of valuable materials from gold mine tailings. In Separation Technologies for Minerals, Coal, and Earth Resources, 7th ed.; Young, C.A., Luttrell, G.H., Eds.; Society for Mining, Metallurgy, and Exploration: Englewood, NJ, USA, 2012; pp. 277–287. [Google Scholar]
- Ferguson, D.N. A basic triboelectric series for heavy minerals from inductive electrostatic separation behaviour. J. South. Afr. Inst. Min. Metall. 2010, 110, 75–78. [Google Scholar]
- Jordan, C.E.; Sullivan, G.V.; Davis, B. Report of Investigations 8457, Pneumatic concentration of Mica; US Bureau of Mines Report Investigations: Pittsburgh, PA, USA, 1980; pp. 1–24. [Google Scholar]
- Emrullahoglu, O.F.; Kara, M.; Tolun, R.; Celik, M.S. Beneficiation of calcined colemanite tailings. Powder Technol. 1993, 77, 215–217. [Google Scholar] [CrossRef]
- Yang, J.; Xu, W.; Deng, X.; Li, H.; Ma, S. Research on the Selective Grinding of Zn and Sn in Cassiterite Polymetallic Sulfide Ore. Minerals 2022, 12, 245. [Google Scholar] [CrossRef]
- Peiravi, M.; Dehghani, F.; Ackah, L.; Baharlouei, A.; Godbold, J.; Liu, J.; Mohanty, M.; Ghosh, T. A review of rare-earth elements extraction with emphasis on non-conventional sources: Coal and coal byproducts, iron ore tailings, apatite, and phosphate byproducts. Min. Metall. Explor. 2021, 38, 1–26. [Google Scholar] [CrossRef]
- Okereafor, U.; Makhatha, M.; Mekuto, L.; Mavumengwana, V. Gold mine tailings: A potential source of silica sand for glass making. Minerals 2020, 10, 448. [Google Scholar] [CrossRef]
- Valente, T.; Grande, J.A.; De La Torre, M.L. Extracting value resources from acid mine drainages and mine wastes in the Iberian Pyrite Belt. In Proceedings of the IMWA 2016—Mining Meets Water—Conflicts and Solutions, Leipzig, Germany, 11–15 July 2016; Drebenstedt, C., Paul, M., Eds.; Technische Universität Bergakademie: Freiberg, Germany, 2016; pp. 1339–1340. [Google Scholar]
- Luckeneder, S.; Giljum, S.; Schaffartzik, A.; Maus, V.; Tost, M. Surge in global metal mining threatens vulnerable ecosystems. Glob. Environ. Chang. 2021, 69, 102303. [Google Scholar] [CrossRef]
- Marion, C.; Grammatikopoulos, T.; Rudinsky, S.; Langlois, R.; Williams, H.; Chu, P.; Awais, M.; Gauvin, R.; Rowson, N.A.; Waters, K.E. A mineralogical investigation into the pre-concentration of the Nechalacho deposit by gravity separation. Miner. Eng. 2018, 121, 1–13. [Google Scholar] [CrossRef]
- Yang, X.; Wang, H.; Peng, Z.; Hao, J.; Zhang, G.; Xie, W.; He, Y. Triboelectric properties of ilmenite and quartz minerals and investigation of triboelectric separation of ilmenite ore. Int. J. Min. Sci. Technol. 2018, 28, 223–230. [Google Scholar] [CrossRef]
- Bada, S.O.; Tao, D.; Honaker, R.Q.; Falcon, L.M.; Falcon, R.M.S. A study of rotary tribo-electrostatic separation of South African fine coal. Int. J. Coal Prep. Util. 2010, 30, 154–172. [Google Scholar] [CrossRef]
- Whitney, D.L.; Evans, B.W. Abbreviations for names of rock-forming minerals. Am. Mineral. 2010, 95, 185–187. [Google Scholar] [CrossRef]
- Gou, M.; Zhou, L.; Then, N.W.Y. Utilization of tailings in cement and concrete: A review. Sci. Eng. Compos. Mater. 2019, 26, 449–464. [Google Scholar] [CrossRef]


| Structure | N 1 | Element | Mean | SD 2 | Min 3 | Max 4 | N 1 | Element | Mean | SD 2 | Min 3 | Max 4 | N 1 | Element | Mean | SD 2 | Min 3 | Max 4 |
|---|---|---|---|---|---|---|---|---|---|---|---|---|---|---|---|---|---|---|
| BIC | 162 | Ag (mg/Kg) | 0.441 | 0.211 | 0.07 | 0.79 | 162 | Au (mg/Kg) | 0.59 | 1.17 | 0.025 | 7.26 | 111 | Cr (mg/kg) | 337 | 156 | 144 | 628 |
| CDS1 | 175 | 1.54 | 0.449 | 1.5 | 7 | 175 | 0.363 | 0.235 | 0.025 | 2.17 | 150 | 283 | 58.1 | 166 | 490 | |||
| CDS2 | 293 | 1.52 | 0.237 | 1.5 | 4 | 293 | 0.742 | 0.937 | 0.24 | 12.7 | 293 | 198 | 38.8 | 118 | 323 | |||
| CO | 282 | 1.51 | 0.134 | 1.5 | 3 | 282 | 0.911 | 0.715 | 0.003 | 8.71 | 282 | 142 | 50.3 | 40 | 423 | |||
| MV | 615 | 0.515 | 1.66 | 0.25 | 13.8 | 615 | 0.126 | 0.353 | 0.001 | 5.17 | 615 | 137 | 126 | 13.3 | 650 | |||
| ISO | 266 | 1.37 | 0.42 | 0.05 | 1.5 | 266 | 0.649 | 0.793 | 0.001 | 5.99 | 251 | 102 | 79.3 | 0.1 | 311 | |||
| CA | 230 | 8.49 | 2.29 | 0.05 | 15 | 230 | 2.39 | 1.08 | 0.001 | 9.45 | 230 | 98.3 | 36.9 | 0.1 | 308 | |||
| BIC | 111 | Mo (mg/kg) | 0.914 | 0.351 | 0.49 | 1.85 | 111 | As (%) | 0.179 | 0.338 | 0.001 | 2.18 | 70 | Pb (mg/kg) | 163 | 148 | 7 | 429 |
| CDS1 | 150 | 1.68 | 0.733 | 1.5 | 7 | 150 | 0.122 | 0.403 | 0.001 | 5.00 | 150 | 51.6 | 18.1 | 4 | 100 | |||
| CDS2 | 291 | 1.5 | 0.0 | 1.5 | 1.5 | 291 | 0.093 | 0.095 | 0.001 | 0.657 | 111 | 69.6 | 28.2 | 16 | 171 | |||
| CO | 282 | 2.12 | 2.55 | 1.5 | 23 | 282 | 0.223 | 6.01 | 0.001 | 58.8 | 248 | 46 | 22.4 | 4 | 124 | |||
| MV | 321 | 2.17 | 3.06 | 0.5 | 11.6 | 321 | 0.595 | 5.97 | 0.001 | 87.5 | 293 | 30.9 | 71.9 | 2.03 | 564 | |||
| ISO | 266 | 1.37 | 0.42 | 0.05 | 1.5 | 266 | 0.717 | 0.945 | 0.001 | 5.7 | 133 | 30 | 89.1 | 0.1 | 749 | |||
| CA | 230 | 7.2 | 1.78 | 0.05 | 10 | 230 | 0.725 | 0.466 | 0.001 | 4.80 | 218 | 241 | 64.4 | 0.1 | 383 | |||
| BIC | 162 | Co (mg/kg) | 54.5 | 35 | 19.3 | 137 | 162 | Sb (%) | 0 | 0 | 0 | 0.002 | 111 | Cu (%) | 0.005 | 0.009 | 0.001 | 0.06 |
| CDS1 | 175 | 93.4 | 39.2 | 18 | 273 | 175 | 0.013 | 0.01 | 0.001 | 0.056 | 150 | 0.007 | 0.001 | 0.001 | 0.012 | |||
| CDS2 | 293 | 21.4 | 6.22 | 4 | 42 | 293 | 0.104 | 0.184 | 0.001 | 0.988 | 293 | 0.01 | 0.008 | 0.001 | 0.04 | |||
| CO | 282 | 19.6 | 11.7 | 4 | 76 | 282 | 0.003 | 0 | 0.003 | 0.003 | 282 | 0.019 | 0.018 | 0.001 | 0.266 | |||
| MV | 615 | 34.6 | 46.2 | 5.53 | 361 | 615 | 0.001 | 0 | 0.001 | 0.001 | 615 | 0.001 | 0 | 0.001 | 0.001 | |||
| ISO | 266 | 33.1 | 34.1 | 0.10 | 214 | 266 | 0.002 | 0 | 0.002 | 0.002 | 251 | 0.04 | 0.046 | 0.001 | 0.17 | |||
| CA | 230 | 132 | 35.8 | 0.10 | 195 | 230 | 0.004 | 0.008 | 0.001 | 0.059 | 230 | 0.086 | 0.029 | 0.001 | 0.16 | |||
| BIC | 163 | Cd (mg/kg) | 0.148 | 0.056 | 0.03 | 0.24 | ||||||||||||
| CDS1 | 51.6 | 1.5 | 0 | 1.5 | 1.5 | |||||||||||||
| CDS2 | 69.6 | 1.5 | 0 | 1.5 | 1.5 | |||||||||||||
| CO | 46 | 1.52 | 0.277 | 1.5 | 5 | |||||||||||||
| MV | 30.9 | 0.285 | 0.259 | 0.05 | 0.95 | |||||||||||||
| ISO | 30 | 1.34 | 0.461 | 0.05 | 1.5 | |||||||||||||
| CA | 241 | 1 | 0.866 | 0.05 | 1.5 | |||||||||||||
| Mineral | Chemical Composition (Ideal Formula) | BIC (Wt%) | CDS1 (Wt%) | CDS2 (Wt%) | CO (Wt%) | MV (Wt%) | ISO (Wt%) | CA (Wt%) |
|---|---|---|---|---|---|---|---|---|
| Quartz | SiO2 | 31.57 | 34.18 | 35.6 | 55.8 | 37.83 | 36.65 | 15.6 |
| Feldspar Group | ||||||||
| Albite | NaAlSi3O8 | 5.33 | 0.07 | 1.11 | 0.37 | 7.56 | 2.81 | 1.5 |
| Anorthite | CaAl2Si2O8 | - | 0.07 | 0.053 | 0.01 | 0.03 | 0.01 | 0.053 |
| K feldspar | KAlSi3O8 | 0.12 | 1.18 | 1.27 | 0.39 | 0.73 | 1.22 | - |
| Phyllosilicates | ||||||||
| Biotite | KMg2.5Fe2+0.5AlSi3O10(OH)1.75F0.25 | 0.11 | 1.74 | 1.26 | 0.16 | 2.55 | 0.52 | 1 |
| Muscovite | KAl3Si3O10(OH)1.9F0.1 | 6.53 | 38.46 | 29 | 5.69 | 28.85 | 20.58 | 12.8 |
| Chlorite | (Mg,Fe)3(Si,Al)4O10(OH)2·(Mg,Fe)3(OH)6 | 2.44 | 3.34 | 5.01 | 6.12 | 1.28 | 5.83 | 3.3 |
| Oxides | ||||||||
| Hematite | Fe2O3 | - | 17.09 | 0.378 | 8.86 | 9.06 | 8.95 | 56.8 |
| Fe antimoniate | FeSb(As)O | - | 0.07 | 0.806 | - | - | - | - |
| Rutile/Anathase | TiO2 | 0.19 | 0.29 | 0.599 | 0.49 | 0.60 | 0.56 | 0.599 |
| Carbonates | ||||||||
| Ankerite | Ca(Fe, Mg, Mn)(CO3)O2 | 16.84 | 0.02 | 9 | 11.2 | 1.49 | 0.85 | 1 |
| Siderite | FeCO3 | 2.92 | 0.17 | 7.2 | 7.25 | 0.01 | 8.94 | - |
| Calcite | CaCO3 | 0.02 | 0.05 | 5.4 | 2.25 | 0.23 | - | 0.2 |
| Sulfates | ||||||||
| Jarosite (Sb) | KFe(SO4)2(OH)6 and (H3O)Fe(SO4)2(OH)6 | - | - | 1.00 | - | - | - | - |
| Gypsum | CaSO4 2H2O | - | - | 2.00 | 0.03 | - | - | 7.00 |
| Sulfides | Total | 9.92 | 0.03 | 0.36 | 1.61 | 0.23 | 6.85 | 0.17 |
| Pyrite | Fe2+S2 | 5.31 | 0.03 | 0.08 | 0.5 | 0.06 | 0.22 | 0.002 |
| Pyrrhotite | Fe2+0.95S | 2.06 | - | 0.041 | 0.79 | 0.148 | 4.7 | 0.004 |
| Arsenopyrite | Fe3+AsS | 2.52 | - | 0.056 | 0.24 | 0.022 | 1.71 | 0.056 |
| Berthierite | FeSb2S4 | - | - | 0.141 | - | - | - | - |
| Chalcopyrite | CuFeS2 | 0.01 | - | 0.028 | - | - | 0.21 | - |
| Gesdorffite | NiAsS | 0.02 | - | - | - | - | - | 0.01 |
| Covellite | CuS | - | - | - | 0.07 | - | 0.01 | 0.1 |
| Sphalerite | ZnS | - | - | 0.009 | 0.01 | - | - | - |
| Au Minerals * | ||||||||
| Au Content (mg/kg) | 0.59 | 0.363 | 0.742 | 0.911 | 0.126 | 0.649 | 2.39 | |
| Native Au | Au > 80%, Ag, Cu, Hg, Fe, Ni | 45 | 20 | 158 | 364 | 2 | 60 | 526 |
| Electrum | Au = 80%, Ag = 20% | 8 | 5 | 6 | 10 | 1 | 5 | 42 |
| Sample | Size Fraction | Mass (%) | Minerals (wt%) * | ||||||||||||||||
|---|---|---|---|---|---|---|---|---|---|---|---|---|---|---|---|---|---|---|---|
| Py | Fe hox/ox | Po | Apy | Qz | Ank | Cal | Ab | Sd | Ms Group | Chl Group | Kfs | Rt | Gp | Ap | Jrs (Sb) | Fe Ant | |||
| BIC | >6 µm | 88.5 | 0.001 | - | 11.2 | 5.30 | 66.4 | - | - | 5.90 | 0.0 | - | 7.50 | 2.57 | 1.18 | - | - | - | - |
| <6 µm | 15.0 | 5.94 | - | - | - | 0.023 | 2.45 | - | 0.012 | 25.8 | 59.3 | 6.53 | - | - | - | - | - | - | |
| CDS1 | >6 µm | 93.3 | 0.013 | 21.5 | 0.033 | 0.013 | 43.0 | 0.023 | 0.063 | 0.089 | 0.213 | 25.8 | 7.33 | 1.48 | 0.360 | - | - | - | 0.078 |
| <6 µm | 6.67 | 0.027 | 8.77 | 1.25 | 0.019 | 25.5 | 0.016 | 0.068 | 0.164 | 0.750 | 50.4 | 0.387 | 2.72 | 0.973 | - | - | - | 8.97 | |
| CDS2 | >6 µm | 94 | 0.094 | - | 0.183 | 0.128 | 81.4 | - | - | 2.53 | - | 10.2 | - | 2.83 | 1.32 | - | 0.459 | 0.432 | 0.432 |
| <6 µm | 6 | - | - | - | - | 0.274 | 18.8 | - | 0.013 | 15.0 | 51.1 | 10.4 | 0.080 | 0.050 | 4.17 | 0 | 0.061 | 0.049 | |
| CO | >6 µm | 87.6 | - | - | 0.822 | 0.402 | 93.1 | - | - | 0.613 | - | 0.602 | 2.68 | 0.637 | 0.805 | - | 0.335 | - | - |
| <6 µm | 12.4 | 2.69 | - | 0.031 | - | 0.695 | 38.2 | - | 0.014 | 24.7 | 18.2 | 15.4 | 0.033 | 0.032 | - | - | - | - | |
| MV | >6 µm | 90.1 | 0.170 | 10.3 | 0.063 | 0.025 | 43.4 | 1.70 | - | 8.64 | 0.013 | 32.8 | 1.47 | 0.787 | 0.680 | - | - | - | - |
| >6 µm | 90.1 | 0.170 | 10.3 | 0.063 | 0.025 | 43.4 | 1.70 | - | 8.64 | 0.013 | 32.8 | 1.47 | 0.787 | 0.680 | - | - | - | - | |
| ISO | >6 µm | 89.5 | 0.00 | 16.5 | - | 3.20 | 68.7 | - | - | 5.19 | 0.0 | - | 3.20 | 2.27 | 1.03 | - | - | - | - |
| <6 µm | 10.5 | 11.8 | 0.488 | 0.552 | 0.016 | 0.295 | 2.13 | - | 0.121 | 22.5 | 51.7 | 10.4 | 0.034 | 0.036 | - | - | - | - | |
| CA | >6 µm | 84.4 | - | 76.1 | - | - | 20.4 | - | - | 1.78 | - | 0.905 | - | - | 0.768 | - | - | - | - |
| <6 µm | 15.0 | - | 8.37 | - | - | 3.59 | 3.68 | 0.736 | 0.833 | - | 44.7 | 12.1 | - | 0.180 | 25.8 | - | - | - | |
| Group | Samples | Au Recovery | As Recovery | Sb Recovery | Fe Recovery | Others * |
|---|---|---|---|---|---|---|
| Group 1 | BIC + CDS1 | H | L | L | L | H |
| Group 2 | CDS2 | H | M | H | L | H |
| Group 3 | CO + MV | H | L | L | L | H |
| Group 4 | ISO | H | H | L | M | H |
| Group 5 | CA | H | H | L | H | L |
| Group | Calculated Feed Grade (mg/kg) | Au Mineralogical Association | Procedure 1 *1 | Procedure 2 *2 | Procedure 3 *3 | |
|---|---|---|---|---|---|---|
| Structures | (% Au Recovery) | |||||
| 1 | BIC + CDS1 *4 | 0.740 | sulfides and Quartz | 29.5 | 30.9 | 77.7 |
| 2 | CDS2 | 0.742 | 49.9 | 70.7 | 34.9 | |
| 3 | CO + MV *4 | 0.735 | 71.8 | 59.4 | 66.4 | |
| 4 | ISO | 1.16 | 64.0 | 48.2 | 78.5 | |
| 5 | CA | 2.39 | Fe Oxides | 32.2 | - | 0.60 |
| Group | Sb Feed Grade (%) | As Feed Grade (%) | Procedure 4 (One Stage of Klin Roasting) | Procedure 4 (Two Stages of Klin Roasting) | Procedure 5 (As e Sb Vitrification) | ||||
|---|---|---|---|---|---|---|---|---|---|
| Samples | Sb Recovery (%) | As Recovery (%) | Sb Recovery (%) | As Recovery (%) | Sb Recovery (%) | As Recovery (%) | |||
| 2 | CDS2 | 0.104 | 0.010 | 2.00 | 1.00 | 18.7 | 3.97 | ||
| 5 | CA | 0.080 | 0.776 | 75.0 | 93.7 | ||||
| Group | Samples | Size (µm) | S1 * | S2 ** | Products Chemical Quality | ||||||||||
|---|---|---|---|---|---|---|---|---|---|---|---|---|---|---|---|
| w (%) | w (%) | Al (%) | As (%) | Au (mg/kg) | Ca (%) | Fe (%) | K (%) | Mg (%) | Na (%) | S (%) | Si (%) | ||||
| 3 | CO + MV | >30 | 69.8 | - | - | 3.04 | 0.036 | 0.690 | 3.68 | 6.95 | 0.856 | 1.44 | 0.190 | 1.13 | 30.4 |
| 30–6 | 23.1 | E1 | 14.6 | 26.2 | 0.100 | 0.260 | 2.10 | 9.30 | 4.00 | 1.0 | 0.400 | 0.900 | 44.4 | ||
| E2 | 8.56 | 6.50 | 0.400 | 1.19 | 8.00 | 17.9 | 1.00 | 2.10 | 0.700 | 4.10 | 44.4 | ||||
| <6 | 7.04 | - | - | 11.4 | 0.100 | 0.890 | 1.97 | 9.88 | 3.70 | 1.62 | 0.264 | 1.73 | 20.6 | ||
| 5 | CA | >30 | 71.5 | - | - | 1.19 | 0.062 | 3.16 | 0.339 | 53.0 | 0.307 | 0.436 | 0.107 | 0.063 | 7.99 |
| 30–6 | 21.9 | E1 | 7.67 | 8.50 | 2.00 | 1.36 | 3.40 | 49.3 | 1.70 | 1.70 | 0.800 | 0.30 | 24.8 | ||
| E2 | 14.3 | 6.50 | 2.00 | 2.46 | 3.40 | 58.4 | 0.900 | 1.00 | 0.500 | 0.40 | 19.8 | ||||
| <6 | 6.62 | - | - | 3.64 | 0.169 | 1.13 | 0.286 | 47.5 | 0.763 | 1.43 | 0.175 | 0.073 | 8.41 | ||
Disclaimer/Publisher’s Note: The statements, opinions and data contained in all publications are solely those of the individual author(s) and contributor(s) and not of MDPI and/or the editor(s). MDPI and/or the editor(s) disclaim responsibility for any injury to people or property resulting from any ideas, methods, instructions or products referred to in the content. |
© 2023 by the authors. Licensee MDPI, Basel, Switzerland. This article is an open access article distributed under the terms and conditions of the Creative Commons Attribution (CC BY) license (https://creativecommons.org/licenses/by/4.0/).
Share and Cite
Lemos, M.G.; Valente, T.M.; Marinho Reis, A.P.; Ferreira Fonseca, R.M.; Guabiroba, F.; da Mata Filho, J.G.; Magalhães, M.F.; Delbem, I.D.; Rebelo Diório, G. Adding Value to Mine Waste through Recovery Au, Sb, and As: The Case of Auriferous Tailings in the Iron Quadrangle, Brazil. Minerals 2023, 13, 863. https://doi.org/10.3390/min13070863
Lemos MG, Valente TM, Marinho Reis AP, Ferreira Fonseca RM, Guabiroba F, da Mata Filho JG, Magalhães MF, Delbem ID, Rebelo Diório G. Adding Value to Mine Waste through Recovery Au, Sb, and As: The Case of Auriferous Tailings in the Iron Quadrangle, Brazil. Minerals. 2023; 13(7):863. https://doi.org/10.3390/min13070863
Chicago/Turabian StyleLemos, Mariana Gazire, Teresa Maria Valente, Amélia Paula Marinho Reis, Rita Maria Ferreira Fonseca, Fernanda Guabiroba, José Gregorio da Mata Filho, Marcus Felix Magalhães, Itamar Daniel Delbem, and Giovana Rebelo Diório. 2023. "Adding Value to Mine Waste through Recovery Au, Sb, and As: The Case of Auriferous Tailings in the Iron Quadrangle, Brazil" Minerals 13, no. 7: 863. https://doi.org/10.3390/min13070863
APA StyleLemos, M. G., Valente, T. M., Marinho Reis, A. P., Ferreira Fonseca, R. M., Guabiroba, F., da Mata Filho, J. G., Magalhães, M. F., Delbem, I. D., & Rebelo Diório, G. (2023). Adding Value to Mine Waste through Recovery Au, Sb, and As: The Case of Auriferous Tailings in the Iron Quadrangle, Brazil. Minerals, 13(7), 863. https://doi.org/10.3390/min13070863