Abstract
Accurate measurement of bubble size is critical for assessing flotation performance. However, the 3D nature of bubbles, in contrast to the 2D nature of photographs obtained using a bubble viewer apparatus, may lead to distortions related to stereological assumptions. This study aimed to quantify the impact of these stereological effects on bubble size measurements in frother characterisations. Our results showed that different assumptions regarding bubble shape and volume resulted in variations in bubble size calculations of up to 10%. Furthermore, these stereological effects were propagated to the calculation of the critical coalescence concentration, leading to uncertainties of up to 14% depending on the type of frother. These findings emphasise the importance of considering stereological effects and selecting an appropriate calculation method when measuring bubble size for flotation and reagent assessments.
1. Introduction
Froth flotation is the most widely used separation technique in mineral processing, in which valuable minerals are separated from the gangue by attaching to air bubbles, based on their hydrophobicity [1]. Bubble size measurement is critical in assessing flotation performance, as bubble size directly affects the probabilities of collision, attachment, and detachment with valuable particles [1,2,3,4]. However, accurate measurement of bubble size is challenging due to the complex multiphase nature of the pulp, the turbulent fluid dynamic environment within a flotation cell, and errors associated with different measurement techniques.
Several methods have been proposed in the literature to quantify bubble size, most of which have been summarised by Rodrigues and Rubio [5] and Junker [6]. Among these, the most widely adopted measurement technique is the use of a bubble viewer apparatus for image analysis. Several bubble viewer apparatuses have been described, including the McGill Bubble Size Analyzer [7,8] and the Anglo Platinum Bubble Sizer (APBS) [9,10]. These apparatuses work under a common principle: the bubbles are sampled from the pulp using a sampling tube and rise to a viewing chamber, where they are photographed to be analysed using image analysis software [11,12].
Stereological effects arise due to the fact that bubbles are 3D objects, while the photographs obtained using a bubble viewer are 2D projections of those objects. This difference in dimensions, as well as the multidisperse nature of bubbles, results in errors in the measurement of bubble size [13]. Similar stereological effects have been discussed for particle size measurement [14], where 90% of the particles measured using 2D techniques such as SEM and 2D-XMT appear smaller than they actually are. In the case of particle size, this problem has been addressed by employing 3D measurement techniques such as 3D X-ray micro-CT [14,15]. Although there exist some 3D techniques available for bubble size measurement [16,17,18,19], these have not been widely adopted in froth flotation or mineral processing due to the multiphase nature of flotation and the practical constraints of using multiple cameras. Most practitioners and researchers continue to measure bubble size using a 2D single-camera approach, and therefore it is critical to quantify the impact of bubble size uncertainties on flotation and reagent assessments.
The uncertainty related to the stereological effects has led to different definitions of bubble size, which is critical under low frother concentrations due to the presence of ellipsoidal and deformed bubbles. Although most authors define bubble size in terms of equivalent diameter, there is no consensus on its calculation, which has hindered the characterisation of frothers. Some authors have used a 2D equivalent diameter (), calculated as the diameter of a circle with the same area () as that exposed in the image, regardless of the shape of the bubble observed [11,20]. This calculation is expressed in Equation (1). A geometric simplification used by some authors [21] has been to approximate the bubble to the best-fitted ellipse, which results in Equation (2), where and represent the maximum and minimum axes of the fitted ellipse, respectively.
The calculation of a 3D equivalent diameter () seeks to determine the diameter of the sphere with a volume equivalent to the observed bubble, as shown in Equation (3). However, since the 2D images do not provide a direct measurement of the volume of each bubble, certain geometric assumptions are required. The most widely used assumption is to represent the bubble by an ellipsoid of axes , and , as in Equation (4). Within Equation (4), and represent the maximum and minimum axes of the fitted ellipse in 2D, respectively, and is the orthogonal axis. However, further assumptions regarding are required. For example, Sam et al. [22] fitted an ellipse to the 2D image using Equation (2) and assumed that the third axis of the ellipsoid is equal to the minimum axis , which is the equivalent of rotating the observed 2D ellipse around its major axis, yielding Equation (4a). Similarly, Li et al. [23] obtained as the geometric mean of the Feret diameters , , and , assuming that is the arithmetic mean between and , as shown in Equation (4b). Grau and Heiskanen [24], Quinn et al. [25], and Vinnett et al. [26], among others, assumed that the unknown axis is equal to the maximum axis , resulting in Equation (4c), which implies that bubbles rotate around their minor axis. This approach follows the results reported by Raymond and Rosant [27], which illustrated the typical trend towards oblate ellipsoids for large bubbles.
The lack of a standardised method for bubble size calculation and the prevalence of in-house image analysis software [11,28] make it challenging to compare results across different research groups. This short communication aims to investigate the differences between 2D and 3D equivalent diameters and how these differences affect the calculation of the critical coalescence concentration (CCC), a key parameter for frother assessment. Different equivalent diameters have been used in the literature when determining CCC, Equations (1) and (4c) being the most common approaches [29,30,31,32]. However, the implications of using different bubble size representations on CCC characterisations have not been discussed in flotation literature. Thus, the findings from this study will contribute to the ongoing efforts to establish more robust and reliable methodologies to assess and compare frothers.
2. Materials and Methods
2.1. Experimental Procedure
Bubble size was measured in a laboratory-scale flotation cell with a 140 × 140 cm cross-section and a width of 15 cm, which simulated a section of an industrial machine [33,34]. Bubble sampling for photographs was carried out using a McGill bubble size analyser (MBSA). The MBSA was filled with conditioned water with the same surfactant concentration as the flotation cell. A digital video camera (Teledyne Dalsa, Waterloo, ON, Canada) was used to photograph the rising bubbles in a 2D plane at a sampling rate of one frame per second. All measurements were performed for 3 min at a resolution of 0.056 mm/px [33]. A subset of images was randomly chosen to process at least 1500 bubbles per condition.
Three frother types were analysed for this study: AeroFroth® 70 (referred to as AF), Flotanol® 9946 (FL) and OrePrep® F-507 (OP). AeroFroth® 70 contains MIBC and diisobutyl ketone, OrePrep® F-507 contains glycol and other non-hazardous components, while Flotanol® 9946 is composed of a 2-ethyl hexanol distillation bottom [35].
The experiments were conducted using frother concentrations of 0, 2, 4, 8, 16, and 32 ppm for all surfactants, with the superficial gas velocity () maintained at a constant value of 0.4 cm/s for all tests. Each experiment was conducted five times.
2.2. Bubble Size Analysis
The photographs were analysed using a semi-automated application based on the Image Processing Toolbox of MATLAB (version), as described by Vinnett et al. (2022) [26]. This application employs a semi-automated procedure for cluster segmentation to identify individual bubbles and calculates equivalent diameters for each bubble.
Two different equivalent diameters were used in this study: a 2D equivalent diameter, which corresponds to the diameter of the circle with the same area as an ellipse (as in Equation (2)); and a 3D equivalent diameter, which was calculated as the diameter of the sphere with the same volume as an oblate ellipsoid (as in Equation (4c)). It should be noted that bubble photographs do not capture the depth of each bubble, so the third axis of the ellipsoid is assumed to be equivalent to the largest of the other two.
The bubble size distribution (BSD) and the respective Sauter mean diameter () were calculated for the different frother types and concentrations using both equivalent-diameter schemes. The 2D and 3D Sauter means were used to plot critical coalescence concentration (CCC) curves and calculate the [36,37] for each representation and experimental condition. The 2D and 3D bubble size estimations of Equations (1) and (4c) were studied, as they have commonly and arbitrarily been used to characterize CCC curves [29,30,31,32]. The curves were fitted using the model for as a function of frother concentration proposed by Nesset et al. [36]:
where is the frother concentration in ppm, represents the limiting bubble size (the smallest that can be achieved by varying frother concentration), is the range of bubble sizes (, with being the with no frother), and is a fitting parameter that defines the rate of decay of bubble size.
The curves were fitted by weighted least squares (WLS), using the inverse of the experimental variance as weights. The was calculated as:
2.3. Analysis of the Stereological Effect on the Critical Coalescence Concentration
The data analysis was performed to investigate the effect of using a 2D and 3D scheme for the equivalent diameter. The study compared the obtained for three different frothers in each case. The CCC model of Equation (5) was utilised and the parameters, including the limiting bubble size, bubble size at no frother, and , were calculated from both diameter representations. The relative change for from 2D to 3D estimations was determined. The impact of frothers on the aspect ratio (AR) of bubbles was also discussed, as the observed bubble shape can provide insights into stereological patterns. The findings and implications of the data analysis are presented in Section 3.
3. Results and Discussion
Table 1 presents the Sauter mean diameter and its standard deviation for each frother type and concentration, using the 2D and 3D equivalent diameter. The Sauter means and standard deviations were used to fit the CCC model to the data using WLS, as described in Equation (5). The experimental data and fitted models are shown in Figure 1, while Table 2 details the curve descriptors of the CCC models for each case.

Table 1.
Sauter mean diameter and its standard deviation (mm) for each frother type and frother concentration (C), using the 2D and 3D equivalent diameter.
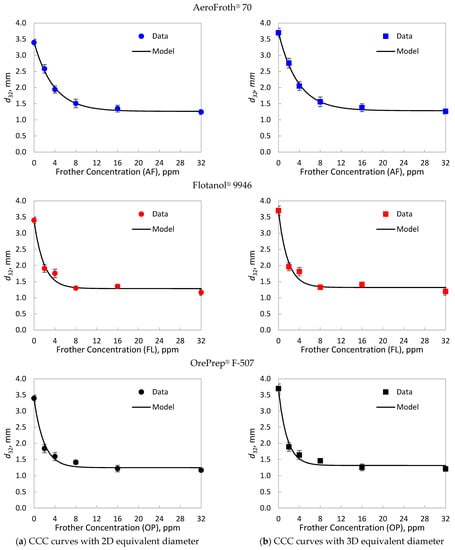
Figure 1.
Critical coalescence concentration (CCC) curves for AeroFroth® 70 (AF), Flotanol® 9946 (FL) and OrePrep® F-507 (OP), calculated with (a) the 2D equivalent diameters and (b) the 3D equivalent diameters. The points represent experimental data, where the error bars represent the standard deviation shown in Table 1. The lines correspond to the model in Equation (5), fitted using weighted least squares with the inverse of the experimental variance.
Table 2.
Effect of using a 2D and a 3D equivalent diameter on the curve descriptors of the CCC model. Change refers to the percentage difference from 2D to 3D.
As shown in Figure 1 and Table 1, the effect of using a 2D or a 3D scheme for the equivalent diameter seems to be negligible at high frother concentrations over the CCC. High frother concentrations cause bubbles to become more spherical [37], which implies a ≈ b. In fact, Table 2 shows that the limiting bubble size () has differences under 5% between the evaluated estimations. However, at low frother concentrations, the obtained from the 3D scheme were greater than those calculated from 2D equivalent diameters. Table 2 indicates that at no frother, the 3D scheme led to close to 10% greater than those obtained from 2D estimations. This result can be explained by the impact of the aspect ratio () of bubbles, which is the ratio between the major and minor axes, on the 2D and 3D equivalent bubble diameters.
The 2D and 3D equivalent diameters can be expressed in terms of aspect ratio () by replacing in Equations (2) and (4c), respectively. The effect of frother on the aspect ratio is explored in Figure 2, showing the reciprocal of the median of AR at different frother concentrations. From this result, not all frothers affect the shape of the bubbles at the same rate. Flotanol® 9946 and OrePrep® F-507 quickly change the shape of bubbles, reaching sphere-like bubbles with at 2 ppm, while a higher AeroFroth® 70 dosage is required to make bubbles spherical, near 8 ppm.
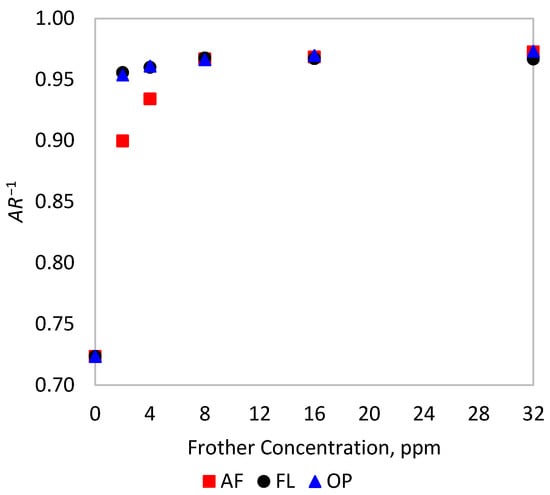
Figure 2.
Change in the inverse of the aspect ratio of bubbles with frother addition in the experimental tests.
The relationship between and can be expressed in terms of by dividing Equation (8) by (7), as shown in Equation (9).
Equation (9), as well as Figure A1 (Appendix A), show that is always larger than , except for perfectly spherical bubbles ().
The impact of using either scheme on the estimation differs depending on the type of frother. From Table 2, AeroFroth® 70 presented non-significant differences in the estimated from both representations—under 1%. On the other hand, stronger frothers, such as OrePrep® F-507 and Flotanol® 9946, had higher differences in estimations, the former being close to 15%. From Equations (5) and (6) and accurate and estimations, only depends on the exponential decay of as a function of the frother concentration. To analyse this decay, the experimental Sauter diameters were normalised, such that . Figure 3 shows the normalised Sauter diameters for each type of frother and equivalent diameter scheme, which fell within the range of 0 to 1. Although the differences are not critical between the evaluated schemes, these variations were sufficient to change the curvatures of the CCC trends, especially before reaching . The subtle difference in curvature has implications for the estimations, as presented in Table 2. Thus, there exists an underexplored relationship between the concepts of , i.e., the frother dose required to reduce bubble size and the frother dose required to make bubbles spherical. As illustrated in Figure 3, the normalised CCC curves varied between the 2D and the 3D schemes for OrePrep® F-507 and Flotanol® 9946, but remained similar for AeroFroth® 70. From Equation (5) and its normalisation to obtain , d/dC at 0 ppm corresponds to -b, which defines the value, as shown in Equation (6). An abrupt decay in as a function of the frother concentration, and consistently, an abrupt decrease in the aspect ratio, led to differences in the normalised CCC curves, because similar values from the 2D and 3D schemes are scaled by different This effect can be observed from Table 2, which will be more critical when spherical regimes are reached before . This feature justifies the differences in the normalised CCC curves and estimations for OrePrep® F-507 and Flotanol® 9946 from the 2D and 3D schemes for the equivalent diameters.
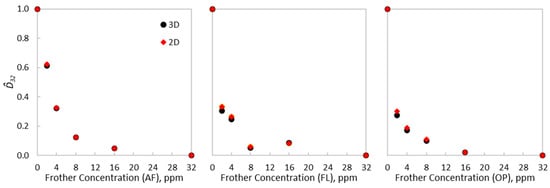
Figure 3.
Normalised CCC curves for AeroFroth® 70, Flotanol® 9946 and OrePrep® F-507, comparing the 2D and 3D experimental results.
The observed dependence on frother type of the extent of the stereological effect is explained by the different rates at which frothers change the shape of bubbles, as shown in Figure 2, and how that rate relates to the reduction of bubble size. For AeroFroth® 70, the rate at which bubbles change their shape closely relates to the rate at which bubble size is reduced. Thus, for this frother, both rates reach a plateau at approximately 10 ppm, explaining why there is no apparent difference in calculating for 2D and 3D schemes in this case. In contrast, the other two frothers present considerably different rates at which bubbles change their size and shape. Both Flotanol® 9946 and OrePrep® F-507 have values between 5 and 6 ppm, but bubbles reach near sphericity much more quickly, at around 2 ppm.
The observation of two distinct phenomena associated with frother function, namely, bubble size and bubble shape, aligns with that presented by Gomez et al. [38] in their CCC model. Unlike the widely used CCC model presented in Equation (5), Gomez et al. [38] defined the CCC curve as the sum of two exponential decays, where one of the decays represents the change in the surface tension of the bubbles (which is linked to bubble shape) and a second decay represents the coalescence control, with surface tension effects subtracted. The simplicity of the CCC model in Equation (5) precludes it from being adapting to cases where bubble size and bubble shape change at significantly different rates, which increases the uncertainties in the CCC estimations.
Future work needs to focus on the design of a new bubble analysis apparatus for froth flotation, capable of measuring bubbles in 3D, thus avoiding stereological assumptions. Recent advancements in image analysis based on deep learning and neural networks have shown promise in reconstructing the 3D shape of bubbles using single-view 2D images [39,40]. However, to effectively apply these methodologies, it will be necessary to create extensive training databases of 3D bubble images for different frothers, operating conditions and sampling equipment. It is observed from this work that as 2D single-view images continue to be widely used in mineral processing research, there is a growing necessity for new models to better estimate the CCC that account for the stereological errors and the different phenomena related to frother addition.
4. Conclusions
This study investigated the impact of using 2D and 3D schemes for determining the equivalent diameter of bubbles in flotation and the respective implications on frother characterisations. The comparison of Sauter means obtained for the evaluated frothers indicated that the 3D scheme produced up to 9% higher values, highlighting the importance of considering the three-dimensional nature of bubbles at low frother content. The adjusted CCC model provided insight into the limiting bubble size, bubble size without frother, and parameters, with percentage changes from 2D to 3D scheme being determined. It was observed that the stereological assumptions generated differences in the estimated at up to 14% for one of the frothers tested, evidencing that the stereological patterns are frother-dependent. Furthermore, the observed bubble shape revealed the impact of frothers on the aspect ratio of bubbles and demonstrated the importance of considering geometric assumptions. Overall, this study provides valuable insights into the importance of considering 3D representations in froth flotation and highlights the need for further research into bubble size estimation and the impact of frothers on bubble shapes and sizes.
Author Contributions
Both authors contributed equally to this work. Conceptualisation, L.V. and D.M.; methodology, L.V. and D.M.; software, L.V.; formal analysis, L.V. and D.M.; investigation, D.M.; resources, L.V. and D.M.; data curation, L.V.; writing—original draft preparation, D.M.; writing—review and editing, L.V. and D.M.; visualisation, L.V. and D.M.; project administration, L.V. and D.M.; funding acquisition, D.M. All authors have read and agreed to the published version of the manuscript.
Funding
The APC was funded by Imperial College London. Funding for process modelling and control research was provided by ANID, Project Fondecyt 1201335.
Conflicts of Interest
The authors declare no conflict of interest.
Appendix A
Figure A1 shows the impact of the aspect ratio (reciprocal) on the equivalent diameter for the 2D and 3D representations. The 3D equivalent diameter of an ellipsoidal bubble is greater than the 2D equivalent diameter, approaching the 2D diameter as .

Figure A1.
Effect of the aspect ratio (reciprocal) on the equivalent diameter for ellipsoidal bubbles.
Figure A1.
Effect of the aspect ratio (reciprocal) on the equivalent diameter for ellipsoidal bubbles.

References
- Wills, B.A.; Finch, J.A. Froth Flotation. In Wills’ Mineral Processing Technology; Elsevier: Amsterdam, The Netherlands, 2016; pp. 265–380. ISBN 978-0-08-097053-0. [Google Scholar]
- Ahmed, N.; Jameson, G.J. The Effect of Bubble Size on the Rate of Flotation of Fine Particles. Int. J. Miner. Process. 1985, 14, 195–215. [Google Scholar] [CrossRef]
- Bennett, A.J.R.; Chapman, W.R.; Dell, C.C. Studies in froth flotation of coal. In Third International Coal Preparation Conference, Liege, Belgium, 23–28 June 1958; Editions techniques et scientifiques; Borreng: Bruxelles, Belgium, 1958; pp. 37–39. [Google Scholar]
- Tao, D. Role of Bubble Size in Flotation of Coarse and Fine Particles—A Review. Sep. Sci. Technol. 2005, 39, 741–760. [Google Scholar] [CrossRef]
- Rodrigues, R.T.; Rubio, J. New Basis for Measuring the Size Distribution of Bubbles. Miner. Eng. 2003, 16, 757–765. [Google Scholar] [CrossRef]
- Junker, B. Measurement of Bubble and Pellet Size Distributions: Past and Current Image Analysis Technology. Bioprocess Biosyst. Eng. 2006, 29, 185–206. [Google Scholar] [CrossRef] [PubMed]
- Chen, F.; Gomez, C.O.; Finch, J.A. Technical Note Bubble Size Measurement in Flotation Machines. Miner. Eng. 2001, 14, 427–432. [Google Scholar] [CrossRef]
- Hernandez-Aguilar, J.R.; Gomez, C.O.; Finch, J.A. A Technique for the Direct Measurement of Bubble Size Distributions in Industrial Flotation Cells. In Proceedings of the 34th Annual Meeting of the Canadian Mineral Processors, Ottawa, ON, Canada, 22–24 January 2002; p. 15. [Google Scholar]
- Tucker, J.P.; Deglon, D.A.; Franzidis, J.-P.; Harris, M.C.; O’Connor, C.T. An Evaluation of a Direct Method of Bubble Size Distribution Measurement in a Laboratory Batch Flotation Cell. Miner. Eng. 1994, 7, 667–680. [Google Scholar] [CrossRef]
- Amini, E.; Bradshaw, D.J.; Finch, J.A.; Brennan, M. Influence of Turbulence Kinetic Energy on Bubble Size in Different Scale Flotation Cells. Miner. Eng. 2013, 45, 146–150. [Google Scholar] [CrossRef]
- Mesa, D.; Quintanilla, P.; Reyes, F. Bubble Analyser—An Open-Source Software for Bubble Size Measurement Using Image Analysis. Miner. Eng. 2022, 180, 107497. [Google Scholar] [CrossRef]
- Wang, J.; Forbes, G.; Forbes, E. Frother Characterization Using a Novel Bubble Size Measurement Technique. Appl. Sci. 2022, 12, 750. [Google Scholar] [CrossRef]
- Sahagian, D.L.; Proussevitch, A.A. 3D Particle Size Distributions from 2D Observations: Stereology for Natural Applications. J. Volcanol. Geotherm. Res. 1998, 84, 173–196. [Google Scholar] [CrossRef]
- Reyes, F.; Lin, Q.; Udoudo, O.; Dodds, C.; Lee, P.D.; Neethling, S.J. Calibrated X-Ray Micro-Tomography for Mineral Ore Quantification. Miner. Eng. 2017, 110, 122–130. [Google Scholar] [CrossRef]
- Reyes, F.; Lin, Q.; Cilliers, J.J.; Neethling, S.J. Quantifying Mineral Liberation by Particle Grade and Surface Exposure Using X-Ray MicroCT. Miner. Eng. 2018, 125, 75–82. [Google Scholar] [CrossRef]
- Bian, Y.; Dong, F.; Zhang, W.; Wang, H.; Tan, C.; Zhang, Z. 3D Reconstruction of Single Rising Bubble in Water Using Digital Image Processing and Characteristic Matrix. Particuology 2013, 11, 170–183. [Google Scholar] [CrossRef]
- Wang, H.; Yang, Y.; Dou, G.; Lou, J.; Zhu, X.; Song, L.; Dong, F. A 3D Reconstruction Method of Bubble Flow Field Based on Multi-View Images by Bi-Direction Filtering Maximum Likelihood Expectation Maximization Algorithm. Int. J. Multiph. Flow 2023, 165, 104480. [Google Scholar] [CrossRef]
- Wang, H.-Y.; Shi, Y.-F.; Zhu, X.-J.; Song, L.-M.; Dong, F. 3-D Reconstruction of Bubble Flow Field Based on the Method of Multivision by Rough-Precise Location Algebraic Reconstruction Technique. IEEE Trans. Instrum. Meas. 2022, 71, 1–11. [Google Scholar] [CrossRef]
- Fu, Y.; Liu, Y. 3D Bubble Reconstruction Using Multiple Cameras and Space Carving Method. Meas. Sci. Technol. 2018, 29, 075206. [Google Scholar] [CrossRef]
- Gomez, C.O.; Finch, J.A. Gas Dispersion Measurements in Flotation Cells. Int. J. Miner. Process. 2007, 84, 51–58. [Google Scholar] [CrossRef]
- Luty, P.; Prończuk, M.; Bizon, K. Experimental Verification of Different Approaches for the Determination of Gas Bubble Equivalent Diameter from Optical Imaging. Chem. Eng. Res. Des. 2022, 185, 210–222. [Google Scholar] [CrossRef]
- Sam, A.; Gomez, C.O.; Finch, J.A. Axial Velocity Profiles of Single Bubbles in Water/Frother Solutions. Int. J. Miner. Process. 1996, 47, 177–196. [Google Scholar] [CrossRef]
- Li, S.; Tan, S.; Xu, C.; Gao, P.; Sun, L. An Experimental Study of Bubble Sliding Characteristics in Narrow Channel. Int. J. Heat Mass Transf. 2013, 57, 89–99. [Google Scholar] [CrossRef]
- Grau, R.A.; Heiskanen, K. Visual Technique for Measuring Bubble Size in Flotation Machines. Miner. Eng. 2002, 15, 507–513. [Google Scholar] [CrossRef]
- Quinn, J.J.; Maldonado, M.; Gomez, C.O.; Finch, J.A. Experimental Study on the Shape–Velocity Relationship of an Ellipsoidal Bubble in Inorganic Salt Solutions. Miner. Eng. 2014, 55, 5–10. [Google Scholar] [CrossRef]
- Vinnett, L.; Urriola, B.; Orellana, F.; Guajardo, C.; Esteban, A. Reducing the Presence of Clusters in Bubble Size Measurements for Gas Dispersion Characterizations. Minerals 2022, 12, 1148. [Google Scholar] [CrossRef]
- Raymond, F.; Rosant, J.-M. A Numerical and Experimental Study of the Terminal Velocity and Shape of Bubbles in Viscous Liquids. Chem. Eng. Sci. 2000, 55, 943–955. [Google Scholar] [CrossRef]
- Panjipour, R.; Karamoozian, M.; Albijanic, B. Bubble Size Distributions in Gas–Liquid–Solid Systems and Their Influence on Flotation Separation in a Bubble Column. Chem. Eng. Res. Des. 2021, 167, 96–106. [Google Scholar] [CrossRef]
- Szyszka, D. Critical Coalescence Concentration (CCC) for Surfactants in Aqueous Solutions. Minerals 2018, 8, 431. [Google Scholar] [CrossRef]
- Sovechles, J.M.; Waters, K.E. Effect of Ionic Strength on Bubble Coalescence in Inorganic Salt and Seawater Solutions. AIChE J. 2015, 61, 2489–2496. [Google Scholar] [CrossRef]
- Grau, R.A.; Laskowski, J.S. Role of Frothers in Bubble Generation and Coalescence in a Mechanical Flotation Cell. Can. J. Chem. Eng. 2006, 84, 170–182. [Google Scholar] [CrossRef]
- Mesa, D.; Brito-Parada, P.R. Bubble Size Distribution in Aerated Stirred Tanks: Quantifying the Effect of Impeller-Stator Design. Chem. Eng. Res. Des. 2020, 160, 356–369. [Google Scholar] [CrossRef]
- Vinnett, L.; Cornejo, I.; Yianatos, J.; Acuña, C.; Urriola, B.; Guajardo, C.; Esteban, A. The Correlation between Macroscopic Image and Object Properties with Bubble Size in Flotation. Minerals 2022, 12, 1528. [Google Scholar] [CrossRef]
- Vinnett, L.; Alvarez-Silva, M. Indirect Estimation of Bubble Size Using Visual Techniques and Superficial Gas Rate. Miner. Eng. 2015, 81, 5–9. [Google Scholar] [CrossRef]
- Saavedra Moreno, Y.; Bournival, G.; Ata, S. Classification of Flotation Frothers–A Statistical Approach. Chem. Eng. Sci. 2022, 248, 117252. [Google Scholar] [CrossRef]
- Nesset, J.E.; Finch, J.A.; Gomez, C.O. Operating Variables Affecting the Bubble Size in Forced-Air Mechanical Flotation Machines. In Proceedings of the Ninth Mill Operators’ Conference, Fremantle, WA, Australia, 19–21 March 2007; p. 11. [Google Scholar]
- Finch, J.A.; Nesset, J.E.; Acuña, C. Role of Frother on Bubble Production and Behaviour in Flotation. Miner. Eng. 2008, 21, 949–957. [Google Scholar] [CrossRef]
- Gomez, C.; Castillo, P.; Alvarez, J. A Frother Characterization Technique Using a Lab Mechanical Flotation Cell. In Proceedings of the XXVII International Mineral Processing Congress IMPC, Santiago, Chile, 20–24 October 2014; pp. 71–81. [Google Scholar]
- Dia, K.; Lamadie, F.; Debayle, J. Using Deep Learning to Retrieve 3D Geometrical Characteristics of a Particle Field from 2D Projected Images: Application to Multiphase Flows. In Proceedings of the 2022 12th International Conference on Pattern Recognition Systems (ICPRS), Saint Etienne, France, 7–10 June 2022; pp. 1–7. [Google Scholar]
- Gong, C.; Song, Y.; Huang, G.; Chen, W.; Yin, J.; Wang, D. BubDepth: A Neural Network Approach to Three-Dimensional Reconstruction of Bubble Geometry from Single-View Images. Int. J. Multiph. Flow 2022, 152, 104100. [Google Scholar] [CrossRef]


Disclaimer/Publisher’s Note: The statements, opinions and data contained in all publications are solely those of the individual author(s) and contributor(s) and not of MDPI and/or the editor(s). MDPI and/or the editor(s) disclaim responsibility for any injury to people or property resulting from any ideas, methods, instructions or products referred to in the content. |
© 2023 by the authors. Licensee MDPI, Basel, Switzerland. This article is an open access article distributed under the terms and conditions of the Creative Commons Attribution (CC BY) license (https://creativecommons.org/licenses/by/4.0/).