Abstract
The molecular structure of the liquid–vapor interfaces of aqueous solutions of alkali metal halides and methyl isobutyl carbinol (MIBC, (CH3)2CHCH2COCH3) is determined by using molecular dynamics simulations with polarizable force fields for the first time. The salts are chlorides, and iodides, some of which are found in raw and partially desalinated seawater increasingly used in flotation operations in regions affected by severe and prolonged drought. The density profiles at the interfaces show that all ions prefer the interface; however, with MIBC, non-polarizable ions, generally small ones, are increasingly pushed into the liquid bulk. A few ions of comparatively less ionic NaCl than KCl and CsCl, persist at the interface, consistent with spectroscopy observations. On the other hand, strongly polarizable ions such as I− always share the interface with MIBC. In the presence of chlorides, the frother chains at the interface stretch slightly more toward vapor than in freshwater; however, in the presence of iodides, the chains stretch so much that they become orthogonal to the interface, giving rise to a well-packed monolayer, which is the most effective configuration. The dominant water configurations at the interface are double donor and single donor, with hydrogen atoms pointing toward the liquid, consistent with studies with sum-frequency generation experiments and extensive ab initio simulations. This picture changes radically in the presence of MIBC and salts. Depending on the halide and MIBC concentration, the different molecular configurations at the interface lead to very different surface tensions. The structure and properties of these new salt-rich interfaces and their impact on the location and arrangement of frother molecules should serve the flotation practitioner, especially in the search for the best frother and dosing in poor-quality water.
1. Introduction
The use of methyl isobutyl carbinol, a frother better known as MIBC, is key in many processes based on froth flotation. Application in mining and other fields employing freshwater is well known, and the great challenge today is limited to determining the optimal dose [1,2]. However, more and more regions are facing water scarcity due to climate change. The sustainability of the industry depends on water availability and, of course, on efficient management. The solution has come from the sea. Some plants operate with raw seawater, where the typical salt concentration is ca. 0.6 M NaCl, and others with partial or total desalinated water. When water with electrolytes is used, choosing a frother is not easy because the effect of the ions modifies the structure of the water at the liquid–air interface, interferes with the action of the frother, and affects the surface properties of the solution, for example, surface tension. The challenge is even greater in potassium and lithium mining, for example, where hypersaline brines, with salt concentrations of 6 M and higher, are common. Understanding all these effects is crucial to evaluate the property of using MIBC or another foaming agent and determining the optimal dose it should be supplied.
The ionic structure of the air–water interface has been extensively studied over the years, which has resulted in a fairly agreed molecular picture. The air–solution interface for various salts has also received significant attention in the last two decades for its role in environmental chemistry and atmospheric science. The most widely used tool is molecular simulation with increasingly optimized force fields. However, the molecular picture of the air-brine interface in the presence of a surfactant has not fully emerged. One system studied, perhaps the most extensive, is the liquid–vapor interface of aqueous NaCl solutions in the presence of MIBC with a wide concentration range by using molecular simulation with non-polarizable force fields [3,4,5]. Results lead to a molecular picture in which both Na+ and Cl− ions are not part of the interface, which makes it impossible to predict the surface tension. However, experimental studies with spectroscopic selective interface techniques [6,7,8,9,10,11,12,13,14,15,16] show that halogens, especially the largest and, therefore, deformable ones, in the presence of a small cation, inhabit the interface of the solutions they form. Molecular simulations with polarizable force fields, available most recently, have also shown the existence of chloride ions and other halides near the liquid–air interface of different saltwater systems [6,9]. For sodium iodides, Nguyen et al. reach the same conclusion with non-polarizable force fields, although they do not report surface tension [17]. In addition, a recent study evaluated the effect of including polarization in simulations of aqueous NaCl solutions [18]. With polarization, the ion distribution obtained coincides with other simulations in the literature and with the experimental results already mentioned, and also the prediction of surface tension improves significantly. In this previous study, the molecular structure of liquid–air interfaces of aqueous solutions of MIBC-NaCl was also determined, finding that the orientation of MIBC molecules at the water liquid–vapor interface changes as the concentration of MIBC increases, from parallel to the interface to perpendicular, with their oxygens, permanently submerged in the liquid phase and forming a well-packed monolayer. Chlorides dominate the liquid–vapor interface even at relatively high MIBC concentrations. Still, they are the less polarizable of all the halogens; thus, their effect stiffens the interface by increasing the surface tension. On the other hand, when the MIBC concentration is high enough, the MIBC manages to displace some Na+ and Cl− ions to the bulk liquid and settle at the interface. This MIBC concentration in 1M NaCl solutions at 300 K is ca. 1.2 mM, referred to by Castro et al. [19] as a surface tension switch point, is very close to the experimental value [5,20,21] and effectively marks the change in surface tension behavior. Below this point, the tension is controlled by the ions at the interface and is higher than that of freshwater; above this point, the tension is controlled by MIBC and is lower than freshwater, a behavior first reported by Ozdemir et al. [22] and later by Castro et al. [19] and Alvarado et al. [18].
Here, the objective is to determine the molecular picture at the liquid–vapor interface of solutions of a series of chlorides, NaCl, KCl, and CsCl, and a series of iodides, KI and CsI, in the presence of MIBC in a wide range of concentrations. In particular, interesting to know the effect of these salts, typical in raw or partially desalinated seawater, on the distribution and orientation of the MIBC chains at the different interfaces. Molecular dynamics simulation is used with force fields that support polarization. The structure of water at the liquid–vapor interface is also studied, particularly the different configurations adopted by the water molecules. Finally, the impact of the molecular picture generated by each salt on the surface tension is determined.
2. Methodology
2.1. Force Fields
MIBC molecules were modeled using the AMBER99sb force field [23,24], suitable for describing organic molecules. These molecules did not need a polarizable model due to their low dipole moment, concentrated at the hydroxyl group and sufficient to show a preference for the gas–liquid interface. The Na+, K+, Cs+, Cl− and I− ions were modeled using the Drude-2013 force field [25] that considers the ions as two sites, one with the mass of the ion and part of its electrical charge and another massless, known as a Drude particle, with the other part of the electric charge of the ion. These sites are attached by a harmonic spring with an equilibrium distance between them equal to zero. Water molecules were simulated with the SWM4-NDP polarizable model with five sites per molecule [26], three representing hydrogen and oxygen atoms, a fourth representing unpaired electrons, and the fifth remaining bound to the oxygen atom. Lorentz–Berthelot mixing rules were used to model cross-species interaction.
2.2. System
The system used is a box of dimensions nm and nm as in Alvarado et al. [18]. The size of the box is large enough for the results to be reproducible and small enough for the computational cost to be affordable. The ions and molecules were added to a smaller volume of dimensions nm and nm centered on the z-axis of the larger box. First, the ions were randomly added at a distance greater than 3 Å from each other and away from the boundaries of the small box. The ion concentration was 1 M for all salts. MIBC molecules were then arranged in the vicinity of the boundaries of the small box at a distance greater than 3 Å between MIBC molecules and ions. The number of MIBC molecules was 1, 10, 20, 30 and 40, spanning a concentration range of 0.046 to 1.85 mM. Finally, water sufficiently equilibrated in a separate simulation at 300 K was added to the small box. Only the molecules with a minimum distance of 2 Å from resident water molecules, alkaline ions and MIBC molecules were accepted until reaching the required concentration. Figure 1 shows the simulation box for a typical water–ion–MIBC system very early on the way to equilibrium.
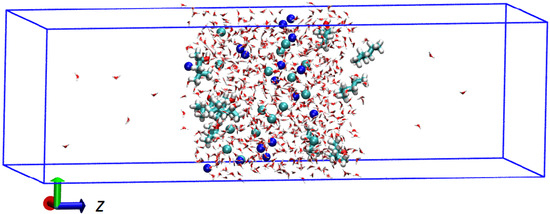
Figure 1.
Simulation box for a typical water–ion–MIBC system at an early stage toward equilibrium. Larger molecules correspond to MIBC, blue and green spheres to cations and anions. Water is depicted with red lines.
2.3. Simulations
The GROMACS version 2016-dev-20170105-c53d212-dirty was used for the simulations, which implemented the Lagrangian dynamics for polarizable systems [27]. Equations of motion were integrated with the velocity Verlet algorithm with a step of 1 fs [28]. A cutoff radius of 1.2 nm was used for van der Waals and Coulomb forces. Long-range electrostatic interactions were calculated using the Ewald particle mesh method [29]. Drude particles were used to introduce polarizability effects in the simulation. The temperature was controlled with the Nosé–Hoover thermostat with a relaxation time of 100 fs for atoms and 5 fs for Drude particles. The reference temperature was 300 K for atoms and 1 K for Drude particles. A repulsive hard wall was introduced to prevent Drude particles moving to distances larger than 0.02 nm from the atom positions. The temperature was controlled with the Nosé–Hoover thermostat with a relaxation time of 0.1 ps for atoms and molecules and 5 fs for Drude particles. In addition, periodic boundary conditions were applied in the three cartesian directions. The simulations were carried out in three steps. In the first step, starting from the initial configuration, the potential energy is minimized using the steepest descent algorithm, where the atoms are moved to new positions such that the force between them is less than 1000 kJ·mol−1·nm−1. Then, an NVT equilibration step of 1 ns was performed at 300 K, where water molecules were moved while the positions of the remaining atoms and molecules were kept fixed. Finally, an NVT simulation run of 10 ns is made to obtain simulation results. The data were collected every 1 ps. These data determined averaged density profiles along the two liquid–vapor interfaces. The parameters used are the same as in Alvarado et al. [18]. The position of each interface, z = 0, was defined as the point where the density of water equals its mean value along the liquid–vapor interface.
2.4. Surface Tension
The GROMACS version The Irving and Kirkwood method is used to determine the surface tension [30] from the local components of the pressure tensor, that is,
where y correspond, respectively, to the normal and tangential components of the pressure tensor along the normal to the surface. The method is based on the calculation of the traction, which is the limit of the prototraction per unit area when the area tends to zero. Adding the kinetic contribution to traction gives the stress tensor on the surface, that is, with the unitary matrix. For the determination of surface tension, we use the method as implemented in GROMACS.
3. Results and Discussion
3.1. MIBC Density Profiles
First, the density profile of the MIBC in the vicinity of the liquid–vapor interface is determined. Figure 2 shows the results for the case without salt. The position of the center groups –CH2– of MIBC is considered for determining the density profiles. MIBC molecules prefer the interface with the oxygen atoms remaining on average in the liquid phase and the carbon atoms in the vapor phase. As the concentration of MIBC in the system increases, its density at the interface increases, and its density profile shifts more toward the water vapor phase, as shown by a previous study [18]. In other words, since the constituent O atoms, in the polar end of the chain, remain anchored in the water, the MIBC chain is stretched so that C atoms at the opposite end of oxygen settle in the vapor phase. For this to happen, the only possibility is that the MIBC molecules adopt orthogonal configurations to the interface and thus become more effective as frothers.
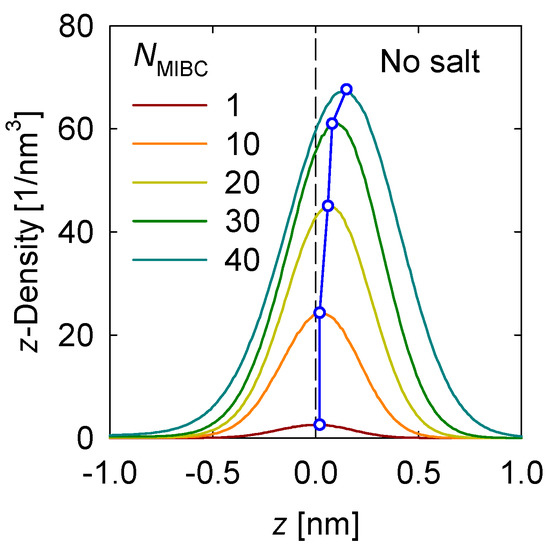
Figure 2.
MIBC number density profile in the z-direction perpendicular to the liquid-gas interface in salt-free systems at different MIBC concentrations (NMIBC). Negative values of z correspond to the region occupied by the liquid phase.
MIBC profiles were then determined in the presence of the various chloride and iodide salts considered in this study. To compare the profiles, we prefer to plot the position of the maximum value (peak) of the MIBC concentration for each MIBC concentration (number of molecules) and each salt that has been considered. The results in Figure 3 show that the presence of salt, whatever it may be, not only shifts the MIBC concentration profile further toward the vapor phase but that the MIBC concentration peak always occurs in the gas phase. This trend is even more pronounced as the MIBC concentration in the system increases. Figure 3 also shows that the effect of each salt, chloride or iodide, is not very different from one another on the same halide series. Although it can be said that the effect of iodides is more effective in displacing the MIBC molecules to the water vapor phase. This means that an increase in the concentration of MIBC in the presence of chlorides leads to a greater stretching of the frother chains than in freshwater (Figure 3a). However, the greatest stretching, and effectiveness as a frother, is obtained in the presence of iodides (Figure 3b). In the latter case, the arrangement of the strings tends toward a well-packed monolayer of MIBC.
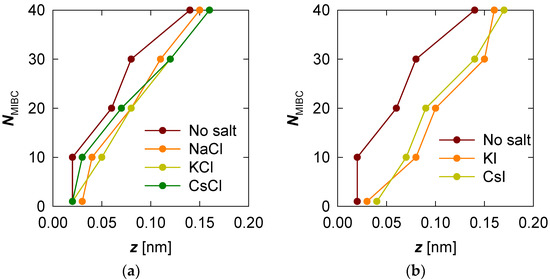
Figure 3.
Location of the maximum MIBC concentration peak for increasing MIBC molecules from 1 to 40. Two cases: without salt and in the presence of salts, chlorides (a) and iodides (b).
3.2. Ions Density Profiles
Density profiles of the ions of the chloride and iodide salts at 1 M in the z-direction perpendicular to the liquid–vapor interface at different MIBC concentrations are shown, respectively, in Figure 4 and Figure 5.
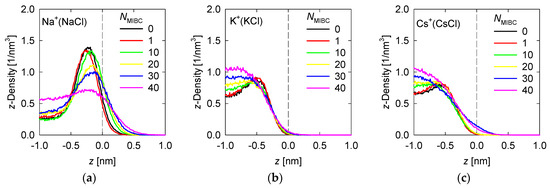
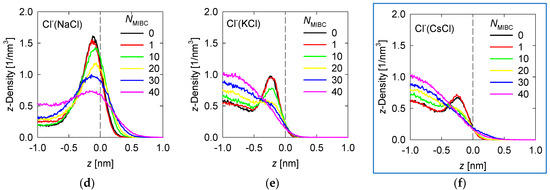
Figure 4.
Density Density profiles of chloride salt ions across the water liquid–vapor interface in all studied systems at different MIBC concentrations, (a,d) for NaCl, (b,e) for KCl, and (c,f) for CsCl. Number of MIBC molecules in the legends. Salt concentration is 1 M and temperature is 300 K. Negative values of z correspond to the region occupied by the liquid phase.
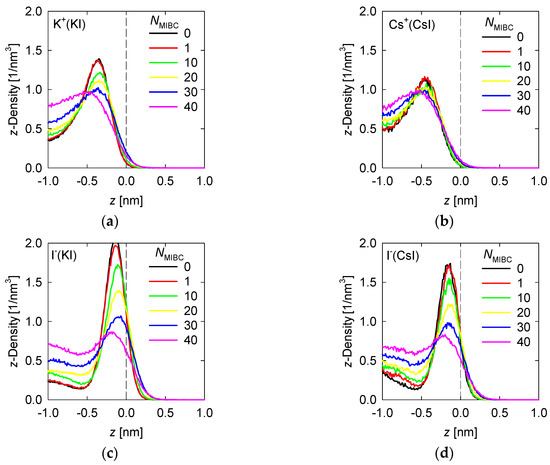
Figure 5.
Density profiles of iodine salt ions across the water liquid–vapor interface in all studied systems at different MIBC concentrations, (a,c) for KI, and (b,d) for CsI. Number of MIBC molecules in the legends. Salt concentration is 1 M and temperature is 300 K. Negative values of z correspond to the region occupied by the liquid phase.
To analyze the density profiles of chloride salt ions in Figure 4, the differences in the Pauling electronegativities of the salt atoms are helpful. Subtracting the electronegativity of the cation from that of the chlorine gives 2.1 for NaCl, 2.2 for KCl, and 3.0 for CsCl. As the size of the cation increases, the ionic character of the salt increases, even though all these chloride salts are ionic. In the absence of MIBC, the ions from the chloride salts tend to accumulate near the liquid–vapor interface, although always in the liquid phase, giving rise to peaks in the density profiles, as shown in Figure 4. However, the location of the peak density of each ion depends on the ionic character of the salt. The more ionic the salts, the greater their tendency to dissolve and remain within the liquid phase, far from the liquid–vapor interface. For NaCl, the Na+ and Cl− density peaks reach approximately 1.5 nm−3, although the Cl− density in all simulations is consistently somewhat higher than that of Na+ (Figure 4), which is in agreement with the literature [6,7,9,18], while the density of these ions in the bulk liquid solution is ca. 0.5 nm−3. The Na+ peak occurs at ca. 0.25 nm from the interface, while the Cl− peak occurs much closer to the interface at ca. 0.125 nm. On the other hand, for CsCl, the most ionic chloride salt, the Cs+ and Cl− peaks reach ca. 0.8 nm−3 while the density in bulk is ca. 0.6 nm−3. The Cs+ peak occurs relatively far from the interface at ca. 0.5 nm, while the Cl− peak also moves away at ca. 0.3 nm. The KCl salt with an intermediate ionic character between NaCl and CsCl is expected to exhibit intermediate densities and density peak positions for the K+ and Cl− ions. Indeed, Figure 3 shows that the peak densities are ca. 1 nm−3 for the Na+ and Cl− peaks and 0.7 nm−3 for the solution bulk. Moreover, the positions of the K+ and Cl− density peaks are, respectively, 0.4 nm and 0.2 nm from the liquid–vapor interface. In the presence of MIBC, the ions of the salts are displaced toward the bulk of the liquid as Figure 4 also shows. This effect is more pronounced as MIBC concentration increases. At the maximum MIBC concentration considered here, it is notable that ions of the more ionic chlorides, such as KCl and CsCl, are fully displaced from the interface into the bulk liquid, while few ions of the somewhat less ionic NaCl continue to show a preference for the liquid–vapor interface at a significantly lower concentration than in the absence of MIBC although closer to the interface to ca. 0.2 nm. As expected, MIBC molecules with surfactant properties, albeit weak, settle at the liquid–vapor interface where they are distributed as in Figure 3.
The differences in the Pauling electronegativities of the iodide salts are 1.6 for the NaI, 1.7 for KI and 1.8 for CsI. These are all salts with a covalent character, a condition that increases as the size of the cation decreases. The strongly covalent character of NaI could not be captured by the force fields used here and therefore the study was limited to the KI and CsI salts. Similar to the chloride salt ions, in the absence of MIBC, the iodide salt ions prefer the liquid–vapor interface, always in the liquid phase, forming respective density peaks, as shown in Figure 4. Unlike chlorides, the cation density of iodides is considerably less than that of I−. For KI, the peak density of K+ reaches ca. 1.5 nm−3 at ca. 0.4 nm from the interface while the peak density of I− exceeds 2 nm−3 at ca. 0.15 nm. For Cs+ the peak reaches ca. 1.2 nm−3 at 0.5 nm while for I− the peak reaches 1.7 nm−3 at 0.2 nm. The more covalent character of the salt, the greater the density achieved by the peaks of its ions in the vicinity of the liquid–vapor interface and the greater the proximity of the peaks to this interface. A substantive difference with the more ionic chloride salts is that in the presence of MIBC, the ions of the more covalent salts continue to show their preference for the interface, which is reflected in clear peaks in Figure 4, although of lower density. This effect is more pronounced for KI, the most covalent salt considered here.
In previous work, we indicated that in a solution of NaCl in water without MIBC, the density peak of the Cl− is slightly stronger and closer to the interface than that of Na+. These results suggest that the propensity of halide ions to concentrate at the liquid–vapor interface correlates with the polarization of the salt and the sizes of the ions [18]. This idea is indirectly supported by spectroscopic experiments [8,9]. The results in Figure 4 for other chloride salts, more ionic than NaCl, less polarizable, and with larger cations, such as KCl and CsCl, confirm this. The density peaks are less intense and further from the interface, and in the presence of MIBC they are displaced toward the bulk solution. On the other hand, the iodide salts show in Figure 5 that, being more covalent, they dispute the interface to the MIBC, particularly the I− ions, which are among the most polarizable, when they are present in combination with small cations such as K+, which are very polarizing. A large cation such as I− is easily deformed by the electric field generated by a small cation such as K+ with a relatively high electric charge density. The result is the polarization of the I− ions that allows them to remain at the interface, resisting displacement into the bulk fluid by the MIBC molecules.
3.3. Water Molecules Orientation
Various experimental and theoretical studies show that the molecular picture of water at the air–water interface includes hydrogen bonds of the double-donor (DD) type, with two OH groups involved per water molecule; single donor (SD), with one OH group involved per water molecule; and non-donor (ND), with no OH involved [31,32,33]. The dominant configurations are the DD and SD, with orientations mainly with the water dipole pointing toward the air and the hydrogens pointing toward the water. There is no agreement on the existence of ND configurations [33]. Studies with sum-frequency generation experiments and extensive ab initio simulations provide no evidence for a significant occurrence of ND configurations [33]. The results of our simulations of the liquid-water vapor interface are by this art and, therefore, can be very useful to assess the impact of salts and MIBC on the structure of the water at the interface and, thus, on the liquid solution surface properties.
Here, the orientation of water molecules is given by , where is the angle between the vector opposite to the water dipole and the normal to the liquid–vapor interface, as defined in Figure 6. Values of −1 indicate the water dipole points away from the interface to the vapor phase, i.e., water hydrogens point toward the liquid water bulk, and the opposite when the value is 1. Values between −1 and +1 indicate partial orientation of the water molecules. Figure 7 and Figure 8 summarize the average of as a function of the distance from the water liquid–vapor interface and the concentration of MIBC for freshwater, solutions of 0.1 M chloride salts, and solutions of 0.1 M iodine salts at 300 K. The average of is over the population of water molecules along the z-axis.
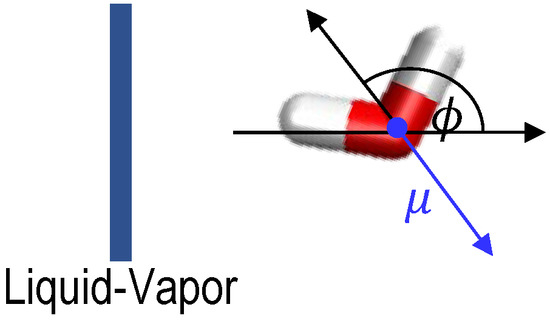
Figure 6.
Definition of water orientation respect to the liquid–vapor interface.
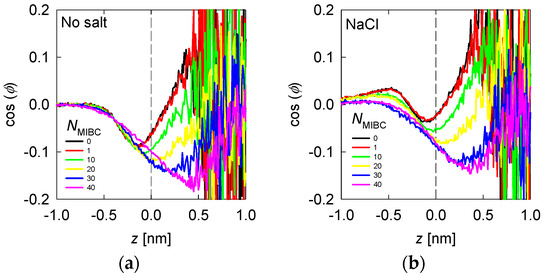
Figure 7.
Average water orientation represented by as a function of the distance from the liquid–vapor interface (plane z) and the concentration of MIBC (number of molecules in the legends) for freshwater (a) and solutions of chloride salts (b). Salt concentration is 1 M and temperature is 300 K. Negative values of z correspond to the region occupied by the liquid phase.
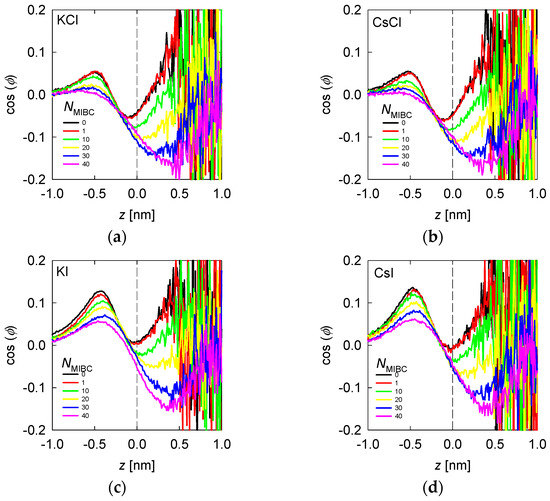
Figure 8.
Average water orientation represented by as a function of the distance from the liquid–vapor interface (plane z) and the concentration of MIBC (number of molecules in the legends) for chlorides, KCl (a) and CsCl (b), and iodides solutions, KI (c) and CsI (d). Salt concentration is 1 M and temperature is 300 K. Negative values of z correspond to the region occupied by the liquid phase.
The results for freshwater and with MIBC in Figure 7a show that in the bulk liquid = 0 as expected by the random distribution of water molecules; however, in the vicinity of the liquid–vapor interface, the takes increasing negative values, reaching a minimum at ca. 0.2 nm in the liquid phase. At increasing distances toward the vapor phase, remains negative, although its absolute value decreases to zero at ca 0.2 nm in the vapor phase. Between 0.5 nm in the liquid phase and 0.2 nm in the vapor phase, water is preferentially structured in DD and SD configurations. This water forms a sufficiently thick layer with a thickness of approximately 0.75 nm, equivalent to about two layers of water. At distances greater than 2 nm within the vapor phase > 0, and as expected, water assumes configurations with hydrogens pointing on average toward the vapor phase. When MIBC is added, the DD and SD configurations extend as far as the vapor phase, and at the highest MIBC concentration these configurations extend as far as 0.5 nm into the vapor phase. At a low concentration of MIBC there is practically no alteration of the water structure. On the contrary, at a high concentration of MIBC, the molecules are packed adopting a configuration orthogonal to the interface; the carboxyl groups that reside in the liquid in higher concentration induce the DD and SD ordering in the vapor phase close to the interface.
When there is salt in the water, such as chlorides and iodides, the ions tend to concentrate in the liquid neighboring the liquid–vapor interface, with the most polarizing and most polarizable closer to the interface and the polarizable closer than the polarizing ones (Figure 4 and Figure 5). For example, when the salt is NaCl, from Figure 4, the Na+ ions are located at ca. 0.25 nm from the interface and Cl− ions at 0.125 nm. The in Figure 7b shows an inflection between these two distances, revealing that the water molecules that solvate or exist in the neighborhood of Na+ ions do so in configurations with > 0, with a maximum at ca. 0.4 nm (absolute distance). Those that solvate or exist near Cl− ions do so in DD and SD configurations, with < 0, with a minimum at ca. 0.1 nm. In the presence of MIBC and with increasing concentration, the behavior of tends to that of water without salt because the MIBC expels the Na and Cl ions from the vicinity of the interface. In the presence of other chlorides, such as KCl and CsCl, the behavior of is repeated, Figure 8a,b, respectively, only that the maxima and minima are more pronounced as the size of the cation increases. The latter is because the density of coordination water molecules decreases with the size of the cation. Therefore, inducing the DD or SD orientation is more effective than when the cation is small and thus more hydrated.
In the presence of iodides and MIBC, the trend is similar to that of chlorides with a notable difference: the structure of the coordination water of the cation with orientation > 0 and that of the anion with < 0 is maintained at high MIBC concentrations, see Figure 8c,d. The implication is that strongly polarizable ions, such as iodides, remain close to the liquid–vapor interface and can coexist with surfactant molecules favoring their function. This is a big difference with chlorides, for example, in the surface tension of their solutions.
3.4. Surface Tension
Salts profoundly affect the structure of water at the liquid–vapor interface, in some cases limiting the surfactant capacity of molecules such as MIBC. One direct impact is on the surface tension of soluble salt solutions such as those considered here. Figure 9 shows surface tension versus MIBC concentration, expressed as the number of MIBC molecules, in the presence of 1 M alkali metal chloride and iodine salts at 300 K. Chlorides dominate the liquid–vapor interface even at relatively high MIBC concentrations, as shown in Figure 9. Still, they are not polarizable; thus, their effect is to stiffen the interface by increasing the surface tension. The result is very marked when the salt is NaCl 1 M. On the other hand, when the MIBC concentration is high enough, about 25 MIBC molecules, ca. 1.2 mM, very close to the experimental value [5,18,19,20] the MIBC manages to displace some Na and Cl ions to the bulk liquid and settle at the interface, in this case, the surface tension begins to be controlled by the MIBC. This behavior is less marked in KCl in the presence of MIBC, but it does exist. Some researchers even show experimentally that the behavior of KCl solutions is similar to that of NaCl [22]. A previous study [19] showed that this MIBC crossover concentration has apparently universal characteristics because it is the same for NaCl solutions in the concentration range of 0.1 to 3 M (see also [34]). Additionally, now, here we find that it is practically the same for solutions of chlorides other than NaCl, such as KCl and CsCl, Figure 9a. Unlike chlorides, iodide salts never interfere with the surfactant characteristic of MIBC, and thus the surface tension is not affected, as shown in Figure 9b.
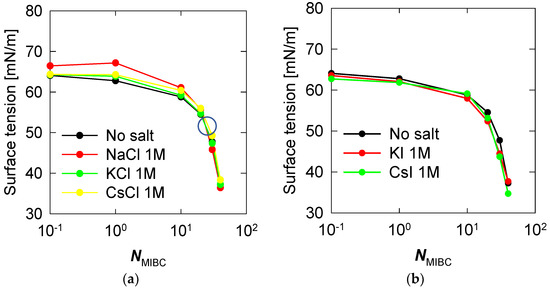
Figure 9.
Surface tension versus concentration of MIBC in aqueous salt solutions, (a) chlorides, (b) iodides. Temperature is 300 K. The large open circle in (a) marks the crossover from interfaces controlled by chloride ions to interfaces controlled by MIBC.
4. Conclusions
Quite different molecular pictures characterize the liquid–vapor interfaces of solutions of alkali metal chlorides and iodides and MIBC in water. The halides are common in water of a secondary quality used today to deal with the scarcity of freshwater. According to the results, they could interfere with the function of the MIBC or determine the optimal dose of MIBC. Depending on the halide and MIBC concentration, the different interfacial profiles produce characteristic surface tensions. Highly ionic halides do not inhabit the interface; therefore, the surface tension is that of water with MIBC. The covalent halides coexist with the MIBC molecules at the interface where they organize as surfactants, but they clearly are not and thus do not change the surface tension relative to that of water with MIBC. A clear case is NaCl, which at a low MIBC controls the surface tension. The concentration at which the MIBC displaces NaCl ions to take control of surface tension is reproducible and measurable in the laboratory. Density profiles obtained by molecular dynamics with polarizable force fields show that small polarizing cations and non-polarizable anions generally move from the interface toward the liquid mass. Therefore, they do not interfere with the structure of the water, do not affect the function of the MIBC, and, consequently, do not change the surface tension concerning that of freshwater with MIBC. The same applies to non-polarizing ions that permanently inhabit the liquid bulk more preferentially. However, a halide with small ions such as NaCl falls short of this description. The difference in electronegativities between Na and Cl causes some of these ions, particularly Cl−, to remain at the interface, competing for space with MIBC molecules at low concentrations. At high concentrations, MIBC displaces Cl− ions toward the bulk of the solution to dominate the interface. The consequences on surface tension are well known. NaCl raises the tension of solutions distinctly above the tension of freshwater at low MIBC up to a critical concentration, which is when the MIBC takes control of the interface, a concentration that has been verified experimentally. The iodides here are all highly covalent with strongly polarizable I− ions. Even at high concentrations of MIBC they remain at the interface, although without interfering with the MIBC. Therefore, the tension of these solutions remains that of freshwater with MIBC. This work concludes that the behavior of NaCl is unique; the other halides present very different molecular profiles at the interface but do not affect the surface tension. We trust that the results of this study will contribute to the challenge of sustainably replacing fresh water with partially desalinated water and to the growing interest in lithium concentration from brines, which involve foam flotation and new chemistry and conditions.
Author Contributions
Conceptualization, P.G.T., J.H.S., G.R.Q. and R.E.R.; methodology, O.A., P.G.T., J.H.S., G.R.Q. and R.E.R.; formal analysis, O.A., P.G.T., J.H.S., G.R.Q. and R.E.R.; resources, P.G.T. and L.G.; data curation, O.A., J.H.S. and G.R.Q.; writing—original draft preparation, G.R.Q. and P.G.T.; writing—review and editing, O.A., P.G.T., J.H.S., G.R.Q., L.G. and R.E.R. All authors have read and agreed to the published version of the manuscript.
Funding
This research was funded by CRHIAM project ANID/FONDAP/15130015 and projects ANID/FSEQ/210002, ANID/FONDECYT/11171092, ANID/FONDECYT/3200978, ANID/FONDECYT/1190101, ANID/FONDECYT/1211705, and ANID/ACT210030.
Data Availability Statement
The data presented in this study are available on request from authors G.R. Quezada and P.G. Toledo.
Acknowledgments
We thank Centro CRHIAM project ANID/FONDAP/15130015 and project ANID/FSEQ/210002 for financial support. J.H.S. thanks project ANID/FONDECYT/11171092, G.R.Q. thanks project ANID/FONDECYT/3200978, R.E.R. thanks project ANID/FONDECYT/1190101, and L.G. thanks projects ANID/FONDECYT/1211705 and ANID/ACT210030. Computing resources were provided by The Southern GPU-cluster (SGPU-C) UDEC funded by FONDEQUIP EQM150134.
Conflicts of Interest
The authors declare no conflict of interest.
References
- Comley, B.A.; Harris, P.J.; Bradshaw, D.J.; Harris, M.C. Frother Characterisation Using Dynamic Surface Tension Measurements. Int. J. Miner. Process. 2002, 64, 81–100. [Google Scholar] [CrossRef]
- Le, T.N.; Phan, C.M.; Ang, H.M. Influence of Hydrophobic Tail on the Adsorption of Isomeric Alcohols at Air/Water Interface. Asia Pac. J. Chem. Eng. 2012, 7, 250–255. [Google Scholar] [CrossRef]
- Nguyen, C.V.; Chaudhary, D. Surface Potential of MIBC at Air/Water Interface: A Molecular Dynamics Study. e-J. Surf. Sci. Nanotech. 2012, 10, 437–440. [Google Scholar]
- Nguyen, C.V.; Phan, C.M.; Ang, H.M.; Nakahara, H.; Shibata, O.; Moroi, Y. Molecular Dynamics Investigation on Adsorption Layer of Alcohols at the Air/Brine Interface. Langmuir 2015, 31, 50–56. [Google Scholar] [CrossRef] [PubMed]
- Gao, G.; Nguyen, C.V.; Phan, C.M. Molecular Arrangement Between Electrolyte and Alcohol at the Air/Water Interface. J. Mol. Liq. 2017, 242, 859–867. [Google Scholar] [CrossRef]
- Jungwirth, P.; Tobias, D.J. Ions at the Air/Water Interface. J. Phys. Chem. B 2002, 106, 6361–6373. [Google Scholar] [CrossRef]
- Jungwirth, P.; Tobias, D.J. Specific Ion Effects at the Air/Water Interface. Chem. Rev. 2006, 106, 1259–1281. [Google Scholar] [CrossRef] [PubMed]
- Liu, D.; Ma, G.; Levering, L.M.; Allen, H.C. Vibrational Spectroscopy of Aqueous Sodium Halide Solutions and Air-Liquid Interfaces: Observation of Increased Interfacial Depth. J. Phys. Chem. B 2004, 108, 2252–2260. [Google Scholar] [CrossRef]
- Mucha, M.; Frigato, T.; Levering, L.M.; Allen, H.C.; Tobias, D.J.; Dang, L.X.; Jungwirth, P. Unified Molecular Picture of the Surfaces of Aqueous Acid, Base, and Salt Solutions. J. Phys. Chem. B 2005, 109, 7617–7623. [Google Scholar] [CrossRef]
- Shen, Y.R.; Ostroverkhov, V. Sum-Frequency Vibrational Spectroscopy on Water Interfaces: Polar Orientation of Water Molecules at Interfaces. Chem. Rev. 2006, 106, 1140–1154. [Google Scholar] [CrossRef]
- Gopalakrishnan, S.; Liu, D.F.; Allen, H.C.; Kuo, M.; Shultz, M.J. Vibrational Spectroscopic Studies of Aqueous Interfaces: Salts, Acids, Bases, and Nanodrops. Chem. Rev. 2006, 106, 1155–1175. [Google Scholar] [CrossRef]
- Tarbuck, T.L.; Ota, S.T.; Richmond, G.L. Spectroscopic Studies of Solvated Hydrogen and Hydroxide Ions at Aqueous Surfaces. J. Am. Chem. Soc. 2006, 128, 14519–14527. [Google Scholar] [CrossRef]
- Levering, L.M.; Sierra-Hernandez, M.R.; Allen, H.C. Observation of Hydronium Ions at the Air-Aqueous Acid Interface: Vibrational Spectroscopic Studies of Aqueous HCl, HBr, and HI. J. Phys. Chem. C 2007, 111, 8814–8826. [Google Scholar] [CrossRef]
- Tian, C.; Ji, N.; Waychunas, G.A.; Shen, Y.R. Interfacial Structures of Acidic and Basic Aqueous Solutions. J. Am. Chem. Soc. 2008, 130, 13033–13039. [Google Scholar] [CrossRef] [PubMed]
- D’Auria, R.; Tobias, D.J. Relation Between Surface Tension and Ion Adsorption at the Air–Water Interface: A Molecular Dynamics Simulation Study. J. Phys. Chem. A 2009, 113, 7286–7293. [Google Scholar] [CrossRef]
- Chattoraj, D.K. Adsorption and the Gibbs Surface Excess; Chattoraj, D.K., Birdi, K.S., Eds.; Plenum Press: New York, NY, USA, 1984. [Google Scholar]
- Nguyen, C.V.; Nakahara, H.; Shibata, O.; Phan, C.M. Adsorption of Sodium Iodine at Air/Water Interface. J. Mol. Liq. 2020, 298, 112076. [Google Scholar] [CrossRef]
- Alvarado, O.; Quezada, G.R.; Saavedra, J.H.; Rozas, R.E.; Toledo, P.G. Species Surface Distribution and Surface Tension of Aqueous Solutions of MIBC and NaCl Using Molecular Dynamics. Polymers 2022, 14, 1967. [Google Scholar] [CrossRef]
- Castro, S.; Miranda, C.; Toledo, P.; Laskowski, J.S. Effect of Frothers on Bubble Coalescence and Foaming in Electrolyte Solutions and Seawater. Int. J. Miner. Process. 2013, 124, 8–14. [Google Scholar] [CrossRef]
- Phan, C.M.; Nakahara, H.; Shibata, O.; Moroi, Y.; Le, T.N.; Ang, H.M. Surface Potential of Methyl Isobutyl Carbinol Adsorption Layer at the Air/Water Interface. J. Phys. Chem. B 2012, 116, 980–986. [Google Scholar] [CrossRef]
- Shahir, A.A.; Nguyen, K.T.; Nguyen, A.V. A Sum-Frequency Generation Spectroscopic Study of the Gibbs Analysis Paradox: Monolayer or Sub-Monolayer Adsorption? Phys. Chem. Chem. Phys. 2016, 18, 8794. [Google Scholar] [CrossRef]
- Ozdemir, O.; Karakashev, S.I.; Nguyen, A.V.; Miller, J.D. Adsorption and Surface Tension Analysis of Concentrated Alkali Halide Brine Solutions. Miner. Eng. 2009, 22, 263–271. [Google Scholar] [CrossRef]
- Cornell, W.D.; Caldwell, J.W.; Kollman, P.A. A Second Generation Force Field for the Simulation of Proteins, Nucleic Acids, and Organic Molecules. J. Am. Chem. Soc. 1995, 117, 5179–5197. [Google Scholar] [CrossRef]
- Sorin, E.J.; Pande, V.S. Exploring the Helix-Coil Transition Via All-Atom Equilibrium Ensemble Simulations. Biophys. J. 2005, 88, 2472–2493. [Google Scholar] [CrossRef]
- Yu, H.; Whitfield, T.W.; Harder, E.; Lamoureux, G.; Vorobyov, I.; Anisimov, V.M.; MacKerell, A.D., Jr.; Roux, B. Simulating Monovalent and Divalent Ions in Aqueous Solution Using a Drude Polarizable Force Field. J. Chem. Theory Comput. 2010, 6, 774–786. [Google Scholar] [CrossRef]
- Lamoureux, G.; Harder, E.; Vorobyov, I.V.; Roux, B.; MacKerell, A.D., Jr. A Polarizable Model of Water for Molecular Dynamics Simulations of Biomolecules. Chem. Phys. Lett. 2006, 418, 245–249. [Google Scholar] [CrossRef]
- Lemkul, J.A.; Roux, B.; van der Spoel, D.; MacKerell, A.D., Jr. Implementation of Extended Lagrangian Dynamics in GROMACS for Polarizable Simulations Using the Classical Drude Oscillator Model. J. Comput. Chem. 2015, 36, 1473–1479. [Google Scholar] [CrossRef]
- Frenkel, D.; Smit, B. Understanding Molecular Simulation: From Algorithms to Applications; Academic Press: San Diego, CA, USA, 2002. [Google Scholar]
- Darden, T.; York, D.; Pedersen, L. Particle Mesh Ewald: An N· log(N) Method for Ewald Sums in Large Systems. J. Chem. Phys. 1993, 98, 10089–10092. [Google Scholar] [CrossRef]
- Irving, J.H.; Kirkwood, J.G. The Statistical Mechanics Theory of Transport Processes. IV. The Equations of Hydrodynamics. J. Chem. Phys. 1950, 18, 817–829. [Google Scholar] [CrossRef]
- Du, Q.; Superfine, R.; Freysz, E.; Shen, Y.R. Vibrational Spectroscopy of Water at the Vapor/Water Interface. Phys. Rev. Lett. 1993, 70, 2313–2316. [Google Scholar] [CrossRef] [PubMed]
- Wilson, K.R.; Cavalleri, M.; Rude, B.S.; Schaller, R.D.; Nilsson, A.; Pettersson, L.G.M.; Goldman, N.; Catalano, T.; Bozek, J.D.; Saykally, R.J. Characterization of Hydrogen Bond Acceptor Molecules at the Water Surface Using Near-Edge X-Ray Absorption Fine-Structure Spectroscopy and Density Functional Theory. J. Phys. Condens. Matter 2002, 14, L221–L226. [Google Scholar] [CrossRef]
- Kühne, T.D.; Pascal, T.A.; Kaxiras, E.; Jung, Y. New Insights into the Structure of the Vapor/Water Interface from Large Scale First-Principles Simulations. J. Phys Chem. Lett. 2011, 2, 105–113. [Google Scholar] [CrossRef] [PubMed]
- Pan, Y.; Gresham, I.; Bournival, G.; Prescott, S.; Ata, S. Synergistic Effects of Frothers, Collector and Salt on Bubble Stability. Powder Technol. 2022, 397, 117028. [Google Scholar] [CrossRef]


Disclaimer/Publisher’s Note: The statements, opinions and data contained in all publications are solely those of the individual author(s) and contributor(s) and not of MDPI and/or the editor(s). MDPI and/or the editor(s) disclaim responsibility for any injury to people or property resulting from any ideas, methods, instructions or products referred to in the content. |
© 2023 by the authors. Licensee MDPI, Basel, Switzerland. This article is an open access article distributed under the terms and conditions of the Creative Commons Attribution (CC BY) license (https://creativecommons.org/licenses/by/4.0/).