Abstract
This study used a physical activation method to prepare asphalt-pitch-derived activated carbon (Pitch AC) for an electric double-layer capacitor (EDLC) electrode. X-ray diffraction analysis and Raman spectroscopy were used to estimate the change in the crystal structure of Pitch AC with activation time. In addition, the textural properties of Pitch AC were studied by Brunauer-Emmett-Teller (BET), Dubinin-Radushkevich (DR) and non-localized density functional theory (NLDFT) equations with N2/77K isotherm adsorption-desorption curves. The electrochemical performance of the Pitch AC was analyzed using a coin-type EDLC with 1 M SBPBF4/PC via galvanostatic charge/discharge, cyclic voltammetry and electrochemical impedance spectroscopy. The specific surface area and total pore volume were 990–2040 m2/g and 0.42–1.51 cm3/g, respectively. The pore characteristics of the Pitch AC varied according to the activation time and changed from a microporous structure to a micro-mesoporous structure as the activation time increased. The electrochemical performance analysis also found that the specific capacity was increased from 43.6 F/g to 84.5 F/g at 0.1 A/g as activation time increased. In particular, Pitch AC-9 exhibited the best electrochemical performance (rectangular CV curve, reversible GCD, lowest ion charge transfer resistance and Warburg impedance). In addition, Pitch AC-9 was confirmed to have a specific capacitance similar to commercial activated carbon for EDLC (YP-50F). Therefore, it was considered that Pitch AC could replace commercial activated carbon for EDLC because it has excellent pore characteristics and electrochemical performance despite being manufactured through a very low-cost precursor and a simple process (physical activation method).
1. Introduction
Electric double-layer capacitors (EDLC) have an energy storage mechanism involving a surface charge adsorption reaction (non-Faradic process) and have been the most attention-grabbing energy storage devices in recent years, along with Li-ion batteries [1,2,3]. EDLCs have been primarily used in portable electronics and power backup applications (Uninterruptible Power) owing to their high output characteristics [4]. However, in recent years, the demand for and importance of EDLCs has increased because of the rapid development of industries that require high-power-density characteristics, such as robotics [5,6], renewable energy [7,8] and eco-friendly automobiles [9,10].
The active electrode material for EDLC requires a high specific surface area and good electrical conductivity to store large amounts of ions; therefore, activated carbon is commonly used [11,12]. Currently, activated carbon for EDLC is manufactured by the steam activation method using a coconut-shell precursor for high energy density. In addition, coconut-derived activated carbon has microporous characteristics and is easy to process owing to its high hardness; therefore, it is used in various industries, such as water purification [13,14] and air filtration (including VOC abatement) [15,16]. Recently, as environmental pollution has accelerated, the demand for health-improving products, such as air and water purifiers, has increased; thus, the demand for coconut-derived activated carbon is also increasing. However, coconut shells are only produced in subtropical climates with high levels of sunlight. As a result, there is a shortage of activated carbon, which is increasing in use.
In the past, research on activated carbon has focused on developing biomass-derived activated carbon to replace coconut shell-derived activated carbon. As a result, various biomass precursors, such as husks [17], bamboo [18], kenaf [19], wood tar [20] and chitin [21], have been manufactured as activated carbon for EDLC [22,23]. However, most biomass precursors have the disadvantages of a limited growth rate and limited growing area. In addition, biomass requires an extra stabilization process in order to develop the cellulose structure into a carbon crystal structure [18,19], and it has a high ash content [24].
Asphalt pitch is a by-product of the petroleum industry and has a high carbonization yield owing to its low ash content and developed polycrystalline (aromatic) structure [25]. In particular, asphalt pitch is a by-product of the petroleum industry, so the precursor price is very low. Furthermore, unlike biomass, it is less affected by climate or the environment, so it provides a stable and smooth supply as an activated carbon precursor.
Production of activated carbon is divided into physical and chemical activation methods [26,27,28]. Generally, pitch has a more developed crystalline structure than biomass because of its polycrystalline structure. Therefore, pitch-derived activated carbon is prepared using chemical activation methods to destroy sp2 hybridized carbon bonds and develop them into pores [29]. The chemical activation method can convert highly crystalline precursors into activated carbon with a high specific surface area, owing to its higher activation energy than the physical activation method. However, activated carbon production costs increase because of chemical activation agents (KOH, H3PO4, ZnCl2, among others). In addition, chemical activation presents challenges, such as equipment corrosion and wastewater generation, making it difficult to apply it in industry. In other words, even if activated carbon is manufactured from low priced asphalt pitch by the chemical activation method, it would be uneconomical and difficult to apply in industry. Therefore, research is needed to prepare activated carbon for EDLC through physical activation using asphalt pitch to achieve high economic efficiency.
This study prepared asphalt-pitch-derived activated carbon (Pitch AC) with excellent pore characteristics to replace commercial coconut-shell-derived activated carbon (YP-50F) in EDLC. Asphalt pitch, a by-product of the oil refining industry, was selected as the activated carbon precursor because of its low precursor price. In addition, the steam activation method was selected as the activation method for manufacturing Pitch AC with high economic efficiency and excellent pore characteristics. Finally, the electrochemical performance of the pitch AC was evaluated based on its pore characteristics after manufacturing a CR2032 type EDLC with a 1 M SBPBF4/PC electrolyte.
2. Materials and Methods
2.1. Sample Preparation
The Korea Petroleum Industries Company provided asphalt pitch manufactured from vacuum residue, which was used as a precursor for activated carbon in this study. The asphalt pitch was crushed to a particle size of less than 250 μm. Then, it was placed in an alumina boat and stabilized in a custom-made cylindrical tubular furnace (SIC heater: 80 × 800 mm). The asphalt pitch was heated to 270 °C at a 0.2 °C/min rate under air atmosphere and held at stabilization temperature for 2 h. After stabilization, the gas flow was switched to an N2 atmosphere (99.999%), and the stabilized asphalt pitch was carbonized for 1 h after heating up to 700 °C at a 10.0 °C /min rate. The stabilization and carbonization yields of the asphalt pitch were 102% and 67%, respectively.
Carbonized asphalt pitch (3 g) was placed in an alumina boat and inserted into a self-made cylindrical tubular furnace (SIC heater, 120 × 670 mm). Then, it was heated to 900 °C under an N2 atmosphere at a rate of 10.0 °C /min. After reaching the activation temperature, the gas flow was switched to steam (flow rate of 0.5 mL/min) and activated for 60–120 min. The sample names of the asphalt pitch-derived activated carbon were labeled based on the regulation of the Pitch-activated carbon activation time (Pitch AC-6, 7, 8, 9 and 12). In addition, pitch AC was compared with commercial steam-activated coconut shell-based activated carbon (YP-50F, Kuraray Chemical Corporation, Tokyo, Japan).
2.2. Characterization
The change in the nanocrystal structure of the Pitch AC was analyzed by X-ray diffraction (XRD) spectroscopy (MiniFlex 600, Rigaku, Japan) and Raman spectroscopy (Raman spectroscope, HEDA, NOST, KOREA). The XRD curve was measured using CuKα (1.5406 Å) in the 10–60° range at 2°/min. To observe the change in the crystal structure of the Pitch AC, according to the activation time, the XRD curve was fitted through Gaussian calculations, and the central diffraction angle and full width at half maximum (FWHM) of each crystalline peak were calculated. In addition, the interplanar distances (d002 and d10l) of the Pitch AC were calculated using the Bragg equation (Equation (1)). Furthermore, crystal size (La) and crystal height (Lc) were calculated from the XRD pattern using the Scherrer equation (Equation (2)) [30].
where λ indicates the wavelength of the applied X-ray (1.5406 Å), B indicates the FWHM, θ indicates the center diffraction angles and K indicates the constant lattice Lc (0.91) and La (1.84). Raman spectrum was measured using green raiser wavelength (532 nm) and ×100 magnification in the 800–2000 cm−1 range. The Raman spectra were normalized based on the G peak and then fitted using Gaussian calculations to four peaks (G1, G2, D1 and D2) with an r-squared value of 0.999 or greater [31].
Textural properties of Pitch AC were measured after 12 h of drying at 300 °C under 0.133 Pa residual pressure using an isotherm gas adsorption analyzer (BELSORP-max, BEL Japan, Osaka, Japan). The specific surface area was calculated from the isotherm adsorption-desorption curves using the Brunauer-Emmett-Teller (BET) equation [32]. The micropore volume was calculated using the Dubinin-Radushkevich (DR) equation [33]. Moreover, pore size distribution (PSD) was calculated using the non-localized density functional theory (NLDFT) [34].
The morphologies and chemical composition of the Pitch AC were observed by field-emission scanning electron microscopy (FE-SEM, ZEISS sigma500, ZEISS, Jena, Germany) and energy dispersive X-ray spectrometer (EDX, XFlash 6-60, BRUKER, Billerica, MA, USA), respectively. Before imaging their surfaces, the prepared Pitch AC and YP-50F were coated with platinum to minimize the charging effects that occur during SEM analysis. The SEM-EDX analysis was performed under the conditions of 5.0 × 10⁻⁵ Pa of pressure and 5 kV of accelerating voltage.
2.3. Electrochemical Tests
The EDLC electrode was manufactured as a slurry that included activated carbon (85 wt%), a binder (7.5 wt%) and a conductive material (7.5 wt%). The binders used were carboxymethylcellulose (CMC; Dai-Inci Kogyo Seiyaku Co., Ltd., Kyoto, Japan), styrene-butadiene rubber (SBR; BM400B; Zeon, Japan) and polytetrafluoroethylene (PTFE; 9002-84-0; Sigma Aldrich, St. Louis, MO, USA). In addition, carbon black (Super P, Timcal Ltd., Bodio, Switzerland) was used as the conductive material.
The slurry, consisting of activated carbon, a conductive agent and a binder, was coated on an aluminum foil to a thickness of 0.152 mm using a laboratory-scale doctor blade coater. The coated electrode was dried at 100 °C for 24 h and then pressed using a heat-roll press until the electrode thickness was 0.13 mm (about 85% of the coating thickness). For the EDLC, a punched electrode (12 mm in diameter), 1 M spirobipyrrolidinium tetrafluoroborate (SBPBF4) in propylene carbonate (PC) and a cellulose-based separator (NKK, Kawasaki, Japan) were assembled according to the CR2032 standard.
The electrochemical performance of EDLCs were tested in symmetrical two-electrode systems with 1M SBPBF4/PC. The galvanostatic charge-discharge (GCD) test was performed using a MACCOR 4300 battery tester (Maccor Inc., Tulsa, OK, USA). The cycle voltammetry (CV) and impedance measurements were performed using a VSP electrochemical workstation (Bio-Logic Science Instruments, Grenoble, France). The GCD was measured with a current density of 0.1–10.0 A/g at a voltage between 0.1–2.5 V. CV was measured at a scan rate of 5–400 mV and a 0.1–2.5 V voltage range, and the impedance was measured within the 10–300 MHz frequency range. The test was performed 10 times to ensure the reliability of the analysis, and the 10th dataset was used. The specific capacitance (F/g) of the symmetric electrodes was calculated using Equation (3), the discharge curve of the GCD.
where i indicates discharge current (A), Δt indicates discharge time (s), m indicates an electrode mass and Δv indicates voltage.
3. Results and Discussions
3.1. X-ray Diffraction Analysis
X-ray diffraction (XRD) is a useful analytical method for observing the crystal structure of carbon materials. This study used XRD to investigate the crystal structure characteristics concerning the activation time. Figure 1 shows the XRD pattern of the Pitch AC.
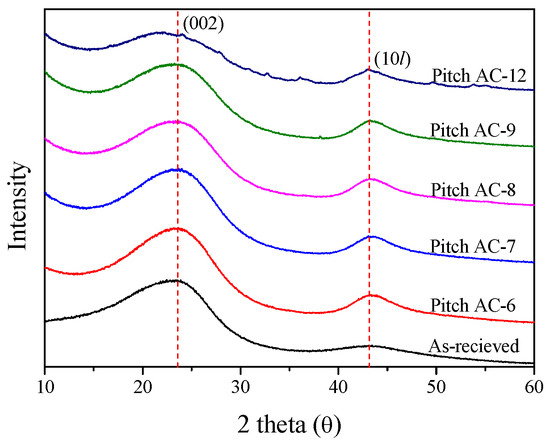
Figure 1.
X-ray diffraction of pitch-derived activated carbons as a function of various activation conditions.
It is generally known that, as the crystal structure of carbon materials develops, the C(002) peak becomes sharper, and the diffraction angle is close to 26.5° [35]. However, as shown in Figure 1, the XRD curves of Pitch AC were observed to have a very broad shape. In other words, the crystal structure of Pitch AC was confirmed to be isotropic rather than anisotropic. As the activation time increased, the intensity of the XRD curve decreased because of increased burn-off. Additionally, the shape of the XRD curve changed from sharp to broad. In particular, the XRD pattern of Pitch AC-12 showed ash peaks other than the C(002) and C(10l) peaks. The ash content relatively increased with increase in burn-off and was the highest for Pitch AC-12.
Table 1 and Figure 2 show the interplanar distance (d002, d10l), crystal height (La) and crystal size (La) calculated using Bragg’s and Scherrer’s equations. The interplanar distance changes, and the AC pitch crystal size were more significant for C(10l) than for C (002) because, in the crystal structure of activated carbon, the layers of the C (002) plane consist of strongly hybridized sp2 bonds, and the vertical π bond on the C(002) plane results in a weak interlayer bond. Therefore, the oxidation reaction of activated carbon occurred at the crystal edge rather than at the basal plane via physical activation. As a result, a significant change was observed in C(10l) compared to C(002).

Table 1.
Structural parameters of pitch-derived activated carbons as a function of various activation conditions.
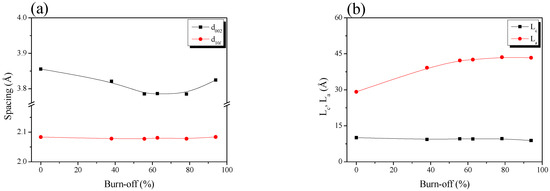
Figure 2.
Structural characteristics of the pitch-derived activated carbons as a function of the various activation time; (a) structure parameters and (b) interplanar distance.
The crystal structure oxidation of Pitch AC was divided into three stages according to the changed behavior of d002: initial-stage activation (≤burn-off 55%), middle-stage activation (burn-off 55%–burn-off 90%) and final-stage activation (>burn-off 90%). Figure 2a shows that d10l was maintained without a significant change, regardless of the burn-off. However, d002 decreased from 3.86 Å to 3.79 Å in the initial-stage activation. It was maintained in the middle-stage activation. After the final stage of activation, d002 increased to 3.82 Å.
In Figure 2b, Lc shows a slight decrease with increasing burn-off time. In contrast, La linearly increased from 29.17 Å to 42.25 Å at initial activation (≤burn-off 55%); the increasing rate decreased significantly from middle-stage activation. In other words, d002 and La exhibited opposite behaviors. The XRD results showed changes in the crystal structure of the activated carbon as statistical data. The oxidation of the amorphous and crystal edges affects the interplanar distance and crystal size change of activated carbon by physical activation [36,37]. In addition, amorphous preferential oxidation occurs more often than at crystal edges [36,37]. Accordingly, by the physical activation mechanism, the oxidation reaction of the Pitch AC was dominant in the amorphous phase at the initial activation stage; thus, d002 decreased owing to the decrease in the distance between the crystallites. On the other hand, La increased owing to the relative increase in the crystallite ratio due to the oxidation of the amorphous phase.
During the middle-stage activation, d002 and La were maintained without significant changes, even when the burn-off increased. It was confirmed that the Pitch AC oxidation reaction occurred simultaneously at the amorphous and crystalline edges. This result is due to the simultaneous oxidation of the amorphous and crystalline edges during middle-stage activation. Carbon domains composed of crystalline and amorphous phases are oxidized from the outside by the diffusion of an activation agent (Steam, H2O) [38]. During this process, the crystal edge of the outer domain and the amorphous structure of the new inner domain were simultaneously oxidized. In other words, based on statistical changes, changes in d002 and La were not observed because the amorphous and crystal edges were simultaneously oxidized.
Finally, in the final-stage activation, d002 was increased to 3.82 Å with increasing burn-off. Pitch AC-12 exhibited a 94% burn-off. In other words, the amorphous and crystal edges of Pitch AC were mainly oxidized during the long activation time. Only d002 increased, owing to the skeleton forming the remaining pore structure.
3.2. Raman Spectroscopy Analysis
Raman spectroscopy is frequently used to study individual changes in the crystal structure of porous carbon materials. Figure 3a shows the Raman spectra of Pitch AC. The Raman spectrum of Pitch AC showed two characteristic peaks at 1590 cm−1 and 1330 cm−1 assigned to the G-band (sp2 hybridized graphitic lattice vibration mode, amorphous carbon or small crystallites) and D-band (disordered graphitic lattice or defects/disorder), respectively. The valley between the G- and D-bands gradually deepened with activation time until 80 min (Pitch AC-8). In Figure 2, until 55% burn-off, it was confirmed that the oxidation of Pitch AC occurred predominantly in the amorphous phase. In other words, until 55% burn-off, the amorphous phase was continuously oxidized, and as a result, the G- and D-bands changed narrowly.
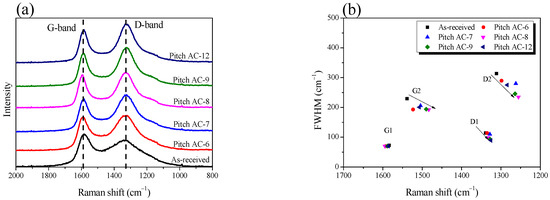
Figure 3.
(a) Raman spectra of pitch-derived activated carbons as a function of various activation conditions, (b) band parameters derived from raw spectra decompositions.
The first-order Raman spectral bands were deconvoluted into four Lorenz sub-bands (G1, G2, D1 and D2). Figure 4 shows the results of the peak fitting of the Raman spectra to observe the changes in the crystalline structure according to the activation time. For example, G1 is the in-plane bond-stretching motion of pairs of sp2 hybridized carbon atoms; D1 indicates disorder and edges in crystallite; G2 indicates amorphous carbon; and D2 indicates a disordered graphitic lattice [31].
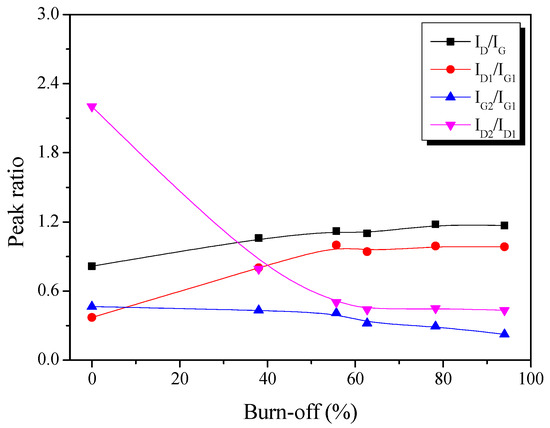
Figure 4.
Raman spectra peak intensity ratio in the pitch-derived activated carbons as a function of the various activation time.
As shown in Figure 3b, the FWHM of G1 did not significantly change, but the FWHM of D1 decreased from an activation time of 80 min. The physical activation method involves a pore development mechanism in which amorphous activated carbon is preferentially oxidized, followed by oxidation of the disordered graphitic lattice or crystal edge [36,37,38]. Therefore, by the physical activation mechanism, G1 did not change because the basal plane of the crystallite was not oxidized by steam, even when 94% was burned off. In addition, the FWHM of D1 decreased due to the oxidation of the disorders and edges in the crystallite after an activation time of 80 min (middle-stage activation). However, unlike G1 and D1, the FWHM of G2 and D2 decreased until Pitch AC-8 and then significantly increased at Pitch AC-12. As shown in Figure 2a, Pitch AC-12 was confirmed to leave only the skeleton of the pore structure (increase in d002) owing to the longest activation time. In other words, the FWHM of G2 and D2 decreased owing to the continuous oxidation of the amorphous and disordered graphitic lattices. However, when the activation time was increased to 120 min, the FWHM of G2 and D2 significantly increased because most amorphous and disordered graphitic lattices were oxidized, and only approximately 6% of the carbon skeleton remained.
Figure 4 presents the change in the intensity ratio of the deconvoluted Raman peak as a function of activation time. Initially, ID/IG and ID1/IG1 increased linearly with increasing activation time. Then, however, IG2/IG1 was constantly decreased with increasing activation time. These results indicate that the amorphous structure (G2) of Pitch AC is preferentially oxidized compared to the in-plane bond stretching motion of the pairs of sp2 hybridized carbon atoms (G1) structures, disorders and edges in crystallite (D1).
As mentioned earlier, the physical activation method involves a pore development mechanism based on the crystal structure oxidation of the activated carbon. For example, in Figure 2b, the La of Pitch AC increased with the activation time due to the amorphous phase’s constant oxidation. In other words, IG2/IG1 decreases with increasing activation time because of the constant oxidation of the amorphous phase. However, as the activation time increased, the amount of exposed crystal edges increased as the amorphous phase was oxidized, and it was considered that ID/IG and ID1/IG1 increased because of the relative increase in the crystal edge content.
Finally, ID2/ID1 exhibited a significant decrease up to a 55% burn-off, after which it tended to remain constant. As shown in Figure 2a, d002 was significantly decreased to a 55% burn-off and then increased to 94%, owing to the oxidation of edges in the crystal grain. Accordingly, ID2/ID1 decreased to a 55% burn-off due to amorphous and disordered graphitic lattice oxidation and was then considered to be constant, owing to the oxidation of edges in crystal grain.
As a result, it was confirmed that the oxidation reaction of Pitch AC by the steam activation method mainly occurred in the amorphous and disordered graphitic lattice, and the oxidation of edges in crystal grain occurred with increased activation time.
3.3. N2/77K Isotherm Adsorption-Desorption Analysis
N2/77K isotherm adsorption-desorption analysis is a very useful method for analyzing the pore characteristics of activated carbon. In this study, N2/77K isotherm adsorption-desorption analysis was used to analyze the change in the pore characteristics of Pitch AC with activation time.
Figure 5 shows the Pitch AC’s N2/77K isotherm adsorption-desorption curves. The isotherm adsorption-desorption curves of the Pitch AC showed that the amount of N2 adsorption increased with increasing activation time, and the shape of the curve changed in the order of Type I (a) < Type I (b) < Type II, according to the International Union of Pure and Applied Chemistry (IUPAC) [39]. The adsorption-desorption curve of Type I (a) was observed when single-layer adsorption occurred because of the strong interaction between the pore wall of the activated carbon and the adsorbent (N2), and it was mainly observed on activated carbons with microporous pore characteristics [39]. In addition, the adsorption-desorption curve of Type I (b) was observed in microporous activated carbon with a wider pore size distribution [39]. The type II adsorption-desorption curve was observed for single-layer adsorption and multilayer adsorption between the pore wall and the adsorbent, which was observed in activated carbon with the simultaneous development of micropores and mesopores [39]. In other words, the mesopore ratio of the Pitch AC increased with increasing activation time, and the pore structure of the Pitch AC changed from microporous to micro-mesoporous.
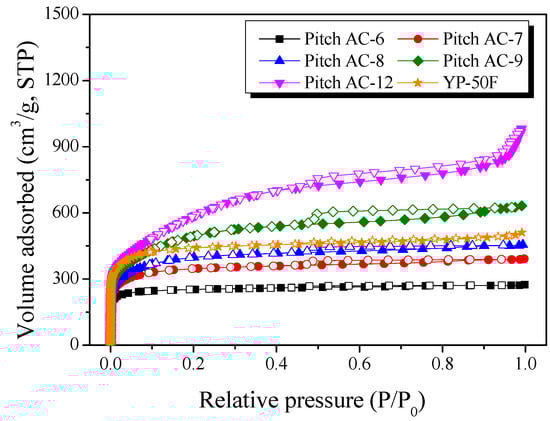
Figure 5.
N2/77K isotherm adsorption-desorption curves of pitch-derived activated carbons as a function of various steam activation conditions.
The shape of the hysteresis loop observed in the N2/77K isotherm adsorption-desorption curve was classified into six types by IUPAC according to the activated carbon’s pore shape [39]. The hysteresis of Pitch AC-6–Pitch AC-9 was observed to be H4-type, and then Pitch AC-12 was observed to be H3-type by IUPAC classification. In addition, the hysteresis area increased with increasing activation time. Crystal structure analysis (XRD and Raman analysis) confirmed that the oxidation reaction of Pitch AC by the steam activation method mainly occurred in the amorphous and disordered graphitic lattice, and the oxidation of edges in crystal grain occurred with increased activation time. In particular, Pitch AC-6–Pitch AC-9 developed silt-type micropores upon the oxidation of amorphous and disordered graphitic lattices, while Pitch AC-12 showed groove pores of a nonrigid generation formed by flaky particles upon the oxidation of edges in polycrystalline graphite with increasing activation time. Commercial activated carbon (YP-50F, coconut shell-derived activated carbon) was confirmed to have a Type I (a) and a hysteresis loop of H4-type. Therefore, it was considered that YP-50F has microporous pore characteristics and a slit-type pore structure similar to that of Pitch AC-6–Pitch AC-9.
Table 2 lists the textural properties of the Pitch AC as a function of activation time. The pore development behavior of activated carbon using the physical activation method is determined by the oxidation of the crystal structure; therefore, the pore characteristics and crystal structure are highly correlated [36,37]. Therefore, the textural properties of Pitch AC were analyzed based on the oxidation behavior of the crystal structure, as shown in Figure 2 and Figure 3. As shown in Table 2, the specific surface area and total pore volume were observed to be 990–2040 m2/g and 0.42–1.51 cm3/g, respectively. In addition, the micropore and mesopore volumes increased with increasing activation time. However, the rate of increase in the micropore volume gradually decreased, and the increase in the mesopore volume gradually increased, with the highest rate of increase observed in Pitch AC-12.
Table 2.
Textural properties of the pitch-derived activated carbons as a function of various activation conditions.
As shown in Figure 2 and Figure 4, the oxidation reaction of Pitch AC can be classified into three steps. In the initial-stage activation (≤55% burn-off), the oxidation reaction of Pitch AC mainly occurred at amorphous phase, and in the middle-stage activation (55% burn-off–90% burn-off), oxidation of the disordered graphitic lattice occurred in addition to amorphous oxidation. Finally, oxidation of the edges in the crystal grain occurred in the final activation stage (>90% burn-off). In a previous study, the micropore and mesopore volumes of activated carbon were confirmed to be affected by amorphous oxidation, disordered graphitics and oxidation of edges in crystal grain [36,37,38]. In other words, in the initial stage of activation, the pore characteristics of Pitch AC mainly developed into micropores by amorphous oxidation, but as the activation time increased, mesopores were developed by disordered graphitics and oxidation of edges in crystal grain. In addition, Pitch AC exhibited the highest oxidation of the edges in crystal grain owing to the longest activation time, resulting in the highest mesopore volume (0.84 cm3/g).
Figure 6a,b shows the pore size distribution (PSD) curves of pitch AC obtained using NLDFT and BJH equations, respectively. In Figure 6a, the PSD curves of the Pitch AC show change from a narrow peak to a broad peak with increasing activation time. Pitches AC-6 and -7 had PSD curves mainly developed with micropores of 1–2 nm pore diameters. As the activation increased, Pitch AC-8 had a 2–3 nm pore diameter PSD curve of mesopore with micropores of 1–2 nm pore diameters. Finally, in Pitch AC-9 and -12, the micropore and mesopore PSD merged, and the development of mesopores with diameters of 3 nm or more was observed. The increase in the pore volume in activated carbon induced by physical activation occurs in two ways: pore drilling (which results in a steady increase in the pore diameter) and pore deepening (which has virtually no effect on the pore diameter). As can be seen in Table 2, the total pore volume of Pitch AC increased from 0.42 cm3/g to 1.51 cm3/g with increasing activation time. In addition, as shown in Figure 4, the oxidation reaction of Pitch AC mainly occurred in the amorphous state, and as the activation time increased, the oxidation reaction occurred at the disordered graphitic lattice and edges in crystal grain. In other words, the pores of Pitch AC-6 and Pitch AC-7 were developed by pore deepening, and as the activation time increased, the pores of Pitch AC-8–Pitch AC-12 were developed by pore drilling. In Figure 6b, Pitch AC-6–Pitch AC-8 were observed to develop mesopores with a pore diameter of less than 10 nm. However, as the activation time increased, the PSD curves of Pitch AC-9 and -12 were expanded to pore diameters greater than 10 nm. In particular, Pitch AC-12 developed macropores with pore diameters greater than 50 nm. That is, the change in the PSD curve of the Pitch AC was influenced by pore deepening in the initial stage of activation; however, as the activation time increased, the PSD curve was influenced by pore drilling. Therefore, Pitch AC exhibited macropore development owing to the collapse of micropores and mesopores due to a 94% burn-off.
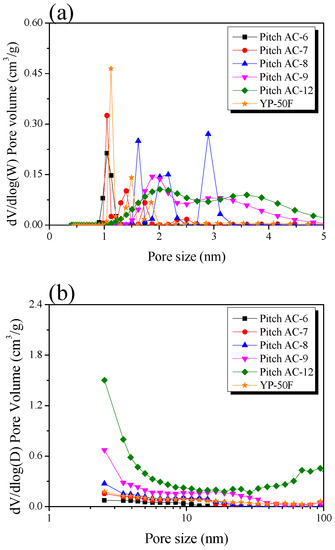
Figure 6.
Pore size distribution of the pitch-derived activated carbons as a function of various activation conditions; (a) NLDFT method and (b) BJH equation.
Figure 6a shows that YP-50F has a PSD with less than 2 nm pore diameter. In Figure 6b, YP-50F is observed to have a PSD very similar to that of Pitch AC-8. However, as shown in Table 2, the specific surface area of YP-50F was 1710 m2/g, which was higher than that of Pitch AC-8 (1500 m2/g). In other words, YP-50F is considered to have microporous pore characteristics, despite its higher specific surface area than that of Pitch AC-8; this is because Pitch AC has a crystal structure developed from aromatic polycrystals, whereas YP-50F has a crystal structure developed from cellulose. Thus, despite having the same specific surface area, YP-50F and Pitch AC are considered to have different pore properties because they were prepared using different precursors.
3.4. SEM and EDX Analysis
Scanning electron microscopy (SEM) and energy dispersive X-ray spectrometer (EDX) were used to observe the morphology and chemical composition, respectively. Figure 7 shows the SEM images of the Pitch AC and YP-50F. The SEM images of the Pitch AC show that the steam activation process produced extensive very rough and irregular morphology voids. As mentioned above, the oxidation reaction of pitch AC by steam activation mainly occurred at amorphous and the edges of crystalline grains, and the mesopore volume increased as the activation time increased (in Table 2). Also, the hysteresis loop area of Pitch AC was increased with increasing activation time (in Figure 6). Therefore, as the activation time increased, the void of the Pitch AC increased due to the oxidation of grain edges and the increase in the hysteresis loop area. Pitch AC-12 had the largest void due to the lowest yield and high mesopore volume. YP-50F has a microporous pore structure than Pitch AC, so it is decided that smaller voids were observed in the same specific surface area. The morphology of Pitch AC and YP-50F is considered by the effect of pore development behavior, according to the difference in the crystal structure of the precursor.
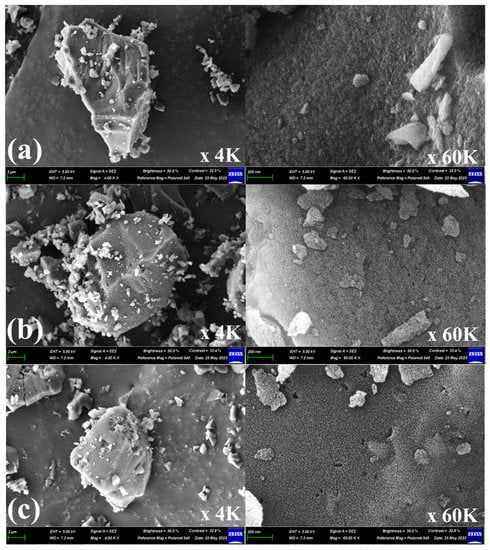
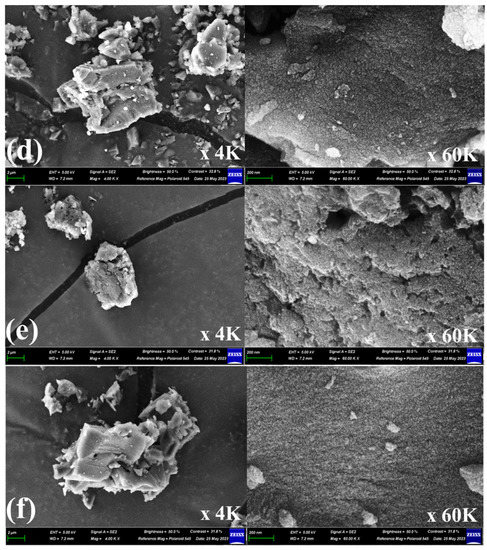
Figure 7.
Scanning electron microscopy (SEM) images for (a) Pitch AC-6, (b) Pitch AC-7, (c) Pitch AC-8, (d) Pitch AC-9, (e) Pitch AC-10 and (f) YP-50F.
The elemental composition of the sample was measured using the energy dispersive X-ray (EDX) analysis. Table 3 shows the presence of the main elements of Pitch AC and YP-50F. The elemental composition of the Pitch AC was observed in the order of C > O > S. In addition, as the activation time increased, the O elemental of the Pitch AC was observed to increase, while the S elemental was observed to decrease. The steam activation has a mechanism in which pores are formed by oxidation of crystals by high-temperature steam. Therefore, as the activation time increases, the content of element O is determined to increase due to the formation of oxygen functional groups at the edges of the crystal grains. On the other hand, it is decided that the content of S element was reduced by the high-temperature oxidation reaction. In addition, Pitch AC-12 was observed to have Zr elemental (1.16%) differently from the other Pitch AC. This is considered that the ash content relatively increased with increase in burn-off. YP-50F has a slightly different elemental composition (C > O > N) from Pitch AC. This is because the YP-50F was manufactured with a different precursor (coconut shell) than the Pitch AC [40].
Table 3.
Elemental composition of the pitch-derived activated carbon from EDX analysis.
3.5. Electrochemical Performance
The Pitch AC electrode was prepared using activated carbon with an activation yield of more than 10% for economic feasibility, and the electrochemical performance of Pitch AC was analyzed using CV, GCD and impedance analysis. The measurements were performed in 1 M SBPBF4/PC. Figure 7 shows the GCD curve of the Pitch AC measured at various current densities (0.1 A/g and 10.0 A/g) in the 0–2.5 voltage range. The GCD curve is the most commonly used method for analyzing the charge and discharge behaviors of EDLC. EDLC using activated carbon as the active electrode material is generally charged and discharged using a non-Faradaic process. Therefore, the GCD curve of an ideal EDLC is observed to be a reversible isosceles triangle with symmetrical charge-discharge curves.
In Figure 8a, the GCD curve of Pitch AC-6 is observed to be irreversible in shape, and the charge and discharge curves are not symmetrical. The sizes of the solvated electrolyte ions in 1 M SBPBF4/PC are 1.35 to 1.40 nm [41]. As shown in Figure 6a, Pitch AC-6 has a very narrow PSD curve with a pore diameter of 1 nm. In other words, Pitch AC-6 had a smaller PSD curve than that of the solvated ions. Accordingly, Pitch AC-6 was considered to have an irreversible GCD curve due to its higher ion charge transfer resistance than the other samples.
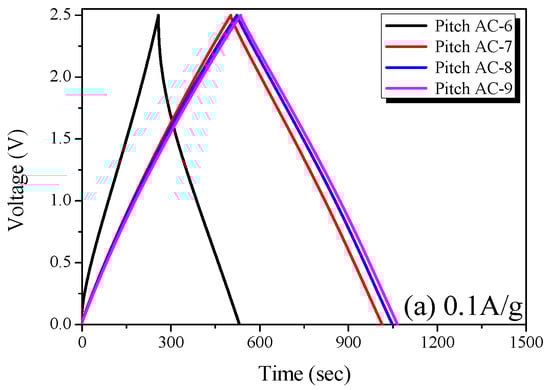
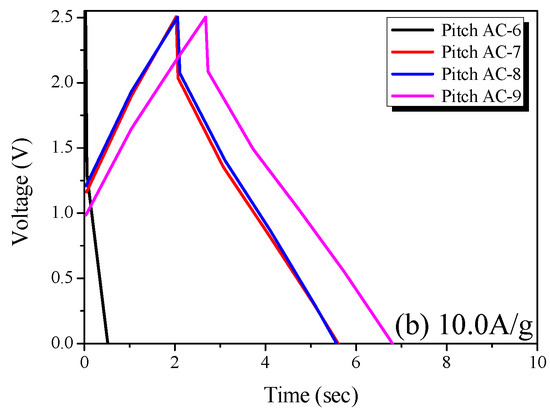
Figure 8.
Charge-discharge curves of the pitch-derived activated carbons at various current densities; (a) 0.1 A/g and (b) 10.0 A/g.
On the other hand, as the activation increased, Pitch AC-7–Pitch AC-9 were confirmed to have a PSD curve with pore diameters larger than the solvated ion. Therefore, pitch AC-7–pitch AC-9 had a reduced ion charge transfer resistance due to the PSD curve of a larger pore diameter than the solvated ions and were considered to have reversible charge and discharge behavior. In Figure 8b, all GCD curves of the Pitch AC are observed to have an irreversible shape with charge and discharge curves. In particular, the IR drop was not observed at 0.1 A/g (except for Pitch AC-6) but at a very large value of 10.0 A/g. In general, the IR drop in the GCD discharge curve represents a voltage charge arising from the internal resistance of the electrode (contact resistance between the electrodes and collectors, electrolyte resistance and distance between electrodes, amongst others) and ion diffusion resistance in the nanopore. Therefore, it was considered that the irreversible GCD curve and the large IR-drop observed in Figure 8b were due to the increased ohmic resistance with increasing current density. However, the size of the IR drop was in the order of Pitch AC-6 > Pitch AC-7 > Pitch AC-8 > Pitch AC-9. Our previous study confirmed that the ion diffusion resistance decreased because of the increased mesopore volume [18]. As shown in Table 2, the mesopore volume of Pitch AC increased from 0.04 cm3/g to 0.36 cm3/g with increasing activation time. In other words, the increase in the mesopore volume positively affected the ion diffusion resistance; therefore, the IR drop decreased as the activation time increased.
Figure 9 shows the specific capacitance of the Pitch AC calculated from the GCD discharge curves at various current densities (0.1–10.0 A/g). The specific capacitance of Pitch AC was observed to be 43.6–84.6 F/g at a current density of 0.1 A/g and 7.5–66.4 F/g at 10.0 A/g. At 0.1 A/g, the specific capacitance of Pitch AC increased with increasing activation time. Especially, Pitch AC-9 was observed to have the largest specific capacitance and lowest specific capacitance decrease rate. In our previous study, the specific capacitance of activated carbon at low current densities was confirmed to be affected more by the micropore volume with pore diameters similar to the size of the solvated ions than by the specific surface area [18]. Also, the ion diffusion resistance of AC at high current densities was confirmed to be affected more by the mesopore volume (pore diameter 3–5 nm) [18]. In Figure 6a, in Pitch AC-9, the micropore and mesopore PSD merged, and the development of mesopores with a diameter of 3 nm or more was observed. In other words, the specific capacitance of the Pitch AC increased with activation time, and the specific capacitance decrease rate of the Pitch AC decreased due to ion diffusion resistance decreasing as the mesopore volume increased.
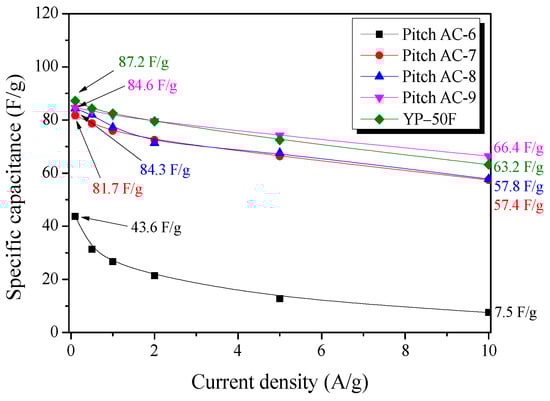
Figure 9.
The specific capacitance of Pitch AC as a function of discharge current density.
The specific capacitance of the YP-50F was observed to be 87.2 F/g at 0.1 A/g and 63.2 F/g at 10.0 A/g. Especially, YP-50F was observed to have a slightly higher specific capacitance than Pitch AC-9 at 0.1 A/g, but at 10.0 A/g, approximately 5% lower than that of Pitch AC-9. In Figure 6a, YP-50F was observed to have mostly PSD with less than 2 nm pore diameter. In other words, YP-50F has microporous pore structure, it was observed that the ion diffusion resistance was higher than that of Pitch AC-9. In conclusion, to achieve high energy and power densities in EDLCs, large micropore and mesopore volumes are required.
CV is a very useful method for analyzing the charge-discharge characteristics of EDLC in conjunction with GCD. Figure 9 shows the CV curves of the Pitch AC measured at various scan rates (5 and 400 mV/s). The CV curve of an ideal EDLC has a rectangular shape, and the area of the curve represents the specific capacitance of the EDLC.
The CV curve of Pitch AC-6 was observed to be leaf-shaped instead of rectangular, regardless of the scan rate; this is consistent with previous GCD results. These results can be attributed to the difficulty of ion transfer in the pores of Pitch AC-6. As shown in Figure 10a, all CV curves of Pitch AC-7–Pitch AC-9 were rectangular. In particular, the area of the CV curve increased with increasing activation time. As shown in Table 2, this is because the specific surface area of the pitch AC increases as the activation time increases; as a result, more electrolyte ions can be stored. However, as shown in Figure 10b, the CV curves of pitch AC-7–pitch AC-9 showed a change from rectangular to leaf shapes as the scan rate increased. The CV curve changed because the ion diffusion resistance increased as the scan rate increased. However, the CV curve of Pitch AC-9 exhibited less deformation than those of the other pitch ACs, and a larger area was observed. As mentioned earlier, Pitch AC-9 had the lowest ion-diffusion resistance, owing to its highest mesopore volume (0.36 cm3/g). Therefore, Pitch AC-9 was considered to have excellent electrochemical performance (e.g., rectangular-shaped CV curve, larger CV curve area) despite a high scan rate of 400 mV/s.
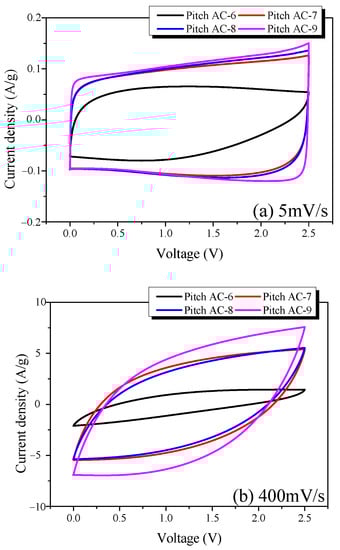
Figure 10.
Cycle voltammograms of the pitch-derived activated carbons at various scan rates; (a) 5 mV/s and (b) 400 mV/s.
Electrochemical impedance spectroscopy (EIS) is commonly used for analyzing the impedance of EDLCs. Figure 11 presents the Nyquist plots for the Pitch AC obtained in the frequency range of 10 MHz to 300 kHz using EIS. Nyquist plots are generally separated into three types of resistances (bulk solution electrolyte resistance, charge transfer resistance, and Warburg impedance) [42]. First, the bulk solution electrolyte resistance (RS) can be easily verified from the x-intercept at high frequencies. In additions, Rs may vary according to the electrolyte properties used in the EDLC [42]. In this study, the Rs values of the samples were the same because all samples were prepared using 1 M SBPBF4/PC.
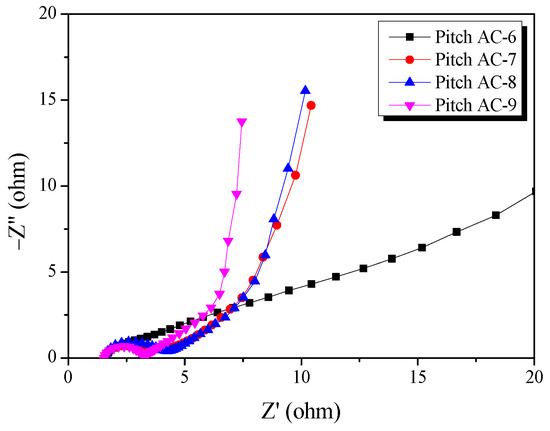
Figure 11.
Nyquist plots of the pitch-derived activated carbons as a function of various activation conditions.
Second, the charge transfer resistance (RCT) was observed as a semicircle on the Nyquist plot in the mid-frequency range. The RCT is the resistance that occurs when an electric double layer (EDL) is formed and includes the interface resistance between the current collector and electrode active material, the interface resistance between the electrode active material and electrolyte ions, the electrical conductivity of the electrode, and the electrolyte ion resistance inside the pores [42]. As shown in Figure 10, the RCT of Pitch AC-6 did not exhibit a semicircular shape; this is consistent with previous GCD results. Therefore, it was considered that Pitch AC-6 had a larger ion charge transfer resistance owing to a pore structure that was unfavorable for EDL formation (PSD of pore diameter smaller than that of solvated ions). In contrast, RCT of Pitch AC-7–Pitch AC-9 were observed to exhibit a semicircle shape, and the diameter of the semicircle decreased with increasing activation time. Furthermore, as shown in Figure 6a, the pore diameter of Pitch AC increased with increasing activation time. It was considered that the increased pore diameter positively affects the ion charge transfer resistance, which results in a decrease in RCT with activation time.
Finally, the Warburg impedance (RW) was observed as a straight line with a 45°slope at low frequency. As shown in Figure 10, RW was observed in the following order: Pitch AC-6 > Pitch AC-7 > Pitch AC-8 > Pitch AC-9. In our previous study, ion diffusion resistance was highly correlated with the mesopore volume ratio of activated carbon [18]. Accordingly, in this study, RW consistently decreased as the mesopore volume ratio of the Pitch AC increased from 9.5% to 36.7%.
Table 4 lists the specific surface areas and capacitances of the Pitch AC and biomass-derived activated carbons for EDLC. As shown in Table 4, Pitch AC-9 prepared by the physical activation method had a specific surface area similar to that of the biomass-derived activated carbon prepared by the chemical activation method. Furthermore, Pitch AC-9 was confirmed to have a relatively high specific capacitance (81.8 F/g at 1.0 A/g), owing to its excellent pore characteristics, even though it was prepared by physical activation. Moreover, pitch AC had the advantages of low cost and high efficiency because it was manufactured via physical activation from a relatively inexpensive asphalt pitch.
Table 4.
Comparison of the specific capacitance of EDLC using different biomass-derived activated carbon electrodes with organic electrolyte.
4. Conclusions
In this study, asphalt pitch-derived activated carbon (Pitch AC) was prepared via steam activation to replace coconut-derived activated carbon. The activation time was varied during the activation step to control the pore size. The specific surface area and mesopore volume of Pitch AC increased to 990–2040 m2/g and 0.04–0.84 cm3/g, respectively, with increased activation time. In particular, the pore characteristics of the Pitch AC developed from a microporous structure to a micro-mesoporous structure, according to the activation time. This study showed that asphalt pitch is a suitable precursor for producing activated carbon because it satisfies the ratio of specific surface area to mesopore volume.
The electrochemical performance of Pitch AC was confirmed to be influenced by its crystal structure and pore properties of Pitch AC, which changed with activation time. The micropore and mesopore volumes of the Pitch AC developed with activation time positively affected the specific capacitance and ion diffusion resistance, respectively. The micropore and mesopore volumes of the Pitch AC-9 were 0.62 cm3/g and 0.36 cm3/g, respectively. The specific surface area and micropore volume of Pitch AC-9 were similar to those of commercial activated carbon (YP-50F); however, the mesopore volume was two times higher than that of YP-50F. Accordingly, the specific capacitance of Pitch AC-9 was similar to that of YP-50F. In addition, the high mesopore volume of Pitch AC-9 lowered the ion diffusion resistance, exhibiting the highest output characteristics compared with the other Pitch AC. As a result, Pitch AC has low cost and high efficiency compared to other biomass-derived activated carbons prepared by chemical activation. Therefore, Pitch AC is expected to replace commercial activated carbon in EDLC, owing to its excellent pore and electrochemical properties.
Author Contributions
Conceptualization, H.-M.L. and B.-J.K.; methodology, Y.-J.K., S.-C.K. and H.-M.L.; software, J.-H.K. and Y.-J.K.; validation, S.-C.K. and Y.-J.K.; formal analysis, J.-H.K., Y.-J.K. and H.-M.L.; investigation, Y.-J.K. and H.-M.L.; resources, S.-C.K. and H.-M.L.; data curation, J.-H.K. and H.-M.L.; writing—original draft preparation, J.-H.K. and H.-M.L.; writing—review and editing, H.-M.L. and B.-J.K.; visualization, J.-H.K., Y.-J.K. and H.-M.L.; supervision, H.-M.L. and B.-J.K.; project administration, H.-M.L.; funding acquisition, H.-M.L. All authors have read and agreed to the published version of the manuscript.
Funding
This work was supported by the Technology Innovation Program (20016795, Development of manufacturing technology independence of advanced activated carbons and application for high performance supercapacitors) and the Technology Innovation Program (20016789, Development of manufacturing and application technology of carbon molecular sieve for high-purity gas separation module) funded by the Ministry of Trade, Industry and Energy (MOTIE, Korea) and the Nano-Material Technology Development Program through the National Research Foundation of Korea (NRF) funded by the Ministry of Science and ICT (NRF-2019M3A7B9071501).
Data Availability Statement
The data presented in this study are available on request from the corresponding author.
Conflicts of Interest
The authors declare no conflict of interest.
References
- Li, T.; Ma, R.; Lin, J.; Hu, Y.; Zhang, P.; Sun, S.; Fang, L. The synthesis and performance analysis of various biomass-based carbon materials for electric double-layer capacitors: A review. Int. J. Energy Res. 2019, 44, 2426–2454. [Google Scholar] [CrossRef]
- Liu, S.; Wei, L.; Wang, H. Review on reliability of supercapacitors in energy storage applications. Appl. Energy 2020, 278, 115436. [Google Scholar] [CrossRef]
- Khan, K.; Tareen, A.K.; Aslam, M.; Mahmood, A.; Khan, Q.; Zhang, Y.; Ouyang, Z.; Guo, Z.; Zhang, H. Going green with batteries and supercapacitor: Two dimensional materials and their nanocomposites based energy storage applications. Prog. Solid State Chem. 2020, 58, 100254. [Google Scholar] [CrossRef]
- Schütter, C.; Pohlmann, S.; Balducci, A. Industrial Requirements of Materials for Electrical Double Layer Capacitors: Impact on Current and Future Applications. Adv. Energy Mater. 2019, 9, 1900334. [Google Scholar] [CrossRef]
- Hartmann, F.; Baumgartner, M.; Kaltenbrunner, M. Becoming Sustainable, The New Frontier in Soft Robotics. Adv. Mater. 2020, 33, 2004413. [Google Scholar] [CrossRef] [PubMed]
- Liang, Z.; He, J.; Hu, C.; Pu, X.; Khani, H.; Dai, L.; Fan, D.; Manthiram, A.; Wang, Z.L. Next-Generation Energy Harvesting and Storage Technologies for Robots Across All Scales. Adv. Intell. Syst. 2022, 5, 2200045. [Google Scholar] [CrossRef]
- Lim, J.M.; Jang, Y.S.; Nguyen, H.V.T.; Kim, J.S.; Yoon, Y.; Park, B.J.; Seo, D.H.; Lee, K.K.; Han, Z.; Ostrikov, K.; et al. Advance in high-voltage supercapacitors for energy storage systems: Materials and electrolyte tailoring to implementation. Nanoscale Adv. 2023, 5, 615–626. [Google Scholar] [CrossRef]
- Kebede, A.A.; Kalogiannis, T.; Mierlo, J.V.; Berrecibar, M. A comprehensive review of stationary energy storage devices for large scale renewable energy sources grid integration. Renew. Sust. Energy Rev. 2022, 159, 112213. [Google Scholar] [CrossRef]
- Ahsan, M.B.F.; Mekhilef, S.; Soon, T.K.; Mubin, M.B.; Shrivastava, P.; Seyedmahmoudian, M. Lithium-ion battery and supercapacitor-based hybrid energy storage system for electric vehicle applications: A review. Int. J. Energy Res. 2022, 46, 19826–19854. [Google Scholar] [CrossRef]
- Rajagopal, S.; Vallikkattil, R.P.; Ibrahim, M.M.; Velev, D.G. Electrode Materials for Supercapacitors in Hybrid Electric Vehicles: Challenges and Current Progress. Condens. Matter 2022, 7, 6. [Google Scholar] [CrossRef]
- Luo, L.; Lan, Y.; Zhang, Q.; Deng, J.; Luo, L.; Zeng, Q.; Gao, H.; Zhao, W. A review on biomass-derived activated carbon as electrode materials for energy storage supercapacitors. J. Energy Storage 2022, 55, 105839. [Google Scholar] [CrossRef]
- Faisal, M.S.S.; Abedin, F.; Asmatulu, R. Activated carbons of pistachio and acorn shells for supercapacitor electrodes with TEABF4/PC solutions as electrolytes. Carbon Lett. 2020, 30, 509–520. [Google Scholar] [CrossRef]
- Reza, M.S.; Yun, C.S.; Afroze, S.; Radenahmad, N.; Bakar, M.S.A.; Saidur, R.; Taweekun, J.; Azad, A.K. Preparation of activated carbon from biomass and its’ applications in water and gas purification, a review. Arab. J. Basic Appl. Sci. 2020, 27, 208–238. [Google Scholar] [CrossRef]
- Packialakshmi, S.; Anuradha, B.; Nagamani, K.; Devi, J.S.; Sujatha, S. Treatment of industrial wastewater using coconut shell based activated carbon. Mater. Today Proc. 2021, 81, 1167–1171. [Google Scholar] [CrossRef]
- Gao, F.; Tang, X.; Yi, H.; Zhang, B.; Zhao, S.; Wang, J.; Gu, T.; Wang, Y. NiO-Modified Coconut Shell Based Activated Carbon Pretreated with KOH for the High-Efficiency Adsorption of NO at Ambient Temperature. Ind. Eng. Chem. Res. 2018, 57, 16593–16603. [Google Scholar] [CrossRef]
- Deng, Z.; Deng, Q.; Wang, L.; Xiang, P.; Lin, J.; Murugadoss, V.; Song, G. Modifying coconut shell activated carbon for improved purification of benzene from volatile organic waste gas. Adv. Compos. Hybrid Mater. 2021, 4, 751–760. [Google Scholar] [CrossRef]
- Arkhipova, E.A.; Novotortsev, R.Y.; Ivanov, A.S.; Maslakov, K.I.; Savilov, S.V. Rice husk-derived activated carbon electrode in redox-active electrolyte-New approach for enhancing supercapacitor performance. J. Energy Storage 2022, 55, 105699. [Google Scholar] [CrossRef]
- Kim, J.H.; Lee, H.M.; Jung, S.C.; Chung, D.C.; Kim, B.J. Bamboo-Based Mesoporous Activated Carbon for High-Power-Density Electric Double-Layer Capacitors. Nanomaterials 2021, 11, 2750. [Google Scholar] [CrossRef]
- Bang, J.H.; Lee, B.H.; Choi, Y.C.; Lee, H.M.; Kim, B.J. A Study on Superior Mesoporous Activated Carbons for Ultra Power Density Supercapacitor from Biomass Precursors. Int. J. Mol. Sci. 2022, 23, 8537. [Google Scholar] [CrossRef]
- Wu, J.; Xia, M.; Zhang, X.; Chen, Y.; Sun, F.; Wang, X.; Yang, H.; Chen, H. Hierarchical porous carbon derived from wood tar using crab as the template: Performance on supercapacitor. J. Power Sources 2020, 455, 227982. [Google Scholar] [CrossRef]
- Zheng, S.; Zhang, J.; Deng, H.; Du, Y.; Shi, X. Chitin derived nitrogen-doped porous carbons with ultrahigh specific surface area and tailored hierarchical porosity for high performance supercapacitors. J. Bioresour. Bioprod. 2021, 6, 142–151. [Google Scholar] [CrossRef]
- Zhang, Q.; Yan, B.; Feng, L.; Zheng, J.; You, B.; Chen, J.; Zhao, X.; Zhang, C.; Jiang, S.; He, S. Progress in the use of organic potassium salts for the synthesis of porous carbon nanomaterials: Microstructure engineering for advanced supercapacitors. Nanoscale 2022, 14, 8216. [Google Scholar] [CrossRef] [PubMed]
- Yan, B.; Zheng, J.; Feng, L.; Zhang, Q.; Zhang, C.; Ding, Y.; Han, J.; Jiang, S.; He, S. Pore engineering: Structure-capacitance correlations for biomass-derived porous carbon materials. Mater. Des. 2023, 229, 111904. [Google Scholar] [CrossRef]
- Wu, R.; Beutler, J.; Baxter, L.L. Biomass char gasification kinetic rates compared to data, including ash effects. Energy 2023, 266, 126392. [Google Scholar] [CrossRef]
- Lee, S.H.; Lee, S.M.; Im, U.S.; Kim, S.D.; Yoon, S.H.; Lee, B.R.; Peck, D.H.; Shul, Y.G.; Jung, D.H. Preparation and characterization of high-spinnability isotropic pitch from 1-methylnaphthalene-extracted low-rank coal by co-carbonization with petroleum reside. Carbon 2019, 155, 186–194. [Google Scholar] [CrossRef]
- Yahya, M.A.; Qadah, Z.A.; Ngah, C.W.Z. Agricultural bio-waste materials as potential sustainable precursors used for activated carbon production: A review. Renew. Sustain. Energy Rev. 2015, 46, 218–235. [Google Scholar] [CrossRef]
- Mamaní, A.; Sardella, M.F.; Giménez, M.; Deiana, C. Highly microporous carbons from olive tree pruning: Optimization of chemical activation conditions. J. Environ. Chem. Eng. 2019, 7, 102830. [Google Scholar] [CrossRef]
- Nowicki, P.; Kazmierczak, J.; Pietrzak, R. Comparison of physicochemical and sorption properties of activated carbons prepared by physical and chemical activation of cherry stones. Powder Technol. 2015, 269, 312–319. [Google Scholar] [CrossRef]
- Guan, T.; Zhao, J.; Zhang, G.; Zhang, D.; Han, B.; Tang, N.; Wang, J.; Li, K. Insight into controllability and predictability of pore structures in pitch-based activated carbons. Microporous Mesoporous Mater. 2018, 271, 118–127. [Google Scholar] [CrossRef]
- Biscoe, J.; Warren, B.E. An X-ray Study of Carbon Black. J. Appl. Phys. 1942, 13, 364–371. [Google Scholar] [CrossRef]
- Shimodaira, N.; Masui, A. Raman spectroscopic investigations of activated carbon materials. J. Appl. Phys. 2002, 92, 902. [Google Scholar] [CrossRef]
- Brauneur, S.; Emmet, P.; Telle, E. Adsorption of Gases in Multimolecular Layer. J. Am. Chem. Soc. 1938, 60, 309–319. [Google Scholar] [CrossRef]
- Dubinin, M.M.; Zaverina, E.D.; Radushkevich, L.V. Sorption and structure of active carbons I. Adsorption of organic vapors. Zhurnal Fiz. Khimii 1947, 21, 1351–1362. [Google Scholar]
- Kierlik, E.; Rosinberg, M.L. Free-energy density functional for the inhomogeneous hard-sphere fluid: Application to interfacial adsorption. Phys. Rev. A 1990, 42, 3382. [Google Scholar] [CrossRef]
- Li, K.; Liu, Q.; Cheng, H.; Hu, M.; Zhang, S. Classification and carbon structural transformation from anthracite to natural coaly graphite by XRD, Raman spectroscopy, and HRTEM. Spectrochim. Acta A Mol. Biomol. Spectrosc. 2021, 249, 119286. [Google Scholar] [CrossRef]
- Baek, J.; Lee, H.M.; Roh, J.S.; Lee, H.S.; Kang, H.S.; Kim, B.J. Studies on preparation and applications of polymeric precursor-based activated hard carbons: I. Activation mechanism and microstructure analyses. Microporous Mesoporous Mater. 2016, 219, 258–264. [Google Scholar] [CrossRef]
- Baek, J.; Shin, H.S.; Chung, D.C.; Kim, B.J. Studies on the correlation between nanostructure and pore development of polymeric precursor-based activated hard carbons: II. Transmission electron microscopy and Raman spectroscopy studies. J. Ind. Eng. Chem. 2017, 54, 324–331. [Google Scholar] [CrossRef]
- Yi, H.; Nakabayashi, K.; Yoon, S.H.; Miyawaki, J. Pressurized physical activation: A simple production method for activated carbon with a highly developed pore structure. Carbon 2021, 183, 735–742. [Google Scholar] [CrossRef]
- Thommes, M.; Kaneko, K.; Neimark, A.V.; Olivier, J.P.; Rodriguez-Reinoso, F.; Rouquerol, J.; Sing, K.S.W. Physisorption of gases, with special reference to the evaluation of surface area and pore size distribution (IUPAC Technical Report). Pure Appl. Chem. 2015, 87, 1051–1069. [Google Scholar] [CrossRef]
- Sarkar, J.K.; Wang, Q. Different Pyrolysis Process Conditions of South Asian Waste Coconut Shell and Characterization of Gas, Bio-Char, and Bio-Oil. Energies 2020, 13, 1970. [Google Scholar] [CrossRef]
- Lin, R.; Taberna, P.L.; Chmiola, J.; Guay, D.; Gogatsi, Y.; Simon, P. Microelectrode Study of Pore Size, Ion Size, and Solvent Effects on the Charge/Discharge Behavior of Microporous Carbons for Electrical Double-Layer Capacitors. J. Electrochem. Soc. 2009, 156, A7–A12. [Google Scholar] [CrossRef]
- Mei, B.A.; Munteshari, O.; Lau, J.; Dunn, B.; Pilon, L. Physical Interpretations of Nyquist Plots for EDLC Electrodes and Devices. J. Phys. Chem. C 2018, 122, 194–206. [Google Scholar] [CrossRef]
- Yang, V.; Senthil, R.A.; Pan, J.; Kumar, T.R.; Sun, Y.; Liu, X. Hierarchical porous carbon derived from jujube fruits as sustainable and ultrahigh capacitance material for advanced supercapacitors. J. Colloid Interface Sci. 2020, 579, 347–356. [Google Scholar] [CrossRef] [PubMed]
- You, X.; Misra, M.; Gregori, S.; Mohanty, A.K. Preparation of an Electric Double Layer Capacitor (EDLC) Using Miscanthus-Derived Biocarbon. ACS Sustain. Chem. Eng. 2018, 6, 318–324. [Google Scholar] [CrossRef]
- Rani, M.U.; Nanaji, K.; Rao, T.N.; Deshpande, A.S. Corn husk derived activated carbon with enhanced electrochemical performance for high-voltage supercapacitors. J. Power Sources 2020, 471, 228387. [Google Scholar] [CrossRef]
- Yu, F.; Ye, Z.; Chen, W.; Wang, Q.; Wang, H.; Zhang, H.; Peng, C. Plane tree bark-derived mesopore-dominant hierarchical carbon for high-voltage supercapacitors. Appl. Surf. Sci. 2020, 507, 145190. [Google Scholar] [CrossRef]


Disclaimer/Publisher’s Note: The statements, opinions and data contained in all publications are solely those of the individual author(s) and contributor(s) and not of MDPI and/or the editor(s). MDPI and/or the editor(s) disclaim responsibility for any injury to people or property resulting from any ideas, methods, instructions or products referred to in the content. |
© 2023 by the authors. Licensee MDPI, Basel, Switzerland. This article is an open access article distributed under the terms and conditions of the Creative Commons Attribution (CC BY) license (https://creativecommons.org/licenses/by/4.0/).