Abstract
The presence of minerals formed under the occurrence of liquid water during the first billion years on Mars was a key discovery, but there is still a large number of open issues that make the study of these mineral deposits a main focus of remote sensing and laboratory studies. Moreover, even though there is extensive research related to the study of the spectral behavior of mixtures, we still lack a full understanding of the problem. The main goal of this work is the analysis of the detection limits of hydrated and carbonate phases within mixtures with basaltic-like fine regolith in the spectral region 1.0–5.5 µm (1818–10,000 cm−1). We selected two different basalt samples and mixed them with two carbonate phases: a dolomite and a calcite. Spectral features have been investigated isolating the main carbonate absorption features and overtones; deriving trends of spectral parameters such as band depth, band area, full-width-half-maximum; percentage and grain size variations. The results obtained in this work show how the presence of a basaltic component can strongly influence the appearance of the hydrated and carbonate features showing different trends and intensities depending on the grain size and percentage of the carbonate components.
1. Introduction
Investigations on the presence of carbonate deposits on Mars are extremely useful for understanding the paleoclimate of the Red Planet. As a result of the interaction between CO2, water and rocks, carbonate phases provide a key role in helping to reveal the past environmental conditions on Mars and its atmospheric evolution. Specifically, carbonate phases preserve the record of the history of liquid water and characteristics such as pH and range of temperatures during their formation. Significant amounts of carbonates are expected to be present in many places on the Martian surface as result of the interaction between rocks, the CO2-rich atmosphere, and liquid water [1]. Indeed, carbonate might have been a significant phase produced on Mars under a potentially thick CO2-rich atmosphere and a warm and wet climate during the Noachian era dated back to ~3.8–4 Gy [2,3,4]. However, questions regarding carbonate detection and whether Mars was warm and wet during the Noachian era are still a bit controversial.
There is an ongoing debate on how past Martian climate conditions can be reconstructed [5]; the most popular method is based on the evaluation of past water discharges in fluvial channels [6,7,8] associated with volumetric and temporal estimation methods of lacustrine environments [9]. However, related mineralogical and chemical investigations are also of key importance [10] and have not only paleoclimatic but also astrobiology implications: especially given that, in the case of carbonate minerals, the precipitation of carbonate in a liquid water environment is a key biosignature preservation mechanism [11]. The investigation and detection of ancient carbonate deposits on the Red Planet surface is therefore a major target for present and future lander investigation as well as analysis of Mars return samples, and it provides support for paleo-environmental reconstruction from the next surface missions with subsurface access [12,13] which in turn influences habitability factors [14].
Carbonate has been detected on several regions on Mars thanks to spaceborne observations; the orbital CRISM instrument (Compact Reconnaissance Imaging Spectrometer for Mars onboard the Mars Reconnaissance Orbiter [15]) allowed initial mapping of carbonate and other secondary mineral deposits in ancient Mars terrains [16,17]. Landed instruments also allowed the detection of carbonate deposits: such deposits have been identified for example by the Spirit Rover (NASA) in the Columbia Hills in Gusev Crater [18] and by the Phoenix lander in the Martian polar soil. Moreover, carbonate has also been detected in Martian meteorites [19]. However, Martian carbonate has only been detected in two (nakhlite and ALH 84001) [1,20,21,22] of the more than 180 Martian meteorites [1], and massive carbonate deposits have not yet been identified on the Mars surface [23]. More importantly, so far there has been only one clear orbital detection of carbonate deposits on Mars in proximity to fluvio-lacustrine features and it is the one in Jezero Crater [23].
A more significant amount of carbonate is expected to be present on the Martian surface as a result of a warm and wet ancient Mars scenario [3,24,25,26]. However, paleoclimatic models [27,28,29,30,31,32,33] fail to give a univocal explanation about how and how long a warm and wet climate could have been sustained on early Mars. Other than a warm and wet Noachian scenario, a cold and icy one has also been proposed, characterized instead by seasonal temperature variations able to produce sufficient warm temperatures for ice melting and surface runoff to account for the observed geological (fluvial and lacustrine) and mineralogical (water alteration mineral deposits) features [34]. From this perspective, addressing the carbonate detection question is a key to understanding which scenario might better explain the past climatic conditions on Mars and its evolution through time.
If on one hand, the missing massive carbonate detections on Mars could led to consider a different past scenario, on the other hand, it could be related to the fact that the minimum percentage of carbonate needed for detection by remote sensing instruments may be much higher than what has been expected up to now [35]. Carbonate signatures might be masked by the presence of other mineral phases; recently carbonates have been found in mixtures with clays in weathering profiles in Oxia Planum [36].
Laboratory studies of the spectral behavior of mixtures of carbonates and their detectability in the spectral range of the remote sensing spectrometers in orbit around Mars, as well as numerical simulations on their detectability, would be very useful to help better understand their controversial detection. Numerical simulations [37,38,39], have shown that detecting small grains of calcium carbonate is very difficult in mixtures of limestone and palagonite with a carbonate mass percentage below 20% [39].
In this work we explore how the detection of carbonate minerals can be influenced and limited by coexisting and mixing with basalt rocks that might alter the appearance and detection of the carbonate spectral features. We therefore explore the spectral behavior using laboratory mixtures of carbonates with basalt-like fine regolith to better investigate the extent to which the appearance of the carbonate spectral features can be modified or masked by the spectral features of basalt regolith. We characterize the sensitivity of mixture spectra to the fraction, type, and grain size of the endmembers. For this study we selected two different types of basalts (a pyroxene-dominated and an olivine-bearing basalt) and mixed them with two carbonates (a calcite and a dolomite). The methodology applied in the creation of mixtures and in the laboratory measurements, along with the data analysis procedure, are described in Section 2. All the spectral measurements were performed at the Planetary Spectroscopy Laboratory (PSL) of the German Aerospace Center (DLR, Berlin, Germany) as described in Section 2. Carbonate spectral features were isolated, and their variations were analyzed in relation to grain size, percentage, and basalt endmember. The results obtained are shown and discussed in Section 3 and Section 4. A summary and the implications of these results in terms of carbonate detections on Mars are described in Section 5.
2. Laboratory Methodology and Data Analysis Procedure
To investigate the detection limits of hydrate and carbonate phases in Mars remote sensing spectral data, we studied the laboratory spectral behavior of mixtures with a basaltic fine regolith as a Mars surface analog. On a larger scale, this work is a part of a laboratory effort that seeks to provide new experimental spectral data derived from a systematic study of the spectral behavior of particulate mixtures that will be useful not only for the investigation of the Martian surface composition but also for the study of other planetary body surfaces.
The methodology applied in this work is based on: (1) sample preparation and creation of laboratory mixtures; (2) acquisition of bidirectional laboratory reflectance measurements of sample endmembers and mixtures; (3) laboratory spectral data analysis in the NIR-MIR (from 1 up to 5.5 µm) through the evaluation and study of spectral parameter trends in mixtures with percentage and grain size variations. The investigated spectral range is interesting for future comparison with CRISM/OMEGA spectral data.
2.1. Sample Preparation and Creation of Laboratory Mixtures
In this study, we selected two natural basalt samples with grain size <50 µm: a pyroxene-dominated basalt (ID: A2; hereafter named as “Px-basalt”) and an olivine-bearing basalt (ID: PY7MM; hereafter referred as “Ol-basalt”).
The A2 Px-basalt is a sample from Iceland, and it is a tholeiitic basalt with a total iron content of 14.82 wt.% and with clinopyroxene as the predominant mafic phase [40,41].
The Py7MM Ol-basalt is a Pampas Onduladas sample from Payún Matrú, Argentina [40,41,42]. Py7MM is an alkali–olivine basalt with a total iron content of 11.3 wt.%. The two sample compositions differ in the presence of plagioclase, which is prevalent in the A2 Px-basalt samples while totally absent in Py7MM Ol-basalt.
The two selected basalts were mixed with two natural carbonate materials, a dolomite and a calcite, at different grain sizes: a dolomite (CIS11C), with some hydration, at four different grain sizes (100–125 µm; 200–224 µm; 300–400 µm; and 600–710 µm); and a calcite at two different grain sizes (100–125 µm and 200–224 µm).
The dolomite sample isfrom the Vado di Corno fault zone (Campo Imperatore, L’Aquila, Italy), and it is composed of 98 wt.% dolomite and 2 wt.% calcite [43,44,45]. The calcite sample is from Santa eulalia, Chihuahua, Mexico [46].
For basalt samples, the different grain size was produced starting from the original rocks and crushing and sieving all the material to lower than 50 microns adopting the following procedure: at the first stage, we systematically powdered the rocks at 200 microns; then the resulting material was repetitively crushed (for a few seconds) and sieved. To sieve the material, intermediated sieves (150–125–100 µm) plus the <50 µm sieve were used to avoid a massive production of very fine material (<10 µm).
For the carbonate samples, since they are almost monomineralic, we first crushed them at 1.00 mm for the CIS11C (dolomite) and at 500 microns for the calcite; then we used the same approach, crushing and sieving at intermediate levels, to produce several grain sizes. Then, considering the amount of material and the spectral properties of the samples obtained, we chose the above-mentioned grain sizes for creating our mixtures. For each basalt endmember, four grain sizes of dolomite and two grain sizes of calcite were intimately mixed in the following increasing weight ratios (carbonate endmember percentage): 20%, 40%, 60%, and 80% for a total of 48 mixtures.
Mineral and bulk chemistry of the endmember samples analyzed in this work were obtained through electron microbe analysis with a CAMECA SX50 (EMP) at the microprobe laboratory of C.N.R.-IGG in Padua and by the XRF laboratory at the Geoscience Department of the University of Padova (see [40,43,44,45]) apart from the calcite sample. The bulk chemistry was done on a representative portion of the samples.
2.2. Laboratory Spectral Measurements
Bidirectional reflectance measurements were acquired at PSL in a vacuum (0.7 mbar) environment by using a Bruker Vertex80V FTIR spectrometer and a Bruker A513 variable-angle accessory that allows bi-conical reflectance measurements for varying viewing geometries with different phase angles. For this work we chose the following angle configuration: i (incidence) = 0°, e (emission) = 30°. A standard gold-coated reference (measured under the same illumination conditions) was used for the calibration of each acquired measurement. Each spectrum was acquired with a spectral resolution of 4 cm−1. A total of 500 interferograms were collected for each sample during the experiment and then averaged by the instrument itself to increase the signal-to-noise ratio of the data [47,48].
To decouple the effect of carbonate percentage and grain size on reflectance spectra in the investigated range, we first measured the reflectance of each basalt endmember and of each carbonate endmember at different grain sizes. Then, each mixture sample was measured in reflectance following the same protocol used for the measurements on the endmembers.
2.3. Spectral Data Analysis Procedure
Data analysis consisted of the investigation of the spectral features of the carbonate phases by means of band isolation and spectral parameter evaluation.
All spectral features were analyzed through the evaluation of the spectral parameters: band center (BC), band area (BA), band depth (BD), full-width-half-maximum (FWHM), and the ratio BA/BD. Spectral indexes were derived from isolated absorption bands in reflectance spectra after removing the spectral continuum. Continuum removal was computed following the procedure adopted by [49], drawing a straight line between the edges for each band (i.e., the maxima on both sides of the band), and then was removed by dividing the spectrum by this line. In the presence of multiple minima in a wider absorption feature, we evaluated the spectral continuum considering the shoulders of the main band. Following the procedure described in [50], the band depth was defined by the relation BD = (RC − RB)/RC, where RC and RB are the reflectance factors of the band at the spectral continuum level and at the position of the band minimum, respectively. The FWHM was obtained by intersecting the isolated band with a horizontal line passing through the middle point of its depth. BA was defined as the total area given by the sum of the rectangle area in the isolated absorption band (a width value corresponding to the spectral sampling was adopted, as in [51]). For bands with multiple minima spectral parameters, BA and FWHM were also computed in relation to the entire band. For each spectral parameter, we derived trends with percent and grain size and retrieved correlation parameters.
3. Reflectance Spectroscopy of Sample Endmembers and Mixtures
Reflectance spectra of the basaltic and carbonate endmembers are shown in Figure 1. The A2 Px-basalt shows a broad feature around 2.3 μm (4348 cm−1), while the Py7MM Ol-basalt has a hydration feature around 3 μm (4348 cm−1). Basaltic endmember reflectance behavior and spectral features were also analyzed in detail in the VNIR spectral range in [40,41,42].
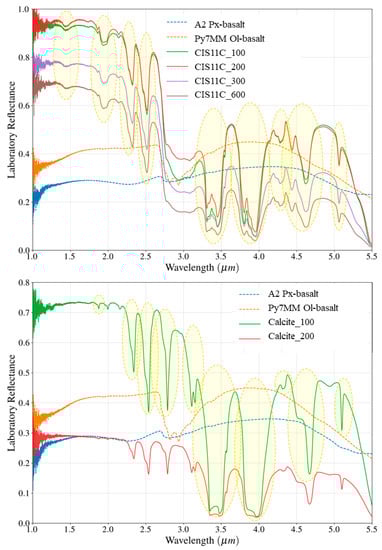
Figure 1.
Upper panel: spectra of CIS11C (dolomite) endmember in different grain sizes and basalt endmembers. Bottom panel: spectra of calcite endmember in different grain sizes and basalt endmembers. Yellow circles indicate the carbonate spectral features investigated in this work.
The spectra of the carbonate endmember samples arecharacterized by the presence of combinations and overtones of the main absorption features located in the region between 7 and 14 μm due to symmetric and asymmetric stretching and deformation of the molecule: v1—9.0 μm (1111 cm−1); v2—11.4 μm (877 cm−1); v3—6.9 μm (1449 cm−1); and v4—13.9 μm (719 cm−1). Overtones and combinations of these vibrations generate the presence of spectral absorption features around 2.35 (3 v3) and 2.55 μm (v3 − v1 + 2v3) (4255 and 3921 cm−1, respectively,) [52,53]. Three strong absorptions arealso present around 3.4 μm (2941 cm−1), 3.9 µm (2564 cm−1), and 4.6 μm (2174 cm−1). The 3.4 μm (2941 cm−1) feature is assigned to the overtone 2ν3 of the fundamental vibration ν3; the 3.9 µm (2564 cm−1) feature is due to a combination of the ν1+ ν3 of the fundamental vibrations ν1 and ν3 [54,55]; and the 4.6 μm (2173 cm−1) feature resulted from the combination tone (v4 + v3) [55]. These features all show a double structure with two separate minima influenced by the grain size of the carbonate and are diagnostic of anhydrous carbonates [54,56]. Spectra of dolomite and calcite endmembers also show smaller common spectral features around 4.3 μm (2325 cm−1) and 5.1 μm (1961 cm−1) [57].
In the spectra of hydrated dolomite, a 3 μm (3333 cm−1) broad absorption band isvisible, and this results from absorbed water [58]. H2O/OH− are also responsible for the spectral bands visible around 1.4 μm (7143 cm−1) and 1.9 μm (5263 cm−1) [52,53] in the spectra of dolomite.
The spectra of calcite show two spectral features around 2.75 (3636 cm−1) and 3.1 μm (3226 cm−1) due to OH stretching vibration. A faint and narrow spectral feature present near 1.75 μm (5714 cm−1) could result from absorption (Gaffey, 1986). In addition, two other small and narrow features are also present in the spectra of calcite around 2.0 μm (5000 cm−1) that are interpreted as overtones of the degenerate v3 combined with the non-degenerate v1 or its overtone [59]. These three features were not analyzed in this work because they were too narrow and not detectable in the mixtures’ spectra.
In sum, for the mixtures of the two basalts with the dolomite endmember, the following spectral features were investigated (see Figure 1, upper panel): 1.4 µm (7143 cm−1); 1.9 µm (5263 cm−1); 2.3 µm (4348 cm−1); 2.5 µm (4000 cm−1); 3.4 µm (2941 cm−1); 3.9 µm (2564 cm−1); 4.3 µm (2326 cm−1); 4.6 µm (2174 cm−1); and 5.1 µm (1961 cm−1). On the other hand, for the mixtures with the two basalts with calcite, we investigated the following spectral features (see Figure 1, bottom panel): 2.3 µm (4348 cm−1); 2.5 µm (4000 cm−1); 2.75 µm (3636 cm−1); 3.1 µm (3226 cm−1); 3.4 µm (2941 cm−1); 3.9 µm (2564 cm−1); 4.3 µm (2326 cm−1); 4.6 µm (2174 cm−1); and 5.1 µm (1961 cm−1).
The spectra obtained for the mixtures of A2 Px-basalt and PY7MM Ol-basalt + hydrated dolomite, at different percents and grain sizes, are shown in Figure 2 and Figure 3, respectively.
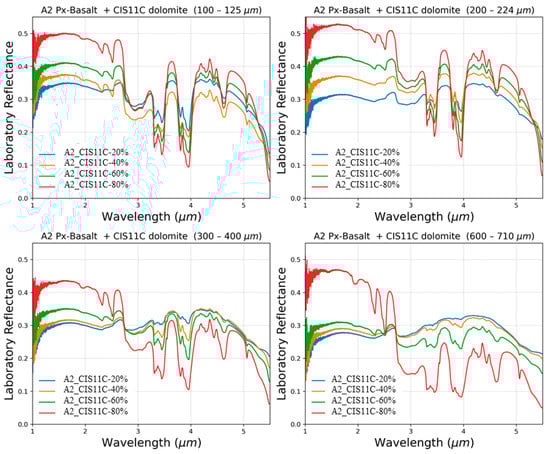
Figure 2.
Mixture spectra of A2 (Px-basalt) + CIS11C (dolomite) with various percentages of carbonate.
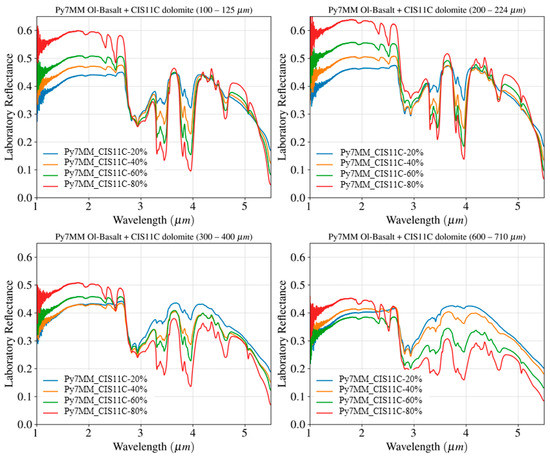
Figure 3.
Mixture spectra of PY7MM (Ol-basalt) + CIS11C (dolomite) with various percentages of carbonate.
The spectra obtained for the mixtures A2 (Px-basalt) and PY7MM (Ol-basalt) + calcite, at different percents and grain sizes, are shown in Figure 4 in the upper and bottom panels, respectively.
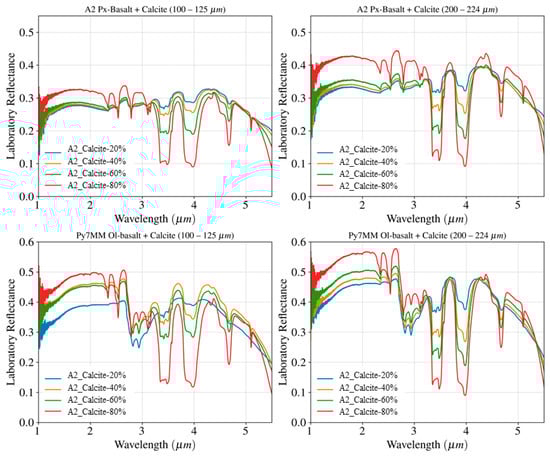
Figure 4.
Mixture spectra of A2 (Px-basalt) + calcite and PY7MM (Ol-basalt) + calcite with various percentages of carbonate.
4. Analysis of Carbonate Spectral Features
The spectral behavior of each isolated band was investigated in relation to carbonate percent and grain size variations to assess the sensitivity of carbonate detection in mixture with basalts to percentage and grain size changes.
We observed that some bands are visible in almost all the mixtures, and their spectral parameters show a linear trend that decreases with increases in the basalt component percentage. This is observed, for example, for the bands 3.4 µm (2941 cm−1), 3.9 µm (2564 cm−1), and 4.3 µm (2326 cm−1) for the mixtures of A2 (Px-basalt)/PY7MM (Ol-basalt) and dolomite (100–125 µm) and A2 (Px-basalt) (200–224 µm) and in all the mixtures with the calcite endmembers. For all the mentioned mixtures, even though the appearance of these spectral features is reduced, they can still be detected even when the percentage of carbonate is 20%. However, the correct retrieval of the spectral parameters is complicated by the faintness of these features in laboratory spectra (due to the low intensity and spectral contrast of the absorption features), and it can be even more complicated to detect them in orbital data.
In the mixtures of the two basalt endmembers with the coarse samples of hydrated dolomite, we observe that the two bands 3.4 µm (2941 cm−1) and 3.9 µm (2564 cm−1) are still visible when the carbonate is 20%, while the 4.6 µm (2174 cm−1) band reaches its detection limit in the mixtures with only 20% carbonate.
The trend of the spectral parameters BD, FWHM, BA, and BA/BD for the 3.4 um (2941 cm−1) band is shown in Figure 5. Linear relations between BD, FWHM, BA, and BA/BD vs. percentage and vs. grain were derived, and the correlation factor R for each sample is reported in the legend in Figure 5, in the following Figure 6 and Figure 7, and in the Supplementary Material. We observed a linear correlation of the retrieved spectral parameters with percentage and grain size of the carbonate component, with R (correlation factors) ranging from 0.8 (minimum) to 0.99 (maximum).
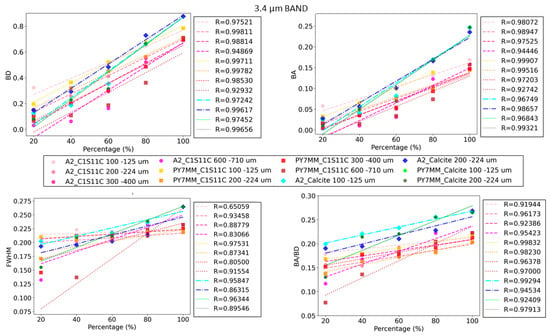
Figure 5.
Trend of the spectral parameters BD, BA, FWHM, and BA/BD with various carbonate endmember percentages for the band around 3.4 µm (2941 cm−1) for all the analyzed mixture and carbonate endmember spectra.
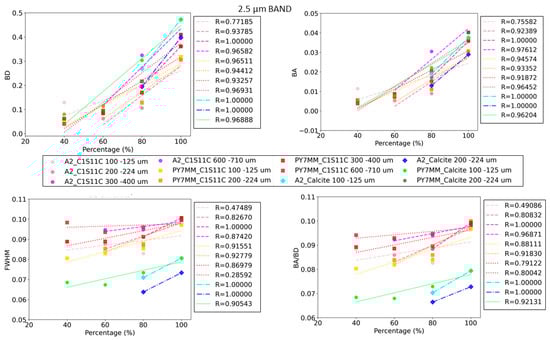
Figure 6.
Trends of the spectral parameters BD, BA, FWHM, and BA/BD with various carbonate endmember percentages for the band around 2.5 µm (4000 cm−1) for all the analyzed mixture and carbonate endmember spectra.
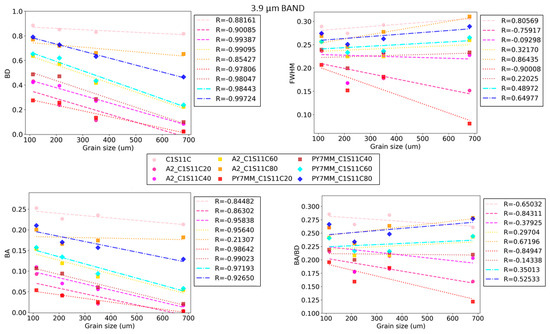
Figure 7.
Trends of the spectral parameters BD, BA, FWHM, and BA/BD with increasing carbonate endmembers grain sizes for the band around 3.9 µm (2564 cm−1) for all the analyzed mixture and carbonate endmember spectra.
For some of the carbonate spectral features, the detection is even more complicated because the bands reach the detection limits for most of the analyzed mixture spectra. This was observed in particular for the bands below 2.6 µm (3846 cm−1), as, for example, for the two bands centered around 2.3 µm (4348 cm−1) and 2.5 µm (4000 cm−1). The trends of the spectral parameters with various carbonate endmember percentages are shown in Figure 6 for the band centered at ~2.5 µm (4000 cm−1).
The 2.5 µm (4000 cm−1) band is not detectable for any mixture with only a 20% carbonate component. In the mixtures of A2 (Px-basalt) with calcite 100–125 µm and with calcite 200–224 µm, the band was big enough to evaluate the spectral parameters only for the mixtures with an 80% carbonate component present.
The trend is linear with the percentage of the carbonate component present and with grain size. The spectral parameters decrease linearly with the increase in the grain size, as expected. An example can be seen in Figure 7, which shows the trend of the spectral parameters for the band centered around 3.9 µm (2564 cm−1) for the mixtures A2 (Px-basalt) and PY7MM (Ol-basalt) with hydrated dolomite.
A detailed description of the spectral behavior of all the investigated bands is reported in the following subsections, and trends of spectral parameters with percentage for all the mixtures are shown in the Supplementary Material of this manuscript.
4.1. Mixtures A2 Px-Basalt and PY7MM Ol-Basalt with Hydrated Dolomite
For the mixtures A2 (Px-basalt) + CIS11C (dolomite) we observed that:
- -
- For all the studied bands, BD and BA show an increasing trend as the percent of carbonate present increases;
- -
- There are no major shifts in the BC position;
- -
- By fixing the carbonate percentage and analyzing the trend of BD and BA as a function of grain size, BD and BA seem to systematically decrease as the grain size increases for all bands visible in the mixtures;
- -
- The 1.4 µm (7143 cm−1) band is not visible in any mix;
- -
- The 1.9 µm (5263 cm−1), 2.3 µm (4348 cm−1), and 2.5 µm (4000 cm−1) bands are not visible in the mixtures at 20% with dolomite 600–710 µm and 300–400 µm; the 2.3 µm (4348 cm−1) and 2.5 µm (4000 cm−1) are not easily visible in the mix at 40% because they overlap with the basalt band. Therefore, the calculation of the spectral parameters did not give consistent values;
- -
- Bands 3.4 µm (2941 cm−1), 3.9 µm (2564 cm−1), 4.3 µm (2326 cm−1), and 4.6 µm (2174 cm−1) are not visible in 20% mixes with 600–710 µm dolomite;
- -
- The bands at 3.4 µm (2941 cm−1) and 3.9 µm (2564 cm−1) are faint in the 40% mixtures, and with 600–710 µm dolomite, it was not possible to evaluate the spectral parameters;
- -
- The bands 2.3 µm (4348 cm−1) and 2.5 µm (4000 cm−1) in the mixture at 20% and 40% with dolomite 200–224 µm are barely visible but overlap with the 2.3 µm (4348 cm−1) of A2 Px-basalt; therefore, the calculation of the spectral parameters did not give consistent values (the same in the A2 mixtures with CS11C 100–125 µm at 40%).
For the mixtures of PY7MM (Ol-basalt) + CIS11C (dolomite) we observed:
- -
- BD and BA show an increasing trend as the percent of carbonate present increases;
- -
- There are no major shifts in the BC position;
- -
- By fixing the carbonate percentage and analyzing the trend of BD and BA as a function of the grain size, BD and BA seem to systematically decrease as the grain size increases for all bands visible in the mixtures;
- -
- The 1.4 µm (7143 cm−1) band is not visible in any mix;
- -
- Bands 4.3 µm (2326 cm−1) and 4.6 µm (2174 cm−1) are not visible in the 20% mix with 600–710 µm dolomite.
4.2. Mixtures A2 Px-Basalt and PY7MM Ol-Basalt with Calcite
For the mixtures of basalts and calcite, it was also possible to isolate and study the trend of the bands around 2.8 µm (3571 cm−1) and 3.1 µm (3226 cm−1). These bands are clearly visible in the spectrum of calcite, unlike the spectrum of dolomite where the high degree of hydration caused the presence in the spectra of a wide band at 3.0 µm (3333 cm−1) that does not allow diagnostics of the 2.8 µm (3571 cm−1) and 3.1 µm (3226 cm−1) bands. It is important to observe the strong spectral contrast between the spectrum of the calcite 100–125 µm compared to that of the sample of calcite 200–224 µm, as opposed to what happens for dolomite in the same grain size (see Figure 1); the spectra of dolomite 100–125 µm and dolomite 200–224 µm are very similar to each other. This behavior can be explained by the fact that the two materials show different trends on reflectance brightness reducing the grain sizes, and so they seem to have a different spectral point of white.
Globally, for the mixtures of A2 (Px-basalt) and PY7MM (Ol-basalt) with calcite, it was observed that:
- -
- BD and BA show an increasing trend as the percent of carbonate present increase;
- -
- There are no major shifts in the BC position;
- -
- The 1.4 µm (7143 cm−1) band is not visible in pure calcite; a small 1.9 µm (5263 cm−1) band is visible in the calcite endmember spectrum, but it is small and immediately becomes undetectable in mixtures spectra;
- -
- The spectral parameters BA, FWHM, and BA/BD for the 2.8 µm (3571 cm−1) band in the mix at 80% of Py7MM and calcite are greater than the values in pure calcite. This happens because the band shape is modified by the presence of the Py7MM basalt band in that range. In fact, in the other mixtures, the band is incorporated into this structure, and it is not possible to distinguish it. However, with 80% of dolomite, the band is visible, but its shape and related spectral parameters are influenced by the basalt.
5. Summary and Implications for Mars Remote Sensing Data Analysis
This study presents the spectroscopic analysis of laboratory spectra of physical intimate mixtures of carbonate minerals with two basalt-like Martian regolith samples in the spectral range 1–5.5 µm in order to better investigate the detection limits of carbonates in mixtures with basalts and provide hints for understanding the puzzle of detection of carbonates on the surface of Mars.
Two different basalt samples with grain size < 50 µm (one pyroxene-dominated and one olivine-bearing basalt) were selected for this study. The basalt samples were mixed with two carbonate samples: a dolomite with some hydration at four different grain sizes and a calcite at two different grain sizes. All the samples were measured in bidirectional reflectance at PSL, and the spectra obtained were analyzed by isolating the main carbonate spectral features and retrieving spectral parameter trends in relation to carbonate percentage and grain size.
The application of spectral parameters to characterize a particular mineral in a laboratory mixture allowed the assessment of a detection limit for that mineral in the mixture.
General trends in the spectral parameters of basalt–carbonate mixtures have important implications for detection of carbonate minerals on the Martian surface. Globally, we observed that absorption features of the carbonate endmembers and of the mixed calcite and dolomite with basaltic endmembers in the investigated laboratory spectra range are influenced by grain size, carbonate mineral content, type of basalt, and level of hydration. Variation in carbonate abundance and grain size causes variations in spectral contrast and alteration of band shapes that affect carbonate identification. This work shows that the main carbonate bands, when mixed with basaltic endmembers, show a linear trend decreasing with decreases in the carbonate components and reach a detection limit when the carbonate is coarse and occurs in small percentages. This is particularly evident for the bands below 2.6 µm (3846 cm−1), while the broad carbonate bands located at about 3.4 µm (2941 cm−1) and 3.9 µm (2564 cm−1) might allow a better detection of these minerals. Moreover, in remote sensing data, the detection is worsened by other factors such as mineral textures on the surface of the planet, atmospheric contribution, and instrument sensitivity. For example, in the case of CRISM data, carbonate is identified by the two absorption features located at 2.3 µm (4348 cm−1) and 2.5 µm (4000 cm−1), while the features at 3.4 µm (2941 cm−1) and 3.9 µm (2564 cm−1) are difficult to observe. The difficulties in detecting the carbonate features at 3.4 µm (2941 cm−1) and 3.9 µm (2564 cm−1) in CRISM data could be due to two main factors: (1) a non-efficient removal of atmospheric contributions with spectral features that make the retrieval of surface components in the VNIR spectral range controversial (atmospheric contributions can cause spectral shape variations beyond 2 µm due to H2O and OH fundamental absorption around 3 µm [60]); (2) the possible presence of more hydrated minerals on the Mars surface with spectral features that dominate the VNIR spectrum masking potential carbonate features. In our study, we observed that in the mixtures with calcite, even in the case of low percentages of carbonate, these bands aremore persistent with respect to what happens for mixtures with the dolomite samples. This is due to the fact that our sample of dolomite is hydrated, and therefore, the spectra show a weakening of the carbonate bands. The weakening of the carbonate spectral features as a result of a higher level of hydration in the mineral was also observed in previous studies through the application of different techniques. Raman and XRD studies on a set of hydrous carbonates showed that the presence of structural water in hydrated carbonates may produce a distortion in the CO3−2 anion and a rearrangement of the mineral structures resulting in a reduction in intensity and a shift in the position of the fundamental CO3 bands, e.g., [61,62,63,64]. Changes in the fundamental CO3 bands in the hydrous carbonates can, in turn, produce a weakening of the overtones and combinations in the VNIR. Spectra of many hydrous carbonates have weak or missing 3.4 µm (2941 cm−1) and 3.9 µm (2564 cm−1) features that are instead prominent and diagnostic in anhydrous carbonates [65,66,67]. In addition, strong water-related absorptions may also mask weaker CO3 absorptions in the VNIR [68,69].
The presence of high hydrated phases has been observed on Mars in the carbonate-bearing terrains of the Jezero crater [23]. The Mottled Terrain in Jezero, in particular, exhibits strong hydration bands and weak carbonate bands relative to the other units.
Further investigations of the detection limits of carbonates in laboratory mixtures are planned to provide more insight into the understanding of the potentially missing carbonate detections on the Martian surface. Detection limits of mixtures of carbonates with other mineral phases are currently being analyzed, and results are planned to be published in follow-up works. Continuous laboratory investigations of the spectral behavior of mixtures of carbonates with other Mars analogues are a key to providing data for a better understanding of the history and fate of liquid water on the Martian surface and its astrobiological implications.
Supplementary Materials
The following are available online at https://www.mdpi.com/article/10.3390/min13060764/s1, S1_Spectral Parameters Trends.docx.
Author Contributions
Conceptualization, G.A., C.C., G.S., A.M. and J.H.; Methodology, G.A., C.C., G.S., A.M. and J.H.; Validation, G.A., C.C., G.S., A.M. and J.H.; Formal analysis, G.A., C.C. and A.M.; Investigation, G.A., C.C., G.S., A.M. and J.H.; Resources, C.C., A.M. and J.H.; Writing—original draft, G.A., C.C. and A.M.; Supervision, J.H. All authors have read and agreed to the published version of the manuscript.
Funding
This research received no external funding.
Data Availability Statement
Not applicable.
Acknowledgments
Authors want to thank Maria Sgavetti for her support in preliminary discussions of this work.
Conflicts of Interest
The authors declare no conflict of interest.
References
- Bridges, J.C.; Hicks, L.J.; Treiman, A.H. Carbonates on Mars. In Volatiles in the Martian Crust; Elsevier: Amsterdam, The Netherlands, 2019; pp. 89–118. [Google Scholar]
- Khan, R. The evolution of CO2 on Mars. Icarus 1985, 62, 175–190. [Google Scholar] [CrossRef]
- Pollack, J.B.; Kasting, J.F.; Richardson, S.M.; Poliakoff, K. The case for a wet, warm climate on early Mars. Icarus 1987, 71, 203–224. [Google Scholar] [CrossRef]
- Ramirez, R.M.; Craddock, R.A. The geological and climatological case for a warmer and wetter early Mars. Nat. Geosci. 2018, 11, 230–237. [Google Scholar] [CrossRef]
- Changela, H.; Chatzitheodoridis, E.; Antunes, A.; Beaty, D.; Bouw, K.; Bridges, J.C.; Capova, K.A.; Cockell, C.S.; Conley, C.A.; Dadachova, E.; et al. Mars: New insights and unresolved questions. Int. J. Astrobiol. 2021, 20, 394–426. [Google Scholar] [CrossRef]
- Steinmann, V.; Kereszturi, Á.; Mari, L. Geomorphological analysis of Tinto-B Vallis on Mars. Hung. Geogr. Bull. 2020, 69, 333–348. [Google Scholar] [CrossRef]
- Boatwright, B.D.; Head, J.W. Constraining early Mars glacial conditions from paleodischarge estimates of intracrater inverted channels. Geophys. Res. Lett. 2022, 49, e2022GL101227. [Google Scholar] [CrossRef]
- Orofino, V.; Alemanno, G.; di Achille, G.; Mancarella, F. Estimate of the water flow duration in large Martian fluvial systems. Planet. Space Sci. 2018, 300, 261–286. [Google Scholar] [CrossRef]
- Kereszturi, A. Review of Wet Environment Types on Mars with Focus on Duration and Volumetric Issues. Astrobiology 2012, 12, 586–600. [Google Scholar] [CrossRef] [PubMed]
- Grindrod, P.M.; West, M.; Warner, N.H.; Gupta, S. Formation of an Hesperian-aged sedimentary basin containing phyllosilicates in Coprates Catena, Mars. Icarus 2012, 218, 178–195. [Google Scholar] [CrossRef]
- Farmer, J.D.; Des Marais, D.J. Exploring for a record of ancient Martian life. J. Geophys. Res. 1999, 104, 26977–26995. [Google Scholar] [CrossRef]
- Kereszturi, A.; Bradak, B.; Chatzitheodoridis, E.; Ujvari, G. Indicators and Methods to Understand Past Environments from ExoMars Rover Drills. Orig Life Evol Biosph 2016, 46, 435–454. [Google Scholar] [CrossRef] [PubMed]
- Ansari, A.H. Detection of organic matter on Mars, results from various Mars missions, challenges, and future strategy: A review. Front. Astron. Space Sci. 2023, 10, 1075052. [Google Scholar] [CrossRef]
- Shawn, D.; Wright, K.E.; Adamala, K.; de La Rubia, L.A.; Bond, J.; Dartnell, L.R.; Goldman, A.D.; Lynch, K.; Naud, M.E.; Paulino-Lima, I.G.; et al. The Astrobiology Primer v2.0. Astrobiology 2016, 16, 561–653. [Google Scholar] [CrossRef]
- Murchie, S.; Arvidson, R.; Bedini, P.; Beisser, K.; Bibring, J.-P.; Bishop, J.; Boldt, J.; Cavender, P.; Choo, T.; Clancy, R.T.; et al. Compact Reconnaissance Imaging Spectrometer for Mars (CRISM) on Mars Reconnaissance Orbiter (MRO). J. Geophys. Res. 2007, 112, E05S03. [Google Scholar] [CrossRef]
- Ehlmann, B.L.; Mustard, J.F.; Murchie, S.L.; Poulet, F.; Bishop, J.L.; Brown, A.J.; Calvin, W.M.; Clark, R.N.; Marais, D.J.D.; Milliken, R.E.; et al. Orbital identification of carbonate bearing rocks on Mars. Science 2008, 322, 1828–1832. [Google Scholar] [CrossRef] [PubMed]
- Wray, J.J.; Murchie, S.L.; Ehlmann, B.L.; Milliken, R.E.; Seelos, K.D.; Noe Dobrea, E.Z.; Mustard, J.F.; Squyres, S.W. Evidence for regional deeply buried carbonate-bearing rocks on Mars. In Proceedings of the 42nd Annual Lunar and Planetary Science Conference, Woodlands, TX, USA, 7–11 March 2011. [Google Scholar]
- Morris, R.V.; Ruff, S.W.; Gellert, R.; Ming, D.W.; Arvidson, R.E.; Clark, B.C.; Golden, D.C.; Siebach, K.; Klingelhöfer, G.; Schröder, C.; et al. Identification of carbonate-rich outcrops on Mars by the Spirit Rover. Science 2010, 329, 421424. [Google Scholar] [CrossRef]
- Boynton, W.V.; Ming, D.W.; Kounaves, S.P.; Young, S.M.M.; Arvidson, R.E.; Hecht, M.H.; Hoffman, J.; Niles, P.B.; Hamara, D.K.; Quinn, R.C.; et al. Evidence for Calcium Carbonate at the Mars Phoenix Landing Site. Science 2009, 325, 61–64. [Google Scholar] [CrossRef]
- Hicks, L.J.; Bridges, J.C.; Gurman, S.J. Ferric saponite and serpentine in the nakhlite Martian meteorites. Geochim. Cosmochim. Acta 2014, 136, 194210. [Google Scholar] [CrossRef]
- Mittlefehldt, D.W. ALH84001, a cumulate orthopyroxenite member of the Martian meteorite clan. Meteorit. Planet. Sci. 1994, 29, 214221. [Google Scholar]
- Harvey, R.P.; McSween, H.Y. A possible high-temperature origin for the carbonates in the Martian meteorite ALH84001. Nature 1996, 382, 4951. [Google Scholar] [CrossRef]
- Horgan, B.H.; Anderson, R.B.; Dromart, G.; Amador, E.S.; Rice, M.S. The mineral diversity of Jezero crater: Evidence for possible lacustrine carbonates on Mars. Icarus 2020, 339, 113526. [Google Scholar] [CrossRef]
- Sagan, C.; Toon, O.B.; Gierasch, P.J. Climate change on mars. Science 1973, 181, 1045–1049. [Google Scholar] [CrossRef] [PubMed]
- Kargel, J.S.; Dougherty, A.; Feldman, W.; Hogenboom, D.; Marion, G.; McCarthy, C.; Prieto-Ballesteros, O. Hydrated Salts: Dehydration, dissolution, and incongruent melting in terrestrial evaporites and at Meridiani Planum, Mars. AGU Fall Meet. Abstracts. 2004, 2004, P21A-0205. [Google Scholar]
- Carr, M.H. The Surface of Mars; Cambridge Planetary Science Series; Cambridge University Press: Cambridge, UK, 2006. [Google Scholar]
- Kasting, J.F. CO2 condensation and the early climate of Mars. Icarus 1991, 94, 1–13. [Google Scholar] [CrossRef]
- Haberle, R.M. Early Mars climate models. J. Geophys. Res. 1998, 103, 28467–28479. [Google Scholar] [CrossRef]
- Wordsworth, R.; Forget, F.; Millour, E.; Head, J.W.; Madeleine, J.B.; Charnay, B. Global modelling of the early martian climate under a denser CO2 atmosphere: Water cycle and ice evolution. Icarus 2013, 222, 1–19. [Google Scholar] [CrossRef]
- Urata, R.A.; Toon, O.B. Simulations of the Martian hydrologic cycle with a general circulation model: Implications for the ancient Martian climate. Icarus 2013, 226, 229–250. [Google Scholar] [CrossRef]
- von Paris, P.; Grenfell, J.L.; Rauer, H.; Stock, J.W. N2-associated surface warming on early Mars. Planet. Space Sci. 2013, 82, 149–154. [Google Scholar] [CrossRef]
- Ramirez, R.M.; Kopparapu, R.; Zugger, M.E.; Robinson, T.D.; Freedman, R.; Kasting, J.F. Warming early mars with CO2 and H2. Nat. Geosci. 2014, 7, 59–63. [Google Scholar] [CrossRef]
- Ramirez, R.M.; Kasting, J.F. Could cirrus clouds have warmed early Mars? Icarus 2017, 281, 248–261. [Google Scholar] [CrossRef]
- Palumbo, A.; Head, J.W.; Wordsworth, R.D. Late Noachian Icy Highlands climate model: Exploring the possibility of transient melting and fluvial/lacustrine activity through peak annual and seasonal temperatures. Icarus 2018, 300, 261–286. [Google Scholar] [CrossRef]
- Fonti, S.; Jurewicz, A.; Blanco, A.; Blecka, M.; Orofino, V. Presence and detection of carbonates on the Martian surface. J. Geophys. Res. Planets 2001, 106, 27815–27822. [Google Scholar] [CrossRef]
- Bultel, B.; Viennet, J.; Poulet, F.; Carter, J.; Werner, S.C. Detection of Carbonates in Martian Weathering Profiles. JGR 2019, 124, 989–1007. [Google Scholar] [CrossRef]
- Blecka, M.I. A study of the influence of the surface emittance and extinction by dust on Martian IR spectra. Adv. Space Res. 1999, 23, 1613–1622. [Google Scholar] [CrossRef]
- Blecka, M.I.; Blanco, A.; Fonti, S.; Muci, A.M.; Orofino, V. Modeling the influence of surface emittance and atmospheric trasmittance on Martian spectra. Adv. Space Res. 1997, 19, 1281–1284. [Google Scholar] [CrossRef]
- Orofino, V.; Blanco, A.; Blecka, M.; de Carlo, F.; Fonti, S.; Jurewicz, A. The spectroscopic search for carbonates on the surface and in the atmosphere of mars: Laboratory measurements and numerical simulations. Adv. Space Res. 1999, 23, 1609–1612. [Google Scholar] [CrossRef]
- Carli, C.; Sgavetti, M. Spectral characteristics of rocks: Effects of composition and texture and implications for the interpretation of planet surface compositions. Icarus 2011, 211, 1034–1048. [Google Scholar] [CrossRef]
- Carli, C.; Serventi, G.; Sgavetti, M. VNIR spectral characteristics of terrestrial igneous effusive rocks: Mineralogical composition and the influence of texture. Geol. Soc. 2015, 401, 139–158. [Google Scholar] [CrossRef]
- Carli, C.; Roush, T.L.; Pedrazzi, G.; Capaccioni, F. Visible and Near-Infrared (VNIR) reflectance spectroscopy of glassy igneous material: Spectral variation, retrieving optical constants and particle sizes by Hapke model. Icarus 2016, 266, 267–278. [Google Scholar] [CrossRef]
- Mari, G. Riflettanza di Rocce di Faglia in Carbonati: Il Caso Della Faglia di Campo Imperatore (Gran Sasso, Italia). 2016. Available online: http://hdl.handle.net/20.500.12608/26566 (accessed on 15 April 2023).
- Demurtas, M.; Fondriest, M.; Balsamo, F.; Clemenzi, L.; Storti, F.; Bistacchi, A.; di Toro, G. Structure of a normal seismogenic fault zone in carbonates: The Vado di Corno Fault, Campo Imperatore, Central Apennines (Italy). J. Struct. Geol. 2016, 90, 185–206. [Google Scholar] [CrossRef]
- Traforti, A. Reactivated Fault Zones: Kinematic Complexity and Fault Rock Spectral Characterization. 2018. Available online: https://hdl.handle.net/11577/3421819 (accessed on 15 April 2023).
- Ward’s® Introductory Mineral Collection. Ward’s Science. Available online: wardsci.com (accessed on 15 April 2023).
- Maturilli, A.; Helbert, J.; Moroz, L. The Berlin emissivity database (BED). Planet. Space Sci. 2008, 56, 420–425. [Google Scholar] [CrossRef]
- Maturilli, A.; Helbert, J.; Ferrari, S.; Davidsson, B.; D’amore, M. Characterization of asteroid analogues by means of emission and reflectance spectroscopy. Earth Planets Space 2016, 68, 113. [Google Scholar] [CrossRef]
- Cloutis, E.A.; Gaffey, M.J.; Jackowski, T.L.; Reed, K.L. Calibrations of phase abundance, composition, and particle size distribution for olivine-orthopyroxene mixtures from reflectance spectra. J. Geophys. Res. 1986, 91, 11641–11653. [Google Scholar] [CrossRef]
- Clark, R.N.; Roush, T.L. Reflectance spectroscopy: Quantitative analysis techniques for remote sensing applications. J. Geophys. Res. 1984, 89, 6329–6340. [Google Scholar] [CrossRef]
- Alemanno, G.; Maturilli, A.; D’Amore, M.; Helbert, J. A new laboratory emissivity and reflectance spectral library for the interpretation of Mars thermal infrared spectral data. Icarus 2021, 368, 114622. [Google Scholar] [CrossRef]
- Gaffey, S.J. Spectral reflectance of carbonate minerals in the visible and near infrared (0.35–2.55 microns): Calcite, aragonite, and dolomite. Am. Miner. 1986, 71, 151–162. [Google Scholar]
- Clark, R.N.; King, T.V.V.; Klejwa, M.; Swayze, G. High spectral resolution reflectance spectroscopy of minerals. J. Geophys. Res. 1990, 95, 12653–12680. [Google Scholar] [CrossRef]
- Buijs, K.; Schutte, C.J.H. The infrared spectra and structures of Li2CO3 and anhydrous Na2CO3. Spectrochim. Acta 1961, 17, 927–932. [Google Scholar] [CrossRef]
- Nuevo, M.; Sandford, S.A.; Flynn, G.J.; Wirick, S. Mid-infrared study of stones from the Sutter’s Mill meteorite. Meteor. Planet. Sci. 2014, 49, 2017–2026. [Google Scholar] [CrossRef]
- Hunt, G.R.; Salisbury, J.W. Visible and near infrared spectra of minerals and rocks. II. Carbonates. Mod. Geol. 1971, 2, 23–30. [Google Scholar]
- Junfeng, J.; Yun Ge Balsam, W.; Damuth, J.E.; Chen, J. Rapid identification of dolomite using a Fourier Transform Infrared Spectrophotometer (FTIR): A fast method for identifying Einrich events in IODP Site U1308. Mar. Geol. 2009, 258, 60–68. [Google Scholar]
- Farmer, V.C. The Infrared Spectra of Minerals; Mineralogical Society: London, UK, 1974. [Google Scholar] [CrossRef]
- Hopkinson, L.; Kristova, P.; Rutt, K. The near-infrared (NIR) spectra of powdered calcite in the 3–121 μm mode particle size range. Vib. Spectrosc. 2017, 90, 69–73. [Google Scholar] [CrossRef]
- Crowley, J.K. Visible and near-infrared (0.4–2.5 lm) reflectance spectra of playa evaporite minerals. J. Geophys. Res. 1991, 96, 16231–16240. [Google Scholar] [CrossRef]
- Harner, P.L.; Gilmore, M.S. Visible–near infrared spectra of hydrous carbonates, with implications for the detection of carbonates in hyperspectral data of Mars. Icarus 2015, 250, 204–214. [Google Scholar] [CrossRef]
- Adler, H.H.; Kerr, P.F. Infrared absorption frequency trends for anhydrous normal carbonates. Am. Mineral. 1963, 48, 839–853. [Google Scholar]
- Frost, R.L.; Dickfos, M. Hydrated double carbonates—A Raman and infrared spectroscopic study. Polyhedron 2007, 26, 4503–4508. [Google Scholar] [CrossRef]
- White, W.B. The carbonate minerals. In The Infrared Spectra of Minerals; Farmer, V.C., Ed.; The Mineralogical Society: London, UK, 1974; pp. 277–284. [Google Scholar]
- Miyamoto, M.; Kato, A. Infrared diffuse reflectance spectra of some hydrous carbonates. Lunar Planet. Sci. 1990, 21, 801. [Google Scholar]
- Cloutis, E.A.; Goltz, D.M.; Coombs, J.; Russell, B.; Guertin, M.; Mueller, T. Hydrated carbonate minerals: Spectral reflectance properties and possibility of detection in martian spectra. Lunar Planet. Sci. 2000, 31, 1152. [Google Scholar]
- Applin, D.; Cloutis, E.; Izawa, M. Reflectance spectroscopy of hydrated carbonate minerals. Lunar Planet. Sci. 2014, 45, 1881. [Google Scholar]
- White, W.B. Infrared characterization of water and hydroxyl ion in the basic magnesium carbonate minerals. Am. Mineral. 1971, 56, 46–53. [Google Scholar]
- Horgan, B.H.N.; Cloutis, E.A.; Mann, P.; Bell, J.F., III. Near-infrared spectra of ferrous mineral mixtures and methods for their identification in planetary surface spectra. Icarus 2014, 234, 132–154. [Google Scholar] [CrossRef]


Disclaimer/Publisher’s Note: The statements, opinions and data contained in all publications are solely those of the individual author(s) and contributor(s) and not of MDPI and/or the editor(s). MDPI and/or the editor(s) disclaim responsibility for any injury to people or property resulting from any ideas, methods, instructions or products referred to in the content. |
© 2023 by the authors. Licensee MDPI, Basel, Switzerland. This article is an open access article distributed under the terms and conditions of the Creative Commons Attribution (CC BY) license (https://creativecommons.org/licenses/by/4.0/).