Article

Effects of Temperature on Visible and Infrared Spectra of Mercury Minerals Analogues

1
Department of Earth, Atmospheric, and Planetary Sciences, Purdue University, West Lafayette, IN 47907, USA
2
LESIA, Observatoire de Paris, CNRS, Sorbonne Université, Université Paris-Diderot, 92195 Meudon, France
3
Institut d’Astrophysique Spatiale, CNRS, Université Paris-Saclay, 91405 Orsay, France
4
Istituto di Astrofisica e Planetologia Spaziali, INAF, 00133 Rome, Italy
5
Osservatorio Astronomico di Roma, INAF, 00078 Monte Porzio Catone, Italy
6
Department of Chemistry, Life Sciences and Environmental Sustainability, Università degli Studi di Parma, 43121 Parma, Italy
7
Department of Environment, Earth and Physical Sciences, University of Siena, 53100 Siena, Italy
8
Department of Physics and Geology, University of Perugia, 06123 Perugia, Italy
9
Synchrotron SOLEIL, 91190 Saint-Aubin, France
*
Author to whom correspondence should be addressed.
Minerals 2023, 13(2), 250; https://doi.org/10.3390/min13020250
Submission received: 29 November 2022 / Revised: 31 January 2023 / Accepted: 4 February 2023 / Published: 10 February 2023

Abstract

:
Mercury’s peculiar orbit around the Sun (3:2 spin–orbit resonance) and lack of atmosphere result in one the widest temperature ranges experienced at the surface of a planetary body in the solar system. Temperature variations affect the physical and, therefore, spectral properties of minerals to varying degrees; thus, it is crucial to study them in the context of the upcoming arrival of the BepiColombo spacecraft in Mercury orbit in the fall of 2025. In this work, we heated and cooled analog materials (plagioclase and volcanic glasses) at temperatures representative of the hermean surface. With our experimental setup, we could measure near-infrared (1.0–3.5 μ m) and thermal infrared (2.0–14.3 μ m) reflectance spectra of our analogs at various temperatures during a heating (25–400 C) or cooling cycle (−125–25 C), allowing us to follow the evolution of the spectral properties of minerals. We also collected reflectance spectra in the visible domain (0.47–14.3 μ m) before and after heating. In the visible spectra, we identified irreversible changes in the spectral slope (reddening) and the reflectance (darkening or brightening) that are possibly associated with oxidation, whereas the temperature had reversible effects (e.g., band shifts of from ten to a hundred nanometers towards greater wavelengths) on the infrared spectral features of our samples. These reversible changes are likely caused by the crystal lattice dilatation during heating. Finally, we took advantage of the water and ice present on/in our samples to study the different components of the absorption band at 3.0 μ m when varying temperatures, which may be useful as a complement to future observations of the north pole of Mercury. The wavelength ranges covered by our measurements are of interest for the SIMBIO-SYS and MERTIS instruments, which will map the mineralogy of Mercury’s surface from spring 2026, and for which we selected useful spectral parameters that are proxies of surface temperature variations.

1. Introduction

The surface of Mercury undergoes a very wide range of temperature variations, with the temperature up to ∼700 K during the day [1], and dropping to ∼100 K during the night, and even ∼70 K in the permanently shadowed regions (PSR) at the poles [2]. Reproducing these conditions in the laboratory can move us a step closer to ground-truth measurements. This provides important information on how minerals exposed to extreme environments evolve over time and how their spectral properties are affected. It also adds to the understanding of spectra provided by current and upcoming space missions (e.g., BepiColombo [3]) regarding planetary bodies that are affected by extreme conditions. Micrometeoroid bombardment and solar wind irradiation are other major processes of space weathering and are also important surface-modifying agents; thus, they have to be considered to draw a global picture [4]. Given the long timescales over which these exogenic processes are effective, planetary surfaces can be exposed to millions of years of alteration before spectral data are obtained from them.
Generally, the temperature has important effects on the crystal structure and density. Some effects are reversible: for instance, increasing the temperature only causes a temporary dilatation of the crystal lattice [5]. In the case of plagioclase, this expansion is anisotropic [6,7]. Other effects of temperature are irreversible, as reported, for example, for phyllosilicates and carbonates, for which high enough temperatures cause the loss of volatile compounds and even induce permanent phase transitions [8,9].
The mineralogical composition of Mercury’s surface remains uncertain, mainly due to the absence of diagnostic absorption bands in the visible and near-infrared (NIR) spectra acquired both by Earth-based telescopes [10,11] and spacecrafts close to the planet [12,13]. However, ground-based observations of Mercury in the thermal infrared (TIR) [14,15,16] revealed that the hermean surface may be dominated by pyroxenes and feldspars, a hypothesis that has been corroborated by middle-infrared (MIR) measurements [17]. Moreover, recent works showed that some spectral features in the visible range could be detected at the local scale in fresh materials such as hollows [18,19]. Based on elemental composition studies, showing, notably, that Mercury’s surface is low in iron [20,21], some models were developed and predicted the presence of plagioclase, iron-poor pyroxene, and olivine, and volatile-rich minerals such as sulfides [22,23,24].
Northern Volcanic Plains (NVP) are the results of large effusive events close to the north pole of Mercury [25,26], with the richest lava flows in SiO 2 , Al 2 O 3 , and Na 2 O, and the poorest in MgO [21,27,28,29]; however, they are overall low in Al 2 O 3 compared to terrestrial and lunar crustal compositions. These chemical properties agree with the low viscosity observed for the lavas [30,31]. Although it has been shown that the sulfur solubility in silicate melts increases with decreasing oxygen fugacity [32,33,34,35], the effect of sulfur on the polymerization of silicate melts, and thus, on their rheology, remains marginal [36].
Several laboratory studies of heating (or cooling) treatments for these minerals have already been conducted and have evidenced spectral variations. The investigation of the thermal effects on the 1 μ m band region, where the crystal field transition of Fe 2 + is detected, showed that crystallographic site symmetry is more important than site expansion (metal–oxygen distances) to assess the position of band centres as a function of temperature [37]. In the MIR, the first measurements of an andesite-labradorite poor in Fe (<0.07 wt.%) at typical Mercury daytime temperatures [38] led to the conclusion that the latitude and the time of the day may be of importance to interpret Mercury’s spectra. Moreover, it has been shown that temperature variations and changes in the composition produce the same effects in spectra for common rock-forming minerals (e.g., forsterite and its iron content [39]). Thus, such surface temperature variations can be an issue in correctly interpreting remote sensing spectroscopic data and retrieving the composition of the surface materials. Based on recent findings showing that Mercury’s petrology is closer to komatiites and boninites [40], a measurement campaign regarding these minerals evidenced reddening and darkening heating effects in the thermal infrared [41,42]. More recently, the behavior of sulfide minerals (e.g., FeS, CaS) at high temperatures has been studied [43] since they are expected to be involved in the formation of hollows [44]. Various changes related to albedo and band centres in the thermal spectral range have been reported. Finally, in the thermal infrared, an analysis of the effects of thermal expansion on mixtures of felsic and mafic minerals [45] concluded that spectral variations depend on mineral abundances, even at high temperatures.
The main goal of our contribution consists of investigating the effects of temperature on the spectral properties of two Mercury analogs (plagioclase and volcanic glasses) in both the visible and infrared ranges, providing a consistent framework for interpreting spectral characteristics over a broad wavelength range. Several associated objectives are addressed: (1) more precisely investigating the spectral modifications caused by high temperatures in these analogs (e.g., can we observe irreversible effects of heating on hermean minerals analogs, and if yes, to which physico-chemical transformation(s) are they associated?); (2) determining if it is possible to separate thermal effects from compositional effects in visible and infrared spectra of various mineral analogs of Mercury’s surface. These wavelength ranges are particularly relevant for the ESA/JAXA BepiColombo mission [3], which will investigate the mineralogy of Mercury’s surface from early 2026 in the visible–near-infrared (0.4–2.0 μ m) and in the thermal infrared (7–14 μ m), thanks to the SIMBIO-SYS [46] and MERTIS [47] instruments, respectively.

2. Materials and Methods

2.1. Selected Samples

Based on our current understanding of the composition of Mercury’s surface, we selected two materials for this study: a crystalline material and a glass.
Among the crystalline phases, different materials could be chosen since different mineral phases have been retrieved [29,40] or proposed [18,19]. Here, we considered mineral phases that globally characterize the surface of Mercury, i.e., silicate. Between the potential candidates, i.e., plagioclase, pyroxene, and olivine, we considered a terrestrial analog with enough material and an iron abundance compatible with remote sensing data [20,21]. Based on these conditions, plagioclase is the better choice for the crystalline material.
We chose a plagioclase with a 20/80 albite/anorthite ratio, i.e., bytownite (exsolution An 80 , formula (Ca 0.8 ,Na 0.2 )[Al(Al,Si)Si 2 O 8 ]). From the same initial rock, we extracted three samples under different states:
  • The first sample was a powder (grain size = 75–100 μ m) with low FeO content (0.5 wt.%), prepared and provided by the University of Parma [48];
  • The second sample was a pellet (5 mm diameter, see Figure 1b and Section 2.3 for the protocol) made by pressing the powder;
  • The third sample consisted of two slices (thickness = 1–2 mm) of the initial rock.
The choice of three plagioclase samples under different states was motivated by the various forms under which rocks can be found on Mercury. Fine regolith is best simulated by the powder sample. Solid blocks of rock, as can be found in impact crater ejecta or floor, are represented by the slice sample. Finally, what can be considered an intermediate case is simulated by the pellet sample.
A preliminary identification of our measurements with the plagioclase spectra from the United States Geological Survey (USGS) spectral library can be found in Appendix A.
The second material was a pellet (5 mm diameter; see Figure 1d and Section 2.3 for the protocol) produced from a powder of volcanic glasses (grain size = 20–50 μ m) [49,50] provided by the University of Perugia (Italy). This sample was an analog for NVP resulting from large effusive events. As discussed in the introduction, it was unnecessary to consider sulfur effects on NVP lavas rheology; therefore, the sample was S-free.

2.2. Experimental Setups

To apply temperature variations to our samples, we used a heating cell to simulate both Mercury day-side temperature variations and their night-side counterpart. All the heating and cooling treatments were conducted at the Spectroscopie et Microscopie dans l’Infrarouge utilisant le Synchrotron (SMIS) beamline of synchrotron Source Optimisée de Lumière d’Énergie Intermédiaire du LURE (SOLEIL; Saint-Aubin, France).
The heating cell was the FTIR600 model from Linkam Scientific Instruments, composed of a nitrogen-purged chamber (slightly higher than atmospheric pressure) and a heating block (∼4 cm diameter) on which the samples were deposited. The temperature at the heating block was measured by a platinum resistor sensor. In the case of measurements at temperatures lower than ambient, the cooling was produced by a flow of liquid nitrogen passing through small tubes inside the cell. The samples were heated/cooled from below; the consequences and methods used to address this issue are discussed in Appendix B. The experiment parameters (final temperature, rate, plateau duration) were manually set beforehand and thanks to a controller.
The use of a nitrogen-purged chamber to reproduce the ultrahigh-vacuum conditions of the surface of Mercury is not ideal because of the inherent usual limitations of measurements under atmospheric pressure (e.g., fluctuations in temperature in the chamber, lower stability, and sensitivity). Atmospheric absorption features caused by residual water (1.38, 1.87, 2.7 and 6.3 μ m) and carbon dioxide (2.0, 2.7, 4.3 and 15 μ m) vapours can interfere with the sample’s spectral features [51]. However, the former absorption features either occur outside the wavelengths of interest in our spectra or are weak enough to be properly removed with the reference spectrum acquired before the measurements (see Section 2.3). In addition, the nitrogen used to purge the chamber is known to be an inert gas. Based on these considerations, as well as the aforementioned consideration (better sample temperature homogenization), we believe our measurements are still relevant to Mercury.
Lastly, the cell can be assembled to the stage of an FTIR microscope. Two ZnSe IR-transparent windows close the cell (top and bottom) to enable in situ IR measurements as a function of the temperature. We used a reflection configuration due to the large sample thickness and for comparison with remote sensing reflectance measurements of Mercury.
We conducted a spectral analysis in the 0.47–14.3 μ m spectral range with two different setups: one, installed in a clean room at the Institut d’Astrophysique Spatiale (IAS; Orsay, France), was dedicated to visible and near-infrared spectroscopy (VNIR) in the 0.47–1.1 μ m range; the second was installed at the synchrotron SOLEIL and focused on the 1.0–14.3 μ m range, i.e., near-infrared (NIR) and mid-infrared (MIR) spectroscopies.
The VNIR analysis was performed using a Maya2000 Pro (Ocean Optics) spectrometer (setup described in more detail by [52]) operating from 0.47 to 1.1 μ m and coupled to a binocular microscope through optical fibers. This setup was configured in bidirectional reflectance (incidence angle i = 45 , emission angle e = 0 ) to collect only the diffuse component of reflected light while avoiding the specular component. The illuminated spot was 1 mm in diameter; the analytical spot was 600 μ m in diameter. A total of 400 scans with 40 ms integration time were integrated per measurement. Spectra were ratioed to that of a Spectralon 99% reflectance standard (from Labsphere), and they were all obtained under the same conditions, i.e., at room temperature and with atmospheric pressure.
The NIR-MIR analysis was conducted with an Agilent (model Cary 670/620) FTIR spectrometer, coupled to a microscope [53] and its internal source (Globar), a 15× objective (0.62 numerical aperture) with a collection spot on the focal plane of about 200 × 200 μ m 2 , associated with an MCT detector cooled with liquid nitrogen. MIR spectra were acquired at 4 cm 1 spectral resolution, NIR spectra at 8 cm 1 . Either 256 or 512 scans were accumulated for each acquisition, always at the same position on the sample during a heating/cooling cycle. The samples were observed in a specific geometric configuration (the reflected light was collected over a large range of angles at all azimuth angles) due to the Schwarzschild objective of the spectrometer. Reflectance spectra were obtained with respect to the gold standard.

2.3. Protocols

Pellets of plagioclase and volcanic glasses were prepared at IAS using a Specac manual hydraulic press. This operation was performed under a vacuum to reduce the amount of air trapped between the grains and increase the robustness of the pellet. We used 30 mg of powder for the plagioclase and 40 mg for the glasses. Each pellet was pressed for fifteen min with a pressure of 1.9 tons. The resulting thickness of the pellets was about 1 mm.
The following procedure was used to measure our samples during a heating cycle. Prior to any spectral acquisition, a reference spectrum of an inert, well-characterized material (Spectralon for VNIR measurements, gold mirror for NIR-MIR) was taken. In the case of VNIR measurements, a dark acquisition was also performed and subtracted from both the sample and the reference spectra. The first spectrum of the chosen sample was collected at room temperature (∼298 K [∼25 C]). Then, the sample was heated to 323 K (50 C) with a ramp of 5 or 10 K per minute and left at this temperature for ten more min. This plateau is crucial to thermalize the sample properly (see Appendix B). After that, the spectrum at 323 K can be acquired. The previous steps were then repeated, with one spectrum each 50 K, until 673 K (400 C) was reached. A similar sequence was finally performed while cooling to room temperature. In total, a complete heating cycle (heating and cooling to room temperature) lasts ∼250–320 min (∼140–180 min for heating; ∼110–140 min for cooling).
We similarly analyzed the behavior of our samples at temperatures lower than ambient, down to 148 K (−125 C). However, to prevent a too-thick ice deposit on the sample due to residual water vapor condensation, fewer spectra were acquired at the lowest temperatures, i.e., at non-constant temperature steps.

3. Results

3.1. VNIR Spectra

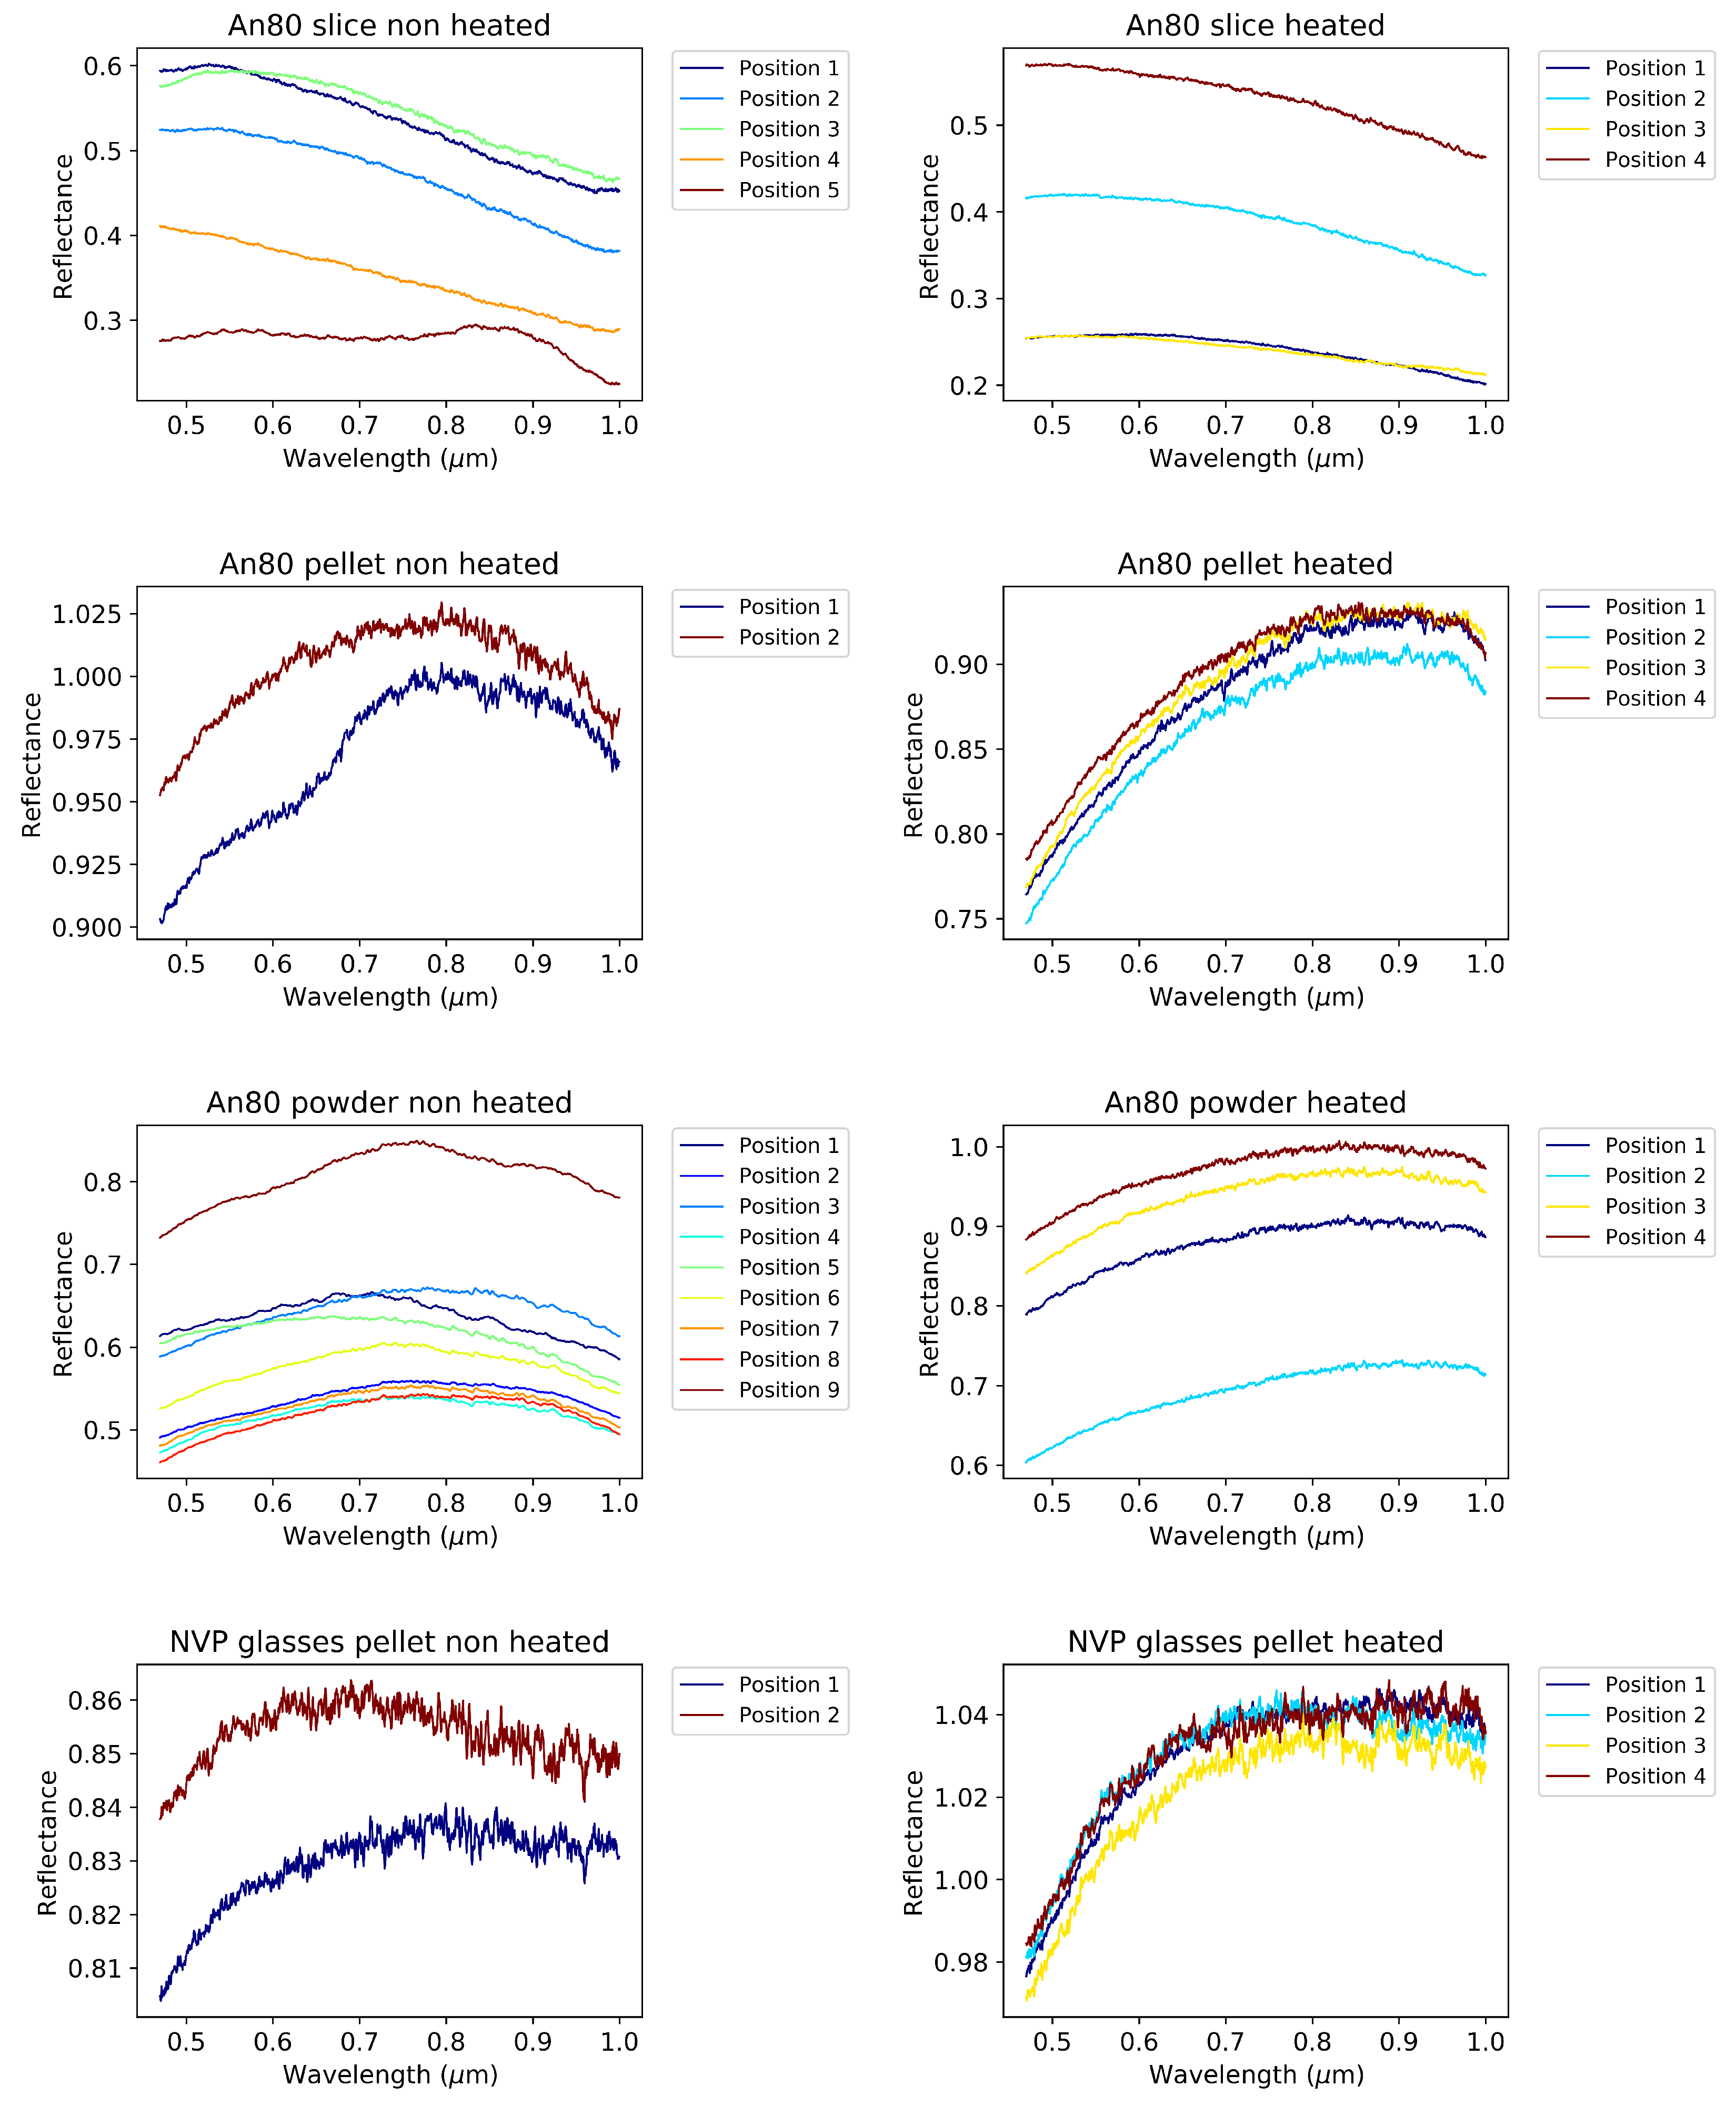
We collected several spectra at various positions on two specimens of each sample (one heated, one non-heated) to obtain a more global and representative view of the spectral properties of the samples. The VNIR spectra of the samples of plagioclase and volcanic glasses are shown in Figure 2.
Reflectance values greater than 1 occurred for two samples (the non-heated pellet of plagioclase and the heated pellet of volcanic glasses). These values may be due to the particularly high rugosity of these samples compared to the reference sample (Spectralon), leading to a partial detection of the specular component of the reflected light for specific positions.
In our VNIR spectral range of study (0.47–1.1 μ m), there is no fully identifiable spectral band for either plagioclase or volcanic glasses, similar to the spectra of Mercury. Thus, other spectral parameters have to be taken into account when evaluating the effects of temperature. We chose to use the spectral slope between 0.5 and 0.8 μ m; the ratio of reflectance at 1.0 μ m and 0.8 μ m, which provides a hint regarding the shape and depth of the 1.3 μ m band of plagioclase; and the reflectance at 0.5 μ m. The values of the spectral parameters for the different spectra are summarized in Table 1, Table 2 and Table 3.
From Table 1, Table 2 and Table 3, it is clear that there are variations in spectral slope and reflectance at 0.5 μ m between non-heated samples and heated samples. Since all spectra were obtained at room temperature, any difference noted between a heated sample and a non-heated sample for a given spectral parameter should be attributed to heating. Thus, we interpret these observations as irreversible changes in spectral parameters. Indeed, if the changes were reversible, the values of spectral parameters after heating would be similar to the ones before heating. However, these changes are not always identical from one sample to another. For an overview of all the changes in each spectral parameter and each sample, see Table 4.
The spectral slope is greater for each heated sample, except for the powder of plagioclase (almost constant spectral slope). The ratio 1.0/0.8 μ m increased during heating for all plagioclase samples, but this ratio does not seem to vary for the pellet of volcanic glasses. Finally, the reflectance decreases after heating for the slice and pellet of An 80 but increases for the powder of An 80 and the pellet of volcanic glasses. In sum, despite the high uncertainties on the spectral parameters of the slice of plagioclase (likely due to the fairly different spectrum acquired in position 5; see Figure 2), the slice and the pellet of plagioclase have similar behaviors in the VNIR when heated, while the powder of plagioclase and the pellet of volcanic glasses exhibit specific trends.

3.2. NIR Spectra

3.2.1. Heating

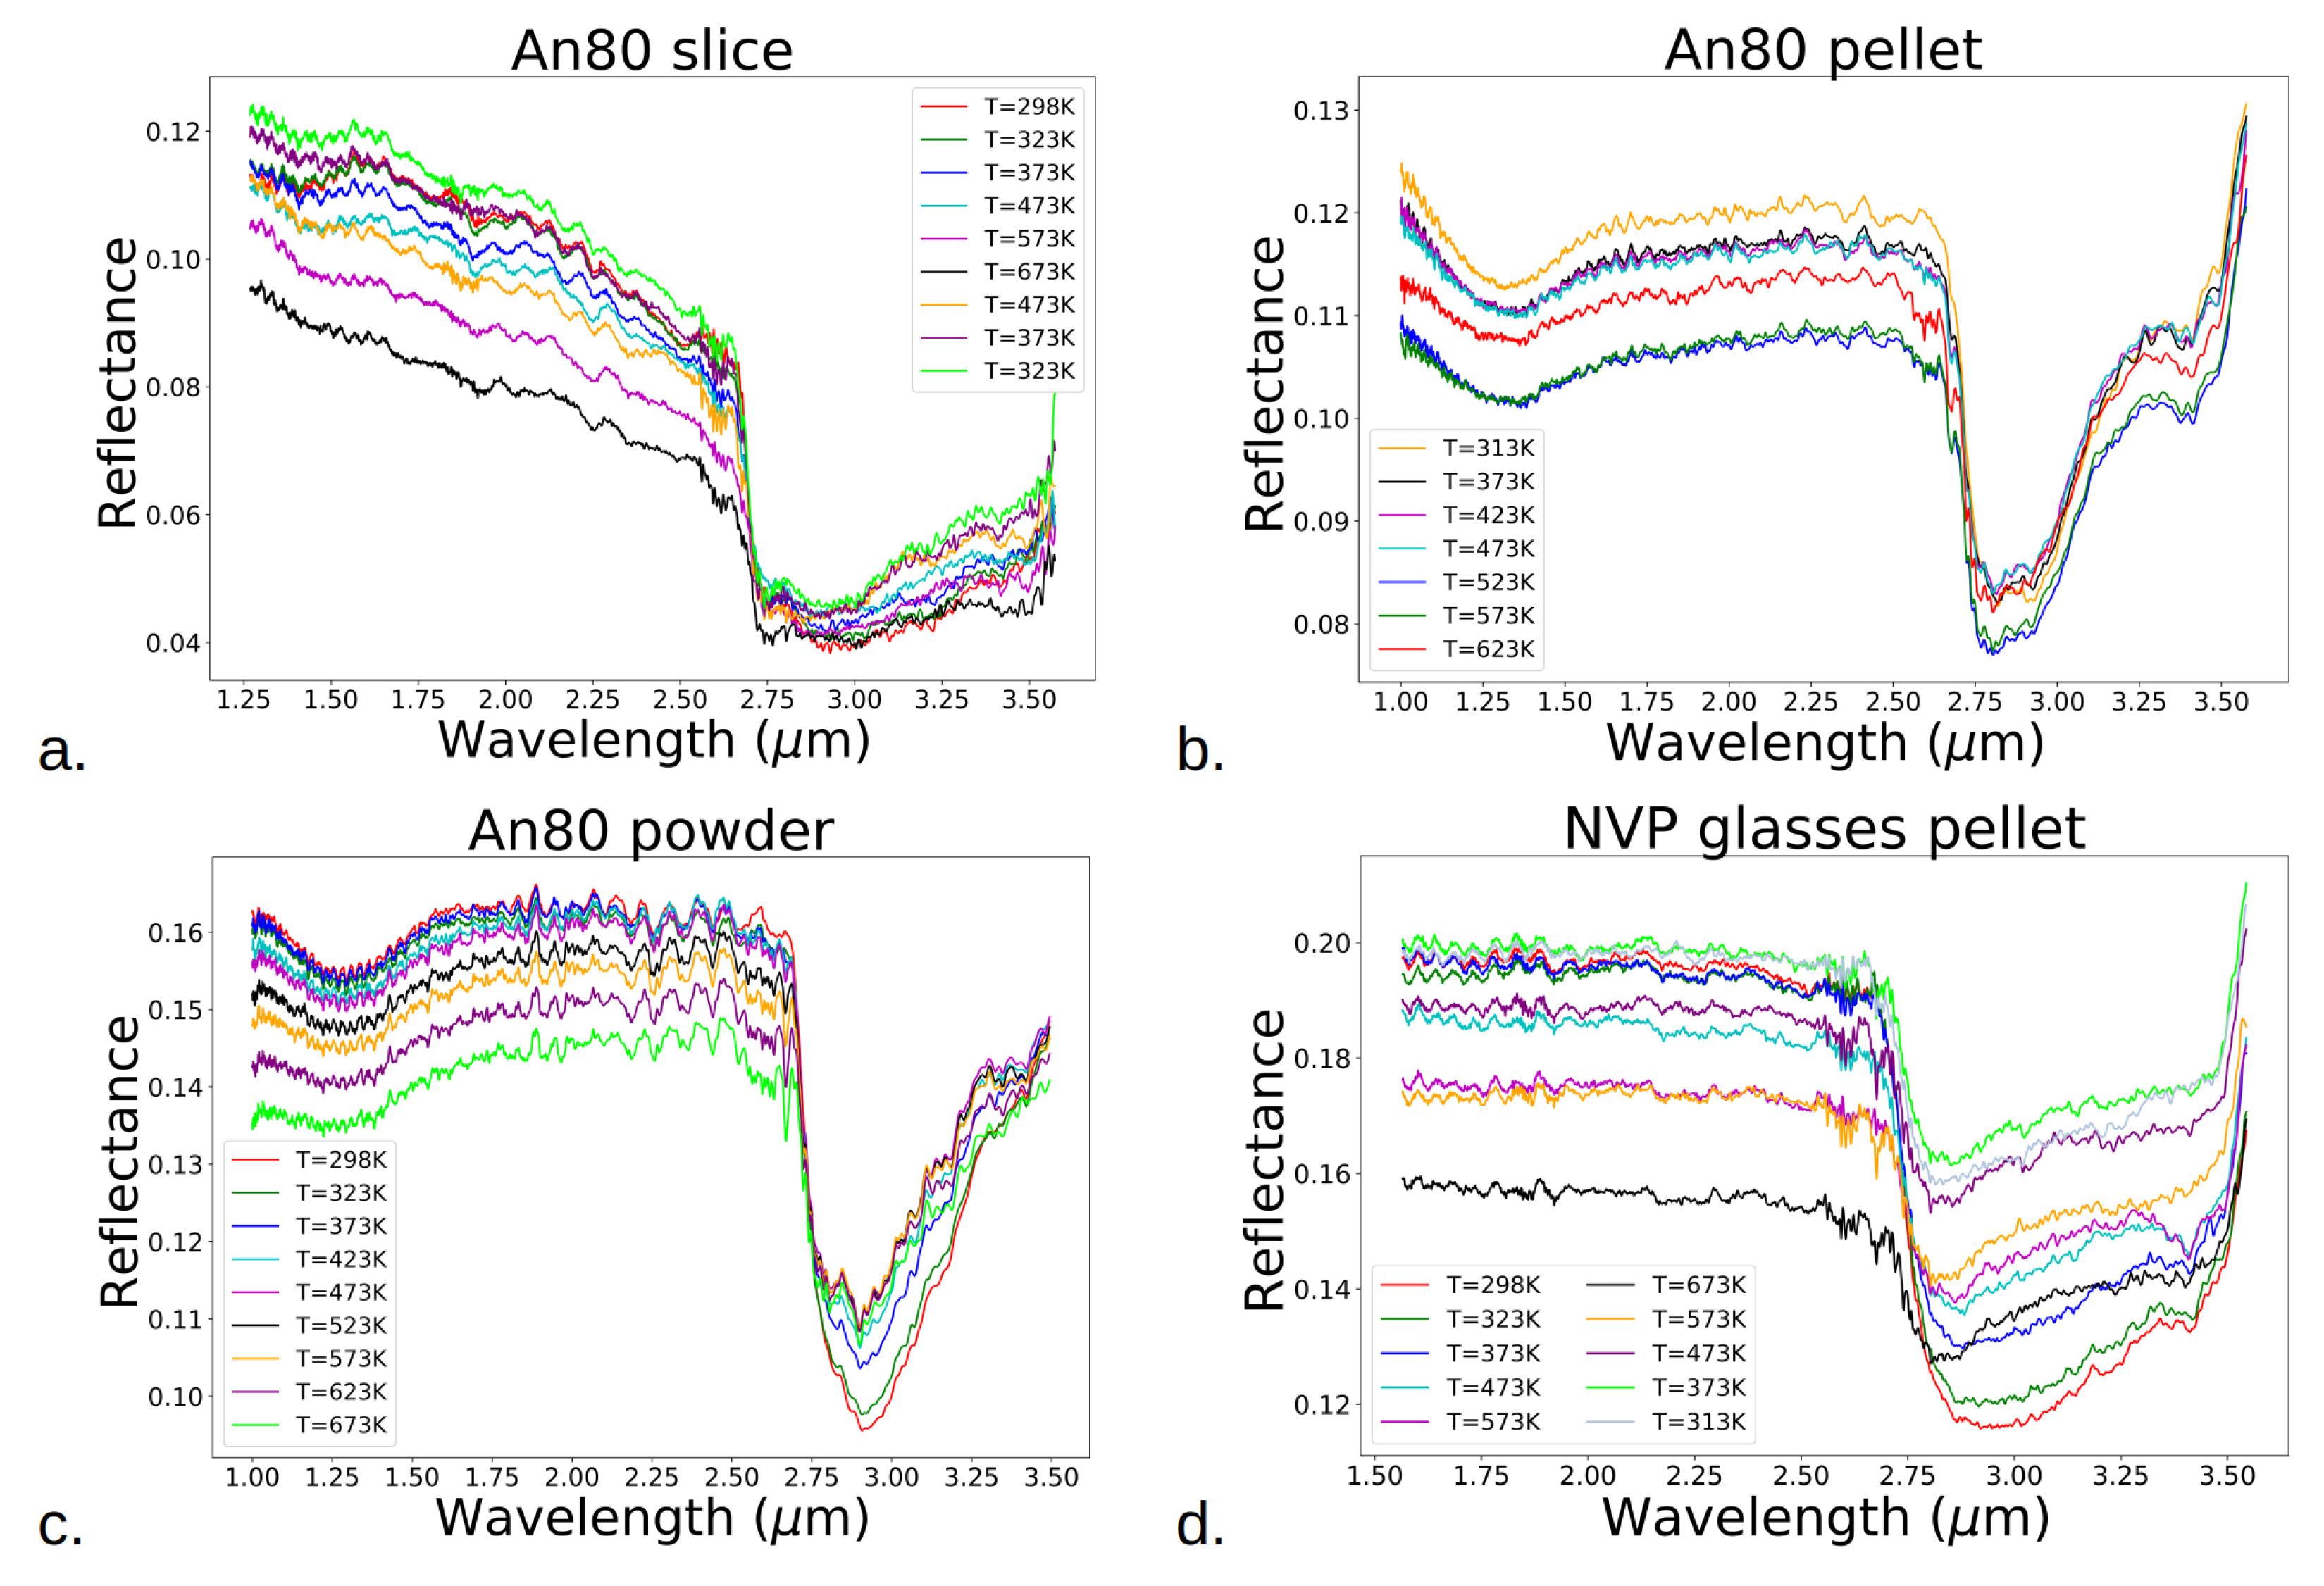
The NIR spectra of the samples of plagioclase and volcanic glasses for the heating experiment are shown in Figure 3.
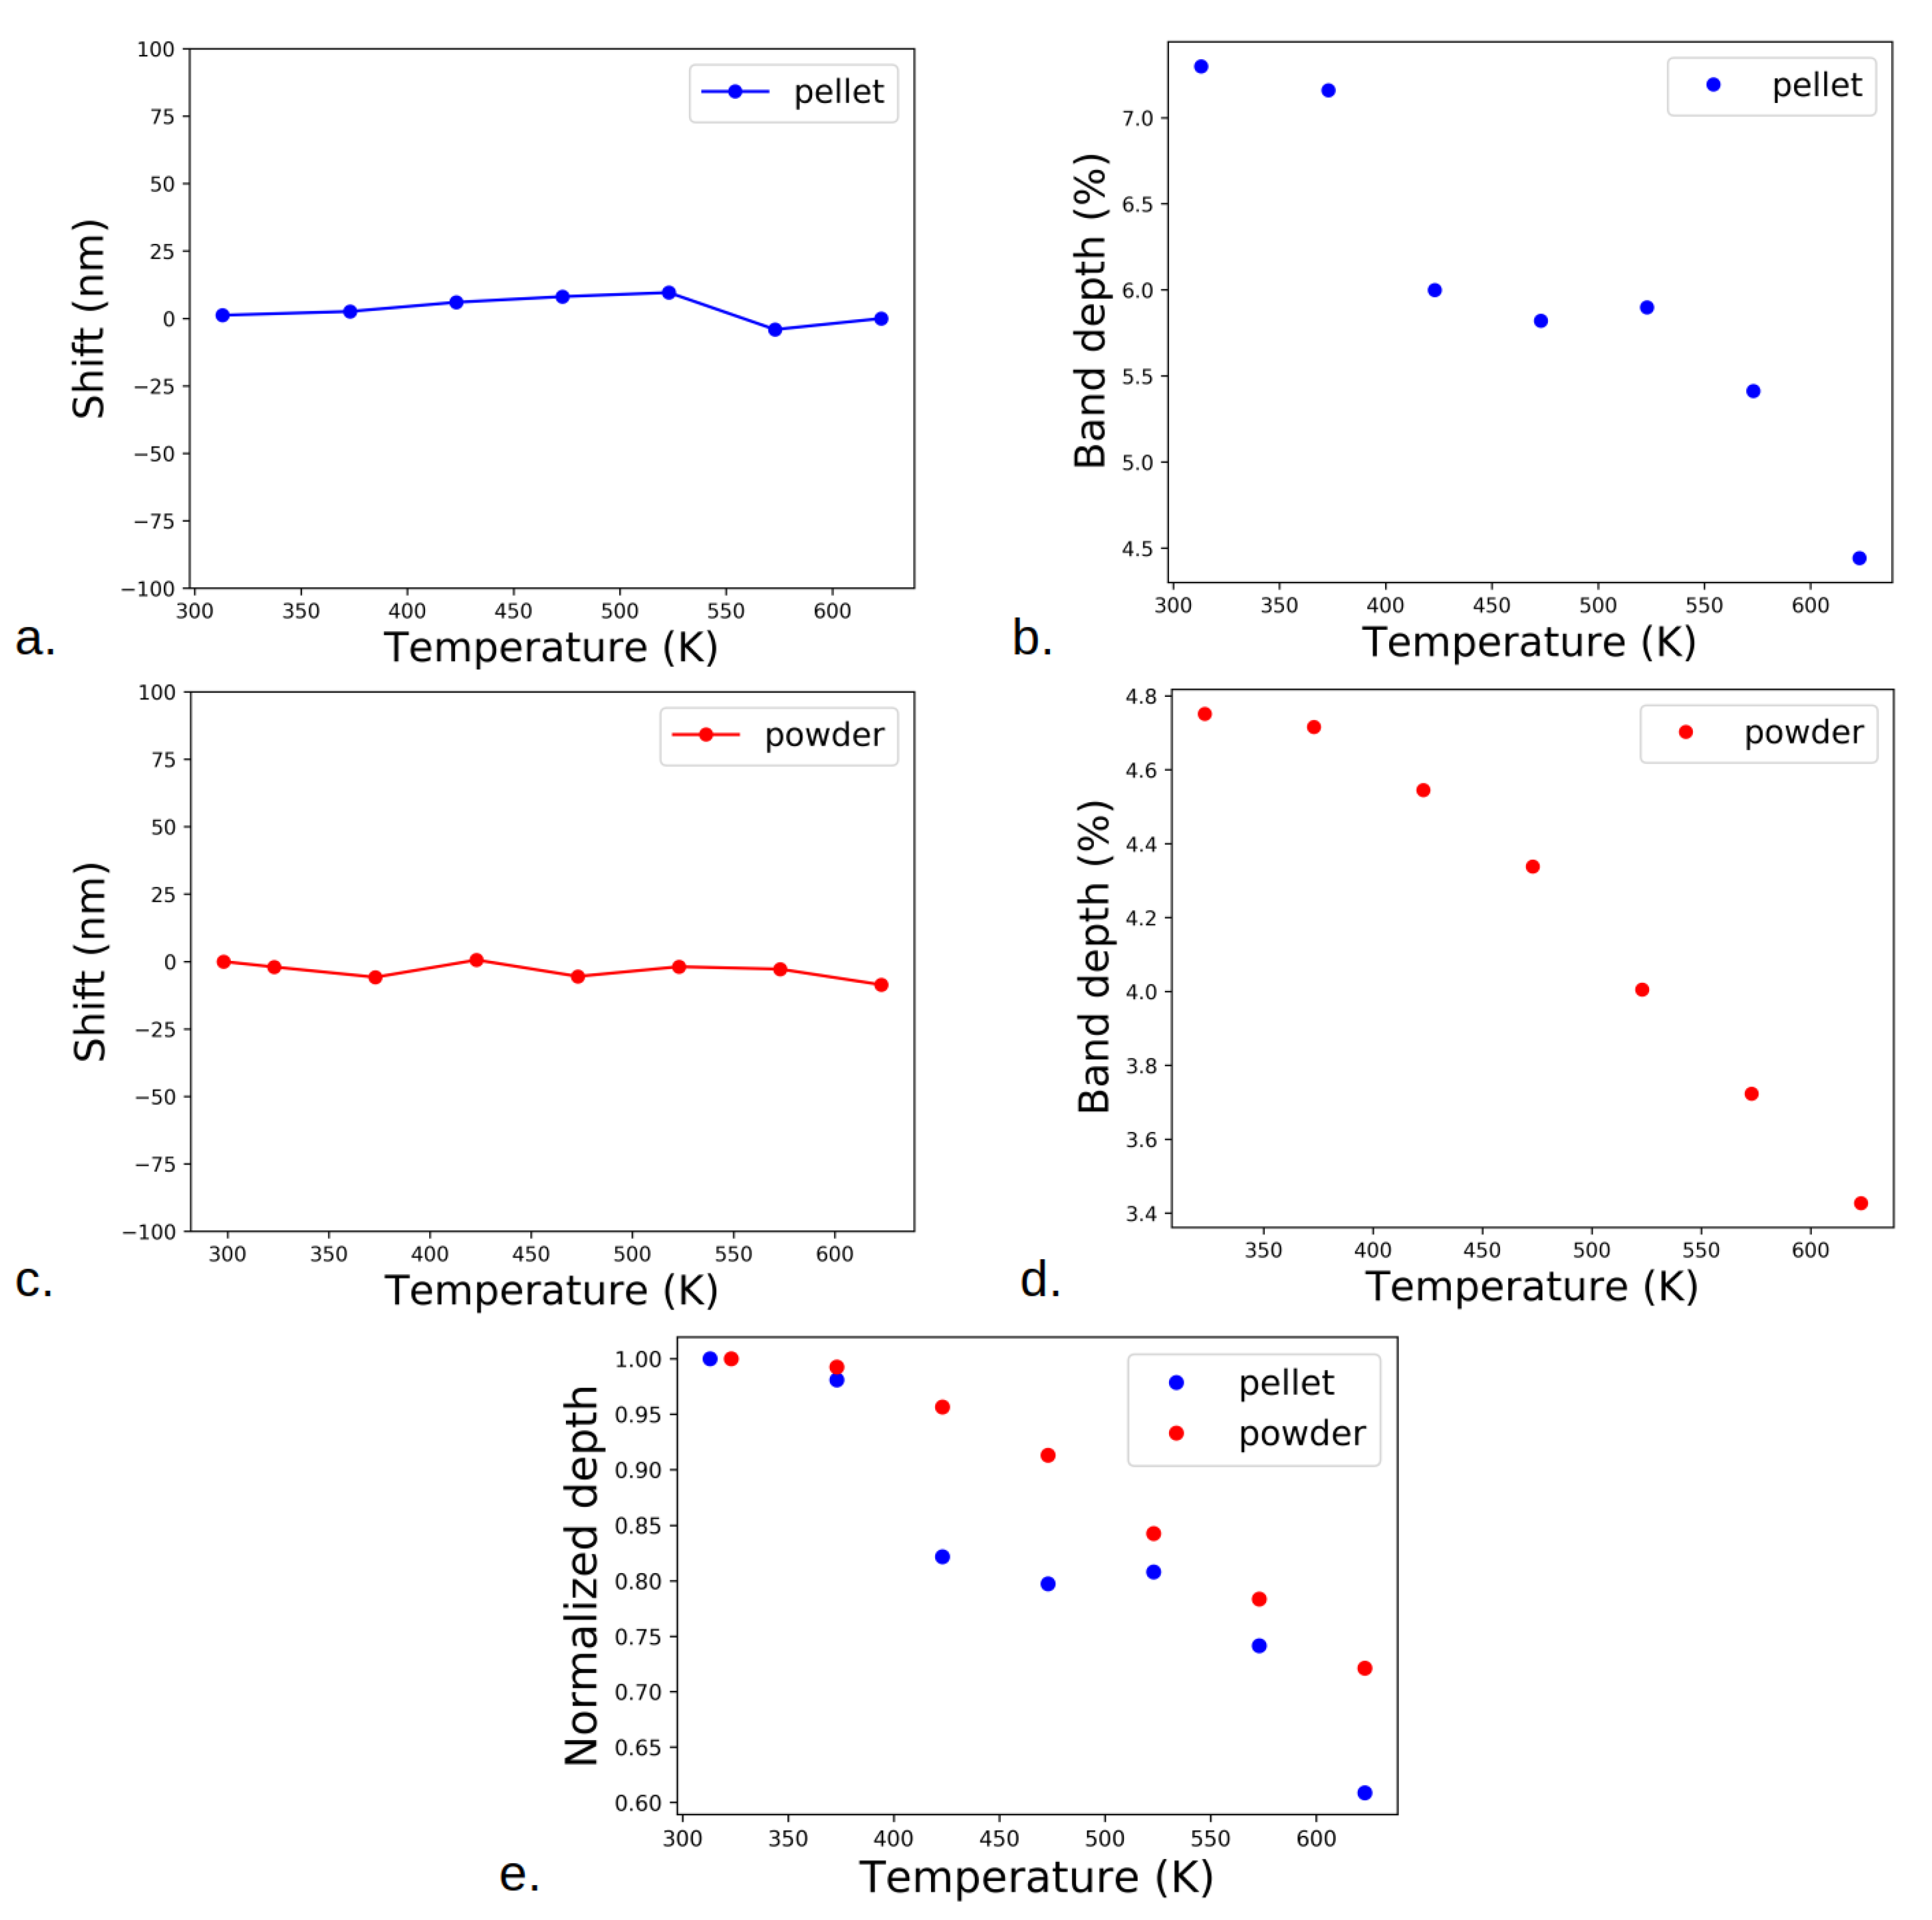
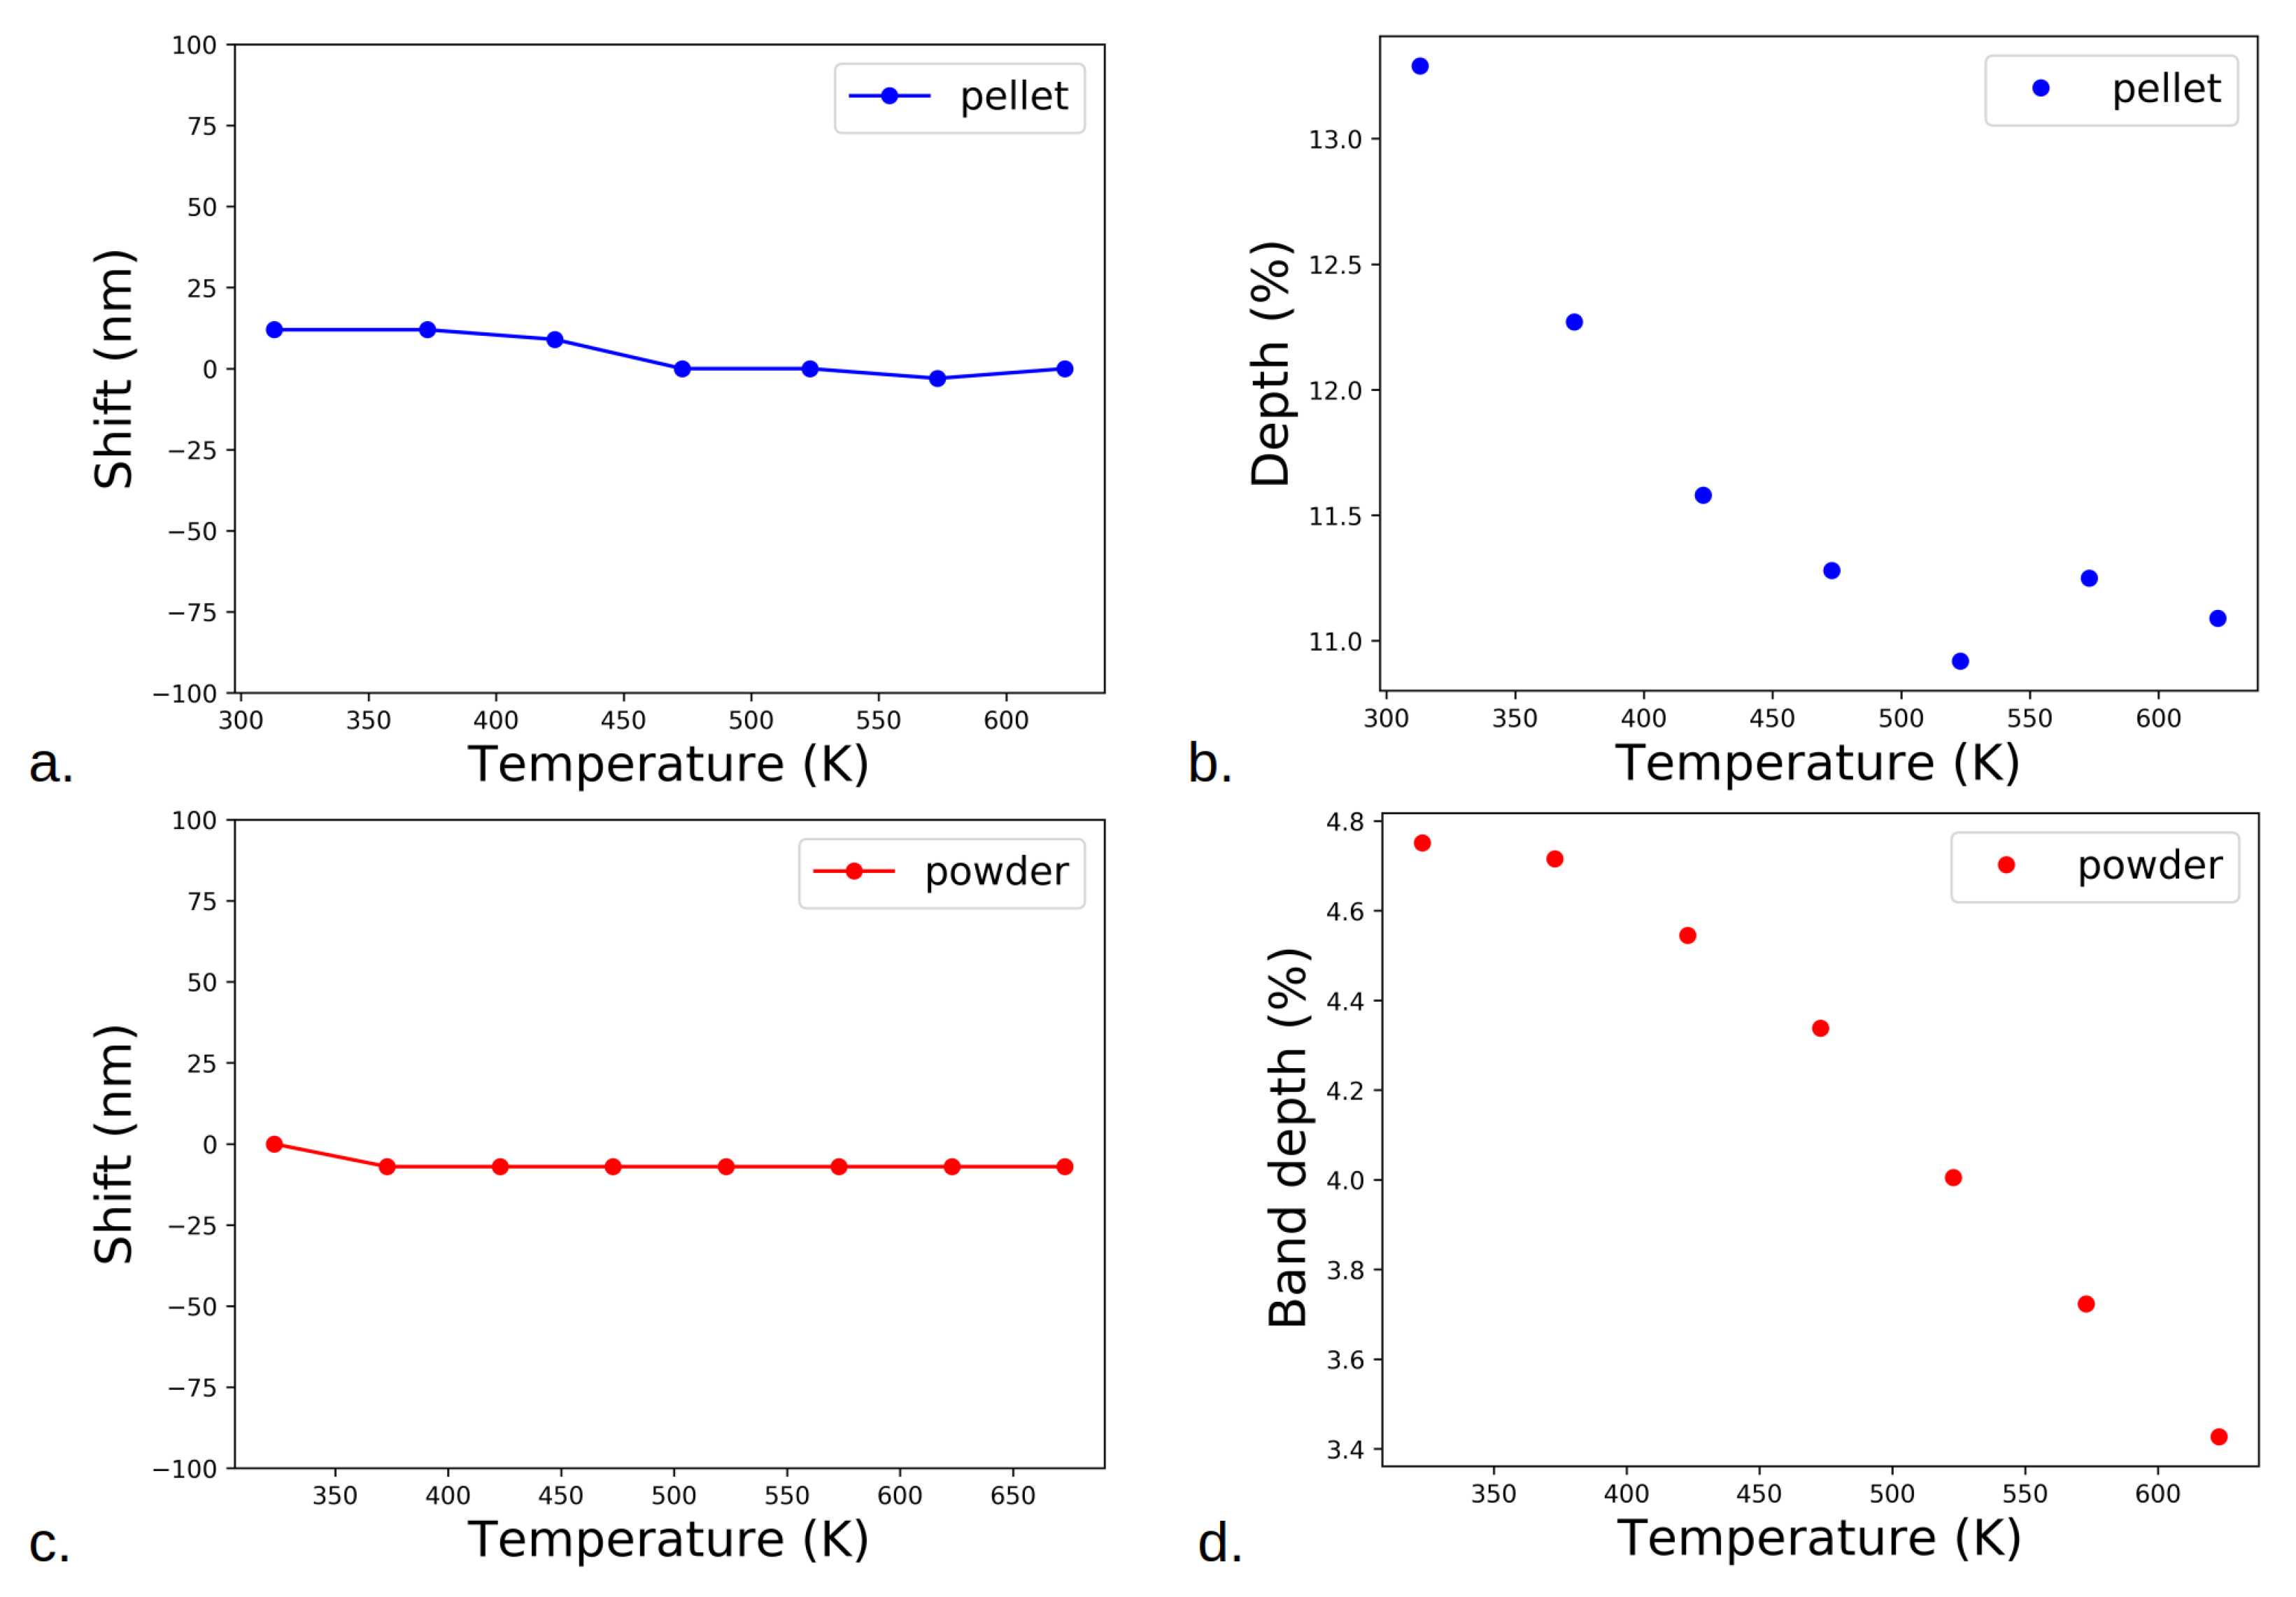
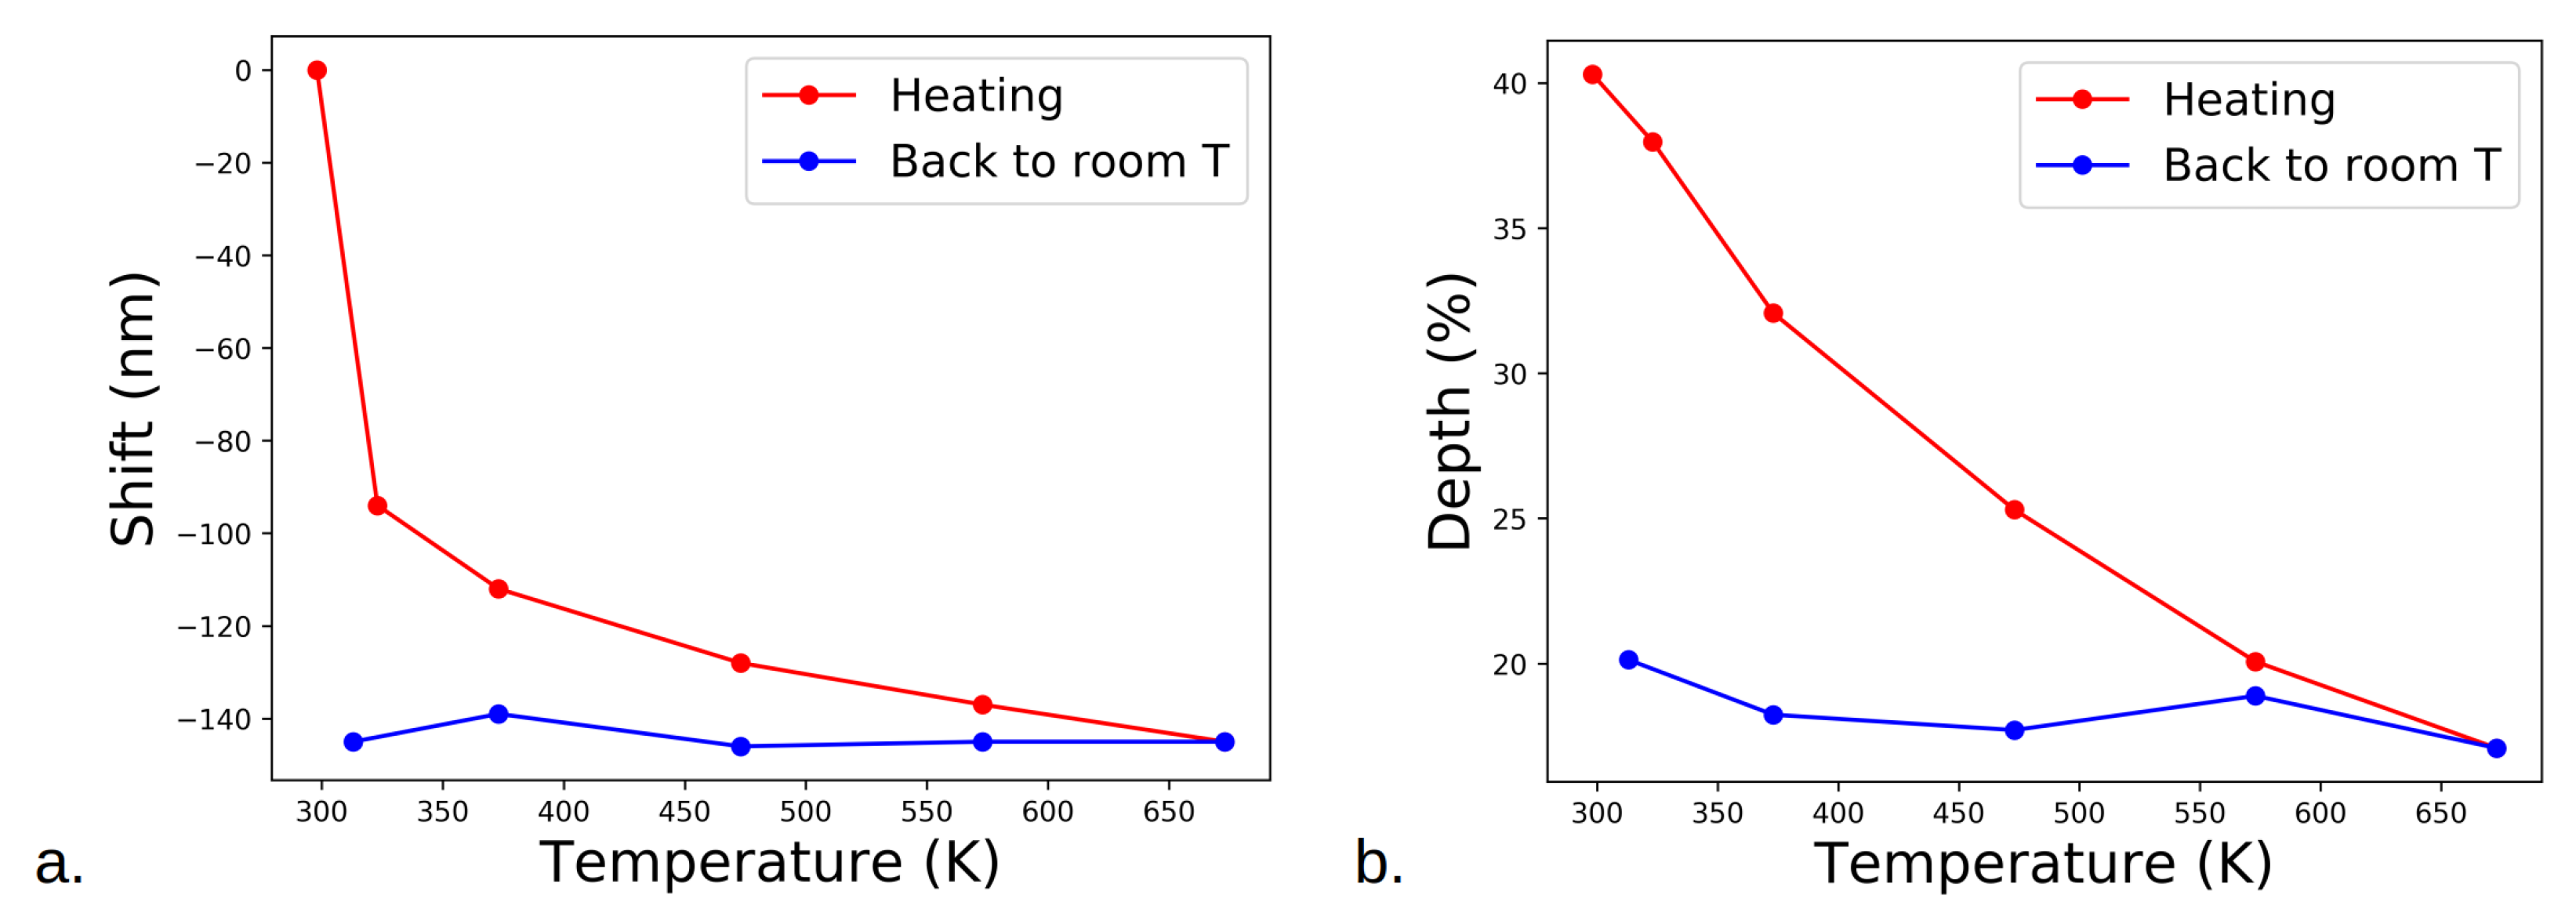
In the NIR spectral range (1.0–3.5 μ m), we observed three main spectral features: the absorption band around 1.3 μ m, caused by the electronic transitions of Fe 2 + ions in the crystal structure of plagioclase [54,55,56], a well-known feature on the Moon (e.g., [57]), which has not yet been detected in Mercury’s spectra [12]; the absorption band around 2.9 μ m corresponding to the OH symmetric and asymmetric stretching of hydrated minerals [58], due to the presence of water in the sample; the absorption band at 3.4 μ m, deriving from the absorption of C–H bonds of aliphatic carbon compounds, such as impurities (stretching of methyl CH 3 and methylene CH 2 groups [59]). We determined the variations in band position and depth of the 1.3 μ m band of plagioclase (except for the slice due to band saturation) and the 3.0 μ m band of volcanic glasses. All band positions and depths in this study were determined by removing the continuum and fitting the band with an even-degree (2, 4, or 6) polynomial. The results are presented in Figure 4, Figure 5 and Figure 6.
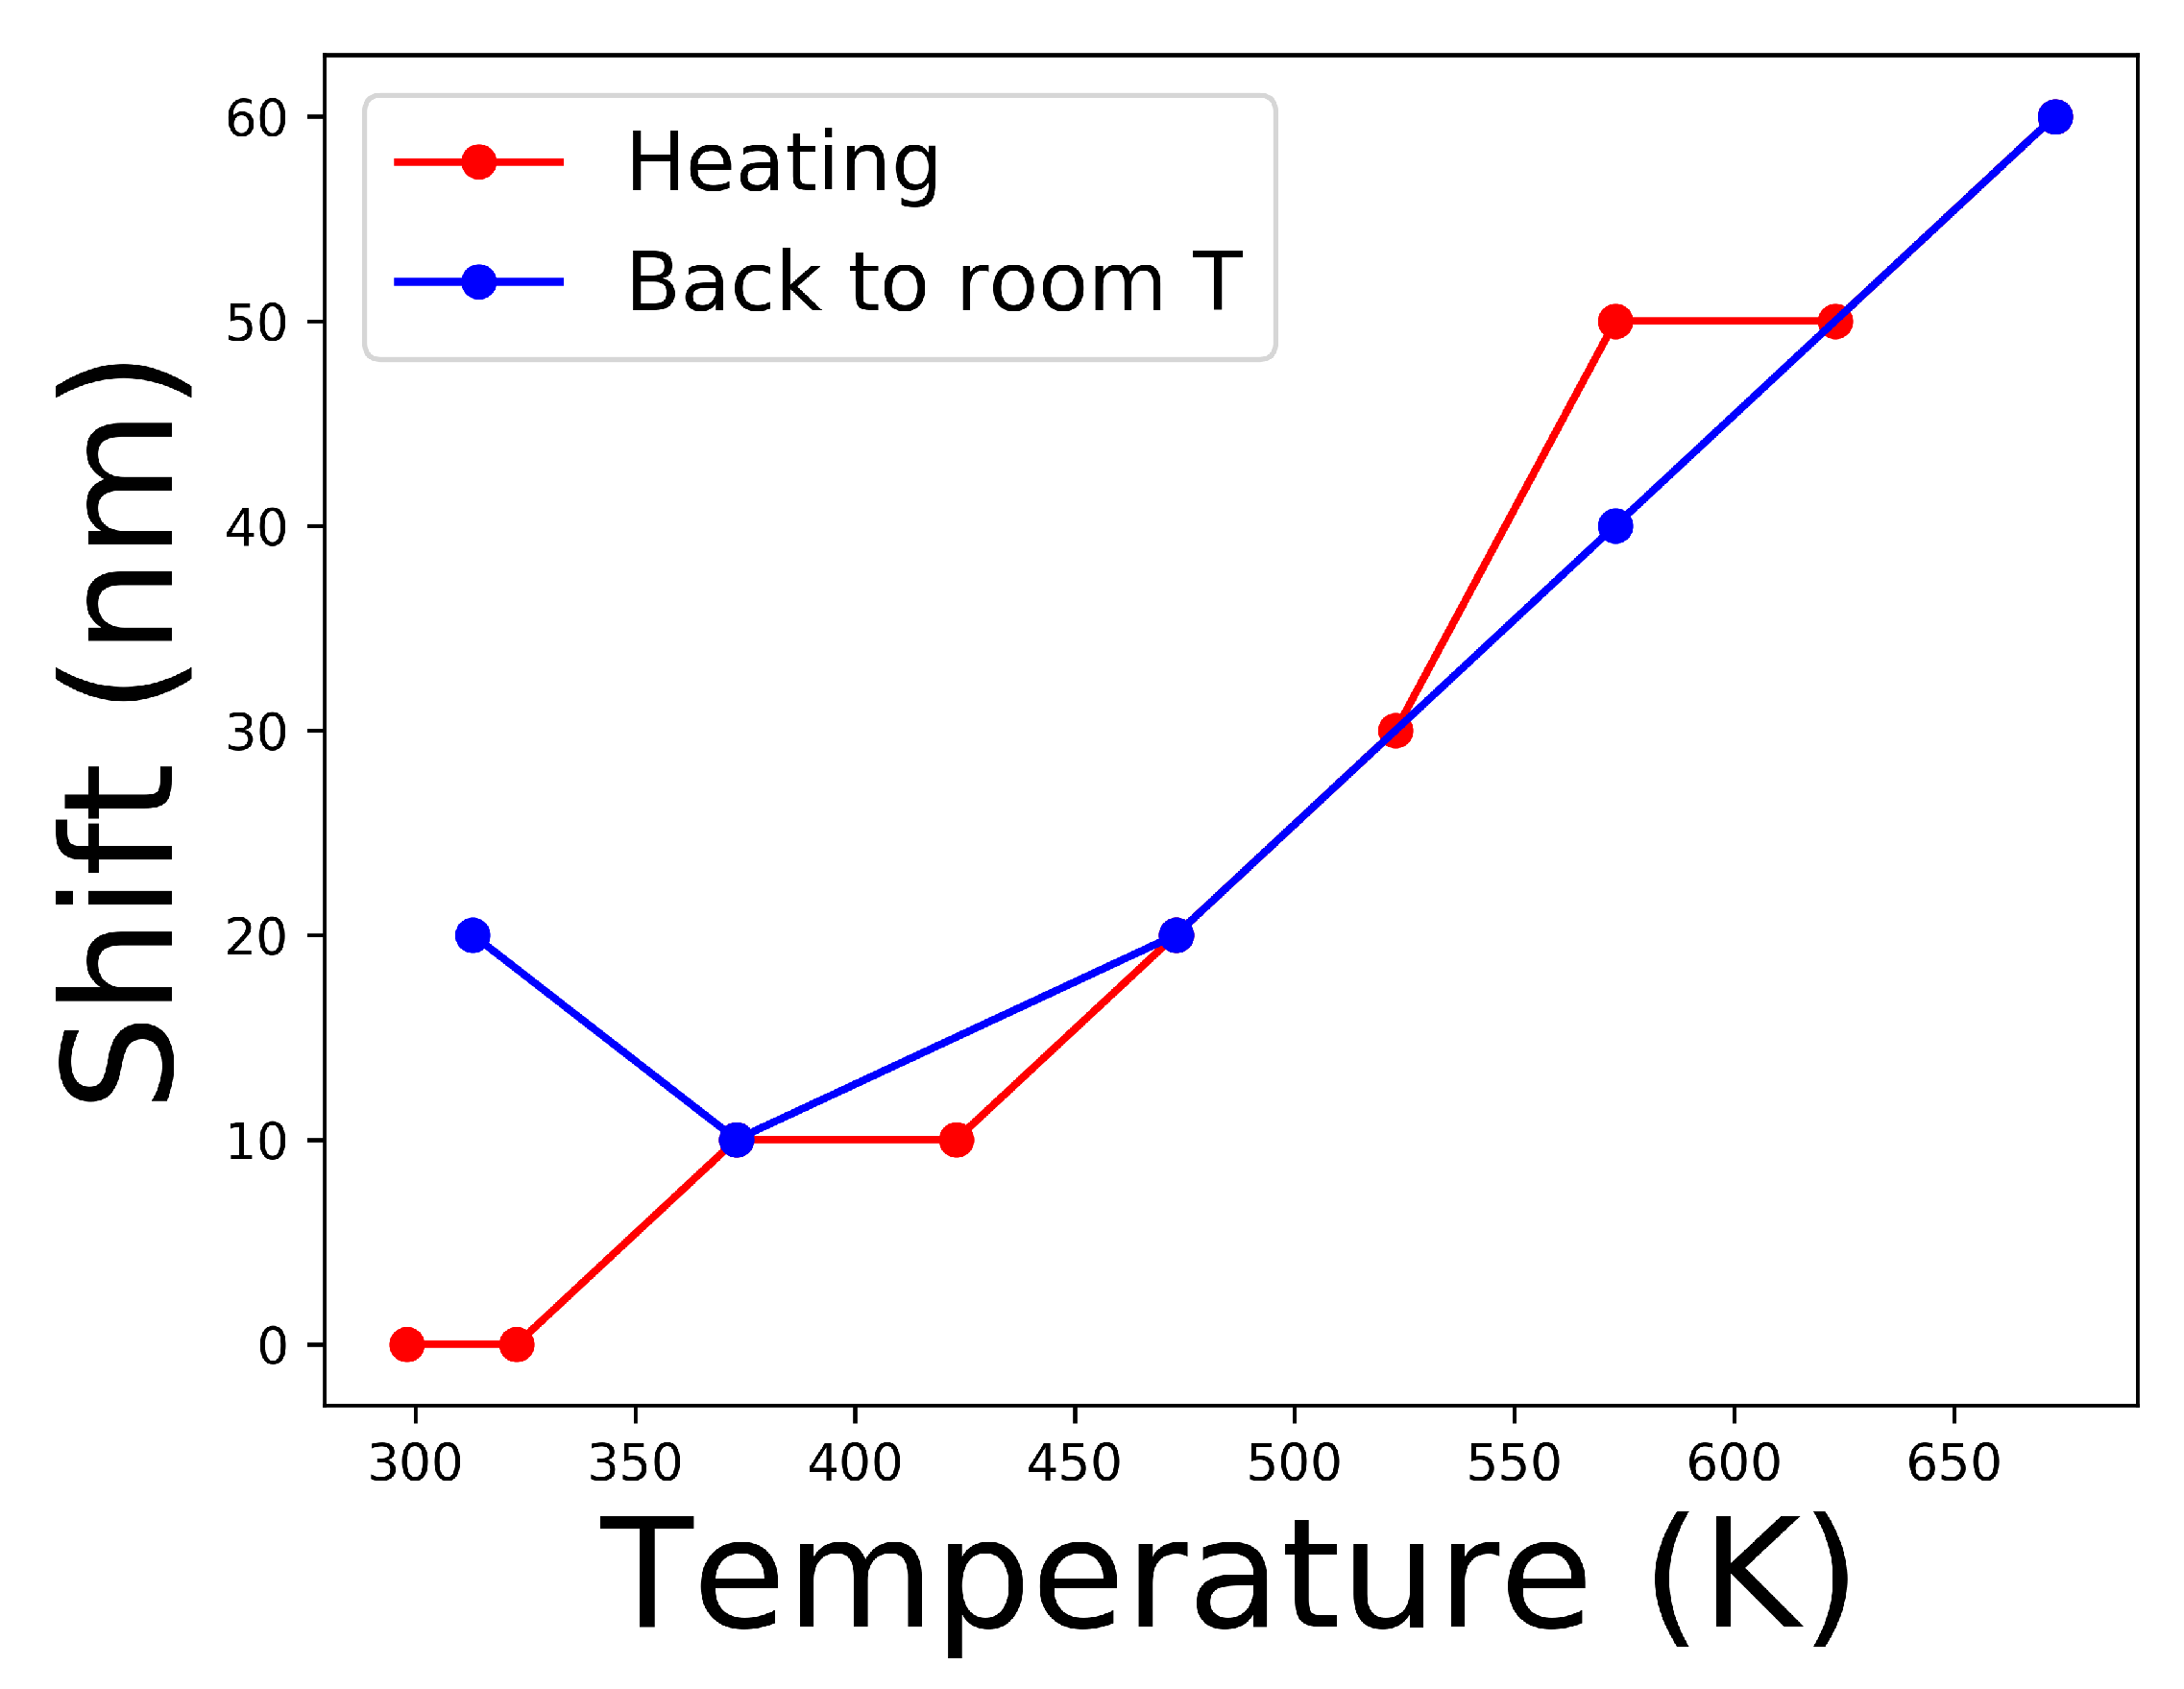
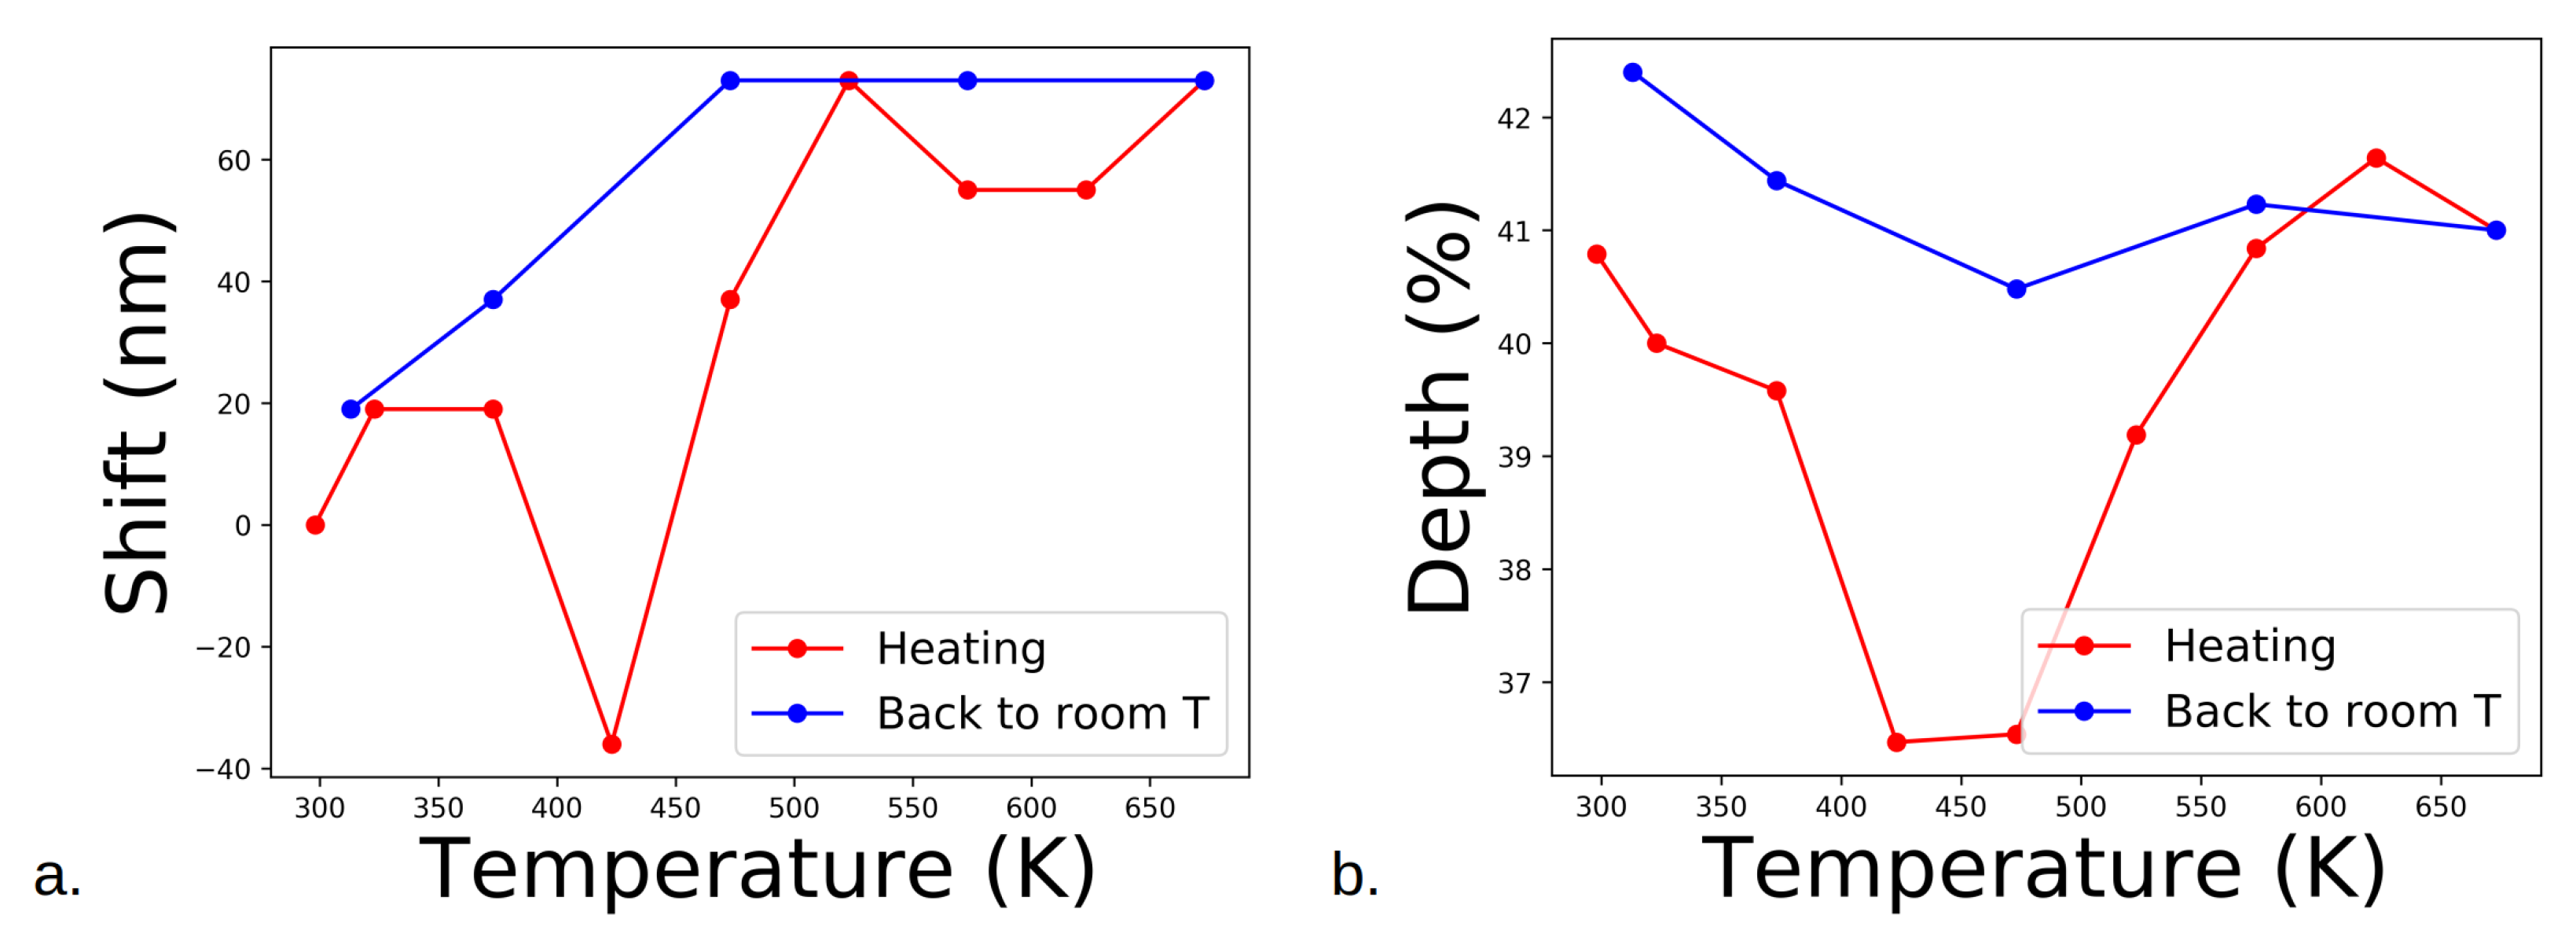
The 1.3 μ m band of plagioclase does not significantly shift when heating for both the pellet (see Figure 4a) and the powder (see Figure 4c). However, the depth of this absorption band clearly decreases as the temperature increases for both samples (see Figure 4b,d). The band depth decrease is slightly more important for the pellet than for the powder (∼40% and ∼30%; see Figure 4e). It is important to note that the NIR spectra of the pellet were acquired while increasing the temperature, whereas those of the powder were obtained when cooling to room temperature but exhibited the same trend (lower band depth at higher temperatures). Thus, despite both experiments involving two samples under different states, it is reasonable to assume that this variation in the depth of the 1.3 μ m band is reversible. Interestingly, a similar behavior (no significant shift and lower depth when heating) was observed for the band around 3.0 μ m (see Figure 5), whereas a shift towards shorter wavelengths occurred for the band around 3 μ m of volcanic glasses (Figure 6a). Unlike the plagioclase, it is obvious that the shift is non-reversible: when cooling the pellet of volcanic glasses (blue curve), the shift stayed at around −140 nm. Moreover, the shift mainly occurs during the first 100 K increase in temperature, and the depth decreases during the heating but remains stationary (around 20%) when cooling (Figure 6b). Lastly, a C-H stretching band at 3.4 μ m, showing the presence of a carbonaceous contaminant, becomes deeper until reaching 573 K (300 C) and then disappears.

3.2.2. Cooling

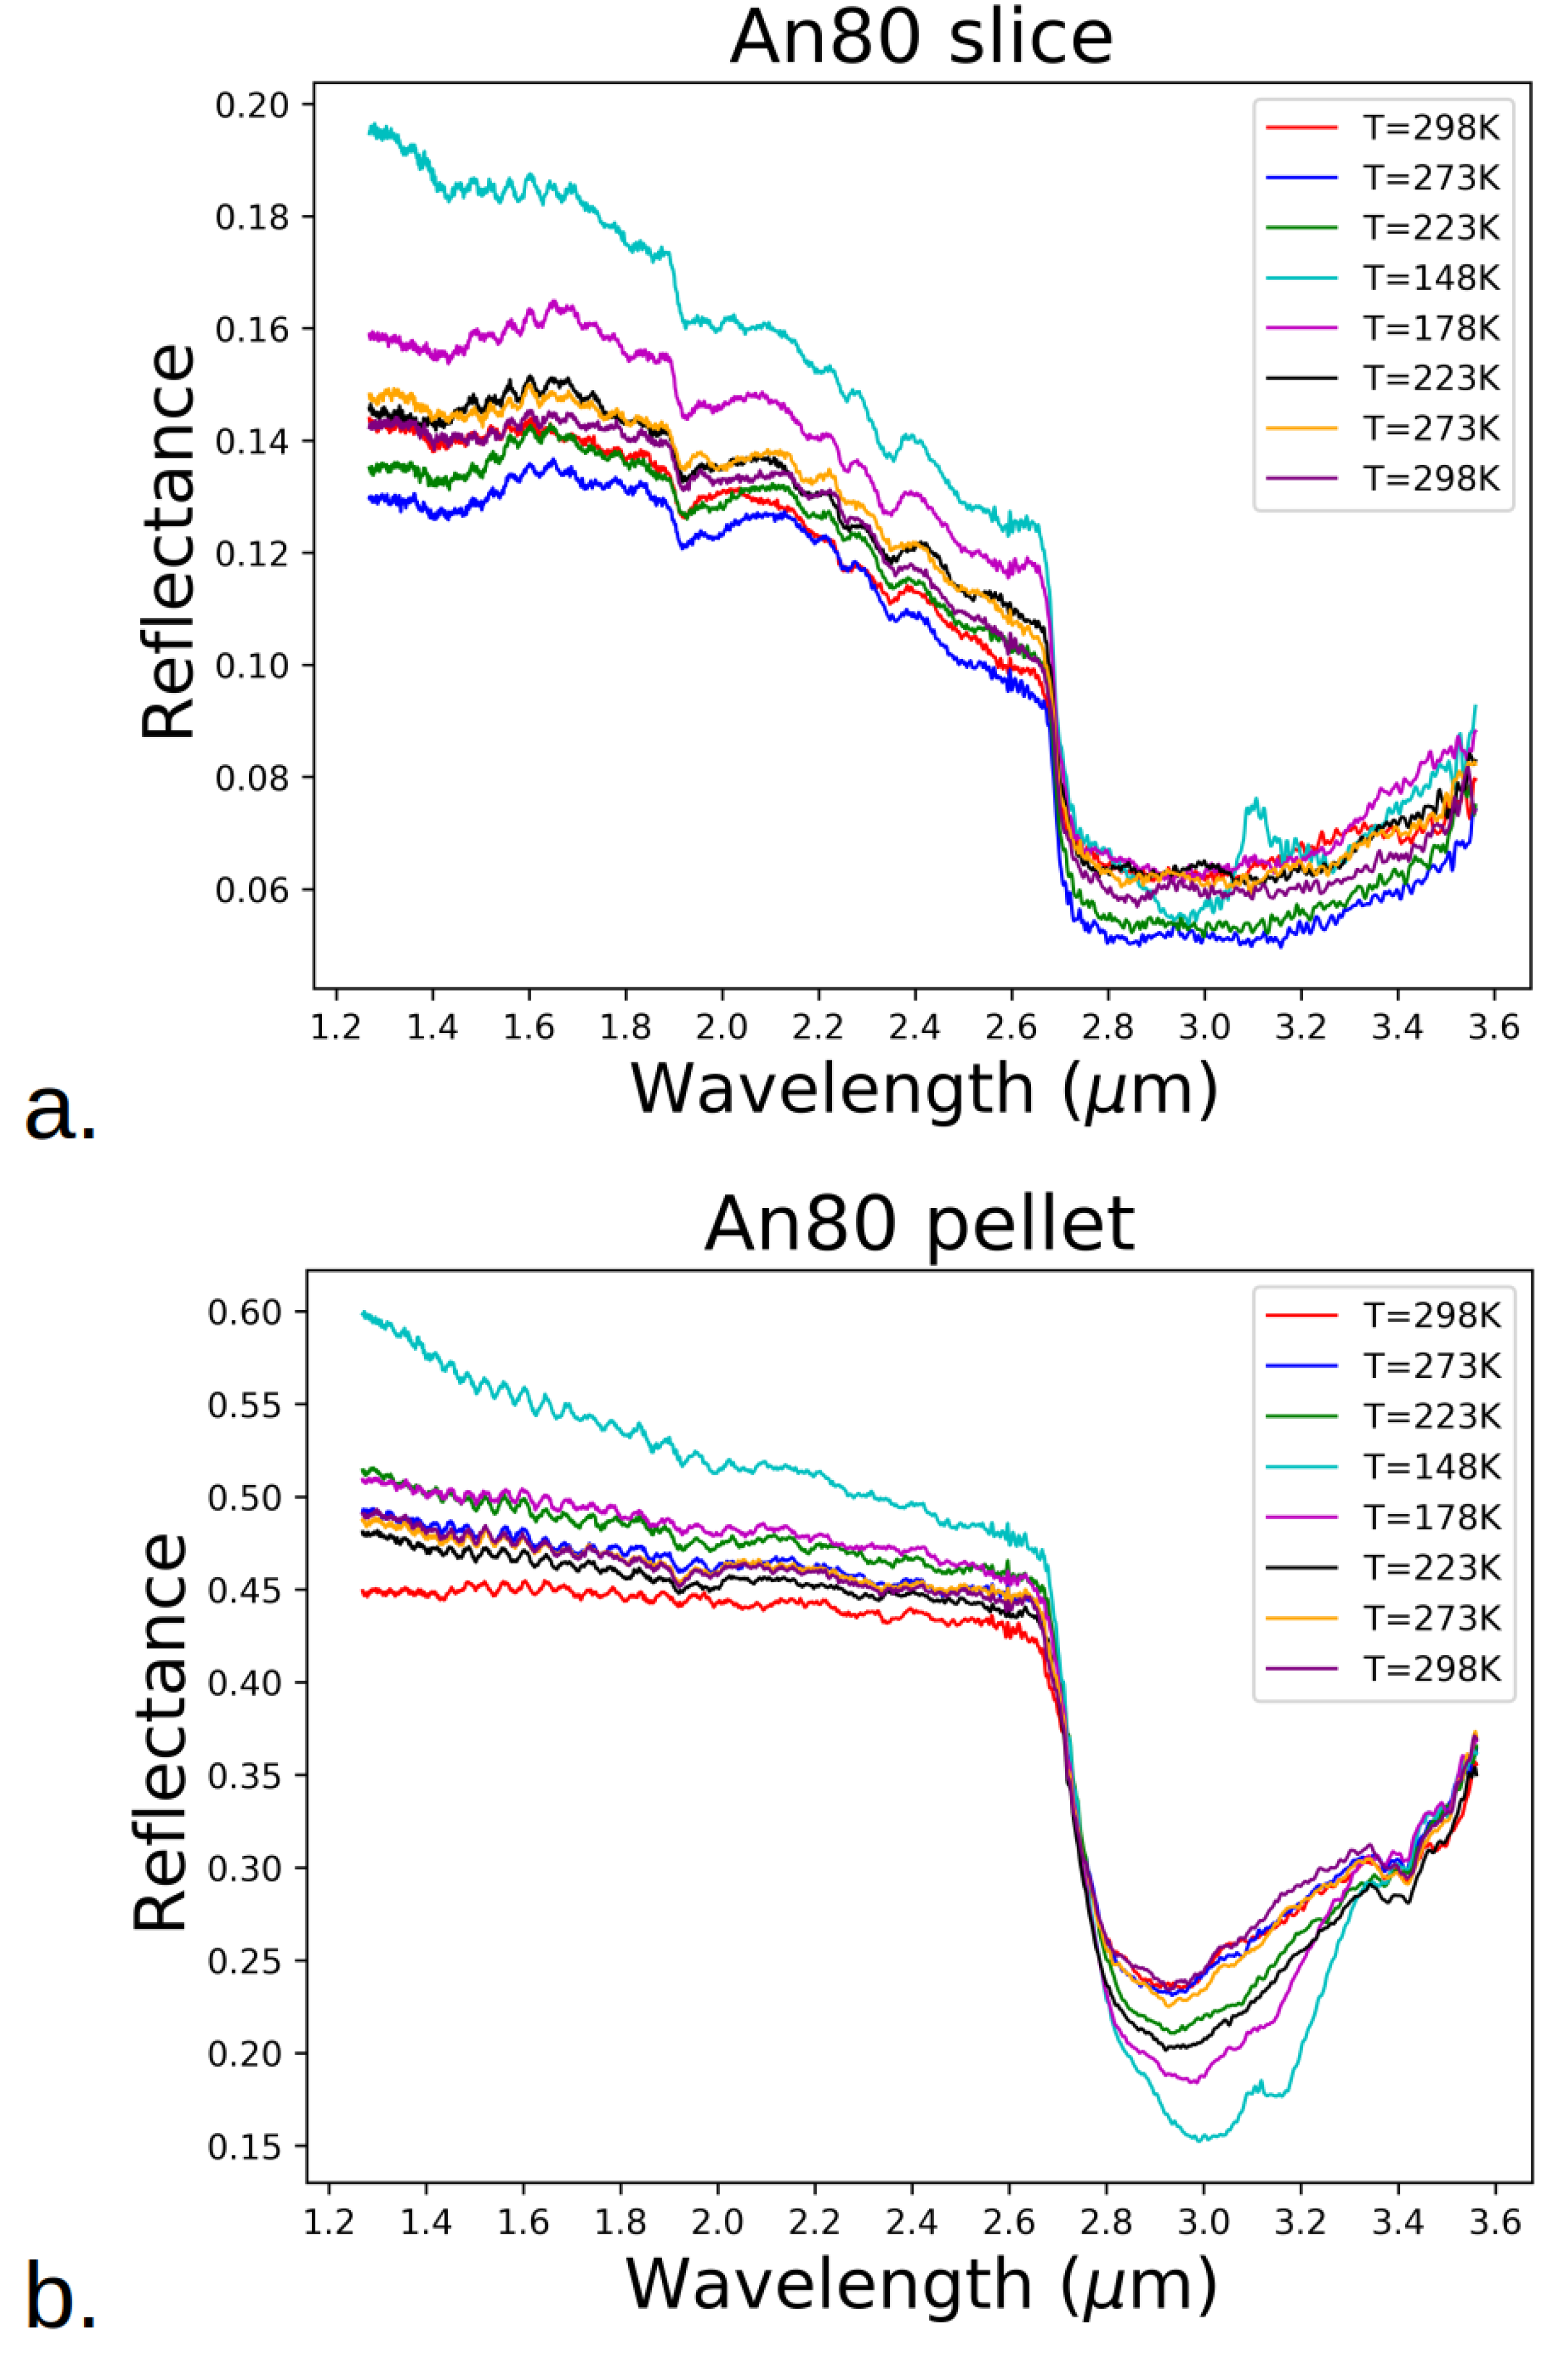
The NIR spectra of the plagioclase (pellet and slice) samples used for the cooling experiment are shown in Figure 7.
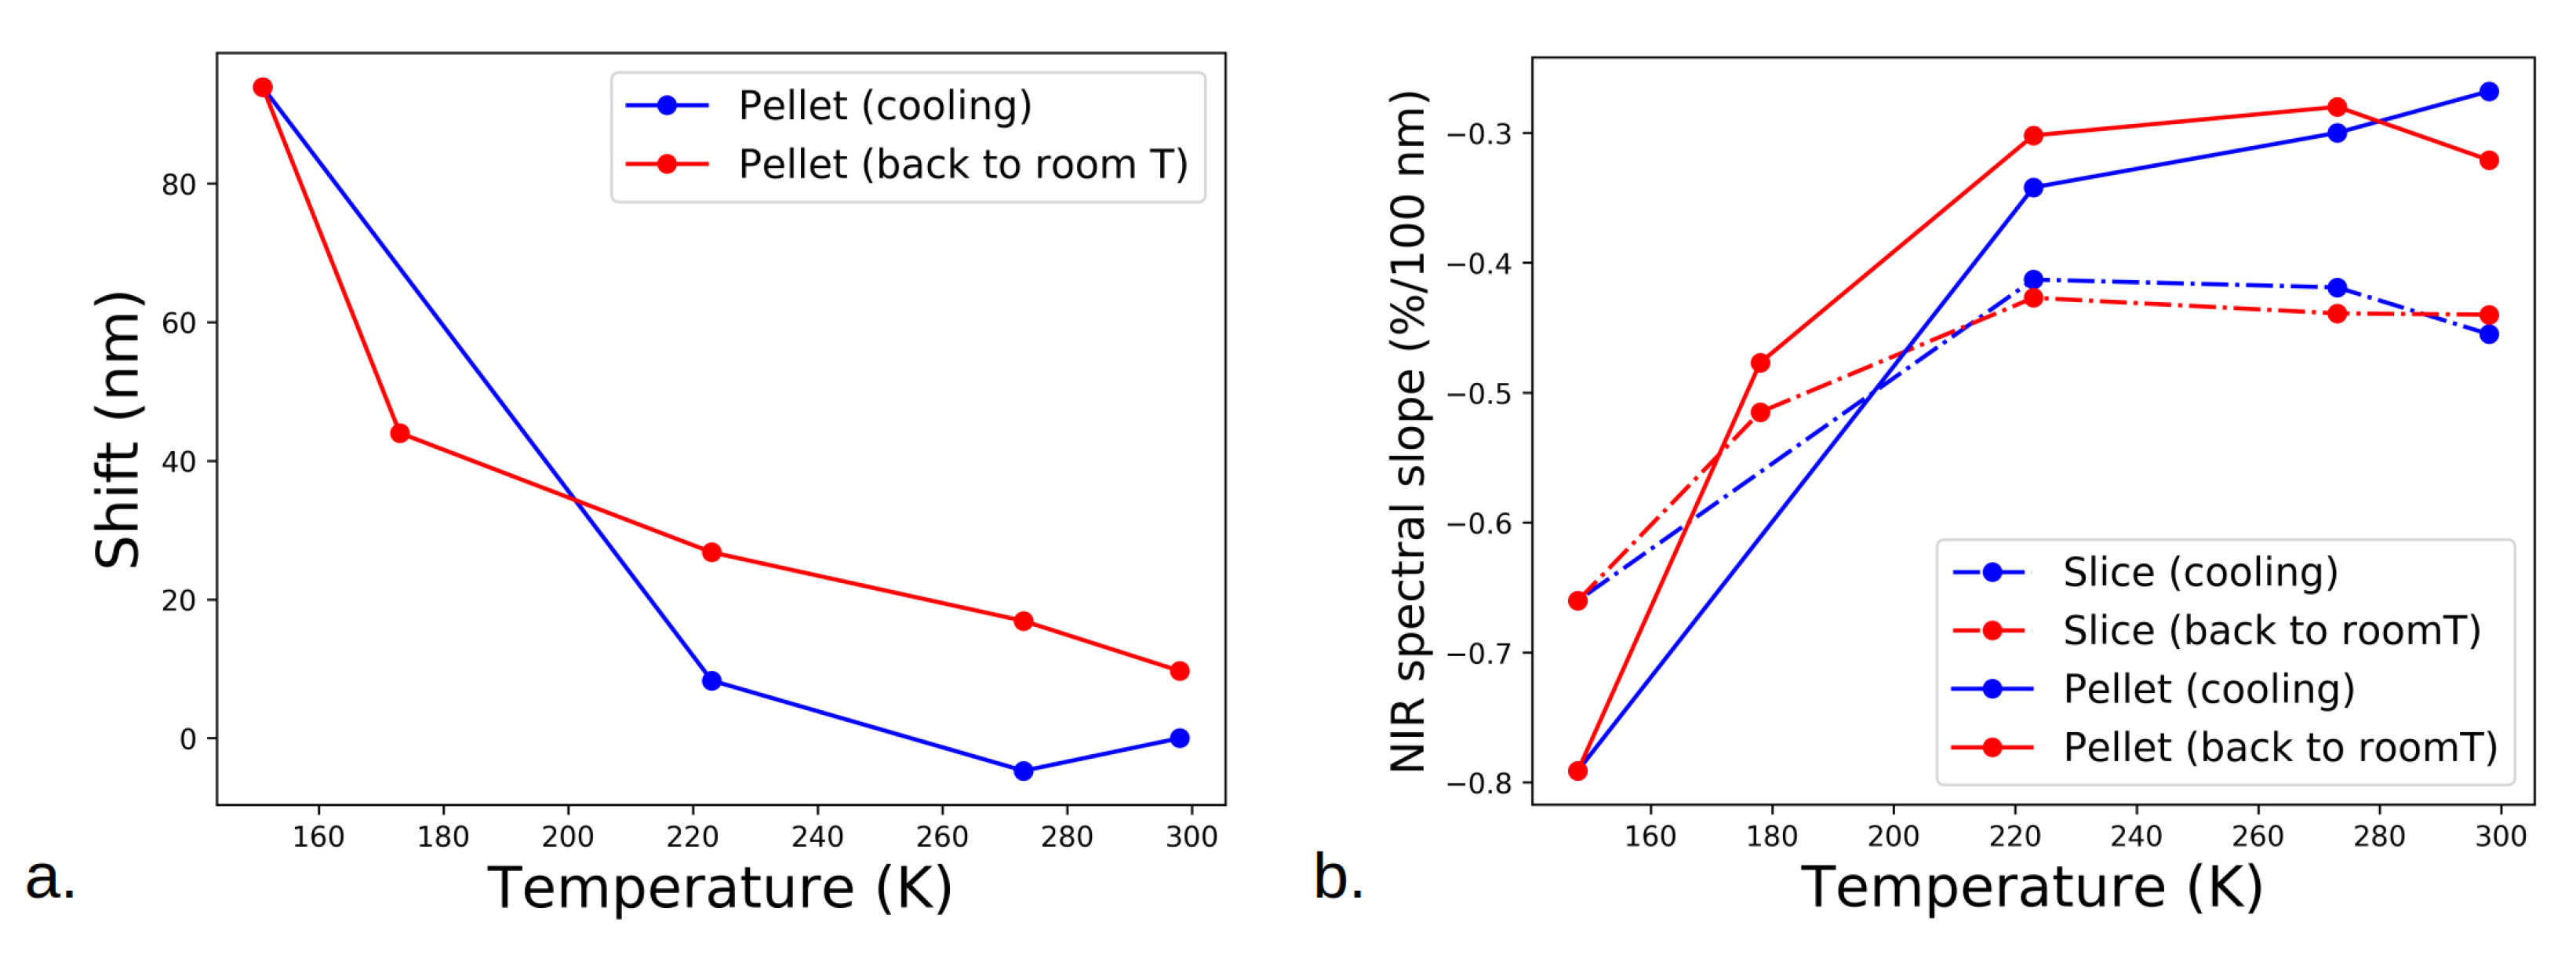
We determined the variations in the 3.0 μ m band position of plagioclase and the NIR spectral slope on the 1.7–2.6 μ m range. The results are presented in Figure 8a,b.
The band at 3.0 μ m shifts towards greater wavelengths when cooling the plagioclase pellet (see Figure 7b and Figure 8a). This behavior is clearly different from the heating experiment, for which no obvious band shift was observed at 3.0 μ m for the same sample (see Figure 3b). Moreover, the process seems reversible, unlike the process for the sample of volcanic glasses (see Figure 3d and Figure 6a). It is difficult to assess if such a band shift occurs for the slice of plagioclase due to its high width (see Figure 7a). Finally, a shallow band at 3.15 μ m appears at very low temperatures (∼178 K [∼−95 C]) and vanishes when returning to warmer temperatures for both plagioclase samples.
The NIR spectral slope tends to be bluer when cooling both plagioclase samples (see Figure 8b). The process is reversible and has a greater amplitude for the pellet than for the slice of plagioclase.

3.3. MIR Spectra

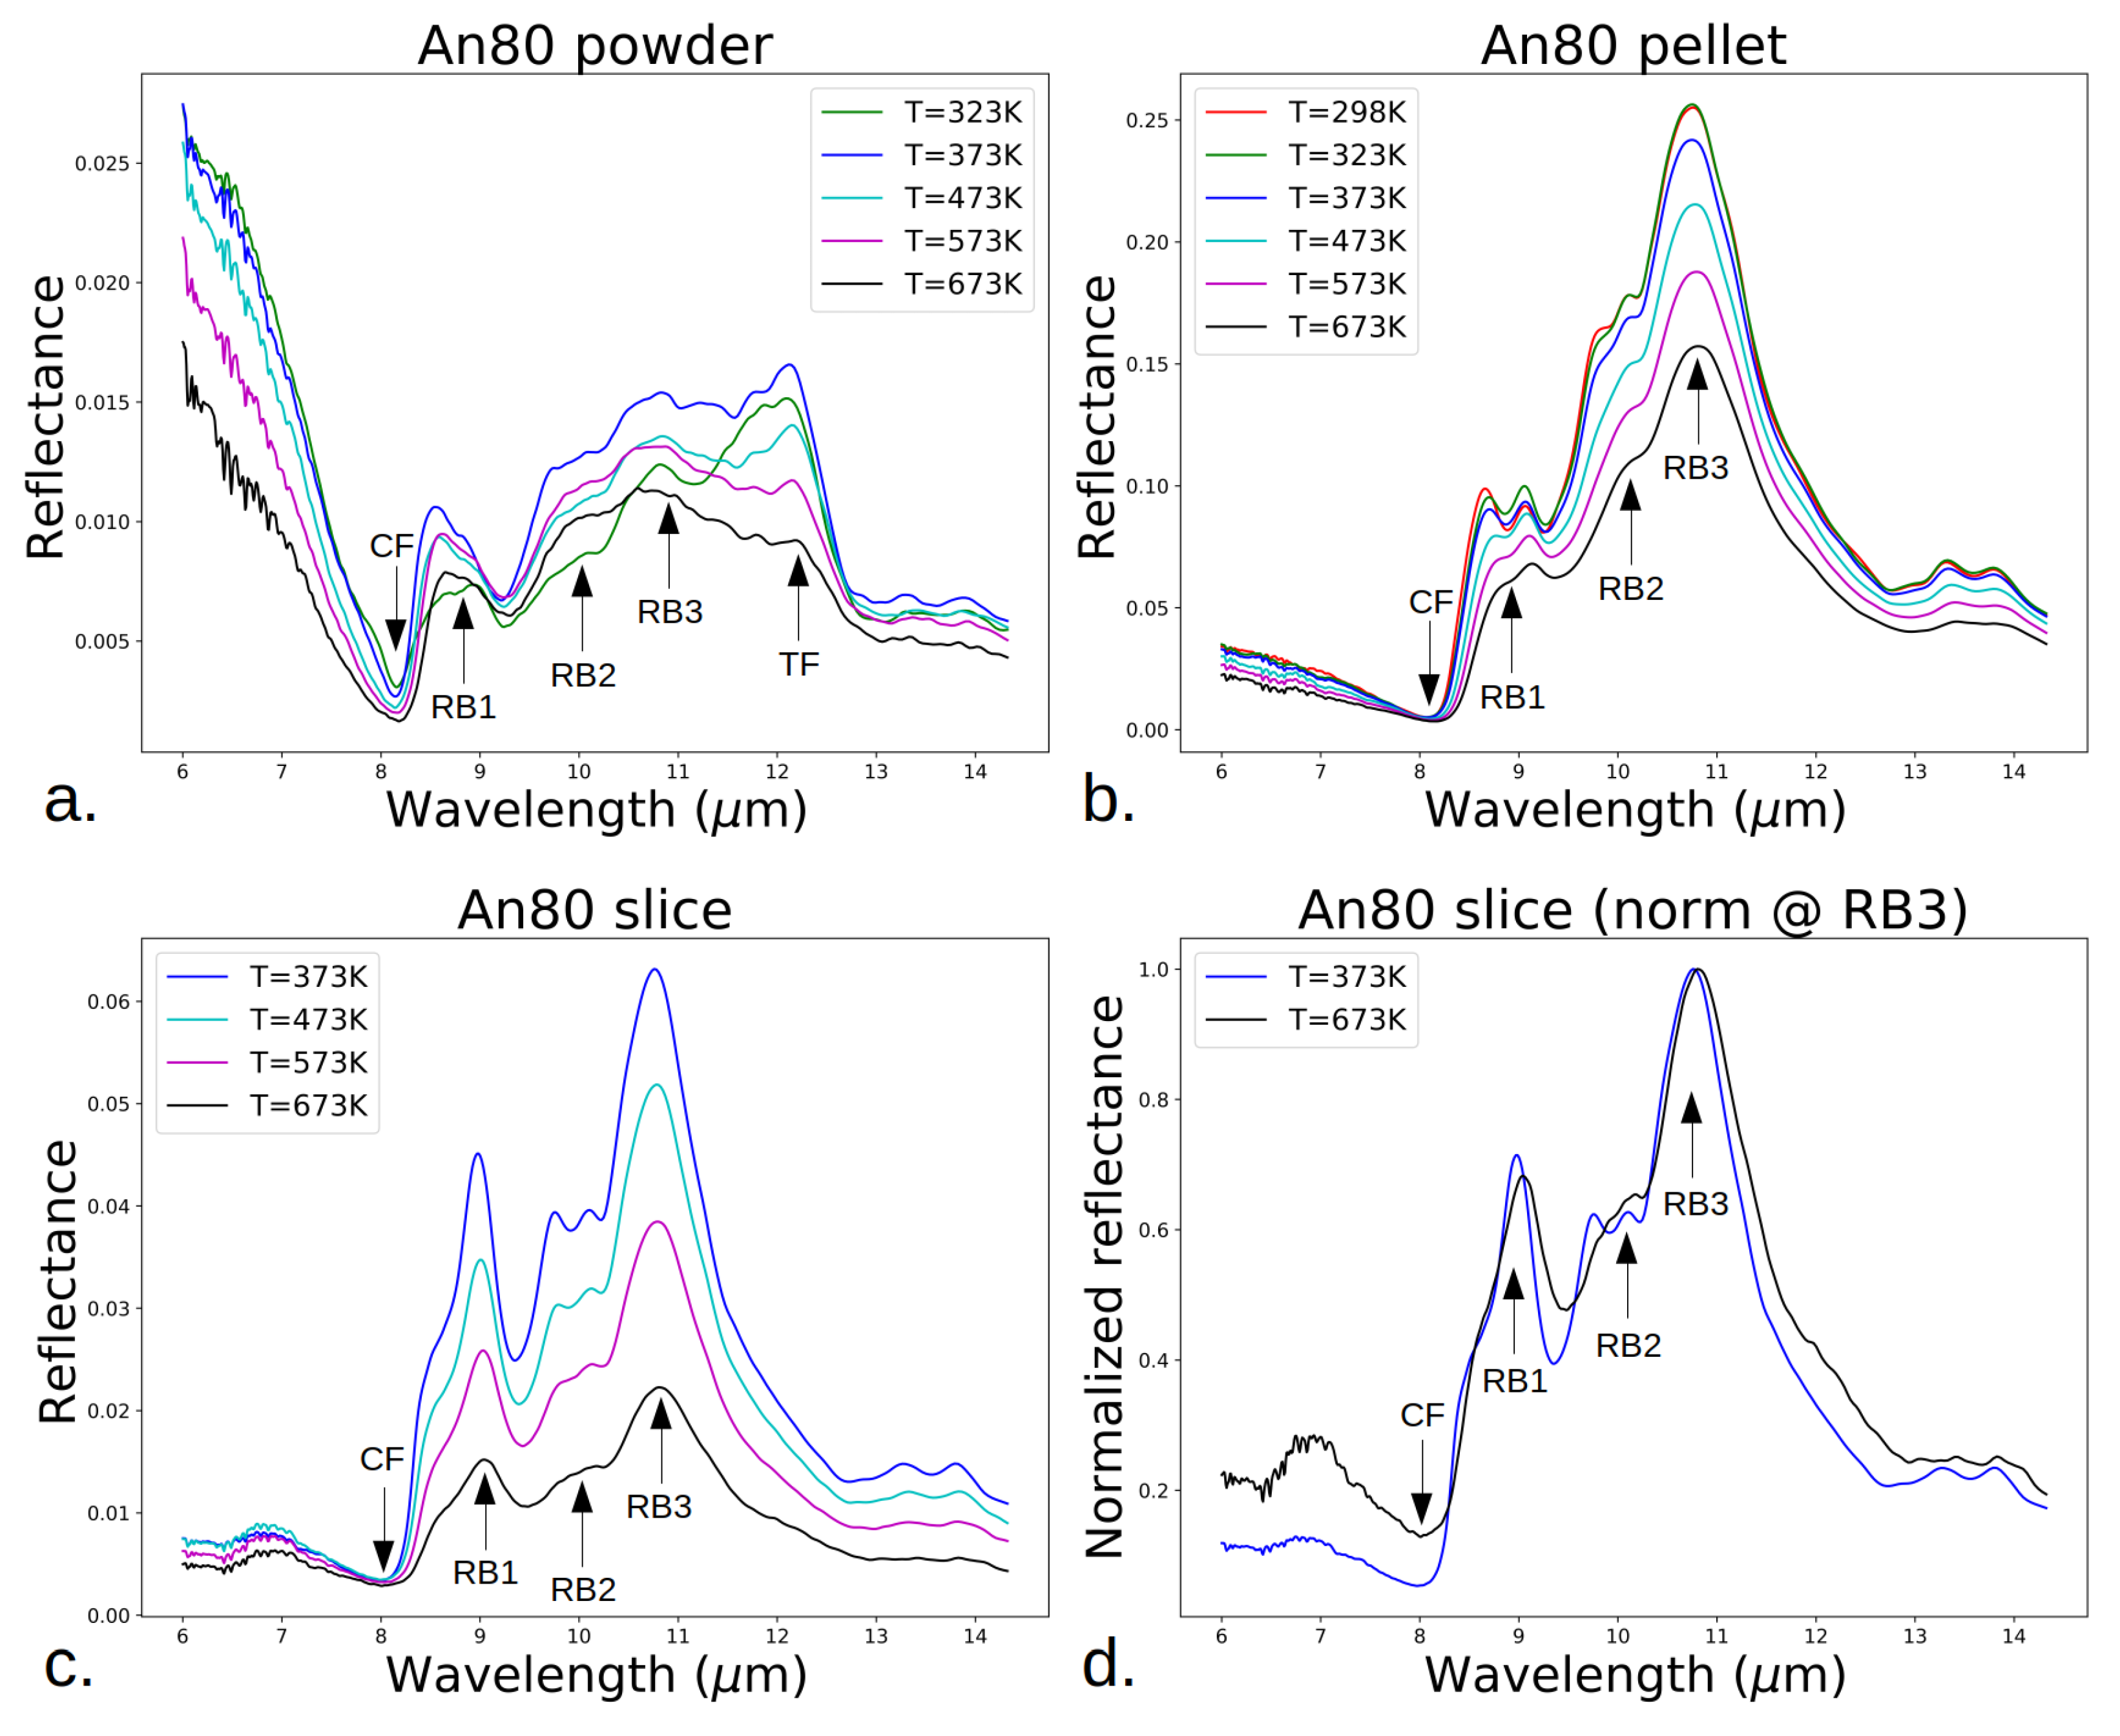
The MIR spectra of plagioclase samples and volcanic glasses are shown in Figure 9 and Figure 10.
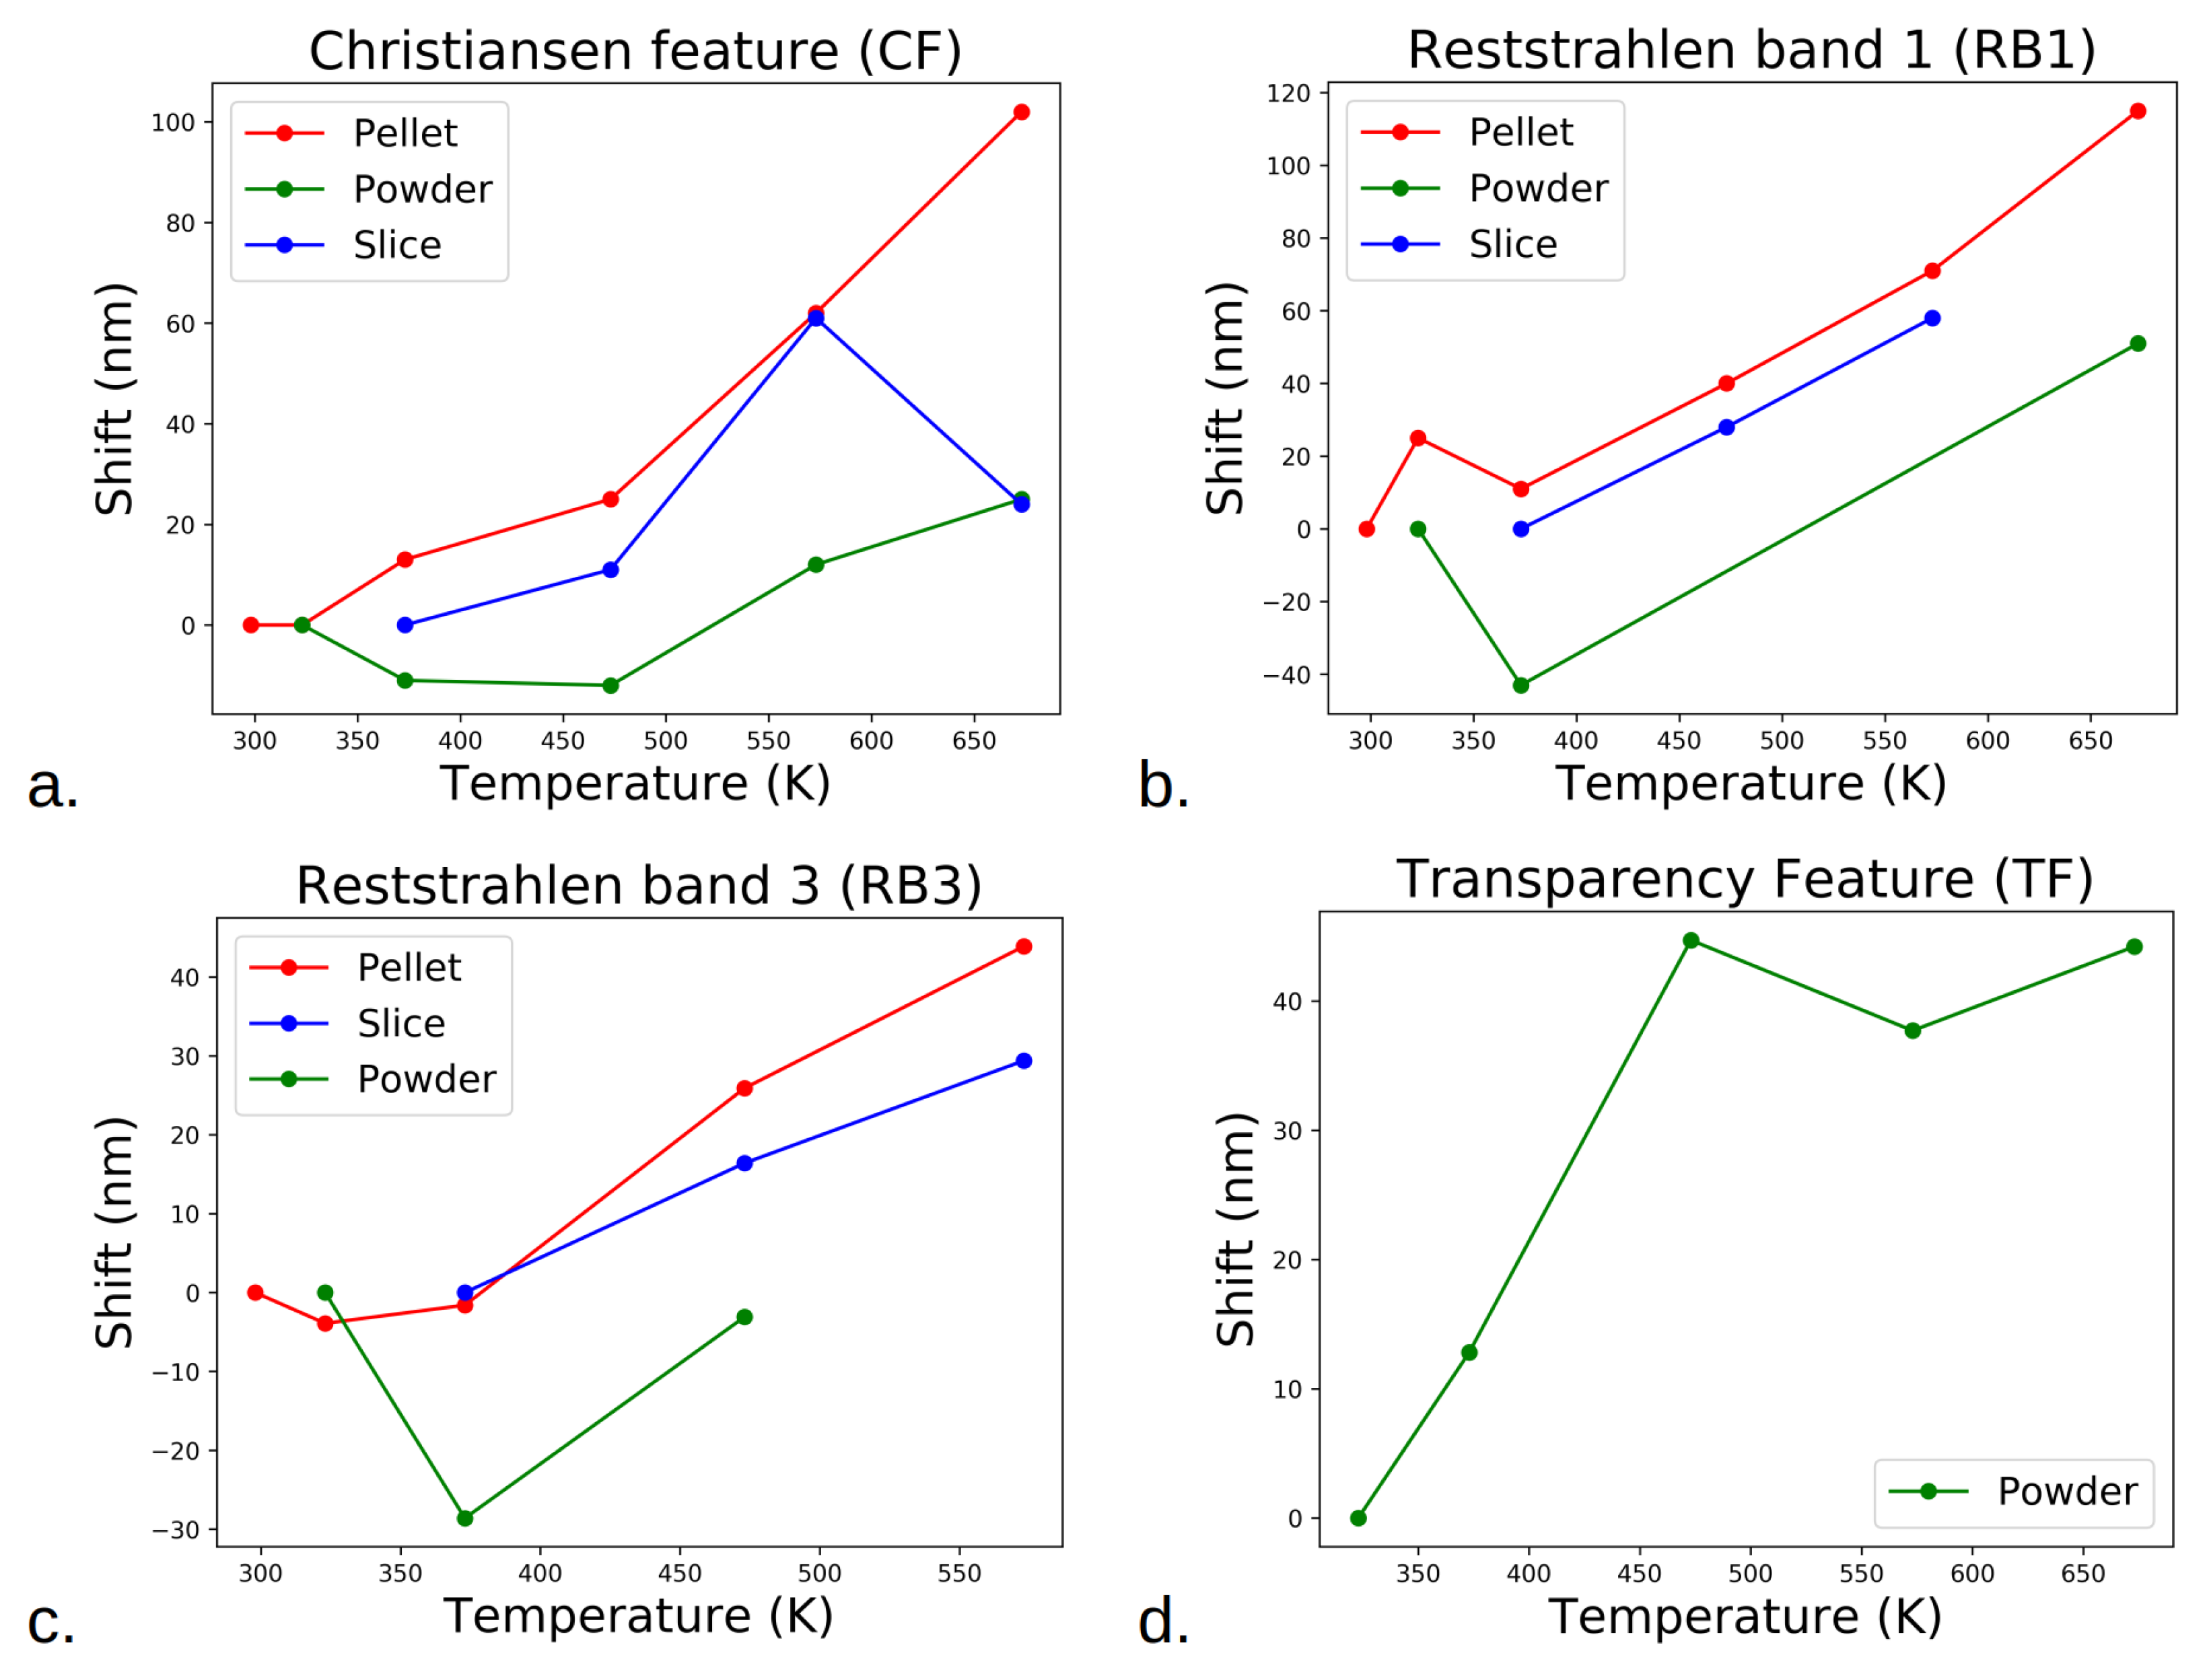
The MIR range (2.0–14.3 μ m in our case) is of high interest when studying the alterations in minerals, especially those containing silicates. Indeed, the Christiansen feature (CF) and the Reststrahlen bands (RB) provide important clues to their composition and structure [60,61,62]. RBs are fundamental molecular vibration bands caused by the stretching and bending motions of the Si-O bonds, as well as by lattice vibrations [62]. The CF is associated with the strongest (i.e., the principal) molecular vibration band and corresponds to a reflectance minimum. In this study, we focused on the CF and two RBs: one at ∼9.0 μ m, labeled RB1, and one at ∼10.5 μ m, labeled RB3 (RB2 at ∼10 μ m was not considered because of its low intensity). In the case of the powder, one can notice the presence of a transparency feature (TF) at around ∼12.1 μ m. This TF usually occurs due to the presence of fine material [63], which can explain its absence for the pellet and the slice. We determined the shift in the CF, RB1, and RB3 of plagioclase and in the single, broad band around 9.5 μ m of volcanic glasses, as well as the depth of the latter band. The results are presented in Figure 11, Figure 12 and Figure 13.
For the three plagioclase samples, we can observe a shift towards greater wavelengths for CF (∼8.0 μ m; see Figure 11a), RB1 (∼9.0 μ m; see Figure 11b) and RB3 (∼10.5 μ m, except for the powder; see Figure 11c) when heating. These variations are also evidenced by normalizing the spectra to the RB3 maximum (see Figure 9d). The TF (∼12.1 μ m) of the powder of plagioclase also shifts towards greater wavelengths with temperature (see Figure 11d). The broad band around 9.8 μ m of volcanic glasses has a local depth minimum at 423–473 K (see Figure 13b).
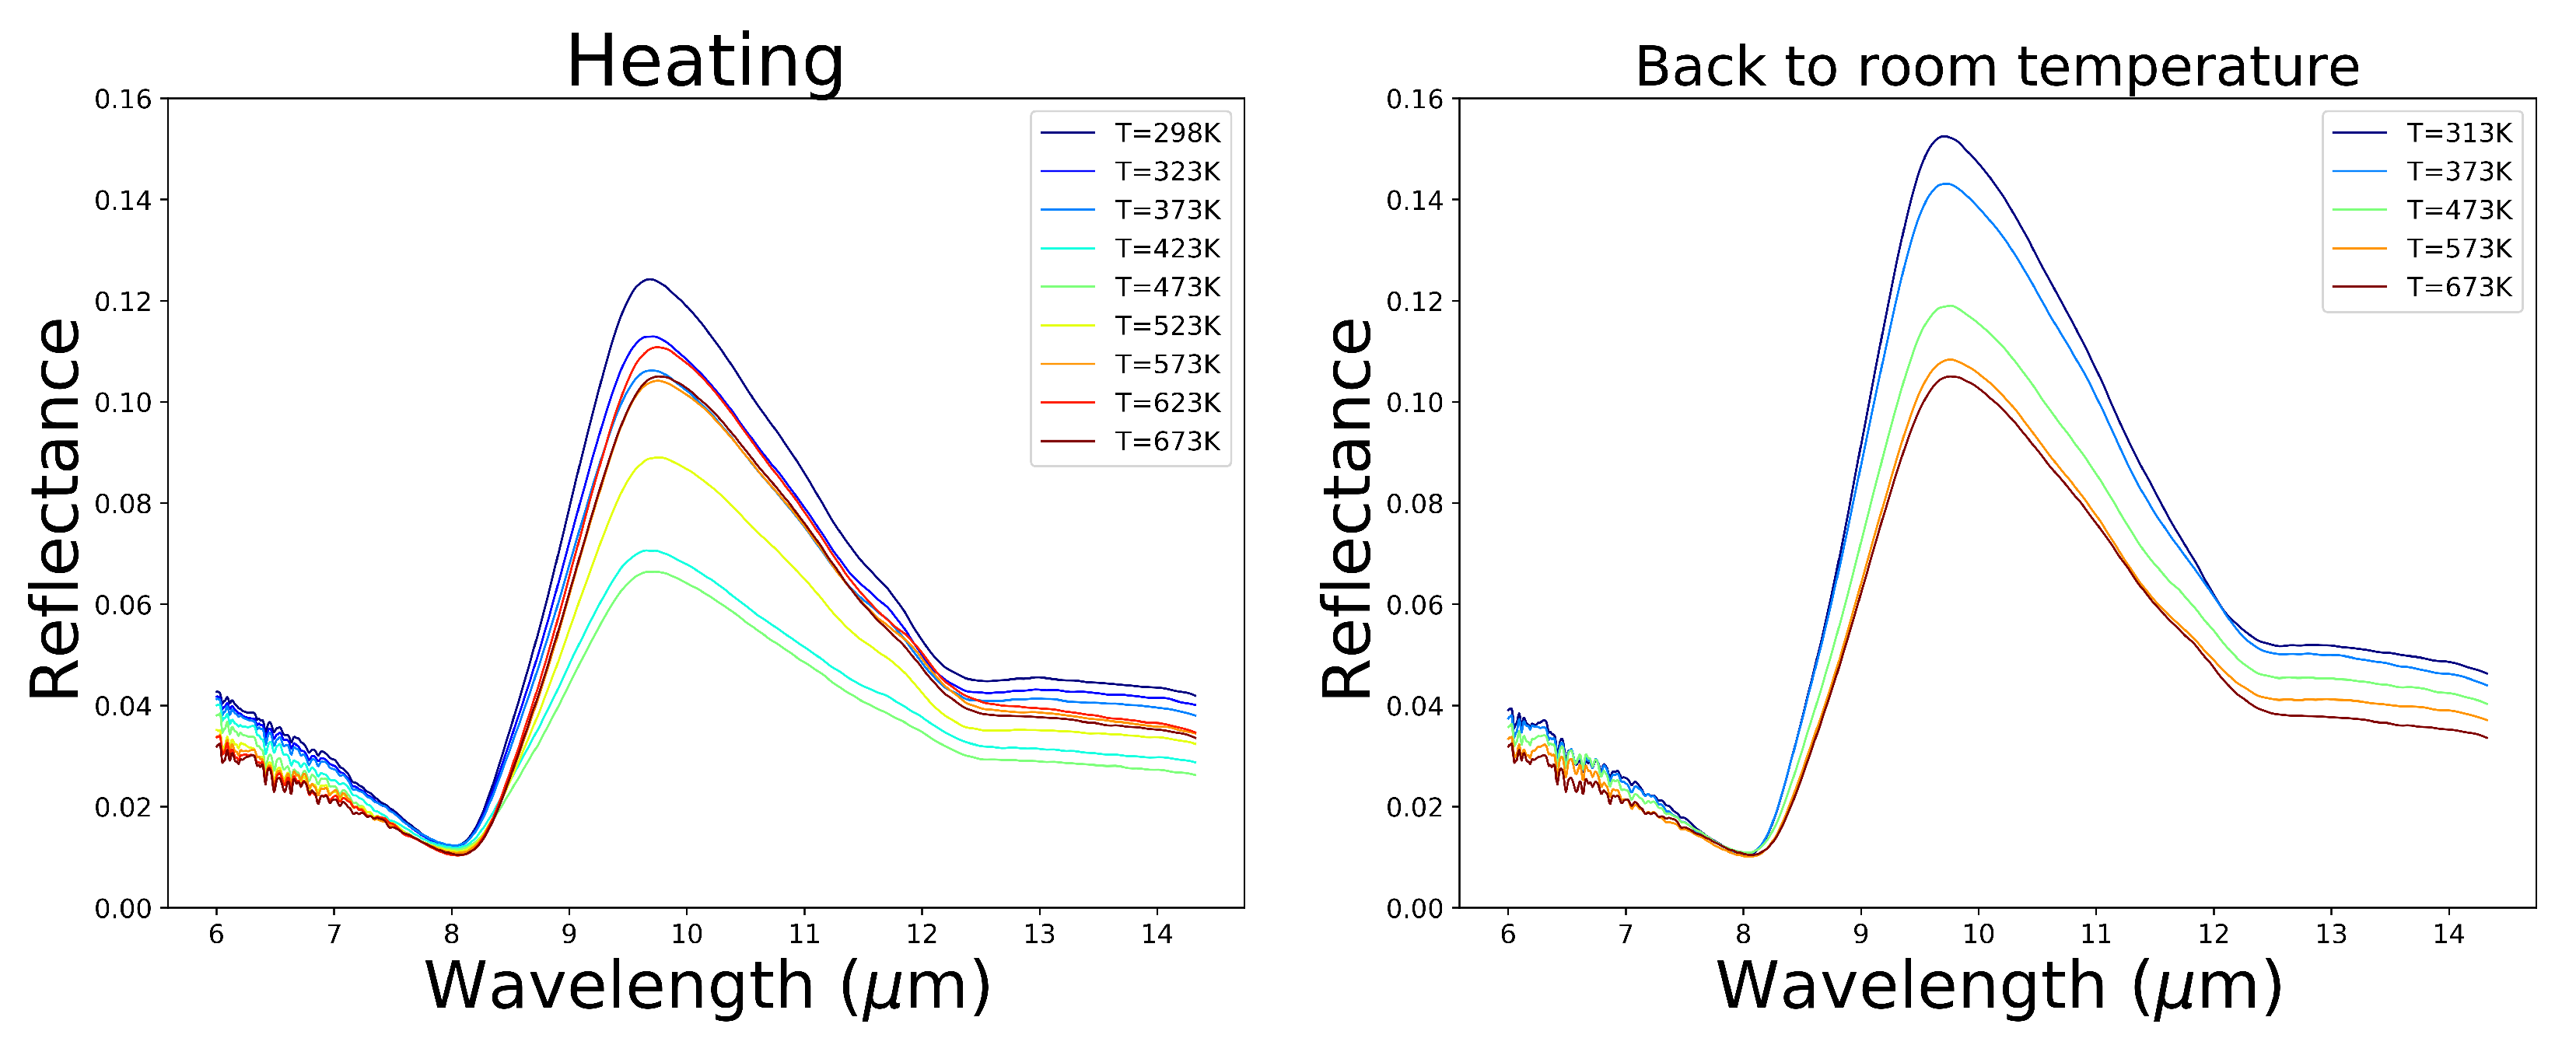
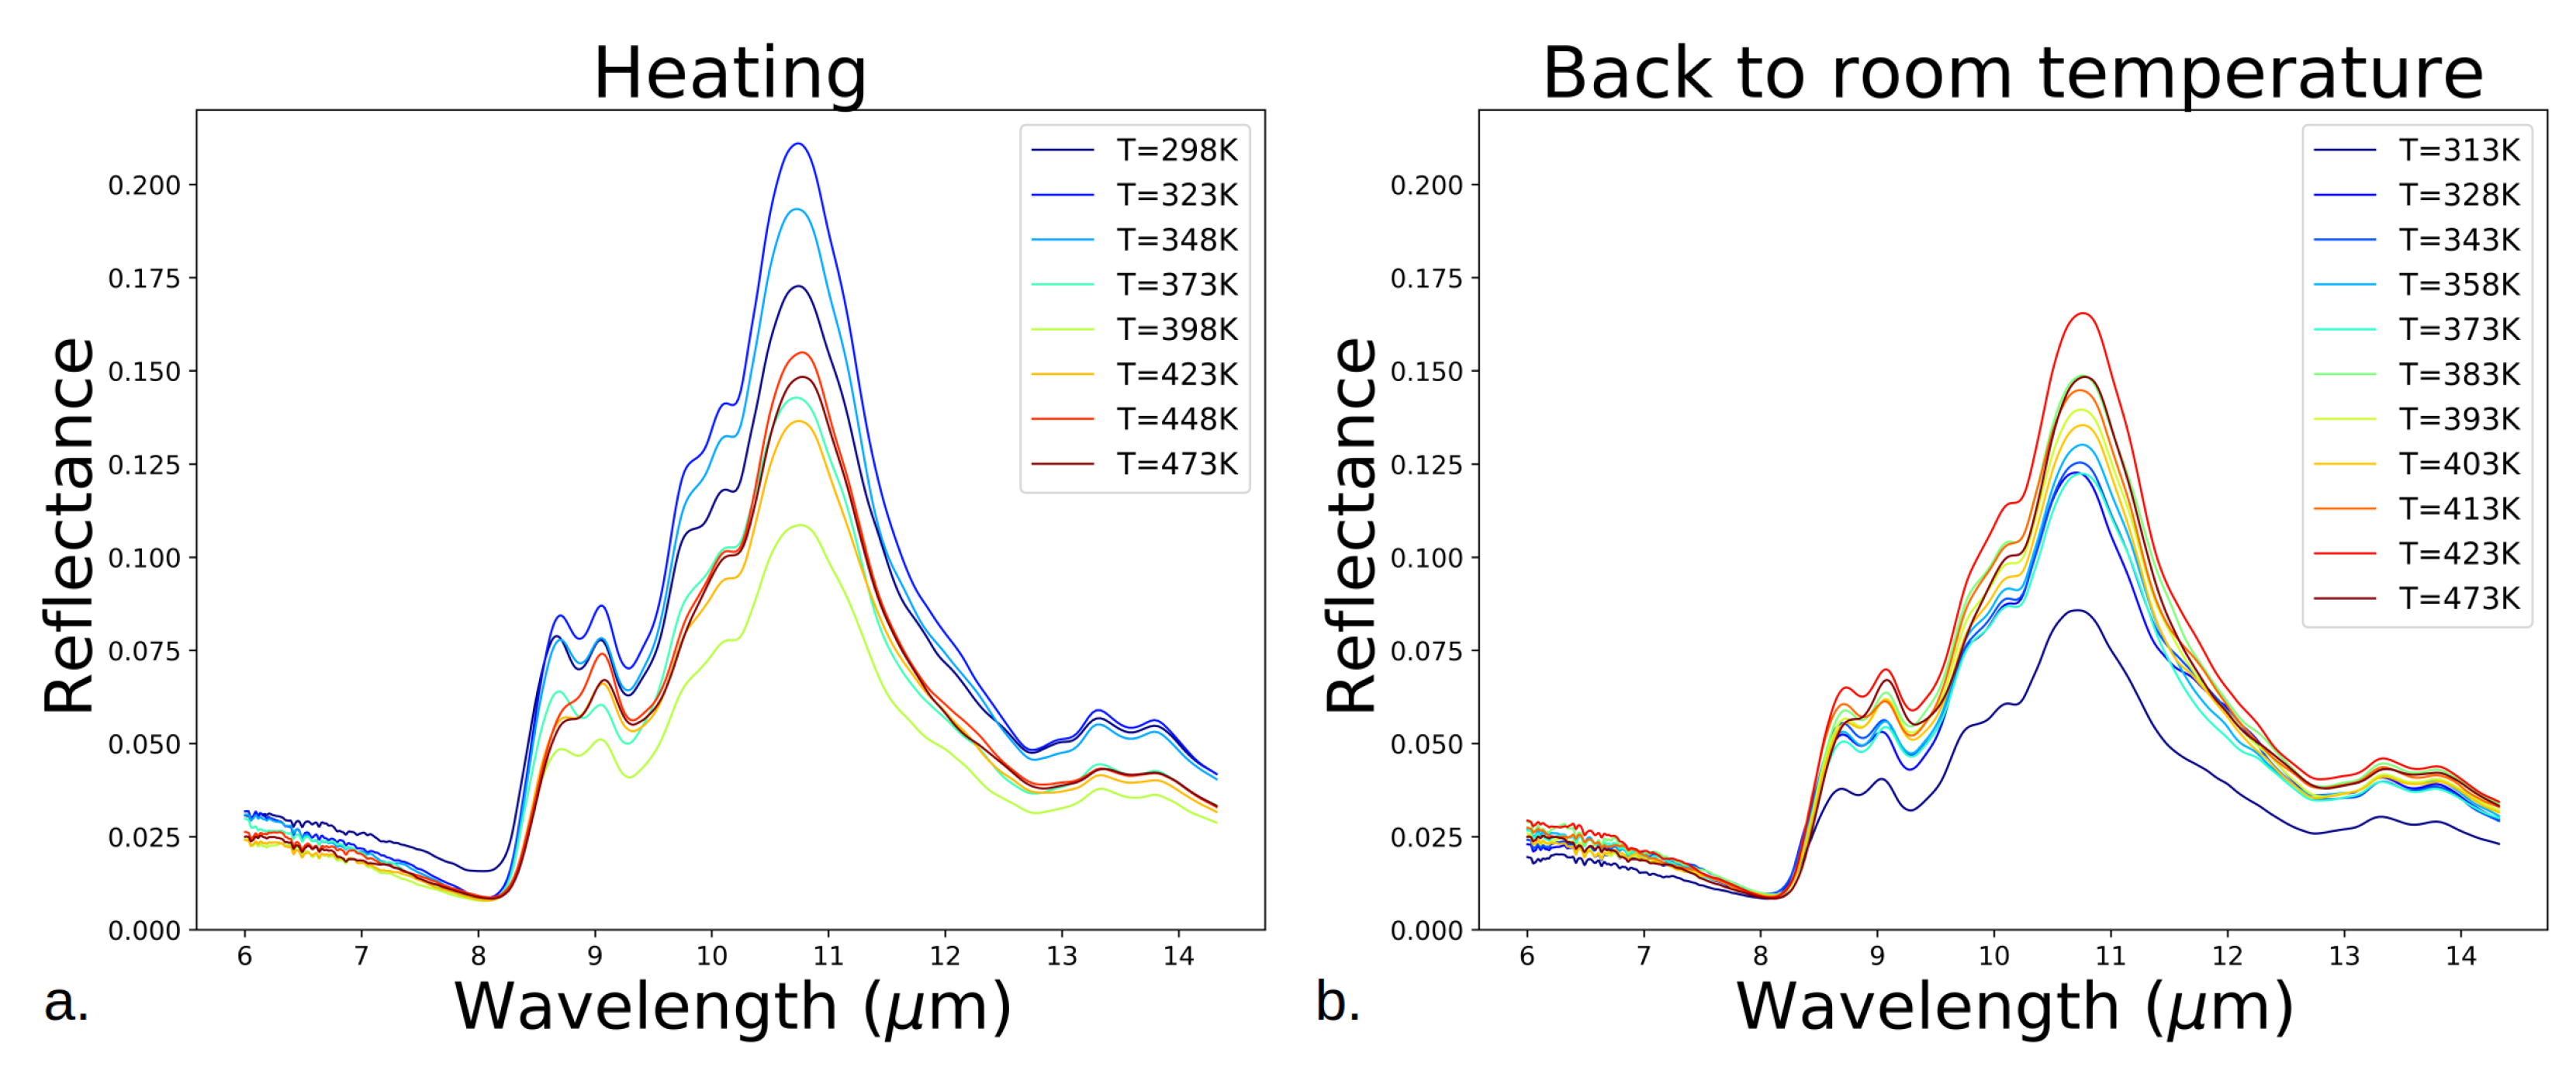
In addition, we noticed that the shape of RB1 changes when heating the pellet of plagioclase (see Figure 9b): the left component of this double band sharply changes in intensity, between 373 K (100 C) and 473 K (200 C). To more precisely determine the temperature at which the transition occurs, we conducted other measurements of the plagioclase pellet with a smaller heating step (one spectrum each 25 K when heating; one spectrum each 10–15 K when cooling to room temperature, see Figure 14);
From these measurements, we estimated the sharp change in the intensity of the left component of RB1 to occur between 398 K (125 C) and 423 K (150 C) when heating (see Figure 14a), but between 423 K and 473 K (200 C) when cooling the pellet of plagioclase (see Figure 14b). Both results are consistent with the initial experiment (see Figure 9b) but do not agree with each other. The different results that occur when heating and cooling to room temperature could be due to an issue with the thermalization of the sample. Indeed, as mentioned in Section 2.2, our protocol ensures that the samples are thermalized with an uncertainty of ∼10 K. However, the heating step decreased to 25 K when heating and 10 K when cooling to room temperature. Due to time limitations, we could not increase the plateau to improve the thermalization of the samples. However, we can expect the change in the shape of RB1 to occur at close to 423 K since this is the common temperature in both results. Lastly, it is interesting to observe that the level of reflectance is overall lower after the complete heating process.
The CF and the unique, broad band around 9.5 μ m of the volcanic glasses sample shift towards greater wavelengths when heating (see Figure 12 and Figure 13a). Both processes are very likely reversible, although the latter band depth is greater after a thermal cycle (see Figure 13b).

4. Discussion

4.1. Irreversible Changes in the VNIR

In the VNIR, we reported a difference between three spectral parameters (spectral slope on 0.5–0.8 μ m, ratio 1.0/0.8 μ m, reflectance at 0.5 μ m) of non-heated samples and heated samples (see Table 1, Table 2, Table 3 and Table 4), which we interpreted as an irreversible change. The spectral slope between 0.5 and 0.8 μ m is linked to the metal–oxygen (here, mainly Fe 2 + -O and Fe 3 + -O) charge transfer absorption bands around 0.2–0.3 μ m [64]. Thus, an increase in spectral slope on 0.5–0.8 μ m could be interpreted as a shift in these bands towards longer wavelengths, an effect which is observable in the VNIR spectra (see Figure 2) and can be caused by a change in the oxidation state of Fe [65]. However, we cannot exclude the contribution of the broad electronic absorption band, due to the dehydrogenation via the heating of organic contaminants in our samples, to the reddening of the VNIR spectra.
Indeed this band, although centered in the UV domain, has a wing in the VNIR, thus, inducing a steeper spectral slope (ref. [66]; see Section 4.2 for more details on the dehydrogenation of organics). Reddening as a result of iron oxides is very unlikely given the low Fe content of our samples (see Section 2.1). The ratio between 1.0 μ m and 0.8 μ m is related to the broad absorption band of plagioclase, at around 1.3 μ m. The increase in this parameter is detected for all plagioclase samples and could result from a narrower/shallower band due to heating.
Interestingly, the heated pellet of plagioclase is slightly darker than the fresh pellet of plagioclase in both the VNIR and the MIR, while the opposite is seen for the pellet of volcanic glasses. Both observations seem to strengthen the inner spectral properties of Mercury’s surface, i.e., the heating would contribute to the surface darkening, except in the NVP, where the different composition and structure (amorphous) of the glasses would slightly brighten the surface, thus, increasing the contrast between these two parts of the surface.
The case of the plagioclase powder is harder to explain. One possible explanation could be the variation in the total area of shadows caused by the large analytical spot (600 μ m) on the irregular surface of the powder. However, this would better explain the variations in reflectance of the spectra than their variations in the spectral slope. The spectral slope was demonstrated to be very sensitive to illumination conditions. This is notably illustrated by phase reddening (increasing spectral slope with increasing phase angle), a well-known effect that occurs at the surface of airless bodies. This was observed and simulated in laboratory [67] and was also observed at the surface of asteroids [68,69], comets [70,71] and, crucially, Mercury [72]. Since powder has an irregular surface shape (at least more irregular than the pellet and the slice; see Figure 1), the light can span a broader range of phase angles; this could explain the relative inconsistency with the other plagioclase samples. Thus, beyond presenting the possibility of directly comparing plagioclase and volcanic glasses, in our case, pellet samples seem to be more reliable in extrapolating the effects of temperature on minerals to Mercury’s surface, as in the above. Although significant, the rather low intensity of the irreversible changes observed in the VNIR may be attributed to the limited heating treatment (a few heating cycles of some hours) compared to what the surface of Mercury underwent during its history.
Early studies of the crystal structure of plagioclase led to the conclusion that the thermal history of a sample, as well as its composition and texture, have to be cautiously considered when analyzing the spectra of such minerals (e.g., [73]). Finally, irreversible alterations in VNIR properties (reddening, decrease in band depth, band shift) were also reported for carbonaceous meteorites [65,74]. Here, we showed that these irreversible changes are also detectable in the VNIR range, which is of particular interest for the future observations of SIMBIO-SYS [46] onboard BepiColombo.

4.2. Changes in the NIR as Proxy for Polar Volatile Materials

The broad band around 3.0 μ m observed in the spectra of volcanic glasses has several components associated with various absorptions due to the water adsorbed on or trapped inside the glasses [58]. It is relevant to study this interaction between water and glasses, despite the very high overall temperatures reached on Mercury, since water is very likely to be present, especially on the floor of PSR at the poles [75], but also, potentially, at lower latitudes [76]. On the Moon, similar cold traps are expected to occur more widely around the poles [77], and these features were recently proposed to be due to surface roughness [78]. Some parts of the broad band, around 3.0 μ m, were eliminated when the volcanic glasses were heated: the 2.9–3.2 μ m range seems to be the most affected by heating. In this spectral range, the band is flattened, mimicking a shift towards shorter wavelengths. An explanation for this could be that the 2.9–3.2 μ m range corresponds to the OH stretching vibrations of molecular water adsorbed on the glass and trapped in the crystal lattice [78,79,80]; these species are sensitive to heating because they are not (strongly) bonded, whereas the 2.7–2.9 μ m range would be caused by the OH stretching of silanol [80,81,82], as these hydroxyl groups are bonded to the silicate group. A similar effect was observed for the 2.7 μ m hydration feature of carbonaceous chondrites [74,83]. Interestingly, the spectral variations in the 3.0 μ m band are completely different for plagioclase: no shift occurred when heating and a reversible shift occurred towards greater wavelengths when reaching very low temperatures. These observations may be explained by the lower adsorption efficiency of molecular water to plagioclase than to volcanic glasses (greater areal density of Si–OH groups on an amorphous surface [84]), and by the slight formation of water ice deposit (estimated thickness ∼0.40 μ m for the pellet, ∼0.24 μ m for the slice; see Appendix C for the computation method) on the samples during the cooling experiment. The thicker water ice deposit for the pellet may also explain its greater amplitude of variation in NIR spectral slope compared to the slice; the ice deposit would smooth the sample surface, acting like a mirror [85].
The absorption band at 3.4 μ m is caused by the stretching of C–H bonds due to the presence of carbonaceous contaminant (amorphous carbon) in our samples. We interpreted the evolution of the depth of this band due to heating (increase between 373 K [100 C] and 573 K [300 C]; abrupt decrease at 673 K [400 C]; see Figure 3d) by breaking C-H bonds between 573 K and 673 K, leading to the release of hydrogens, which combined into the escaping H 2 and to the unsaturation (even the aromatization) of carbon. Indeed, the energetics of the thermal processes leading to hydrogen loss and aromatization in hydrogenated amorphous carbon (HAC) materials were considered in detail in previous studies ([86,87] and references therein). The principal stages in HAC thermal evolution for temperatures ≥600 K (≥327 C) can be summarized as follows:
1.
600–700 K (327–427 C): a loss of H, a decrease in the C atom sp3/sp2 ratio, and a closing of the band gap;
2.
700–800 K (427–527 C): the formation of aromatic clusters with sizes of the order of 1–2 nm, with dangling bonds on their edges;
3.
>1200 K (>927 C): growth of the aromatic clusters, their alignment, and the eventual graphitization of the solid.
Thus, heating could contribute to the formation of unsaturated carbon and macromolecular organic compounds expected in the low-reflectance polar deposits of Mercury [88], implying possibly ongoing endogenic surface activity, even at the poles.

4.3. Changes in the MIR and Implications for BepiColombo

The change in the shape of RB1 (∼9.0 μ m) when heating may be caused by the grains’ dilatation [39] reduces sample porosity and slightly increases their spectral contrast [89]. However, based on the data available in the literature [6], our plagioclase samples should experience a thermal expansion of 1.65 × 10 5 K 1 , which is about two times less important than that which occurred for olivine [39]. Thus, the effect of grain dilatation on porosity reduction should be less important. Another factor in the change in the shape of RB1 could be the splitting of transverse optic–longitudinal optic (TO–LO) modes occurring in the MIR [90]. Both arguments are in agreement with the reversible nature of this effect. As in our case, a reversible shift in the MIR for the Reststrahlen bands of olivine was also observed [39], and these observations were explained by the fact that the crystal lattice dilatation due to heating mimics a higher Fe content, based on the previous results [91] (Figure 6). Moreover, the shift of the CF towards longer wavelengths and the unique RB within a collection of synthetic volcanic glasses was attributed to an increase in Mg content (and, thus, a decrease in SiO 2 content) [92]. Our study and the aforementioned studies confirm that the measurements of Mercury surface temperature will be crucial to correctly interpret the NIR spectra taken by SIMBIO-SYS/VIHI and the MIR spectra acquired by MERTIS. For this purpose, a thermal model to produce temperature maps was recently developed and tested on MESSENGER data [1]. In addition, to discriminate between a band shift caused by a variation in temperature and a band shift caused by a variation in composition, we propose that MERTIS data can also be crosschecked with the SIMBIO-SYS/VIHI data acquired at various surface temperatures; thus, taking advantage of the irreversible effects of heating on the spectral parameters of minerals in the visible spectral domain.
The BepiColombo spacecraft was launched on 19 October 2018 with a complete set of instruments for studying Mercury’s surface composition. Two of these will be crucial: VIHI, the hyperspectral imager channel of SIMBIO-SYS [46], which will acquire data in the visible-near infrared spectral range (VNIR, 0.4–2.0 μ m) at a high spectral resolution (6.25 nm), and MERTIS [47], a thermal infrared spectrometer, which will take spectra in the 7–14 μ m spectral range at a reasonable spectral resolution (up to 90 nm). In the VNIR, the absorption band of primary interest is the one at 1.3 μ m: its depth at 623 K is approximately half its value at room temperature. The VNIR spectral slope (0.5–0.8 μ m) and the ratio of reflectance 1.0 μ m/0.8 μ m are also good indicators of variations in 0.2–0.3 μ m and 1.3 μ m absorption bands, respectively, and are worth observing. In the MIR, CF (∼8 μ m), RB1 (∼9 μ m), and RB3 (∼10.5 μ m) are the critical absorption bands, with total variations in peak position from several tens of nm to ∼100 nm. These values are close to the ones obtained in previous works (e.g., [39]), although these were obtained at temperatures different from our experiments (352–773 K). It is also interesting to mention that the CF of shocked olivine shifts of 200 nm towards greater wavelengths [93], which is in the same order as our results. Thus, our measurements evidence that both instruments will be able to detect the spectral variations mentioned in previous sections, even if the best MERTIS performances will be needed to achieve this goal [93]. However, since space weathering also produces shifts in MIR spectral bands of the order of several tens to hundreds of nm towards greater wavelengths [85,94,95], the resulting total band shift may be even more important, especially for RB3, for which band shifts are much more important (several hundreds of nm for ion irradiation, several tens of nm for heating).
Based on the above discussion, we selected spectral parameters of interest to help analyze the upcoming SIMBIO-SYS and MERTIS data. These parameters, along with the effect that heating has on them, are presented in Table 5.

5. Conclusions

In this study, we performed heating and cooling experiments on mineral analogs relevant to the surface of Mercury. We considered plagioclase and volcanic glasses as good first-order analogs for the global surface of the planet and the Northern Volcanic Plains (NVP), respectively, following mineralogy modeling [22,24]. We collected visible reflectance spectra before and after heating, in addition to infrared reflectance spectra during a heating/cooling cycle, which allowed us to analyze the evolution of the spectral properties of our samples.
Irreversible changes in the spectral slope (reddening) and of the reflectance (darkening or brightening) were observed in the visible, similarly to heated carbonaceous meteorites [65,74]. We suggest that these changes, especially the increased visible spectral slope, are associated with an oxidation of the sample induced by heating [65]. The repeated heating cycles Mercury has undergone in its history could, thus, have quite significantly contributed to the reddening of its surface, as well as its darkening, in the visible spectral range. Future measurements of our samples after multiple thermal cycles could help to determine if additional alterations occurred due to heating. In addition, it is interesting to note that such irreversible changes in the visible part of the spectra, induced by heating, can help discriminate between thermal and compositional effects in the VNIR spectra of Mercury.
In the thermal infrared, however, the spectral modifications (e.g., band shift in Reststrahlen bands) are mainly reversible; therefore, they can be associated with the dilatation of the crystal lattice due to heating, or, more globally, by its volume change [39]. Finally, in the near-infrared, we observed the different components of the absorption band at ∼3 μ m, notably that the component associated with adsorbed water (2.9–3.2 μ m) [79,80,96] is much more sensible to heating than the component of structural water (2.7–2.9 μ m), providing constraints on the spectral properties of permanently shadowed regions.
We identified spectral parameters to support the interpretation of results from the SIMBIO-SYS [46] and MERTIS [47] instruments onboard the BepiColombo space mission, whose operations are planned to start in spring 2026.
Further works should explore synthetic mineral phases or rocks with suitable mineralogy and chemistry to enlarge the information that we can use to interpret the future SIMBIO-SYS or MERTIS data. In addition, Mercury’s surface is not only strongly heated during the day, but it is also severely altered by space weathering processes such as micrometeoroids’ bombardment and solar wind irradiation [4]. The effects of ion irradiation on various samples have already been studied (e.g., [94,95,97]), but never in association with heating. We aim to perform combined heating and irradiation experiments in the future.

Author Contributions

Conceptualization, N.B., R.B., A.D., Y.L., D.P. (Davide Perna) and F.P.; methodology, R.B., F.B. and C.S.; software, N.B.; validation, N.B. and R.B.; formal analysis, N.B.; investigation, N.B.; resources, R.B., C.C., G.S., M.S., F.V., D.P. (Diego Perugini), C.P., F.B. and C.S.; data curation, N.B.; writing—original draft preparation, N.B.; writing—review and editing, N.B., R.B., A.D., C.C., F.C., Y.L., D.P. (Davide Perna), F.P., G.S., M.S., F.V., D.P. (Diego Perugini), C.P., F.B. and C.S.; visualization, N.B.; supervision, R.B. and A.D.; project administration, R.B. and A.D.; funding acquisition, R.B., A.D. and F.C. All authors have read and agreed to the published version of the manuscript.

Funding

The MIR micro-spectroscopy measurements were supported by grants from Region Ile-de-France (DIM-ACAV) and SOLEIL. The VNIR measurements at IAS were supported by P2IO LabEx (ANR-10-LABX-0038) in the framework Investissements d’Avenir (ANR11-IDEX-0003-01). The APC was funded by the Centre National d’Etudes Spatiales (CNES).

Data Availability Statement

Our laboratory measurements can be obtained upon request.

Acknowledgments

We thank O. Mivumbi for the useful help in the preparation of the pellet samples at IAS. We are grateful to two anonymous reviewers for their detailed comments and suggestions, which significantly improved the manuscript.

Conflicts of Interest

The authors declare no conflict of interest. The funders had no role in the design of the study; in the collection, analyses, or interpretation of data; in the writing of the manuscript; or in the decision to publish the results.

Abbreviations

The following abbreviations are used in this manuscript:
CFChristiansen Feature
FTIRFourier-Transform Infrared
HACHydrogenated Amorphous Carbon
MERTISMercury Radiometer and Thermal Infrared Spectrometer
MESSENGERMercury Surface, Space Environment, Geochemistry and Ranging
MIRMid-Infrared
NIRNear-Infrared
NVPNorthern Volcanic Plains
PSRPermanently Shadowed Regions
RBReststrahlen Band
SIMBIO-SYSSpectrometer and Imaging for MPO BepiColombo Integrated Observatory SYStem
SMISSpectroscopie et Microscopie dans l’Infrarouge utilisant le Synchrotron
SOLEILSource Optimisée de Lumière d’Énergie Intermédiaire du LURE
USGSUnited States Geological Survey
VIHIVisible Infrared Hyperspectral Imager
VNIRVisible Near-Infrared
TFTransparency Feature
TIRThermal Infrared
XRSX-Ray Spectrometer

Appendix A

Identification of Plagioclase Spectra
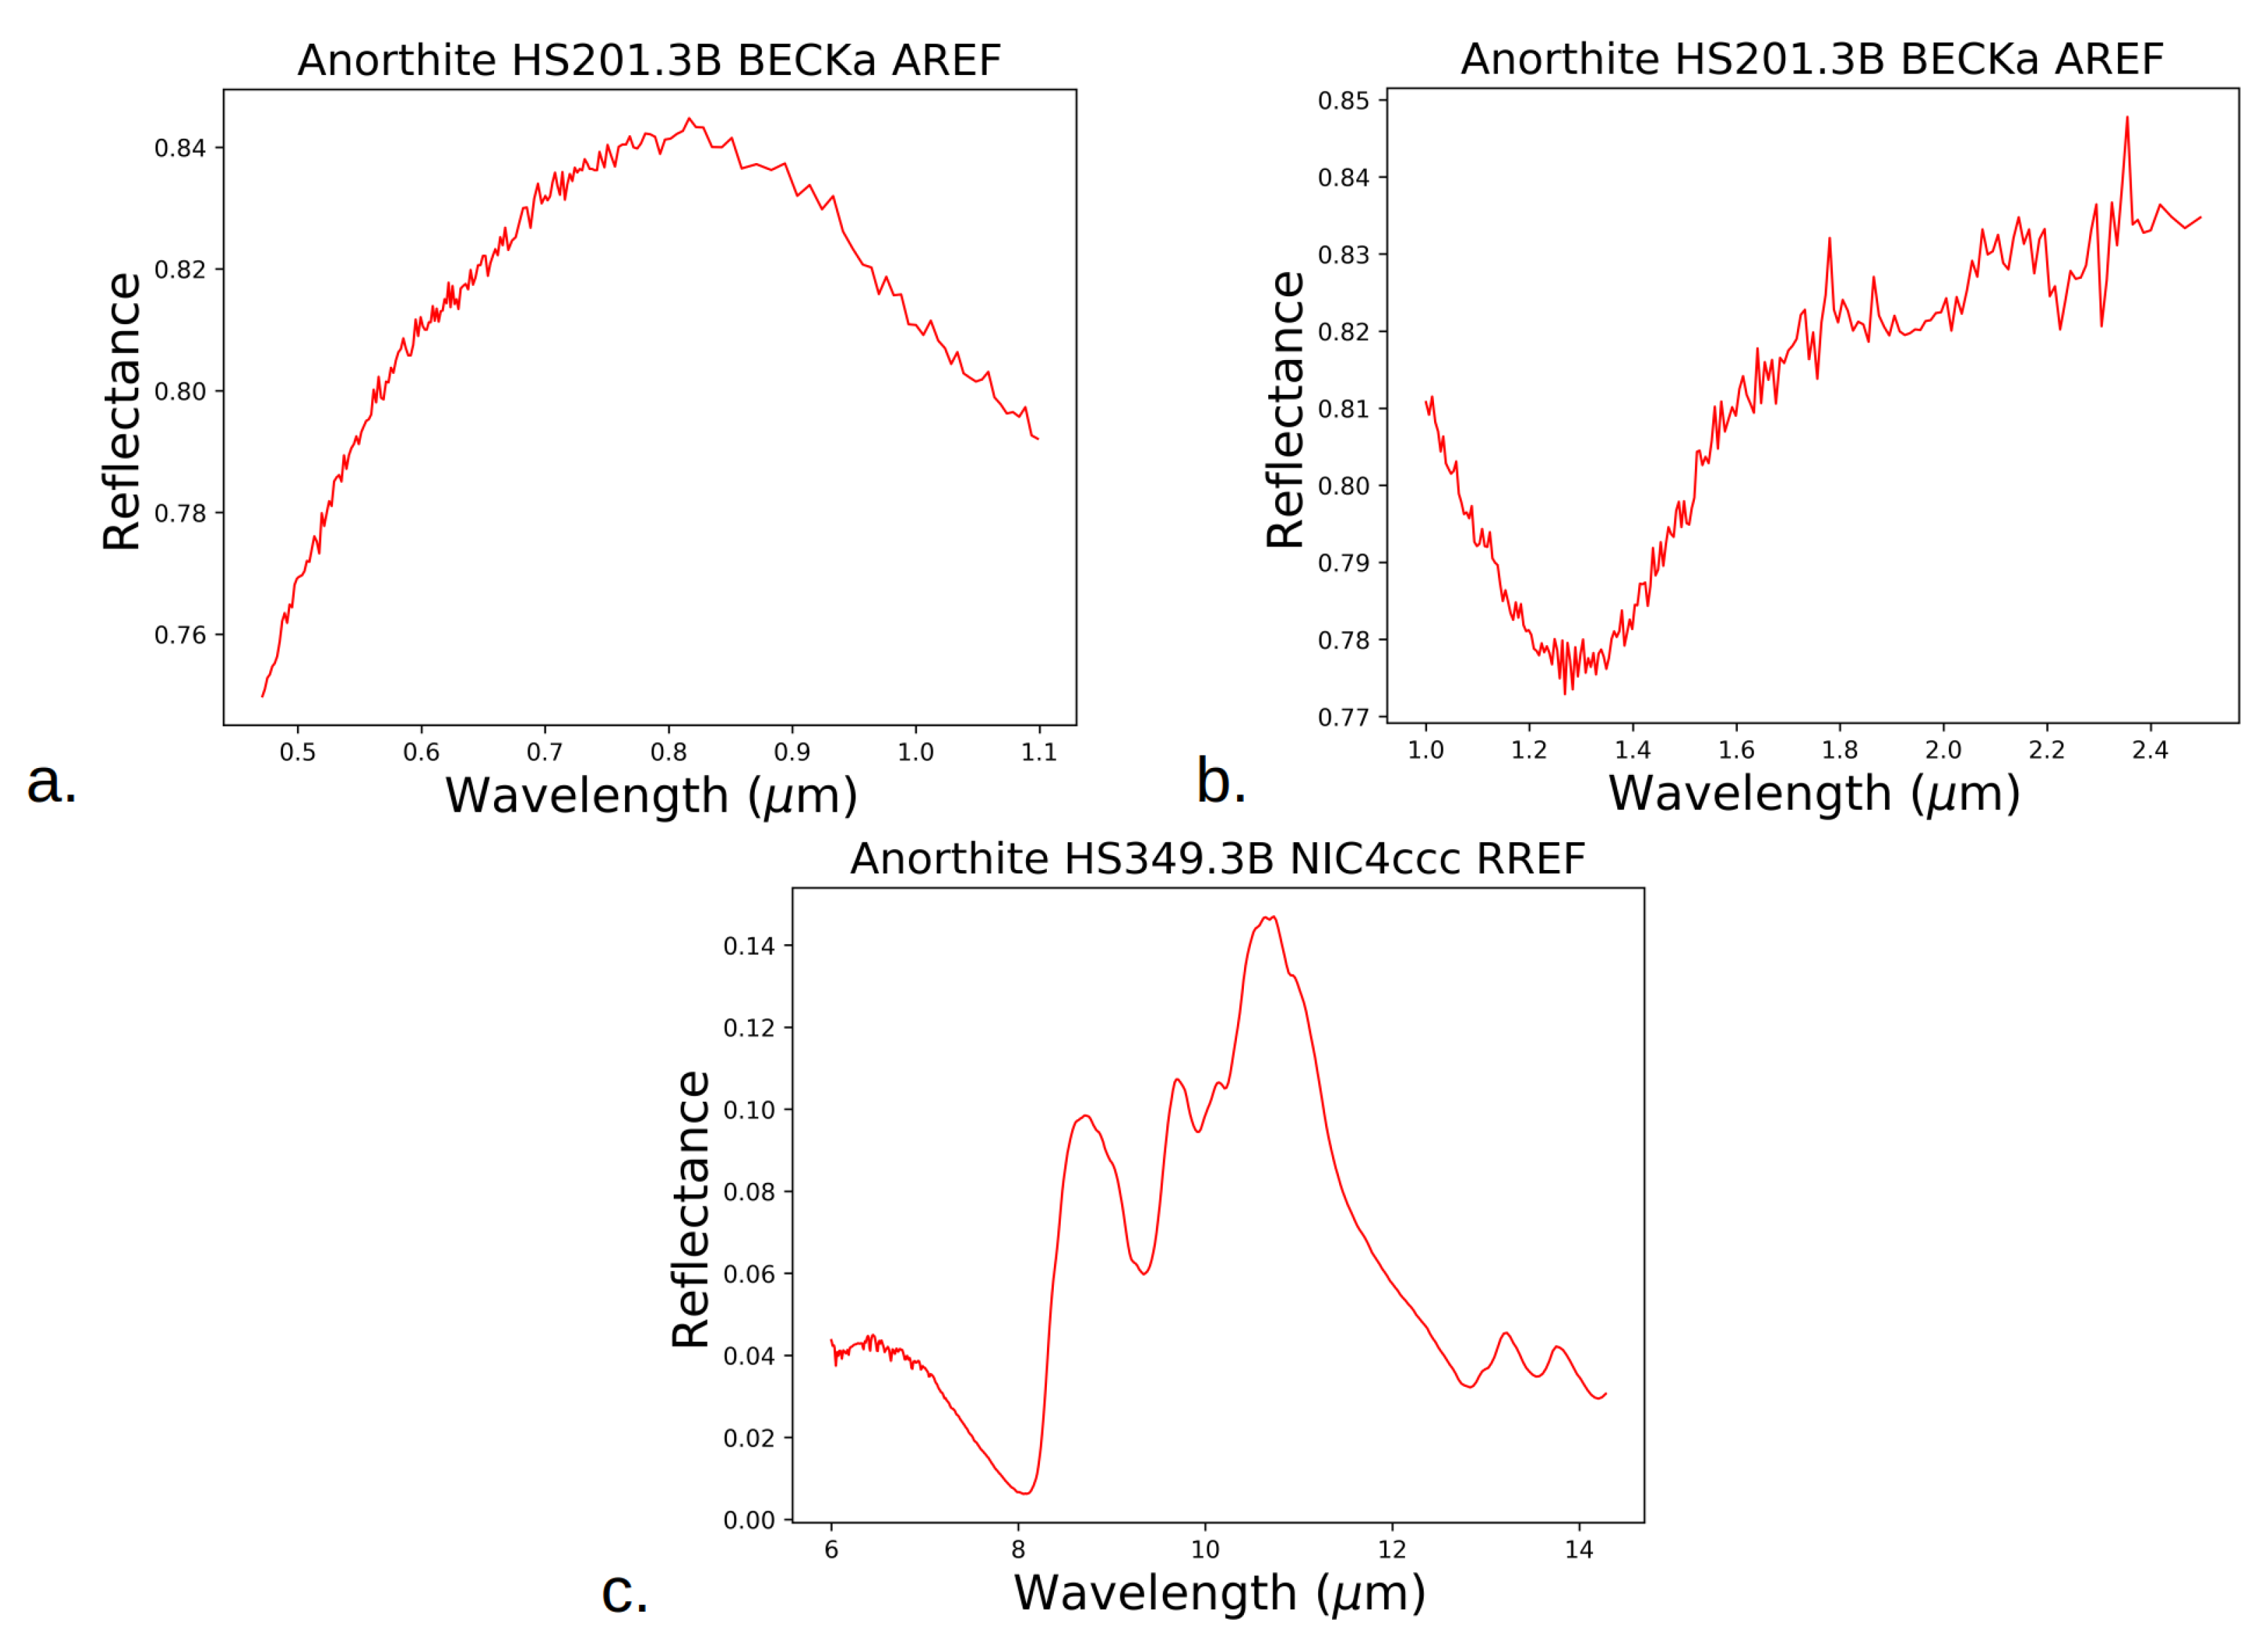
Figure A1 shows plagioclase spectra from the USGS spectral library in the various wavelength ranges used in our study. The spectra in the VNIR and in the NIR are from the same sample (HS201.3B), and the spectrum in the MIR is from a distinct sample (HS349.3B). However, both samples are anorthite, so they are good references when identifying the spectral parameters characteristic of the plagioclase and, by extension, bytownite (i.e., our samples; see Section 2.1).
Figure A1. Spectra of two anorthite samples from the USGS spectral library. The spectra were restricted to the wavelengths used for our measurements for better comparison. (a) VNIR range (0.47–1.1 μ m); (b) NIR range (1.0–3.5 μ m, but data are only available on 1.0–2.5 μ m); (c) MIR range (6.0–14.3 μ m).
Minerals 13 00250 g0a1
Overall, our spectra are very similar in shape to the USGS spectra, at least for the pellet and powder samples (see Figure 2, Figure 3 and Figure 9). In the VNIR (see Figure A1a), the local maximum is similarly located at around 0.8 μ m, which justifies the choice of two of our spectral parameters in this wavelength range (spectral slope on 0.5–0.8 μ m, reflectance ratio 1.0/0.8 μ m). In the NIR, the absorption band is likewise centered around 1.3 μ m. Its depth is more important for the USGS sample because our samples have a low Fe content (see Section 2.1). Finally, in the MIR, the CF is around 8 μ m, and all Reststrahlen bands (around 9.0, 10.0, and 10.5 μ m) are present, as in our samples, with the highest reflectance point reached for RB3.
Based on the above identification of the spectral parameters in the USGS spectra, we can confirm that our samples are indeed composed of plagioclase.

Appendix B

Temperature Calibration Using a Silicon Sample
With our setup (see Section 2.2), the samples are heated/cooled from below. Since the thickness of the samples is macroscopic (∼1 mm) and the samples have a thermal inertia, a temperature gradient occurs, which could affect the reliability of our measurements (non-stable temperature during acquisition). Indeed, we needed to make sure the temperature at the top of our samples is not too different from the input temperature (i.e., the temperature of the heating cell resistor, which is in contact with the bottom of the sample), and quantify this difference in temperature. In the case of a too-large difference in temperature, the protocol would be adapted, for example, by increasing the duration of the plateau after a heating ramp, to reduce it to a satisfying value. To check for this issue, we performed a temperature calibration by collecting the transmission spectra of a silicon sample.
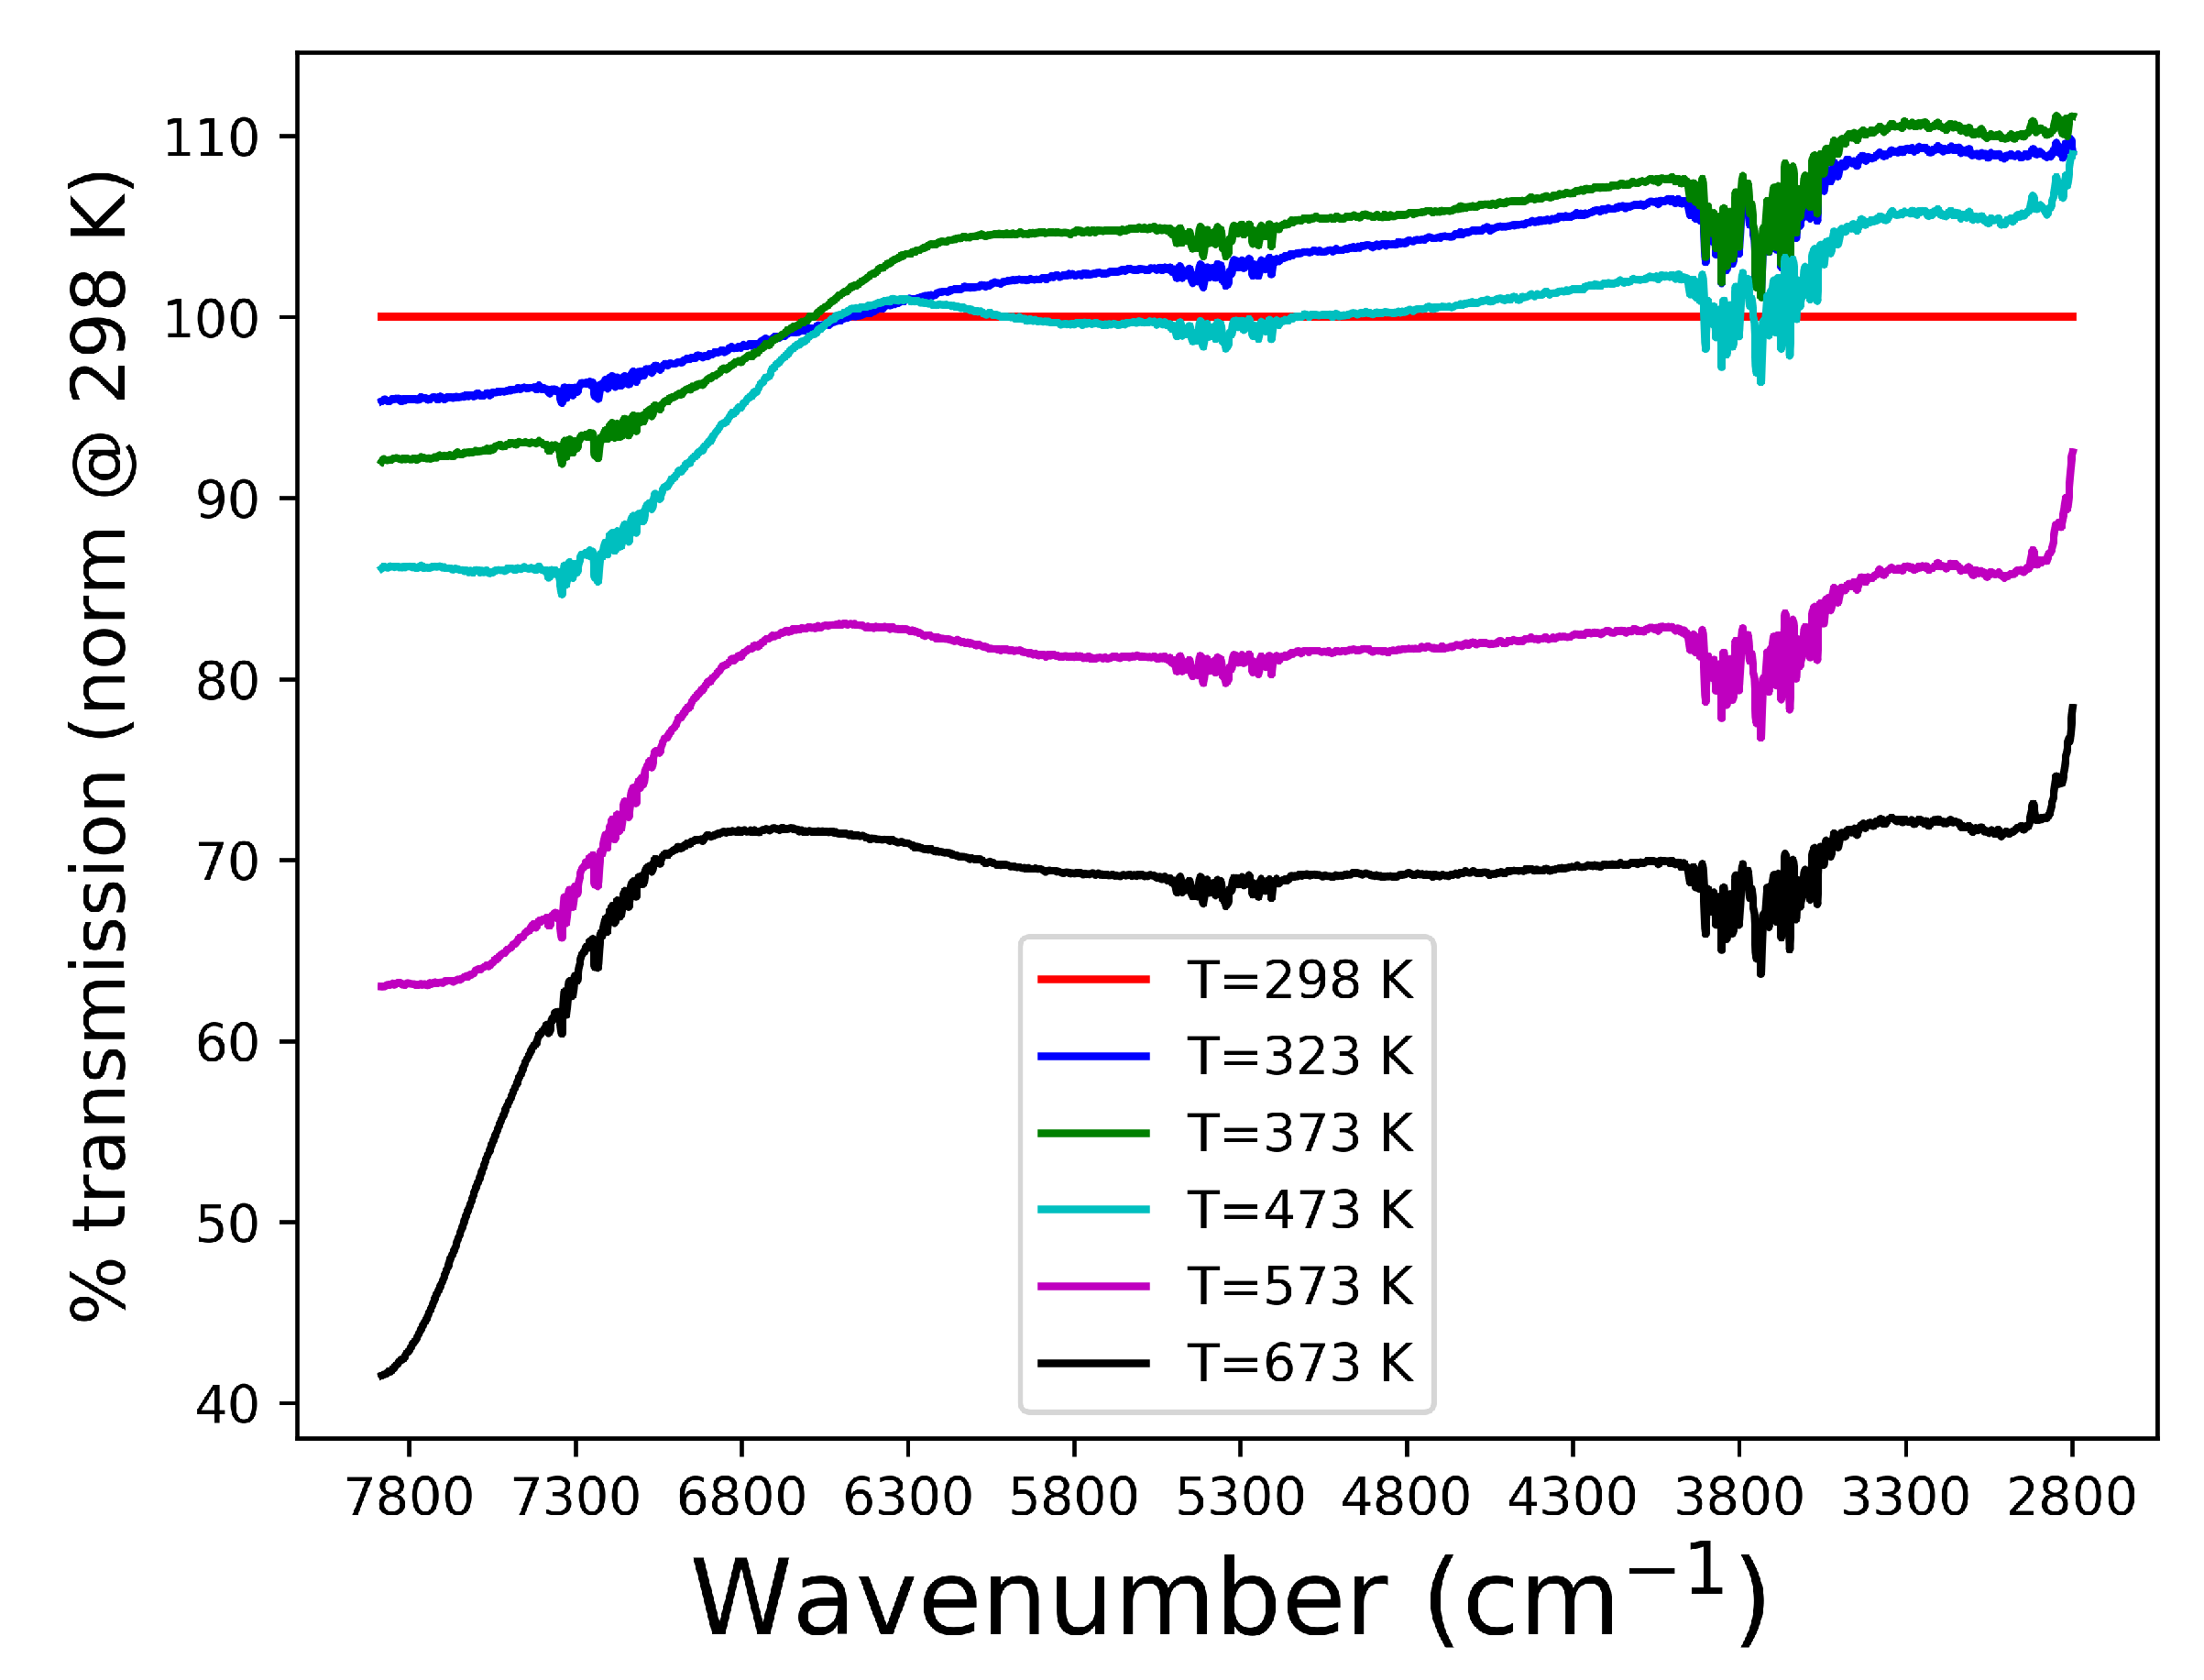
We proceeded as follows: first, we collected NIR transmission spectra of a Si standard sample (thickness < 1 mm) at various temperatures, with the same facility as described in Section 2.2 (Agilent FTIR spectrometer coupled to a microscope). We normalized all spectra with respect to the spectrum at room temperature for the next calibration step. The results are presented in Figure A2.
Figure A2. NIR (1.26–3.57 μ m) transmission spectra of a silicon standard sample at various temperatures, and normalized with respect to the spectrum at room temperature (298 K [25 C], red line).
Minerals 13 00250 g0a2
Then, we used reference NIR transmission spectra of Si (0.5 mm thick) taken at elevated temperatures [98] for comparison with our own measurements. The authors of the study only specified the thickness of their GaAs sample (0.5 mm), but we assume that all their samples (including their Si sample) had about the same thickness for consistency. Based on that hypothesis, both our Si sample and the reference Si sample had approximately the same thickness, and our comparison was relevant.
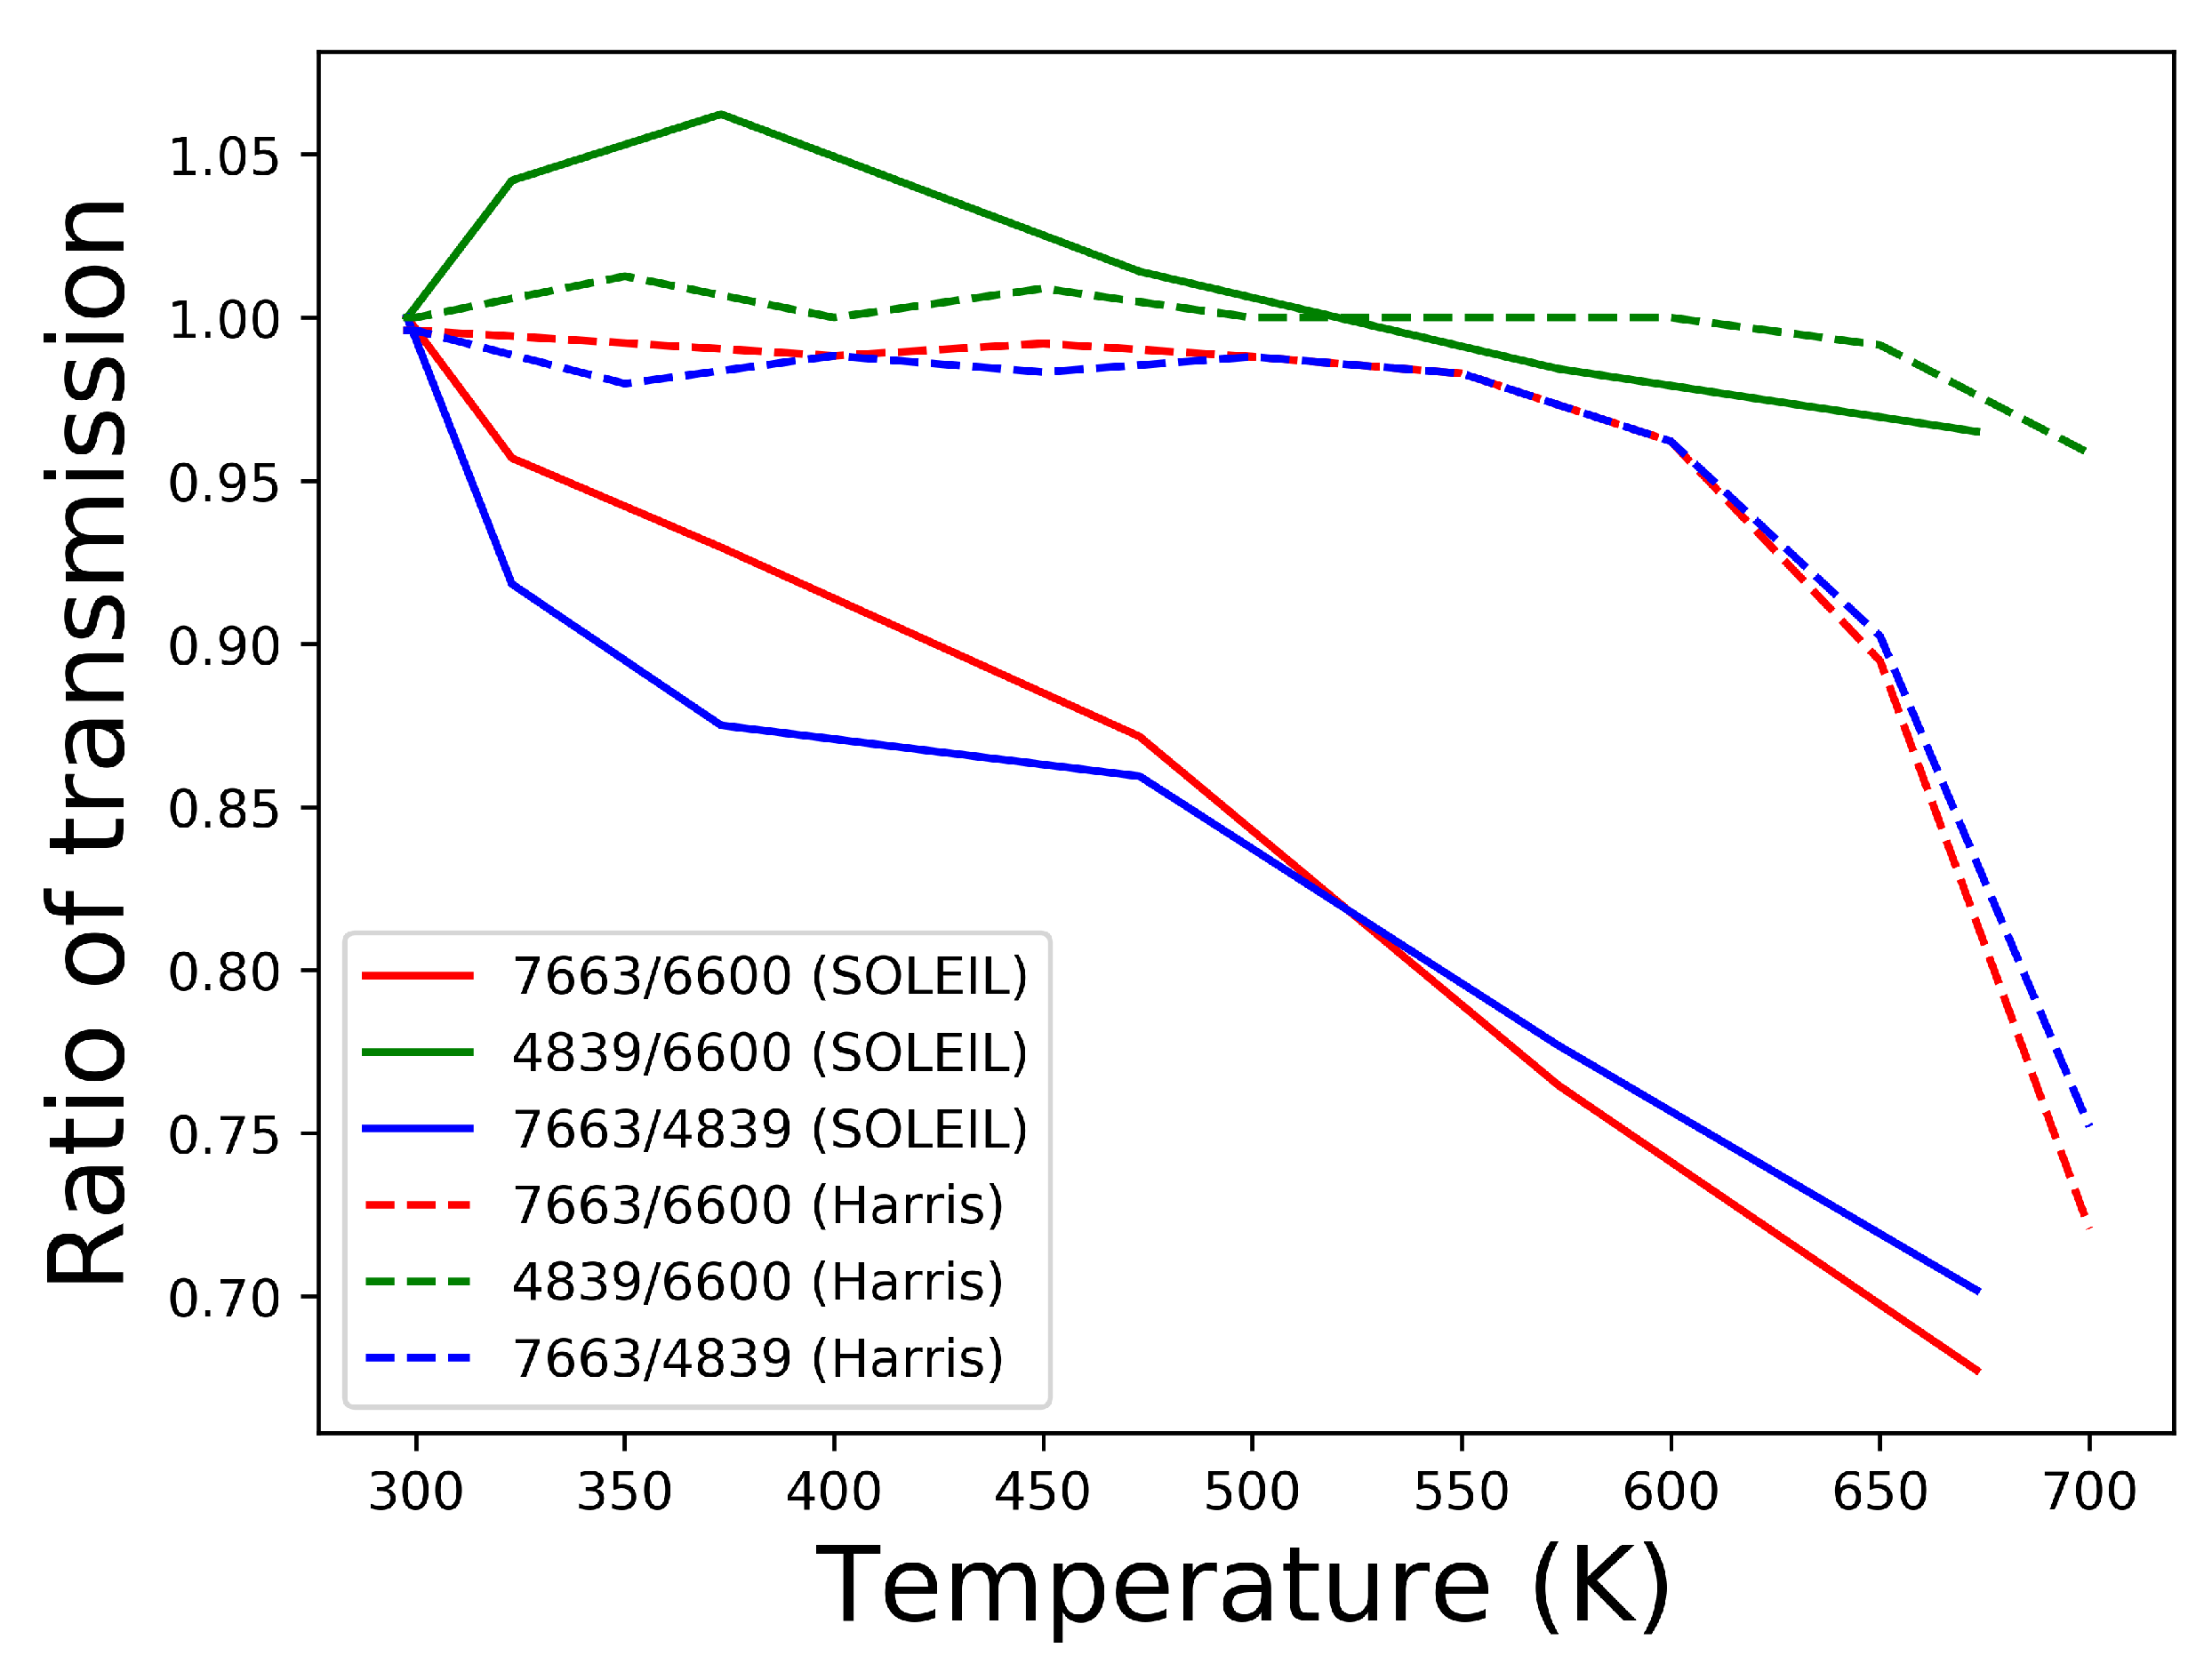
Finally, we extracted the transmission values at three wavenumbers (4839, 6600, and 7663 cm 1 ) in both our spectra and the reference spectra, and we calculated three transmission ratios: 7663 cm 1 /6600 cm 1 , 4839 cm 1 /6600 cm 1 , and 7663 cm 1 /4839 cm 1 . We plotted these ratios as a function of temperature (see Figure A3) to estimate the consistency between both datasets and the reliability of our measurements.
Figure A3 shows a maximum difference of ∼15% between the values of transmission ratios of both datasets, and only for two of the ratios (7663 cm 1 /6600 cm 1 , and 7663 cm 1 /4839 cm 1 ). The transmission ratio with the best consistency between both datasets (4839 cm 1 /6600 cm 1 ) is actually the most critical since it corresponds to the part of the spectra that undergoes the biggest changes with an increase in temperature (see Figure A2). Therefore, we consider our samples to be thermalized by approximately 10 K after a time plateau of about ten min. The heating cell, which has a metallic structure, is thermally conductive, and the nitrogen purge flux probably contribute to the homogenization of the samples’ temperature.
Figure A3. Transmission ratios at three different wavenumbers (4839, 6600, and 7663 cm 1 ) with respect to temperature for both our spectra (labeled as ‘SOLEIL’) and the spectra acquired by [98] (labeled as ‘Harris’).
Minerals 13 00250 g0a3

Appendix C

Estimation of Water Ice Deposit Thickness
In both cases considered in our experiments (i.e., pellet and slice; the powder was not used for the cooling experiment), we used the NIR reflectance spectra at room temperature (no ice) and at 148 K (−125 C) (lowest temperature; thus, the thickest ice deposit). First, we computed the ratio R of the spectrum at 148 K over the spectrum at room temperature. This ratio is set to correspond to 2T, where T is the transmission through the water ice deposit. Factor 2 accounts for both times the light passes through the ice deposit, i.e., once before reaching the surface of the sample and once after. Then, this transmission is converted into absorbance, A, using Equation (A1):
A = l n ( T ) = l n ( R / 2 )
Finally, we extracted the water ice deposit thickness, t, by computing the 3.0 μ m band area, B A 3.0 (in cm 1 ) and using Equation A2:
t = M × B A 3.0 I B S × d × n A
where M = 18 g/mol is the molar mass of water, I B S = 2.0 × 10 16 cm/molecule is the integrated band strength of O-H bond stretching at 3280 cm 1 , d = 1 g/cm 3 is the density of water and n A = 6.02 × 10 23 molecules/mol is the Avogadro number.

References

  1. Bauch, K.E.; Hiesinger, H.; Greenhagen, T.G.; Helbert, J. Estimation of surface temperatures on Mercury in preparation of the MERTIS experiment onboard BepiColombo. Icarus 2021, 354, 114083. [Google Scholar] [CrossRef]
  2. Paige, D.A.; Siegler, M.A.; Harmon, J.K.; Neumann, G.A.; Mazarico, E.M.; Smith, D.E.; Zuber, M.T.; Harju, E.; Delitsky, M.L.; Solomon, S.C. Thermal Stability of Volatiles in the North Polar Region of Mercury. Science 2013, 339, 300–303. [Google Scholar] [CrossRef] [PubMed]
  3. Benkhoff, J.; Murakami, G.; Baumjohann, W.; Besse, S.; Bunce, E.; Casale, M.; Cremosese, G.; Glassmeier, K.-H.; Hayakawa, H.; Heyner, D.; et al. BepiColombo—Mission Overview and Science Goals. Space Sci. Rev. 2021, 217, 90. [Google Scholar] [CrossRef]
  4. Domingue, D.L.; Chapman, C.R.; Killen, R.M.; Zurbuchen, T.H.; Gilbert, J.A.; Sarantos, M.; Benna, M.; Slavin, J.A.; Schriver, D.; Trávníček, P.M.; et al. Mercury’s Weather-Beaten Surface: Understanding Mercury in the Context of Lunar and Asteroidal Space Weathering Studies. Space Sci. Rev. 2014, 181, 121–214. [Google Scholar] [CrossRef]
  5. Hazen, R.M.; Downs, R.T.; Prewitt, C.T. Principles of Comparative Crystal Chemistry. Rev. Mineral. Geochem. 2000, 41, 1–33. [Google Scholar] [CrossRef]
  6. Tribaudino, M.; Angel, R.J.; Cámara, F.; Nestola, F.; Pasqual, D.; Margiolaki, I. Thermal expansion of plagioclase feldspars. Contrib. Mineral. Petrol. 2010, 160, 899–908. [Google Scholar] [CrossRef]
  7. Tribaudino, M.; Bruno, M.; Nestola, F.; Pasqual, D.; Angel, R.J. Thermoelastic and thermodynamic properties of plagioclase feldspars from thermal expansion measurements. Am. Mineral. 2011, 96, 992–1002. [Google Scholar] [CrossRef]
  8. Hiroi, T.; Zolensky, M.E. UV-Vis-NIR absorption features of heated phyllosilicates as remote-sensing clues of thermal histories of primitive asteroids. In Proceedings of the Antarctic Meteorite Research, 23rd Symposium on Antarctic Meteorites, Tokyo, Japan, 10–12 June 1998; National Institute of Polar Research: Tachikawa, Japan, 1999; Volume 12. [Google Scholar]
  9. Ostrowski, D.R.; Gietzen, K.; Lacy, C.; Sears, D.W.G. An investigation of the presence and nature of phyllosilicates on the surfaces of C asteroids by an analysis of the continuum slopes in their near-infrared spectra. Meteorit. Planet. Sci. 2010, 45, 615–637. [Google Scholar] [CrossRef]
  10. Vilas, F. Mercury: Absence of crystalline Fe2+ in the regolith. Icarus 1985, 64, 133–138. [Google Scholar] [CrossRef]
  11. Warell, J.; Blewett, D.T. Properties of the Hermean regolith: V. New optical reflectance spectra, comparison with lunar anorthosites, and mineralogical modelling. Icarus 2004, 168, 257–276. [Google Scholar] [CrossRef]
  12. Izenberg, N.R.; Klima, R.L.; Murchie, S.L.; Blewett, D.T.; Holsclaw, G.M.; McClintock, W.E.; Malaret, E.; Mauceri, C.; Vilas, F.; Sprague, A.L.; et al. The low-iron, reduced surface of Mercury as seen in spectral reflectance by MESSENGER. Icarus 2014, 228, 364–374. [Google Scholar] [CrossRef]
  13. Murchie, S.L.; Klima, R.L.; Denevi, B.W.; Ernst, C.M.; Keller, M.R.; Domingue, D.L.; Blewett, D.T.; Chabot, N.L.; Hash, C.D.; Malaret, E.; et al. Orbital multispectral mapping of Mercury with the MESSENGER Mercury Dual Imaging System: Evidence for the origins of plains units and low-reflectance material. Icarus 2015, 254, 287–305. [Google Scholar] [CrossRef]
  14. Emery, J.P.; Sprague, A.L.; Witteborn, F.C.; Colwell, J.E.; Kozlowski, R.W.H.; Wooden, D.H. Mercury: Thermal Modeling and Mid-infrared (5–12 μm) Observations. Icarus 1998, 136, 104–123. [Google Scholar] [CrossRef]
  15. Sprague, A.L.; Deutsch, L.K.; Hora, J.; Fazio, G.G.; Ludwig, B.; Emery, J.; Hoffmann, W.F. Mid-Infrared (8.1–12.5 μm) Imaging of Mercury. Icarus 2000, 147, 421–432. [Google Scholar] [CrossRef]
  16. Sprague, A.L.; Emery, J.P.; Donaldson, K.L.; Russell, R.W.; Lynch, D.K.; Mazuk, A.L. Mercury: Mid-infrared (3–13.5 μm) observations show heterogeneous composition, presence of intermediate and basic soil types, and pyroxene. Meteorit. Planet. Sci. 2002, 37, 1255–1268. [Google Scholar] [CrossRef]
  17. Sprague, A.L.; Donaldson Hanna, K.L.; Kozlowski, R.W.H.; Helbert, J.; Maturilli, A.; Warell, J.B.; Hora, J.L. Spectral emissivity measurements of Mercury’s surface indicate Mg- and Ca-rich mineralogy, K-spar, Na-rich plagioclase, rutile, with possible perovskite, and garnet. Planet. Space Sci. 2009, 57, 364–383. [Google Scholar] [CrossRef]
  18. Vilas, F.; Domingue, D.L.; Helbert, J.; D’Amore, M.; Maturilli, A.; Klima, R.L.; Stockstill-Cahill, K.R.; Murchie, S.L.; Izenberg, N.R.; Blewett, D.T.; et al. Mineralogical indicators of Mercury’s hollows composition in MESSENGER color observations. Geophys. Res. Lett. 2016, 43, 1450–1456. [Google Scholar] [CrossRef]
  19. Lucchetti, A.; Pajola, M.; Galluzzi, V.; Giacomini, L.; Carli, C.; Cremonese, G.; Marzo, G.A.; Ferrari, S.; Massironi, M.; Palumbo, P. Mercury Hollows as Remnants of Original Bedrock Materials and Devolatilization Processes: A Spectral Clustering and Geomorphological Analysis. J. Geophys. Res. Planets 2018, 123, 2365–2379. [Google Scholar] [CrossRef]
  20. Nittler, L.R.; Starr, R.D.; Weider, S.Z.; McCoy, T.J.; Boynton, W.V.; Ebel, D.S.; Ernst, C.M.; Evans, L.G.; Goldsten, J.O.; Hamara, D.K.; et al. The Major-Element Composition of Mercury’s Surface from MESSENGER X-ray Spectrometry. Science 2011, 333, 1847–1850. [Google Scholar] [CrossRef]
  21. Weider, S.Z.; Nittler, L.R.; Starr, R.D.; Crapster-Pregont, E.J.; Peplowski, P.N.; Denevi, B.W.; Head, J.W.; Byrne, P.K.; Hauck, S.A.; Ebel, D.S.; et al. Evidence for geochemical terranes on Mercury: Global mapping of major elements with MESSENGER’s X-Ray Spectrometer. Earth Planet. Sci. Lett. 2015, 416, 109–120. [Google Scholar] [CrossRef]
  22. Charlier, B.; Namur, O. Mineralogical Variations at the Surface of Mercury. In Proceedings of the 48th Lunar and Planetary Science Conference, The Woodlands, TX, USA, 20–24 March 2017. [Google Scholar]
  23. Nittler, L.R.; Chabot, N.L.; Grove, T.L.; Peplowski, P.N. The Chemical Composition of Mercury. In Mercury: The View after MESSENGER; Solomon, S.C., Nittler, L.R., Anderson, B.J., Eds.; Cambridge University Press: Cambridge, UK, 2018; pp. 30–51. [Google Scholar] [CrossRef]
  24. Solomon, S.C.; Nittler, L.R.; Anderson, B.J. Mercury: The View after MESSENGER; Cambridge University Press: Cambridge, UK, 2018. [Google Scholar] [CrossRef]
  25. Head, J.W.; Chapman, C.R.; Strom, R.G.; Fassett, C.I.; Denevi, B.W.; Blewett, D.T.; Ernst, C.M.; Watters, T.R.; Solomon, S.C.; Murchie, S.L.; et al. Flood Volcanism in the Northern High Latitudes of Mercury Revealed by MESSENGER. Science 2011, 333, 1853–1856. [Google Scholar] [CrossRef] [PubMed]
  26. Denevi, B.W.; Ernst, C.M.; Meyer, H.M.; Robinson, M.S.; Murchie, S.L.; Whitten, J.L.; Head, J.W.; Watters, T.R.; Solomon, S.C.; Ostrach, L.R.; et al. The distribution and origin of smooth plains on Mercury. J. Geophys. Res. Planets 2013, 118, 891–907. [Google Scholar] [CrossRef]
  27. Peplowski, P.N.; Evans, L.G.; Stockstill-Cahill, K.R.; Lawrence, D.J.; Goldsten, J.O.; McCoy, T.J.; Nittler, L.R.; Solomon, S.C.; Sprague, A.L.; Starr, R.D.; et al. Enhanced sodium abundance in Mercury’s north polar region revealed by the MESSENGER Gamma-Ray Spectrometer. Icarus 2014, 228, 86–95. [Google Scholar] [CrossRef]
  28. Peplowski, P.N.; Lawrence, D.J.; Feldman, W.C.; Goldsten, J.O.; Bazell, D.; Evans, L.G.; Head, J.W.; Nittler, L.R.; Solomon, S.C.; Weider, S.Z. Geochemical terranes of Mercury’s northern hemisphere as revealed by MESSENGER neutron measurements. Icarus 2015, 253, 346–363. [Google Scholar] [CrossRef]
  29. Namur, O.; Charlier, B.; Holtz, F.; Cartier, C.; McCammon, C. Sulfur solubility in reduced mafic silicate melts: Implications for the speciation and distribution of sulfur on Mercury. Earth Planet. Sci. Lett. 2016, 448, 102–114. [Google Scholar] [CrossRef]
  30. Charlier, B.; Grove, T.L.; Zuber, M.T. Phase equilibria of ultramafic compositions on Mercury and the origin of the compositional dichotomy. Earth Planet. Sci. Lett. 2013, 363, 50–60. [Google Scholar] [CrossRef]
  31. Sehlke, A.; Whittington, A.G. Rheology of lava flows on Mercury: An analog experimental study. J. Geophys. Res. Planets 2015, 120, 1924–1955. [Google Scholar] [CrossRef]
  32. McCoy, T.J.; Dickinson, T.L.; Lofgren, G.E. Partial melting of the Indarch (EH4) Meteorite: A textural, chemical and phase relations view of melting and melt migration. Meteorit. Planet. Sci. 1999, 34, 735–746. [Google Scholar] [CrossRef]
  33. Berthet, S.; Malavergne, V.; Righter, K. Melting of the Indarch meteorite (EH4 chondrite) at 1 GPa and variable oxygen fugacity: Implications for early planetary differentiation processes. Geochim. Cosmochim. Acta 2009, 73, 6402–6420. [Google Scholar] [CrossRef]
  34. Cartier, C.; Hammouda, T.; Doucelance, R.; Boyet, M.; Devidal, J.-L.; Bertrand, M. Experimental study of trace element partitioning between enstatite and melt in enstatite chondrites at low oxygen fugacities and 5 GPa. Geochim. Cosmochim. Acta 2014, 130, 167–187. [Google Scholar] [CrossRef]
  35. Namur, O.; Collinet, M.; Charlier, B.; Grove, T.L.; Holtz, F.; McCammon, C. Melting processes and mantle sources of lavas on Mercury. Earth Planet. Sci. Lett. 2016, 439, 117–128. [Google Scholar] [CrossRef]
  36. Morizet, Y.; Ory, S.; Di Carlo, I.; Scaillet, B.; Echegut, P. The effect of sulphur on the glass transition temperature in anorthite–diopside eutectic glasses. Chem. Geol. 2015, 416, 11–18. [Google Scholar] [CrossRef]
  37. Roush, T.L.; Singer, R.B. Gaussian analysis of temperature effects on the reflectance spectra of mafic minerals in the 1-μm region. J. Geophys. Res. Solid Earth 1986, 91, 10301–10308. [Google Scholar] [CrossRef]
  38. Helbert, J.; Maturilli, A. The emissivity of a fine-grained labradorite sample at typical Mercury dayside temperatures. Earth Planet. Sci. Lett. 2009, 285, 347–354. [Google Scholar] [CrossRef]
  39. Helbert, J.; Nestola, F.; Ferrari, S.; Maturilli, A.; Massironi, M.; Redhammer, G.J.; Capria, M.T.; Carli, C.; Capaccioni, F.; Bruno, M. Olivine thermal emissivity under extreme temperature ranges: Implication for Mercury surface. Earth Planet. Sci. Lett. 2013, 371, 252–257. [Google Scholar] [CrossRef]
  40. Vander Kaaden, K.E.; McCubbin, F.M.; Nittler, L.R.; Peplowski, P.N.; Weider, S.Z.; Frank, E.A.; McCoy, T.J. Geochemistry, mineralogy, and petrology of boninitic and komatiitic rocks on the mercurian surface: Insights into the mercurian mantle. Icarus 2017, 285, 155–168. [Google Scholar] [CrossRef]
  41. Maturilli, A.; Helbert, J.; St. John, J.M.; Head, J.W.; Vaughan, W.M.; D’Amore, M.; Gottschalk, M.; Ferrari, S. Komatiites as Mercury surface analogues: Spectral measurements at PEL. Earth Planet. Sci. Lett. 2014, 398, 58–65. [Google Scholar] [CrossRef]
  42. Maturilli, A.; Helbert, J.; Varatharajan, I.; D’Amore, M. Emissivity Spectra of Mercury Analogues under Mercury Pressure and Temperature Conditions. In Proceedings of the European Planetary Science Congress 2017, Riga, Latvia, 17–22 September 2017. [Google Scholar]
  43. Varatharajan, I.; Maturilli, A.; Helbert, J.; Alemanno, G.; Hiesinger, H. Spectral behavior of sulfides in simulated daytime surface conditions of Mercury: Supporting past (MESSENGER) and future missions (BepiColombo). Earth Planet. Sci. Lett. 2019, 520, 127–140. [Google Scholar] [CrossRef]
  44. Helbert, J.; Maturilli, A.; D’Amore, M. Visible and near-infrared reflectance spectra of thermally processed synthetic sulfides as a potential analog for the hollow forming materials on Mercury. Earth Planet. Sci. Lett. 2013, 369, 233–238. [Google Scholar] [CrossRef]
  45. Ferrari, S.; Maturilli, A.; Carli, C.; D’Amore, M.; Helbert, J.; Nestola, F.; Hiesinger, H. Thermal infrared emissivity of felsic-rich to mafic-rich analogues of hot planetary regoliths. Earth Planet. Sci. Lett. 2020, 534, 116089. [Google Scholar] [CrossRef]
  46. Cremonese, G.; Capaccioni, F.; Capria, M.T.; Doressoundiram, A.; Palumbo, P.; Vincendon, M.; Massironi, M.; Debei, S.; Zusi, M.; Altieri, F.; et al. SIMBIO-SYS: Scientific Cameras and Spectrometer for the BepiColombo Mission. Space Sci. Rev. 2020, 216, 75. [Google Scholar] [CrossRef]
  47. Hiesinger, H.; Helbert, J.; Alemanno, G.; Bauch, K.E.; D’Amore, M.; Maturilli, A.; Morlok, A.; Reitze, M.P.; Stangarone, C.; Stojic, A.N.; et al. Studying the Composition and Mineralogy of the Hermean Surface with the Mercury Radiometer and Thermal Infrared Spectrometer (MERTIS) for the BepiColombo Mission: An Update. Space Sci. Rev. 2020, 216, 110. [Google Scholar] [CrossRef]
  48. Serventi, G.; Carli, C.; Sgavetti, M.; Ciarniello, M.; Capaccioni, F.; Pedrazzi, G. Spectral variability of plagioclase-mafic mixtures (1): Effects of chemistry and modal abundance in reflectance spectra of rocks and mineral mixtures. Icarus 2013, 226, 282–298. [Google Scholar] [CrossRef]
  49. Vetere, F.; Rossi, S.; Namur, O.; Morgavi, D.; Misiti, V.; Mancinelli, P.; Petrelli, M.; Pauselli, C.; Perugini, D. Experimental constraints on the rheology, eruption, and emplacement dynamics of analog lavas comparable to Mercury’s northern volcanic plains. J. Geophys. Res. Planets 2017, 122, 1522–1538. [Google Scholar] [CrossRef]
  50. Bruschini, E.; Carli, C.; Buellet, A.-C.; Vincendon, M.; Capaccioni, F.; Ferrari, M.; Vetere, F.; Secchiari, A.; Perugini, D.; Montanini, A. VNIR reflectance spectra of silicate-graphite mixtures: The effect of graphite content and particle size. Icarus 2022, 378, 114950. [Google Scholar] [CrossRef]
  51. Stammer, X.; Heißler, S. FT-IR Spectroscopy in Ultrahigh-Vacuum Conditions: A Surface Science Approach to Understanding Reactions on Catalytic Oxide Powders; Advanstar Communications Inc.: Santa Monica, CA, USA, 2013; Volume 28. [Google Scholar]
  52. Maupin, R.; Djouadi, Z.; Brunetto, R.; Lantz, C.; Aléon-Toppani, A.; Vernazza, P. Vis-NIR Reflectance Microspectroscopy of IDPs. Planet. Sci. J. 2020, 1, 62. [Google Scholar] [CrossRef]
  53. Brunetto, R.; Lantz, C.; Dionnet, Z.; Borondics, F.; Aléon-Toppani, A.; Baklouti, D.; Barucci, M.A.; Binzel, R.P.; Djouadi, Z.; Kitazato, K.; et al. Hyperspectral FTIR imaging of irradiated carbonaceous meteorites. Planet. Space Sci. 2018, 158, 38–45. [Google Scholar] [CrossRef]
  54. Adams, J.B.; McCord, T.B. Alteration of Lunar Optical Properties: Age and Composition Effects. Science 1971, 171, 567–571. [Google Scholar] [CrossRef]
  55. Bell, P.M.; Mao, H.K. Crystal-field effects of iron and titanium in selected grains of Apollo 12, 14, and 15 rocks, glasses, and fine fractions. In Proceedings of the Lunar Science Conference, Houston, TX, USA, 10–13 January 1972; Volume 3, pp. 545–553. [Google Scholar]
  56. Burns, R.G. Mineralogical Applications of Crystal Field Theory; Cambridge University Press: Cambridge, UK, 1993. [Google Scholar]
  57. Adams, J.B.; McCord, T.B. Remote sensing of lunar surface mineralogy: Implications from visible and near-infrared reflectivity of Apollo 11 samples. Geochim. Cosmochim. Acta Suppl. 1970, 1, 1937. [Google Scholar]
  58. Davis, K.M.; Tomozawa, M. An infrared spectroscopic study of water-related species in silica glasses. J. -Non-Cryst. Solids 1996, 201, 177–198. [Google Scholar] [CrossRef]
  59. Godard, M.; Feraud, G.; Chabot, M.; Carpentier, Y.; Pino, T.; Brunetto, R.; Duprat, J.; Engrand, C.; Brechignac, P.; d’Hendecourt, L.; et al. Ion irradiation of carbonaceous interstellar analogues—Effects of cosmic rays on the 3.4 μm interstellar absorption band. Astron. Astrophys. 2011, 529, A146. [Google Scholar] [CrossRef]
  60. Conel, J.E. Infrared Emissivities of Silicates: Experimental Results and a Cloudy Atmosphere Model of Spectral Emission from Condensed Particulate Mediums. J. Geophys. Res. 1969, 74, 1614–1634. [Google Scholar] [CrossRef]
  61. Koike, C.; Chihara, H.; Tsuchiyama, A.; Suto, H.; Sogawa, H.; Okuda, H. Compositional dependence of infrared absorption spectra of crystalline silicate. II. Natural and synthetic olivines. Astron. Astrophys. 2003, 399, 1101–1107. [Google Scholar] [CrossRef]
  62. Hamilton, V.E. Thermal infrared (vibrational) spectroscopy of Mg-Fe olivines: A review and applications to determining the composition of planetary surfaces. Chem. Erde—Geochem. 2010, 70, 7–33. [Google Scholar] [CrossRef]
  63. Pisello, A.; Ferrari, M.; De Angelis, S.; Vetere, F.P.; Porreca, M.; Stefani, S.; Perugini, D. Reflectance of silicate glasses in the mid-infrared region (MIR): Implications for planetary research. Icarus 2022, 388, 115222. [Google Scholar] [CrossRef]
  64. Wagner, J.K.; Hapke, B.; Wells, E. Atlas of reflectance spectra of terrestrial, lunar, and meteoritic powders and frosts from 92 to 1800 nm. Icarus 1987, 69, 14–28. [Google Scholar] [CrossRef]
  65. Potin, S.; Beck, P.; Schmitt, B.; Moynier, F. Some things special about NEAs: Geometric and environmental effects on the optical signatures of hydration. Icarus 2019, 333, 415–428. [Google Scholar] [CrossRef]
  66. Moroz, L.; Baratta, G.; Strazzulla, G.; Starukhina, L.; Dotto, E.; Barucci, M.A.; Arnold, G.; Distefano, E. Optical alteration of complex organics induced by ion irradiation:. 1. Laboratory experiments suggest unusual space weathering trend. Icarus 2004, 170, 214–228. [Google Scholar] [CrossRef]
  67. Schröder, S.E.; Grynko, Y.; Pommerol, A.; Keller, H.U.; Thomas, N.; Roush, T.L. Laboratory observations and simulations of phase reddening. Icarus 2014, 239, 201–216. [Google Scholar] [CrossRef]
  68. Sanchez, J.A.; Reddy, V.; Nathues, A.; Cloutis, E.A.; Mann, P.; Hiesinger, H. Phase reddening on near-Earth asteroids: Implications for mineralogical analysis, space weathering and taxonomic classification. Icarus 2012, 220, 36–50. [Google Scholar] [CrossRef]
  69. Fornasier, S.; Hasselmann, P.H.; Deshapriya, J.D.P.; Barucci, M.A.; Clark, B.E.; Praet, A.; Hamilton, V.E.; Simon, A.; Li, J.-Y.; Cloutis, E.A.; et al. Phase reddening on asteroid Bennu from visible and near-infrared spectroscopy. Astron. Astrophys. 2020, 644, A142. [Google Scholar] [CrossRef]
  70. Gehrels, T.; Coffeen, T.; Owings, D. Wavelength dependance of polarization. III. The lunar surface. Astron. J. 1964, 69, 826. [Google Scholar] [CrossRef]
  71. Fornasier, S.; Hasselmann, P.H.; Barucci, M.A.; Feller, C.; Besse, S.; Leyrat, C.; Lara, L.; Gutierrez, P.J.; Oklay, N.; Tubiana, C.; et al. Spectrophotometric properties of the nucleus of comet 67P/Churyumov-Gerasimenko from the OSIRIS instrument onboard the ROSETTA spacecraft. Astron. Astrophys. 2015, 583, A30. [Google Scholar] [CrossRef]
  72. Warell, J.; Bergfors, C. Mercury’s integral phase curve: Phase reddening and wavelength dependence of photometric quantities. Planet. Space Sci. 2008, 56, 1939–1948. [Google Scholar] [CrossRef]
  73. Nakajima, Y.; Morimoto, N.; Kitamura, M. The superstructure of plagioclase feldspars. Phys. Chem. Miner. 1977, 1, 213–225. [Google Scholar] [CrossRef]
  74. Potin, S.; Beck, P.; Bonal, L.; Usui, F.; Vernazza, P.; Schmitt, B. The Shape of the 3 μm Absorption Band Linked to the Alteration History? Laboratory Investigations on Carbonaceous Chondrites and Applications to AKARI, Hayabusa2 and OSIRIS-REx Spectra. In Proceedings of the Asteroid Science in the Age of Hayabusa2 and OSIRIS-REx, Tucson, Arizona, USA, 5–7 November 2019. [Google Scholar]
  75. Chabot, N.L.; Ernst, C.M.; Harmon, J.K.; Murchie, S.L.; Solomon, S.C.; Blewett, D.T.; Denevi, B.W. Craters hosting radar-bright deposits in Mercury’s north polar region: Areas of persistent shadow determined from MESSENGER images. J. Geophys. Res. Planets 2013, 118, 26–36. [Google Scholar] [CrossRef]
  76. Susorney, H.C.M.; Ernst, C.M.; Chabot, N.L.; Deutsch, A.N.; Barnouin, O.S. Morphometry and Temperature of Simple Craters in Mercury’s Northern Hemisphere: Implications for Stability of Water Ice. Planet. Sci. J. 2021, 2, 97. [Google Scholar] [CrossRef]
  77. Hayne, P.O.; Aharonson, O.; Schörghofer, N. Micro cold traps on the Moon. Nat. Astron. 2021, 5, 169–175. [Google Scholar] [CrossRef]
  78. Davidsson, B.J.R.; Hosseini, S. Implications of surface roughness in models of water desorption on the Moon. Mon. Not. R. Astron. Soc. 2021, 506, 3421–3429. [Google Scholar] [CrossRef]
  79. Frost, R.L.; Ruan, H.; Kloprogge, J.T.; Gates, W.P. Dehydration and dehydroxylation of nontronites and ferruginous smectite. Thermochim. Acta 2000, 346, 63–72. [Google Scholar] [CrossRef]
  80. Potin, S.; Manigand, S.; Beck, P.; Wolters, C.; Schmitt, B. A model of the 3-μm hydration band with Exponentially Modified Gaussian (EMG) profiles: Application to hydrated chondrites and asteroids. Icarus 2020, 343, 113686. [Google Scholar] [CrossRef]
  81. Wakabayashi, H.; Tomozawa, M. Diffusion of Water into Silica Glass at Low Temperature. J. Am. Ceram. Soc. 1989, 72, 1850–1855. [Google Scholar] [CrossRef]
  82. Kuligiewicz, A.; Derkowski, A.; Szczerba, M.; Gionis, V.; Chryssikos, G.D. Revisiting the Infrared Spectrum of the Water–Smectite Interface. Clays Clay Miner. 2015, 63, 15–29. [Google Scholar] [CrossRef]
  83. Potin, S.; Beck, P.; Bonal, L.; Usui, F.; Vernazza, P.; Schmitt, B. Investigation of the Hydration Features of Asteroids with Carbonaceous Chondrites: Experimental Analysis and Comparison with Astronomical Observations. In Proceedings of the 82nd Annual Meeting of The Meteoritical Society, Sapporo, Japan, 7–12 July 2019. [Google Scholar]
  84. Sheth, N.; Ngo, D.; Banerjee, J.; Zhou, Y.; Pantano, C.G.; Kim, S.H. Probing Hydrogen-Bonding Interactions of Water Molecules Adsorbed on Silica, Sodium Calcium Silicate, and Calcium Aluminosilicate Glasses. J. Phys. Chem. 2018, 122, 17792–17801. [Google Scholar] [CrossRef]
  85. Lantz, C.; Brunetto, R.; Barucci, M.A.; Fornasier, S.; Baklouti, D.; Bourçois, J.; Godard, M. Ion irradiation of carbonaceous chondrites: A new view of space weathering on primitive asteroids. Icarus 2017, 285, 43–57. [Google Scholar] [CrossRef]
  86. Duley, W.W. The formation of H2 by H-atom reaction with grain surfaces. Mon. Not. R. Astron. Soc. 1996, 279, 591–594. [Google Scholar] [CrossRef]
  87. Jones, A.P. Variations on a theme—The evolution of hydrocarbon solids. I. Compositional and spectral modelling—The eRCN and DG models. Astron. Astrophys. 2012, 540, A1. [Google Scholar] [CrossRef]
  88. Hamill, C.D.; Chabot, N.L.; Mazarico, E.; Siegler, M.A.; Barker, M.K.; Martinez Camacho, J.M. New Illumination and Temperature Constraints of Mercury’s Volatile Polar Deposits. Planet. Sci. J. 2020, 1, 57. [Google Scholar] [CrossRef]
  89. Salisbury, J.W. Mid-infrared spectroscopy: Laboratory data. In Remote Geochemical Analysis: Elemental and Mineralogical Composition; Pieters, C.M., Englert, P.A.J., Eds.; Cambridge University Press: New York, NY, USA, 1993; pp. 79–98. [Google Scholar]
  90. Tan, C.Z.; Arndt, J. Interaction of longitudinal and transverse optic modes in silica glass. J. Chem. Phys. 2000, 112, 5970. [Google Scholar] [CrossRef]
  91. Cloutis, E.A.; McCormack, K.A.; Bell, J.F.; Hendrix, A.R.; Bailey, D.T.; Craig, M.A.; Mertzman, S.A.; Robinson, M.S.; Riner, M.A. Ultraviolet spectral reflectance properties of common planetary minerals. Icarus 2008, 197, 321–347. [Google Scholar] [CrossRef]
  92. Morlok, A.; Klemme, S.; Weber, I.; Stojic, A.; Sohn, M.; Hiesinger, H. IR spectroscopy of synthetic glasses with Mercury surface composition: Analogs for remote sensing. Icarus 2017, 296, 123–138. [Google Scholar] [CrossRef]
  93. Stojic, A.N.; Morlok, A.; Tollan, P.; Kohout, T.; Hermann, J.; Weber, I.; Moreau, J.-G.; Hiesinger, H.; Sohn, M.; Bauch, K.E.; et al. A shock recovery experiment and its implications for Mercury’s surface: The effect of high pressure on porous olivine powder as a regolith analog. Icarus 2021, 357, 114162. [Google Scholar] [CrossRef]
  94. Brunetto, R.; Lantz, C.; Ledu, D.; Baklouti, D.; Barucci, M.A.; Beck, P.; Delauche, L.; Dionnet, Z.; Dumas, P.; Duprat, J.; et al. Ion irradiation of Allende meteorite probed by visible, IR, and Raman spectroscopies. Icarus 2014, 237, 278–292. [Google Scholar] [CrossRef]
  95. Lantz, C.; Brunetto, R.; Barucci, M.A.; Dartois, E.; Duprat, J.; Engrand, C.; Godard, M.; Ledu, D.; Quirico, E. Ion irradiation of the Murchison meteorite: Visible to mid-infrared spectroscopic results. Astron. Astrophys. 2015, 577, A41. [Google Scholar] [CrossRef]
  96. McMillan, P.F.; Remmele, R.L. Hydroxyl sites in SiO2 glass: A note on infrared and Raman spectra. Am. Mineral. 1986, 71, 772–778. [Google Scholar]
  97. Brucato, J.R.; Strazzulla, G.; Baratta, G.; Colangeli, L. Forsterite amorphisation by ion irradiation: Monitoring by infrared spectroscopy. Astron. Astrophys. 2004, 413, 395–401. [Google Scholar] [CrossRef]
  98. Harris, T.R. Optical Properties of Si, Ge, GaAs, GaSb, InAs, and InP at Elevated Temperatures. B.S. Thesis, Air Force Institute of Technology, Wright-Patterson Air Force Base, OH, USA, 2010. [Google Scholar]
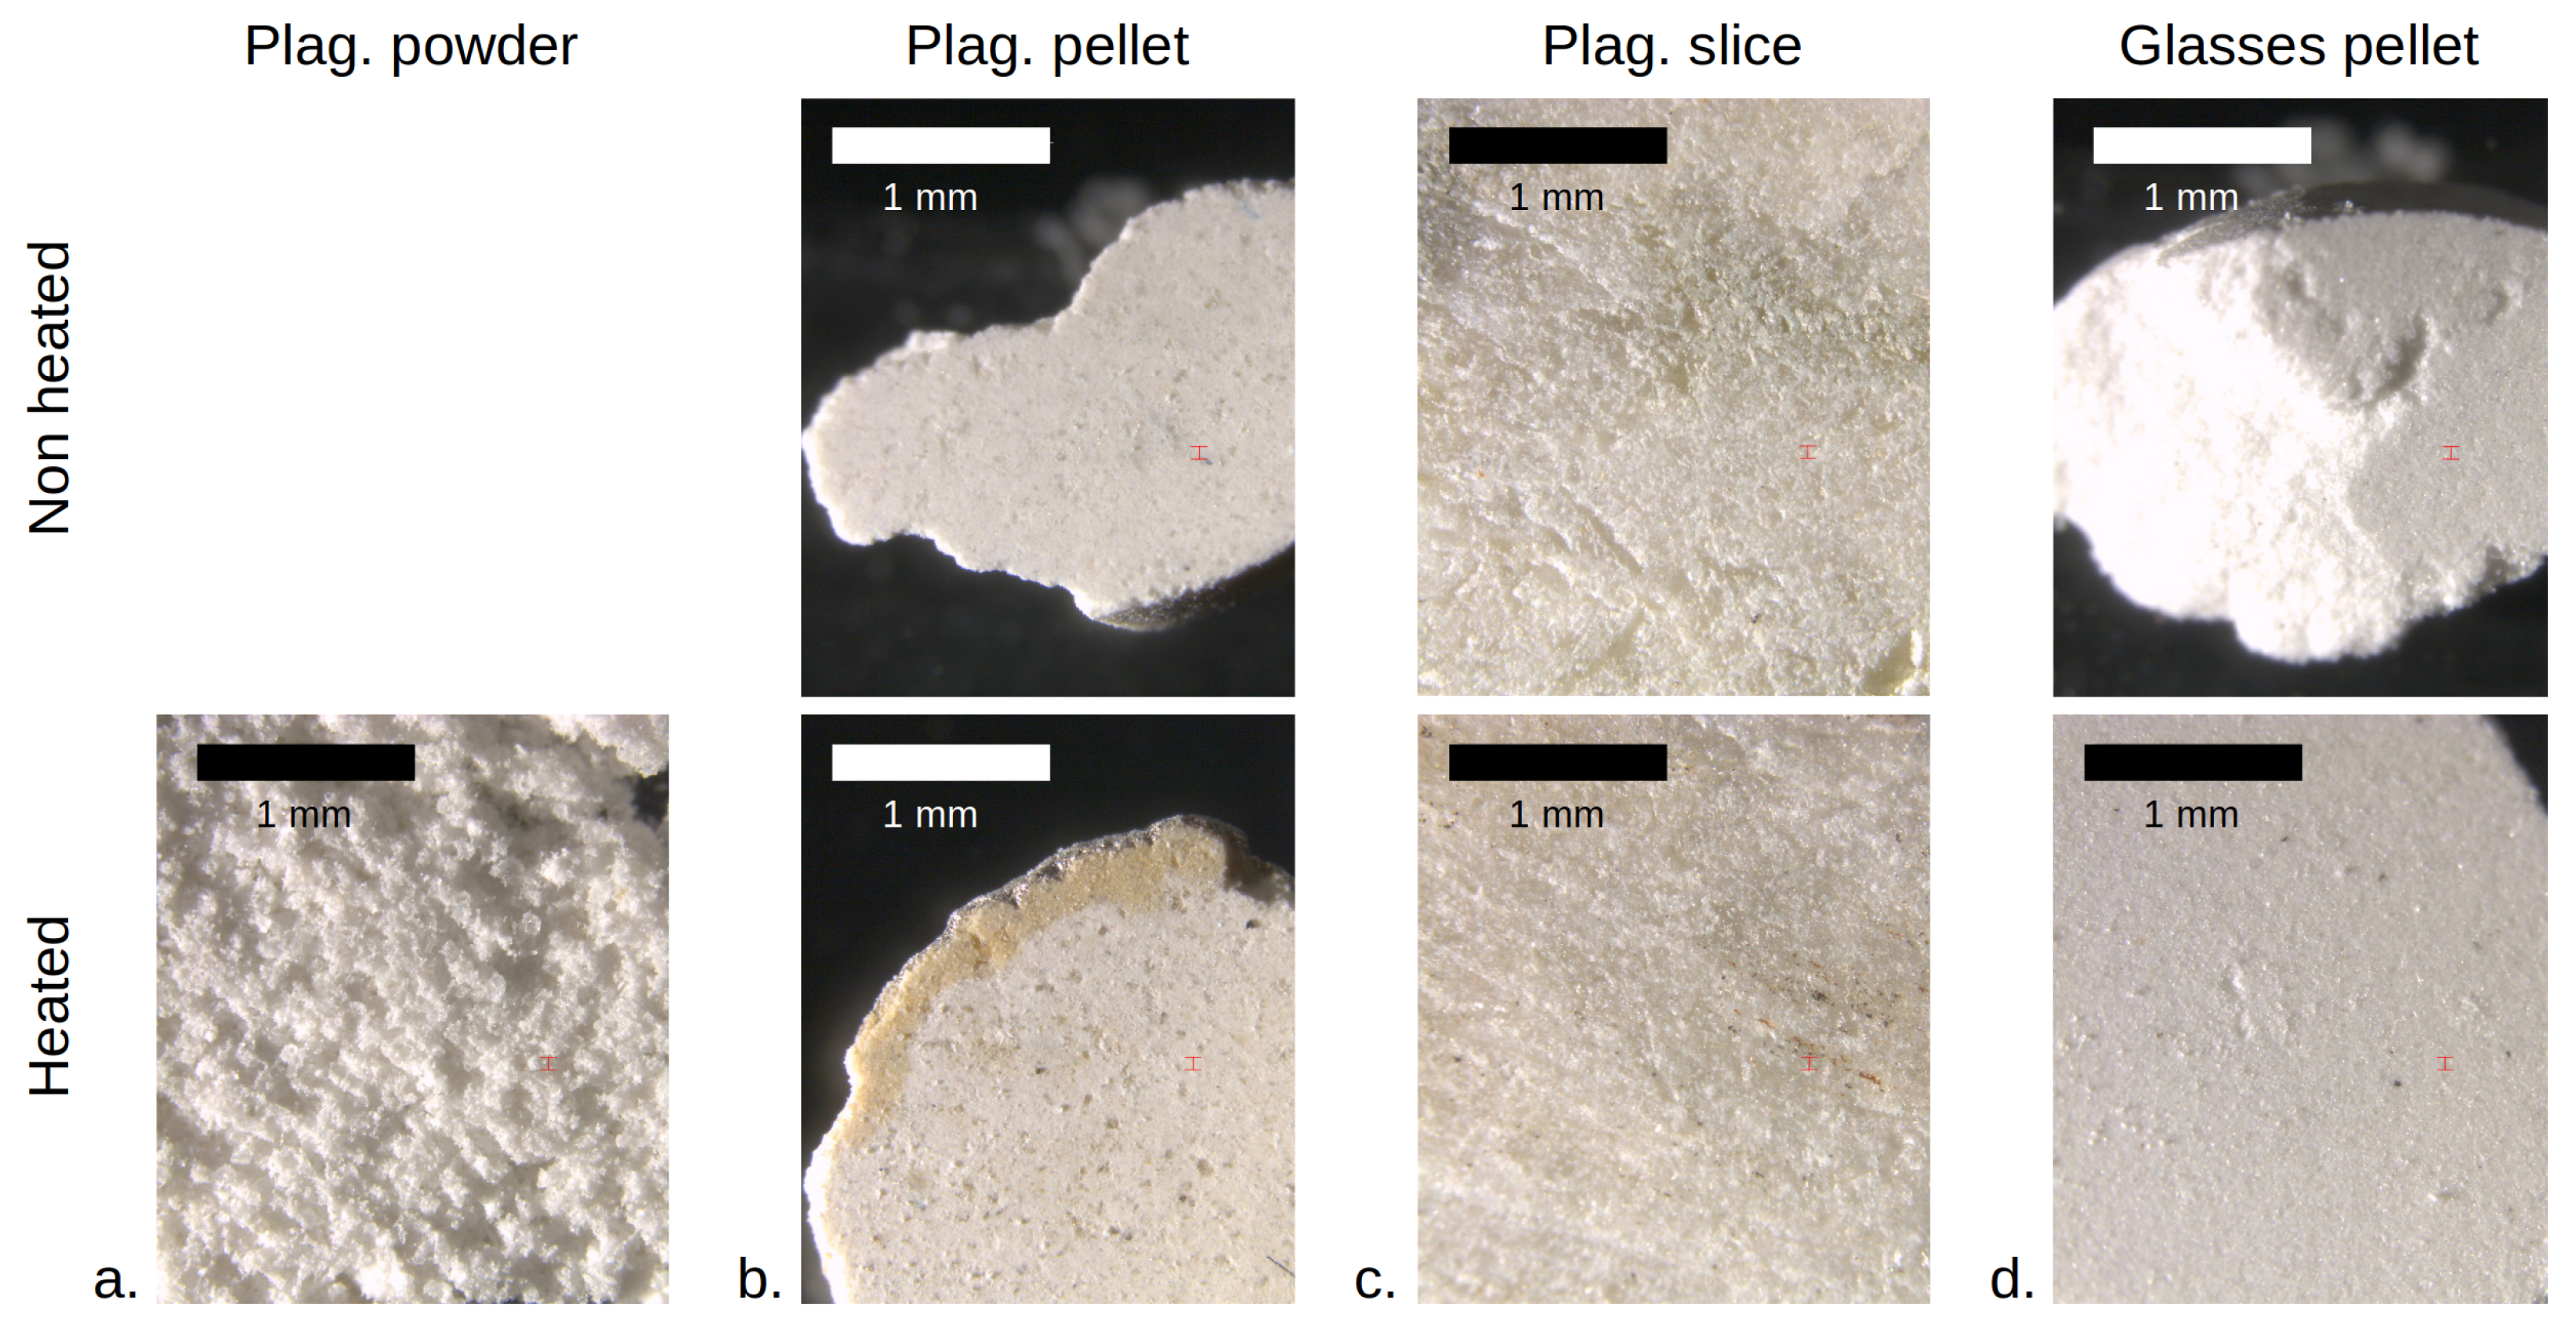
Figure 1. The four samples were observed with a binocular microscope. The top row shows the non-heated samples (when available); the bottom row shows the heated samples. (a) the powder of plagioclase (grain size = 75–100 μ m); (b) the pellet of plagioclase (5 mm diameter); (c) the slice of plagioclase; (d) the pellet of synthetic volcanic glasses (5 mm diameter). No obvious difference in brightness or colour is visible between the heated sample and the same non-heated sample.
Minerals 13 00250 g001
Figure 2. VNIR reflectance spectra of plagioclase samples and volcanic glasses. For each sample, several spectra were collected at different positions on the sample to obtain a more representative insight into the spectral properties. Position numbers in labels are specific to each sample. (Left column): non-heated samples; (Right column): heated samples (distinct from non-heated samples). (Row 1): slice of plagioclase; (Row 2): pellet of plagioclase; (Row 3): powder of plagioclase; (Row 4): pellet of volcanic glasses.
Minerals 13 00250 g002
Figure 3. NIR spectra of plagioclase samples and volcanic glasses at different temperatures for the heating experiment. (a) slice of plagioclase; (b) pellet of plagioclase; (c) powder of plagioclase; (d) pellet of volcanic glasses.
Minerals 13 00250 g003
Figure 4. Spectral variations in the 1.3 μ m band with respect to temperature for the pellet ((a) shift; (b) depth) and the powder of plagioclase ((c) shift; (d) depth); (e) depths normalized to the lowest available temperature value (313 K [40 C] for the pellet, 323 K [50 C] for the powder).
Minerals 13 00250 g004
Figure 5. Spectral variations in the 3.0 μ m band with respect to temperature for the pellet ((a) shift; (b) depth) and the powder of plagioclase ((c) shift; (d) depth).
Minerals 13 00250 g005
Figure 6. Spectral variations in the 3.0 μ m band with respect to temperature for the pellet of volcanic glasses. (a) Shift; (b) depth.
Minerals 13 00250 g006
Figure 7. NIR spectra of plagioclase samples at different temperatures for the cooling experiment. (a) slice; (b) pellet.
Minerals 13 00250 g007
Figure 8. (a) Shift in the 3.0 μ m band with respect to temperature for the pellet of plagioclase; (b) NIR spectral slope on 1.7–2.6 μ m with respect to the temperature for the slice and pellet of plagioclase.
Minerals 13 00250 g008
Figure 9. MIR spectra of the samples of plagioclase at different temperatures. (a) powder; (b) pellet; (c) slice; (d) slice at T = 373 K (100 C) and 673 K (400 C) normalized to the RB3 maximum. The approximate positions of CF, RB1, RB2, RB3, and TF are indicated on each panel.
Minerals 13 00250 g009
Figure 10. MIR spectra of the samples of the pellet of volcanic glasses at different temperatures. (Left) During heating; (Right) when cooling to room temperature.
Minerals 13 00250 g010
Figure 11. Shift in the main MIR bands with respect to the temperature for the plagioclase samples. (a) CF; (b) RB1 (9.0 μ m); (c) RB3 (10.5 μ m); (d) TF (12.1 μ m).
Minerals 13 00250 g011
Figure 12. Shift in the CF with respect to temperature for the pellet of volcanic glasses.
Minerals 13 00250 g012
Figure 13. Spectral variations in the 9.8 μ m band with respect to temperature for the pellet of volcanic glasses. (a) Shift; (b) depth.
Minerals 13 00250 g013
Figure 14. MIR spectra of the pellet of plagioclase at different temperatures and with different heating steps. (a): During heating (heating step = 25 K); (b): When cooling to room temperature (heating step = 10 K between 423 K [150 C] and 373 K [100 C], 15 C between 373 K and 313 K [40 C]).
Minerals 13 00250 g014
Table 1. Mean values of spectral slope (%/100 nm) between 0.5 and 0.8 μ m for each sample. Uncertainties correspond to 1 σ .
SampleAn 80 SliceAn 80 PelletAn 80 PowderGlasses Pellet
Non-heated−1.81 ± 1.022.31 ± 0.373.09 ± 0.80.60 ± 0.21
Heated−0.99 ± 0.364.29 ± 0.153.15 ± 0.161.61 ± 0.1
Table 2. Mean values of ratio 1.0/0.8 μ m for each sample. Uncertainties correspond to 1 σ .
SampleAn 80 SliceAn 80 PelletAn 80 PowderGlasses Pellet
Non-heated0.854 ± 0.030.963 ± 0.0050.953 ± 0.020.995 ± 0.005
Heated0.880 ± 0.020.983 ± 0.0040.980 ± 0.10.995 ± 0.005
Table 3. Mean values of reflectance at 0.5 μ m for each sample. Uncertainties correspond to 1 σ .
SampleAn 80 SliceAn 80 PelletAn 80 PowderGlasses Pellet
Non-heated0.478 ± 0.1200.934 ± 0.0240.529 ± 0.0840.829 ± 0.016
Heated0.375 ± 0.1300.790 ± 0.0120.801 ± 0.1080.990 ± 0.005
Table 4. Variations in spectral parameters with heating. ‘+’ means an increase, ‘-’ a decrease and ‘=’ no variation. (?) is to warn of uncertainty because too few points were taken for the mean.
An 80 SliceAn 80 PelletAn 80 PowderGlasses Pellet
Spectral slope (0.5–0.8 μ m)++=+
Ratio NIR (1.0/0.8 μ m)+++= (?)
Reflectance at 0.5 μ m--++
Table 5. Expected effects of heating on selected spectral parameters of interest for the SIMBIO-SYS (VNIR range) and MERTIS (MIR range) instruments in two different locations on Mercury: intercrater plains (analog = plagioclase) and Northern Volcanic Plains (analog = volcanic glasses). ‘+’ stands for an increase in the spectral parameter, ‘-’ for a decrease, and ‘N/A’ if the spectral parameter is unavailable for the corresponding analog.
Wavelength RangeSpectral Parameter of InterestIntercrater Plains (Plagioclase)Northern Volcanic Plains (Volcanic Glasses)
VNIR (0.4–2.0 μ m)1.3 μ m band depth-N/A
VIS spectral slope (0.5–0.8 μ m)++
Reflectance at 1.0 μ m / reflectance at 0.8 μ m+N/A
MIR (7–14 μ m)Christiansen feature position (∼8 μ m)++
Reststrahlen band 1 position (∼9 μ m)++
Disclaimer/Publisher’s Note: The statements, opinions and data contained in all publications are solely those of the individual author(s) and contributor(s) and not of MDPI and/or the editor(s). MDPI and/or the editor(s) disclaim responsibility for any injury to people or property resulting from any ideas, methods, instructions or products referred to in the content.