Article

The Correlation of Colour and Iron Oxides in Yellow Seal Stones from Northern Laos

1
Institute of Gemology, China University of Geosciences, No. 388, Lumo Road, Wuhan 430074, China
2
School of Earth Sciences, China University of Geosciences, No. 388, Lumo Road, Wuhan 430074, China
*
Author to whom correspondence should be addressed.
Minerals 2023, 13(2), 291; https://doi.org/10.3390/min13020291
Submission received: 14 December 2022 / Revised: 1 February 2023 / Accepted: 16 February 2023 / Published: 19 February 2023
(This article belongs to the Special Issue Gem Deposits: Mineralogical and Gemological Aspects)

Abstract

:
The yellow seal stone from northern Laos is one possible substitute for the Tianhuang Stone, the most famous Chinese seal stone, because of its similar yellow to orange-yellow appearance and the same main mineral composition. The colour causation of the yellow seal stone from northern Laos was studied. The samples’ phase, micro-morphology and chemical components were studied by Raman spectroscopy, and scanning electron microscopy (SEM) with energy disperse spectroscopy (EDS), respectively. The yellow seal stone from northern Laos is mainly composed of dickite, occasionally with minor impurity minerals, such as hematite, anatase, barite, diaspore and pyrite. Micro- to nano-sized iron oxides/hydroxides were observed and detected by SEM and EDS in the yellow to orange-yellow part of the samples. Moreover, these iron oxides/hydroxides were suggested to cause the yellow to orange-yellow in the seal stone from northern Laos. The UV-Vis spectrum and its second derivative, the Kubelka-Munk spectra, were used to identify and quantify hematite and goethite. The samples’ colour parameters were obtained with the Commission Internationale de l’Eclairage (CIE) 1931 standard space. According to the observation of the samples and the results obtained from experiments and calculations, the colour of the yellow parts (L* = 33.56~47.99, a* = 0.35~3.65, b* = 4.55~9.89) correlated with goethite (goethite is about 0.175~0.671 g/kg, the content of hematite was too low to be figured out in the yellow parts). In contrast, the colour of the orange-yellow parts (L* = 33.99~46.27, a* = 3.98~12.39, b* = 8.04~22.14) was more closely related with the content of hematite (goethite is about 0.096~0.691 g/kg, hematite is about 0.258~2.383 g/kg). The results of correlation analysis also support that the contents of iron oxides or hydroxides influence the samples’ colour. Therefore, it is suggested that micro- to nano-scaled hematite and goethite caused the colour of yellow and orange-yellow in the studied seal stone. Hematite can strengthen the red hue and change the colour from yellow to orange-yellow.

1. Introduction

The yellow seal stone from northern Laos is a kind of phyllosilicate aggregate formed from hydrothermal alternation, which has similar mineral composition and colour to the most famous Chinese seal stone, Tianhuang Stone [1,2]. Recently, it has entered the seal stone market and sold well. However, the mining position of the northern Laos yellow seal stones remains a secret. Yellow is the most attractive and valuable colour of seal stone in China. Therefore, the colour causation and evaluation study are conducive to finding the value of the yellow seal stone from northern Laos.
According to earlier studies, the main mineral components of yellow seal stone from Northern Laos are dickite and kaolinite, similar to Tianhuang stone [1]. However, it has not yet been studied how the yellow seal stone from northern Laos acquired its colour. Several papers reported on the colour-forming mechanism of Tianhuang stone. It was considered to form through hydrothermal alternation and water-rock reaction processes [1,2,3]. It has been proved that the chromogenic Fe does not exist as a substitution ion for Al in dickite in the Tianhuang stone but as newly formed iron oxides/hydroxides among dickite particles [2]. The Diffuse Reflectance Spectrum (DRS) technique was applied in the research of red seal stone from Laos to explore its colour mechanism. It found that its colour came from hematite particles formed on the surface of dickite particles [4]. The authors suggested that relatively high temperature and low humidity is the suitable formation condition, which is beneficial to form hematite [5,6,7,8]. Multiple linear regression was adopted to examine the connection between mixed iron oxide contents and reflectance intensity acquired from DRS [9,10]. DRS is a commonly-used method in the study of low-concentration iron oxides/hydroxides due to its low detection limit. The first derivative of percent reflectance curves could even detect iron oxides at 0.01 wt% [11,12]. The newly formed (secondary) iron oxides/hydroxides are usually less than 1% in igneous, metamorphic, and sedimentary rocks and soils, so it is hard to extract or identify by other techniques. DRS method is widely used in the study of loess or other soils containing iron oxides and iron hydroxides [7,13,14,15]. It was also used in researching gemstones, such as Beihong agates [9]. To determine the association between colour and iron oxides in agates, the researchers used correlation analysis to integrate the values of colour parameters and total Fe content [16].
To this day, there have not been any researchers applying techniques of quantitative colour analysis to investigate seal stones. This study will analyse the colour feature of the yellow seal stone from Northern Laos, trying to find related colour-causing minerals and illustrate colour-influenced factors of the yellow seal stones.

2. Materials and Methods
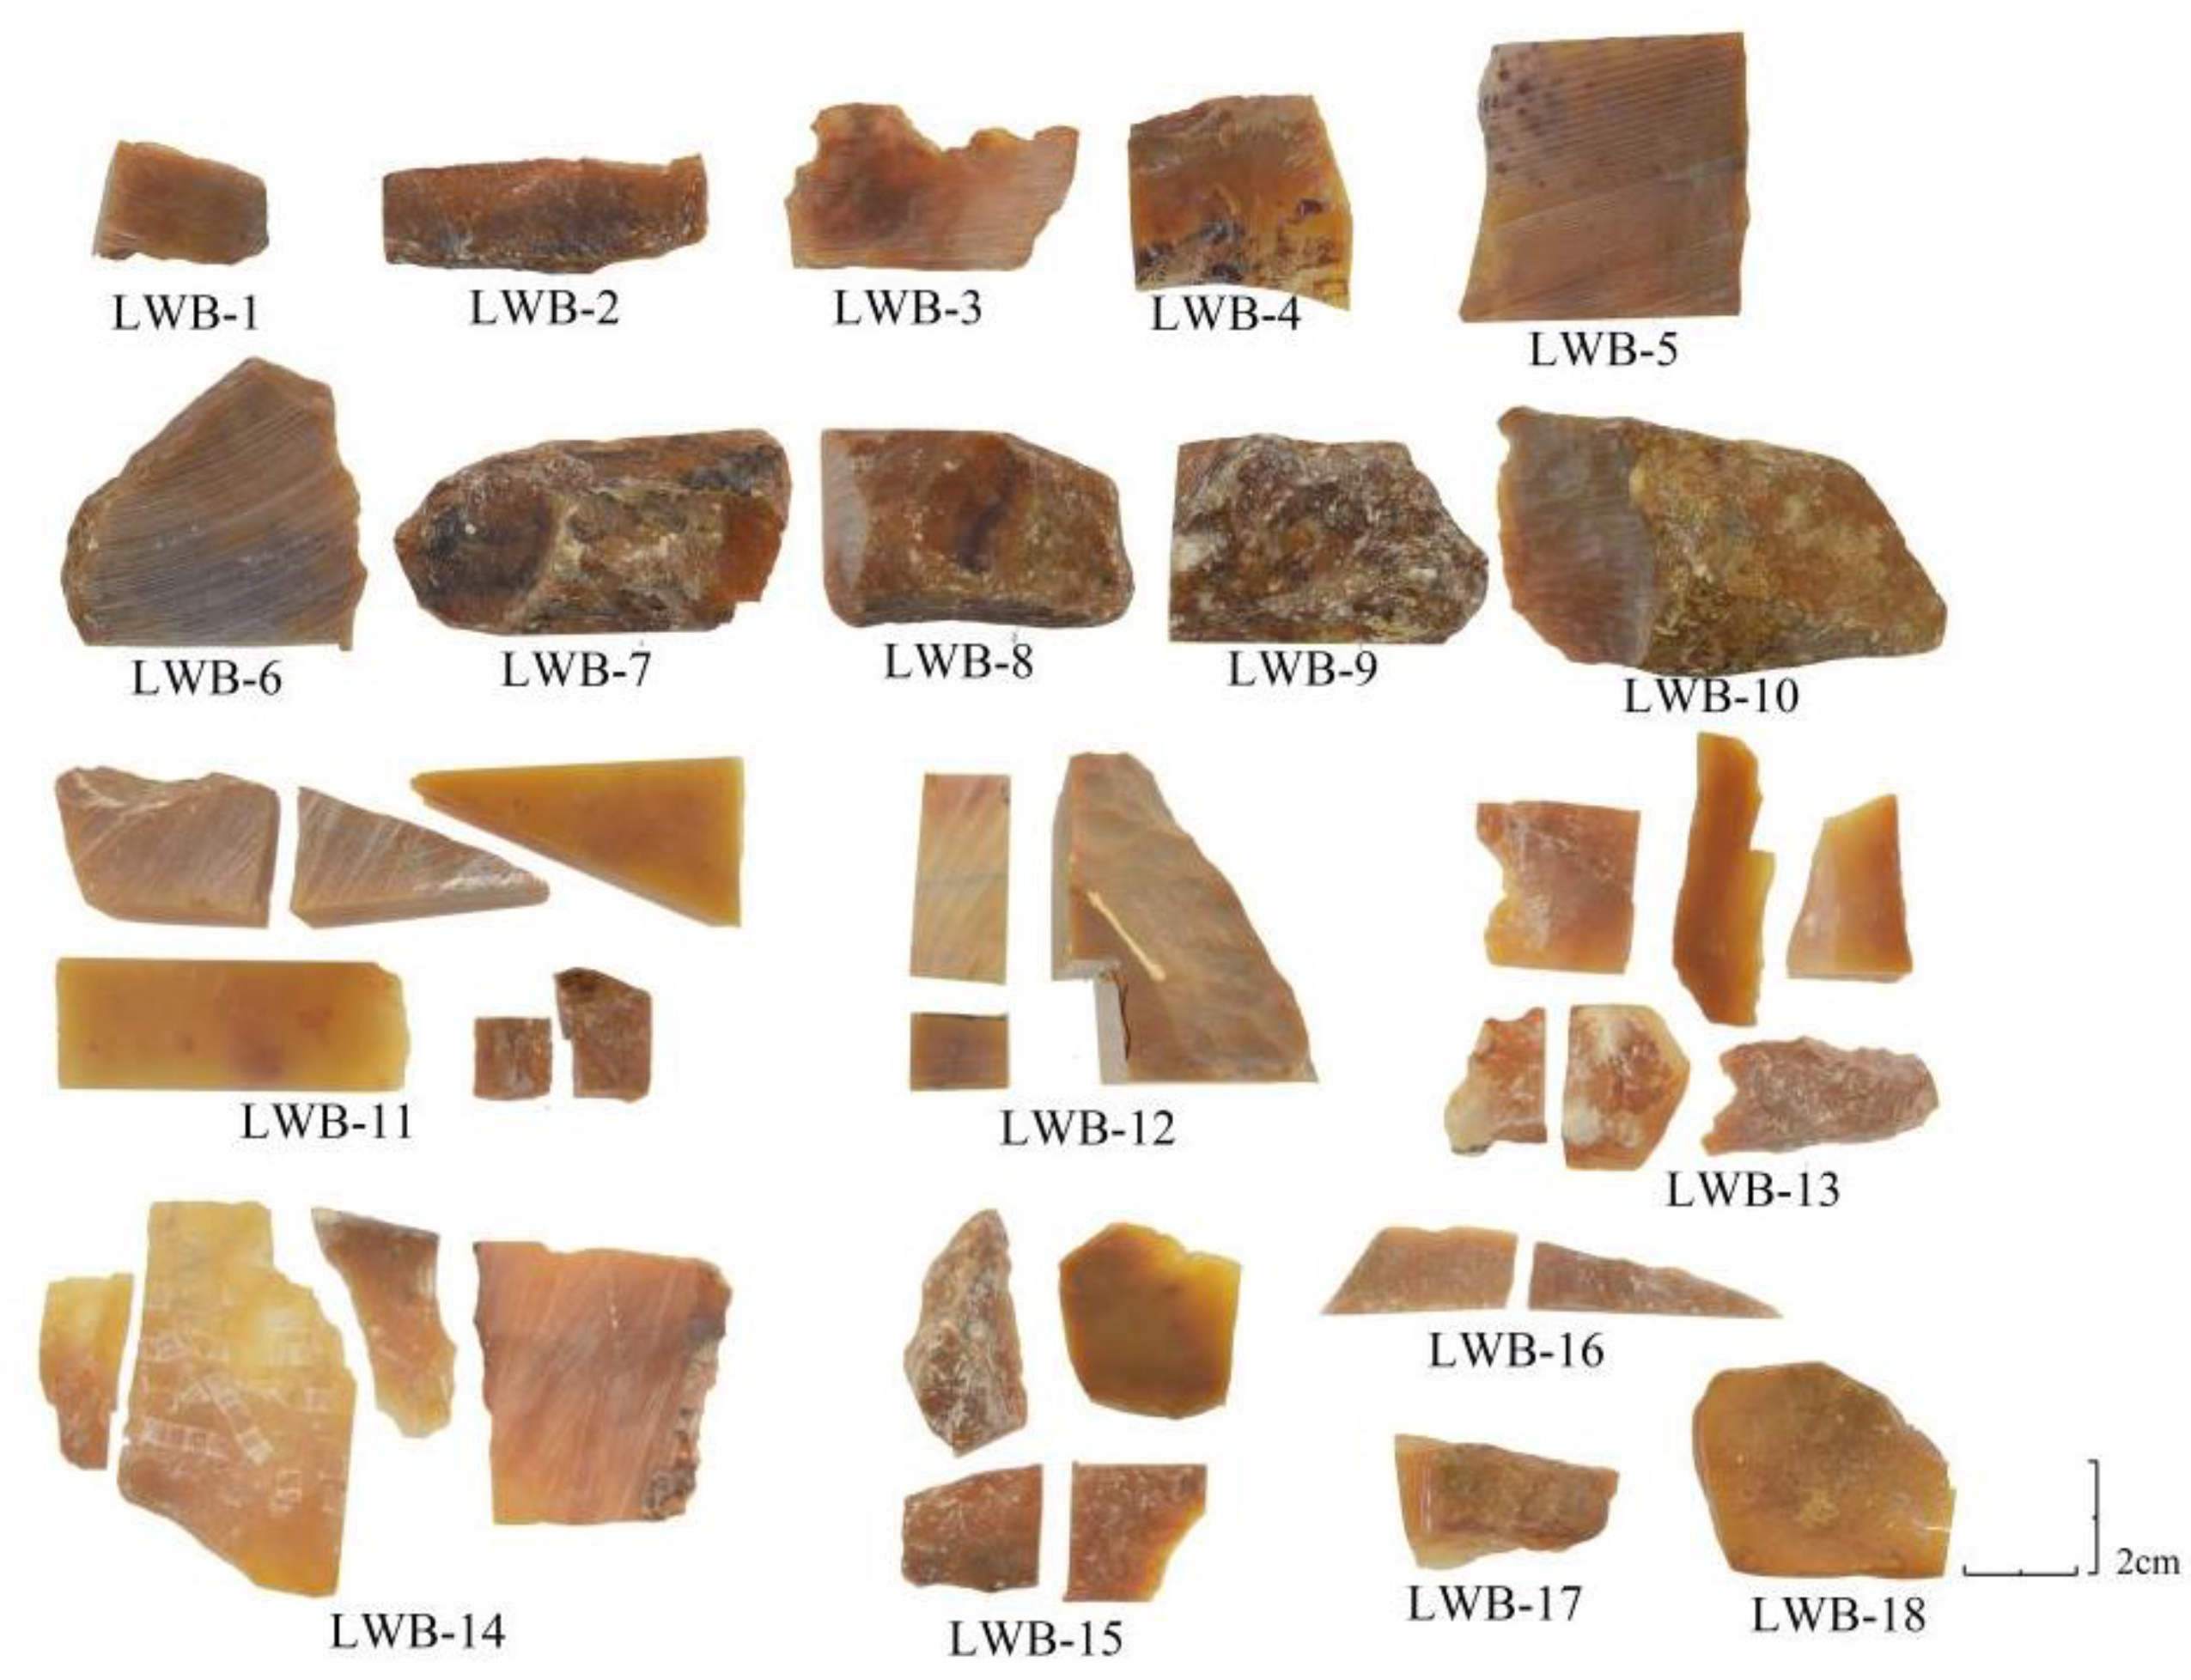
2.1. Samples

The study focused on 44 yellow seal stone samples from northern Laos. All the samples are dense, massive aggregates. Some of them have a thin weathered crust. The colour distribution is usually not uniform in a sample, taking on yellow to orange-yellow in different areas.
Some of these samples are exhibited in Figure 1. The camera used for photography was the Leica M205 A/DFC500 System at the Gemmological Institute, China’s University of Geosciences. All the samples were polished and tested using the reflection method to collect UV-Vis spectroscopy and its colour parameters. Considering the samples’ inhomogeneity of the colour areas, 2~3 spots in the same colour area were tested in a sample.

2.2. Laser Raman Spectroscopy

Sample LWB-1~18 and their inclusions were acquired by Horiba Evolution HR Raman Spectroscopy at Geological Processes and Resource Minerals Laboratory at the China University of Geosciences. The experiment conditions are as follows: testing range: 100–1500 cm−1 and 100–4000 cm−1; laser light source: 532 nm; laser power: 50 mW; optical grating: 600 gr/mm; acquisition time: 3 s.

2.3. Scanning Electron Microscope

Small pieces with fresh fractures from the original samples were tested with ThermoFisher Helios G4 CX Scanning Electron Microscope and Oxford Instrument AZtec X-max 80 energy disperse spectroscopy. The collected energy spectra were analysed with AZtec 5.0. The experiment conditions are as follows: operating voltage: 20 kV; operating current: 9.3 nA; beam spot: 3.0 μm; working distance: 10 mm.

2.4. UV-Vis Reflectance Spectra

The reflection spectra of these samples were obtained with a Gem UV-100 UV-Vis spectrophotometer at the Gemmological Institute, China University of Geosciences. Test condition: light source: deuterium lamp and tungsten lamp; range 400 ~ 800 nm; integration time: 100 ms; average time: 23 times. The original UV-Vis spectra were first processed using the Kubelka-Munk (K-M) transformation and then attained the 2nd derivative spectra, respectively. K in the formula below is the absorption coefficient, S is the scattering coefficient, and R represents reflectance. The derivative curves were used to calculate the content of goethite and hematite. The derivative calculation method was based on the formulas in the thesis of Scheinost (1998) [17] and Torrent (2007) [18].
F ( R ) = K S = ( 1 R ) 2 2 R

2.5. Colourimetric Analysis

The colour parameters of the forty-four samples were acquired from Gem UV100 UV-Vis spectroscopy and created projections in the Commission Internationale de l’Eclairage (CIE) uniform colour space. Each sample was measured in areas with different colours, and 2~3 spots were tested in each area because of colour inhomogeneity. These measurements were performed under CIE standard illumination D65 lighting source, with observer angle 10° and reflection method. Chroma (C*) and hue angle (h°) could be calculated from redness (a*) and yellowness (b*) by formulations below [16]:
C * = a * 2 + b * 2
H ° = arctan b * a *

3. Results and Discussion

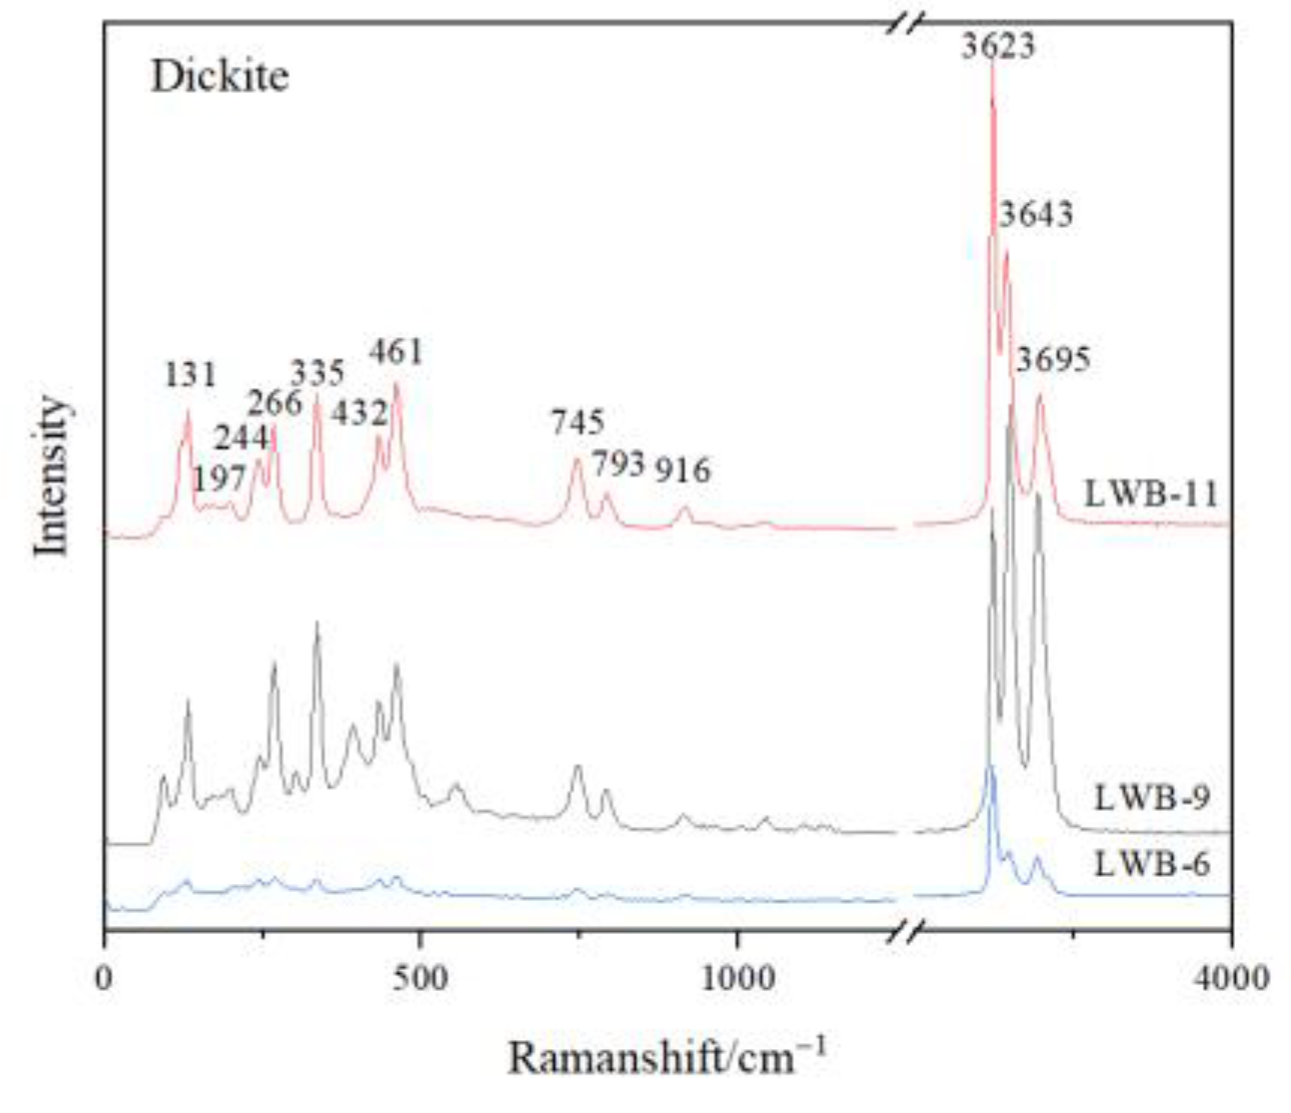
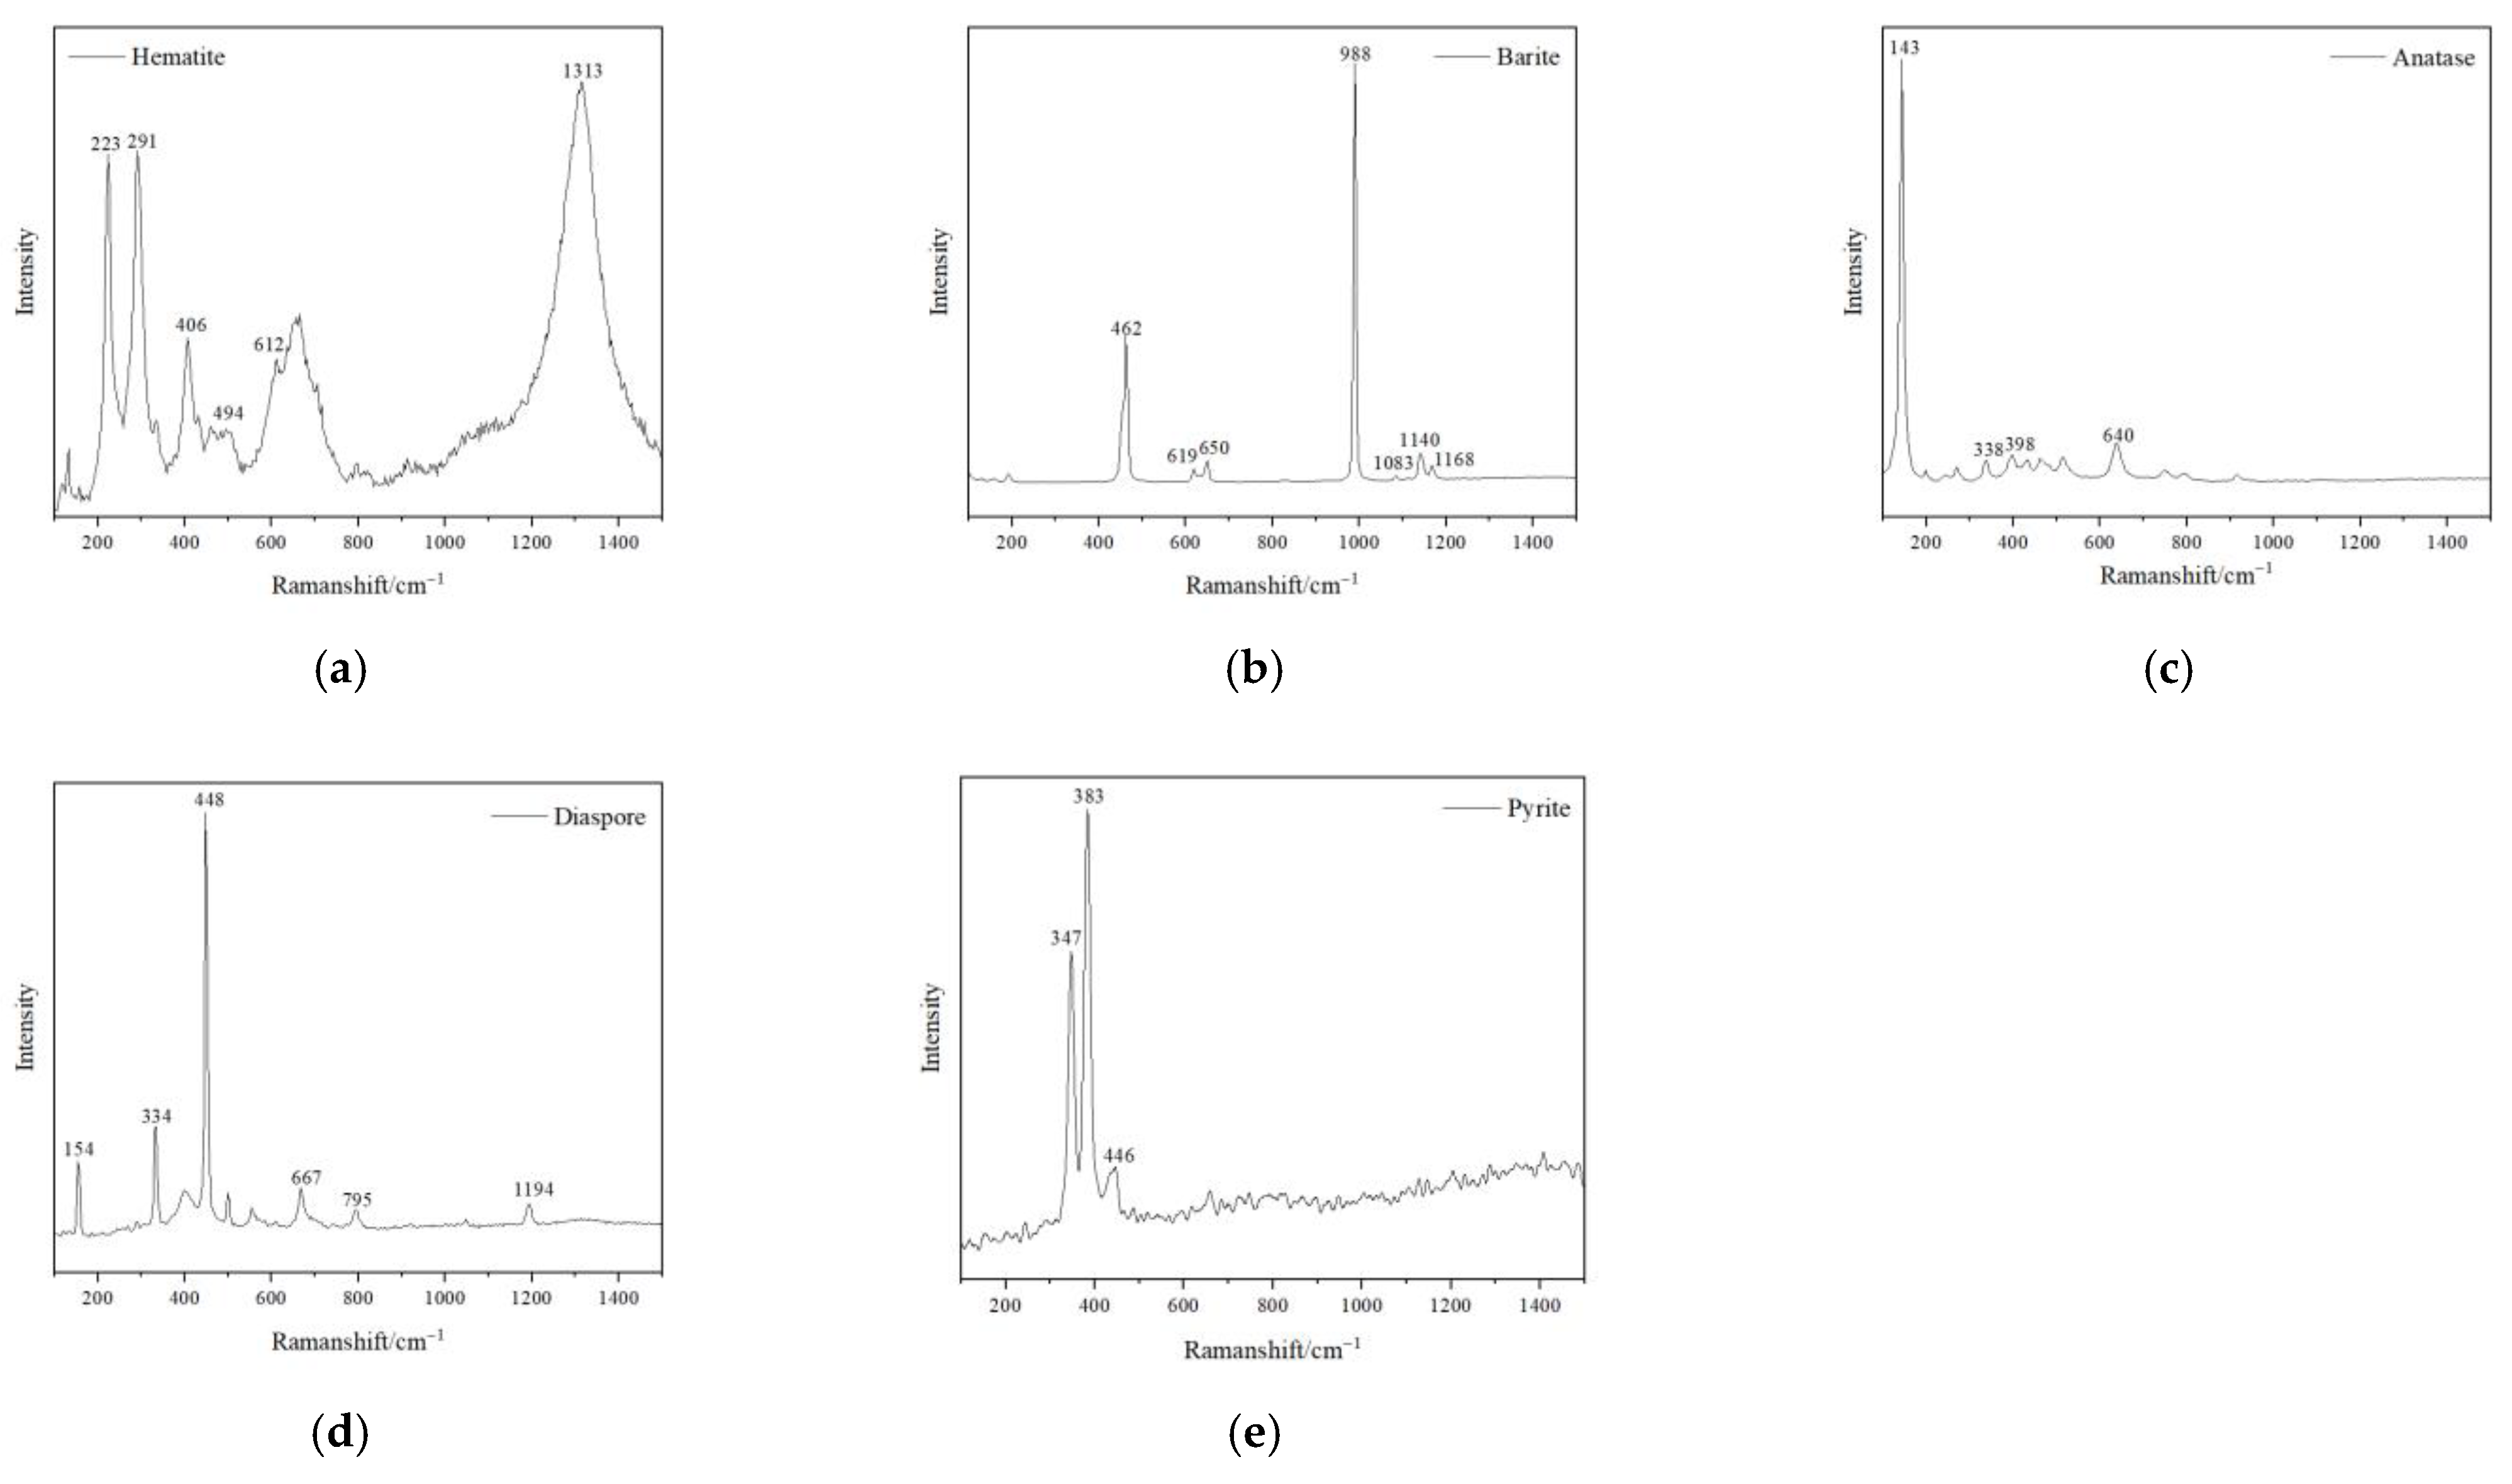
3.1. Laser Raman Spectrum

The studied yellow matrix of Laos yellow seal stones was relatively homogeneous in texture and inhomogeneous in colour (Figure 2a–c). The cracks usually take on a red or brown colour. Various impurity minerals were randomly distributed in the matrix of Laos seal stone (Figure 2e,f). Raman spectroscopy was used to test the mineral phase of the matrix and the impurity minerals. The pink dots can be observed by bare eyes in the yellow matrix, while some impurity minerals with other colours need to be observed by microscope (Figure 2).
The matrix of all the samples is composed of dickite, though it took on different hues of yellow colour. The characteristic Raman shifts of the tested dickite were at 136 cm−1, 241 cm−1, 270 cm−1, 337 cm−1, 434 cm−1, 462 cm−1, 750 cm−1, 797 cm−1, 918 cm−1, 3623 cm−1, 3643 cm−1 and 3695 cm−1 (Figure 3). Hematite was detected in the red cracks, which showed the characteristic Raman shifts at 225 cm−1, 296 cm−1, 411 cm−1 and 1318 cm−1 (Figure 4a) [8]. Barite was detected in the pink dots, which showed the characteristic Raman shifts at 462 cm−1, 619 cm−1, 650 cm−1, 988 cm−1, 1083 cm−1, 1140 cm−1 and 1168 cm−1 (Figure 4d). Anatase (characteristic Raman shifts at 143 cm−1, 338 cm−1, 398 cm−1, 640 cm−1), diaspore (characteristic Raman shifts at 154 cm−1, 334 cm−1, 448 cm−1, 667 cm−1, 795 cm−1 and 1194 cm−1) and pyrite (347 cm−1, 383 cm−1, 446 cm−1) were also detected in the cloudy pink areas (Figure 4b,c,e).
The open fractures and cracks were filled with hematite and took on a red colour. It is the same as the conclusion of the mineral composition as the red cracks tested in Tianhuang stone [2]. However, the characteristic of colour distribution is different between them. Tianhuang stone shows a more uniform yellow colour distribution. It indicates that the two seal stones may have similar and different forming processes. Pyrite is frequently found in hydrothermal alternation rocks. Subsequently, pyrite is easily oxidised to be iron oxides/hydroxides during the weathering processes in humid tropical and subtropical conditions [8,19,20,21,22]. It may be one of the reasons for iron oxide/hydroxide formation.

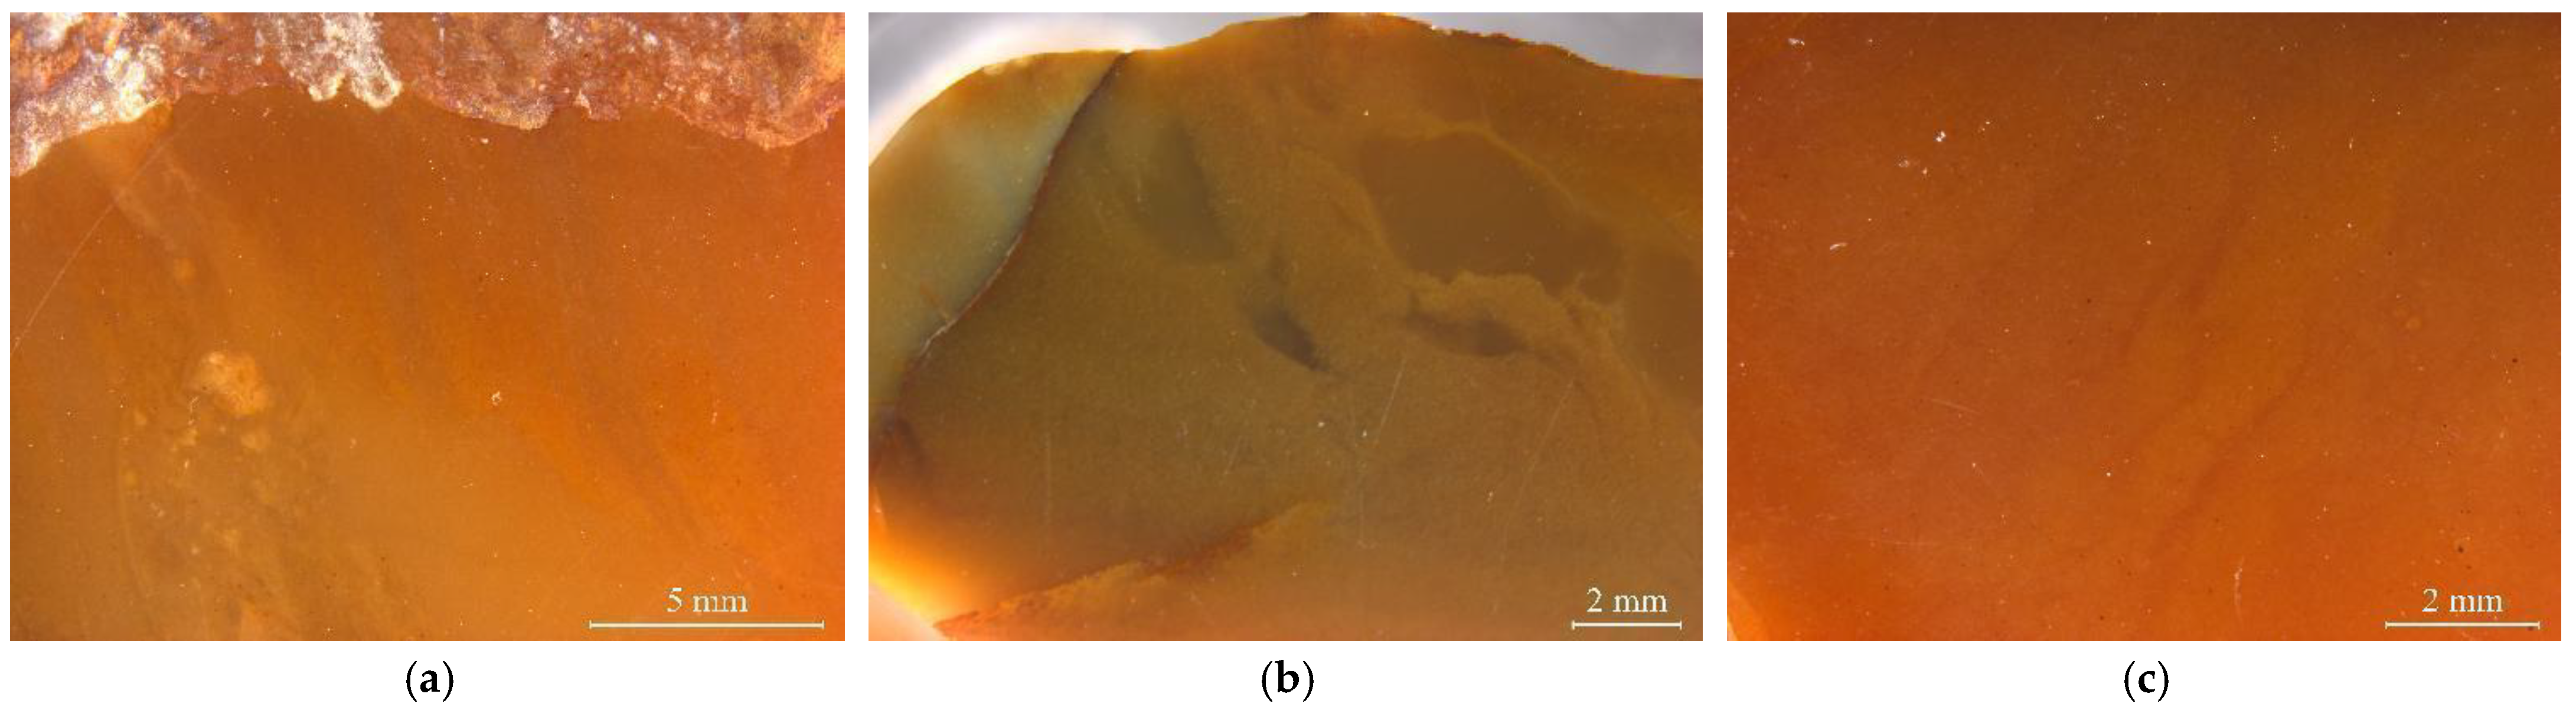
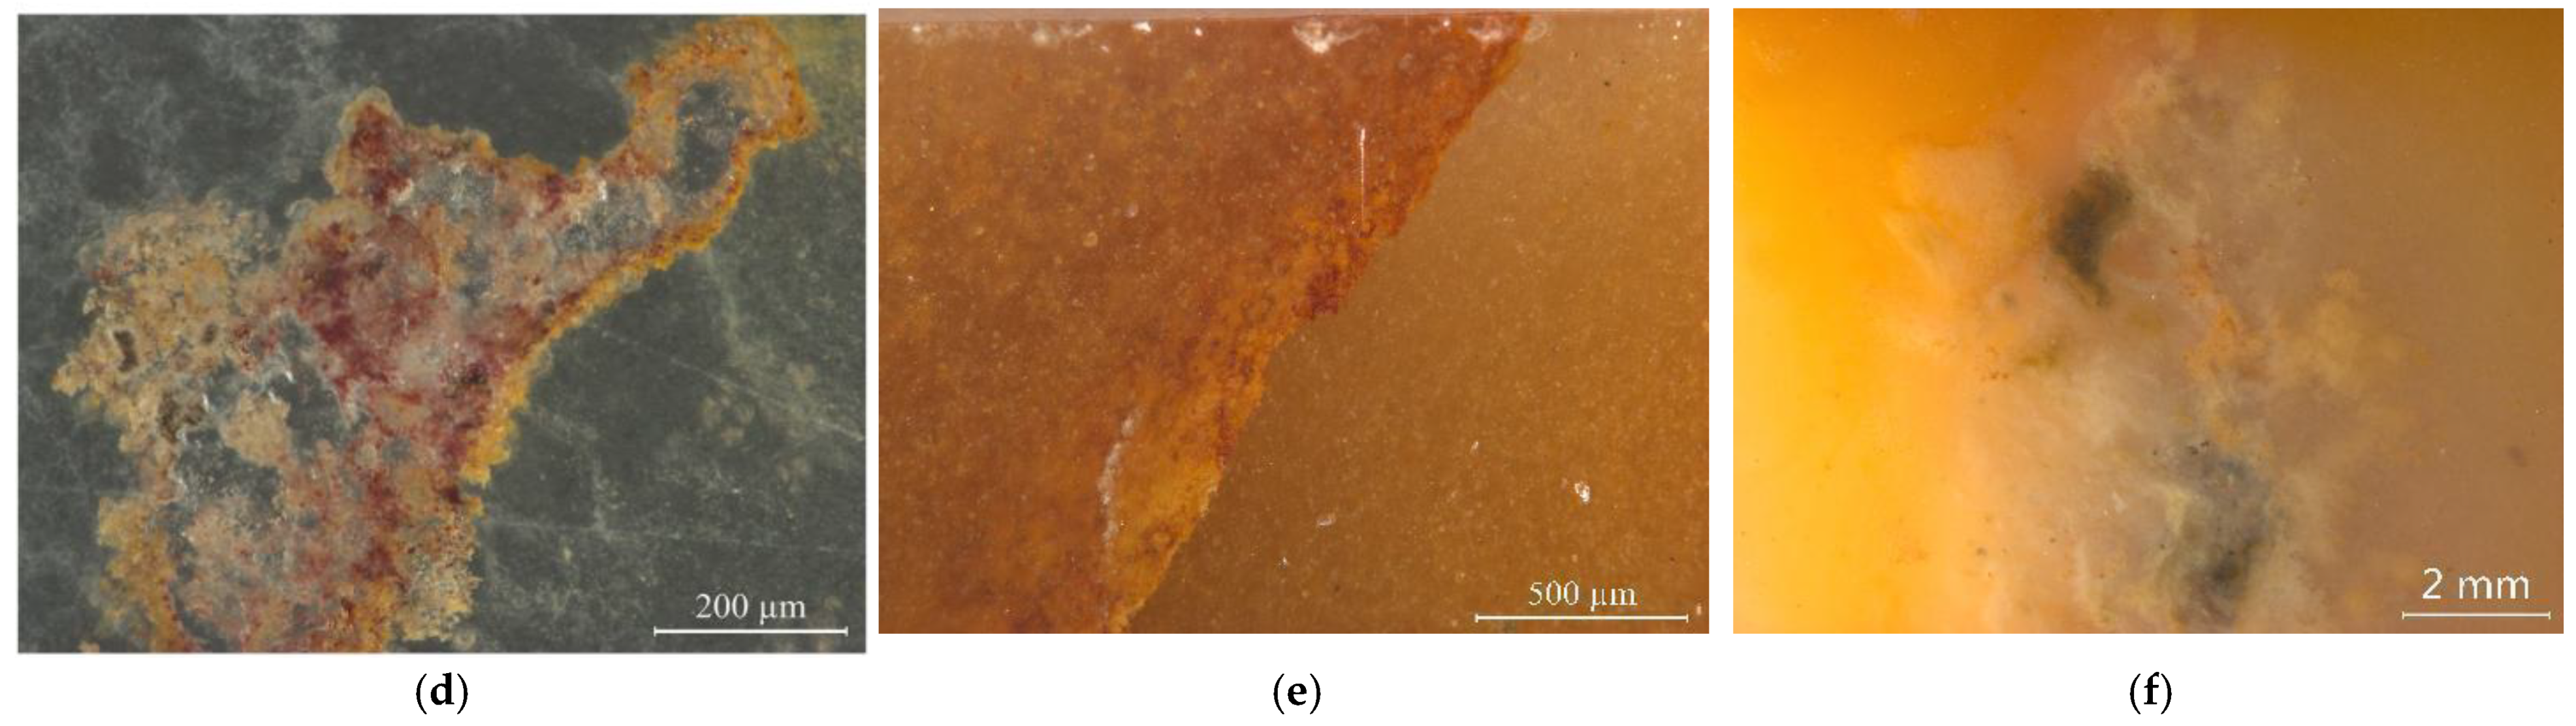
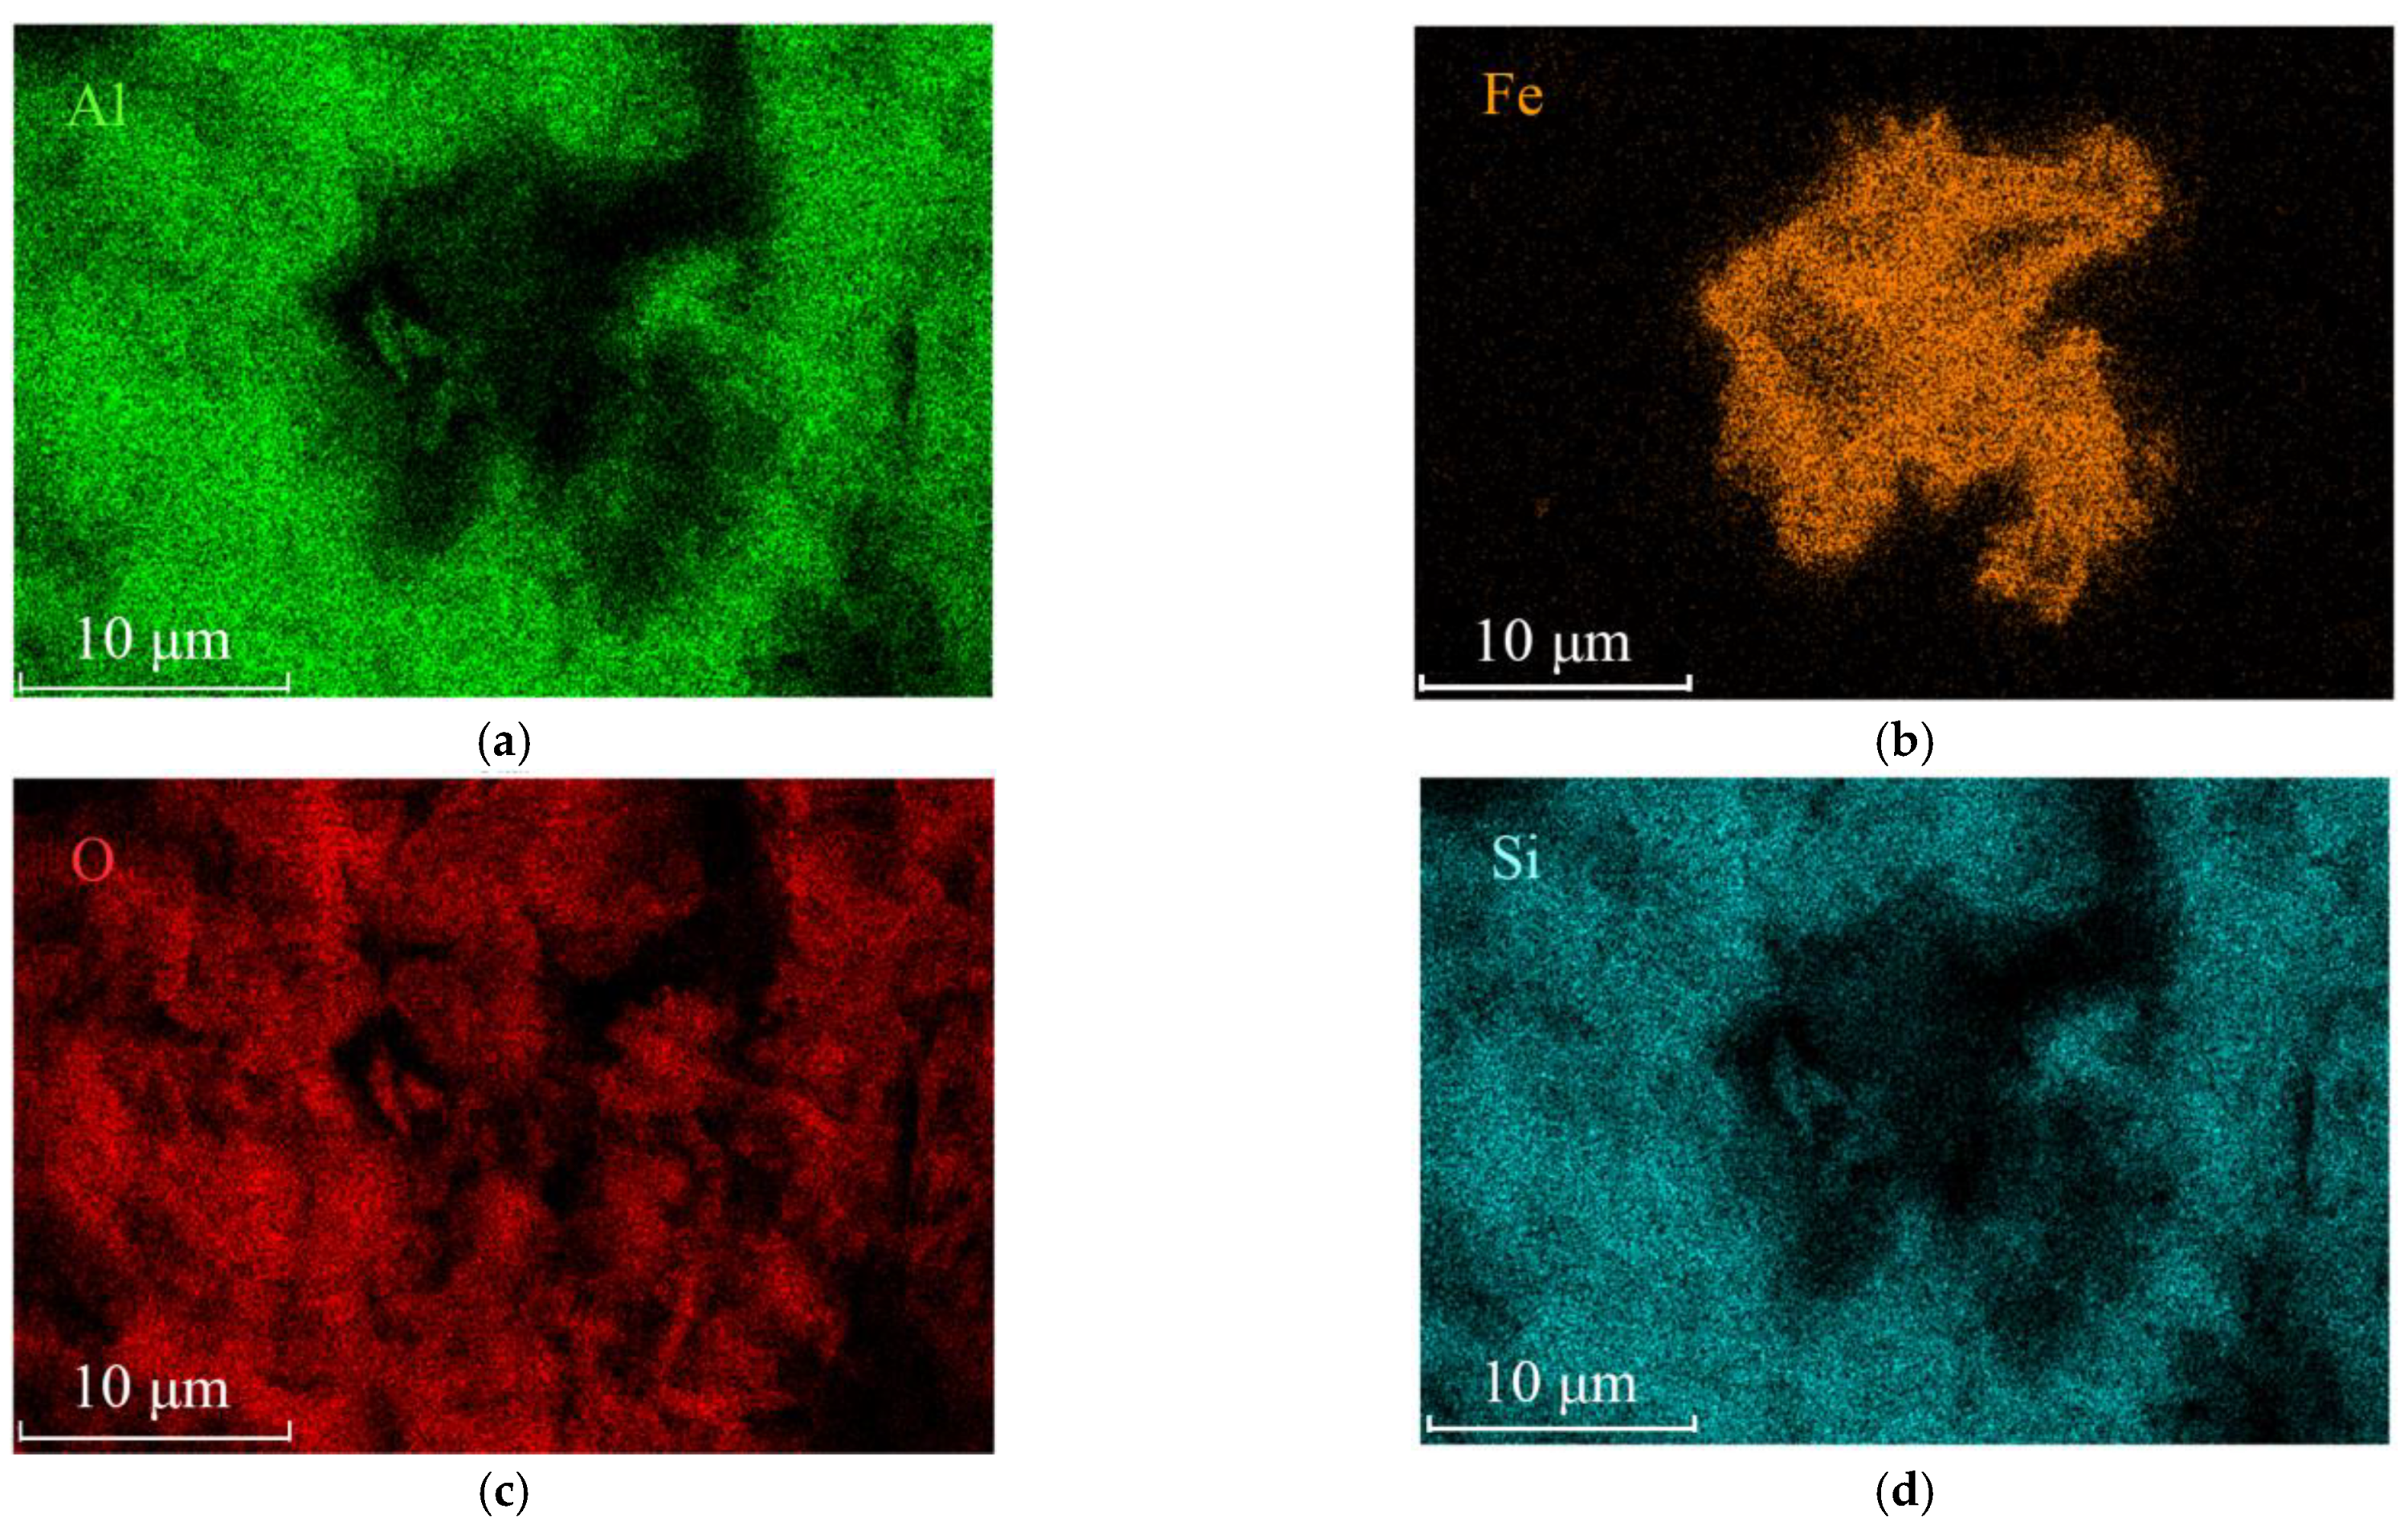
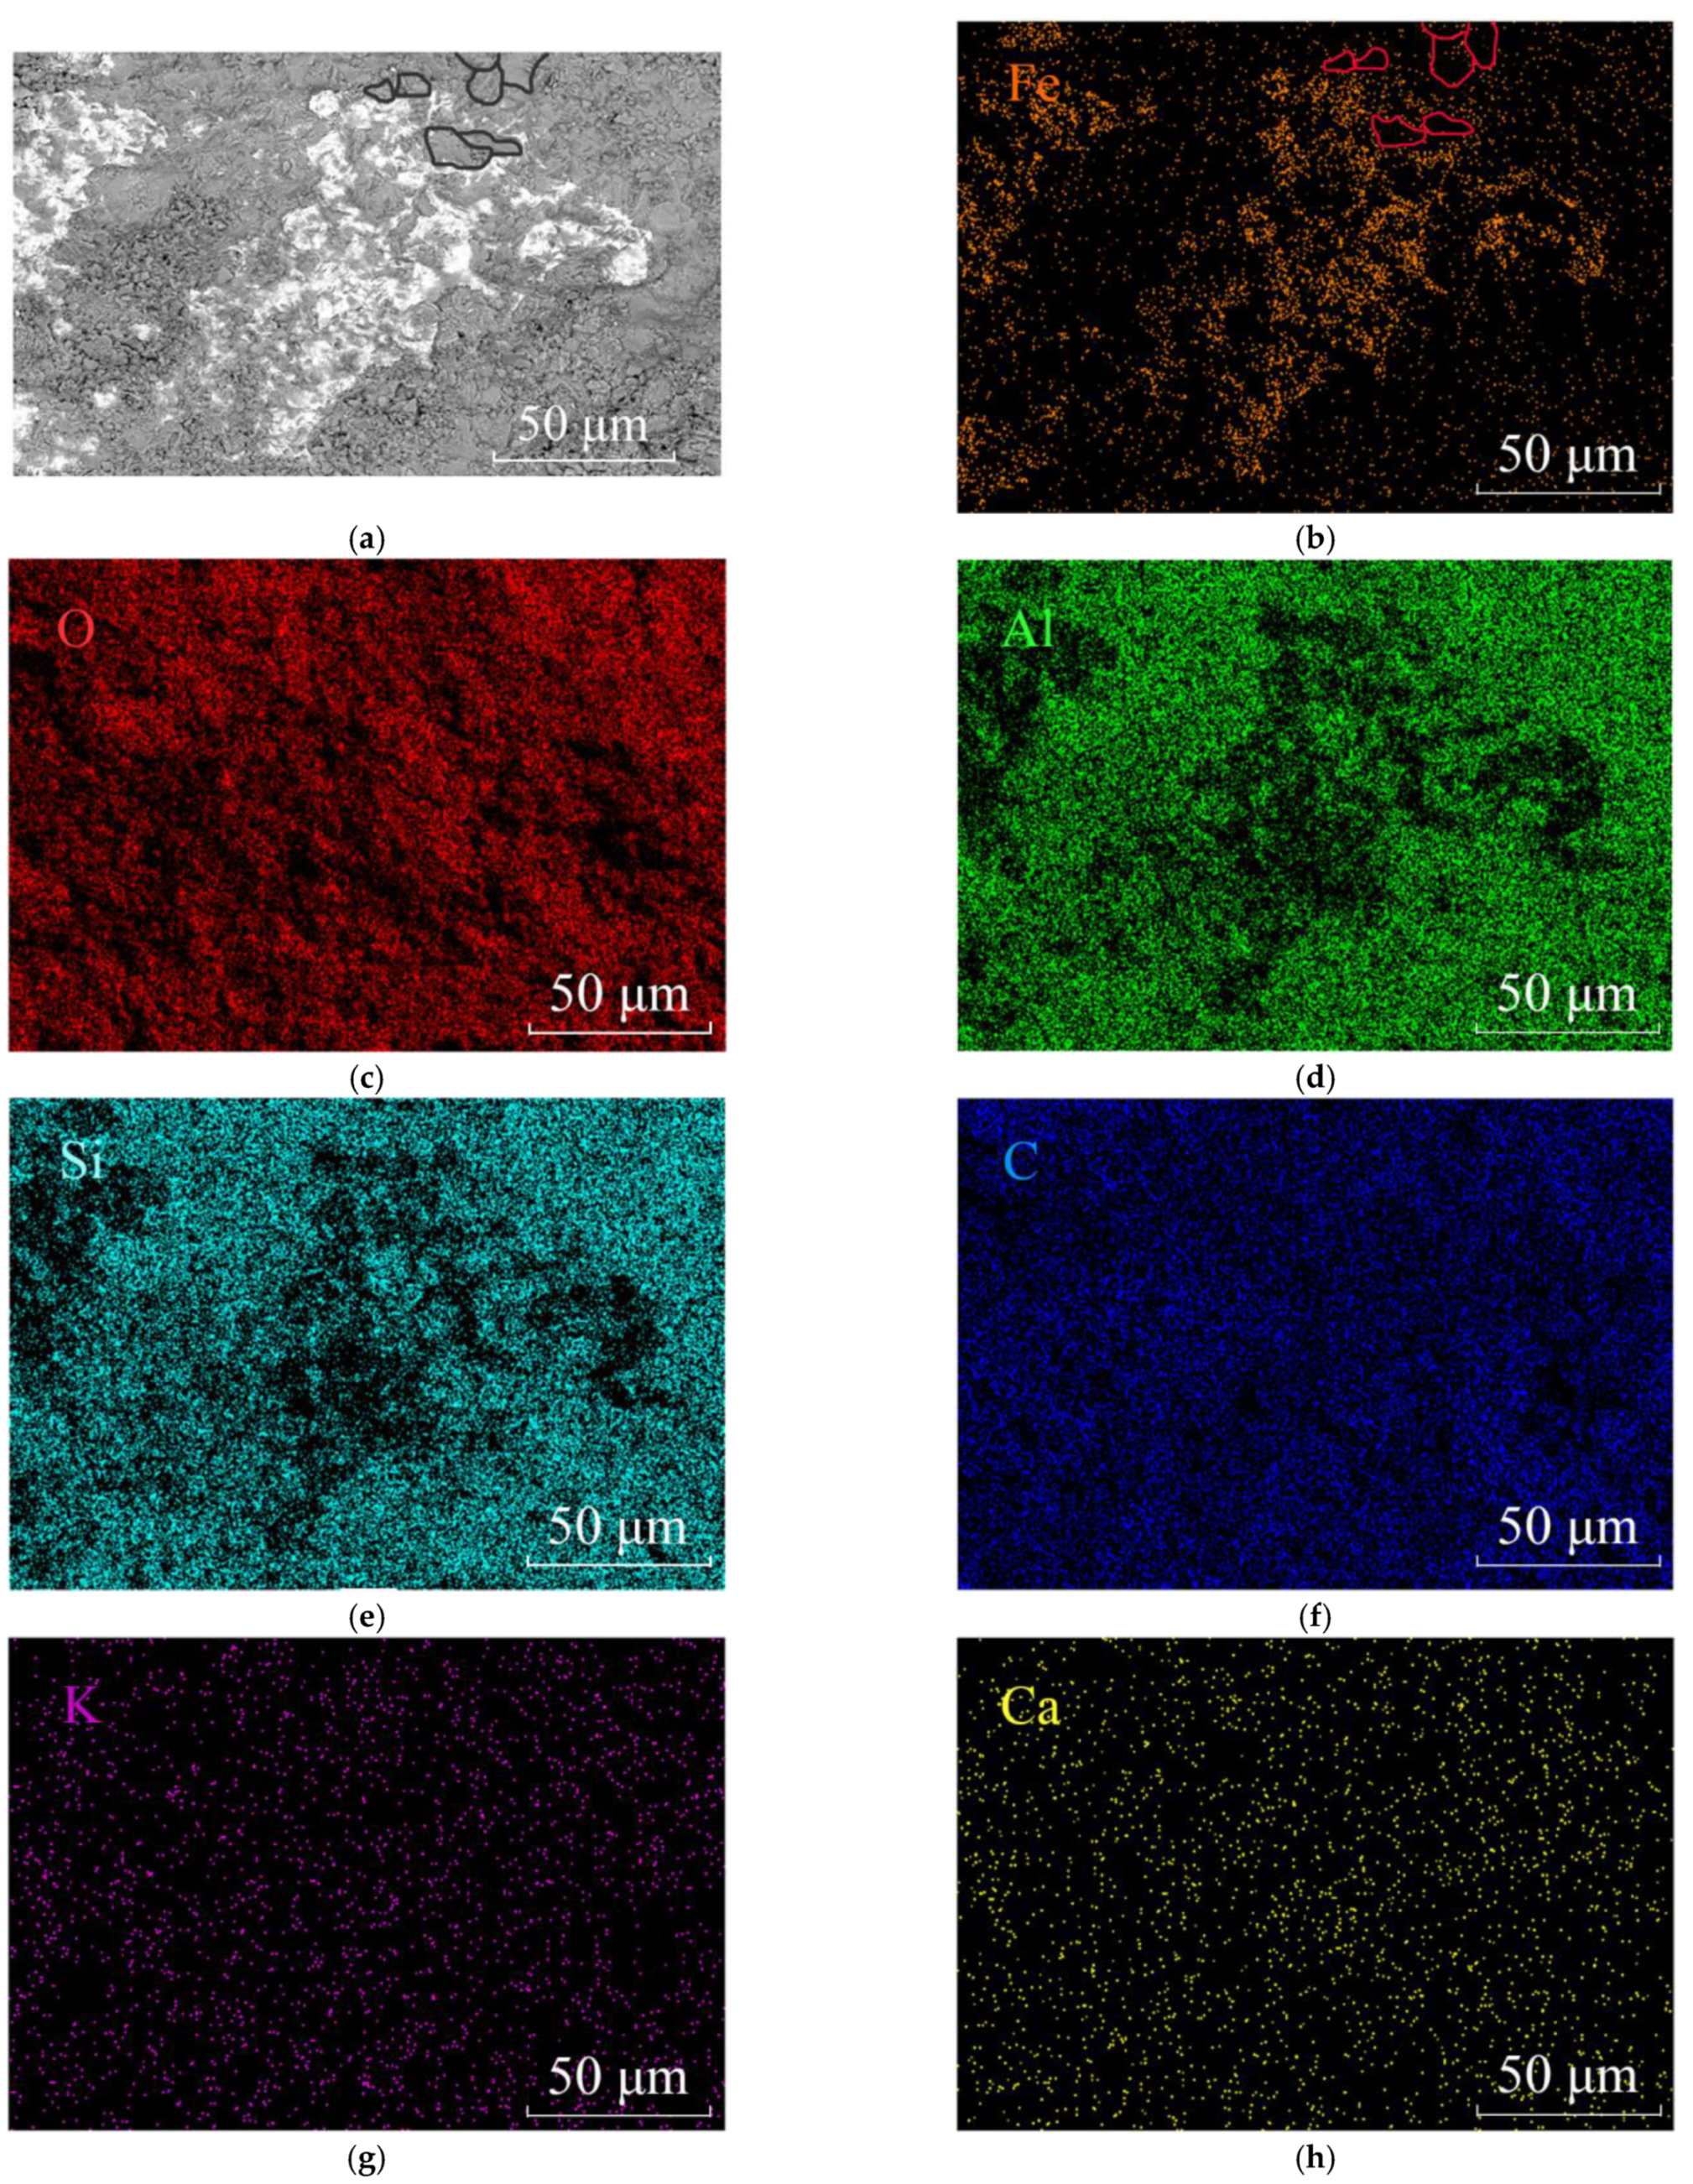
3.2. Scanning Electron Microscope

Scanning electron microscopy (SEM) was used to detect further whether other minerals were dispersed throughout the matrix and caused non-uniform yellow colour in the matrix. Dickite was detected by Raman analysis and was the predominant mineral composition of the matrix of the samples. In the SEM study, nano-sized needle-like minerals were found to cluster in the crevices, voids and cavities among dickite particles (Figure 5). EDS (Energy Disperse Spectroscopy) revealed that their main elements were Fe and O (Figure 6). Goethite is more frequently acicular [23,24,25], while hematite has a rhombohedral, platy, and rounded morphological habit [8,26]. Although both iron oxides/hydroxides will exhibit only Fe and O elements in EDS, their morphologies can reveal the phase of iron minerals. According to their morphology, the needle-like minerals observed are goethite.
Desulfurisation of pyrite in the matrix produces spaces that might fill with secondary materials [27], and these samples frequently have voids containing impurity minerals. This event also occurs in the environment, resulting in the formation of iron oxides/hydroxides. It is possible that these voids formed from oxidised pyrite.
Platy ferruginous minerals were also observed among randomly arranged dickite particles (Figure 7). It was reported that iron oxides/hydroxides in soil could form through oxidation of Fe2+ reduced microbially from Fe(III) oxides and transformation from ferrihydrite [5,15,28]. The Fe2+ could be released from primary minerals or reduced microbially from Fe(III) oxides [11]. These goethite crystals are considered to crystallise after the formation of dickite based on the aggregation form of goethite in the crevices, voids and cavities among dickite particles.
As shown in Figure 7a,b, the Fe element prefers to concentrate at the edge of the dickite particles instead of inside them. The black circles in the BSE image and the red circles in the Fe mapping image outlined several dickite particles at the same position to clarify the distribution characteristic of the element Fe. It indicates that Al3+ were not replaced by Fe3+ in the dickite lattice, and nano-sized iron oxides/hydroxides must form around the dickite particles.
The ratio of goethite and hematite is related to the solubility of ferrihydrite, which was influenced by pH [29]. The preferable pH for the formation of goethite and hematite are considered to be pH= 4~5 and pH= 6~8 [5,30,31], respectively. Previous studies confirmed the importance of water in the conditions for the formation of hematite and goethite [32], and the low solubility of ferrihydrite favours hematite formation [8,33].

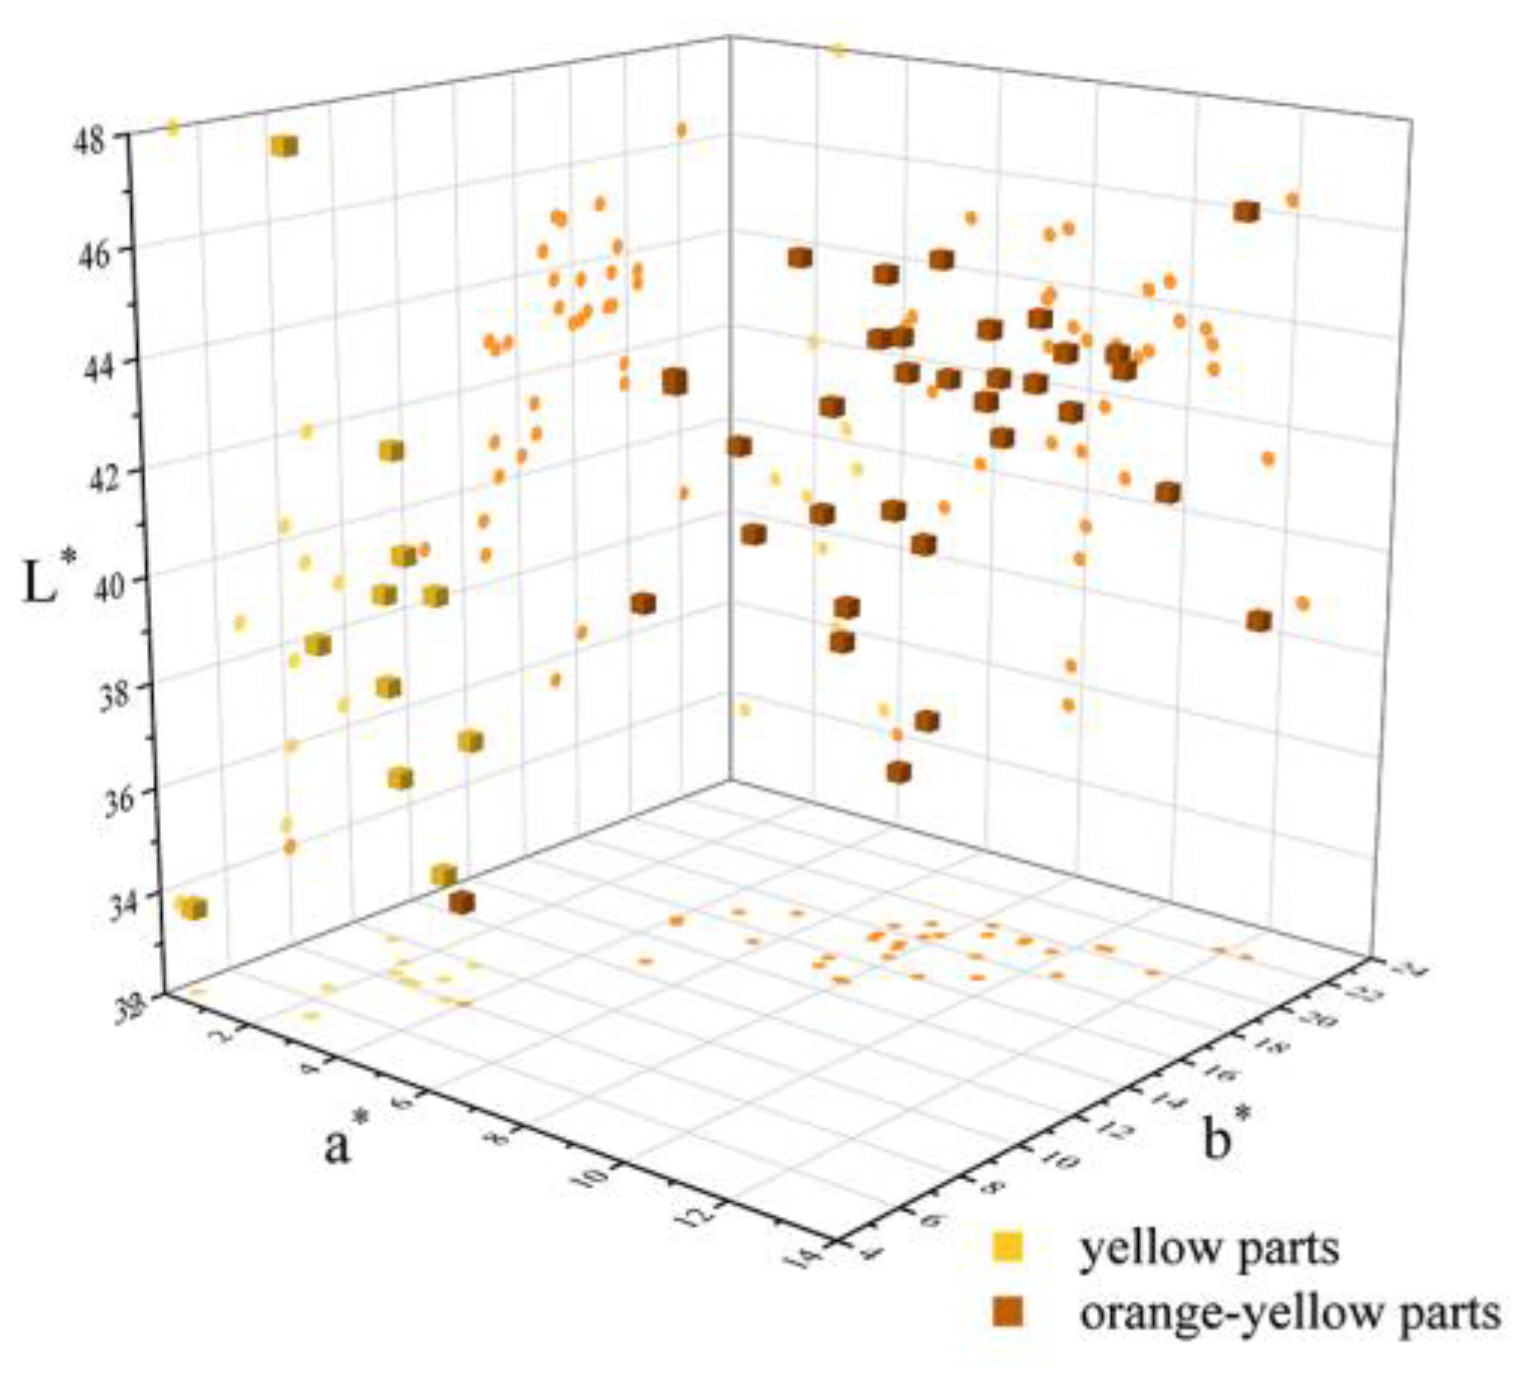
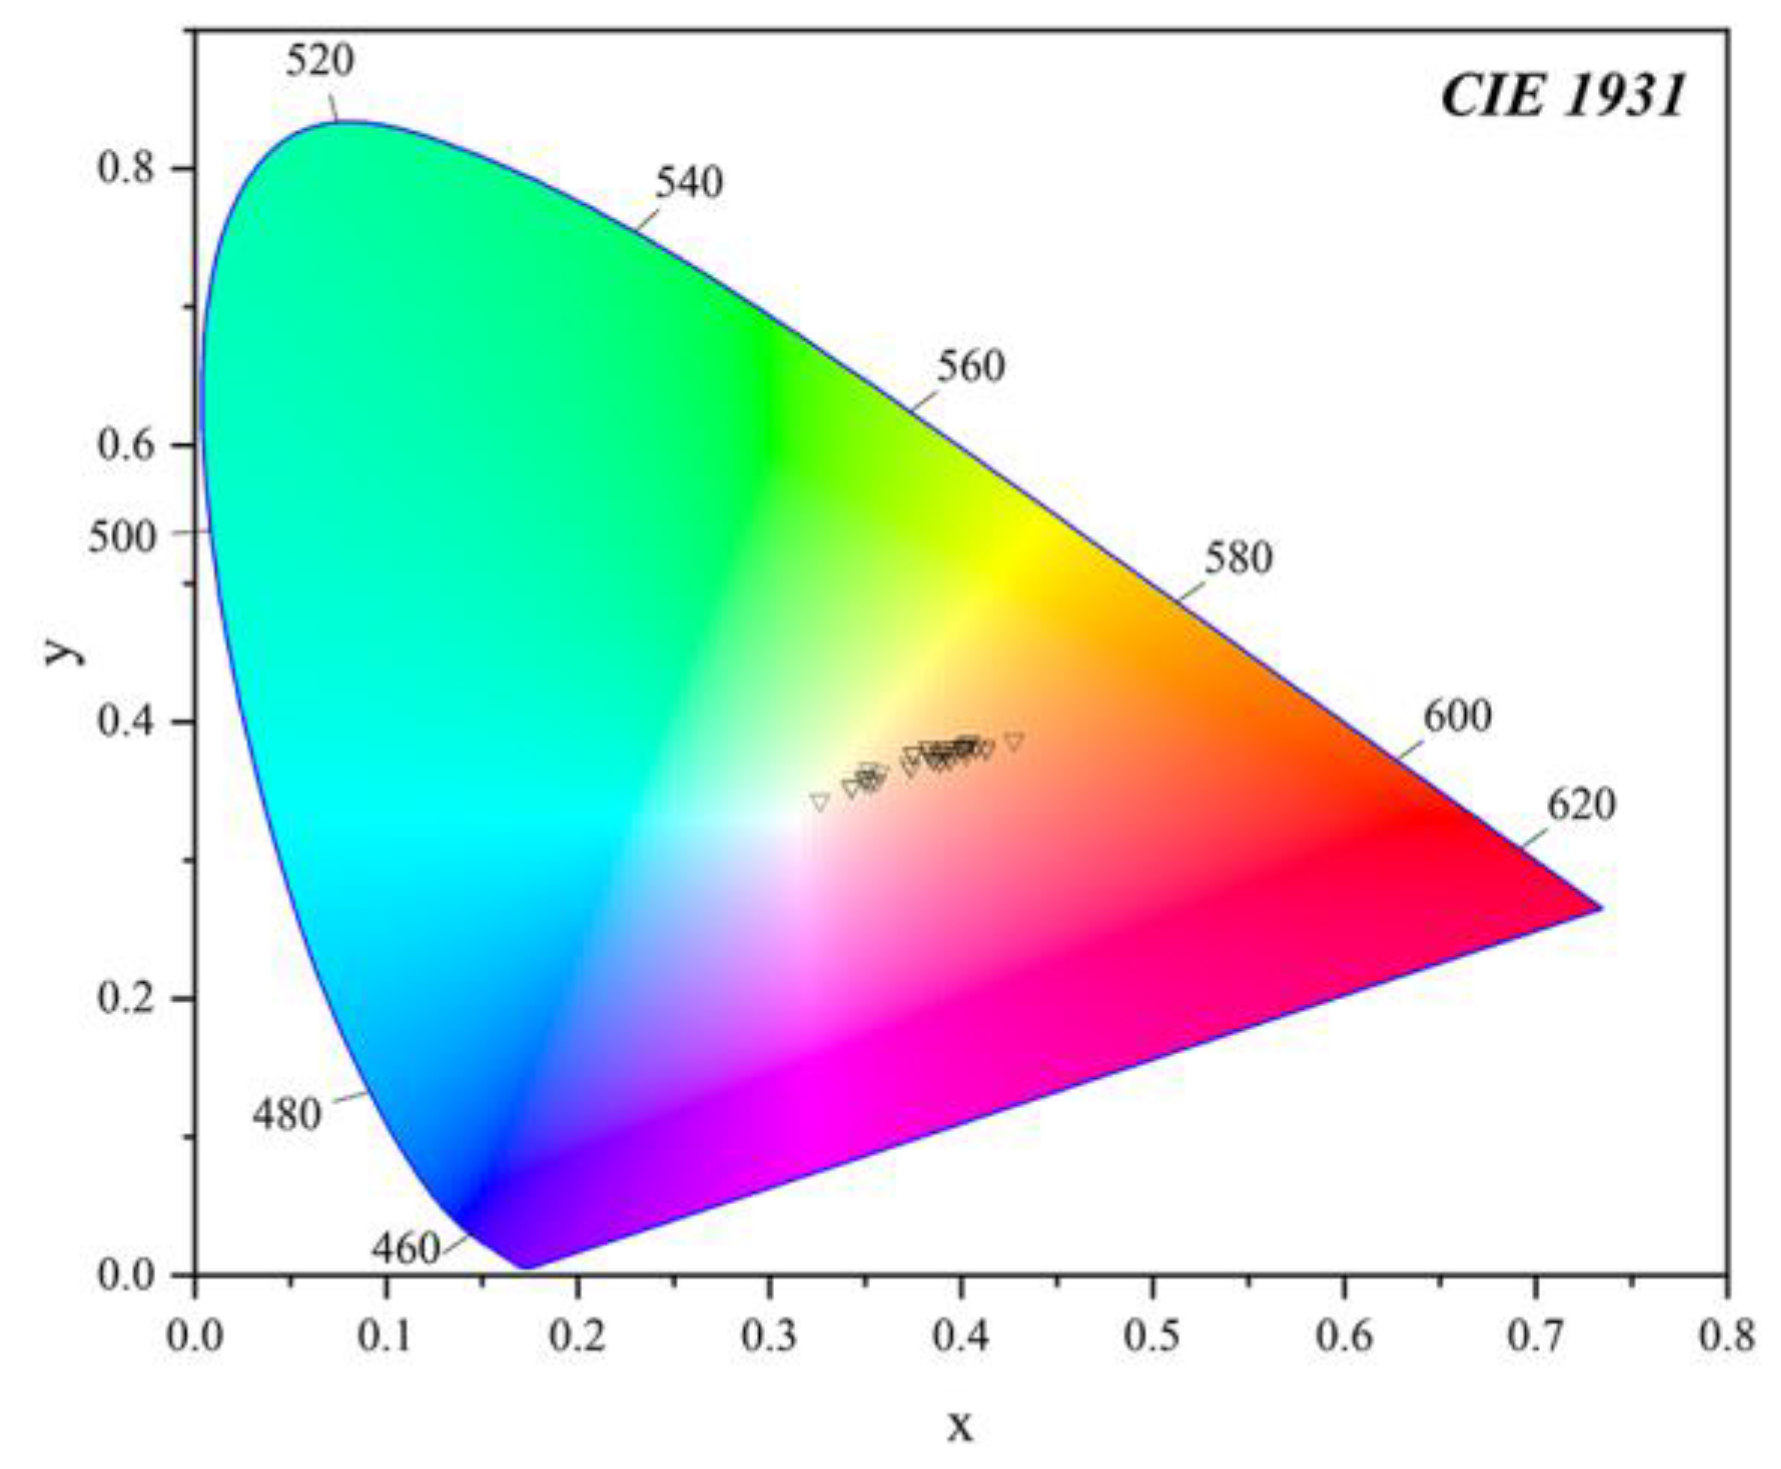
3.3. Colourimetric Analysis

The Commission Internationale de l’Eclairage (CIE uniform colour space) is one of the frequently-used tools for quantitative colour study [16,34]. Colours of objects are tested with a colourimeter and expressed by several colour parameters, such as L* (lightness), a* (redness-greenness), b* (yellowness-blueness), saturation, chroma, hue and dominant wavelength [34]. Among all of these colour parameters, L* (lightness), a* (redness-greenness) and b* (yellowness-blueness) are widely used in the colour description and measurement for minerals and rocks [35]. The positive direction of a* represents redness, and the negative direction represents greenness. The positive and negative direction of b* indicates the degree of yellowness and blueness, respectively.
The colour parameters of all the samples were listed in Table 1 and projected in a 3D scatter diagram (Figure 8), and presented in the CIE 1931 L*a*b* uniform colour space (Figure 9). The 3D scatter diagram (Figure 8) and CIE 1931 L*a*b* uniform colour space (Figure 9) match well with the two groups’ areas of the yellow and orange-yellow colour of Northern Laos yellow stones. The colour parameters of the samples included the values of lightness L* (33.65~47.99), colour coordinates a* (0.35~12.39) and b* (4.55~22.14), Chroma C* (4.57~25.37), hue angles (59.73~85.61), saturation (0.18~0.90) and dominant wavelength (572.58~582.58 nm).
Some of the values of colour parameters in yellow parts were lower than those of orange-yellow parts, including a* (yellow parts = 0.35~3.65; orange-yellow parts = 3.98~12.39), b* (yellow parts = 4.55~9.89; orange-yellow parts = 8.04~22.14), saturation (yellow parts = 0.18~0.38; orange-yellow parts = 0.36~0.90), Chroma (yellow parts = 4.57~10.32; orange-yellow parts = 8.97~25.37), dominant wavelength (yellow parts = 572.58~579.11 nm; orange-yellow parts = 576.19~582.58 nm). The increase in the a* and b* values from the yellow to orange-yellow parts appeared as an increasing red and yellow hue of the samples. In Figure 9, the change was more pronounced, and most points were concentrated in two areas with different dominant wavelengths. Nevertheless, some were almost in the same range, including Lightness (yellow parts = 33.65~47.99; orange-yellow parts = 33.99~46.27) and Hue (yellow parts = 64.81~85.61; orange-yellow parts = 59.73~75.13). The light matrix could improve the Lightness of the samples to a great extent [36], so the influence of chromogenic minerals may not be distinct. The difference in the range of a* and b* might be attributed to the content of goethite and hematite, two ubiquitous minerals in red or yellow soil or claystone [7,35]. According to previous studies, redness is mainly influenced by hematite, while yellowness correlates with both hematite and goethite content [37,38]. So the contents of iron oxides or hydroxides in testing points of yellow and orange-yellow parts were calculated, and their correlation with corresponding colour parameters was obtained in the following.

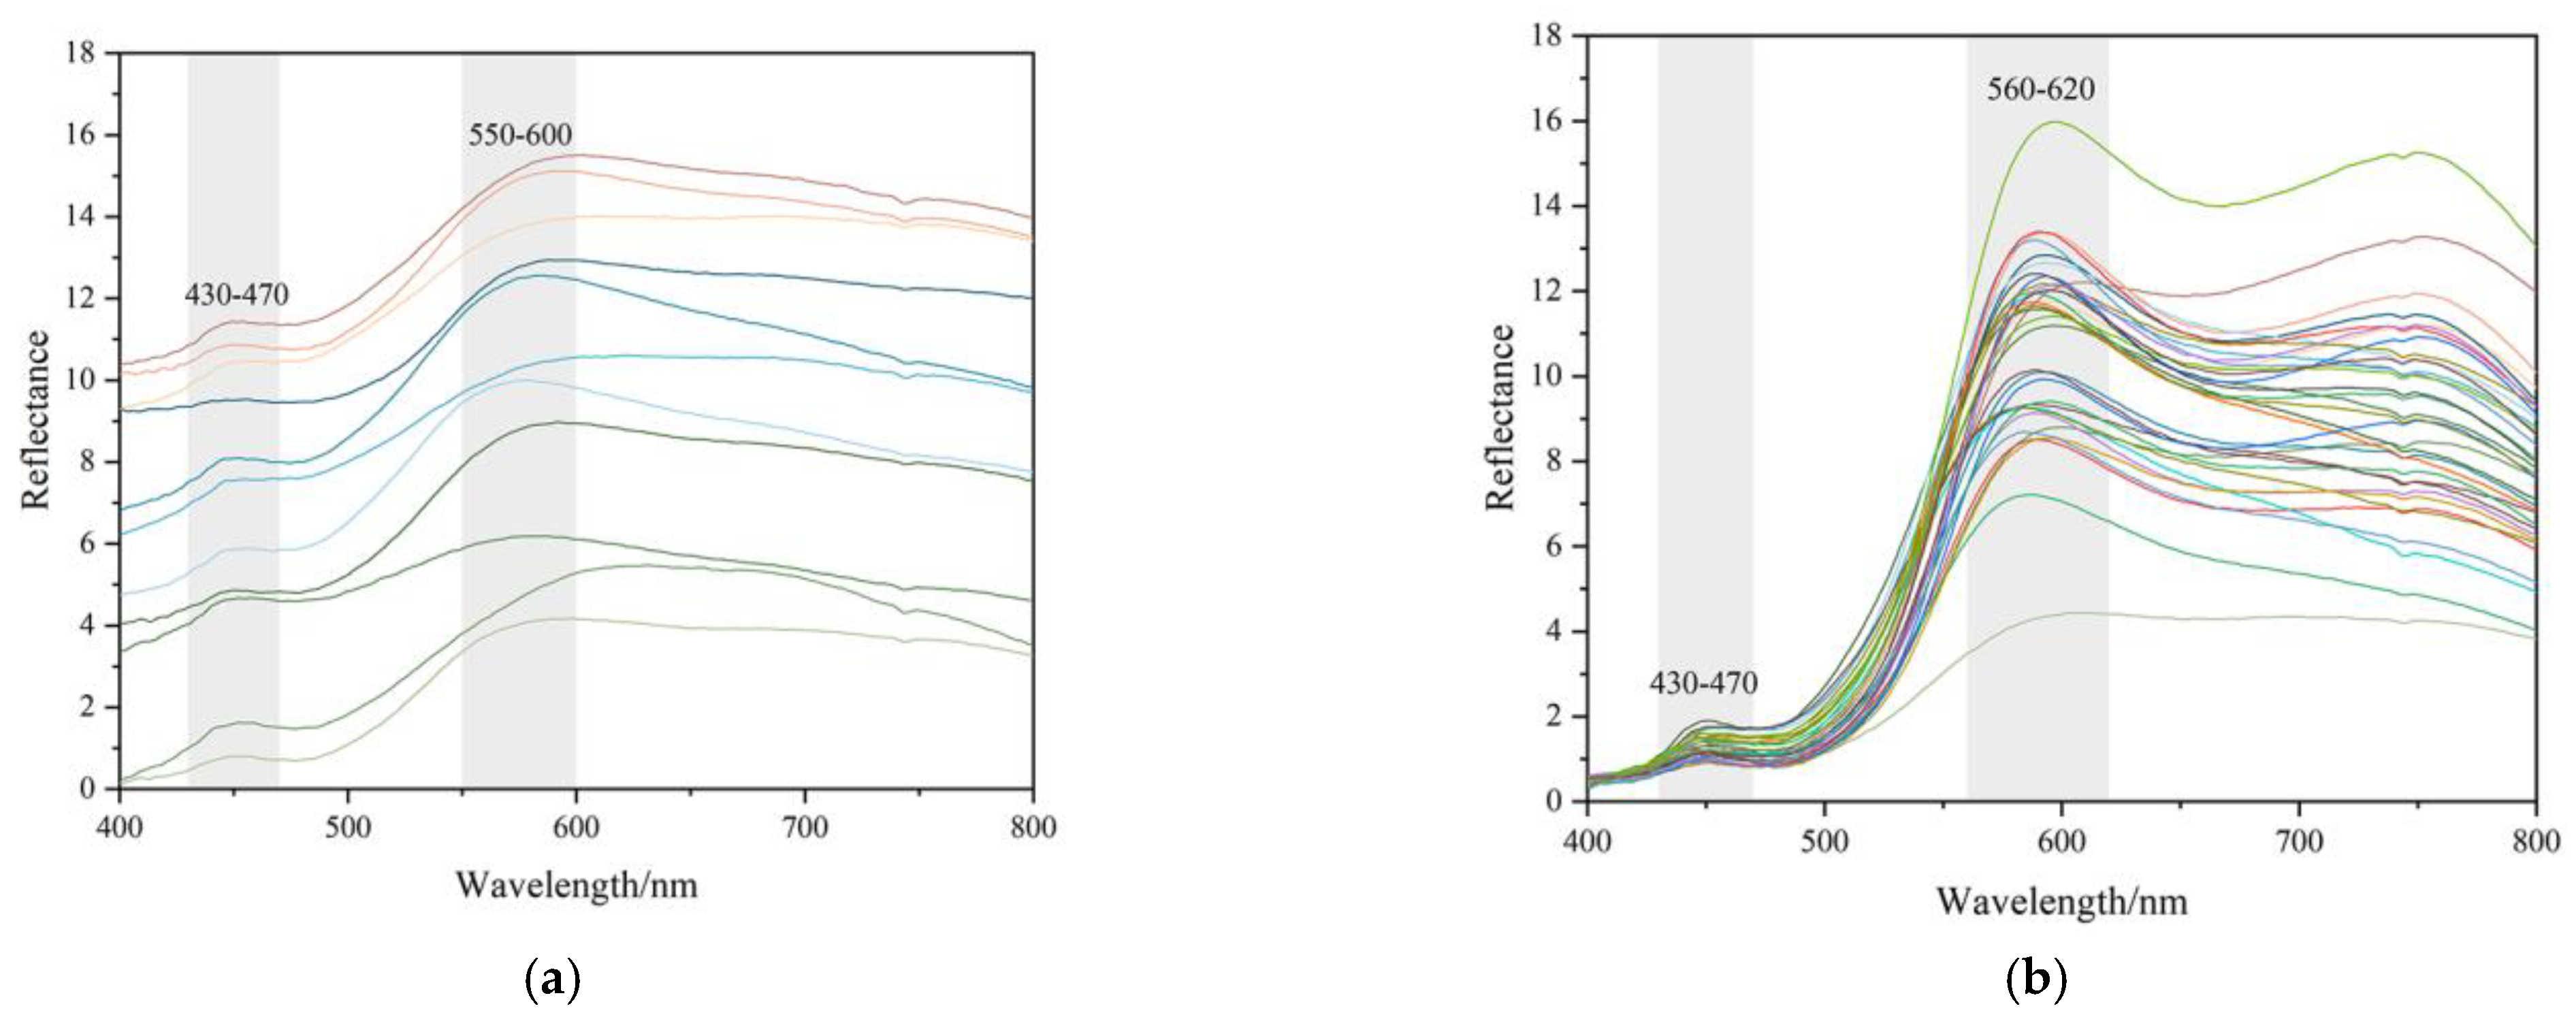
3.4. UV-Vis Reflectance Spectra

All figures and tables show that yellow and orange-yellow are the characteristic colour of the yellow seal stones from northern Laos. The orange-yellow part is closer to the surface of a sample than the yellow part in the same sample. Therefore, the UV-Vis spectra of all the samples were collected at the yellow and orange-yellow matrix parts to analyse colour parameters and attain DRS, then to analyse the correlation of colour and iron oxides. Figure 10 shows several UV-Vis characteristic spectra of the two colour groups, yellow and orange-yellow.
There are two main bands in the wavelength of 400~800 nm, which are at about 450 nm and 590 nm, respectively. These spectra correspond to three types of electronic transitions: (1) Fe(III) crystal or ligand field transitions; (2) interactions between magnetically coupled Fe3+; (3) ligand (oxygen)-metal charge transfer excitations from the O(2p) non-bonding valence bands to the Fe(3d) ligand field orbitals (between FeII and FeIII under certain conditions) [8]. The band at about 450 nm is related to double excitation processes, while the band around 590 nm is owing to ligand field transitions [8]. The bands in UV-Vis absorption may be meant for various electron transitions for different iron oxide and iron hydroxide minerals. The 434~444 nm band in goethite and hematite correspond to 6A1 → 4E4A1, and 525 nm is meant for 2(6A1) → 2(4T1) for hematite [8,17].

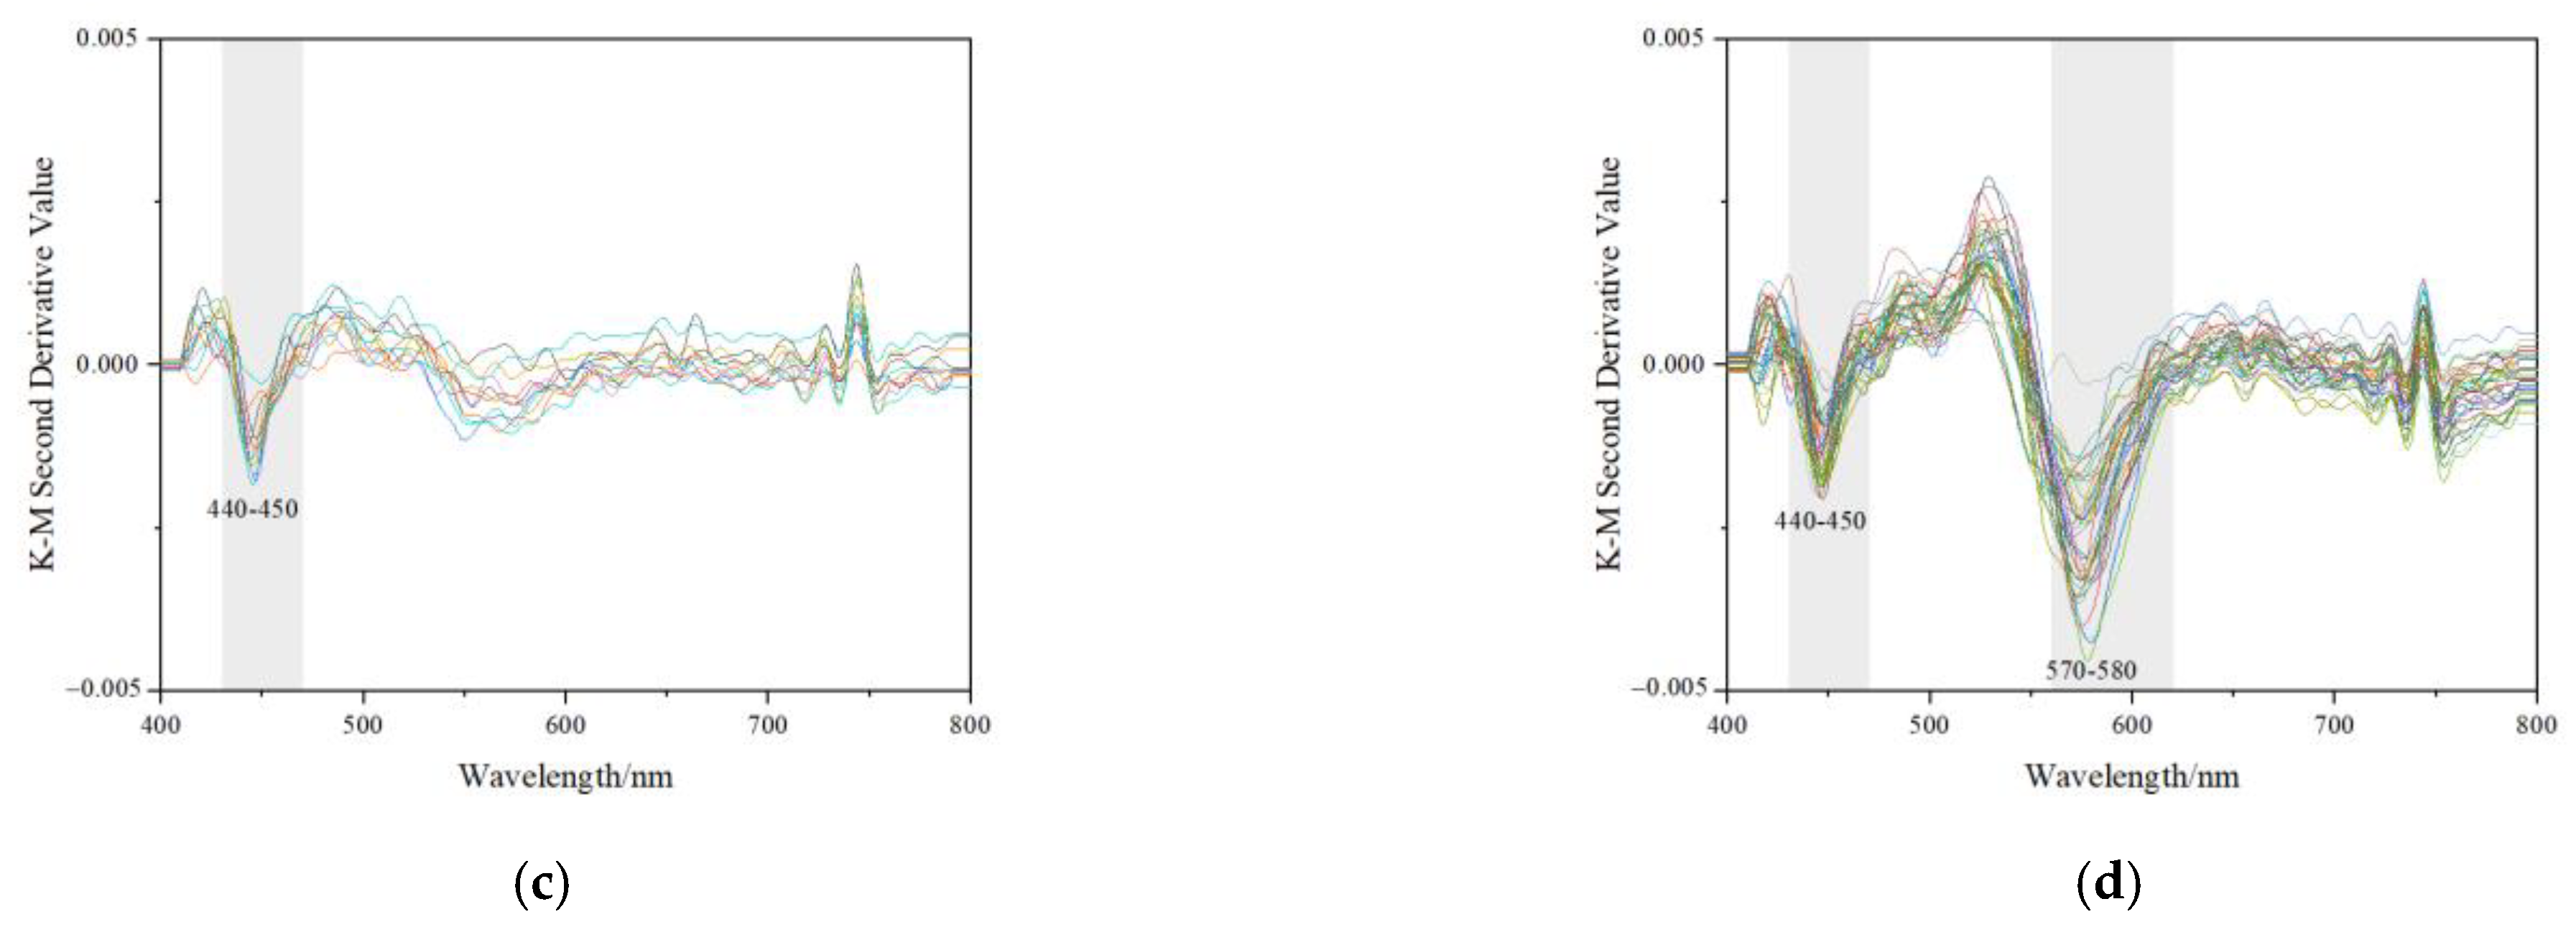
3.5. Characteristics of Second Derivative Reflectance Spectra

Goethite and hematite have been found ubiquitous in phyllosilicate aggregates or loess on the earth’s surface [39,40]. The content of free iron oxides was estimated to be less than 2% in loess, but it was even more than that in the highly weathered lateritic soils [12]. Due to the tiny grain size and the low content of goethite and hematite, most techniques have difficulty detecting them. The diffuse reflection spectrum (DRS) is routinely used to analyse nanoscale iron oxides or iron hydroxides in loess. DRS has a lower detection limit (about 0.01 wt%) than most testing techniques due to its sensitivity in identifying the variations of iron oxides or hydroxides in soil [12]. As a result, DRS was the main method to analyse the content of hematite and goethite in this research.
The Kubelka-Munk (K-M) theory was applied to obtain the remission function F(R) = [(1 − R)2]/(2R) from original reflectance values collected from UV-Vis spectroscopy [41], owing to the ratio of absorption K and scattering S are associated with diffuse reflectance R [18]. Before the second derivative calculation, all the original reflective UV-Vis spectra were dealt with in the K-M equation. Then the second derivative spectra were obtained.
According to the previous studies on K-M transformed DRS curves, the colour of iron oxide or iron hydroxide is strongly linked with the single electron transitions 4A1→6A1 at 405~610 nm and electron pair transition (EPT) at 488~493 nm in the second derivative spectra [8,17,37]. The strong band in absorption at around 450 nm was considered responsible for the crystal field absorption of Fe3+ octahedral coordination with oxygen in the crystal structure [32]. The LMCT transitions that occurred in iron oxides could produce an absorption band extending from near UV to the blue-green area of the visible region [8,42]. Therefore, the soil containing iron oxides often exhibits yellow-red appearances.
Goethite was hard to identify with Raman spectroscopy in the studied samples. As is shown in Figure 10d, the second derivative Kubelka-Munk spectra of orange-yellow parts mainly displayed two strong bands at about 440~450 nm and 570~580 nm in the 400~800 nm region (almost the entire visible range), indicating the presence of goethite and hematite in the samples [43,44]. However in Figure 10c, the bands of yellow parts at around 570 nm were hard to identify.
The intensity values of the bands were used to calculate and attain the approximate contents of iron oxides with multiple linear regression equations that were obtained by Scheinost (1998) [17]: Y1 (Goethite g/kg) = −0.06 + 268Y1, r2 = 0.86, p < 0.001; Y2 (Hematite g/kg) = −0.09 + 402Y2, r2 = 0.85, p < 0.001. Y1 corresponded to the intensity of the band at about 440 ~ 450 nm, and Y2 was the intensity of the band at 570 ~ 580 nm. The approximate goethite and hematite content of the studied samples was calculated and shown in Table 2.
The range of approximate content of goethite in the yellow parts was 0.175~0.671 g/kg. The values of orange-yellow parts almost fell within the same range, which was 0.096~0.691 g/kg. Overall, the peaks indicating hematite in the yellow parts were too weak to calculate their content. However, the hematite content in the orange-yellow parts was much higher, which was at 0.258~2.383 g/kg. The difference value of hematite content between the yellow and orange-yellow testing points was around 0.2%, while the difference value of goethite content was much lower. However, the b* (yellowness) change from the yellow to orange-yellow parts was obvious. The behaviour of changes in b* and Fe mineral content can be explained by the influence of hematite on redness.

3.6. Correlation Analysis between Colour Parameters and Content of Goethite and Hematite

In order to show the correlation between colour parameters (L*, a* and b*) and the content of iron oxides, it was analysed in orange-yellow parts. Multiple linear regression was also applied to evaluate the relationship between colour parameters and goethite and hematite content, which was calculated from the second derivative Kubelka-Munk spectra (Table 3).
L*, a* and b* showed significant or high relevance with the content of both goethite and hematite in multiple linear regressions: L* (R = 0.477, R2 = 0.228), a* (R = 0.614, R2 = 0.377), b* (R = 0.737, R2 = 0.543). In the correlation analysis separately, a* (Pearson’s r = 0.611, sig. < 0.001) and b* (Pearson’s r = 0.706, sig. < 0.001) all showed a significant correlation with the content of hematite. However, L* (Pearson’s r = 0.038, sig. = 0.829) seemed irrelevant to hematite content. For goethite, only L* (Pearson’s r = 0.475, sig. = 0.005) exists a significant correlation with the content of goethite. The correlation was low when it came to a* (Pearson’s r = −0.080, sig. = 0.653) and b* (Pearson’s r = 0.194, sig. = 0.271).
We found that the colour of a matrix in the orange-yellow parts is more related to the existence of hematite, while the yellow part is mainly caused by goethite. It has already been proved that goethite leads loess to be yellow [8,45], and it mainly influences the b* value (yellowness) as well as the L* value (Lightness) in CIE 1931 L*a*b* uniform colour space to some extent. We suggest that nano-sized goethite provides a yellow colour, and extra hematite increases the red hue and changes the colour from yellow to orange-yellow, which influences both the a* value (redness) and the b* value (yellowness).

4. Conclusions

A minor amount of goethite and hematite causes the colour of the yellow seal stones from northern Laos. These minerals were crystalised as micro- to nano-sized particles and took on acicular, rod-like, and needle-like morphology, which was observed with SEM. The study of UV-Vis spectra and K-M transformed DRS indicated that the yellow and orange-yellow areas (parts) contained goethite, which influenced the b* value. However, orange-yellow areas contained more hematite, which influenced both a* and b* values in CIE 1931 L*a*b* uniform colour space. The difference between the colour parameters of yellow and orange-yellow parts and corresponding goethite and hematite content could explain the increase in a* and b* values caused by the increasing amount of hematite.
The main composition of the yellow seal stones from northern Laos is dickite. The impurity composition includes hematite, anatase, barite, diaspore and pyrite. The mineral composition indicates that the studied seal stone is a product of typical volcanic hydrothermal alteration. However, the formation of the micro- to nano-scaled goethite and hematite particles among the dickite aggregate needs to be studied when the geological background or its mining position could be reported. Then the causation of colour inhomogeneity of the yellow seal stones from northern Lao could be further investigated.

Author Contributions

Conceptualisation, T.C.; methodology and formal analysis, J.T., J.Z., J.W. and Y.X.; writing—original draft preparation, J.T.; writing—review and editing, T.C.; funding acquisition, T.C. All authors have read and agreed to the published version of the manuscript.

Funding

This research was funded by Tao Chen, the National Natural Science Foundation of China (No. 42072252, No. 41572033, No. 41172050).

Data Availability Statement

All supporting data and computational details are available on written request. These data are held by the main author of this article.

Acknowledgments

The authors thank Chunmao Yao provided the samples and appreciate Xing Xu and Jia Liu from the Gemmological Institute, China University of Geosciences, for their help in experiments.

Conflicts of Interest

The authors declare no conflict of interest.

References

  1. Xu, Y.; Chen, T. Mineral Composition and Trace Element Characteristics of Laos Northern Yellow Stone. Acta Petrol. Et Mineral. 2019, 38, 399–409. [Google Scholar]
  2. Liu, Y.; Chen, T.; Han, W.; Wang, C. A Study of Color and Luobowen of Tianhuang Stone. Acta Petrol. Et Mineral. 2013, 32, 549–556. [Google Scholar]
  3. Çiflikli, M. Hydrothermal Alteration-Related Kaolinite/Dickite Occurrences in Ignimbrites: An Example from Miocene Ignimbrite Units in Avanos, Central Turkey. Arab. J. Geosci. 2020, 13, 1044. [Google Scholar] [CrossRef]
  4. Han, W.; Ke, J.; Chen, H.; Lu, T.; Yin, K. Diffuse Reflectance Spectroscopy of Red Colored “Laowo Stone. Spectrosc. Spectr. Anal. 2016, 36, 2634–2638. [Google Scholar]
  5. Suppiah, D.D.; Johan, M.R. Influence of Solution PH on the Formation of Iron Oxide Nanoparticles. Mater. Res. Express 2018, 6, 015008. [Google Scholar] [CrossRef]
  6. Xie, T.; Lu, S.; Rao, L.; Zhang, L.; Wang, X.; Wang, W.; Wang, Q. Dissolution Factors and Oxidative Potential of Acid Soluble Irons from Chlorite Mineral Particles. Atmos. Environ. 2021, 255, 118436. [Google Scholar] [CrossRef]
  7. Wu, C.; Long, H.; Cheng, T.; Liu, L.; Qian, P.; Wang, H.; Ren, S.; Zhou, L.; Zheng, X. Quantitative Estimations of Iron Oxide Minerals in the Late Pleistocene Paleosol of the Yangtze River Delta: Implications for the Chemical Weathering, Sedimentary Environment, and Burial Conditions. CATENA 2021, 207, 105662. [Google Scholar] [CrossRef]
  8. Cornell, R.; Schwertmann, U. The Iron Oxides: Structures, Properties, Reactions, Occurences and Uses, 2nd ed.; Wiley-vch: Weinheim, Germany, 2003. [Google Scholar]
  9. Zhou, Y.; Liu, Z.; Zhao, Z.; Guo, Y. Quantitative Study on Colour and Spectral Characteristics of Beihong Agate. Minerals 2022, 12, 677. [Google Scholar] [CrossRef]
  10. Hu, P.; Jiang, Z.; Liu, Q.; Heslop, D.; Roberts, A.P.; Torrent, J.; Barrón, V. Estimating the Concentration of Aluminum-Substituted Hematite and Goethite Using Diffuse Reflectance Spectrometry and Rock Magnetism: Feasibility and Limitations. J. Geophys. Res. Solid Earth 2016, 121, 4180–4194. [Google Scholar] [CrossRef]
  11. Balsam, W.; Ji, J.; Renock, D.; Deaton, B.C.; Williams, E. Determining Hematite Content from NUV/Vis/NIR Spectra: Limits of Detection. Am. Mineral. 2014, 99, 2280–2291. [Google Scholar] [CrossRef]
  12. Grygar, T.; Dědeček, J.; Kruiver, P.P.; Dekkers, M.J.; Bezdička, P.; Schneeweiss, O. Iron Oxide Mineralogy in Late Miocene Red Beds from La Gloria, Spain: Rock-Magnetic, Voltammetric and Vis Spectroscopy Analyses. CATENA 2003, 53, 115–132. [Google Scholar] [CrossRef]
  13. Ding, Z.L.; Sun, J.M.; Liu, T.S.; Zhu, R.X.; Yang, S.L.; Guo, B. Wind-Blown Origin of the Pliocene Red Clay Formation in the Central Loess Plateau, China. Earth Planet. Sci. Lett. 1998, 161, 135–143. [Google Scholar] [CrossRef]
  14. Li, X.; Hu, X.; Cai, Y.; Han, Z. Quantitative Analysis of Iron Oxide Concentrations within Aptian–Albian Cyclic Oceanic Red Beds in ODP Hole 1049C, North Atlantic. Sediment. Geol. 2011, 235, 91–99. [Google Scholar] [CrossRef]
  15. Makiel, M.; Skiba, M.; Kisiel, M.; Maj-Szeliga, K.; Błachowski, A.; Szymański, W.; Salata, D. Formation of Iron Oxyhydroxides as a Result of Glauconite Weathering in Soils of Temperate Climate. Geoderma 2022, 416, 115780. [Google Scholar] [CrossRef]
  16. Schanda, J. CIE Colorimetry. Colorimetry 2007, 3, 25–78. [Google Scholar] [CrossRef]
  17. Scheinost, A.C. Use and Limitations of Second-Derivative Diffuse Reflectance Spectroscopy in the Visible to Near-Infrared Range to Identify and Quantify Fe Oxide Minerals in Soils. Clays Clay Miner. 1998, 46, 528–536. [Google Scholar] [CrossRef]
  18. Torrent, J.; Liu, Q.; Bloemendal, J.; Barrón, V. Magnetic Enhancement and Iron Oxides in the Upper Luochuan Loess-Paleosol Sequence, Chinese Loess Plateau. Soil Sci. Soc. Am. J. 2007, 71, 1570–1578. [Google Scholar] [CrossRef] [Green Version]
  19. Freire-Lista, D.M.; Campos, B.B.; do Rosário Costa, M.; Sanjurjo-Sánchez, J. Main Building Granite of São Tiago de Folhadela Parish Church (North of Portugal). Petrography, Glyptography, Construction Phases and Decay by Pyrite Oxidation. Constr. Build. Mater. 2022, 350, 128904. [Google Scholar] [CrossRef]
  20. Winkler, E.M. (Ed.) Natural Rust on Stone. In Stone: Properties, Durability in Man’s Environment; Springer: Vienna, Austria, 1975; pp. 164–168. [Google Scholar] [CrossRef]
  21. Zolotov, M.Y.; Shock, E.L. Formation of Jarosite-Bearing Deposits through Aqueous Oxidation of Pyrite at Meridiani Planum, Mars. Geophys. Res. Lett. 2005, 32, L21203. [Google Scholar] [CrossRef] [Green Version]
  22. Bedoya-Gonzalez, D.; Hilberg, S.; Redhammer, G.; Rinder, T. A Petrographic Investigation of the Carboniferous Sequence from the Ibbenbüren Mine: Tracing the Origin of the Coal Mine Drainage. Minerals 2021, 11, 483. [Google Scholar] [CrossRef]
  23. Cairncross, B.; Windisch, W.; Smit, H.; Fraser, A.; Gutzmer, J. The Vergenoeg: Gauteng Province, South Africa Fluorite Mine. Rocks Miner. 2008, 83, 410–421. [Google Scholar] [CrossRef]
  24. Sawłowicz, Z.; Malinowski, Ł.; Giże, A.; Stanek, J.; Przybyło, J. Mineralogical-Geochemical Study of Corroded Iron-Based Metals from a Salt Mine Environment. Corrosion 2020, 76, 666–677. [Google Scholar] [CrossRef]
  25. Lupulescu, M.; Chamberlain, S.C.; Walter, M.; Wallace, S. Diagenetic Uvite with Overgrown Dravite Bigelow, St. Lawrence County, New York. Rocks Miner. 2010, 85, 250–259. [Google Scholar] [CrossRef]
  26. Domingo, C.; Rodríguez-Clemente, R.; Blesa, M. Morphological Properties of α-FeOOH, γ-FeOOH and Fe3O4 Obtained by Oxidation of Aqueous Fe(II) Solutions. J. Colloid Interface Sci. 1994, 165, 244–252. [Google Scholar] [CrossRef]
  27. Bayoumi, M.B.; Abu Khoziem, H.A. Mineralogical Investigation of the Alteration Aspects in Gabal El Sela Area, South Eastern Desert, Egypt. Arab. J. Geosci. 2021, 14, 1268. [Google Scholar] [CrossRef]
  28. Gentile, L. Ferrihydrite Nanoparticles Entrapped in Shear-Induced Multilamellar Vesicles. J. Colloid Interface Sci. 2022, 606, 1890–1896. [Google Scholar] [CrossRef]
  29. Agresti, F.; Zin, V.; Barison, S.; Sani, E.; Meucci, M.; Mercatelli, L.; Nodari, L.; Rossi, S.; Bobbo, S.; Fabrizio, M. NIR Transmittance Tuneability under a Magnetic Field of Colloidal Suspensions of Goethite (α-FeOOH) Nanorods. RSC Adv. 2017, 7, 12429–12436. [Google Scholar] [CrossRef] [Green Version]
  30. Schwertmann, U.; Murad, E. Effect of PH on the Formation of Goethite and Hematite from Ferrihydrite. Clays Clay Miner. 1983, 31, 277–284. [Google Scholar] [CrossRef]
  31. Bigham, J.M.; Nordstrom, D.K. Iron and Aluminum Hydroxysulfates from Acid Sulfate Waters. Rev. Mineral. Geochem. 2000, 40, 351–403. [Google Scholar] [CrossRef]
  32. Bao, H.; Koch, P.L.; Thiemens, M.H. Oxygen Isotopic Composition of Ferric Oxides from Recent Soil, Hydrologic, and Marine Environments. Geochim. Et Cosmochim. Acta 2000, 64, 2221–2231. [Google Scholar] [CrossRef]
  33. Schwertmann, U.; Stanjek, H.; Becher, H.-H. Long-Term in Vitro Transformation of 2-Line Ferrihydrite to Goethite/Hematite at 4, 10, 15 and 25°C. Clay Miner. 2004, 39, 433–438. [Google Scholar] [CrossRef]
  34. Luo, M.R.; Li, C. CIE Color Appearance Models and Associated Color Spaces. Colorimetry 2007, 11, 261–294. [Google Scholar] [CrossRef]
  35. Nagano, T.; Nakashima, S. Study of Colors and Degrees of Weathering of Granitic Rocks by Visible Diffuse Reflectance Spectroscopy. Geochem. J. 1989, 23, 75–83. [Google Scholar] [CrossRef]
  36. Cuadros, J.; Sánchez-Marañón, M.; Mavris, C.; Fiore, S.; Bishop, J.L.; Melgosa, M. Color Analysis and Detection of Fe Minerals in Multi-Mineral Mixtures from Acid-Alteration Environments. Appl. Clay Sci. 2020, 193, 105677. [Google Scholar] [CrossRef]
  37. Nagano, T.; Isobe, H.; Nakashima, S.; Ashizaki, M. Characterization of Iron Hydroxides in a Weathered Rock Surface by Visible Microspectroscopy. Appl. Spectrosc. 2002, 56, 651–657. [Google Scholar] [CrossRef]
  38. Sánchez-Marañón, M.; Molinero-García, A.; Delgado, R.; García del Moral, L.F.; Martín-García, J.M. Spectral Analysis of Fe Oxidation in the Early Stages of Weathering and Soil Formation. CATENA 2023, 222, 106850. [Google Scholar] [CrossRef]
  39. Zhao, H.; Qiang, X.; Xu, X.; Sun, Y. Iron Oxide Characteristics of the Chinese Loess-Red Clay Sequences and Their Implications for the Evolution of the East Asian Summer Monsoon since the Late Oligocene. Palaeogeogr. Palaeoclimatol. Palaeoecol. 2020, 543, 109604. [Google Scholar] [CrossRef]
  40. Szeberényi, J.; Kovács, J.; Bradák, B.; Barta, G.; Csonka, D.; Medveďová, A.; Roštínský, P.; Kiss, K.; Varga, G. Experiencing New Perspectives in the Application of Reflectance Spectroscopy in Loess Research. Quat. Int. 2020, 552, 36–49. [Google Scholar] [CrossRef]
  41. Barron, V.; Torrent, J. Use of the Kubelka—Munk Theory to Study the Influence of Iron Oxides on Soil Colour. J. Soil Sci. 1986, 37, 499–510. [Google Scholar] [CrossRef]
  42. Torrent, J.; Barrón, V. Diffuse Reflectance Spectroscopy of Iron Oxides. Encycl. Surf. Colloid Sci. 2002, 1, 1438–1446. [Google Scholar]
  43. Ion, R.-M.; Barbu, M.G.; Gonciar, A.; Vasilievici, G.; Gheboianu, A.I.; Slamnoiu-Teodorescu, S.; David, M.E.; Iancu, L.; Grigorescu, R.M. A Multi-Analytical Investigation of Roman Frescoes from Rapoltu Mare (Romania). Coatings 2022, 12, 530. [Google Scholar] [CrossRef]
  44. Fontes, M.P.F.; Carvalho, I.A., Jr. Color Attributes and Mineralogical Characteristics, Evaluated by Radiometry, of Highly Weathered Tropical Soils. Soil Sci. Soc. Am. J. 2005, 69, 1162–1172. [Google Scholar] [CrossRef]
  45. Chao, T.T.; Theobald, P.K. The Significance of Secondary Iron and Manganese Oxides in Geochemical Exploration. Econ. Geol. 1976, 71, 1560–1569. [Google Scholar] [CrossRef]
Figure 1. The studied samples of Laos seal stone (LWB-1~18).
Minerals 13 00291 g001
Figure 2. Colour distribution feature and impurity minerals in the samples. (a) orange-yellow to yellow from the outer to the inner part. (b) red cracks in the inhomogenous yellow matrix. (c) inhomogeneous colour in the matrix. (d) pink spots in the matrix. Other minerals were also observed by further magnification. (e) dark red and yellow inclusions filled in the fracture. (f) irregularity of brown and grey impurities.
Minerals 13 00291 g002aMinerals 13 00291 g002b
Figure 3. Raman Spectra of dickite, which is the mineral composition of the matrix of the samples.
Minerals 13 00291 g003
Figure 4. Raman Spectra of impurity minerals in the samples. (a) hematite detected from the red cracks; (b) barite detected from mixed impurity minerals blended into pink agglomerate; (c) anatase detected from the mixture of white and dark red impurity minerals, and other impurity minerals, such as (d) diaspore, (e) pyrite.
Minerals 13 00291 g004
Figure 5. SEM images of clustered acicular minerals in sample LWB-1. (a) SEM image of clustered accicular minerals in the void of dickite particles (3500×); (b) Zooming image of (a) showing thin accicular and rod-like minerals (25,000×); (c) Zooming image of (a) showing needle-like minerals (10,000×); (d) Zooming image of (a) showing rod-like minerals (10,000×).
Minerals 13 00291 g005
Figure 6. EDS mapping of the clustered acicular minerals. (a) Element Al distribution map; (b) Element Fe distribution map; (c) Element O distribution map; (d) Element Si distribution map of the same area shown in Figure 5a.
Minerals 13 00291 g006
Figure 7. SEM and EDS mapping of iron oxide or hydroxide minerals in plate-like dickite particles. (a) SEM image showing the platy ferruginuous minerals distributed among dickite particles. Some dickite particles were circles black in the upper; (b) Element Fe distribution map. Fe concentrates in the iron oxides/hydroxides and outlines the dickite particles, such as the red circles shown; (c) Element O distribution map; (d) Element Al distribution map; (e) Element Si distribution map; (f) Element C distribution map; (g) Element K distribution map and (h) Element Ca distribution map of the same area of (a).
Minerals 13 00291 g007
Figure 8. A 3D scatter diagram of yellow and orange-yellow areas in the yellow seal stone samples from Northern Laos. L* (Lightness) is the z-axis, a* (redness) is the x-axis, and b* (yellowness) is the y-axis.
Minerals 13 00291 g008
Figure 9. Projection of samples’ colour parameters in the CIE 1931 L*a*b* standard space, and it can be seen that the yellow and orange-yellow areas were mainly concentrated in two different zones.
Minerals 13 00291 g009
Figure 10. Characteristics of UV-Vis reflectance spectra and K-M 2nd spectra of samples. The intensity of bands at 580~600 nm is stronger than the other band or peaks. (a) Reflective UV-Vis spectra collected from lighter colour (mainly yellow) areas; (b) Reflective UV-Vis spectra collected from darker colour (mainly orange-yellow) areas; (c) K-M 2nd reflective UV-Vis spectra collected from darker colour (mainly yellow) areas; (d) K-M 2nd reflective UV-Vis spectra collected from darker colour (mainly orange-yellow) areas.
Minerals 13 00291 g010aMinerals 13 00291 g010b
Table 1. Colour parameters collected from the samples.
Dominant Wavelength (nm)
yellow partsLWB-5L35.97 2.52 8.21 0.33 72.90 8.59 576.59
LWB-10L47.99 2.48 5.27 0.19 64.81 5.83 578.90
LWB-17L33.65 0.35 4.55 0.18 85.61 4.57 572.58
LW-Y-3L36.45 2.95 9.89 0.38 73.40 10.32 576.53
LW-Y-4L38.88 1.07 9.85 0.34 83.78 9.90 573.22
LW-Y-6L38.66 1.82 6.69 0.25 74.76 6.94 575.88
LW-Y-8L41.95 1.94 8.98 0.31 77.79 9.19 575.00
LW-Y-10L34.44 3.65 7.94 0.35 65.33 8.74 579.11
LW-Y-14L37.62 2.20 8.35 0.31 75.26 8.63 575.82
LW-Y-16L40.26 2.73 8.19 0.30 71.56 8.63 576.98
LW-Y-17L39.46 2.99 8.79 0.33 71.20 9.29 577.15
orange-yellow partsLWB-1L39.28 8.00 14.75 0.60 61.52 16.78 581.21
LWB-2L42.81 8.97 18.02 0.67 63.53 20.13 580.65
LWB-2D43.66 9.79 19.44 0.71 63.26 21.77 580.89
LWB-3D41.32 11.61 19.89 0.79 59.73 23.03 582.58
LWB-4D43.32 10.45 20.41 0.75 62.90 22.93 581.18
LWB-4L33.99 3.98 8.04 0.36 63.68 8.97 579.69
LWB-5D40.76 7.87 16.66 0.64 64.70 18.42 580.08
LWB-6D45.02 5.44 17.45 0.57 72.70 18.28 577.13
LWB-7D45.10 7.49 19.03 0.64 68.52 20.45 578.75
LWB-8D44.93 7.10 17.67 0.60 68.10 19.04 578.80
LWB-10D43.77 7.16 17.35 0.61 67.57 18.77 578.99
LWB-12L35.54 7.73 17.24 0.71 65.85 18.89 579.88
LWB-12D38.66 12.39 22.14 0.90 60.76 25.37 582.58
LWB-14D41.73 8.33 19.89 0.71 67.28 21.56 579.39
LWB-15D36.36 7.77 18.23 0.72 66.92 19.81 579.54
LWB-18L41.38 4.65 16.59 0.57 74.34 17.23 576.56
LW-Y-1D42.84 4.19 15.05 0.51 74.45 15.62 576.40
LW-Y-1L42.65 4.06 15.28 0.51 75.13 15.80 576.19
LW-Y-2L43.66 7.07 18.32 0.63 68.90 19.64 578.59
LW-Y-2D44.16 9.15 19.67 0.70 65.05 21.70 580.15
LW-Y-3D43.19 7.64 17.52 0.63 66.44 19.11 579.44
LW-Y-4D43.59 10.31 20.41 0.75 63.19 22.87 581.04
LW-Y-5D39.05 4.96 12.70 0.49 68.68 13.63 578.31
LW-Y-6D38.58 7.89 14.79 0.61 61.93 16.76 581.07
LW-Y-8D42.72 7.13 15.69 0.58 65.55 17.24 579.61
LW-Y-9D42.98 8.53 19.31 0.69 66.16 21.12 579.72
LW-Y-11D40.09 5.73 15.32 0.56 69.49 16.35 578.21
LW-Y-12D46.27 11.88 22.10 0.79 61.73 25.09 581.76
LW-Y-13D42.98 9.19 19.48 0.71 64.75 21.54 580.30
LW-Y-14D40.39 8.78 16.12 0.65 61.42 18.36 581.39
LW-Y-15L40.81 7.25 15.17 0.58 64.47 16.81 580.01
LW-Y-15D42.85 10.49 18.29 0.71 60.17 21.09 582.11
LW-Y-17D44.39 9.56 16.97 0.64 60.59 19.48 581.70
LW-Y-18D42.98 7.92 18.55 0.66 66.87 20.17 579.38
Table 2. Content of goethite and hematite estimated from K-M 2nd derivative spectra.
SamplesY1Goethite (g/kg)Y2Hematite (g/kg)
yellow partsLWB-5L0.0010759410.22835225————
LWB-10L0.0019843120.471795657————
LWB-17L0.0018120210.425621738————
LW-Y-3L0.0015690420.360503127————
LW-Y-4L0.0019897440.47325136————
LW-Y-6L0.001764680.412934281————
LW-Y-8L0.002729290.671449621————
LW-Y-10L0.0008759870.174764567————
LW-Y-14L0.0020272550.483304445————
LW-Y-16L0.0016032780.369678603————
LW-Y-17L0.0020573890.491380249————
orange-yellow partsLWB-1L0.0010599330.2240621620.00122520.402530309
LWB-2L0.0022227090.5356859550.0024432850.892200609
LWB-2D0.0012807280.283235060.0027327041.008547074
LWB-3D0.0009557060.1961292440.0030310461.128480675
LWB-4D0.0018262450.4294337620.0032571421.219371117
LWB-4L0.0011084670.2370691520.0008660890.258167593
LWB-5D0.0013132210.291943230.0024739440.904525304
LWB-6D0.0028014020.6907756410.0022354630.80865613
LWB-7D0.0016987990.3952781930.0023060930.837049482
LWB-8D0.0019674120.4672664190.0019830250.707175859
LWB-10D0.00173780.4057305050.0017432610.61079074
LWB-12L0.001433510.3241806830.003594451.354968756
LWB-12D0.0013860350.3114572980.0061505552.38252327
LWB-14D0.0015185420.3469691690.0053198452.048577627
LWB-15D0.0012853260.2844672470.0038751731.467819471
LWB-18L0.0017841340.418148030.0029981621.115261068
LW-Y-1D0.0020906980.500307090.0014536460.494365656
LW-Y-1L0.0005820.0959164960.0019217950.682561744
LW-Y-2L0.0023873780.5798172540.0034237591.286350983
LW-Y-2D0.0014254050.322008660.0043081971.641895239
LW-Y-3D0.0022503890.5431042390.0023125910.839661424
LW-Y-4D0.001651170.38251360.0041208471.566580404
LW-Y-5D0.0015495910.3552903940.002022920.723213885
LW-Y-6D0.0014881220.3388167640.0022097870.798334202
LW-Y-8D0.0015523430.3560277910.0030576631.139180642
LW-Y-9D0.0016266410.3759397070.0021844620.788153614
LW-Y-11D0.0013708530.3073885420.0024667330.901626586
LW-Y-12D0.0017752960.415779410.0035622591.342028192
LW-Y-13D0.0013651520.3058606370.0041287691.569765008
LW-Y-14D0.0013845710.3110649450.0028152821.041743287
LW-Y-15L0.0011593570.2507078080.0022900620.830604936
LW-Y-15D0.0013924940.3131884110.0030101081.120063488
LW-Y-17D0.0018444880.4343228120.0029557041.098192886
LW-Y-18D0.0014438020.3269390030.0024972050.913876211
Table 3. Multiple linear regression and correlation results between colour parameters and approximate content of goethite and hematite in samples calculated from K-M 2nd derivative spectra.
Colour
Parameters
Correlations with GoethiteCorrelations with HematiteMultiple Linear Correlation
ResultsPearson’s rSignificancePearson’s rSignificanceRR2
L* (Lightness)0.4750.0050.0380.8290.4770.228
a* (redness)−0.0800.6530.611<0.0010.6140.377
b* (yellowness)0.1940.2710.706<0.001 0.7370.543
Disclaimer/Publisher’s Note: The statements, opinions and data contained in all publications are solely those of the individual author(s) and contributor(s) and not of MDPI and/or the editor(s). MDPI and/or the editor(s) disclaim responsibility for any injury to people or property resulting from any ideas, methods, instructions or products referred to in the content.

