Article

Spectral Characteristics of Unique Species of Burmese Amber

1
Gemological Institute, China University of Geosciences (Wuhan), Wuhan 430074, China
2
Gem Testing Center, China University of Geosciences (Wuhan), Guangzhou 510145, China
*
Author to whom correspondence should be addressed.
Minerals 2023, 13(2), 151; https://doi.org/10.3390/min13020151
Submission received: 23 September 2022 / Revised: 6 January 2023 / Accepted: 7 January 2023 / Published: 19 January 2023
(This article belongs to the Special Issue Gem Deposits: Mineralogical and Gemological Aspects)

Abstract

:
Special species of Burmese amber are highly valued within the gemological market due to their fancy optical characteristics. However, some ordinary amber species are misidentified as precious species, which has disrupted consumers’ purchasing behavior and the market order. In this study, seven Burmese amber species (golden, golden-blue, blood-tea, black-tea, green-tea, brownish-red, and ‘chameleon’ amber) were collected and investigated. By using conventional gemological tests, Fourier transform infrared (FTIR), three-dimensional (3D) fluorescence, and photoluminescence (PL) spectrometers, detailed analyses were performed on unique species. The FTIR spectra identified that there are three groups of peaks that can distinguish Burmese amber from any other origin. Additionally, the ‘Chameleon’ amber exhibited special patterns in the third group, which might be due to its internal aromatic hydrocarbons structures that are different from any other species. The 3D fluorescence spectra displayed that all seven species presented similar fluorescence behavior—the 334 or 347 nm emission wavelength could be optimally excited by 240 or 294 nm excitation wavelength in the ultraviolet region and the 380 ± 10 nm or 400 ± 10 nm excitation wavelength optimally excited the 430 nm emission wavelength in the violet region. In the red region, green-tea amber, black-tea amber, and brownish-red amber presented totally different fluorescence behavior, which could be regarded as a reference feature for differentiation. Obvious pink fluorescence on the surface of the tea amber was efficiently found under PL spectra, and we firstly suggest this test could be used as an effective way to distinguish black-tea amber from green-tea amber and some ordinary species (such as blood-tea amber). Both the PL and 3D fluorescence measurements demonstrated the different luminescence behavior of tea amber in the red region, which might be related to the type and content of red fluorescent substances in the tea amber.

1. Introduction

Burmese amber is one of the most ancient ambers originating in the Cretaceous period, and its plant source is commonly regarded as Araucariaceae [1,2]. There are three main mines of amber in Burma: Denai, Kandi, and Tilin mines. Among them, the Denai Mine is the oldest mining area where many species of amber, including brown, golden, blood, and root amber species, are unearthed in abundance. The Kandi Mine is a relatively young mining area which has been fulfilled with tea amber and ‘chameleon’ amber. The age of Myanmar amber has been confirmed as 99 million years [3], which are older than amber from other geographic origin, so they have recorded more paleontological information and provide greater scientific research value for paleobiology scholars [4]. However, the value of amber itself has not been ignored. For example, the chemical composition characteristics of amber provide an important reference value for identifying plant source, although it needs to be combined with other disciplines such as ecological environment, geography, and spectroscopy [5,6,7]. Various color fluorescence and phosphorescence phenomena caused by the chemical composition make Myanmar amber more attractive and colorful, which is not only favored by consumers in the market [8,9] but also attracts the interest of researchers.
Zhang Z.Q. et al. found that [10] amber from different producing areas had different luminescence characteristics by using three-dimensional fluorescence (3D) spectrum testing, and Jiang X.R. et al. believed that fluorescence and phosphorescence spectra explained the pink fluorescence and phosphorescence phenomena on the surface of tea amber [11]. Jiang W.Q. et al. used gas chromatography-mass spectrometer (GC-MS) to analyze the chemical components of Dominican amber and confirmed that the blue fluorescent substances were aromatic components [12]. Researchers used synchronous fluorescence spectroscopy combined with GC-MS to explain the Baltic amber extract substance, and believed that the fluorescence phenomena in the ultraviolet and violet region were related to aromatic hydrocarbons such as naphthene [13]. There are four special species of Burmese amber, as shown in Table 1.
Because of the fancy colors caused by fluorescence and phosphorescence effects (Figure 1), previous scholars have systematically summarized the gemological and spectral characteristics of amber from different places [14,15,16,17]. However, commonalities and differences in the spectral characteristics of the different amber species in Burma have not been analyzed in-depth. Based on the special optical phenomenon as the main entry point, identification evidence based on the photoluminescence (PL) spectra still does not exist. In the current study, the gemological and spectral characteristics of 13 Burmese amber samples were collected using conventional gemological methods, the Fourier transform infrared (FTIR) spectroscopy test, 3D fluorescence spectroscopy test, and PL spectroscopy test. The study produced findings with identification significance, and it provides richer references for the identification of the place of origin and classification of the varieties. Furthermore, we also discuss the presence of fluorescence substances in amber.

2. Materials and Methods

2.1. Materials

Thirteen Myanmar amber samples were used in this study. These samples have been classified into seven species (Figure 2): golden amber (MDG-1), golden-blue amber (MDGB-1, MDGB-2), blood-tea amber (MDBOT-1, MDBOT-2, MDBOT-3), green-tea amber (MDGT-1), black-tea amber (MDBAT-1, MDBAT-2), brownish-red amber (MDBR-1, MDBR-2), and ‘chameleon’ amber (MDCL-1, MDCL-2).

2.2. Methods

The gemological characteristics of the amber samples, including their appearance, ultraviolet fluorescence characteristics, relative density, and optical features, were preliminary tested. The appearance features were analyzed under different light sources and backgrounds—strong white light on white and black backgrounds, long-wave (365 nm) UV light under black backgrounds, and short-wave (245 nm) UV light under black backgrounds. The hydrostatic density was determined using a Sartorius balance (BSA223S, Sartouris, Göttingen, Germany), and the extinction characteristics of samples were obtained under a polarizer.
The infrared spectral features (VERTEX80, Bruker, Mannheim, Germany) of amber samples were tested via the KBr tablet method, by mixing the KBr and amber powder with the mass fraction 100:1 approximately, with test range: 4000–400 cm−1, step size: 4 cm−1, scanning time: 128 s, and scanning speed: 10 kHz, respectively. A baseline calibration was also performed on the obtained results. The vibration information of molecular bonds in functional groups can be obtained in this test by comparing the transmission peak position and intensity of each sample. The 3D fluorescence spectra (FP8500, JASCO, Tokyo, Japan) were tested using the fluorescence spectrophotometer. The excitation light source adopts a continuously adjustable hernia light source., and the scanning speed was 2000 nm/min, while both the bandwidths of the excitation wavelength (Ex) and emission wavelength (Em) were 5 nm with a response time in 10 ms. The test range of the excitation wavelength was 220–500 nm, and the data interval was 2 nm. The test range of the emission wavelength was 240–700 nm, and the data interval was 1 nm [11]. The photoluminescence spectra (Qspec Microscopic PL-3000, Guangzhou Biaoqi, Guangzhou, China) of the samples were collected with the excitation light source at 405 nm with an integral time of 180 ms. The luminescence characteristics of samples under these conditions were summarized to find effective identification basis.

3. Results and Discussions

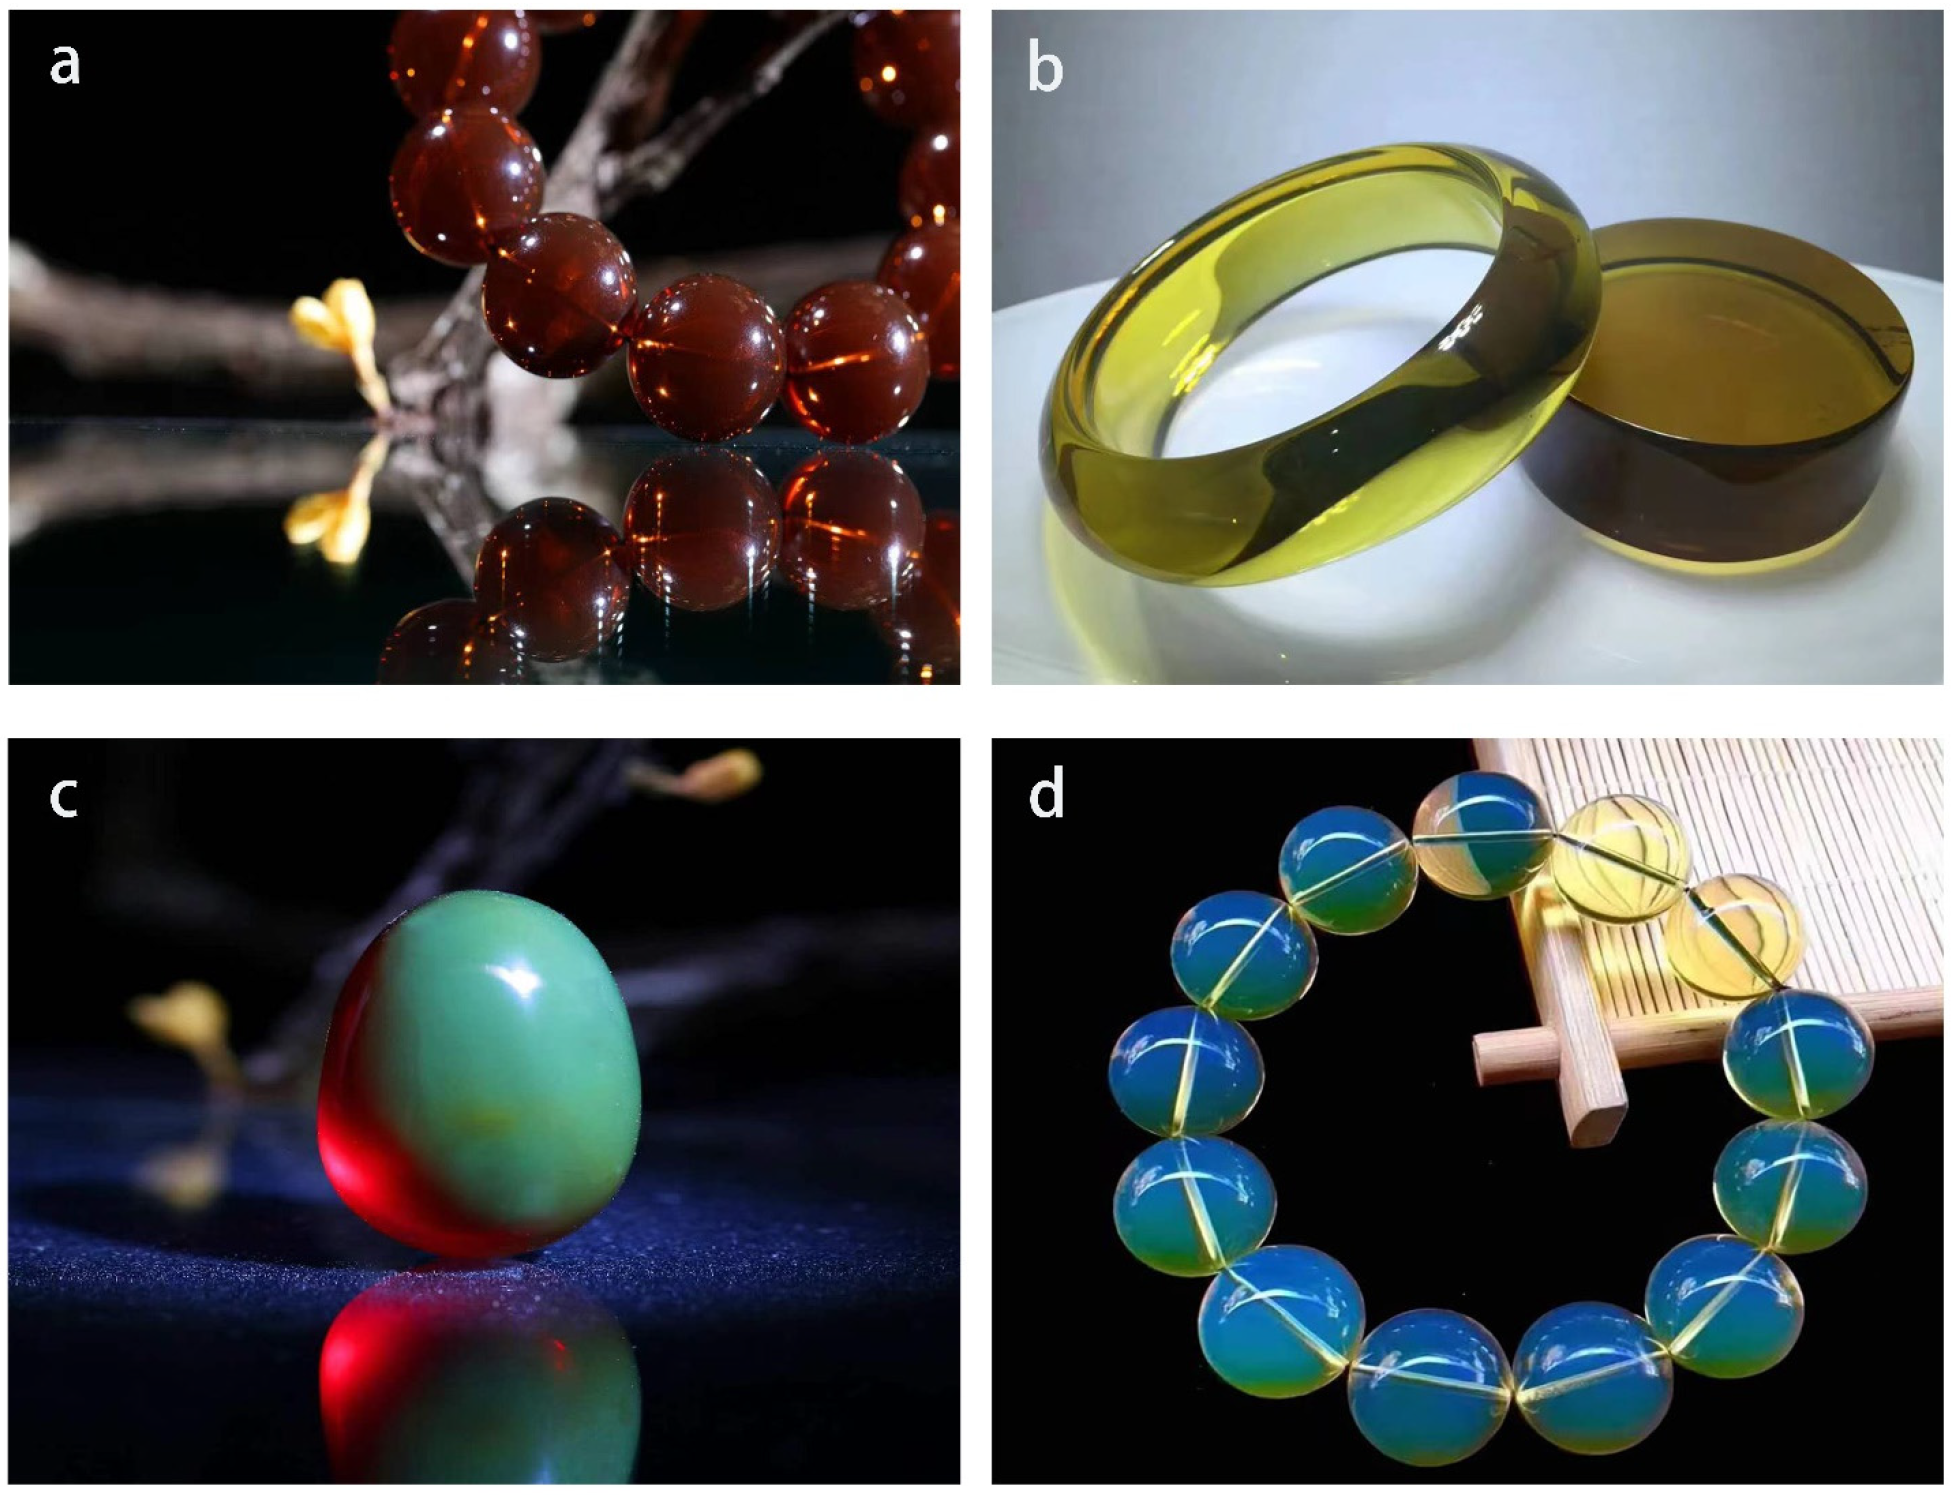
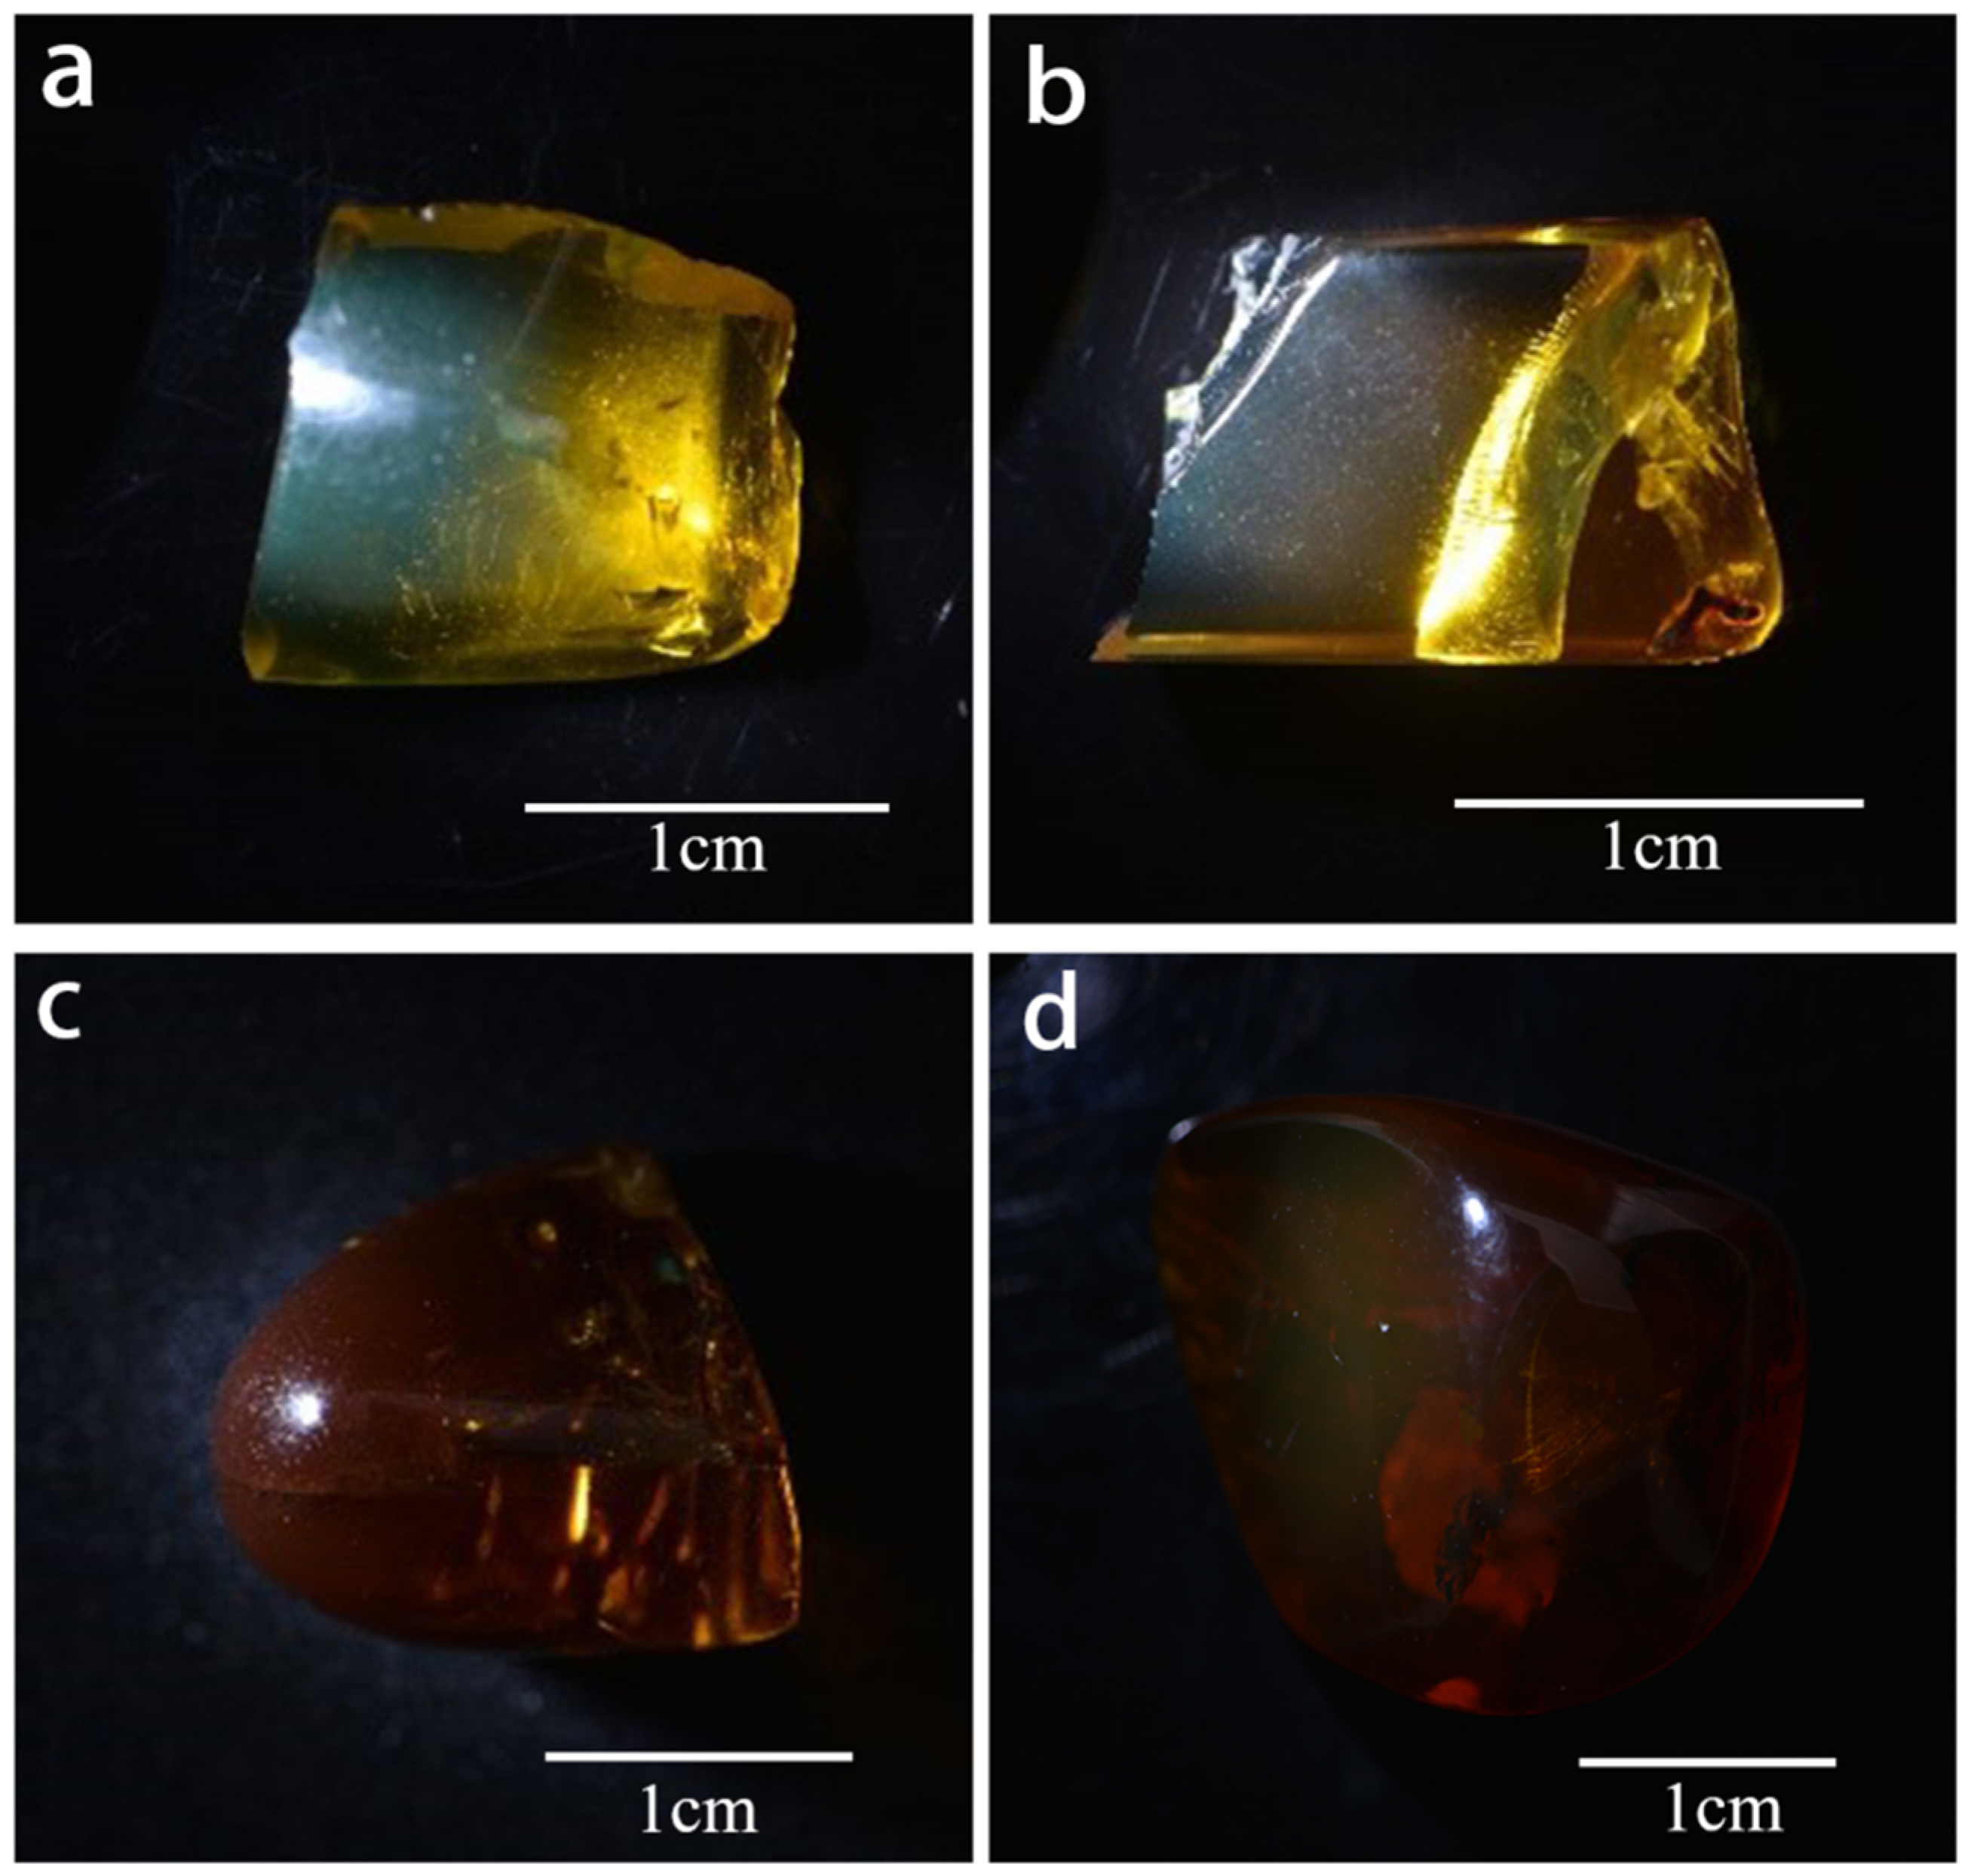
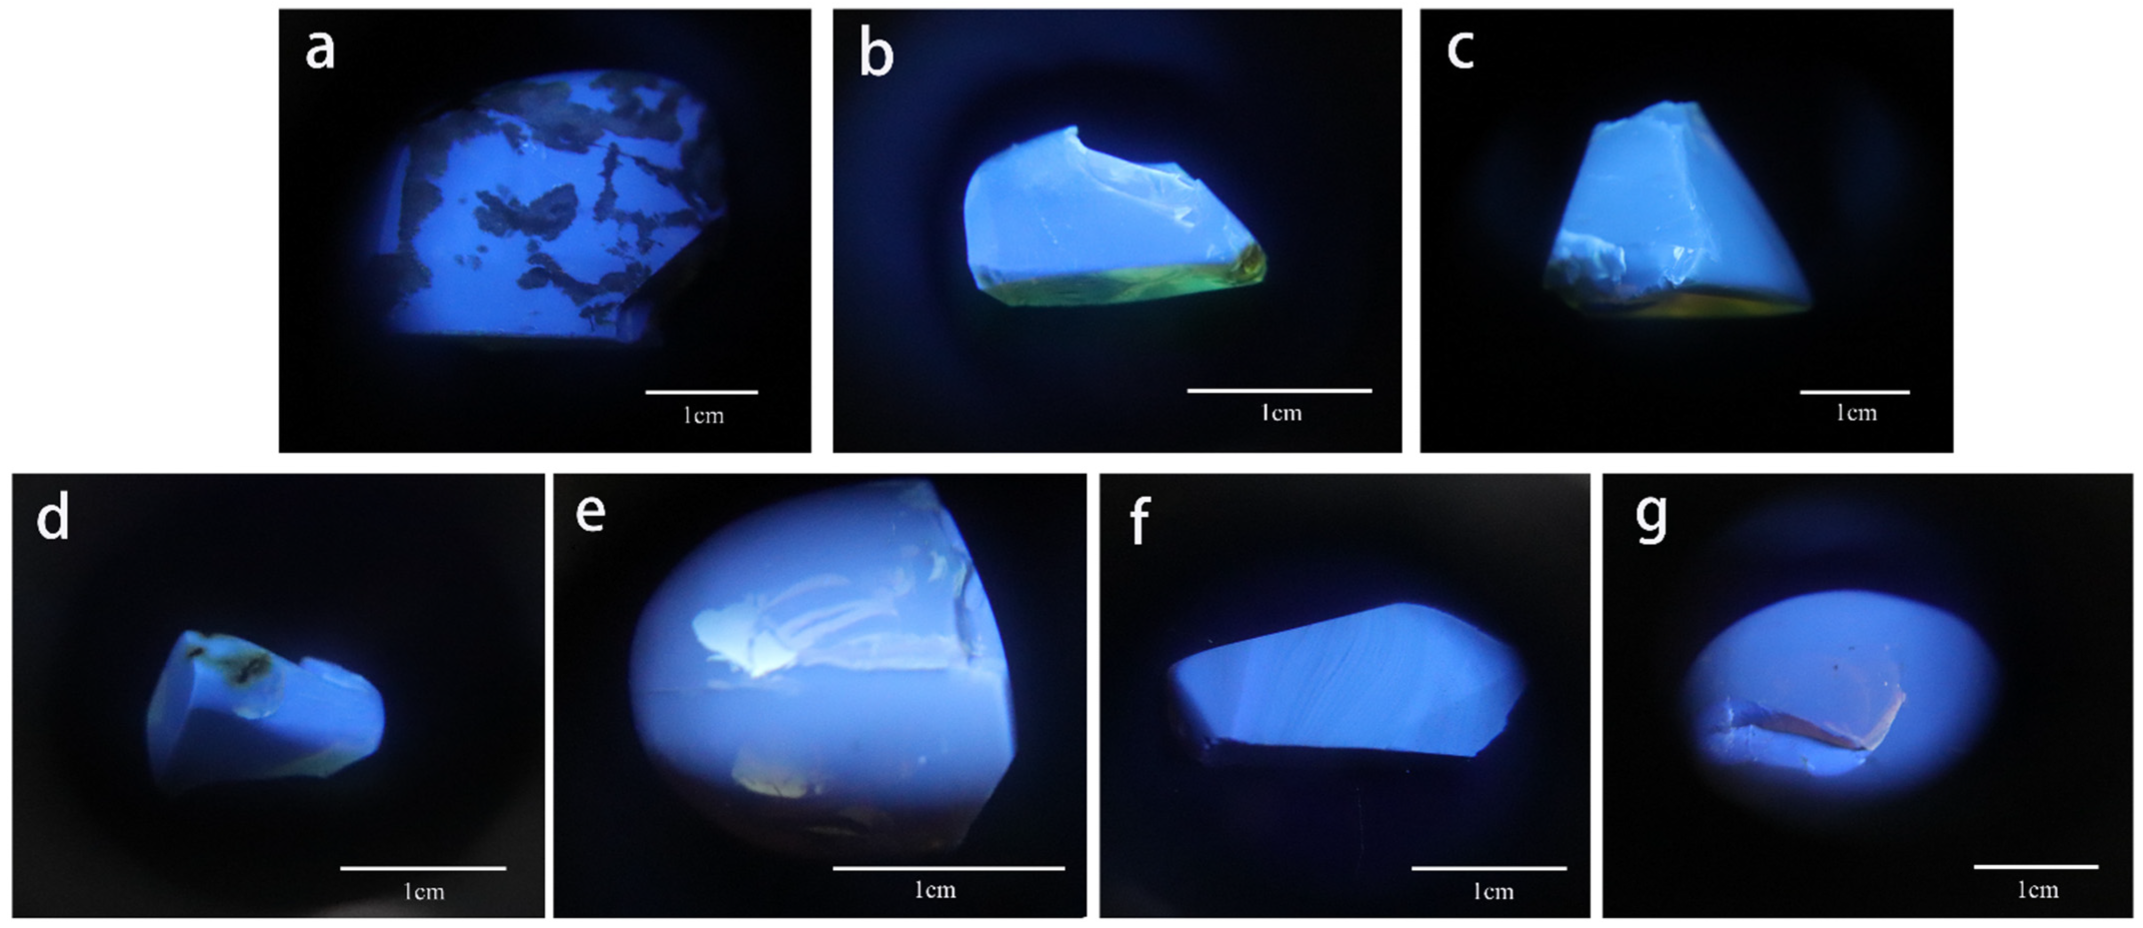
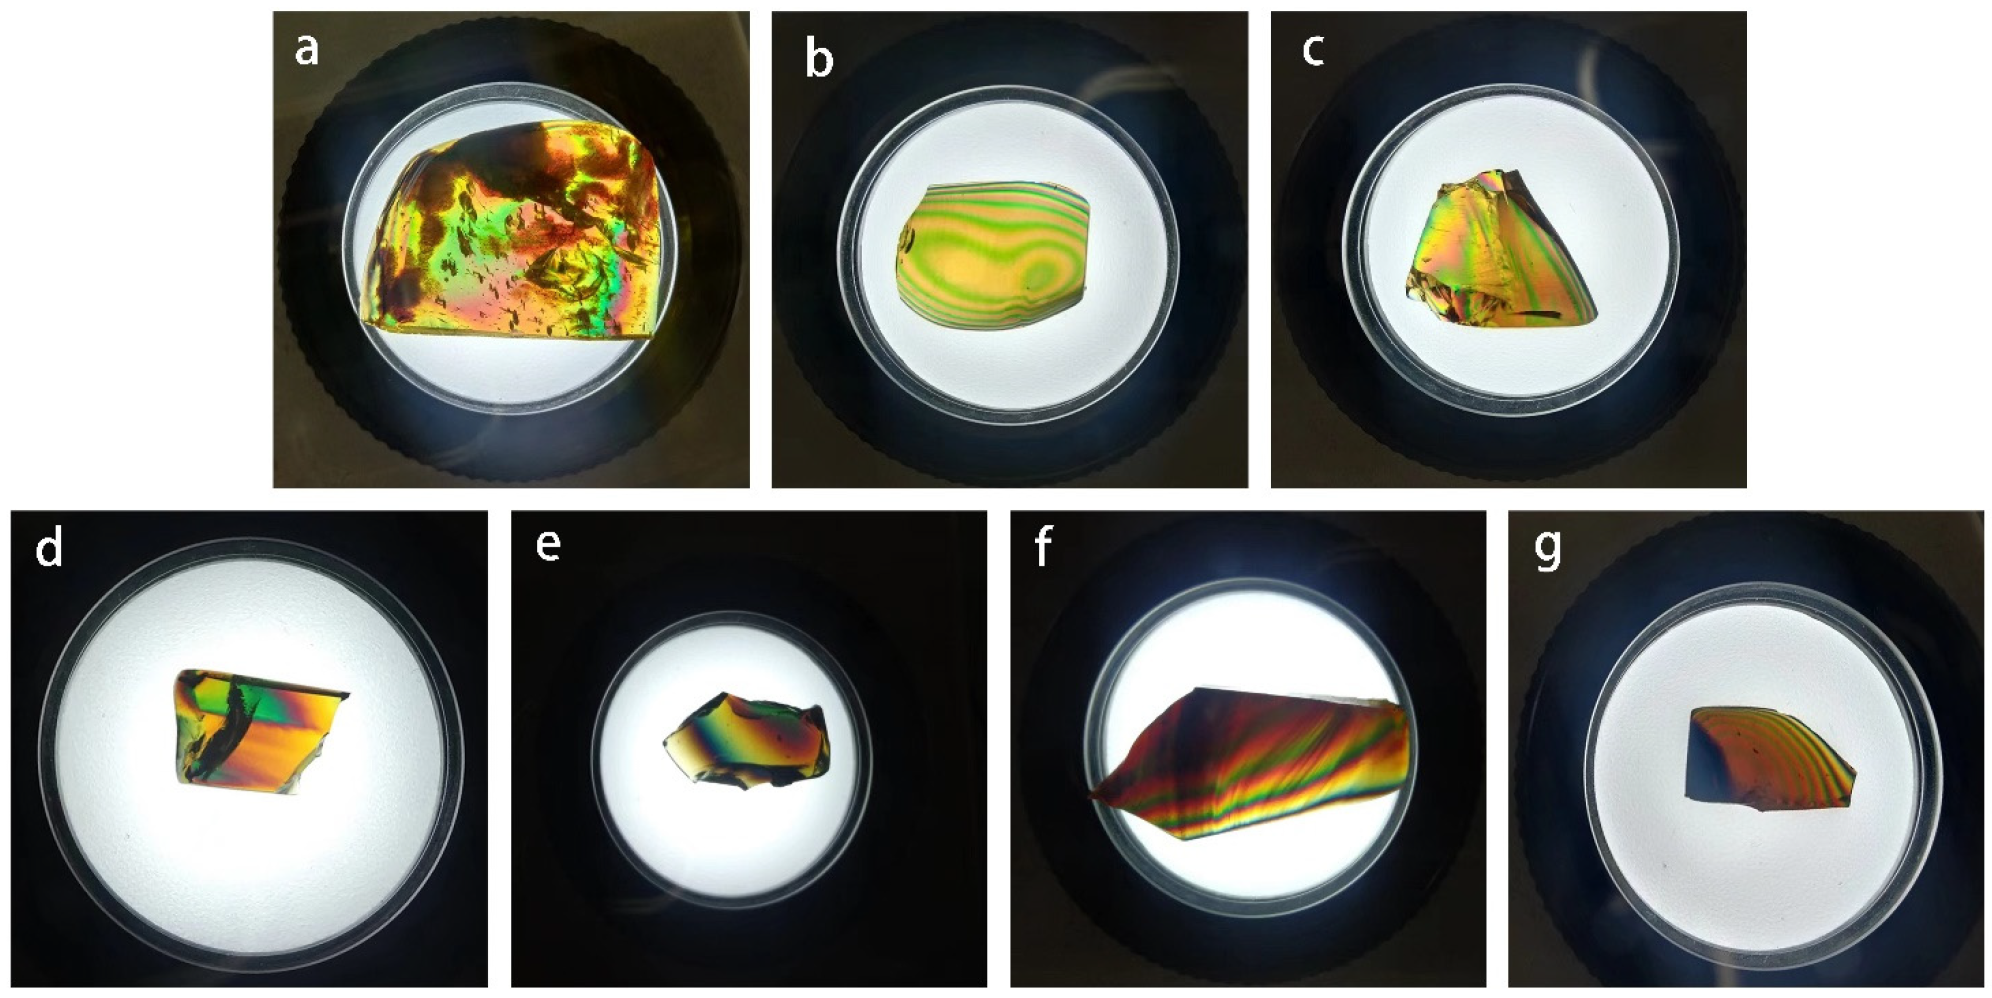
3.1. Gemological Characteristics

The basic gemological characteristics of the samples tested are listed in Table 2. On the white background with natural light, the body color of amber samples were dominated by yellow, yellowish brown, and dark brown. Generally, all samples presented transparent appearances, except the brownish-red amber; the brown parts were faintly transparent–semi-transparent. The relative density ranged from 1.027 to 1.070. The fluorescence behavior was nearly the same under short-wave ultraviolet (SW UV) and long- wave ultraviolet (LW UV), but higher intensity fluorescence was observed under LW UV radiation. Therefore, we only recorded fluorescence features at long-wave (365 nm) UV, which presents more identifiable information than that of short-wave (245 nm) UV. The anomalous extinction phenomenon appeared on all samples because of the heterogeneous characteristic of amber [19].
It was worth noting that four species, golden-blue amber (MDGB-1, MDGB-2), green-tea amber (MDGT-1), black-tea amber (MDBAT-1, MDBAT-2), and ‘chameleon’ amber (MDCL-1, MDCL-2), showed four kinds of special optical effect (Figure 3).
Under a black background and 365 nm UV light source, most of the amber samples presented a bluish-violet fluorescence (Figure 4). In one case, a slight pink fluorescence was shown (Figure 4e) [11]. Additionally, the chameleon amber (MDCL-2) revealed a visual impression of dark green or dark white (Figure 4g).
Under the polarizer, all varieties of samples revealed an annular-banded anomalous extinction phenomenon (Figure 5).

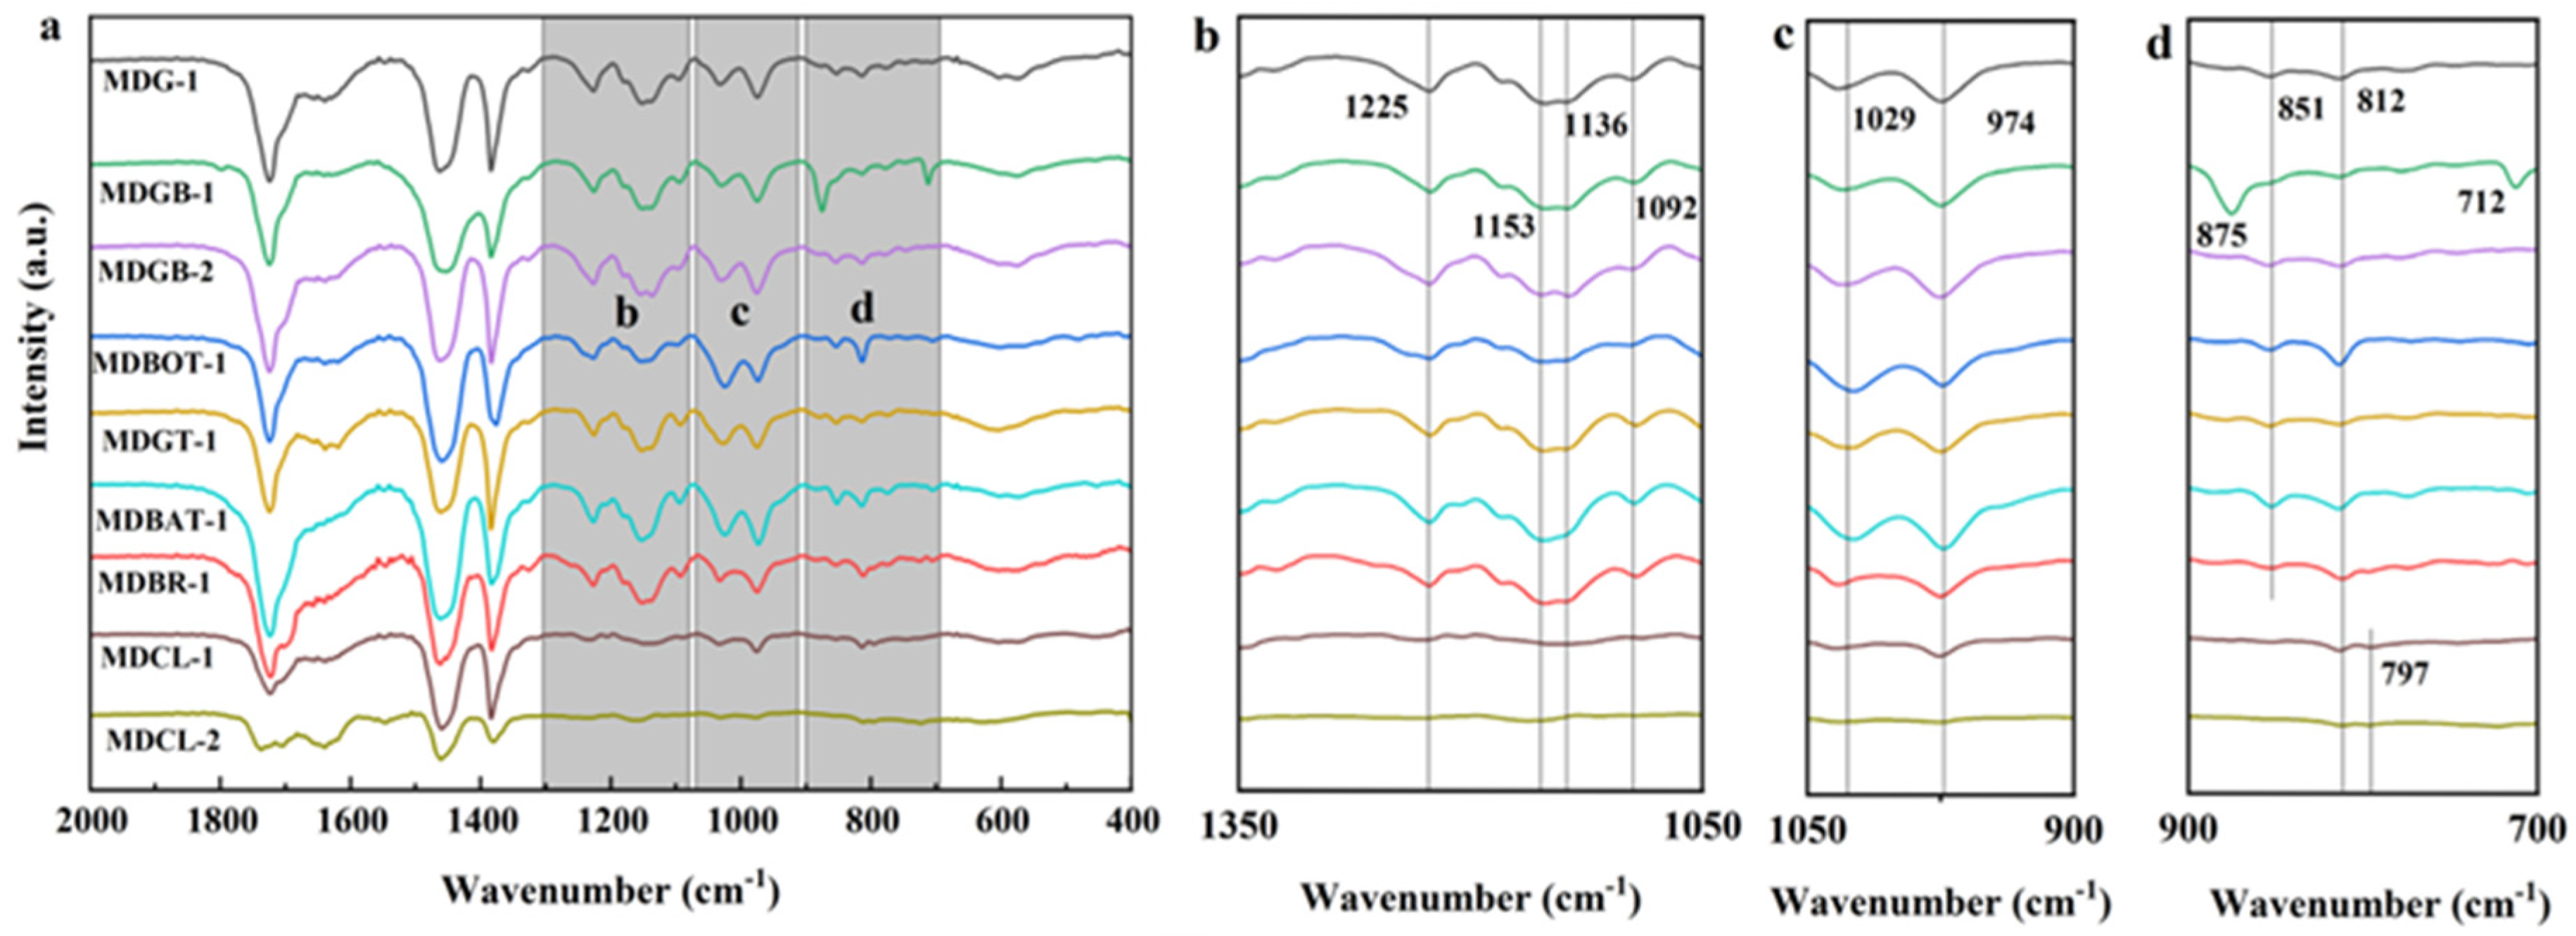
3.2. FTIR Spectral Analysis

It is worth pointing out that there were three groups of special position of Burmese amber that significantly differ from other places (Figure 6a). The first spectra bands group (Figure 6b) were recorded at 1225, 1153, 1136, and 1092 cm−1, caused by C-O stretching vibration which were determined by oxygen-containing functional groups. The second group spectra bands (Figure 6c) were recorded at 1029 cm−1, due to the C-O stretching vibration in alcohol, and 974 cm−1 caused by flexural vibration out from the C-H surface. The third group was recorded at 851 and 812 cm−1, caused by flexural vibration out from the C-H surface on the aromatic ring [20]. In the third group, there were two transmission peaks (875 and 712 cm−1) in MDGB-1 samples (Figure 6d).
In this test, we gained more peaks by optimizing the test parameters compared with previous work [21]. Burmese amber was recorded at 1225 cm−1, 1153 cm−1, 1136 cm−1, 1092 cm−1, 1029 cm−1, 974 cm−1, 851 cm−1, and 812 cm−1. Firstly, Burmese amber lacked the ‘Baltic shoulder’ feature and 888cm-1 which helps to distinguish it from Baltic amber. Secondly, the characteristic peaks of Dominican Amber were recorded at 1244 cm−1, 1174 cm−1, 1148 cm−1, 1130 cm−1, and 1104 cm−1, and the characteristic peaks of Mexican Amber were recorded at 1241 cm−1, 1170 cm−1, 1142 cm−1, 1105 cm−1, and 888 cm−1. It is clear that their peak positions in the first group are significantly different from Burmese amber and they lacked the second and third group peaks that Burmese amber possessed. Finally, the characteristic peaks of Funshun Amber were recorded at 1229 cm−1, 1180 cm−1, 1153 cm−1, 1138 cm−1, 1093 cm−1, 852 cm−1, and 813 cm−1. Fushun amber lacked the second group of peaks that Burmese amber possessed.
In the ‘chameleon’ amber samples (MDCL–1, MDCL–2), the relative intensity of the first and second group was significantly lower than other samples—its curve shape was wide and smooth. Moreover, the characteristic peaks at 812 and 797 cm−1 in the third group were also different from other optical samples. The spectra region between 900 and 700 cm−1 indicated the aromatic hydrocarbon structure and differences in the peak positions in this region, and it may reflect the isomerization of aromatic hydrogen. It is supposed that the internal aromatic hydrocarbon compound structures in ‘Chameleon’ are significantly different from those in other varieties of amber [22].

3.3. 3D Fluorescence Spectra

In this section, we presented 3D fluorescence characteristics according to species classification. We selected a sample of each species for detailed explanation. They were MDG-1, MDGB-2, MDBOT-1, MDGT-1, MDBAT-2, MDBR-1, and MDCL-1.

3.3.1. Golden Amber

The 3D fluorescence spectra of the amber species were collected. In the violet region, it was found that the 430 nm emission wavelength of the golden amber can be optimally excited via the 380 nm or 400 nm excitation wavelength. In the ultraviolet region, it was found that the optimal excitation center corresponding to the 347 nm emission wavelength is 240 or 294 nm (Figure 7).

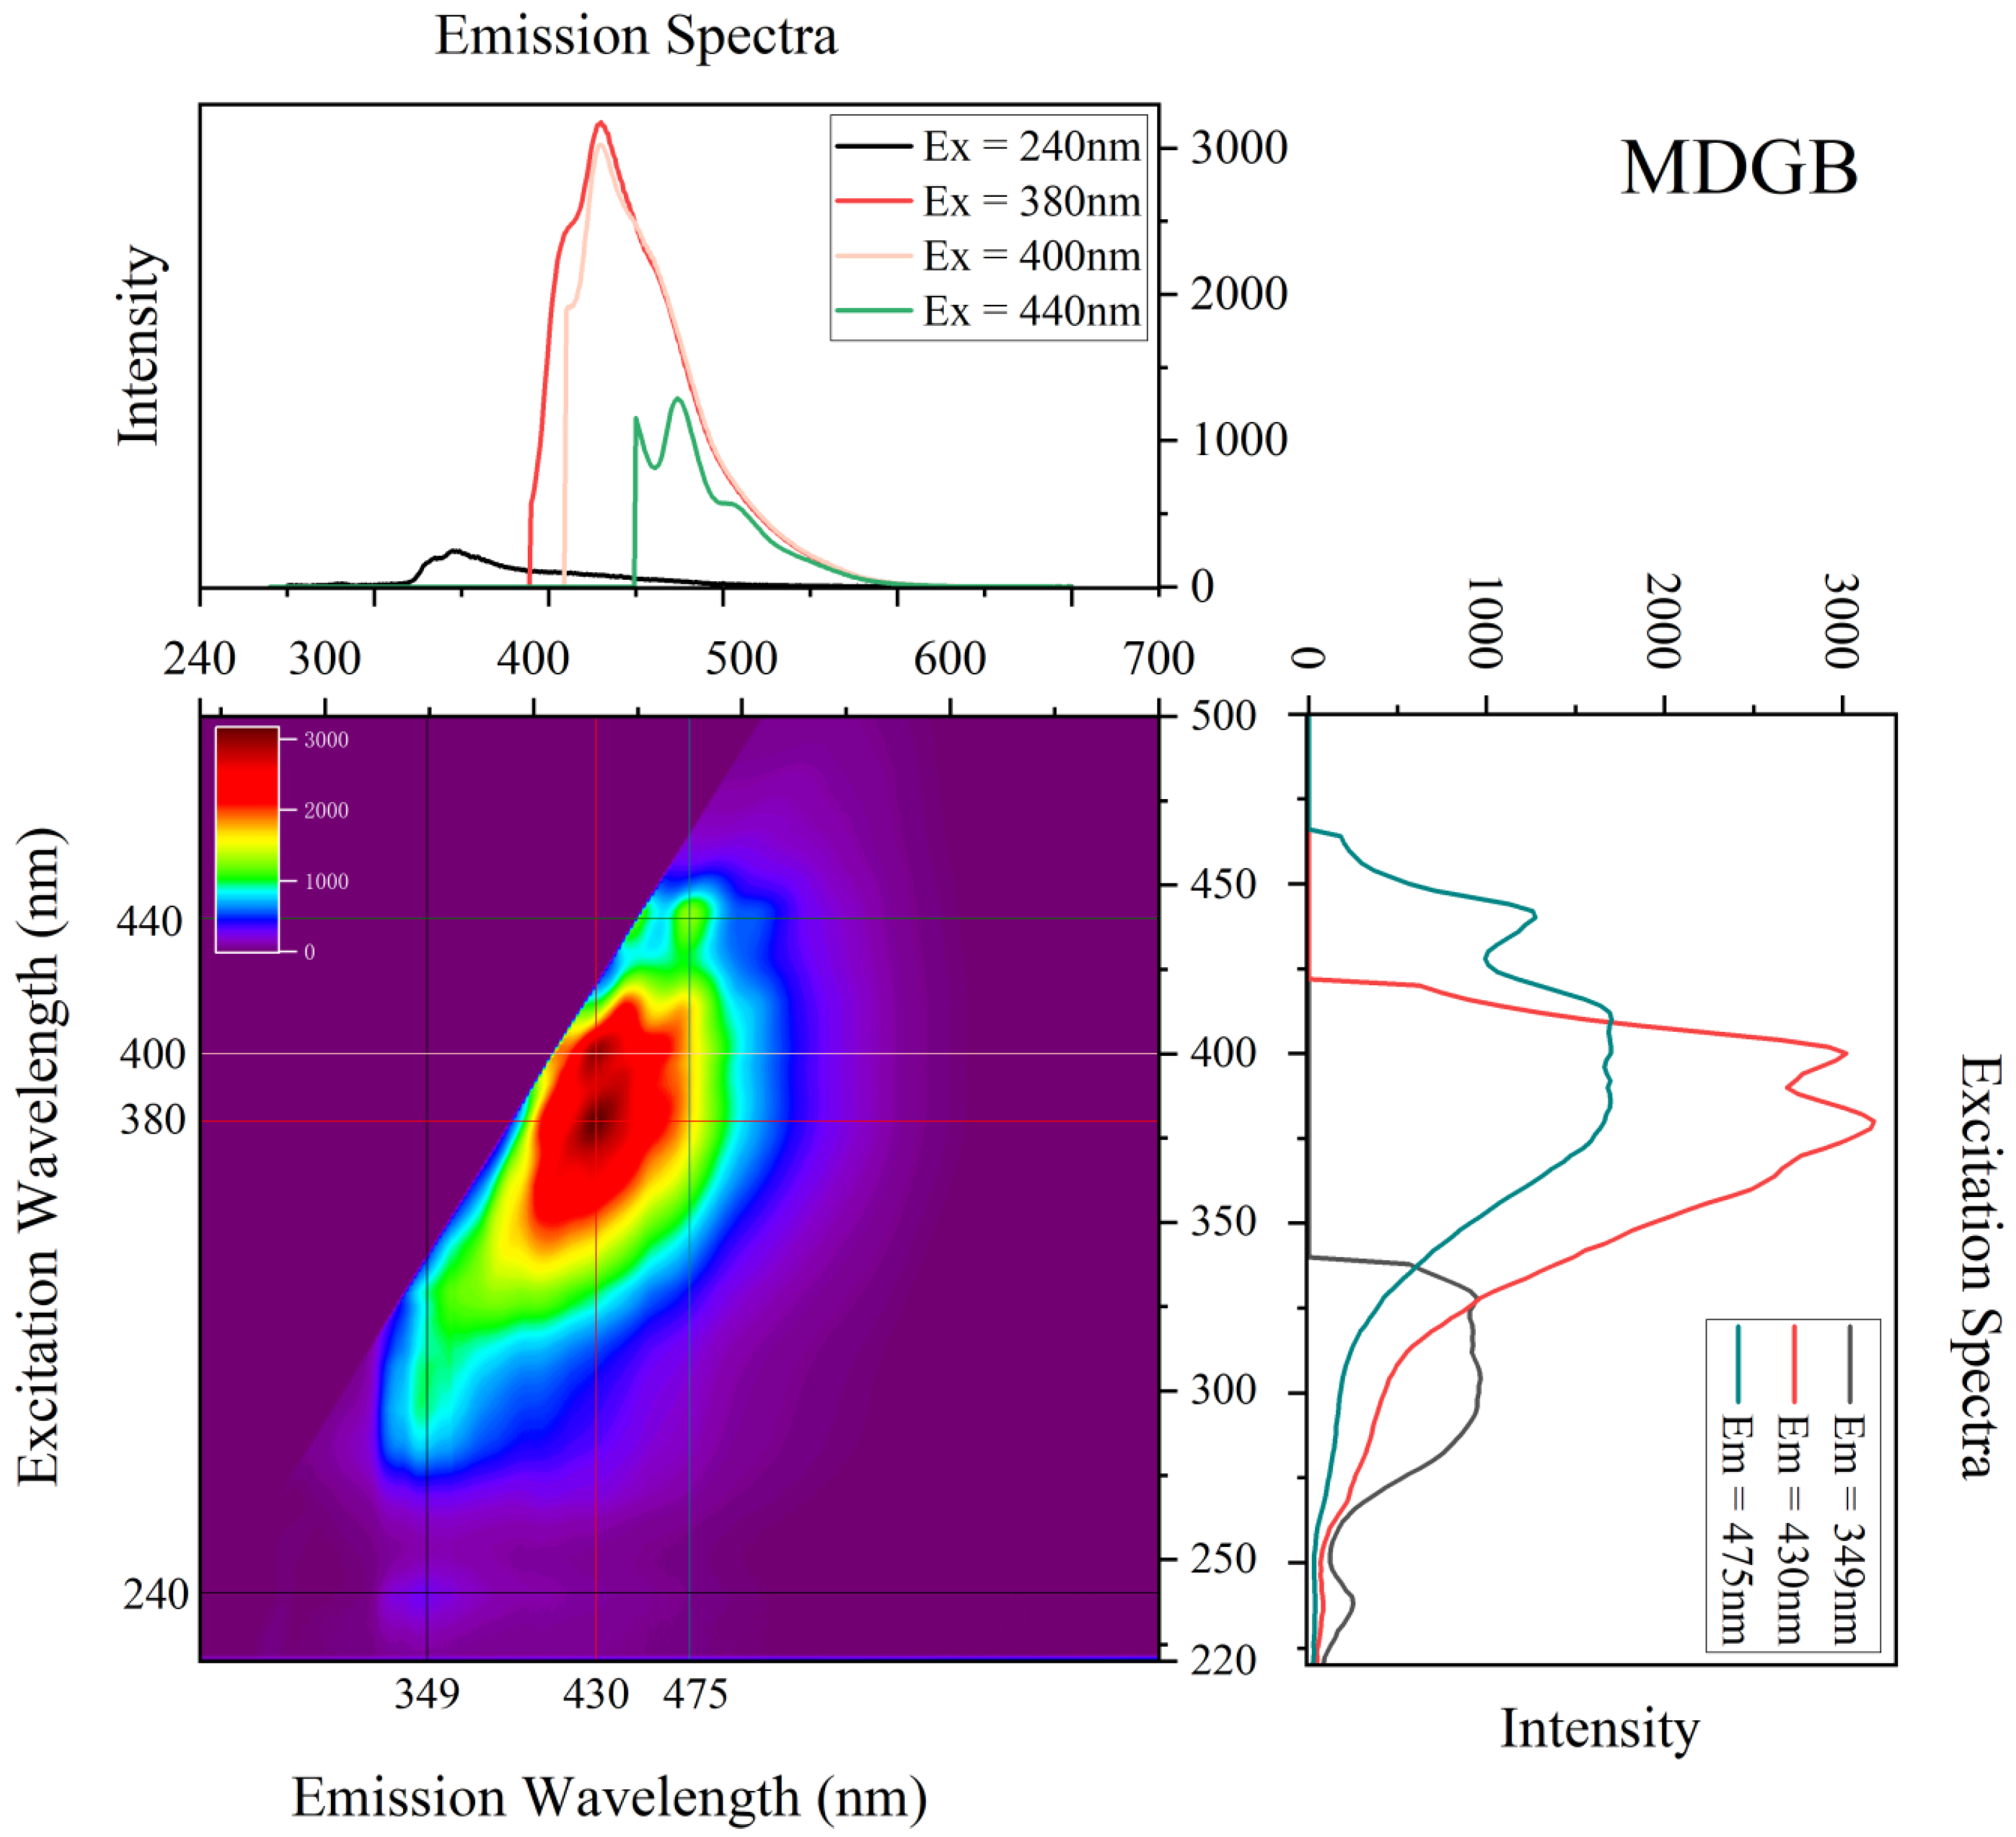
3.3.2. Golden-Blue Amber

The golden-blue amber revealed two strong fluorescence centers in the violet region. The 430 nm emission wavelength was optimally excited via the 380 and 400 nm excitation wavelength at the same time. A luminescence center was revealed in the blue region, and the 440 nm excitation wavelength was found to optimally excite the 475 nm emission wavelength. In the ultraviolet region, the 240 nm excitation wavelength was found to optimally excite the emission wavelength at 349 nm (Figure 8).

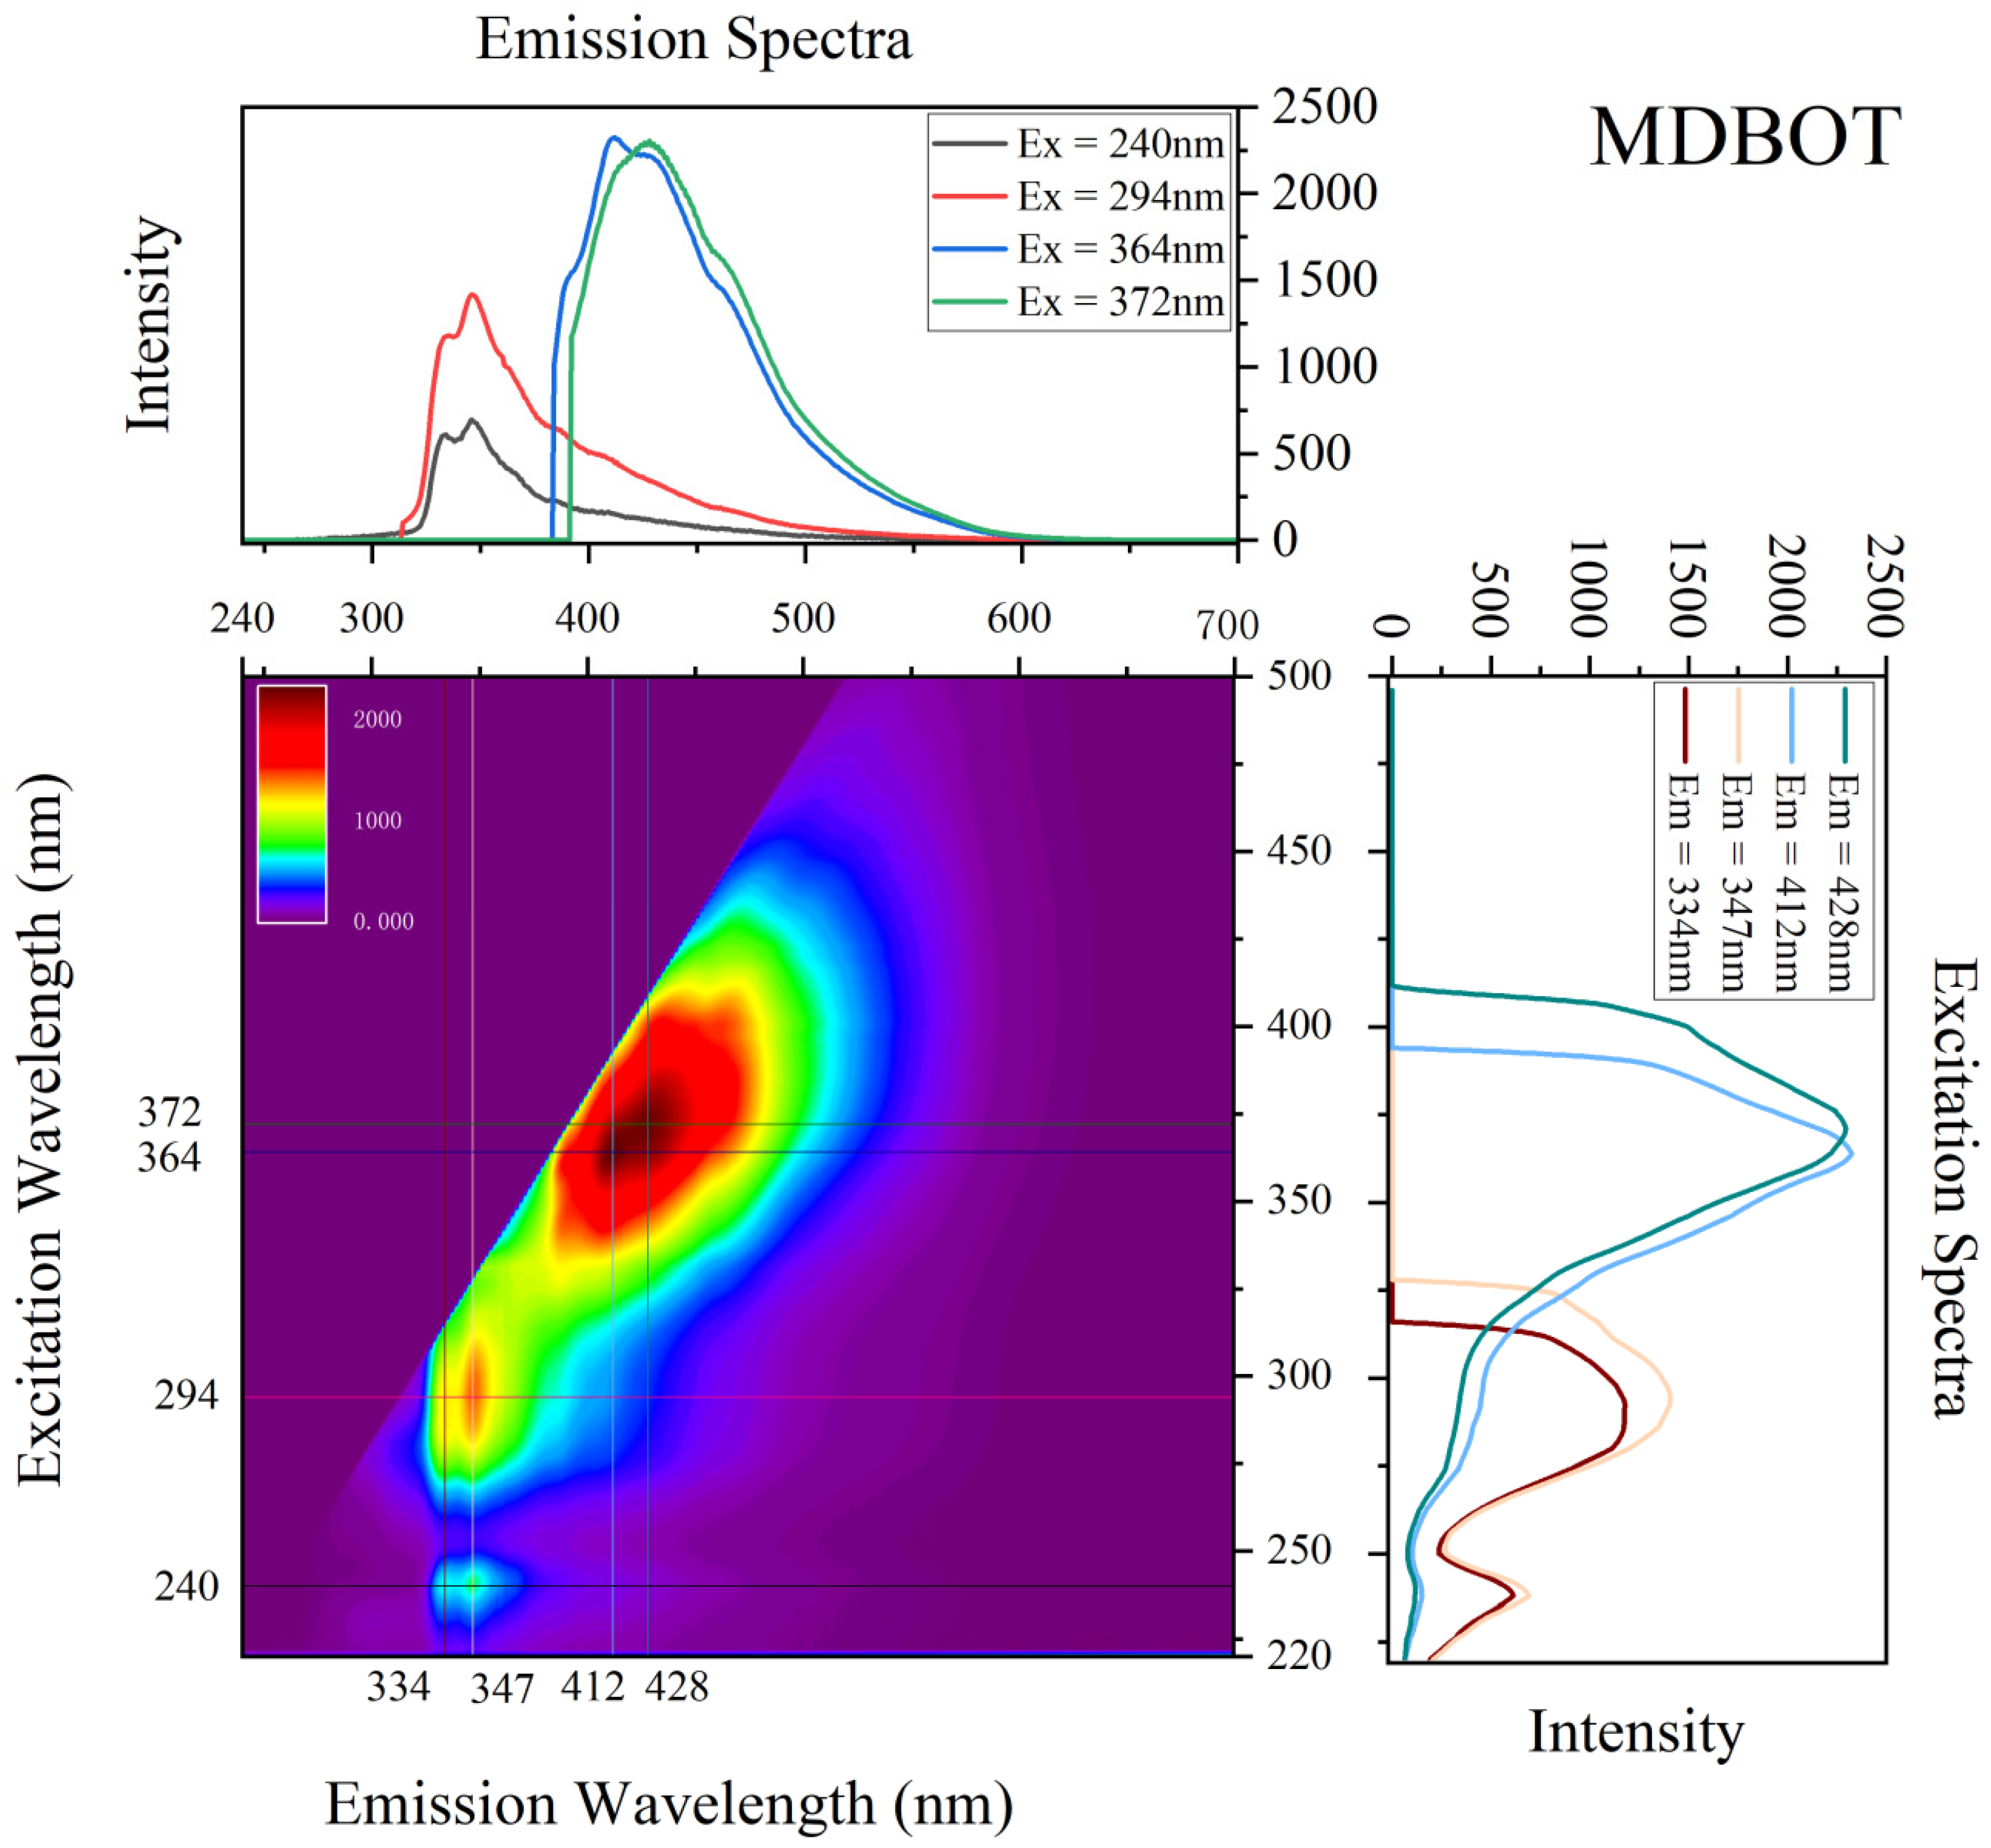
3.3.3. Blood-Tea Amber

The test results for the three pieces of blood-tea amber revealed good uniformity. The excitation wavelengths (364 and 372 nm) of the blood-tea amber in the violet region were found to correspond to the optimal emission centers of 412 and 428 nm, respectively. The excitation wavelength at 240 or 294 nm in the ultraviolet region may optimally excite the fluorescence emission peaks centered at 347 and 334 nm (Figure 9).

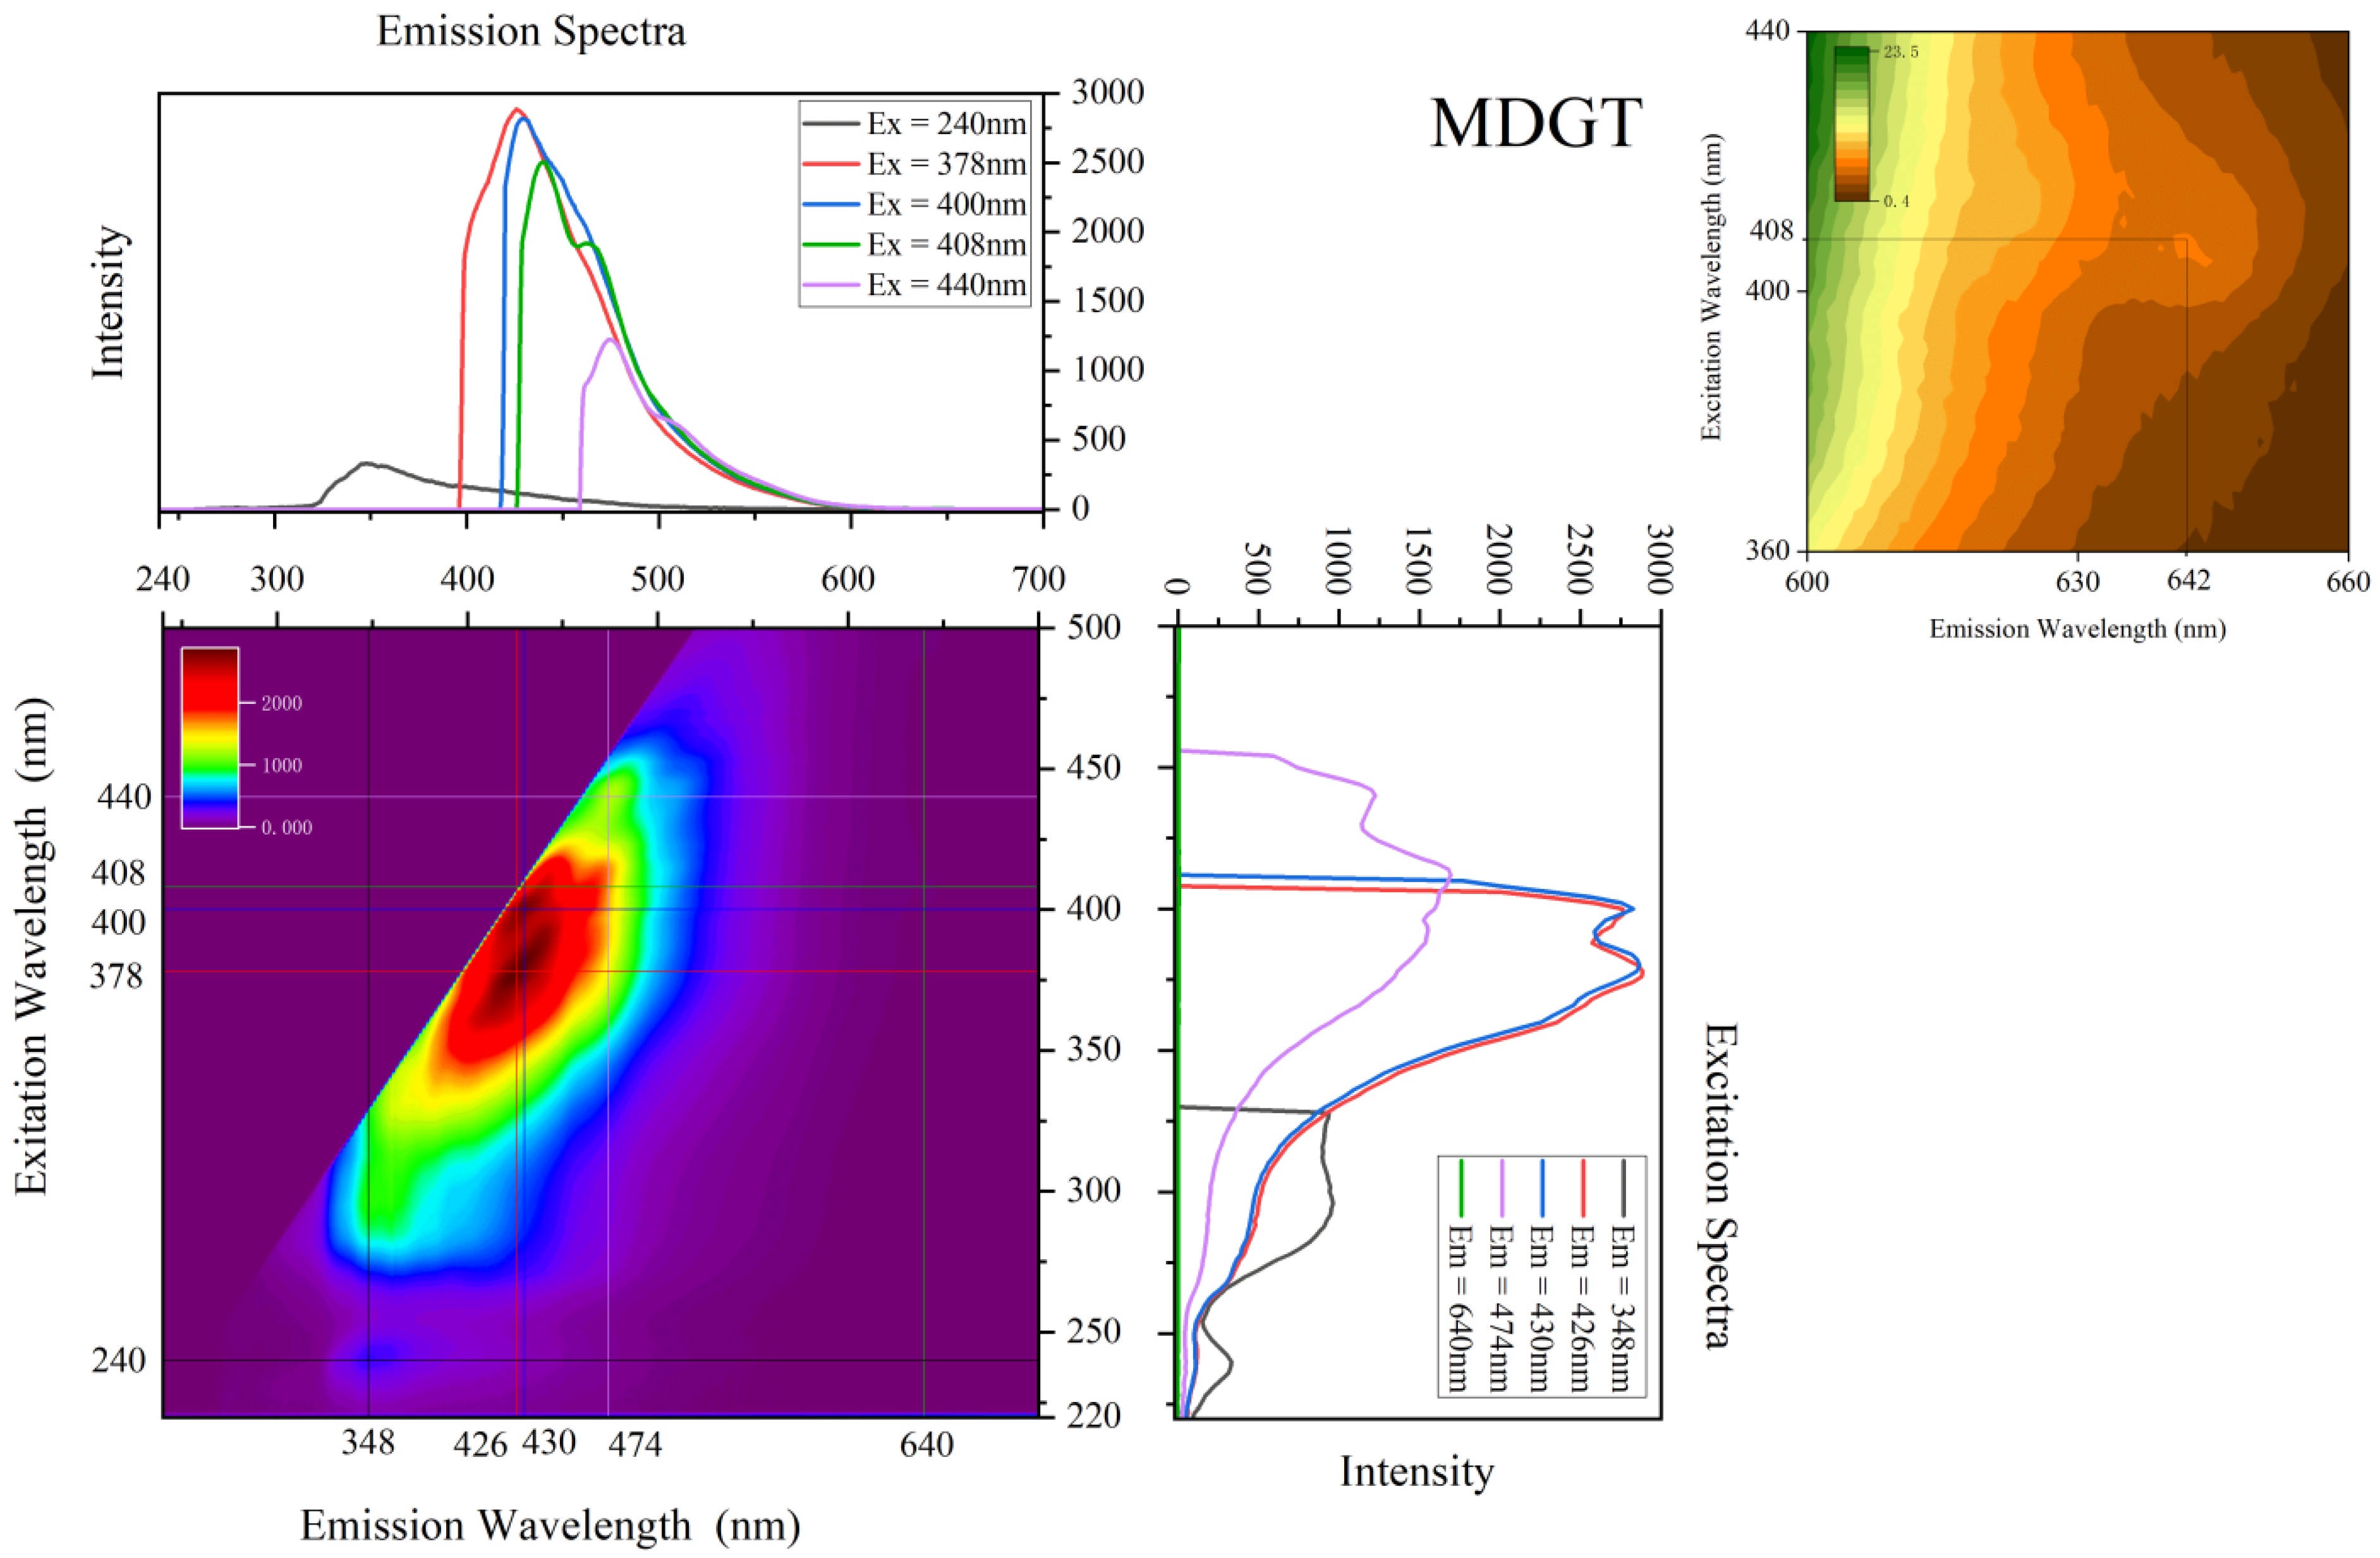
3.3.4. Green-Tea Amber

The green-tea amber samples were found to possess a faint fluorescence center in the red region. The 408 nm excitation wavelength excited the 642 nm emission wavelength. In the violet region, there were two strong luminescence centers. The 378 nm excitation wavelength optimally excited the 426 nm emission center, and the 400 nm excitation wavelength optimally excited the 430 nm emission wavelength. In the blue region, the 440 nm excitation wavelength excited the 474 nm emission wavelength, and the fluorescence intensity of this center is second only to the strongest one. Since the golden-blue amber was found to possess the same luminescence center in the blue region, it cannot be used as strong evidence to differentiate between green-tea and golden-blue amber. In the ultraviolet area, the 240 nm excitation wavelength was found to excite the 348 nm emission wavelength (Figure 10).

3.3.5. Black-Tea Amber

In the red region, the 400 nm excitation wavelength of the black-tea amber was found to optimally excite the 645 nm emission wavelength. The 410 nm excitation wavelength optimally excited the 624 nm emission wavelength. In the violet region, the 364 nm excitation wavelength was found to optimally excite the 412 nm emission wavelength. Additionally, the 372 nm excitation wavelength optimally excited the 432 nm emission wavelength. In the ultraviolet region, the 335 and 347 nm emission wavelengths were simultaneously excited by the 240 and 294 nm excitation wavelengths at the same time (Figure 11).

3.3.6. Brownish-Red Amber

In the red region, the 410 nm excitation wavelength of brownish-red amber was found to optimally excite the 623 nm emission wavelength, and the strength of this was extremely weak. There were three strong fluroescence centers in the blue-violet region. The 276, 386, 374, and 402 nm excitation wavelengths were all found to effectively excite the 440 nm emission wavelength. Moreover, the 276 nm excitation wavelength was found to optimally excite the 419 nm emission wavelength, the 374 nm excitation wavelength excited the 428 nm emission wavelength, and the 402 nm excitation wavelength excited the 440 nm emission wavelength. Relatively speaking, the brownish-red amber was found to possess more excitation centers under the emission wavelength conditions centered at 430 nm compared with the other amber species. In the ultraviolet region, the optimal excitation centers corresponding to the 347 nm emission wavelength were 238 and 294 nm. Further, the 328 nm excitation wavelength was found to optimally excite the 360 nm emission wavelength (Figure 12).

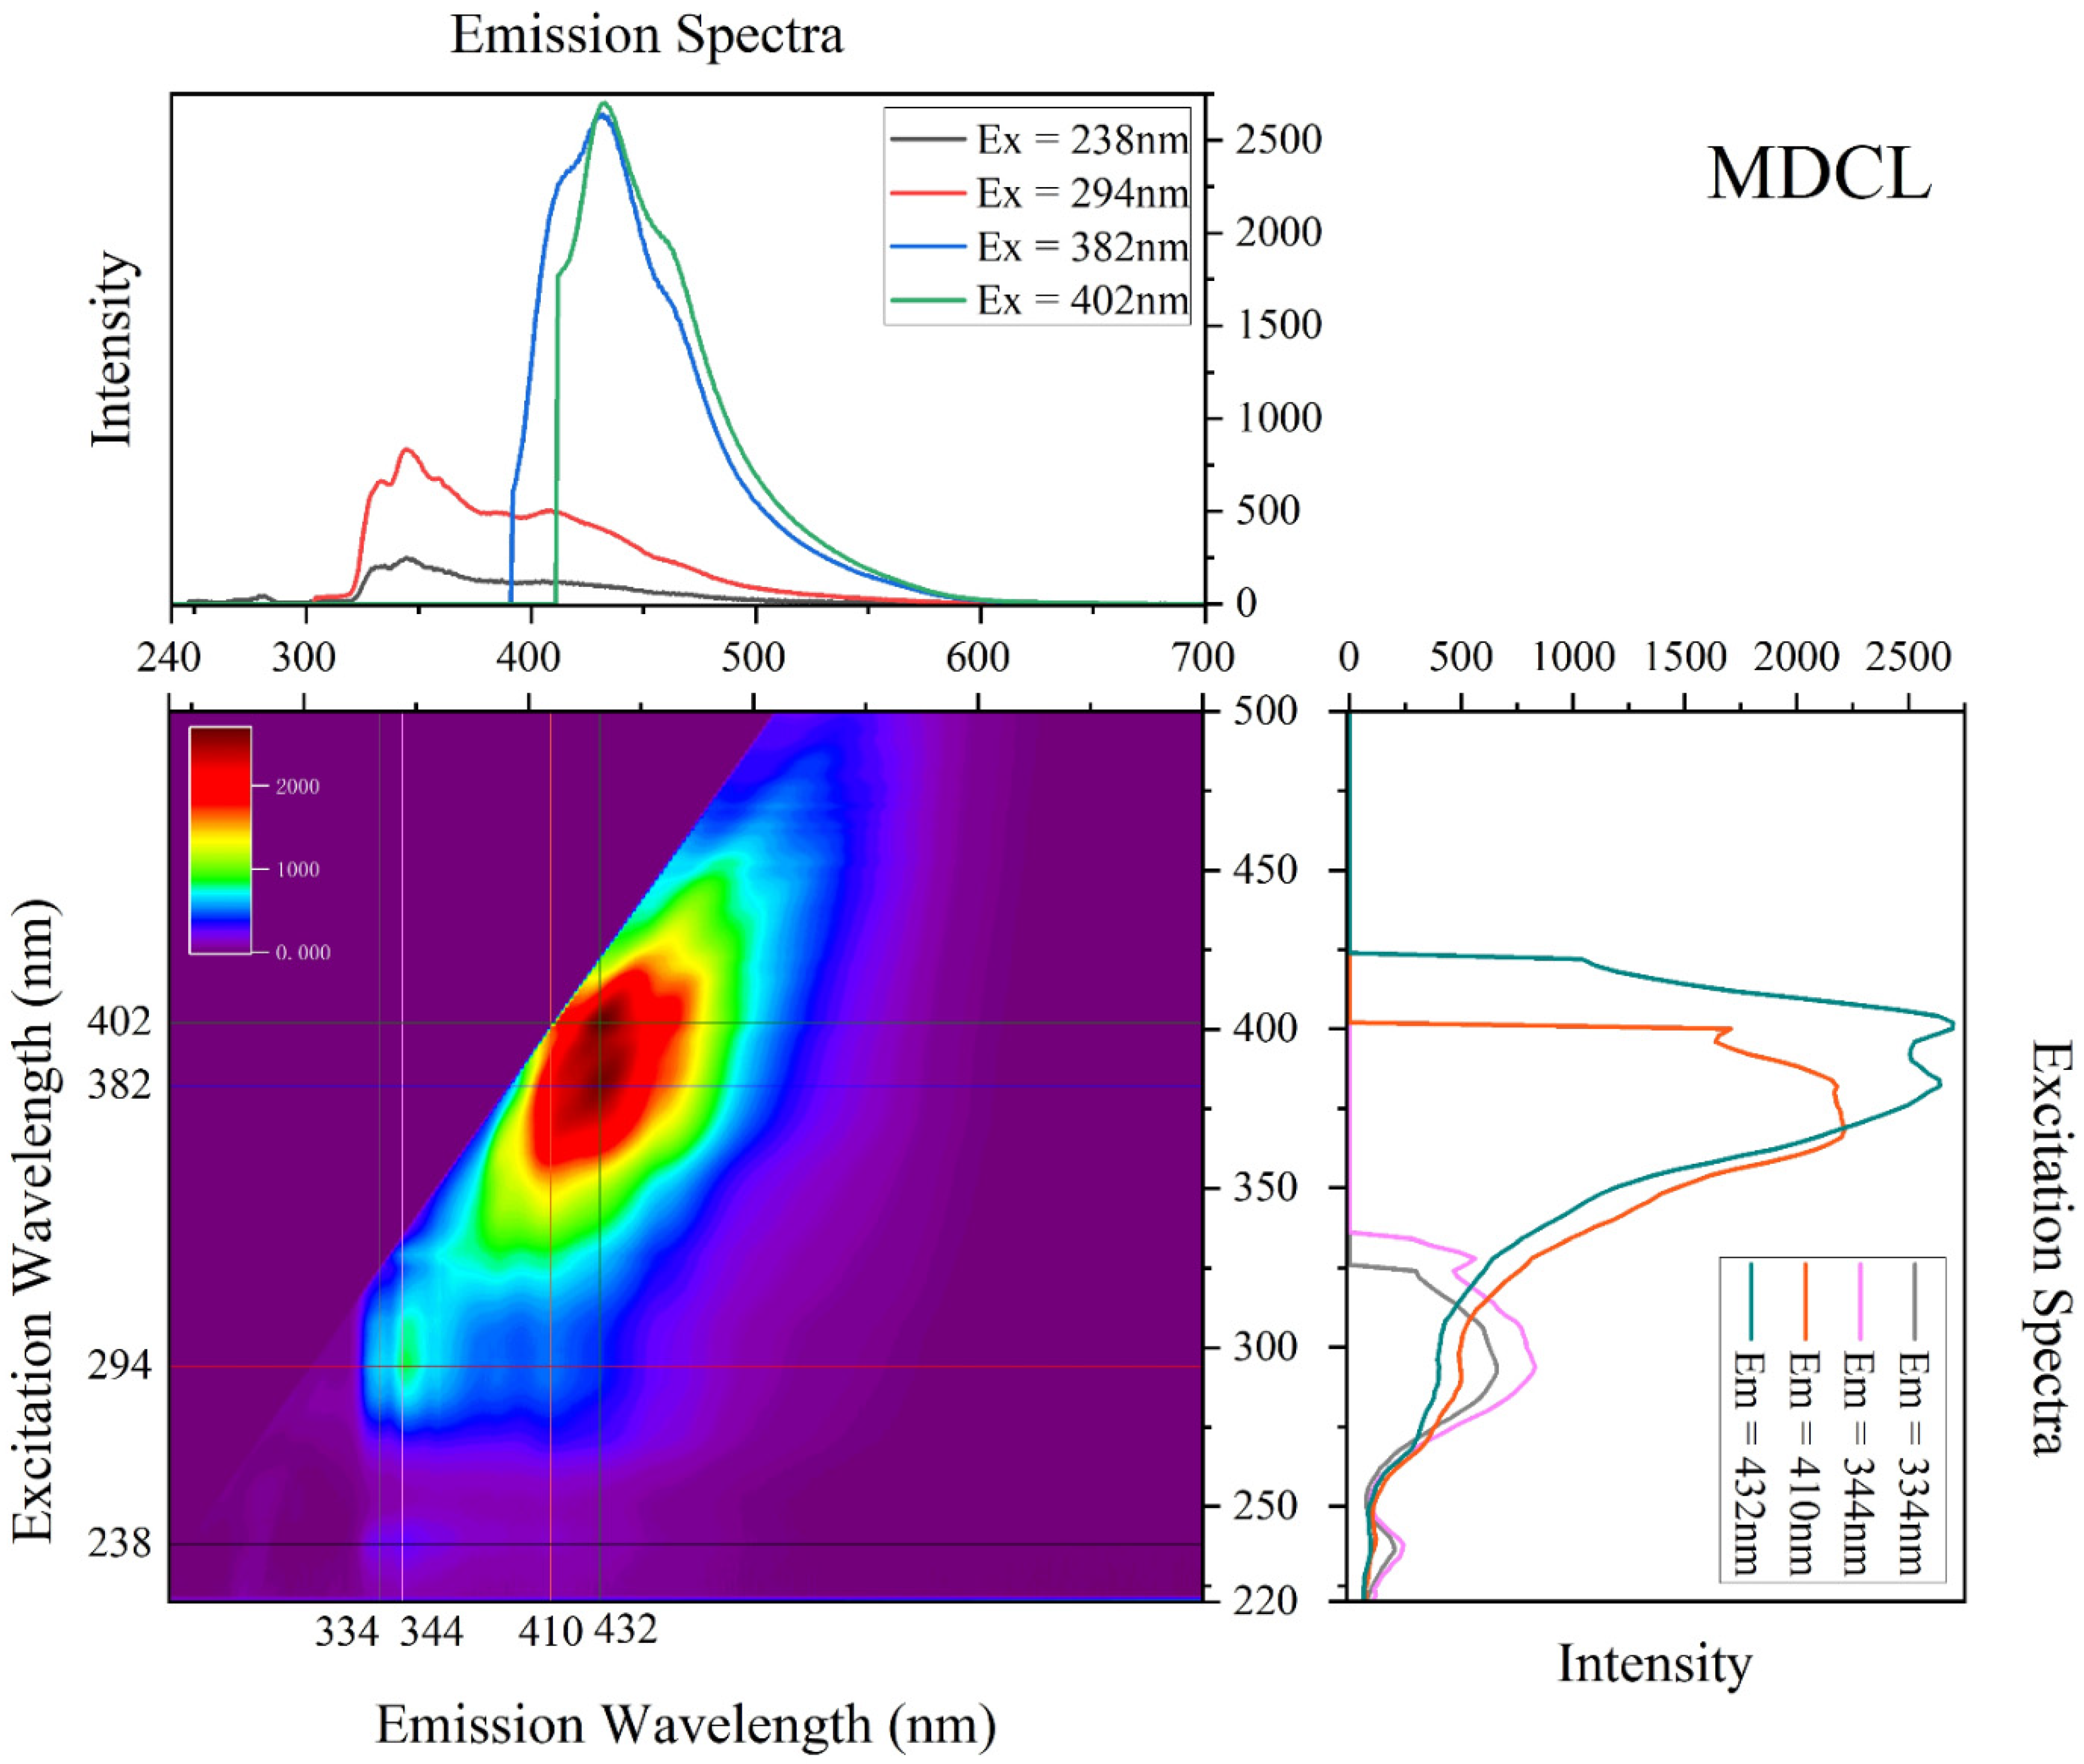
3.3.7. ‘Chameleon’ Amber

In the violet region, the 432 nm emission wavelength was optimally and simultaneously excited by the 382 and 402 nm emission wavelengths. In the ultraviolet region, the 238 and 294 nm excitation wavelength optimally excited the 334 and 344 nm emission wavelength. In addition to this, there was a 410 nm faint emission peak under the 294 nm excitation wavelength condition (Figure 13).
In relation to previous studies, the 3D fluorescence spectral characteristics of the different Burmese amber species were summarized as follows. In the ultraviolet region, the emission peak had strong regularity of luminescence centers. Generally speaking, 240 or 294 nm optimally excited the 334 or 347 nm emission wavelength. In the violet region, the major luminescence center of 380 ± 10 nm or 400 ± 10 nm excitation wavelength optimally excited the 430 nm emission wavelength, and the 364 nm excitation wavelength optimally excited the 412 nm emission wavelength. The above-mentioned luminescence characteristics enable identification of the places of origin of the amber under study [10]. Brownish-red ambers have three luminescent centers in the violet region, while the rest only have two centers. In the blue region, it can be said that the 440 nm wavelength optimally excites the 475 nm emission wavelength; this is because green-tea amber and golden-blue amber may possess the luminescence center. This, however, does not provide a reference point to distinguish between green-tea and golden-blue amber.
In the red-region, only the black-tea, green-tea, and brownish-red amber possessed the luminescence phenomenon; however, they possessed different luminescence characteristics. Such differences can provide references to distinguish between green-tea amber, black-tea amber, and brownish-red amber. Black-tea amber was found to have two luminescence centers. The optimal excitation and emission wavelengths were determined as 400 nm and 645 nm, as well as 410 nm and 624 nm, respectively. The green-tea amber and brownish-red amber possessed one center. For the former, the 408 nm excitation wavelength was found to optimally excite the 642 nm emission wavelength. For the latter, the 410 nm excitation wavelength optimally excited the 623 nm emission wavelength. Based on a comparison of the black-tea, green-tea, and brownish-red amber, the black-tea amber possessed a more obvious luminescence center. 3D fluorescence spectrometry can provide detailed spectral information and it might be useful for help finding the substance which caused the fluorescence phenomenon [23]. However, limitations remain (i.e., there is a high cost associated with the time it takes for testing and there is relatively low resolution in some intervals). The fluorescence characteristics of all samples are summarized in Table 3.

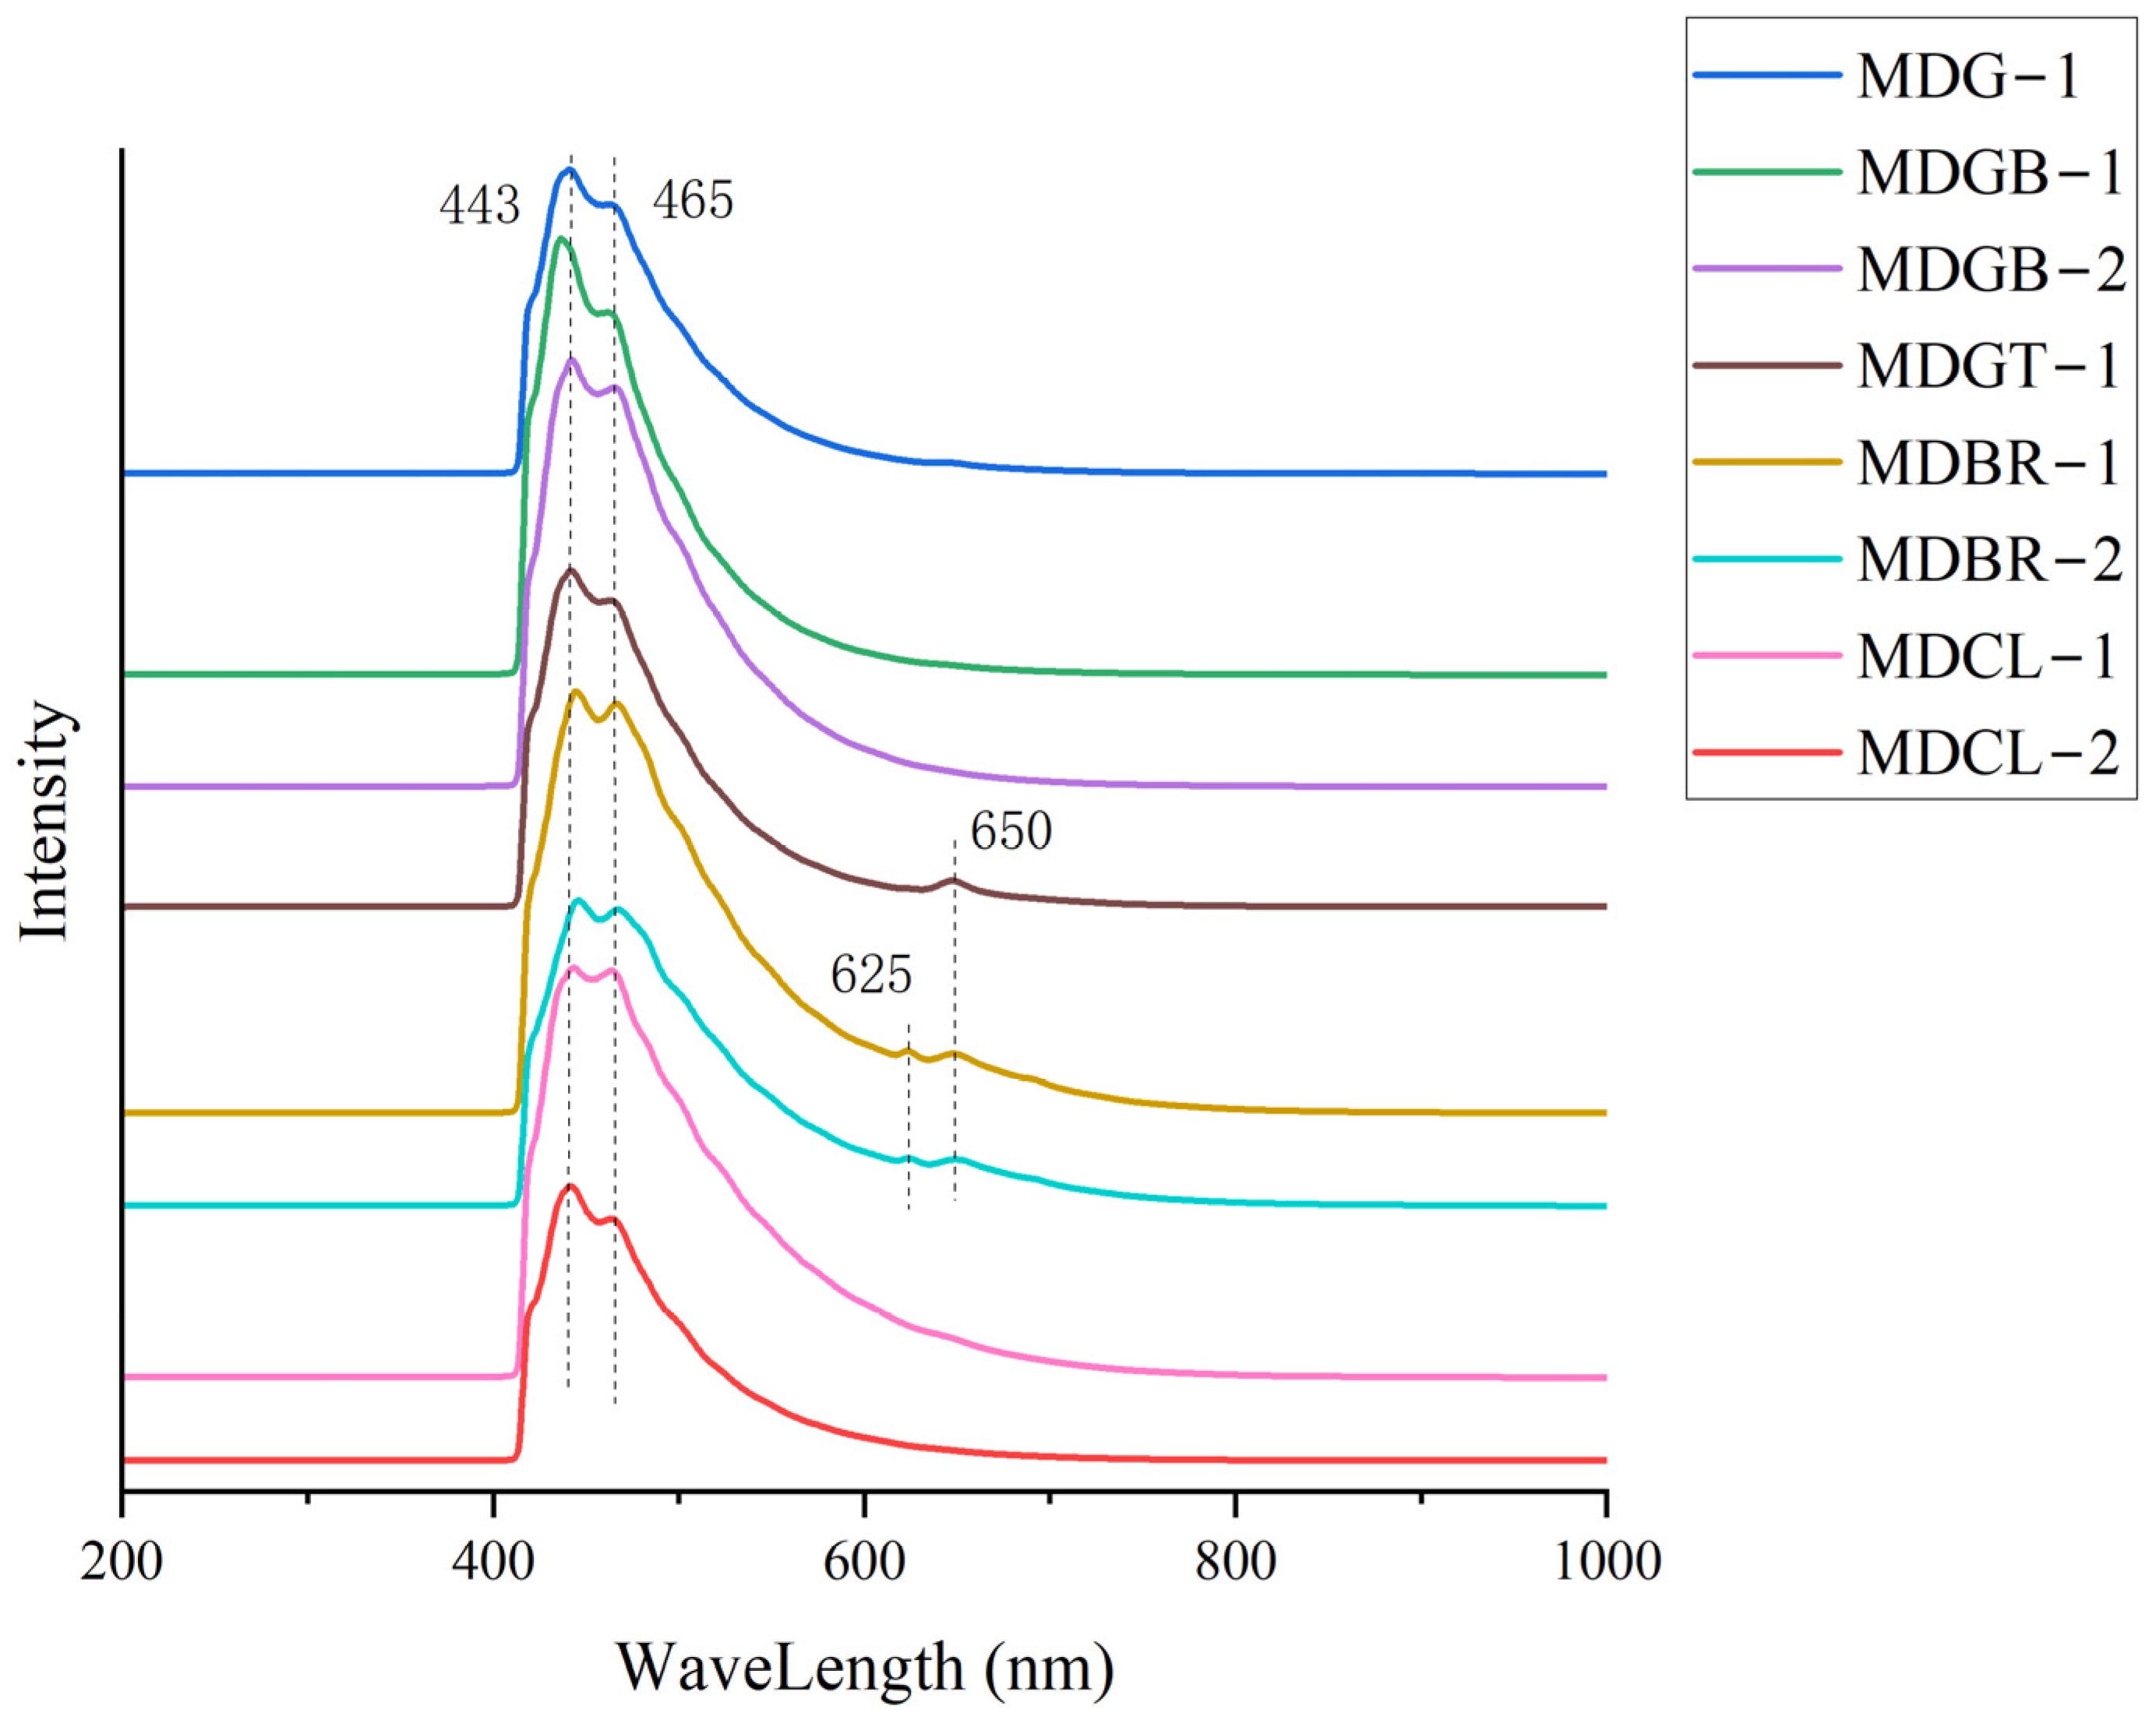
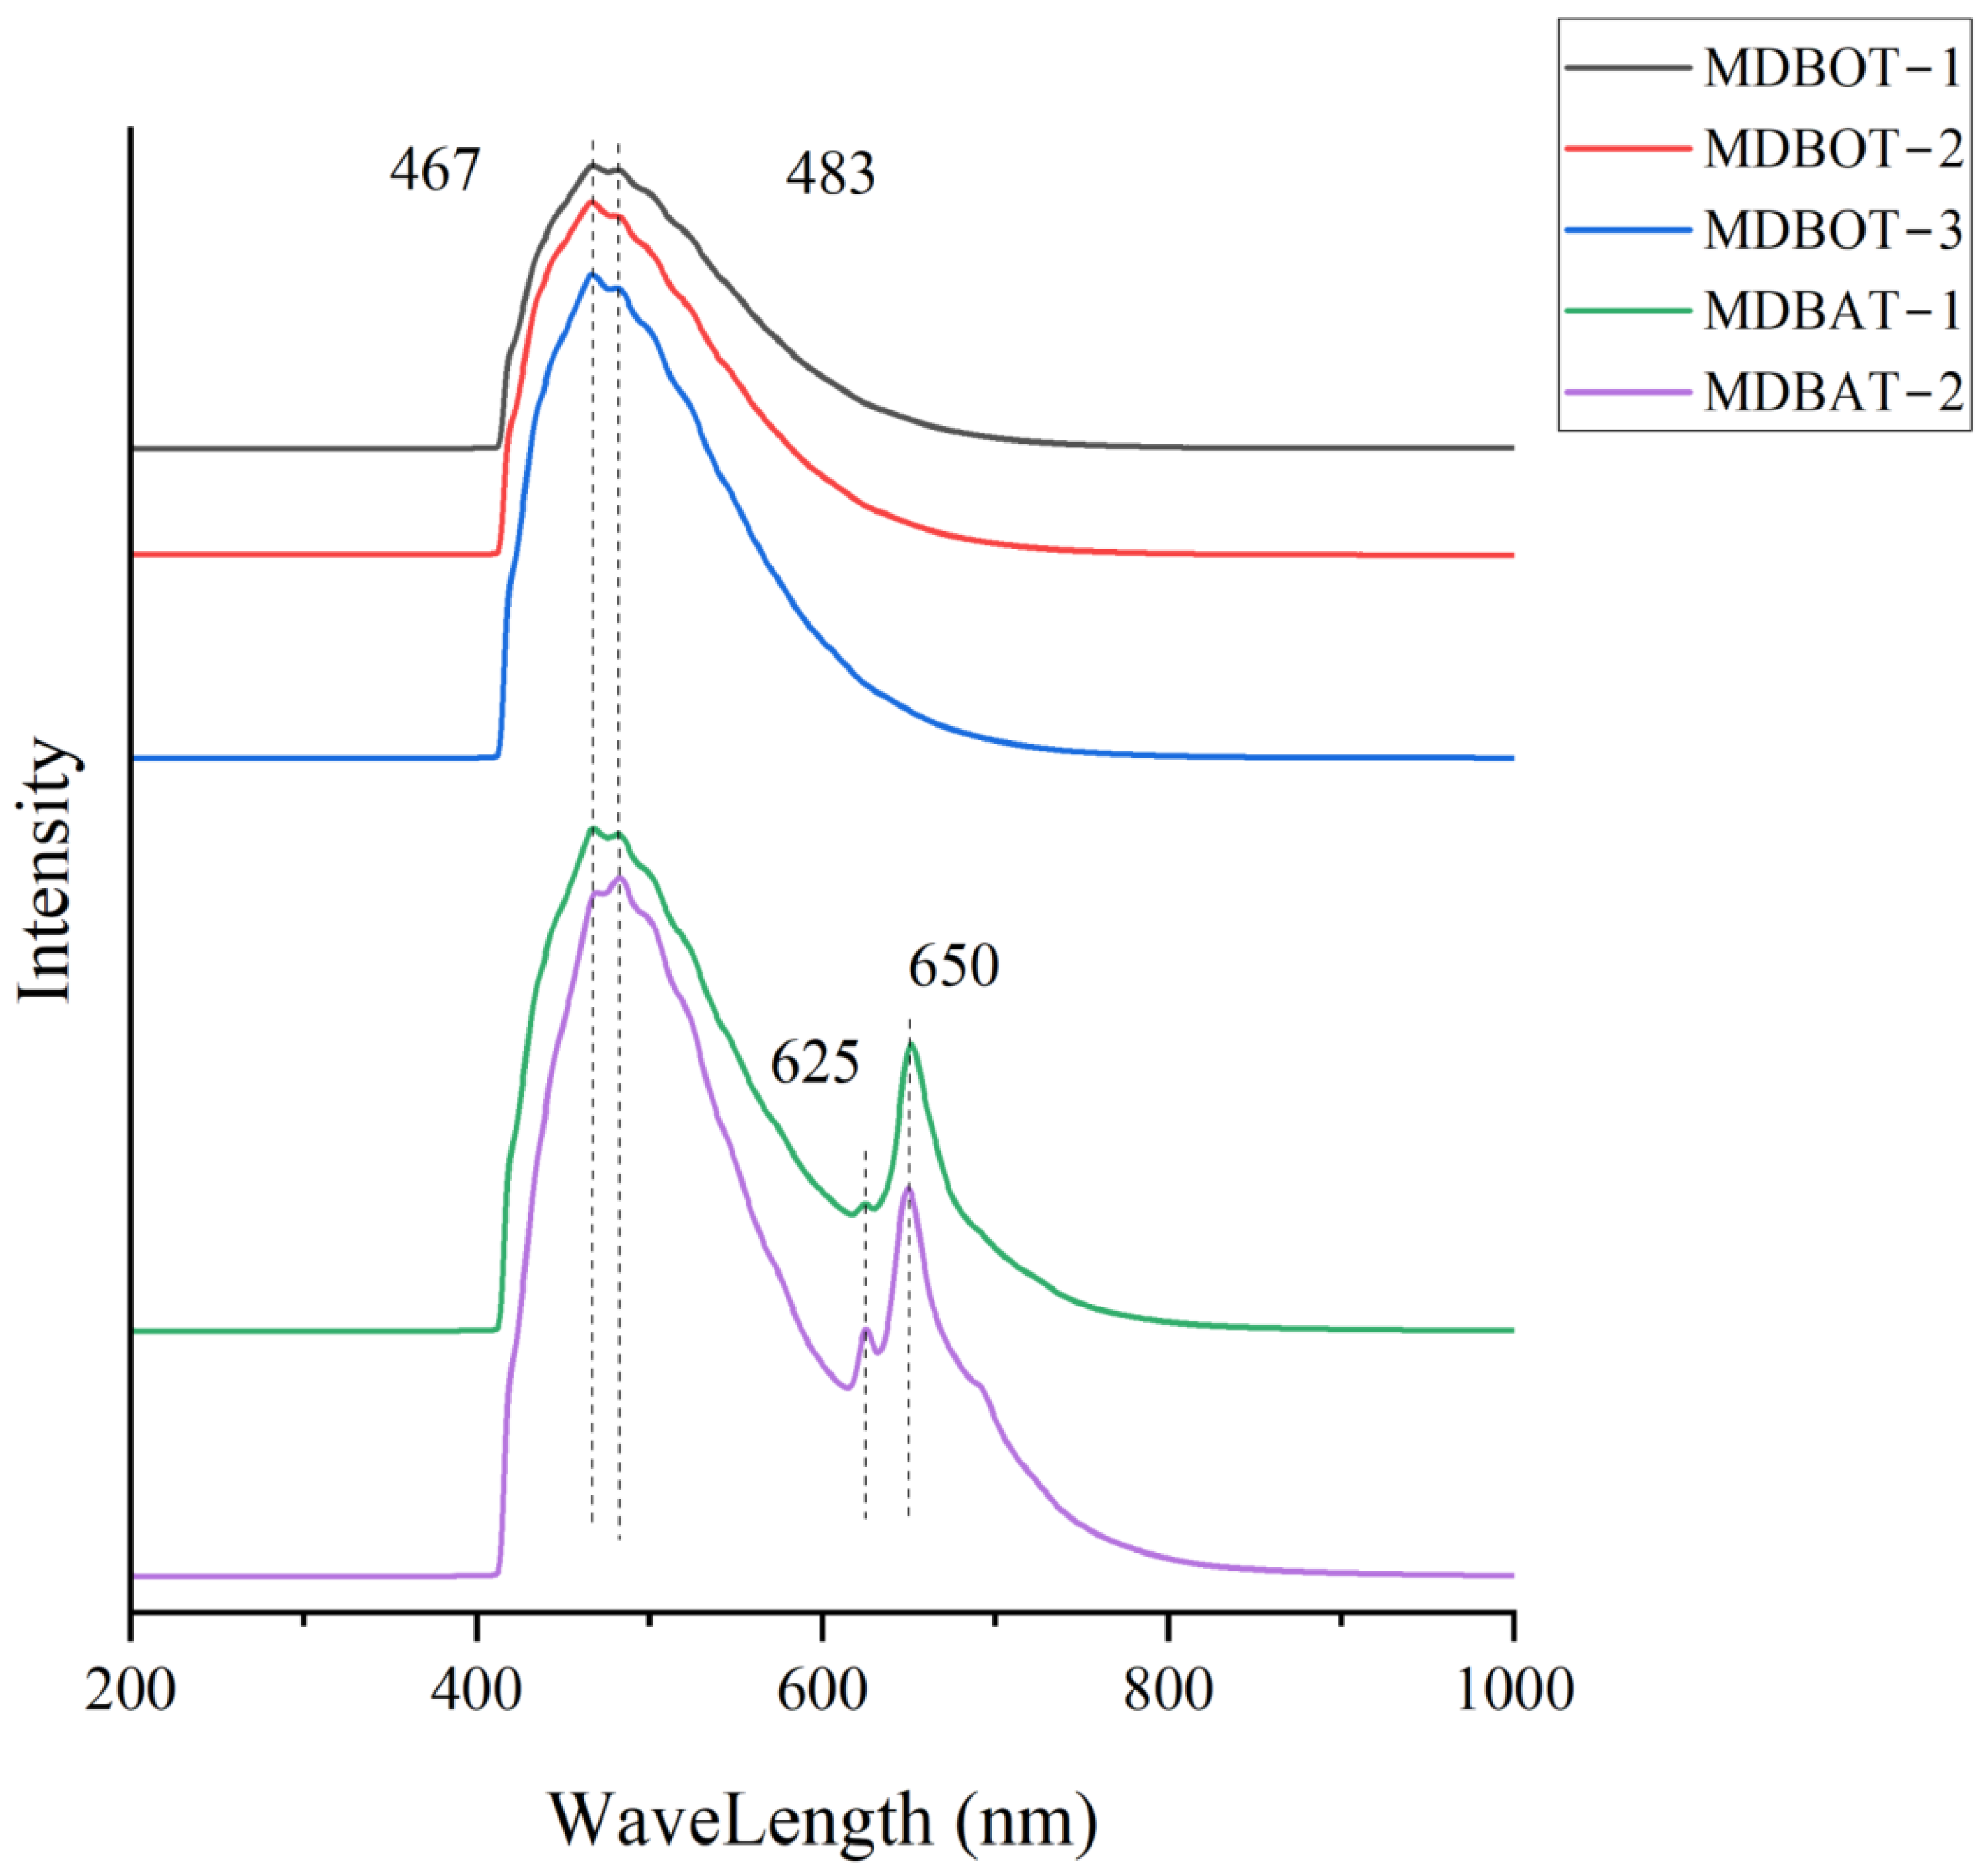
3.4. Photoluminescence Spectral Characteristics

The luminescence spectra of Burmese amber usually have 2–4 luminescence centers [15,24,25], and they were recorded at 443, 467, and 483 nm in the blue-violet region and near 625 and 650 nm in the red region. The photoluminescence centers of all samples are summarized in Table 4.
It was found that ‘chameleon’ amber, golden amber, golden-blue amber, brownish-red amber, and green-tea amber possessed two luminescence centers near 443 and 465 nm in the blue-violet region. The left peak of MDGB-1 possessed a luminescence center at 437 nm, and this moved toward the blue-violet region. The brownish-red amber had two extremely faint luminescence peaks at 625 and 650 nm in the red region. The green-tea amber had an extremely faint luminescence center at 650 nm in the red region (Figure 14).
The luminescence centers of the blood-tea and black-tea amber in the blue-violet region were found to be near 467 and 483 nm (Figure 15). Moreover, the black-tea amber had luminescence centers at 625 and 650 nm in the red-light area. The right peak (650 nm) was far higher than the left peak (625 nm).
The current study revealed that the luminescence characteristics in the blue-violet region can be used to distinguish black-tea amber from brownish-red amber, golden amber, golden-blue amber, green-tea amber, and ‘chameleon’ amber. The luminescence characteristics in the red region could be used to distinguish black-tea amber from blood-tea amber and green-tea amber in this situation, where both are similar in appearance to black-tea amber on the white background and are difficult to distinguish. The use of this method can help to address the disorder phenomena in the market dictating that ordinary amber species have been purchased as black-tea amber. Besides, it was found that tea amber and brownish-red amber possessed luminescence centers in the red region. However, green-tea amber only possessed one luminescence center (650 nm), while black-tea amber and brownish-red amber possessed two (625 and 650 nm). Moreover, the luminescence peak intensity of the black-tea amber at 650 nm was far higher than those of green-tea amber and brownish-red amber. It can be said that this is related to the pink fluorescence of the surface of the tea amber. Furthermore, the pink fluorescence of the black-tea amber was found to be more obvious than that of the green-tea amber. Compared with the use of the 3D fluorescence spectra, testing using the photoluminescence spectra effectively differentiated black-tea amber from other amber species (e.g., blood-tea and green-tea amber).
In terms of amber that possesses special fluorescence phenomena, it is thought that this may be related to its internal chemical components, particularly its aromatic substances. Since aromatic substances have a relatively strong conjugated structure, they can satisfy π→π* transition, which has given the amber its rich fluorescence and phosphorescence effect. The 3D fluorescence spectra and photoluminescence spectra reflect differences in luminescence features in the red region. In relation to previous studies, it has been thought that amber may contain several fluorescent substances. Except for the different substances in the amber species, the content of the substance may represent one of the most important reasons for the fluorescence phenomena [13]. Determining the chemical components in amber that may cause red fluorescence represents an area for future research.

4. Conclusions

Amber from Burma was generally transparent ~ semi-transparent, with a relative density that ranged from 1.027~1.070. On the black background under exposure to strong light, a pink fluorescence on the tea amber surface, the ‘green membrane’ phenomenon on the ‘chameleon’ surface, and a blue fluorescence on the golden-blue amber develop. It was found that the ultraviolet fluorescence of tea amber gives off a near pink color under a long- and short-wave UV lamp, and the ‘chameleon’ surface presented white and dark fluorescence. The other amber species revealed different degrees of blue-violet fluorescence. An anomalous extinction was developed under the nicol.
Seven kinds of special Burmese amber were analyzed. The FITR spectra provided sufficient evidence—three groups of peaks: (i) 1225, 1153, 1136, and 1092 cm−1; (ii) 1029 and 974 cm−1; and (iii) 851 and 812 cm−1—to distinguish Burmese amber from other areas of origin. This work can help trace the area of origin of amber worldwide. It was also important to point out that the intensity of ‘Chameleon’ amber was lower than that of other species, and the different patterns in the third group reflected that the internal aromatic hydrocarbon compound structures in ‘Chameleon’ are significantly different from those in other varieties of amber. 3D fluorescence spectra revealed the luminous characteristics of amber. Fluorescence behavior of all seven species presented similar regularity in the ultraviolet region and violet region. Thus, it helps to identify whether the amber came from Myanmar. The illumination centers in the red region were observed in green-tea amber, black-tea amber, and brownish-red amber. Furthermore, the positions of these illumination centers were different, which can be used to distinguish them. The slight pink color fluorescence was also observed on the surface of green-tea amber and black-tea amber, and it was identified in 3D fluorescence spectra. It is worth emphasizing that this feature was also reflected on the PL spectrum effectively; peaks at 625 and 650 nm were both found in black-tea amber and a 650 nm peak was found in green tea amber. Based on the results of the PL spectrum (differences between special species and ordinary species), we discovered that the PL spectra test can offer an effective method to distinguish black-tea amber from green-tea amber and some other ordinary species (e.g., blood-tea amber). The difference of pink color fluorescence on the surface of tea amber was speculated as being caused by the different fluorescent substances and their content. Gemological tests and spectroscopic tests are helpful for area origin tracing and variety differentiation. In particular, the high efficiency of PL improves the detection efficiency of gemstones. This will provide inspiration and ideas for future gemstone detection and scientific research.

Author Contributions

Conceptualization, Y.W. and Z.S.; methodology, Z.S.; formal analysis, Z.S. and C.X.; investigation, Z.S.; resources, Y.W.; data curation, Z.S. and Y.W.; writing—original draft preparation, Z.S.; writing—review and editing, Z.S., C.X. and Y.W.; visualization, Z.S. and C.X.; supervision, Y.W.; funding acquisition, Y.W. All authors have read and agreed to the published version of the manuscript.

Funding

Philosophy and Social Science Research Project in Department of Education of Hubei Province (No.21G007); Fundamental Research Funds for National University, China University of Geosciences (Wuhan) (No.CUGDCJJ202221); Hubei Gem & Jewelry Engineering Technology Center (No.CIGTXM-02-202001;No.CIGTXM-03-202104).

Data Availability Statement

The data used to support the findings of this study are available from the first author upon request.

Acknowledgments

The authors would like to thank the staff members from the large instrument Laboratory at the Gemological Institute China University of Geosciences (Wuhan).

Conflicts of Interest

The authors declare no conflict of interest.

References

  1. Poinar, G. Burmese amber: Evidence of Gondwanan origin and Cretaceous dispersion. Hist. Biol. 2019, 31, 1304–1409. [Google Scholar] [CrossRef]
  2. Zong, P.; Xue, J.Z.; Tang, B. Tracing the most ancient amber: The origin and envolution of resin-producing plants. Acta Petrol. Mineral. 2014, 33, 111–116. [Google Scholar]
  3. Shi, G.; Grimauldi, D.A.; Harlow, G.E.; Jing, W.; Wang, J.; Yang, M.; Lei, W.; Li, Q.; Li, X. Age constraints on Burmese Amber based on U–Pb of zircons. Cretaceous Res. 2012, 37, 155–165. [Google Scholar] [CrossRef]
  4. Perkovsky, E.E.; Olmi, M.; Muller, P.; Guglielmino, A.; Jarzembowski, E.A.; Capradossi, L.; Rasnitsyn, A.P. A review of the fossil Embolemidae (Hymenoptera: Chrysidoidea), with description of seven new species and history of the family. Cretaceous Res. 2020, 121, 104708. [Google Scholar] [CrossRef]
  5. Simoneit, B.R.; Oros, D.R.; Karwowski, Ł.; Szendera, Ł.; Smolarek-Lach, J.; Goryl, M.; Bucha, M.; Rybicki, M.; Marynowski, L. Terpenoid biomarkers of ambers from Miocene tropical paleoenvironments in Borneo and of their potential extant plant sources. Int. J. Coal Geol. 2020, 221, 103430. [Google Scholar] [CrossRef]
  6. Wang, Y.; Jiang, W.; Qiao, F.; Hong, L.; Youping, Z.; Jing, L.; Qingtao, W.; Guoying, S. Identification of 15- nor -cleroda-3,12-diene in a Dominican amber. Org. Geochem. 2017, 113, 90–96. [Google Scholar] [CrossRef]
  7. Sonibare, O.O.; Huang, R.J.; Jacob, D.E.; Nie, Y.Y.; Kleine-Bene, E.; Hoffmann, T.; Foley, S.F. Terpenoid composition and chemotaxonomic aspects of Miocene amber from the Koroglu Mountains, Turkey. J. Anal. Appl. Pyrolysis 2014, 105, 100–107. [Google Scholar] [CrossRef]
  8. Shuai, C.C.; Yin, Z.W.; Xue, Q.F.; Wan, S.L.; Wu, X.B. The Spectrum Characteristic Research of Color Change Effect and “Light Tarry Effect” Amber from Burma. Spectrosc. Spectr. Anal. 2020, 40, 1174–1178. [Google Scholar]
  9. Li, X.P.; Li, Y.; Wang, Y.M.; Xiong, W.; Xin, C.X. Individualized Inlay Design of Abnormal Amber Based on 3D ScanningTechnique. J. Gems Gemmol. 2020, 22, 37–46. [Google Scholar]
  10. Zhang, Z.Q.; Jiang, X.R.; Wang, Y.M.; Shen, X.T.; Kong, F.L. Fluorescense Spectral Characteristic of Amber from Baltic Sea Region, Dominician Republic, Mexico Myanmar and Fushun, China. J. Gems Gemmol. 2020, 22, 1–11. [Google Scholar]
  11. Jiang, X.R.; Zhang, Z.Q.; Wang, Y.M.; Kong, F.L. Special Optical Effect of Amber from Myanmer. J. Gems Gemmol. 2019, 21, 1–17. [Google Scholar]
  12. Jiang, W.Q.; Nie, S.F.; Wang, Y.M. Fluorescence Spectral Characteristic of Blue Amber from Dominician Republic, Mexico and Myanmar. J. Gems Gemmol. 2017, 19, 1–8. [Google Scholar]
  13. Matuszewska, A.; Czaja, M. Aromatic compounds in molecular phase of Baltic amber-synchronous luminescence analysis. Talanta 2002, 56, 1049–1059. [Google Scholar] [CrossRef] [PubMed]
  14. Xing, Y.Y.; Qi, L.J.; Mai, Y.C.; Xie, M.H. FTIR and 13C NMR Spectrum Characterization and Significance of Amber from Different Origins. J. Gems Gemmol. 2015, 17, 8–16. [Google Scholar]
  15. Zhao, T.; Wang, Y.M.; Liu, L.; Li, Y. Gemological and Spectral Characteristics of Mexican Red Blue Amber. Spectrosc. Spectr. Anal. 2021, 41, 2618–2625. [Google Scholar]
  16. Wang, Y.; Shi, G.H.; Shi, W.; Wu, R.H. Infrared Spectral Characteristics of Ambers from Three Main Sources. Spectrosc. Spectr. Anal. 2015, 35, 2164–2169. [Google Scholar]
  17. Bai, Y.; Zheng, X.H.; Yin, Z.W. Characterization of Burmese Amber with Three-Dimensional Fluorescence. Spectrosc. Spectr. Anal. 2020, 40, 1473–1477. [Google Scholar]
  18. Wang, Y.M. Amber Gemology; China University of Geosciences Press: Wuhan, China, 2019; pp. 147–149. [Google Scholar]
  19. Xie, X.; Di, J.R.; Wu, X.B. Type of Amber from Myanmar and Its Gemmological Characteristic. J. Gems Gemmol. 2017, 19, 48–59. [Google Scholar]
  20. Liao, W.C.; Fan, X.Y.; Shi, G.H.; Dai, L.L. Study on Chemical Process of Amber Formation by Infrared Spectroscopy. Spectrosc. Spectr. Anal. 2020, 40, 3167–3173. [Google Scholar]
  21. Wang, Y.M.; Li, Y.; Shi, Z.T.; Liu, F.; Liu, F.L.; Zhang, Z.Q. A Review for the Gemmological Research on Amber. J. Gems Gemmol. 2022, 24, 55–68. [Google Scholar]
  22. Weng, S.P.; Xu, Y.Z. Fourier Transform Infrared Spectroscopy Analysis, 3rd ed.; Chemical Industry Press: Beijing, China, 2016; pp. 311–315. [Google Scholar]
  23. Jin, D.; Zhang, Y.J.; Li, G.G.; Xiao, X.; Wang, Z.G.; Yin, G.F.; Liu, W.Q. Study on Three-Dimensional Fluorescence Spectra of Phenanthrene. Spectrosc. Spectr. Anal. 2009, 29, 1319–1322. [Google Scholar]
  24. Inessa, M.; Yang, M.Z. Laser-induced Luminescence of Emeralds from Different origins. J. Gems Gemmol. 1999, 1, 58–61. [Google Scholar]
  25. Zhang, S.Y.; Shen, A.H. Characteristic of Natural Cobalt Blue Spinel. J. Gems Gemmol. 2018, 20, 24–26. [Google Scholar]
Figure 1. (a) Black-tea amber; (b) green-tea amber; (c) ‘chameleon’ amber; (d) golden-blue amber [18].
Minerals 13 00151 g001
Figure 2. Different species of amber samples from Burma.
Minerals 13 00151 g002
Figure 3. Amber species with special optical effect phenomena are shown on the black background with strong light: (a) golden-blue amber (MDGB-1); (b) green-tea amber (MDGT-1); (c) black-tea amber (MDBAT-2); (d) ‘chameleon’ amber (MDCL-1).
Minerals 13 00151 g003
Figure 4. Long-wave ultraviolet fluorescence phenomenon of seven species of amber. (a) golden amber (MDG-1); (b) golden-blue amber (MDGB-2); (c) blood-tea amber (MDBOT-2); (d) green-tea amber (MDGT-1); (e) black-tea amber (MDBAT-2); (f) brownish-red amber (MDBR-2); (g) ‘chameleon’ (MDCL-1).
Minerals 13 00151 g004
Figure 5. Anomalous extinction phenomenon: (a) golden amber (MDG-1); (b) golden-blue amber (MDGB-2); (c) blood-tea amber (MDBOT-2); (d) green-tea amber (MDGT-1); (e) black-tea amber (MDBAT-1); (f) brownish-red amber (MDBR-2); (g) ‘chameleon’(MDCL-2).
Minerals 13 00151 g005
Figure 6. (a) Infrared spectra of different amber species from Burma; (b) the first group spectra peaks (1350 cm−1~1050 cm−1); (c) the second group spectra peaks (1050 cm−1~900 cm−1); (d) the third group spectra peaks (900 cm−1~700 cm−1).
Minerals 13 00151 g006
Figure 7. 3D fluorescence spectra, characteristic excitation spectra, and emission spectra of the golden amber sample (MDG-1).
Minerals 13 00151 g007
Figure 8. 3D fluorescence spectra, characteristic excitation spectra, and emission spectra of the golden-blue amber sample (MDGB-2).
Minerals 13 00151 g008
Figure 9. 3D fluorescence spectra, characteristic excitation spectra, and emission spectra of the blood-tea amber sample (MDBOT-1).
Minerals 13 00151 g009
Figure 10. 3D fluorescence spectra, the characteristic excitation spectra, and emission spectra of the green-tea amber sample (MDGT-1).
Minerals 13 00151 g010
Figure 11. 3D fluorescence spectra, the characteristic excitation spectra, and emission spectra of the black-tea amber sample (MDBAT-2).
Minerals 13 00151 g011
Figure 12. 3D fluorescence spectra, the characteristic excitation spectra, and emission spectra of the brownish-red amber sample (MDBR-1).
Minerals 13 00151 g012
Figure 13. 3D fluorescence spectra, the characteristic excitation spectra, and emission spectra of the ‘chameleon’ amber sample (MDCL-1).
Minerals 13 00151 g013
Figure 14. Photoluminescence spectral diagrams of the gold amber, chameleon, golden-blue amber, and brownish-red amber.
Minerals 13 00151 g014
Figure 15. Photoluminescence spectral diagrams of the blood-tea and black-tea amber.
Minerals 13 00151 g015
Table 1. Burmese amber with special optical effects.
Special SpeciesBlack-Tea AmberGreen-Tea Amber‘Chameleon’ AmberGolden-Blue Amber
White light
on white background
Maroon and abellinebrownish green and yellowish greenbrownish red and light brownish redgold and orange
White light
On black background
pink fluorescence on the surfaceslight pink fluorescencegreen fluorescence on the surfacebody color and blue, bluish-purple and bluish-green fluorescence
Table 2. Basic gemological characteristics of amber samples.
SampleColorsOptical Effect *TransparencyDensity
(g⋅cm−1)
LW UV
MDG-1GoldTransparent with dark-colored plant inclusions1.041Bluish purple
MDGB-1GoldBoth the blue fluorescence color and yellow body color both existTransparent1.033Bluish white
MDGB-2Gold1.027Bluish white
MDBOT-1Orange-yellowTransparent1.046Bluish violet
MDBOT-2Orange-yellow1.044Bluish violet
MDBOT-3Orange-yellow1.043Bluish violet
MDGT-1Yellowish greenextremely faint pink fluorescenceTransparent with internal cracks1.030Bluish violet
MDBAT-1Bronzingpresenting pink fluorescenceTransparent1.042Bluish violet with pink tone
MDBAT-2Brownish green1.042Bluish violet with pink tone
MDBR-1Claybank mixed with dark-brown stripesTransparent—non-transparent1.063purple blue
MDBR-2Claybank mixed with dark-brown stripes1.064purple blue
MDCL-1Brownish redDark green fluorescence on the appearanceTransparent with cracks1.070Bluish purple and mildly dark and green on surface
MDCL-2BrownGreen fluorescence with obvious white and dark toneTransparent, with partial dark-colored inclusions1.048Bluish purple and mildly dark on surface
* All the samples were observed under strong white light on a black background.
Table 3. Summary of luminescence centers of the different amber species from Burma.
SamplesRed-Light Area/nmBlue-Light Area/nmPurple-Light Area/nmUV-Light Area/nm
ExEmExEmExEmExEm
MDG-1 380/400430240/294347
MDGB-1 380/400430240347/401
MDGB-2 440475380/400430240349
MDGT-1408640440474378426240348
400430
MDBOT-1 364412240/294334/347
372428
MDBOT-2 Same as MDBOT-1
MDBOT-3
MDBAT-1400648 360408240/294335/347
410625
MDBAT-2400645 364412240/294347
410624372432
MDBR-1 386441238/294347
374428/440328360
410623 402437
276419/438
MDBR-2Same as MDBR-1
MDCL-1 382/402432238334/344
294334/(344,410)
MDCL-2 388/406440240/295335/350
274360/415
Table 4. Summary of photoluminescence centers of different species of Burmese amber.
SamplesBlue Region/nmRed Region/nm
MDG-1441465
MDGB-1437464
MDGB-2443466
MDGT-1443465648
MDBR-1444466624649
MDBR-2446467624649
MDCL-1443464
MDCL-2442464
MDBOT-1467483
MDBOT-2467483
MDBOT-3467483
MDBAT-1470483625652
MDBAT-2468483625650
Disclaimer/Publisher’s Note: The statements, opinions and data contained in all publications are solely those of the individual author(s) and contributor(s) and not of MDPI and/or the editor(s). MDPI and/or the editor(s) disclaim responsibility for any injury to people or property resulting from any ideas, methods, instructions or products referred to in the content.

