1. Introduction
The Alta Floresta Gold Province (
Província Aurífera de Alta Floresta, PAAF) is one of the main gold-mining areas in the state of Mato Grosso, Brazil [
1]. The first gold discoveries in the region occurred in alluvial deposits in the Peixoto de Azevedo River in 1978. Initially, the mechanisms used for gold digging were manual, and then, the mining methods changed to the use of dredges and pumps for gravel suction. From 1980 to 1999, the production of gold in the PAAF was in the order of 160 tons [
2], most of which was extracted from alluvial and auriferous shear zones.
Due to its great potential and the necessity to discover new, mainly primary deposits, many geological works have concentrated on this province, such as works accomplished by the Geological Survey of Brazil (GSB) [
3,
4,
5,
6], in addition to works restricted to the eastern portion of the province [
7,
8,
9,
10,
11,
12].
Most of the gold deposits in the eastern region of the PAAF are of the filonean type [
7,
9,
11,
13,
14] inside shear zones in monzogranites. Additionally, in the PAAF, disseminated mineralization occurs, hosted in granitic rocks (e.g., the Serrinha gold mine, the Pezão gold mine, the Luizão gold mine, the Pé Quente gold mine, and the X1 gold mine [
7,
9,
11]). In 2018, the Anglo-American mining company performed a mineral requisition of 284 blocks in the PAAF (1.9 million hectares) due to the discovery of porphyry copper-gold deposits with deep drilling hole information [
15].
Due to the region’s intense rock weathering, the soil and saprolite layers reach up to 40 m thick. Few rock outcrops make it difficult to conduct surface mapping for auriferous mineralization. For regions where there are no research or geological studies, information from mineral research is used with backhoes and drill holes. However, due to the irregularity of the geometry and the discontinuity of the auriferous shear zones, there are many failures to find gold ore in these drilling campaigns.
Geophysical methods have great significance for mineral exploration. The research was conducted [
16] in the South Khorasan Province, Iran, to identify copper mineralization zones using geophysical research (IP and RES) and forecasting methods for planning mining and drilling operations. Another study [
17] investigated the relationship between fault systems and host lithology with massive sulfide copper mineralization in the Sahlabad area, South Khorasan Province, eastern Iran. An airborne geophysical analysis (aeromagnetometric data) was executed to determine the presence of intrusive and extrusive masses associated with structural systems. Researchers [
18] found promising areas of iron ore mineralization in the Chak Chak exploration area of Yazd Province, Iran, using terrestrial magnetometry. In addition, researchers [
19] studied an area located near Toot village in the Yazd Province of Iran considered to have iron mineralization potential. Radioactivity and radiometric surveys were performed in a part of the area where magnetometric studies were also performed.
Some geophysical operations in the PAAF, such as the Juruena-Teles Pires Project 1991 [
3,
5], have developed new geological maps for the PAAF region based on airborne geophysical data. Some studies [
20,
21] have used remote sensing and aerogeophysics for better descriptions and location of minerals in the region, while others [
22,
23] have used remote sensing and airborne geophysical surveys to model geophysical data and describe the geological and metallogenetic implications of the region. The work conducted in [
24] developed mineral-prospecting research using geochemical and geophysical methods, including magnetic, electromagnetic, resistivity, and induced polarization methods. Researchers in [
13] conducted terrestrial investigations using magnetic and inductive electromagnetic methods. Some studies [
25,
26] have used geoelectrical methods (induced polarization and resistivity) and magnetometry to help identify and characterize exploratory targets in the region.
In all the geophysical operations developed in the PAAF region, there has been a reference to the existence of a layer with high electrical conductivity and high magnetization near the surface. This layer occurs from the surface to a maximum depth of 50 m [
27]. In all boreholes describing mineralogical compositions of the rocks, there are records of high concentrations of magnetite in the soils and saprolites [
10].
The laterization process of the soils and saprolites increases the induced polarization response in the first layer of subsoil. The presence of reduced iron (magnetite minerals) in soils and saprolites attenuates the propagation of electric current at certain depths, as these media become good electrical conductors. To minimize this effect, high voltages must be applied to the media to enable the flow of electric currents at greater depths.
The research carried out in this work takes place in three different mines that extract gold ore using vertical shafts with horizontal accesses. Ore exploration occurs up to 100 m deep, as the large volumes of water that flow along the fractures require constant pumping to avoid flooding the galleries, which greatly increases cost and makes exploitation infeasible.
This work aims to verify the geoelectric signatures and the effectiveness of resistivity and chargeability in the location of shallow auriferous veins in the southeastern portion of the Alta Floresta Gold Province.
2. Geological Setting of the Study Region
The Alta Floresta Gold Province (PAAF) was named by Dardene and Schobbenhaus [
27]; suggestions by other authors include the Juruena-Teles Pires Auriferous Province [
5], the Alta Floresta Domain [
28], and the Mineral Province of Alta Floresta [
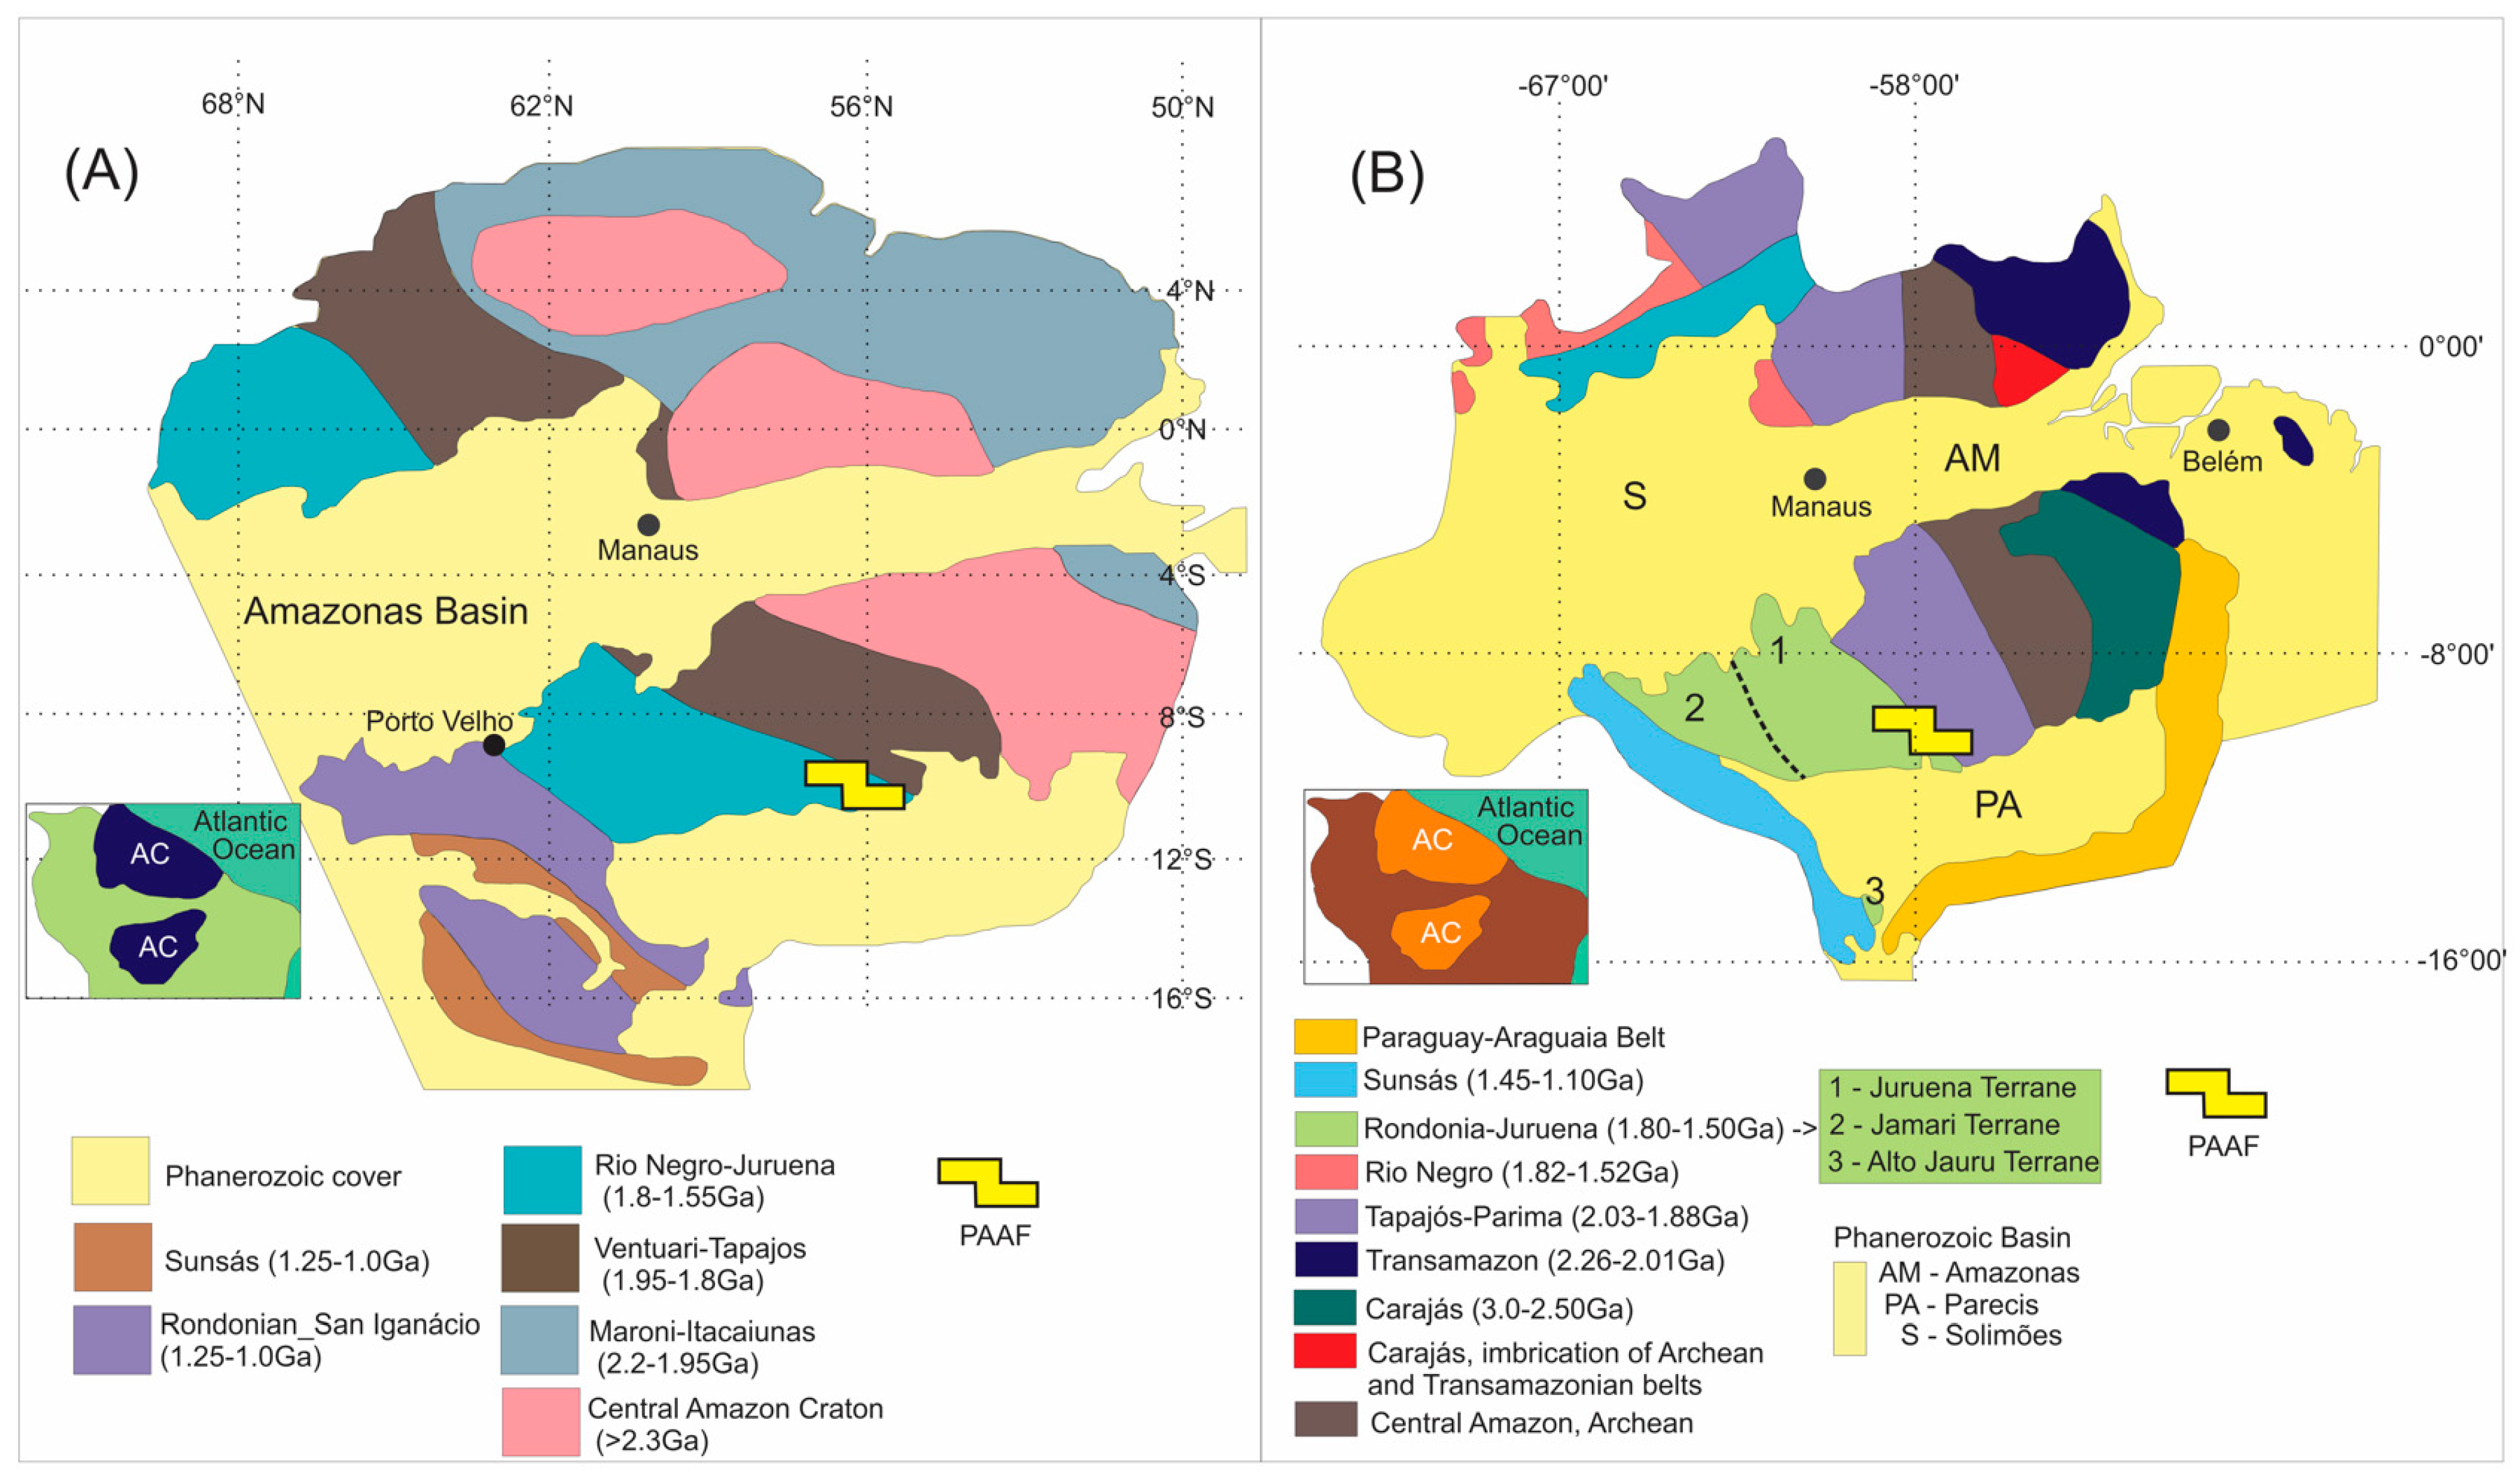
6]. It is contextualized on a strip of paleo-to-Mesoproterozoic terrain located in the southern portion of the Amazonian Craton, where it is bordered to the north by the Ventuari-Tapajós Province (1.95 to 1.80 Ga) and to the southwest by the Rio Negro-Juruena Province (1.80 to 1.55 Ga) (
Figure 1). Depending on the geotectonic model adopted, the PAAF is considered part of different geochronological provinces, whose temporal and spatial boundaries differ in the geotectonic compartmentation of the Amazonian Craton. Thus, two main proposals have been determined to understand the geotectonic structuring of the Craton.
The first proposal divides the compartmentation into seven tectonic provinces [
28,
29,
30], in which the Carajás Province is separated from the Central Amazon Province (
Figure 1A). In this context, the remaining provinces undergo minor modifications to those initially proposed [
27,
28,
29].
In the second proposal, the compartmentation is described by six geochronological provinces that are structured in a preferred NW–SE direction in which authors [
31,
32,
33] show the Central Amazonian Province as a central Archean nucleus in addition to other proterozoic provinces, such as the provinces of Maroni-Itacaiunas, Ventuari-Tapajós, Rio Negro-Juruena, Rondonian-San Ignacio, and Sunsás (
Figure 1B).
In the PAAF, mineral deposits are embedded in type-I calcium-alkaline granites and are hosted in three main forms: (i) widespread in form and associated with Au ± Cu, similar to gold porphyry deposits [
5,
9,
34,
35,
36,
37]; (ii) hosted in quartz veins associated with Au ± Cu [
2,
11,
14,
38]; and (iii) hosted in quartz veins with Au ± base metals genetically related to epidermal intermediate sulfide deposits [
7,
35,
38].
Primary gold deposits are found in various regions of the PAAF but are largely found in the eastern portion, specifically in the Peru-Trairão lineament. This lineage covers an extended area of approximately 30 km by 140 km with a NW–SE direction and has a transcurrent character, predominantly sinister kinematics, and natural ductile to ruptile-ductile fractures [
8,
11,
38].
The eastern portion of the Alta Floresta Gold Province partially corresponds to the Peixoto Domain, which is the subject of this research as it constitutes an important gold-producing segment and, in addition to the namesake gold-mining region, includes several other traditional gold-producing regions. This work is inserted in the eastern portion of the PAAF in what is known as the Peixoto Domain (
Figure 2 and
Figure 3).
Moreton and Martins [
39] described that, in the mining areas, there were biotite granites and monzogranites from the Matupá intrusive suite, as well as gabbro, granodiorites, quartz diorites, monzogabbro, and monzodiorite from the Flora da Serra intrusive suite. However, a description of boreholes from the Raimunda (BH1R), Truilio (BH1T), and Porteira (BH1P, BH2P, and BH3P) mines only indicated the presence of monzogranites (
Figure 4).
The study area was composed of three artisanal gold mines named Raimunda, Truilio, and Porteira. The geological setting was described with core samples from five boreholes (
Figure 4) with the presence of three lithotypes, defined as saprolite, monzogranite, and diabase.
From top to bottom, we found an initial layer of saprolite (altered monzogranite) of about 40 m in depth with a reddish-colored sandy clay material, fragments of biotite-rich monzogranites, and many magnetic oxides (mainly magnetite). This was followed by a layer of monzogranite, with a light gray to black color (higher concentration of biotite) and a medium and isotropic uneven texture. In the monzogranite, quartz venules enriched with sulfides and oxides were frequent.
There were hydrothermal zones within the monzogranite layer with the notable presence of quartz venules, carbonates, and epidotes, higher concentrations of sulfides (pyrite and chalcopyrite), and free gold. This is the mineralization zone that artisanal for which miners search.
In addition, inside the monzogranite layer, there were intrusions of diabase dikes, which were fine-grained, with common, small pegmatitic veins of quartz and feldspar across these structures. In all the boreholes, small intrusions from a centimeter to a meter in the diabase layer were recorded.
It was observed that the rocks in the three artisanal mines followed the same geological setting. In addition, the highest concentrations of free gold were associated with sulfide rocks from the hydrothermal altered zone, known in the region as the gold lode (
Figure 5).
3. Materials and Methods
3.1. Geoelectrical Data Measurement
The geoelectric data acquisition occurred in areas of small mining companies that were part of the Peixoto River Valley Gold Miners Cooperative (Coogavepe), which made it possible to access the areas. The survey occurred in the Raimunda, Truilio, and Porteira mines (
Figure 6). At each mine sections of three or four geophysical lines with lengths up to 700 m were planned according to access to the mines and access to nearby farms. Sections were always perpendicular to the main direction of mineralization.
Before the acquisition of data, those responsible for each mining area arranged for opening paths, staking a mark on the ground every 25 m in the sections and certifying authorization to access the areas. The resistivity and chargeability field measurements took place in August 2016.
The data acquisition was performed using a 10-channel ELREC-PRO, Induced Polarisation (IP) and Resistivity receiver (IRIS INSTRUMENTS, Orléans, France) and a VIP 3000 transmitter (IRIS INSTRUMENTS, Orléans, France) powered by a single-phase Toyama TF8000CXE2V generator (Toyama Power Products, Curitiba, Brazil) with a maximum power of 6.8 KVA, a 110/220 V output current, and 8.3 A. An injection cycle and 2000 ms (2 s) current record and temporal windows of the Cole–Cole potential curve were used for data collection. The transmitter injected an electrical current of between 1 and 2.5 A, depending on the electrical contact resistance (less than 10 kohm.m) between the current electrode and the subsoil. A dipole–dipole array was used with 10 levels of depth investigation, using spacings of 20 m (Raimunda gold mine) and 25 m (Truilio and Porteira gold mines) (
Figure 7).
During the field measurements, the acquisition group made adaptations to ensure the physical integrity of the equipment, such as trenching for the passage of electrical cables, successive stops to maintain transmitter internal cooling, aerial transposition of cables over water bodies, and reopening passages and mounting tents for transmitter and generator protection (
Figure 8).
3.2. Resistivity and Induced Polarization
The combined application of the electrical resistivity and induced polarization methods make it possible to more accurately determine the locations of polarizable electrical anomalies related to sulfides associated with mineral deposits [
40,
41,
42,
43,
44,
45,
46,
47].
The advantage of the induced polarization method is that electrical resistivity (ρ) and chargeability (M) are recorded during the same injection cycle current (
Figure 9), which minimizes the time required for field data acquisition [
48,
49]. Electrical resistivity depends on the dimensions (factor K; [
50]) through which an electric current is passed and is calculated when the electric potentials and the current are at maximum Equation (1), whereas the effect of induced electric polarization is independent of the medium and is recorded after the current is turned off Equation (2).
Electrical resistivity represents how much a material opposes the passage of an electric current. This property depends mainly on mineralogical composition, water content, porosity, temperature, salinity, and colloid content [
51]. In mineralized hydrothermal zones with gold occurrence associated with sulfides, electrical resistivity may be high or low depending mainly on the sulfide content, the mineralogical composition of the enclosing rock, and the medium porosity (shear degree; [
52,
53]).
According to Sumner [
48], the IP phenomenon is due to the polarization of a membrane and electrode polarization (overvoltage effect). The first occurs only in rocks with saline fluids percolating in their pores as an electrolytic source. The overvoltage effect occurs in materials with high free electronic charges, e.g., metallic materials such as copper, gold, silver, sulfides (pyrite, arsenopyrite, chalcopyrite, etc.), and oxides with metallic shine (magnetite, hematite, etc.; [
50]). Therefore, the overvoltage effect is the most important factor in prospecting for gold deposits.
4. Results and Analysis
4.1. Data Analysis, Filtering, and Modeling
During the field measurement stage, quality analyses were performed on the electrical resistivity and chargeability data to verify the need to repeat in the different field sections. The quality criteria were electrical contact resistance (electrode versus ground), output voltage, current, and recorded electrical potential.
After the field measurements, the data were filtered through Prosys II software (Iris Instruments Inc., Orléans, France). The filtering criteria determined removed resistivity and chargeability records outside the normal log distribution and removed chargeability data with abnormal curves, e.g., different from decreasing exponential functions. In the filtering process, resistivity data above 20,000 ohm.m and chargeability data above 70 mV/V were removed, corresponding to less than 2% of the acquisition data.
The modeling of geoelectric data was performed with the Res2Dinv software [
53]. This program automatically determined a two-dimensional model of the middle subsurface with field data [
54]. The 2D model used in this program, or the inversion routine, consisted of several rectangular blocks. The arrangement of these blocks was moderately related to the distribution of points in the pseudo-section. In the software, the parameters and sizes of the blocks were changed with the changing thickness of the layers, so each measured point fit inside a block; otherwise, the distribution and sizes of the blocks were generated automatically by the program using the distribution of the field points.
For the construction of the target, we defined the parameters of the inversion blocks with Res2Dinv software. Data were examined, saved, and exported. Using Geosoft–Oasis Montaj, the exported data were integrated with topographic data with UTM coordinates. Each position in the profile was considered a geophysical borehole, thus generating the resistivity and chargeability profiles for the data of each gold mine in Geosoft. By importing the geophysical borehole grid from each line, we generated 3D profiles, and interpretations of the mining zones were generated with the help of the WIREFRAME extension within Geosoft.
Figure 10 shows a flowchart summarizing data acquisition, data processing, and the creation of a geophysical model for resistivity (RES) and induced polarization (IP).
For most of the mines studied, we were able to observe three distinct electrical resistivity patterns, which could be observed in almost all the resistivity models. The most superficial pattern had resistivities between 350 and 1800 ohm.m, which behaved as a horizontal package along some parts of the sections. The second resistivity pattern had low values, from 50 to 700 ohm.m. The third pattern had values from 500 to 3000 ohm.m.
For all the IP profiles studied at the mines, two chargeability patterns were noticed. The most superficial pattern had chargeability values from 15 to 30 mV/V that behaved similarly to a horizontal package, and in this package, there was a high chance of overvoltage (membrane or electrode polarization). The second package had chargeability values ranging from 3 to 30 mV/V, where the overvoltage effect was likely to occur. A mineralization zone or sulfide region was indicated at some points with chargeability values above 18 mV/V (sharp change in color gradient or chargeability values), which may also be associated with mineralized or sulfide targets.
4.2. Raimunda Gold Mine
Figure 11 shows the results for the Raimunda gold mine. The borehole (BH1R) was situated approximately 165 m from the end of geophysical line 04 (L4RM). The resistivity profile (
Figure 11A) shows a layer that could possibly be soil, with a thickness reaching up to 30 m in depth and values ranging from 800 to 2200 Ω.m. The second layer, with low resistivity values ranging from 50 to 650 ohm.m along the entire profile, was the saprolite layer. The third layer had high values of resistivity ranging from 1000 to 3800 ohm.m and was correlated with monzogranite. In the chargeability profile shown in
Figure 11B, at the positions of 125, 270, and 490 m, anomalous patterns with high chargeability values corresponding to 38, 14, and 34 mV/V, respectively, were observed. These punctual anomalous patterns were associated with possible mineralized zones. However, the mineralization at 125 and 270 m could be hosted in fractured monzogranite zones.
Figure 12 shows a projection of the continuity for two parallel mineralized zones that intersected lines 01 (L1RM), 02 (L2RM), and 04 (L4RM), which were probably structured in the east–west direction. The mineralized zone in L1RM ranged from depths of 20 to 30 m, extending in the eastern direction and passing through L2RM at 40 and 60 m depths, as well as through L4RM. L3RM showed no signs of a possible mineralization zone or sulfide region.
Table 1 shows the numerical results of resistivity and chargeability for the Raimunda gold mine.
4.3. Truilio Gold Mine
Figure 13 shows the results for the Truilio gold mine. The borehole (BH1T) was located at a position of 300 m.
The resistivity profile (
Figure 13A) showed a layer with low values of resistivity ranging from 50 to 600 ohm.m. This layer was the saprolite layer. The second layer had values from 800 to 30,000 ohm.m. This layer could be recognized as monzogranite. In the chargeability profile shown in
Figure 13B, there was an anomaly at the position of 180 m with a chargeability value of 18 mV/V. At the position of 340 m, we found an anomaly with a high chargeability value of 31 mV/V. Additionally, at the position of 460 m, there was an anomaly with a chargeability value of 22 mV/V. The indicated targets could possibly be mineralization zones. The anomalies at the positions of 300 and 460 m were in the monzogranite layer and very possibly hosted in a fracture. All the anomalies mentioned were associated with possible mineralized zones.
Figure 14 shows a projection of the continuity for three parallel mineralized zones that intersected lines 01 (L1TR), 02 (L2TR), and 03 (L3TR) structured in the north–south direction. The mineralized zone in L1TR was from depths of 50 to 70 m, extending to the south and passing through L2TR at depths close to 60 m and through L3TR at depths around 70 m.
Table 2 shows the numerical results of resistivity and chargeability for the Truilio gold mine.
4.4. Porteira Gold Mine
Figure 15 shows the results for line 03 of the Porteira gold mine (L3PR). Two boreholes (BH1P and BH2P) were made very close to the positions of 290 and 410 m. The resistivity profile (
Figure 15A) showed a layer of soil at 20 m of depth with values ranging from 140 to 700 ohm.m. The second geoelectric layer, the saprolite layer, showed low resistivity values ranging from 24 to 150 ohm.m. The third geoelectric layer had high values ranging from 200 to 1800 ohm.m associated with monzogranite. In the chargeability profile shown in
Figure 15B, at the positions of 160 and 500 m, anomalous zones appeared with high chargeability values corresponding to 34 and 40 mV/V, respectively. These anomalies were possible mineralized zones that were probably hosted in monzogranite fracture zones.
Figure 16 shows the results for L2PR of the Porteira gold mine. A borehole (BH3P) was located near the position of 350 m. In the resistivity profile, the first geoelectric layer had values ranging from 200 to 1400 ohm.m and was associated with soil having 40 m of thickness. The second layer, which could be saprolite, had low resistivity values from 24 to 150 ohm.m. The third layer had high values from 300 to 1800 ohm.m and corresponded to monzogranite. In the IP profile shown in
Figure 16B, only one anomaly pattern with a chargeability value of 18 mV/V was located at the position of 240 m. This anomaly possibly indicated a mineralized zone that was hosted in a fractured monzogranite zone.
Table 3 shows the numerical results of resistivity and chargeability for the Porteira gold mine.
5. Conclusions
From the geological setting of the study area, the gold-bearing interval was located within hydrothermal zones associated with sulfide and fractured quartz rocks. The correlation between gold and sulfide rocks permitted the use of resistivity and induced polarization methods to define new targets for drilling, as sulfide rocks generally provide high values of chargeability. High-chargeability zones were found in all of the IP profiles and were marked as targets for future investigation.
Correlation between the responses of geoelectric patterns (resistivity and chargeability) and geological boreholes allowed the creation of lithological geophysical models and the indication of possible new mineralized targets, as well as their continuities along monzogranitic hosts contextualized in the Raimunda, Truilio, and Porteira gold mines. The geophysical data acquisition of resistivity and induced polarization with dipole–dipole arrays with spacings of 20 and 25 m in the mines did not allow for the identification of fractured zones in the base layers due to spatial resolution.
The geophysical model elaborated for the Raimunda gold mine matched the lithological description of the borehole (BH1R). In the geophysical model, the geoelectric resistivity patterns showed a layer of soil along the line and a saprolite–monzogranite interface at a 40 m depth. A layer with hydrothermal sulfide could not be distinguished in the resistivity and IP profiles. Regarding the inferred mineralized targets, through the IP section, the target at the position of 270 m showed low chargeability compared to the surrounding values. However, its characterization was linked to the depth that corresponded to the record of the borehole performed near the acquired section. The high chargeability values observed at the positions of 125 and 490 m could be influenced by the edge effect that occurred in the processing and profile-modeling steps performed in Res2Dinv.
In the Truilio gold mine, there was no presence of soil, only saprolite layers and the basis for the interpretation of the geophysical model. This lithological inference was consistent with the recording of the borehole (BH1T) made in the mine. The IP target at the position of 350 m had a lower chargeability value than the others. However, this target stood out because of its indicated depth, as well as its location in a situation surrounded by low chargeability values, indicating a potential mineralized zone. The IP anomaly at the position of 180 m was near the edge of the IP profile, where the value of this anomaly could be influenced due to the edge effect.
In the Porteira gold mine, for line 03 (L3PR) in the boreholes (BH1P and BH2P), there was no record of a soil layer, only saprolite layers, and monzogranite rock. BH2P was drilled at a depth of approximately 30 m. This drilling occurred three months after data acquisition. The geophysical model was consistent with the boreholes. In the induced polarization results, BH2P had a thin layer of 1 m of sulfide quartz with gold and a layer of hydrothermal alteration zone just below it. Between the positions of 420 and 500 m, the chargeability results had values from 12 to 30 mV/V, which fit the layers of sulfide quartz with gold and the hydrothermal alteration zone. The mineralized targets inferred through the IP section and geophysical model at the positions of 150 and 500 m showed values greater than 30 mV/V. These targets were in layers with low chargeability values of up to 34 mV/V.
In line 02 (L2PR) of the Porteira gold mine, the resistivity profile was inconsistent with BH3P. The IP profile allowed the definition of soil layer thickness and marked the boundary between the soil layer and the saprolite. Unfortunately, the geophysical model was not consistent with BH3P. The mineralized target inferred at the position of 250 m had a value of 16 mV/V for chargeability, which was a lower value compared to line 03 of the same mine.
The defined color scales were applied to the gold mines, where the maximum resistivity value was close to the determined value of 6500 ohm.m after the statistical analysis of all the data points collected. For chargeability, the maximum value determined was 40 mV/V. In some mines, such as L2PR and L3PR in Porteira, the maximum resistivity values were lower than the determined value, causing certain structures or layers in the resistivity profile to become one. The same effect occurred when chargeability values were lower than the maximum value, masking potential anomalies with values of 20 mV/V.
The results obtained with the methods of resistivity and induced polarization had a fair, average correlation with the geological structures, making it possible to show the mineralized zones and indicating that the induced polarization method is an average tool for mineral prospecting in the region. For future work in the region, petrophysical analyses are recommended, as well as trying other methods, such as magnetometers and Wenner and Schlumberger arrays, to compare other results for RES and IP.
Author Contributions
Conceptualization, E.X.S., A.S.J.d.C., and W.R.B.; methodology, E.X.S. and W.R.B.; software, E.X.S. and A.S.J.d.C.; validation, E.X.S., W.R.B., and R.E.C.; formal analysis, E.X.S. and M.I.; investigation, E.X.S., A.S.J.d.C., and R.E.C.; writing—original draft preparation, E.X.S., W.R.B., and M.I.; writing—review and editing, E.X.S. and W.R.B.; visualization, A.S.J.d.C. and E.X.S.; supervision, M.I. and W.R.B.; project administration, E.X.S. and W.R.B. All authors have read and agreed to the published version of the manuscript.
Funding
This study was financed, in part, by the Coordenação de Aperfeiçõamento de Pessoal de Nível Superior, Brasil (CAPES) (Finance Code 001) and the University of Brasilia (UnB) (DPI/DPG/BCE N. 01/2023). The Matogrossense Mining Company (METAMAT) and the Peixoto River Valley Gold Miners Cooperative (COOGAVEPE) also provided financial and logistical support.
Data Availability Statement
The data is unavailable due to privacy matters asked by the mine owners and by the Peixoto River Valley Gold Miners Cooperative (Cooperativa dos Garimpeiros do Vale do Rio Peixoto—COOGAVEPE) helped with the fund and also made the contacts/negotiations with the gold miners.
Acknowledgments
The authors thank Francisco Jose Fonseca Ferreira and Rodoilton Stevanato of the Applied Geophysics Laboratory of the Federal University of Paraná (UFPR) for loaning the IRIS VIP and ELREC PRO equipment. The authors also thank Daniel Richard Oliveira, Willian Giovanni Zan, Joyce Pinheiro de Oliveira Fiori, Vicente de Paula Pinto, and Pedro Vencovsky Nogueira for contributing to this study.
Conflicts of Interest
The authors declare no conflict of interest.
References
- ANM. Principais substâncias metálicas. In Brazilian Mineral Yearbook; National Department of Mineral Production: Rio de Janeiro, Brazil, 2016. [Google Scholar]
- Paes de Barros, A.J. Contribuição a Geologia e Controle das Mineralizações Auríferas de Peixoto de Azevedo-MT. Master’s Thesis, Instituto de Geociências, Universidade de São Paulo, São Paulo, Brazil, 1994; 145p. [Google Scholar] [CrossRef]
- CPRM. Dados Aereogeofísicos—Projeto Juruena-Teles Pires Fase I. In Companhia de Pesquisas de Recursos Minerais; CPRM: São Paulo, Brazil, 1991. [Google Scholar]
- Dardene, M.A.; Schobbenhaus, C. Metalogênese do Brasil; Universidade de Brasília: Brasília, Brazil, 2001; p. 392. [Google Scholar]
- Silva, M.G.; Abram, M.B. Projeto Metalogenia da Província Aurífera Juruena-Teles Pires, Mato Grosso. In Goiânia, Geological Survey of Brazil; CPRM: São Paulo, Brazil, 2008; 212p. [Google Scholar]
- Souza, J.O.; Frasca, A.A.S.; Oliveira, C.C. Geologia e Recursos Minerais da Província Mineral de Alta Floresta; Relatório Integrado Brasília, Geological Survey of Brazil; CPRM: São Paulo, Brazil, 2005; 164p.
- Assis, R.R. Depósitos Auríferos Associados ao Magmatismo Félsico da Província de Alta Floresta (MT), Cráton Amazônico: Litogeoquímica, Idade das Mineralizações e Fonte dos Fluidos. Ph.D. Thesis, Instituto de Geociências, Universidade Estadual de Campinas, Campinas, Brazil, 2015; 363p. [Google Scholar] [CrossRef]
- Miguel, E., Jr. Controle Estrutural das Mineralizações Auríferas E Idades U-Pb das Rochas Encaixantes ao Longo do Lineamento Peru-Trairão: Província Aurífera de Alta Floresta, Mato Grosso. Master’s Thesis, Universidade Estadual de Campinas, Campinas, Brazil, 2011; 86p. [Google Scholar]
- Moura, M.A. O Maciço Granítico Matupá no Depósito de Ouro Serrinha (MT): Petrologia, Alteração Hidrotermal E Metalogenia. Ph.D. Thesis, Universidade de Brasília, Instituto de Geociências Brasília, Brasília, Brazil, 1998; 294p. [Google Scholar]
- Oliveira, D.R.P. O Depósito de Au Porteira, Peixoto de Azevedo (MT): Geologia, Petrologia, Geocronologia U-Pb E Metalogênese. Master’s Dissertation, Instituto de Geociências—IG, Pós-Graduação em Geologia, UnB, Brasília, Brazil, 2017. [Google Scholar]
- Paes de Barros, A.J. Granitos da Região de Peixoto de Azevedo—Novo Mundo E Mineralizações Auríferas Relacionadas—Província Aurífera Alta Floresta (MT). Ph.D. Thesis, Instituto de Geociências, Universidade Estadual de Campinas, Campinas, Brazil, 2007; 154p. [Google Scholar] [CrossRef]
- Quispe, P.E.C. Geologia, Geoquímica E Geocronologia dos Granitoides Foliados E Rochas Subvulcânicas da Região de Peixoto de Azevedo Setor Leste da Província Aurífera de Alta Floresta, Mato Grosso. Master’s Thesis, Instituto de Geociências, Universidade Estadual de Campinas, Campinas, Brazil, 2016. [Google Scholar] [CrossRef]
- Agnoletto, E. Caracterização Litológica e Identificação de Alvos Exploratórios na Região de Flor da Serra, Província Aurífera Alta Floresta (MT), Utilizando Dados Magnéticos e Geoelétricos. Master’s Thesis, Instituto de Geociências. Campinas, Universidade Estadual de Campinas, Campinas, Brazil, 2013; 119p. [Google Scholar] [CrossRef]
- Trevisan, V.G. Estudo Comparativo Entre Mineralizações Filonares De Au ± Cu E Au + Metais de Base do Setor Leste da Província de Alta Floresta (MT), Craton Amazônico. Master’s Thesis, Universidade Estadual de Campinas, Campinas, Brazil, 2015; 129p. [Google Scholar] [CrossRef]
- DNPM. Anuário Mineral Brasileiro: Principais Substâncias Metálicas; Departamento Nacional de Produção Mineral: Rio de Janeiro, Brazil, 2018.
- Shirazy, A.; Hezarkhani, A.; Shirazy, A.; Timkin, T.V.; Voroshilov, V.G. Geophysical explorations by resistivity and induced polarization methods for the copper deposit, South Khorasan, Iran. Bull. Tomsk. Polytech. Univ. Geo Assets Eng. 2022, 333, 99–110. [Google Scholar] [CrossRef]
- Shirazi, A.; Hezarkhani, A.; Pour, A.B. Fusion of Lineament Factor (LF) Map Analysis and Multifractal Technique for Massive Sulfide Copper Exploration: The Sahlabad Area, East Iran. Minerals 2022, 12, 549. [Google Scholar] [CrossRef]
- Aali, A.A.; Shirazi, A.; Shirazy, A.; Khakmardan, S.; Maghsoudi, A.; Hezarkhani, A. Geophysical Study to Identify Iron Mineralization Anomalies Using Terrestrial Magnetometry in the Chak-Chak Exploration Area, Iran. Geol. Bull. Turk. 2022, 65, 159–170. [Google Scholar] [CrossRef]
- Shirazy, A.; Hezarkhani, A.; Tmkin, T.; Shirazi, A. Investigation of magneto-/radio-metric behavior in order to identify an estimator model using K-means clustering and Artificial Neural Network (ANN) (Iron Ore Deposit, Yazd, IRAN). Minerals 2021, 11, 1304. [Google Scholar] [CrossRef]
- Madrucci, V. Avaliação dos produtos integrados TM-Landsat, RadarSAT e Gamaespectrométricos na Caracterização Tectônica e Mapeamento Geológico de Área Mineralizada em Ouro na Região de Alta Floresta. Ph.D. Thesis, Instituto Nacional de Pesquisas Espaciais—INPE, São José dos Campos, São Paulo, Brazil, 2000; 189p. Available online: http://urlib.net/sid.inpe.br/deise/2000/11.06.11.14 (accessed on 4 February 2019).
- Madrucci, V.; Veneziani, P.; Paradella, W.R. Caracterização geológica e estrutural através da interpretação do produto integrado TM-Landsat 5 e dados aerogamaespectrométricos, região de Alta Floresta—MT. Rev. Bras. Geofísica (Braz. J. Geophys.) 2003, 21, 219–234. [Google Scholar] [CrossRef]
- Barbuena, D. Processamento e Modelagem de Dados Geofísicos e Imagens Aster Aplicados à Interpretação Geológica e Prospecção Mineral na Província Aurífera de Alta Floresta, MT. Master’s Thesis, Instituto de Geociências, Universidade Estadual de Campinas, Campinas, Brazil, 2012; 117p. [Google Scholar] [CrossRef]
- Moura, R. Integração De Dados Aerogeofísicos, Multiespectrais e Geoquímicos no Segmento Leste da Província Aurífera Alta Floresta (MT); Implicações Geológicas e Metalogenéticas Regionais; Course Completion Work; Instituto de Geociências, Universidade Estadual de Campinas: Campinas, Brazil, 2004; 60p. [Google Scholar]
- Pajanoti, B.J.; Agnoletto, E. Aplicação Dos Métodos Magnético e Eletromagnético em Alvos Auríferos na Gleba da Liberdade, Município de Matupá—MT; Course Completion Work, Geology Course; Instituto de Ciências Exatas e da Terra—ICET, Universidade Federal de Mato Grosso—UFMT: Cuiabá, Brazil, 2010; 93p. [Google Scholar]
- Agnoletto, E.; Leite, E.P. Identification of exploration gold targets in the Alta Floresta Gold Province, Mato Grosso state, Brazil, based on an integrated interpretation of magnetic and geoelectrical data. Braz. J. Geophys. 2015, 33, 1. [Google Scholar] [CrossRef]
- Costa, L.D.V.; Da Silva, J.M.; De Lima, H.M. Analysis of options of production and access ways in underground mines. REM Int. Eng. J. 2017, 70, 237–242. [Google Scholar] [CrossRef]
- Santos, J.O.S.; Hartmann, L.A.; Gaudette, H.E.; Groves, D.I.; McNaughton, N.J.; Fletcher, I.R. New understanding of the Amazon Craton provinces, based on field work and radiogenic isotope data. Gondwana Res. 2000, 3, 453–486. [Google Scholar] [CrossRef]
- Santos, J.O.S. Geotectônica dos escudos das Guianas e Brasil-Central. In Geologia, Tectônica e Recursos Minerais do Brasil; Bizzi, L.A., Schobbenhaus, C., Vidotti, R.M., Gonçalves, J.H., Eds.; CPRM: Brasília, Brazil, 2003. [Google Scholar]
- Santos, J.O.S.; Hartmann, L.A.; Faria, M.S.; Riker, S.R.; Souza, M.M.; Almeida, M.E.; McNaughton, N.J. A compartimentação do Cráton Amazonas em províncias: Avanços ocorridos no período 2000–2006. In Simpósio de Geologia da Amazônia; Sociedade Brasileira de Geologia: Belém, Brazil, 2006; p. 9. [Google Scholar]
- Tassinari, C.C.G. O Mapa Geocronológico Do Cráton Amazônico No Brasil: Revisão Dos Dados Isotópicos. Ph.D. Thesis, Universidade de São Paulo, São Paulo, Brazil, 1996; 257p. [Google Scholar] [CrossRef]
- Tassinari, C.C.G.; Macambira, M.J.B. Geochronological Provinces of the Amazonian Craton. Episodes 1999, 22, 174–182. [Google Scholar] [CrossRef] [PubMed]
- Tassinari, C.C.G.; Macambira, M.J.B. A evolução tectônica do Craton Amazônico. In 44 Congresso Brasileiro de Geologia, Araxá, Minas Gerais, Anais; SBG-Núcleo Minas Gerais: Belo Horizonte, Brazil, 2004. [Google Scholar]
- Cordani, U.G.; Teixeira, W. Proterozoic accretionary belts in the Amazonian Craton. In 4-D, Framework of Continental Crust; Hatcher, R.D., Jr., Carlson, M.P., McBride, J.H., Martínez-Catalán, J.R., Eds.; Geological Society of America Memoir: Boulder, CO, USA, 2000; pp. 297–320. [Google Scholar] [CrossRef]
- Assis, R.R. Depósitos Auríferos Associados AO Magmatismo Granítico do Setor Leste da Província De Alta Floresta (MT), Craton Amazônico: Tipologia das Mineralizações, Modelos Genéticos e Implicações Prospectivas. Master’s Thesis, Universidade Estadual de Campinas, Campinas, Brazil, 2011; 428p. [Google Scholar] [CrossRef]
- Moura, M.A.; Botelho, N.F.; Olívio, G.R.; Kyser, T.K. Granite-related Paleoproterozoic, Serrinha gold deposit, Southern Amazonia, Brazil: Hydrothermal alteration, fluid inclusion and stable isotope constraints on genesis and evolution. Econ. Geol. 2006, 101, 585–605. [Google Scholar] [CrossRef]
- Rodrigues, R.M. Caracterização Geológica E Metalogenética Do Depósito X1 E Província Aurífera de Alta Floresta, Região de Matupá (MT). Master’s Thesis, Universidade Estadual de Campinas, Campinas, Brazil, 2012; 70p. [Google Scholar] [CrossRef]
- Serrato, A.A.A. Geocronologia e Evolução do Sistema Hidrotermal do Depósito Aurífero de Juruena, Província Aurífera de Alta Floresta (MT). Brasil. Master’s Thesis, Universidade Estadual de Campinas, Campinas, Brazil, 2014; 83p. [Google Scholar] [CrossRef]
- Bettencourt, J.S.; Juliani, C.; Xavier, R.P.; Monteiro, L.V.; Neto, A.C.B.; Klein, E.L.; Assis, R.R.; Leite, W.B.; Moreto, C.P.; Fernandes, C.M.D.; et al. Metallogenetic systems associated with granitoid magmatism in the Amazonian Craton: An overview of the present level of understanding and exploration significance. J. S. Am. Earth Sci. 2015, 68, 22–49. [Google Scholar] [CrossRef]
- Moreton, L.C.; Martins, E.G. Geologia e Recursos Minerais de Alta Floresta. Vila Guarita. Escala 1:250.000. Brasília. In Geological Survey of Brazil; CPRM: São Paulo, Brazil, 2005; 68p. [Google Scholar]
- Gallistl, J.; Orozco, A.F.; Bücker, M. Characterization of Abandoned Mine Tailings by means of Timeand Frequency-Domain Induced Polarization Imaging. In Proceedings of the IP2016, Internacional Workshop on Induced Polarization, Aarhus, Denmark, 6–8 June 2016. [Google Scholar]
- Gouet, D.H.; Ndougsa-Mbarga, T.; Meying, A.; Assembe, S.P.; Pepogo, A.D.M.-M. Gold Mineralization Channels Identification in the Tindikala-Boutou Area (Eastern-Cameroon) Using Geoelectrical (DC & IP) Methods: A Case Study. Int. J. Geosci. 2013, 4, 643–655. [Google Scholar] [CrossRef]
- Hungerford, N. The geophysical signature of the Batman Gold Deposit, Mt Todd Project, NT. Explor. Geophys. 2018, 26, 100–105. [Google Scholar] [CrossRef]
- Martins, A.C.; Elis, V.; de Tomi, G.; Bittencourt, J.; Marin, T. Resistivity and induced polarization to support morphological modeling in limestone mining. Int. Geophys. 2016, 55, 227–238. [Google Scholar] [CrossRef]
- Oldenburg, D.W.; Yaogou, L.; Elliss, R.G. Inversion of geophysical data over a copper gold porphyry deposit: A case history for Mt Milligan. Geophysics. 1997, 62, 1419–1431. [Google Scholar] [CrossRef]
- Ware, G.H. In-situ induced-polarization and magnetic susceptibility measurements—Yerington mine. Geophysics 1979, 44, 1417–1428. [Google Scholar] [CrossRef]
- White, R.M.S.; Collins, S.; Denner, R.; Hee, R.; Brown, P. A new survey design for 3D IP inversion modelling at Copper Hill. Explor. Geophys. 2001, 32, 152–155. [Google Scholar] [CrossRef]
- Dentith, M.; Mudge, S.T. Geophysics for the Mineral Exploration Geoscientist; Cambridge University Press: New York, NY, USA, 2014; 516p. [Google Scholar]
- Sumner, J.S. Principle of Induced Polarization for Geophysical Exploration; Elsevier: Amsterdam, The Netherlands, 1976; 277p. [Google Scholar]
- Telford, W.M.; Geldart, L.P.; Sheriff, R.E. Applied Geophysicis; Cambridge University Press: New York, NY, USA, 1990; 770p. [Google Scholar]
- McNeill, J.D. Use of Electromagnetic Methods for Groundwater Studies. In Investigations in Geophysics No. 5, Geotechnical and Enviromental Geophysics, Vol. I: Review and Tutorial; Ward, S.H., Ed.; Society of Exploration Geophysicists: Houston, TX, USA, 1990; pp. 147–189. [Google Scholar] [CrossRef]
- Arifin, M.H.; Kayode, J.S.; Izwan, M.K.; Zaid, H.A.H.; Hussin, H. Data for the potential gold mineralization mapping with the applications of Electrical Resistivity Imaging and Induced Polarization geophysical surveys. Data Brief 2019, 22, 830–835. [Google Scholar] [CrossRef] [PubMed]
- Okada, K. Geophysical exploration for epithermal gold deposits: Case studies from the Hishikari Gold Mine, Kagoshima, Japan. Explor. Geophys. 1995, 26, 78–83. [Google Scholar] [CrossRef]
- GEOTOMO. RES2DINV Version 3.59 for Windows XP/Vista/7, Rapid 2D Resistivity and IP Inversion Using the Least-Squares Method; User’s Manual; Geotomo: Penang, Malaysia, 2010; 148p.
- Griffiths, D.H.; Barker, R.D. Two-dimensional resistivity imaging and modelling in areas of complex geology. J. Appl. Geophys. 2013, 29, 211–226. [Google Scholar] [CrossRef]
Figure 1.
Geotectonic map of the Amazonian Craton: (
A) modified after [
29]; (
B) modified after [
32]; highlighting the limits of the Alta Floresta Gold Province (PAAF).
Figure 1.
Geotectonic map of the Amazonian Craton: (
A) modified after [
29]; (
B) modified after [
32]; highlighting the limits of the Alta Floresta Gold Province (PAAF).
Figure 2.
Overview map locating the eastern portion of the Alta Floresta Gold Province (PAAF) in the State of Mato Grosso (MT), Brazil, with the locations of the gold mines surveyed in this work.
Figure 2.
Overview map locating the eastern portion of the Alta Floresta Gold Province (PAAF) in the State of Mato Grosso (MT), Brazil, with the locations of the gold mines surveyed in this work.
Figure 3.
Geological map of the eastern portion of the PAAF with the locations of the gold mines surveyed in this work [
7].
Figure 3.
Geological map of the eastern portion of the PAAF with the locations of the gold mines surveyed in this work [
7].
Figure 4.
(A) Description of boreholes drilled in the surveyed mines. (B) Maps with the locations of boreholes drilled in the mines: (B1) Raimunda gold mine, (B2) Truilio gold mine, and (B3) Porteira gold mine.
Figure 4.
(A) Description of boreholes drilled in the surveyed mines. (B) Maps with the locations of boreholes drilled in the mines: (B1) Raimunda gold mine, (B2) Truilio gold mine, and (B3) Porteira gold mine.
Figure 5.
Photographs of (A) sulfide quartz shaft (vein) exposed on surface; (B) sulfide quartz shaft deep inside a shaft; (C) sulfide quartz shaft in detail; (D) monzogranite block extracted from within a shaft; and (E) free gold quartz shaft sample.
Figure 5.
Photographs of (A) sulfide quartz shaft (vein) exposed on surface; (B) sulfide quartz shaft deep inside a shaft; (C) sulfide quartz shaft in detail; (D) monzogranite block extracted from within a shaft; and (E) free gold quartz shaft sample.
Figure 6.
Locations of geoelectric sections made in the gold mines: 1—Raimunda; 2—Porteira; 3—Truilio.
Figure 6.
Locations of geoelectric sections made in the gold mines: 1—Raimunda; 2—Porteira; 3—Truilio.
Figure 7.
Graphical representation of electrical resistivity and chargeability data acquisition scheme used in the field and photos illustrating geophysical instrumentation (electric generator, transmitter, and receiver).
Figure 7.
Graphical representation of electrical resistivity and chargeability data acquisition scheme used in the field and photos illustrating geophysical instrumentation (electric generator, transmitter, and receiver).
Figure 8.
Photos showing some geoelectric data acquisition stages in the surveyed mines: (A) electric transmitter in operation; (B) data receiver and porous electrode used for recording electrical potential; (C) excavated trench for protection of electrical cables; (D) receiver operation in the field area; (E) tent mounted on a truck for protection of electric transmitter; (F) caves bypassed during the measurements; (G) open pathway in palm forest; (H) aerial transposition of electrical cables over a body of water; (I) open pathway in pasture area; and (J) mounting electrodes in a closed forest area.
Figure 9.
Schematic representation of the quadratic waveform of electric current flow and electrical potential emitted and recorded during a geophysical investigation of induced polarization: (A) waveform of the electric current; (B) electric potential waveform with the definition of the maximum, secondary, and limit potentials; (C) voltage decay curve indicating intervals used in calculating chargeability.
Figure 10.
Schematic for acquisition and processing of data and creation of a geophysical model for resistivity (RES) and induced polarization (IP).
Figure 10.
Schematic for acquisition and processing of data and creation of a geophysical model for resistivity (RES) and induced polarization (IP).
Figure 11.
Results for line 04 of Raimunda gold mine (L4RM): (A) resistivity profile; (B) chargeability profile; (C) geophysical model with borehole.
Figure 11.
Results for line 04 of Raimunda gold mine (L4RM): (A) resistivity profile; (B) chargeability profile; (C) geophysical model with borehole.
Figure 12.
Results for Raimunda gold mine chargeability profile with continuity projection of mineralized zone.
Figure 12.
Results for Raimunda gold mine chargeability profile with continuity projection of mineralized zone.
Figure 13.
Results of line 01 for Truilio gold mine (L1TR): (A) resistivity profile; (B) chargeability profile; (C) geophysical model with borehole.
Figure 13.
Results of line 01 for Truilio gold mine (L1TR): (A) resistivity profile; (B) chargeability profile; (C) geophysical model with borehole.
Figure 14.
Result for Truilio gold mine chargeability profile with continuity projection of mineralized zone.
Figure 14.
Result for Truilio gold mine chargeability profile with continuity projection of mineralized zone.
Figure 15.
Results for line 03 of Porteira gold mine (L3PR): (A) resistivity profile; (B) chargeability profile; (C) geophysical model with boreholes.
Figure 15.
Results for line 03 of Porteira gold mine (L3PR): (A) resistivity profile; (B) chargeability profile; (C) geophysical model with boreholes.
Figure 16.
Result for line 02 of Porteira gold mine (L2PR): (A) resistivity profile; (B) chargeability profile; (C) geophysical model with borehole.
Figure 16.
Result for line 02 of Porteira gold mine (L2PR): (A) resistivity profile; (B) chargeability profile; (C) geophysical model with borehole.
Table 1.
Values measured for resistivity and chargeability for Raimunda gold mine.
Table 1.
Values measured for resistivity and chargeability for Raimunda gold mine.
| RESISTIVITY—Raimunda Gold Mine (RM) |
|---|
| Line | N. of Samples | Mean (ohm.m) | Standard Deviation
(ohm.m) | Mean Absolute Deviation
(ohm.m) | Median
(ohm.m) | Maximum
(ohm.m) |
|---|
| L1RM | 260 | 1466.82 | 2298.88 | 1375.62 | 633.61 | 15,775.60 |
| L2RM | 244 | 1903.53 | 2450.98 | 1731.07 | 935.41 | 13,100.10 |
| L3RM | 139 | 1881.69 | 3019.27 | 1757.92 | 833.27 | 19,439.00 |
| L4RM | 226 | 1527.96 | 2520.88 | 1541.39 | 594.81 | 17,814.20 |
| CHARGEABILITY—Raimunda Gold Mine (RM) |
| Line | N. of Samples | Mean (mV/V) | Standard Deviation
(mV/V) | Mean Absolute Deviation
(mV/V) | Median
(mV/V) | Maximum
(mV/V) |
| L1RM | 260 | 12.86 | 14.42 | 10.30 | 6.88 | 96.44 |
| L2RM | 244 | 13.70 | 10.00 | 8.15 | 10.66 | 38.93 |
| L3RM | 140 | 10.23 | 9.33 | 7.86 | 8.05 | 44.09 |
| L4RM | 230 | 8.68 | 9.06 | 6.86 | 5.93 | 52.87 |
Table 2.
Values measured for resistivity and chargeability for Truilio gold mine.
Table 2.
Values measured for resistivity and chargeability for Truilio gold mine.
| RESISTIVITY—Truilio Gold Mine (TR) |
|---|
| Line | N. of Samples | Mean (ohm.m) | Standard Deviation
(ohm.m) | Mean Absolute Deviation
(ohm.m) | Median
(ohm.m) | Maximum
(ohm.m) |
|---|
| L1TR | 245 | 382.74 | 271.59 | 204.88 | 294.54 | 1779.96 |
| L2TR | 242 | 929.98 | 1587.99 | 927.25 | 394.98 | 11,739.71 |
| L3TR | 263 | 818.17 | 1366.96 | 773.46 | 410.37 | 9505.49 |
| CHARGEABILITY—Truilio Gold Mine (TR) |
| Line | N. of Samples | Mean (mV/V) | Standard Deviation
(mV/V) | Mean Absolute Deviation
(mV/V) | Median
(mV/V) | Maximum
(mV/V) |
| L1TR | 227 | 8.75 | 7.75 | 4.21 | 7.15 | 87.21 |
| L2TR | 219 | 8.68 | 7.93 | 4.04 | 7.31 | 69.21 |
| L3TR | 248 | 8.94 | 5.54 | 4.01 | 7.31 | 32.26 |
Table 3.
Values measured for Resistivity and Chargeability for the Porteira gold mine.
Table 3.
Values measured for Resistivity and Chargeability for the Porteira gold mine.
| RESISTIVITY—Porteira Gold Mine (TR) |
|---|
| Line | N. of Samples | Mean (ohm.m) | Standard Deviation
(ohm.m) | Mean Absolute Deviation
(ohm.m) | Median
(ohm.m) | Maximum
(ohm.m) |
|---|
| L1PR | 168 | 239.90 | 257.63 | 180.06 | 144.47 | 1511.00 |
| L2PR | 250 | 300.48 | 463.76 | 264.93 | 152.10 | 4552.40 |
| L3PR | 210 | 290.05 | 349.30 | 241.55 | 144.96 | 1892.20 |
| CHARGEABILITY—Porteira Gold Mine (TR) |
| Line | N. of Samples | Mean (mV/V) | Standard Deviation
(mV/V) | Mean Absolute Deviation
(mV/V) | Median
(mV/V) | Maximum
(mV/V) |
| L1PR | 168 | 10.43 | 13.46 | 9.35 | 5.57 | 98.65 |
| L2PR | 250 | 7.60 | 7.16 | 5.70 | 4.28 | 30.73 |
| L3PR | 210 | 6.46 | 7.93 | 5.22 | 3.92 | 42.15 |
| Disclaimer/Publisher’s Note: The statements, opinions and data contained in all publications are solely those of the individual author(s) and contributor(s) and not of MDPI and/or the editor(s). MDPI and/or the editor(s) disclaim responsibility for any injury to people or property resulting from any ideas, methods, instructions or products referred to in the content. |
© 2023 by the authors. Licensee MDPI, Basel, Switzerland. This article is an open access article distributed under the terms and conditions of the Creative Commons Attribution (CC BY) license (https://creativecommons.org/licenses/by/4.0/).


 ,
, 


