1. Introduction
The vibrational dynamics of solids is of exceptional importance for a wide variety of their potential applications, but also from a fundamental scientific perspective [
1,
2,
3]. Even very basic efforts to interpret their vibrational spectra have necessarily been based on mostly empirical approaches. The observation of a band in the vibrational spectrum of solids indicates only a certain difference in vibrational energy levels but does not reveal anything concerning the very nature of these levels. To provide a more exact basis for the interpretation of the experimental vibrational spectroscopy data, it is possible to carry out a periodic DFT calculation of the Hessian at the stationary point located on the studied potential energy hypersurface (PES) [
4]. The subsequent diagonalization of the mass-weighted Hessian leads to harmonic eigenvalues and eigenvectors. Though such analysis is very useful and certainly provides fundamental insights into the nature of vibrational transitions in the solid-state system, one should keep in mind that it is performed within the
harmonic approximation. Thus, it does not include any effects due to anharmonicity, which involve the intermode coupling effects as well [
1,
2,
3], that are, on the other hand, essential for an in-depth understanding of, e.g., energy and information transport phenomena ([
1,
2,
3] and references therein).
An excellent method that enables the significant extension of spectroscopic techniques, in the sense of obtaining new information related not only to the band assignments but also to the sequential order of changes upon the action of a certain external perturbation, is the so-called two-dimensional correlation approach, devised initially by Noda for a range of specific applications [
5,
6], and later generalized for essentially any spectroscopic technique [
7,
8,
9]. The generalized 2D COS approach has been applied to a range of problems by the thorough analysis of the experimental spectroscopic data ([
10,
11,
12,
13,
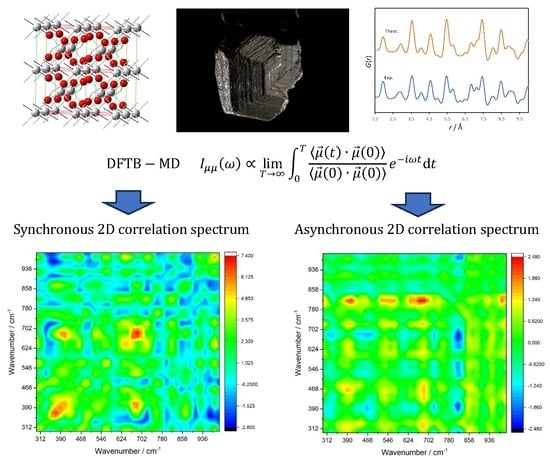
14] and references therein). In the present study, we extend the applicability of the generalized 2D COS technique to an analysis of data generated by molecular dynamics simulations, using temperature as an external perturbation parameter. We calculate the IR spectra of a solid-state system from a sequence of molecular dynamics simulations carried out at a series of different temperatures followed by the analysis of the corresponding dipole moment autocorrelation functions. Such generated temperature-perturbed anharmonic IR spectra were further subjected to the generalized 2D correlation analysis. This theoretical approach enables us to obtain in-depth insights into the temperature perturbation-induced changes in the anharmonic vibrational force field in the studied solid-state system. Moreover, we derive further conclusions concerning the sensitivity of vibrational modes on temperature-induced perturbations to the system as well as conclusions related to intermode coupling effects. In combination with the more standard single-point harmonic vibrational analysis, our approach enables the derivation of more profound insights into the even more intricate aspects of the vibrational dynamics of solid-state systems.
As a particular solid-state system, for the current study, we have chosen one of the polymorphic modifications of titanium dioxide (TiO
2)—rutile. Aside from its relevance as a naturally occurring mineral (rutile modification is the most abundant form of TiO
2 occurring in nature) [
15], there has been significant interest in this polymorph due to its use in industry and contemporary high technology [
16]. Its conventional applications (dominantly as a white pigment) have been mostly based on the high refractive index in monocrystals and the opacifying power in high surface area forms (e.g., in microcrystalline or nanocrystalline form). More recent developments, however, have relied on the photocatalytic activity of this material [
16,
17,
18,
19]. In the mineralogical context, a relatively new method of laser ablation ICP-MS (inductively coupled plasma mass spectrometry) has enabled studies of microscopic rutile inclusions for the identification of rutile-containing rock types [
20]. This information can reveal important knowledge related to the mechanism of formation of the studied specimen, the changes in local temperatures and pressures to which the specimen had been exposed as well as to their lifecycles [
20].
2. Computational Details, Materials and Methods
The computational protocol in the present study consists of two phases. In the first phase, a series of molecular dynamics simulations of the title system have been carried out at different temperatures. Subsequently, on the basis of computed dipole moment autocorrelation functions at each temperature, the theoretical anharmonic infrared (IR) spectral response functions were calculated. In the second phase, the temperature-dependent IR spectra were analyzed employing the technique of generalized two-dimensional correlation analysis (also known as generalized two-dimensional correlation spectroscopy—GEN-2DCOS). The synchronous and asynchronous 2D correlation spectra are generated and analyzed to obtain insights into the temperature-perturbed vibrational dynamics of the studied system.
2.1. Density Functional Tight Binding Formalism
All calculations in the present study have been carried out within the density functional tight binding formalism (DFTB [
21,
22]). Despite the approximations inherent to the method, DFTB is the method of choice whenever the studied system has a large number of atoms due to its affordable computational cost. Besides, the latest methodology developments within the DFTB formalism have thoroughly improved its accuracy, which has made it a viable alternative to DFT ([
21,
22] and references therein).
The particular variant of DFTB that we implement for the purpose of the present study is the self-consistent charge (SCC) DFTB, or the
second order DFTB-DFTB2 [
23]. In this approach, the total electronic energy is expanded in Taylor series up to the
second order with respect to charge fluctuations [
23]:
In this equation,
cμi and
cvi denote the wavefunction expansion coefficients, while
are Hamiltonian matrix elements. The key terms in (1), Δ
qa and Δ
qb, represent the charge fluctuation at atoms
a and
b;
is, on the other hand, the short-range repulsive energy term (between the centers denoted with
a and
b). The central contribution to the energy inherent to the DFTB2 approach in (1) is
In (2), the
γ–function represents the Coulomb repulsion taking place between the corresponding density fluctuations for spherically constrained atomic densities. Its analytical form is usually represented as
In the last equation, S is a short-range function which has been introduced to provide a correct convergence behavior of γ as rab approaches zero; h, on the other hand, is a damping function.
DFTB is, in general, an approximate scheme based on the original Kohn–Sham DFT approach [
21,
22,
23]. It owes its computational efficiency to the fact that the evaluation of the Hamiltonian matrix elements is performed using the minimal basis set (which consists of pseudo-atomic orbitals), relying on the two-center approximation. Within the Slater–Koster approach, the precomputed values of
Hμv and the values of the overlap matrix elements are tabulated for different distances. To find the coefficients in the LCAO-MO (linear combination of atomic orbitals–molecular orbitals), expansion of the solutions of the Kohn–Sham secular-type equations are sought, which have the following form:
In (4), Sμv denotes the overlap matrix element; the Hamiltonian matrix elements Hμv explicitly depend on the Mulliken charges, which are, in turn, dependent on the MO coefficient, so that the need for a self-consistent solution of (4) becomes obvious.
All DFTB computations in the present study were performed with the DFTB+ code [
24], using the matsci-0-3 Slater-Koster parameter set [
25]. This set has been obtained by a specific parametrization for solid state and materials science simulations. To optimize the atomic positions within the unit cell of the studied 3D periodic system, we have employed the rational function-based optimization algorithm. In order to make a proper choice of the Monkhorst–Pack grid [
26] for
k-point sampling, careful testing has been carried out, controlling both the convergence of energy (which was better than 10
−4 eV) as well as geometry. The productive calculations have been performed with the Γ—point centered 8 × 8 × 8 Monkhorst–Pack grid. The SCC tolerance was set to 10
−8 a.u. in the course of geometry optimizations and at 10
−8 a.u. for Hessian computations as well as during the molecular dynamics simulations.
2.2. Molecular Dynamics Simulations
Molecular dynamics (MD) simulations have been carried out within the microcanonical (
NVE) and canonical (
NVT) ensembles at the following series of temperatures: 150, 225, 300, 375, 450, 525 and 600 K. All MD simulations were started from the minimum on the studied potential energy hypersurface of the 3D periodic system.
NVT simulations were performed using the Nose–Hoover thermostat, with a coupling strength set to the highest harmonic vibrational frequency of the system calculated by diagonalization of the Hessian matrix at minimum energy point.
NVE simulations were carried out by stochastic initial distribution of atomic velocities corresponding to Maxwell–Boltzmann distribution at the target temperature. Newton’s equations of motion were integrated by the velocity Verlet algorithm [
27], with a time step of 1 fs. Throughout the microcanonical
NVE simulations, we have found out that excellent equilibration is achieved within a time interval of 10 ps, which has subsequently been followed by simulation periods of up to 500 ps at each temperature. However, for production calculations, the simulation time interval of 200 ps has been shown to be quite sufficient. Temperature fluctuations were within the limits predicted on the basis of statistical physics considerations [
28].
For all further productive spectroscopic calculations, we rely on the
NVE results. This is due to the fact that we basically employ the linear response theory to calculate the IR spectra on the basis of dipole moment autocorrelation functions. In order to apply directly the fundamental equations inherent to this approach, the trajectory should, in the best-case scenario, not be distorted by any temperature correction schemes [
29].
2.3. Materials and Methods
Pure single crystals of rutile specimen from Veselčani locality (RN Macedonia) were powdered to collect the experimental IR and Raman spectrum. The PerkinElmer Spectrum 2000 FTIR interferometer (PerkinElmer, Waltham, MA, USA) was employed to obtain the IR spectrum of rutile (1000–370 cm−1) by applying KBr pellet method. The Raman spectrum (1000–100 cm−1) was collected on Horiba Jobin Yvon Labram 300 spectrometer (Horiba, Kyoto, Japan) using a red 632.81 nm He:Ne excitation laser.
3. Results and Discussion
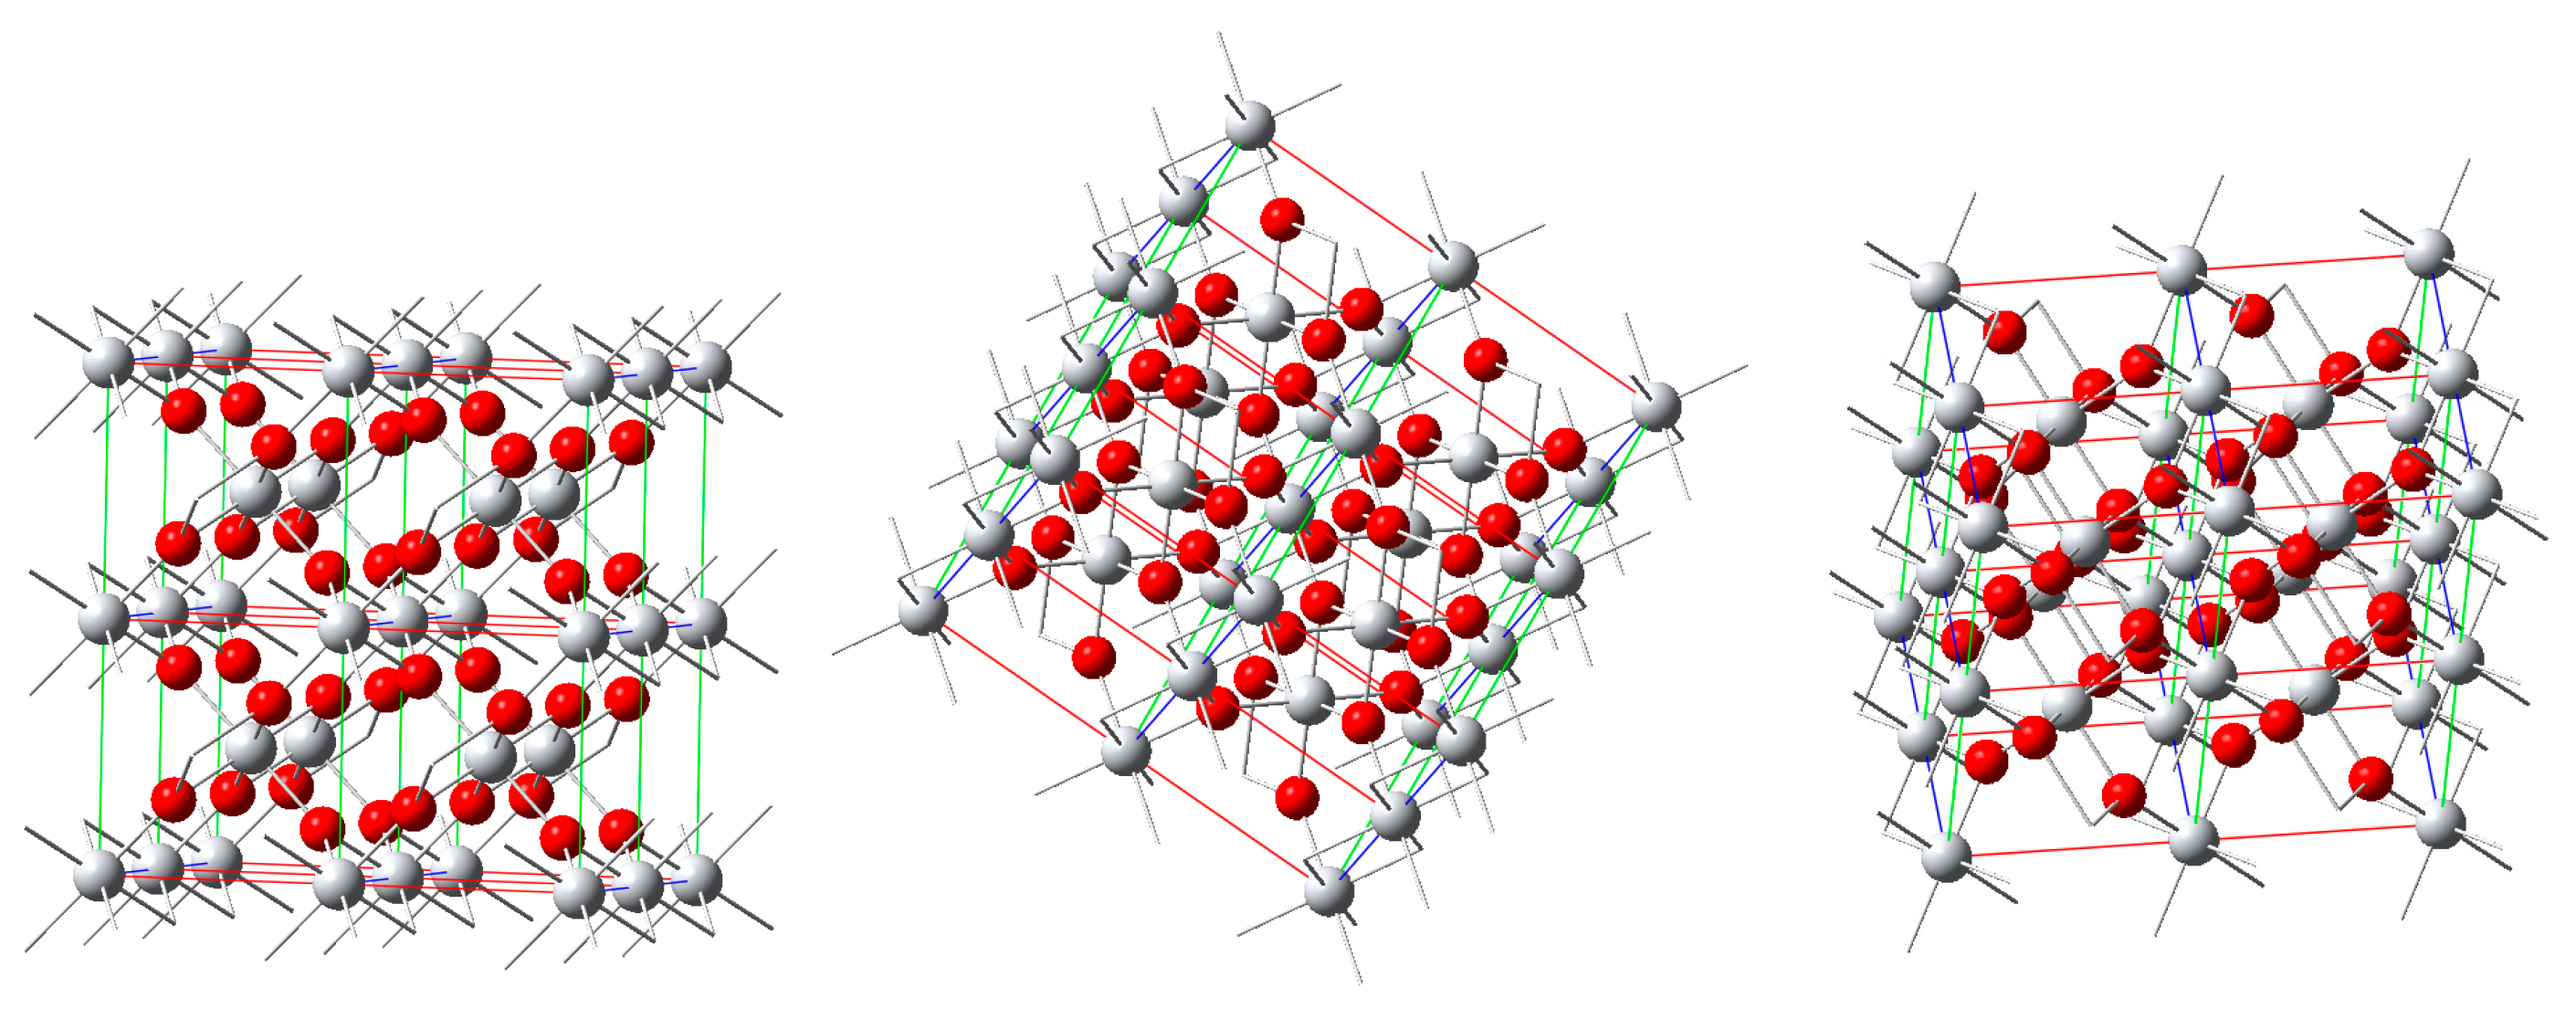
The optimized atomic positions within the crystal lattice of the rutile modification of TiO
2 are depicted in
Figure 1, in which the structure is viewed from different angles. Rutile crystallizes in the space group
P4
2/
mnm (
D4h14) and there are two formula units per unit cell.
To compare the results from our molecular dynamics simulations with the experimental structural data, we hereby employ the atomic pair distribution functions (PDFs) analysis. Atomic PDF is defined as [
30] follows:
In Equation (5),
denotes the local atomic number density,
is the corresponding average atomic number density, while
r is the radial distance. As follows from its definition,
G(
r) is a function with oscillating behavior around the zeroth value. Positive peaks of this function indicate distances that separate pairs of atoms (the local atomic number density is above the average at these points). The reduced structure function
F(
Q), which can be obtained experimentally, is related to
G(
r) through a sine-Fourier transform, i.e.,
The integration variable
Q is actually the scattering vector, defined as
where 2
θ is the angle between the incident and the scattered X-rays, while
λ is their wavelength. The reduced structure function is, on the other hand, directly related to the structure function
S(
Q) through the following expression:
The relation between
S(
Q) and the coherent X-ray scattering intensity per atom
Icoh.(
Q), expressed in electron units, is given by
In (9), ci and fi denote the atomic concentrations and the corresponding X-ray scattering factors of the atomic species with index i.
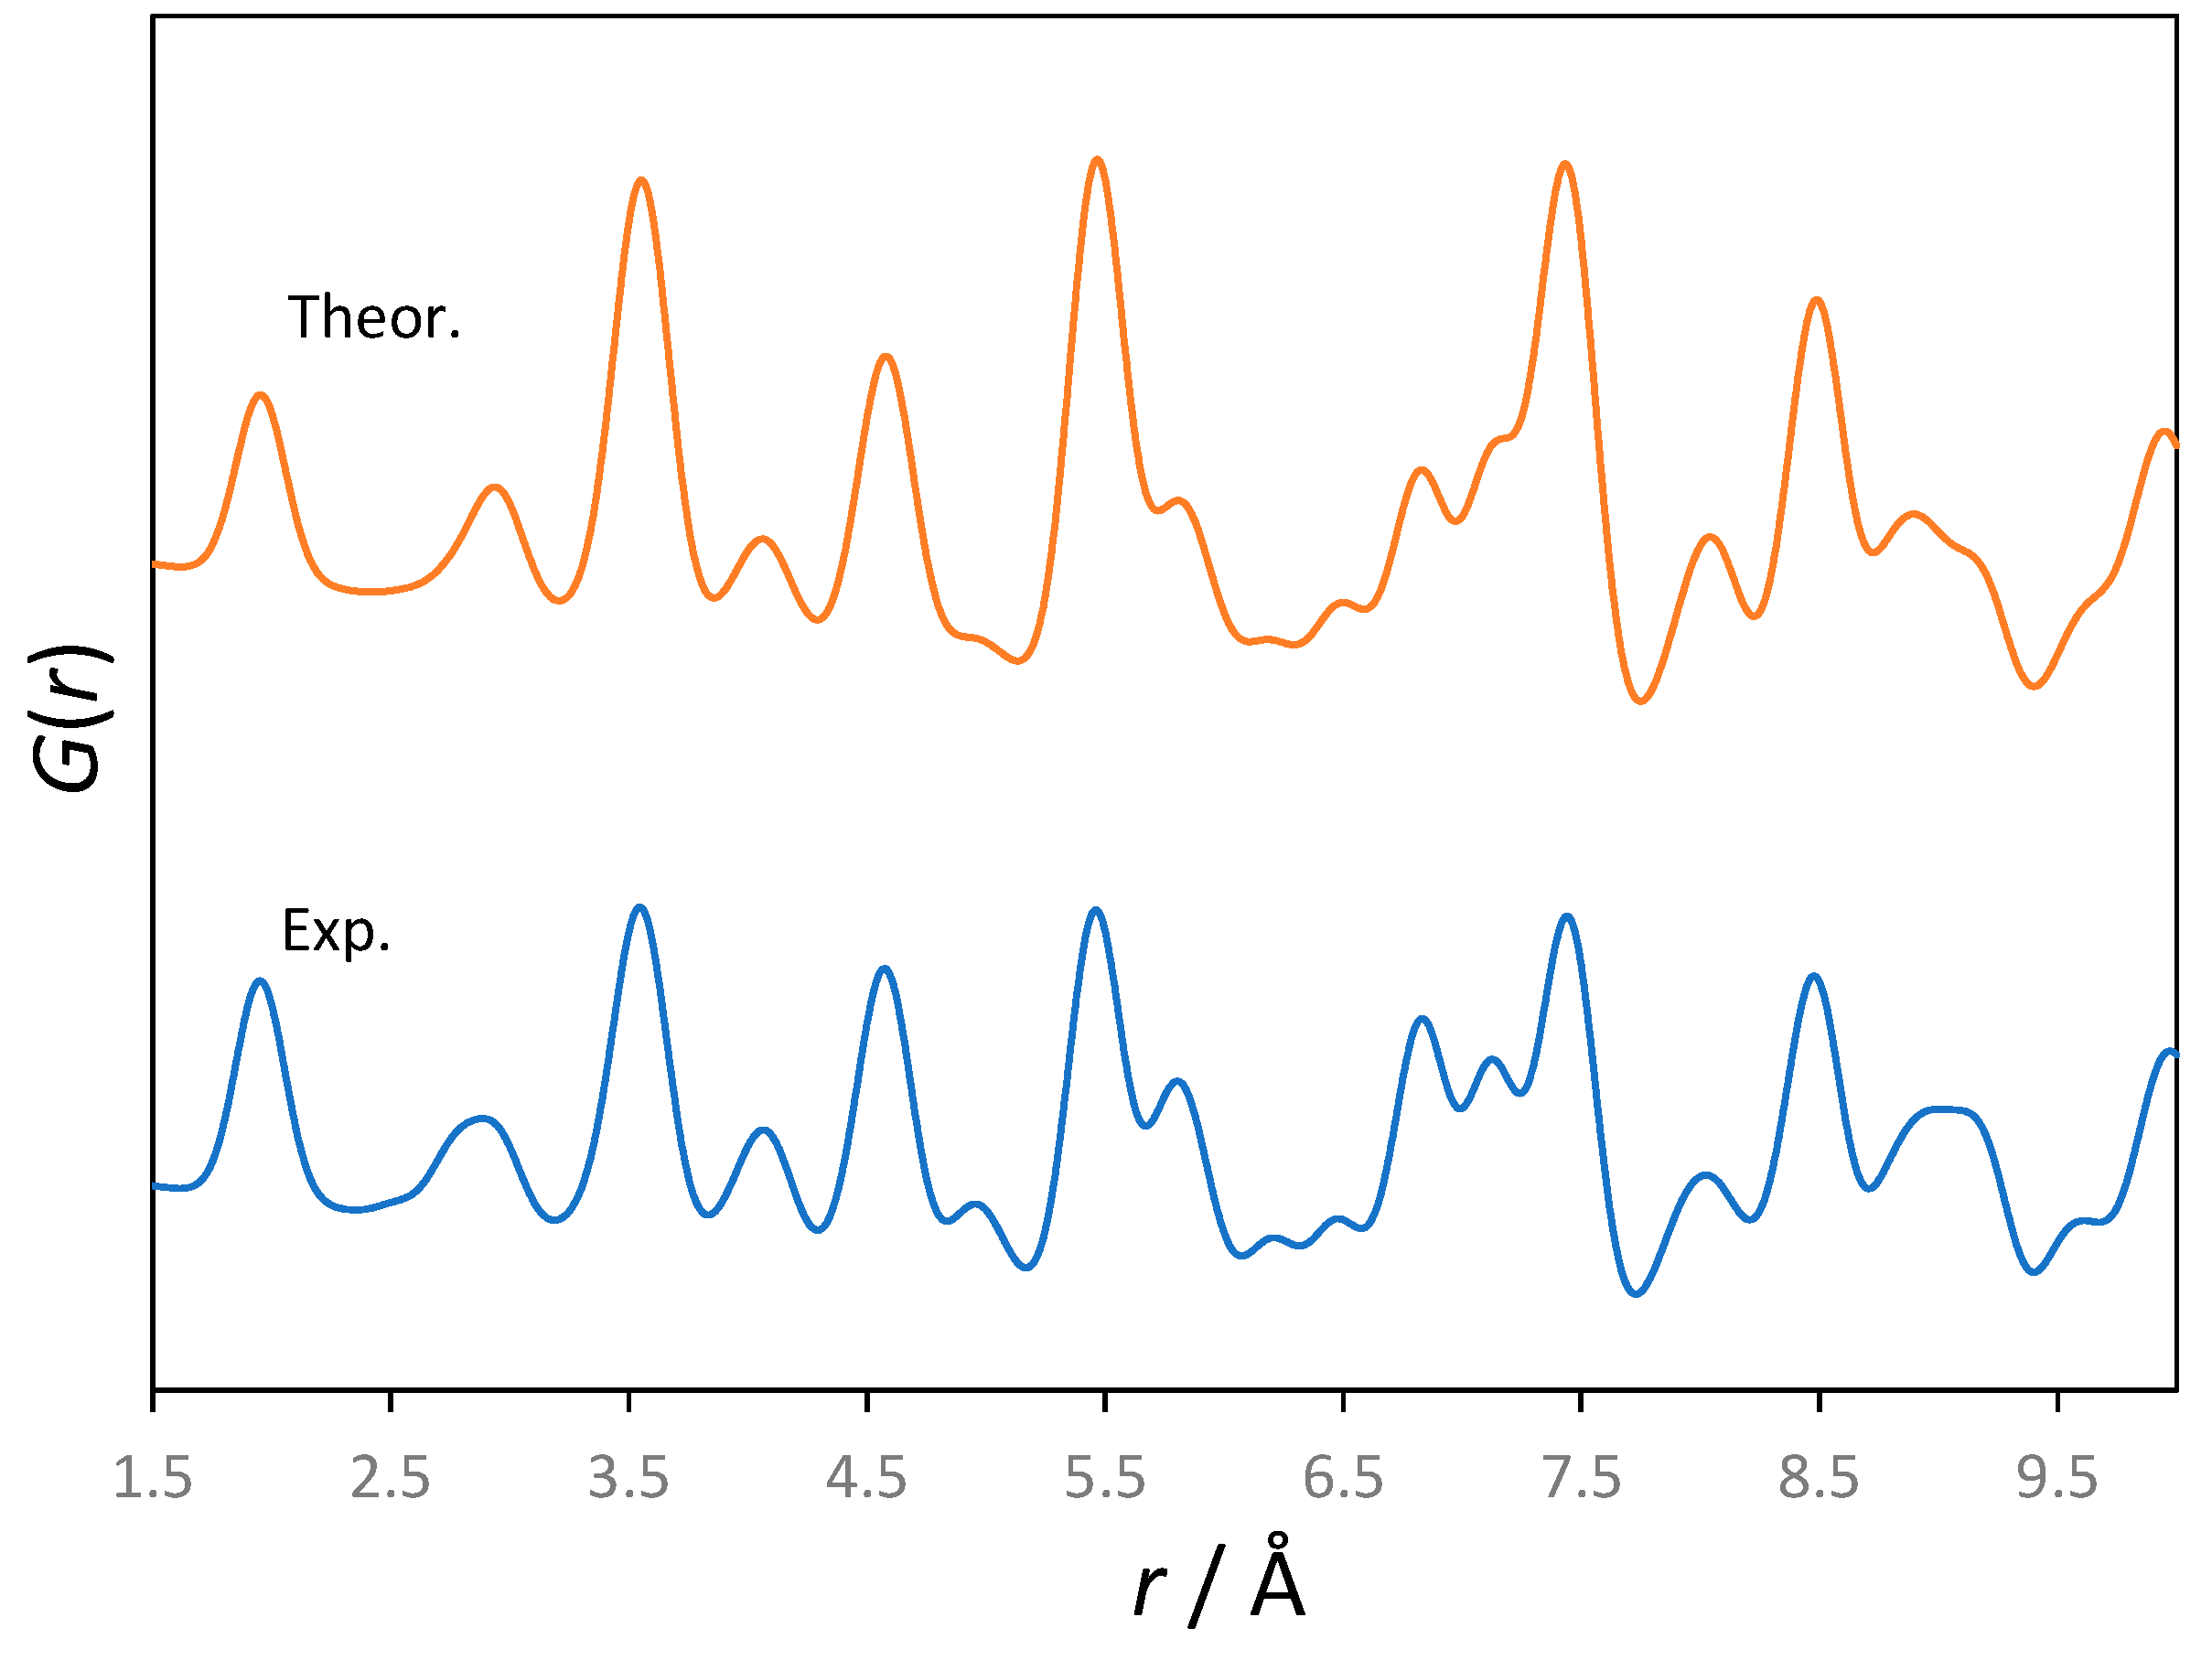
Figure 2 compares the calculated atomic PDF from the experimental powder X-ray diffraction data for rutile (TiO
2) as well as from the MD trajectory generated at 300 K.
It can be seen that the resemblance is excellent, which validates the results from the statistical physics simulations; these will be used further on to derive both harmonic and finite temperature anharmonic spectroscopic data.
Group theoretical analysis within the
k = 0 approximation leads to the following vibrational representation:
Within this centrosymmetric group, thus, there are four IR-active vibrations (A2u + 3Eu) and four Raman active ones (A1g + B1g + B2g + Eg).
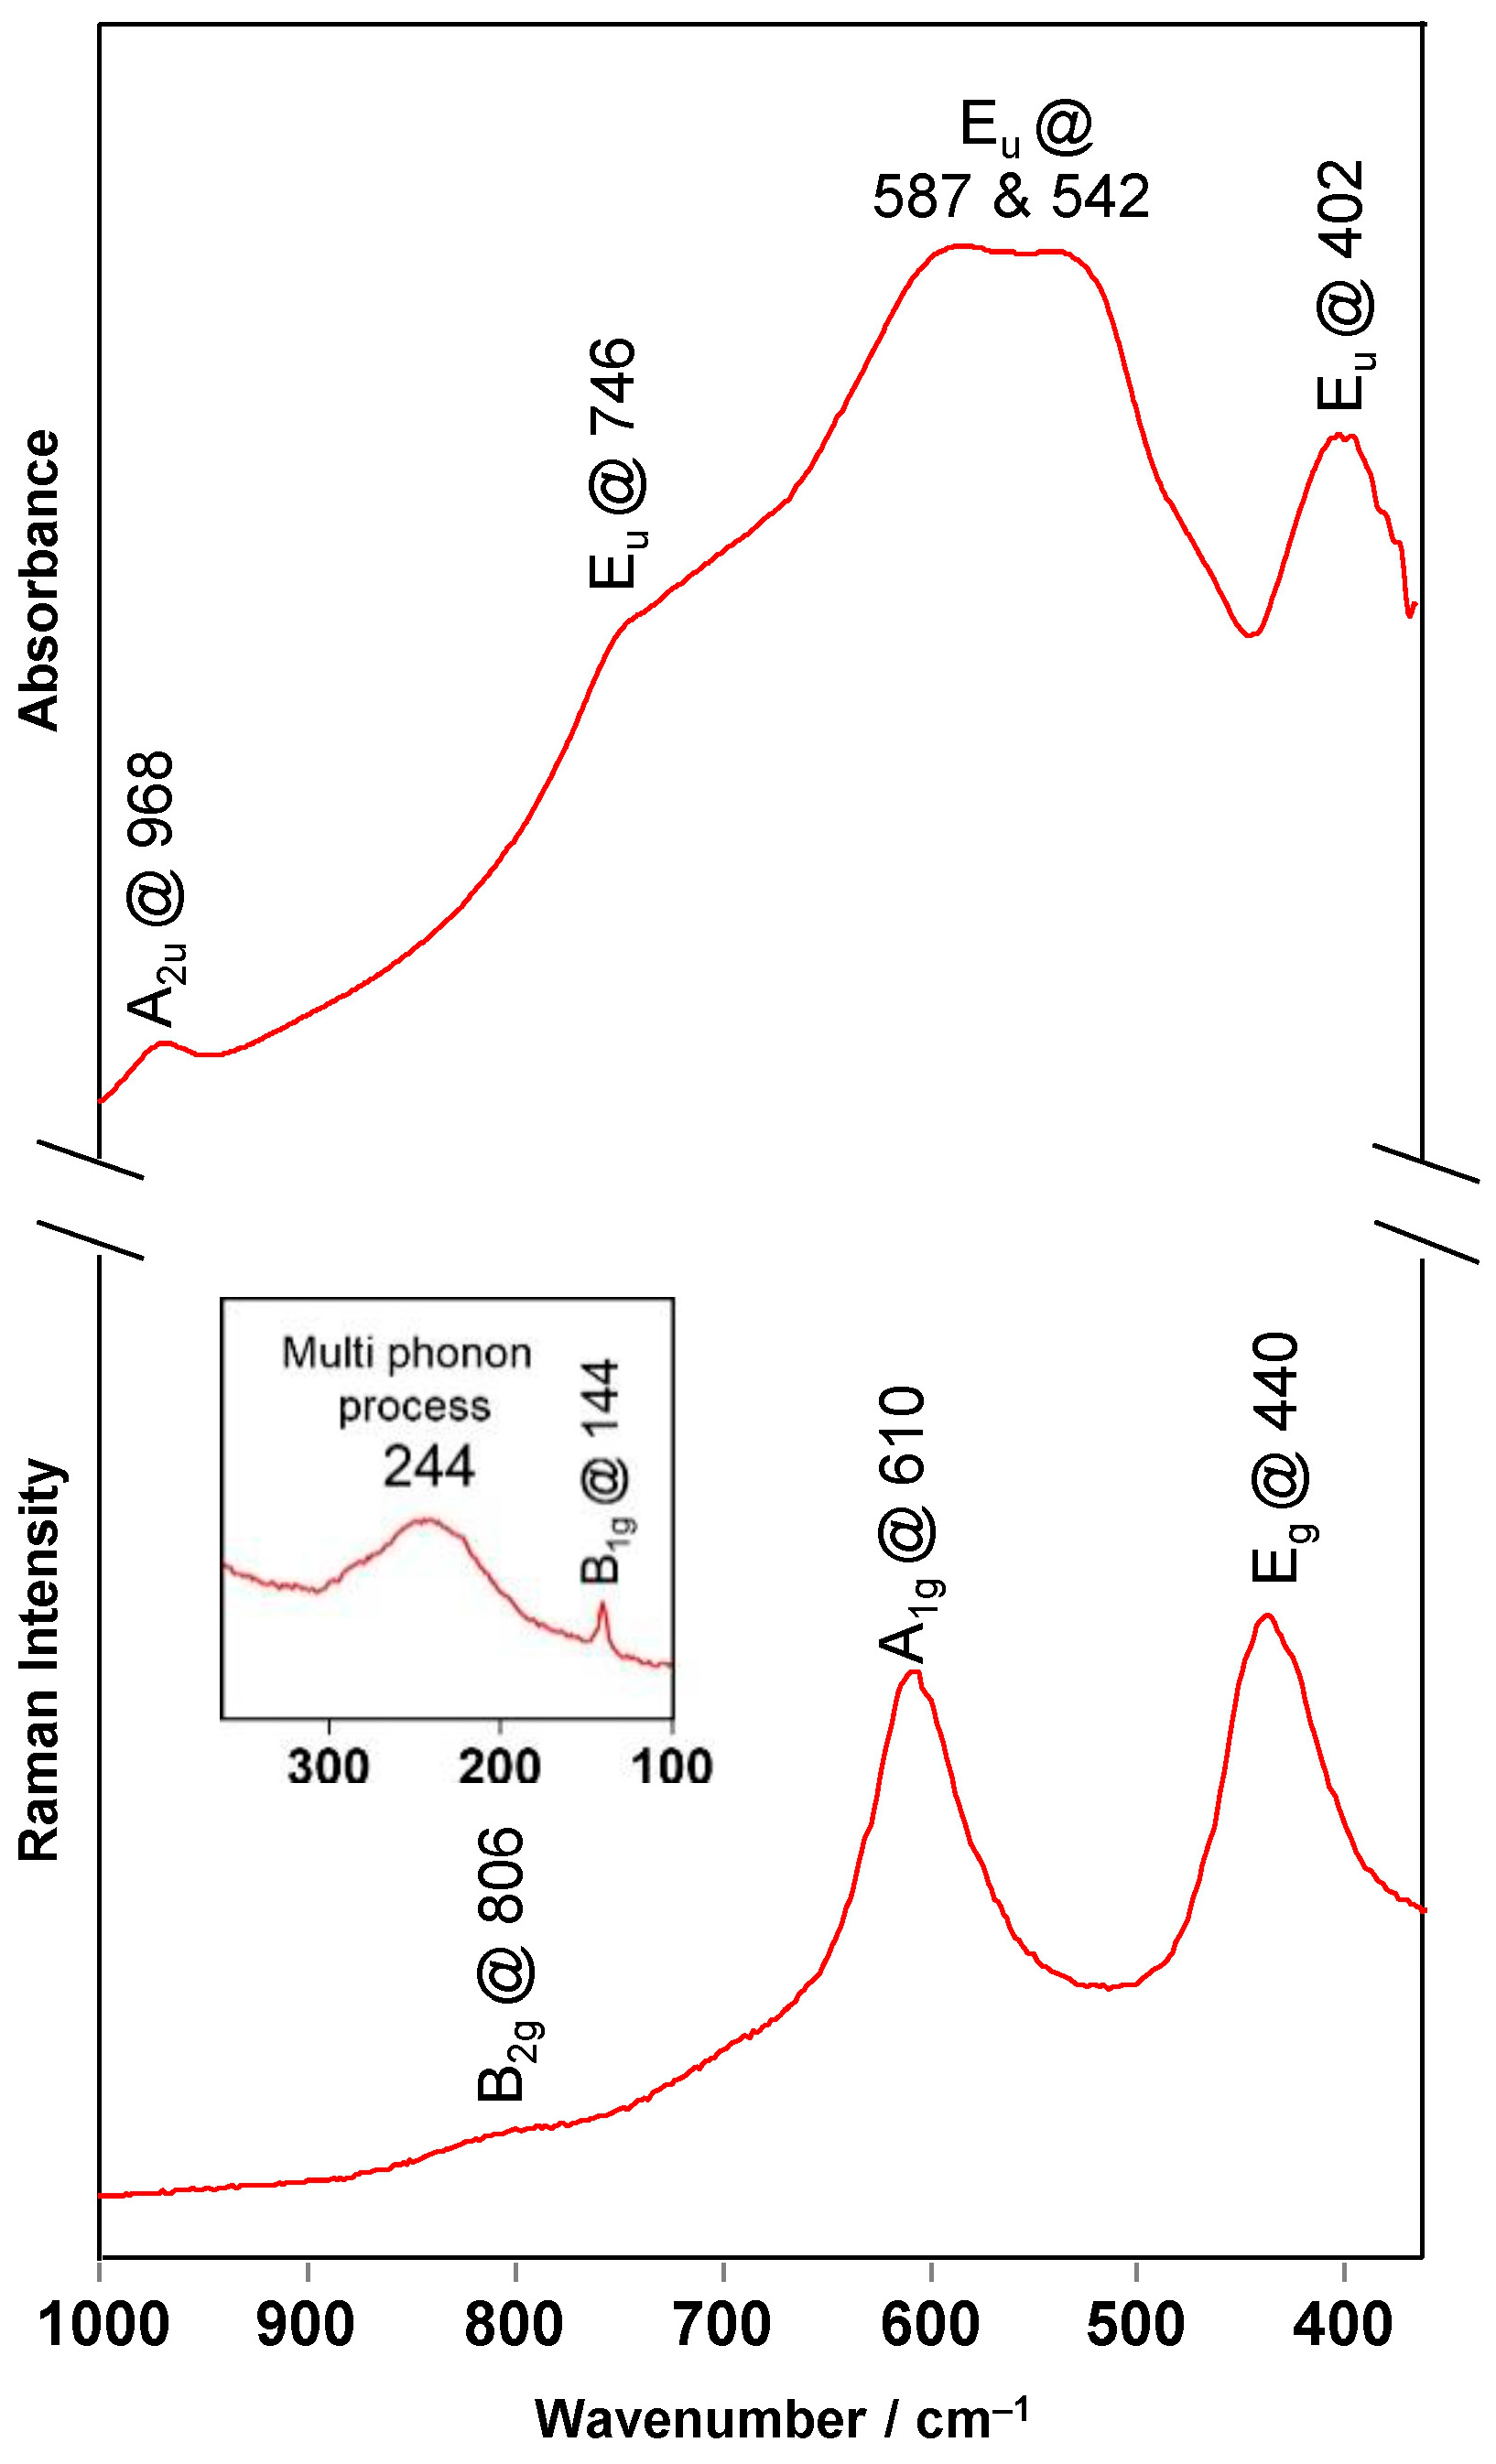
Table 1 presents the vibrational frequencies (expressed as wavenumbers) computed by harmonic vibrational analysis within the static DFTB approach, together with the corresponding ones extracted from the experimental spectra (
Figure 3). As can be seen, the agreement is quite good, which further confirms the appropriateness of the used theoretical model in the present study. The good agreement can be partially attributed to the good parametrization of the employed DFTB method, as well as to the validity of harmonic approximation at low temperatures. Note, however, that there is a rather significant variation in the positions of the experimentally reported bands for rutile in a series of different, independent experimental studies, which has been attributed to the fact that TiO
2 microcrystals exhibit polarization phenomena, resulting in much higher variability than in other oxide materials [
31,
32].
3.1. Anharmonic Spectra Generated from MD Simulations
In order to calculate the temperature-dependent IR spectra of the studied system from the DFTB MD simulations, in the present study, the time correlation functions approach has been implemented.
Strictly speaking, this approach is based on the linear response formalism [
33]. To compute the spectrum of a given type, one needs to compute the corresponding autocorrelation function using the data collected from the MD trajectory. The computed autocorrelation function is subsequently Fourier-transformed. Consider a time-dependent function
f(
t). Following the Wiener–Khintchine theorem, the autocorrelation of
f(
t) is given by
To calculate the temperature-perturbed IR vibrational spectra, in the present study, we have relied on the dipole moment autocorrelation function [
33,
34].
The dipole–dipole autocorrelation function (or, shortly, dipole moment autocorrelation function—DM-ACF) is defined with
The subscript
i in (12) ranges from 1 to the total number of atoms, while the index
j refers to the three principal Cartesian directions and ranges from 1 to 3. DM-ACF was computed using the data collected from the production (simulation) part of the DFTB MD trajectory. It was subsequently normalized with respect to the initial value
. From the normalized DM-ACF, infrared absorption cross-sections were computed by a Fourier transformation, i.e.,
All the Fourier transformations in the present study have been performed using the fast Fourier transform algorithm (FFT). Bearing in mind that all the time series have been obtained from finite length (
T < ∞) DFTB MD simulations, we have used Blackman’s window function to diminish the integrand at suitable
T values. In discrete notation, Blackman’s window is of the following form:
In
Figure 4, a typical dipole moment autocorrelation function computed from the DFTB MD simulation data at 150 K is presented.
Figure 5, on the other hand, shows a series of spectra of rutile obtained by the Fourier transformation of the dipole moment autocorrelation function computed from the MD simulation at 150 K, 300 K and 450 K. As already mentioned, due to the inherent characteristics of dynamical methods, all the computed spectra are anharmonic.
3.2. Generalized 2D Correlation Analysis
To obtain a better understanding of the anharmonic vibrational force field of solid rutile (TiO2), we have carried out a generalized two-dimensional correlation analysis of the temperature-perturbed IR spectra computed from the MD trajectories at the mentioned series of temperatures.
The external perturbation that affects our model system is the change in temperature. In this context, the “dynamic” spectrum (where
t in a general case denotes the perturbation variable, i.e., temperature in our case) is defined as [
7,
8]
In (15), (–
T/2,
T/2) is the interval of the applied external perturbation, while
denotes the reference spectrum, which we hereby define as the temperature-averaged spectrum, i.e.,
The synchronous and asynchronous 2D correlation spectra are defined with
and
In the expression (18) for the asynchronous correlation intensity, the
Nik is the Hilbert–Noda transformation matrix element:
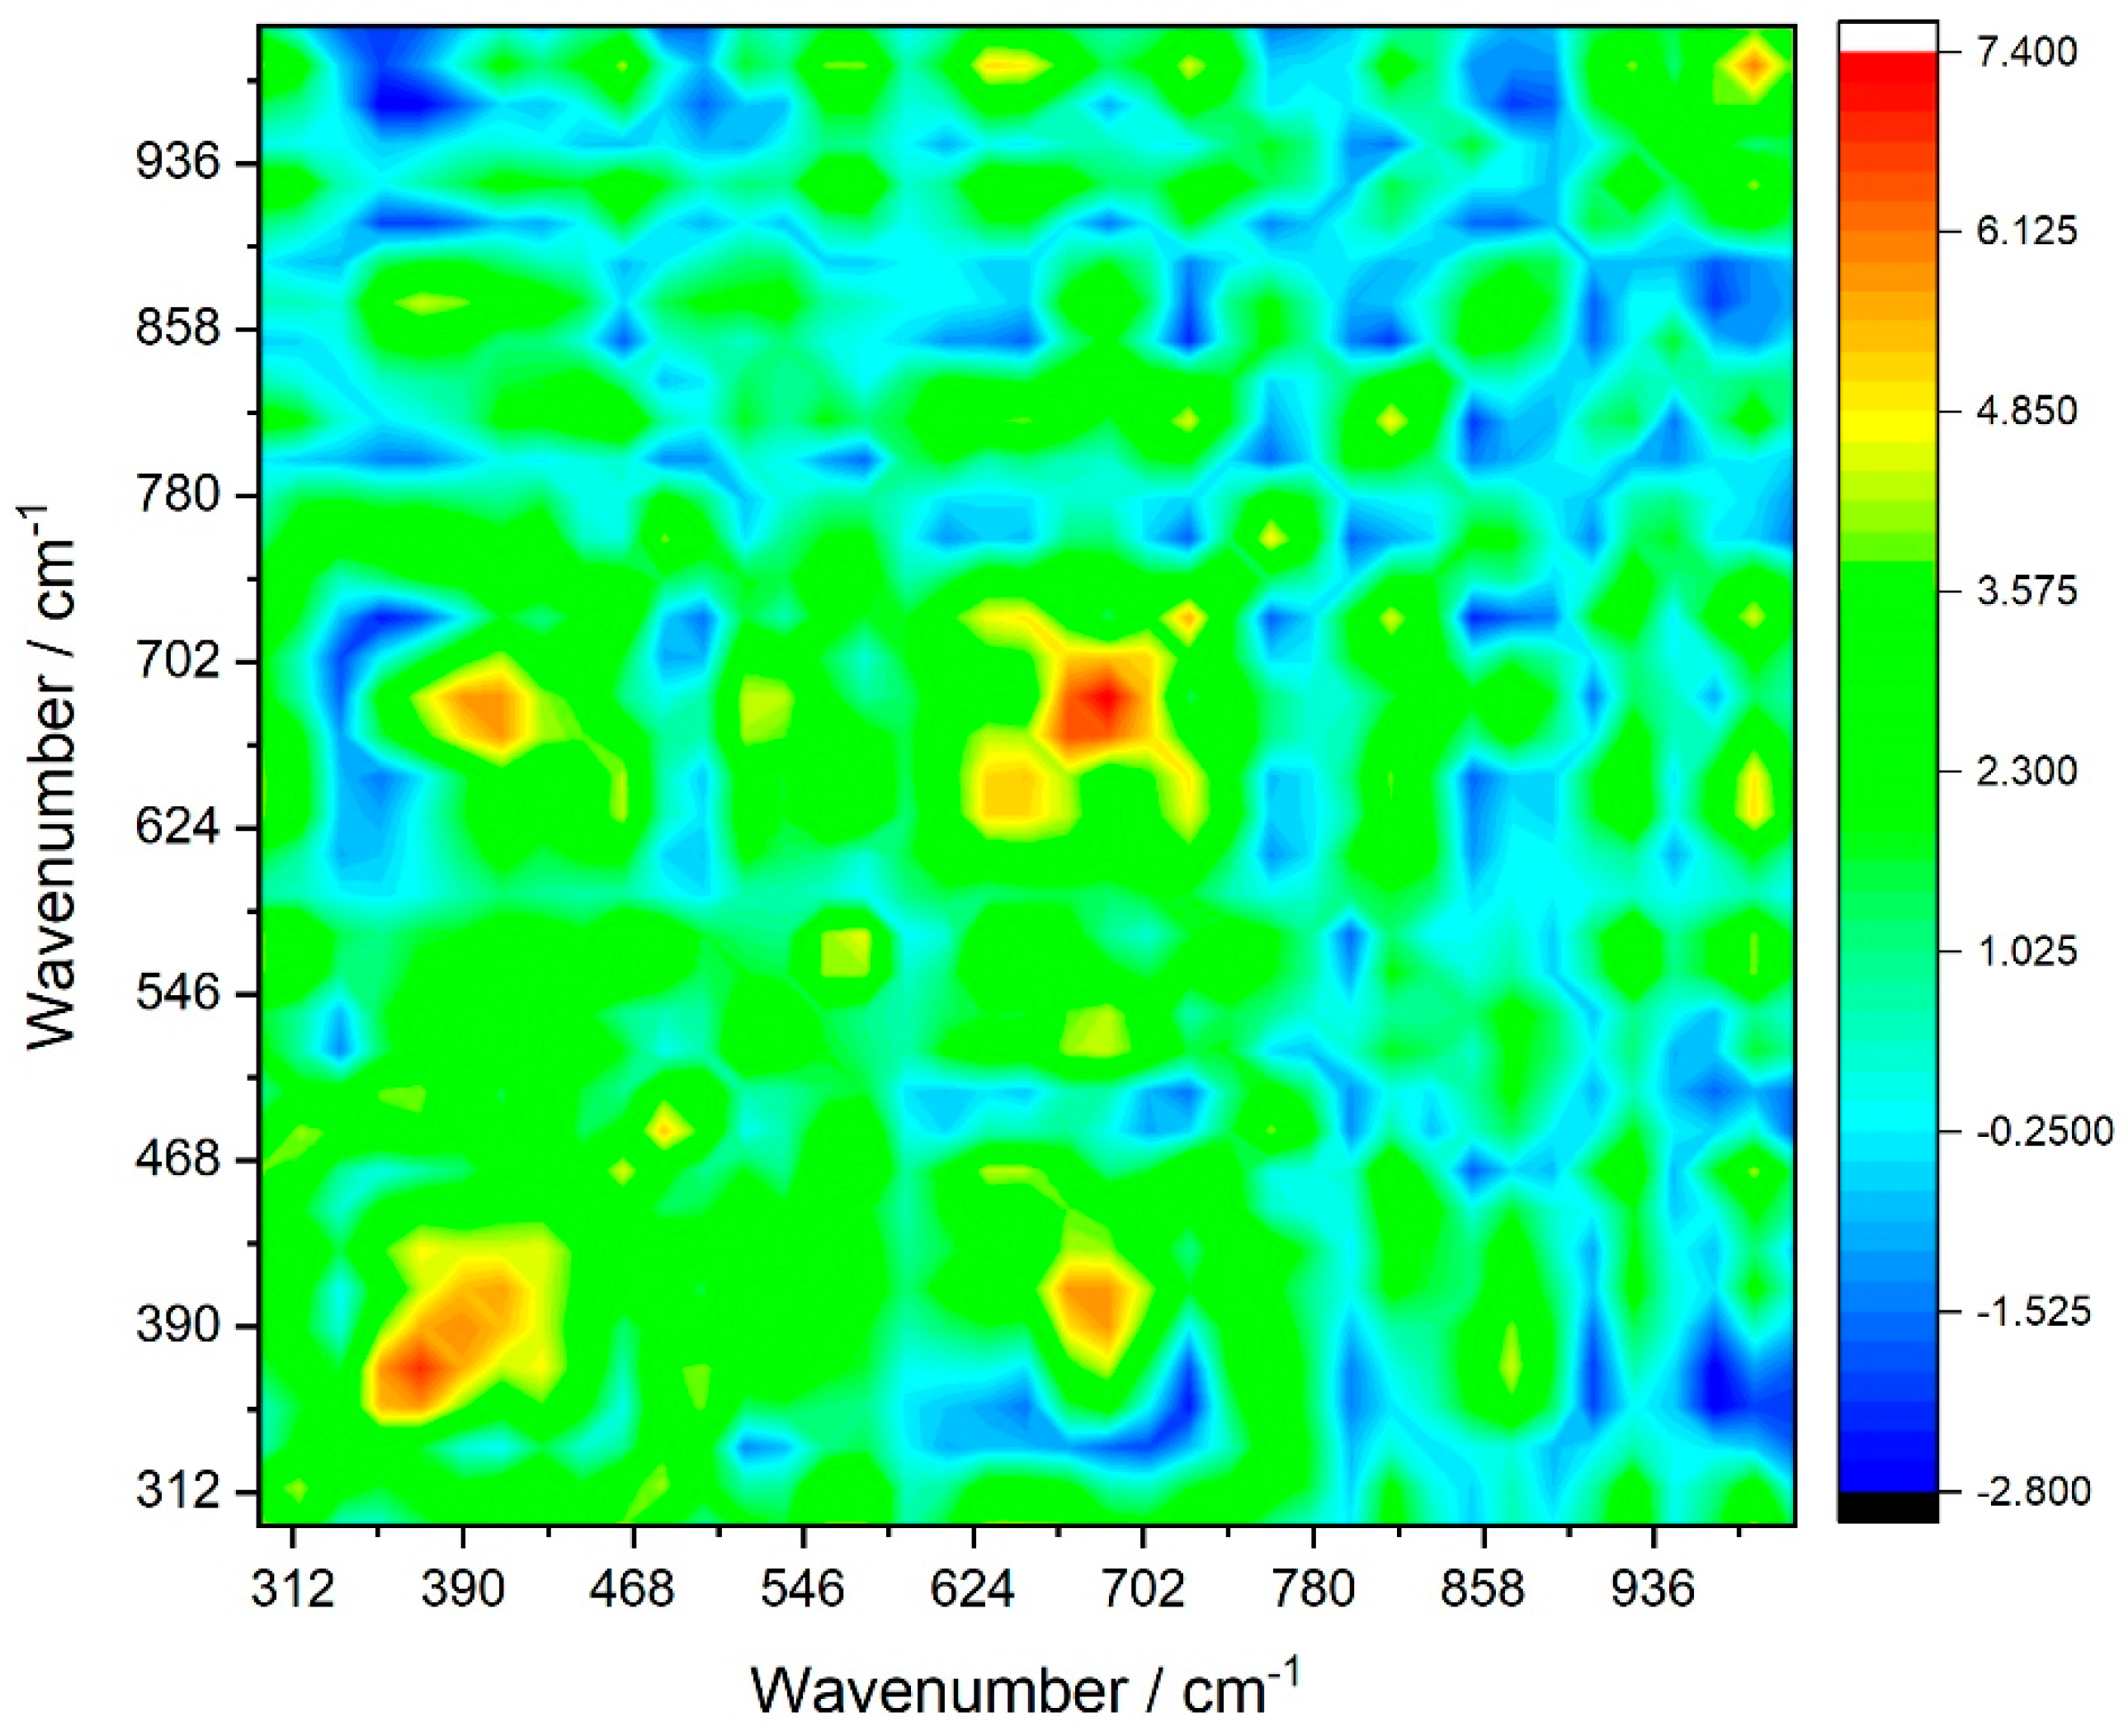
The calculated synchronous and asynchronous spectra of rutile are shown in
Figure 6 and
Figure 7.
As can be seen from
Figure 6, the most prominent features in the synchronous spectra are the auto peaks appearing at (685 cm
−1 and 685 cm
−1) corresponding to the autocorrelation of the
Eu mode, at (982 cm
−1 and 982 cm
−1), due to the
A2u mode, (370 cm
−1 and 370 cm
−1) owing to the
Eu mode, as well as at (575 cm
−1 and 575 cm
−1), due to the highest-frequency IR active
Eu fundamental mode. On the basis of the intensities of the mentioned auto peaks, we can conclude that the most sensitive to the temperature perturbation is the 685 cm
−1 Eu vibration, followed by the 370 cm
−1 Eu mode and the 982 cm
−1 A2u mode.
From the signs of the cross-peaks in the synchronous spectra, we can conclude that the 982 cm−1 A2u mode and the 575 cm−1 Eu mode undergo a synchronous change upon temperature perturbation, i.e., the mechanism governing their temperature-induced drift is the same. The same conclusion holds for the 685 cm−1 Eu mode and the 370 cm−1 Eu mode.
On the other hand, the negative cross-peak appearing at (685 cm
−1 and 982 cm
−1)—
Figure 6—is an indication that the 685 cm
−1 Eu mode and 982 cm
−1 A2u mode undergo an asynchronous change when temperature perturbation sets in. Such asynchronicity implies different mechanisms being involved in the temperature-induced shifts of the mentioned two modes. The same discussion is valid for the cross-peak at (345 cm
−1 and 982 cm
−1) arising from the temperature asynchronous coupling of the 345 cm
−1 Eu mode and the 982 cm
−1 A2u mode, as well as for the 982 cm
−1 A2u mode and the 370 cm
−1 Eu mode.
Further implementation of Noda’s rules [
7,
8] in the analysis of the generalized 2D correlation spectra have led us to conclusions concerning the sequence of the temperature-induced changes in the vibrational force field of this crystal.
The existence of a peak with a positive intensity at the position (v1, v2) in the synchronous 2D correlation spectrum accompanied with a positive peak at the position (v1, v2) in the asynchronous 2D correlation spectrum is an indication that the spectral change at v1 precedes the one at v2. If the corresponding asynchronous peak has a negative intensity, on the other hand, the spectral change at v1 follows the one at v2. Note, however, that if the sign of the intensity of the peak at (v1, v2) in the synchronous 2D correlation spectrum is negative, the previous conclusions have to be reversed.
The positive intensity of the peak in the asynchronous 2D COS at (575 cm−1 and 982 cm−1) in conjunction with the positive intensity of the peak at the corresponding position in the synchronous 2D COS indicates that the temperature perturbation-induced change in the 982 cm−1 A2u mode precedes the change in the 575 cm−1 Eu mode. The same conclusion could be derived for the sequential changes in the 370 cm−1 Eu mode and the 982 cm−1 A2u mode (Eu precedes A2u). The negative intensity of the peak in the asynchronous 2D COS at (370 cm−1 and 685 cm−1) in conjunction with the positive intensity of the peak at the corresponding position in the synchronous 2D COS indicates that the temperature perturbation-induced change in the 370 cm−1 Eu mode follows the change in the 685 cm−1 Eu mode.
On the other hand, a negative cross-peak appears at (685 cm−1 and 982 cm−1) in the asynchronous 2D COS spectrum, which, in conjunction with a negative peak at the same position in the synchronous spectrum is an indication that the temperature perturbation—induced change in the 685 cm−1 Eu mode precedes the change in the 982 cm−1 A2u mode. The same discussion is valid for the negative cross-peak appearing at (345 cm−1 and 982 cm−1) in the asynchronous 2D COS in conjunction with the negative cross-peak at the same position in the synchronous 2D COS.
4. Conclusions
In the present study, we have combined a statistical physics simulation technique (molecular dynamics), in conjunction with the linear response theory-based analysis of the trajectories to compute the temperature-perturbed infrared spectra of the rutile modification of titanium dioxide, with the generalized two-dimensional correlation analysis of the obtained spectra. MD simulations have been carried out with the second-order self-consistent charge density functional tight binding approach (SCC-DFTB) for 3D periodic systems. We have demonstrated the usefulness of the approach and its potential to obtain further insights into the vibrational dynamics of periodic systems by combining statistical physics simulations with the generalized 2D COS analysis. The results of our static DFTB calculations concerning the frequencies and IR/Raman activities of the vibrational modes of rutile (TiO2) are in excellent agreement with the experimental data and allow for a more exact assignment of the corresponding experimental bands. At the same time, through a detailed analysis of the synchronous and asynchronous 2D spectra, we provide certain new insights into the anharmonic couplings between the modes in the studied system, as well as into the sequential character of the temperature-induced changes in the vibrational force field. The most sensitive to temperature perturbation is the 685 cm−1 Eu vibration, followed by the 370 cm−1 Eu mode and the 982 cm−1 A2u mode. The 982 cm−1 A2u mode and the 575 cm−1 Eu mode undergo a synchronous change upon temperature perturbation, i.e., the mechanism governing their temperature-induced drift is the same. The same conclusion holds for the 685 cm−1 Eu mode and the 370 cm−1 Eu mode. On the other hand, the 685 cm−1 Eu mode and 982 cm−1 A2u mode undergo an asynchronous change when temperature perturbation sets in, which implies different mechanisms being involved in the temperature-induced shifts of the mentioned two modes. The same holds for the asynchronous coupling of 345 cm−1 Eu mode and 982 cm−1 A2u mode, as well as for the 982 cm−1 A2u mode and the 370 cm−1 Eu mode.


