Article

Bulk Composition Effects on Vitrification of Mixed Fine Construction–Demolition and Inorganic Solid Waste

by
Paola Stabile
1,2,*,
Ababekri Abudurahman
1,
Michael R. Carroll
1 and
Eleonora Paris
1
1
School of Science and Technology, University of Camerino, Via Gentile III da Varano, 62032 Camerino, Italy
2
Department of Earth, Environment and Life Sciences, University of Genova, Corso Europa 26, 16132 Genova, Italy
*
Author to whom correspondence should be addressed.
Minerals 2023, 13(11), 1378; https://doi.org/10.3390/min13111378
Submission received: 28 August 2023 / Revised: 20 October 2023 / Accepted: 23 October 2023 / Published: 28 October 2023
(This article belongs to the Special Issue Geomaterials: Compositional, Mineralogical and Textural Features)

Abstract

:
Re-use of neglected and frequently landfilled wastes, including earthquake-generated rubble, can reduce the environmental impact of such waste materials, avoiding georesource exploitation, and potentially provide a source for new upcycling applications. Here, the fine fraction (<0.125 mm) of different wastes was selected according to chemical composition (mostly silicate/oxide-rich materials), including construction and demolition waste (CDW), commercial glass, ceramic industry waste and incinerator bottom and fly ashes. Mixtures of these materials were used for vitrification experiments conducted at atmospheric pressure, 1200 °C, 8 h duration, preparing ten mixes containing 30 to 70 wt% of different waste materials added to a CDW starting material. X-ray powder diffraction and SEM/electron microprobe analyses show that the amorphous content (glass) varies from a maximum of 100 wt.% in products made of CDW with 70 wt.% added ceramic materials (e.g., roof tile) to a minimum of ~53 wt.% amorphous material when CDW was mixed with 30 wt.% brick powder. Mixtures of other waste materials (commercial glass, bottom/fly ash, ceramic waste) produced variable amounts of amorphous component, interpreted in terms of thermal minima in the CaO-Al2O3-SiO2 system. Lack crystallinity and characteristic microstructures of experimental products suggest that vitrification is a promising choice for rendering inert chemically complex waste materials like CDW for possible upcycling applications.

1. Introduction

Industrial development generates large amounts of toxic and hazardous wastes which are frequently landfilled (e.g., [1]). This practice raises concerns about the possibility of leaching materials into aquifers, reduced landfill capacity and high environmental and economic costs associated with landfill disposal [2]. Waste treatments as alternatives to landfill confinement have thus attracted considerable research efforts, stimulated by the need to comply with EU regulations on waste. Moreover, among the different technologies for immobilizing polluting and/or toxic components in polymeric, cementitious, glass, or ceramic matrices, vitrification shows promise as a process which allows the confinement of environmentally hazardous elements into a stable amorphous structure, thus avoiding leaching ([2,3,4] and references therein).
Vitrification is a well-established technology that involves the conversion of the waste into a stable and homogeneous (silicate) glass structure through a thermal treatment with the possible modification of the starting composition using glass-forming additives (e.g., [5]). Vitrification of waste follows different technologies to create a glass matrix from waste materials. For example, microwave heating present some benefits such as high volume reductions, rapid heating, high temperature capabilities and high energy saving [6,7,8]; using electric heating furnaces [9,10,11,12,13], heat can be delivered to the cold cap and convective heat transfer occurs near the melting temperature; and plasma technology has the advantages of fast reaction and robust installation [14,15,16,17].
Although vitrification produces a volume reduction of waste and can immobilize potential hazardous elements in this glass structure, it also requires considerable energy costs for melting. Therefore, we can consider the vitrification process as an economically sustainable option by taking into account and balancing the following factors: (a) the cost of energy for high-temperature processes, (b) the environmental savings by avoiding extraction and long-distance transportation of virgin materials, (c) the possibility of recycling industrial waste, postponing end-of-life, (d) the reduction of landfilling, with environmental and economic savings, (e) the stable confinement of possible hazardous components into stable glass structure [2,18]. The economic disadvantage of the vitrification process may be counterbalanced also by further conversion of the glasses (or glass ceramics) obtained from waste into marketable products with desirable properties (e.g., durability, chemical and heat resistance, decorative aesthetics).
Among different types of waste, construction and demolition waste (CDW) has been identified as a priority waste stream, covering about the 35% of total waste generation in EU, accounting for 800 million tonnes per year [19]. In particular, the EU Waste Framework Directive (WFR 2008/98/EC) requires European countries to achieve at least 70 wt.% of recycling and/or recovery of CDW by 2020. In fact, CDW is produced during building construction, restoration, reconstruction and demolition. Demolition can be considered as a process involving the inevitable aging of constructions, or as a consequence of sudden disastrous events, like earthquakes.
The seismic events which hit four regions in Central Italy in 2016 (involving 140 municipalities in an area of 8000 km2) produced an enormous amount of CDW which needed to be rapidly removed to facilitate widespread reconstruction efforts. In the demolition areas, still valuable building materials could be reused in new constructions, especially in the local traditional architecture (building stones like sandstone and limestone, roof tiles and bricks), provided that a valid and low-cost materials separation can be carried out (e.g., [20] and references therein). Thus, CDW recycling is important for recovery raw materials from end-of-life and to prevent their disposal in landfills, but it also allows for an approach to the need to find alternatives to the extraction of new raw materials, avoiding environmental impacts linked to natural resources exploitation and production of mining waste (Directive 2006/21/EC).
The main problem in reutilization of CDW materials is related to the heterogeneous composition and the difficulty of selectively extracting some components of potential higher value, or removing some contaminants like asbestos, if present in debris [21,22,23] type is still downgrading applications, as aggregates for road construction or backfilling and, with limitations due to possible diminished mechanical performance, as recycled aggregates in concrete. For instance, CDW previously treated to selectively remove ferrous metals, plastic and wood components, clay, soil, rubber and gypsum is used in the manufacture of structural concrete; in particular, self-compacted (SCC) concrete mixes reached the strength target of the class of concretes C40/50 [24] and references therein.
The larger-grainsize components of CDW, after being treated and removed from the unwanted fractions could be recycled as aggregate. In this way, large amounts of CDW can be used in the manufacture of structural and non-structural concrete, thus contributing to increasing the technical and economic value of CDW-derived materials and increasing building energy efficiency [24]. Moreover, plastics and wood, typically making up the lightweight fraction of CDW, could be potentially reused for insulation purposes rather than being landfilled or incinerated. Plastic particles have also previously been used as aggregates in concrete composites [25,26,27].
The use of demolition wastes for the production or development of alkali-activated cements or the potential use of CDW (including recycled concrete, bricks, tiles, stone composites, etc.) as aggregate materials for the synthesis of geopolymers also present promising possibilities ([28] and references therein; [29,30]).
The remaining finer fraction materials (<0.125 mm) of CDW lack recycling applications and are destined to landfill, which provides potential problems connected to chemical leaching in the environment. Based on the above, the development of innovative technologies and products to recycle the finer CDW fraction is mandatory. In this work, we decided to test the use of fine CDW in addition to other inorganic solid wastes, including a variety of ceramic wastes, fly ash and bottom ash from incineration and municipal and car windshield glasses. Some of the materials are usually considered of limited recyclability or even destined to landfill, thus impacting important environmental issues [5,9,13,31].
The CDW used here was preliminarily investigated alone in vitrification experiments carried out in a laboratory furnace at temperatures <1400 °C ([32], which evidenced the difficulty in producing a highly amorphous products due to the refractory chemical composition of the CDW investigated. The novelty of this work is, therefore, to deal with an evaluation of a wide range of compositionally different waste materials, spanning from Ca-Al silicate systems to soda-lime glasses, including also quite heterogenous components waste materials, fine in granulometry and difficult to be allocated in virtuous applications.
In this study, different mixes combining the same CDW with industrial inorganic solid wastes have been tested from a mineralogical, chemical and textural point of view, to attempt obtaining fully vitrified materials, using only the finer fractions of CDW mixed with other selected wastes, thus serving the fulfilment of circular economy goals by investigating their effective recycling potential.

2. Material and Methods

2.1. Waste Materials

2.1.1. Construction and Demolition Waste (CDW)

The CDW used in this study was obtained from the centralized processing plant (COSMARI s.r.l, in Macerata, Italy) which, after the 2016 seismic crisis that hit four regions in Central Italy, was in charge of collecting and separating the earthquake rubble of the entire Marche Region. Before grinding to produce CDW material for recycling, the rubble was preliminarily cleaned to remove hazardous or environmentally undesirable materials like cement-asbestos, lead, electronic waste, and other recyclable metals. Wood, plastic, glass and gypsum were separated for recycling, while large rock blocks, if reusable as building materials, were made available in storage at the plant for reuse. For the purpose of this study, a CDW sample of grain size <16 mm was collected, separated for grain size classes in the range 0.125–4 mm and preliminarily analyzed mineralogically and chemically, as reported in [32]. Then, only the finest fraction of CDW (<0.125 mm) was used for the vitrification experiments reported here, as it represents the most unused and unwanted fraction for recycling purposes.

2.1.2. Glass

Glass waste samples of different compositions were used for the vitrification experiments on CDW mixed waste materials. The samples included an urban green-color bottle glass (sample G15) and a car windshield glass (sample GLU), which is considered as a special glass (Table 1, Figure 1). While urban glass contributes to a well-established waste stream with a high rate of recovering and recycling in most EU countries, special glasses usually need additional processing for recycling, making the process difficult and non-economic for companies and recycling centers. Therefore, car windshield glass is usually landfilled, and it has been used here to test its potential for recycling.

2.1.3. Ceramic Materials

Among industrial waste, ceramic materials of different composition were sourced directly from manufacturing facilities (stoneware, ceramic tiles, porcelain stoneware) or from earthquake rubble (bricks, roof tiles). Ceramic products could have a high potential for recycling because the raw materials used for their production and manufacture processes are well known, thus ensuring a consistency in the waste properties for reutilization as opposed to landfilling. There is a large amount of literature regarding recycling of ceramic waste from industrial production, increasing especially in the recent years (see as an example the comprehensive review by [33]), which testifies to the interest in the recycling of this waste stream and the knowledge already acquired in this field. Recycling is mostly carried out inside the factories, favoring a high recycling degree of the waste produced in the various industrial steps and ensuring a constant composition of wastes, compatible with the final ceramic products of the factory itself. In contrast, mixed ceramic waste, due to inherent heterogeneity, is partially recycled in the ceramic industry [34] or it can be recycled eventually in the production of engineered stones, mixed with epoxy resin [35].
Six ceramic materials were used in this study to investigate whether their addition to CDW would improve the vitrification process and to what extent, as a function of composition and experimental conditions; this represents a preliminary sampling in the wide compositional range of ceramic materials. Porcelain stoneware (PP) and ceramic stoneware scraps (CP and MU) were sampled to take into consideration different chemistry, crystalline contents and amorphous components. Samples of bricks (BR) and roof tiles (RT; MPA09 in [22]) were obtained from CDW rubble (see [22] and references within). It is necessary to specify that, regarding samples from CDW rubble, there is a wide variability of material compositions, changing with construction age, area of provenance and uses of masonry. Also, a sample of an industrial residue obtained from cutting and polishing of stoneware slabs from ceramic factories [36] was tested (sample CP).

2.1.4. Cement Tiles

The industrial production of cement tiles (terrazzo tiles), containing aggregates of marble or other ornamental stones of various compositions, involves cutting and polishing operations using different types of abrasive products, producing sludges. These residues, characterized by fine grain size and richness in CaO due to the cement binder and carbonate (limestones or marble) aggregates, are landfilled with high economic cost for the companies and a high environmental impact. As an example, the specimen used in this study (GRA) came from a company where sludge amounts to about 20 wt.% of the annual tile production, therefore representing a huge impact for the production costs (personal communication). Although several studies have approached the problem of the addition of sludge as an inert material in concrete (e.g., [37]) the compositional variability among the different industrial sludges and the absence of a recycling stream determines the lack of application of these materials in products for the building industry, ending therefore in landfilling.

2.1.5. Fly ash and Bottom Ash

The common by-products of municipal solid waste incineration are bottom ash (BA) and fly ash (FA), which are mostly classified as hazardous waste materials based on their heavy metal content and leaching potential [38]. BA and FA account for, respectively, ~80 vol.% and ~20 vol.% of the total incineration residues [28]. In particular, fly ash can contain a significant concentration of toxic heavy metals, such as mercury, lead, arsenic and chromium, as well as organic pollutants such as dioxins. Fly ash compositions differ significantly depending on the source area, the technology of the incinerator and the composition of the waste sources. Specifically, fly and bottom ash samples used here were collected at the Coriano (Rimini) incineration facility in Italy [13]. Given their chemical composition, the possibility of recycling FA and BA in the mix for vitrification represents a good opportunity for the conversion of such wastes into a stable glassy structure, useful also for the confinement of the hazardous metals present (e.g., Pb, Zn, Cd).

2.2. Experimental and Analytical Methods

2.2.1. Vitrification Treatments

The vitrification treatments of mixtures of CDW with different types of waste were carried out at ambient pressure in air using a chamber furnace (Carbolite RHF 14/3, ~3 L internal volume). For the procedure used, 5 g of sample powder (kept in a 110 °C drying oven before use) was loaded in a platinum crucible (15 mL capacity) and placed in the constant temperature zone of the furnace. Temperature was recorded by a Pt-Rh S-type thermocouple. The starting temperature of the experiments was 300 °C, heating rate was set at 20 °C/min up to the final temperature of 1200 °C and samples were kept at the desired temperature for 8 h. After the treatment, the crucible was taken out of the furnace and rapidly quenched by immersion in a water bath. Vitrified material often fractured on quenching, which aided extraction of quenched material from the sample crucibles; crucibles were cleaned with HF between different vitrification experiments.

2.2.2. Chemical Composition Determination

X-ray Fluorescence
Chemical analyses of the major elements in all the starting materials were obtained by X-ray Fluorescence (XRF) using a Bruker S8 Tiger WD X-ray Spectrometer on 5 g tablets obtained from each waste powder. Powders were mixed with polyvinyl alcohol until a homogeneous compound was obtained. Once dried, the sample was pulverized again and the powder obtained was placed on a boric acid base and pressed at 25 bars in an aluminum tray to produce a high-density sample for use in XRF analyses. XRF errors based on counting statistics for major oxides (wt.%) are reported in the Table 1.
Electron microprobe
Sample fragments obtained from the vitrification experiments were embedded in 25.4 mm diameter epoxy plugs, polished to 1 μm quality and inspected using reflected light microscopy to evaluate their state of vitrification. Suitable samples were then coated with an approximately 20 nm thick carbon layer for charge dissipation and subjected to chemical analysis by electron microprobe (EMP). The analyses for major elements were obtained by using a JEOL Superprobe 8200 (Milano), using ~10 random analysis spots per sample to check for glass homogeneity. The measurements were performed with an acceleration voltage of 15 keV, a beam current of 5nA and a beam diameter of 5 μm for all the elements analyzed. The standard materials used for quantitative WDS analyses consisted of a range of silicate and oxide minerals of composition similar to the studied compositions, such as omphacite, grossularite, fayalite, rhodonite, K-feldspar, olivine and fluorapatite. Back-scattered electron (BSE) images of the samples were also collected during microprobe analyses and examples are reported in the Results section.

2.2.3. Amorphous Content Determination

X-ray Powder Diffraction
The mineralogical composition of the starting materials and the vitrification products were determined by X-ray powder diffraction (XRPD), using a Panalytical X’Pert powder diffractometer with Cu Kα radiation (λ = 1.5418Å), an applied voltage of 40 kV and current of 25 mA. The acquisition range was from 5° to 70° 2theta, and a step size of 0.02° and an acquisition time of 1 s/step were used. XRPD allowed for the identification of the crystalline phases present.The abundances of amorphous and crystalline phases (wt.%) was semi-quantitatively evaluated using the RIR (reference intensity ratio) method [39,40], using the software package “Match! version 3.9.0” (Crystal Impact, 2019). The RIR compares the intensity scaling factor of each mineralogical phase (I) with a “virtual” corundum crystalline phase (Icor), which is not necessarily present in the XRPD patterns. The “I/Icor” ratio is then used for assessing semi-quantitatively the content (wt.%) of each crystalline phase (using a database of estimated densities) with an uncertainty of ca. ±5 wt% [39,40].
Analysis of Textures
The digital BSE images captured during microprobe analyses were analyzed for crystal and glass phases using ImageJ software 1.8.0 (NIH Image, [41,42]), which is a Java-based image processing program that can be used to calculate areal abundances of the different phases in digital images, inches or other values, and can provide phase proportion statistics of user-defined selections. To measure the areas of the glassy component, the phase of major interest in this study, images of the 3 complete series of CDW mixed with GLU, CP and BR were segmented using manual bi-level grayscale thresholding based on the grayscale histogram of the image. This allowed for defining the glass phase in the images by appropriate threshold values [43]. The glass area fraction was then obtained from the measured total image area [44].
Mass Balance
The glass fraction of the vitrification experiments can theoretically be determined by mass balance, if the composition of the bulk material used and the compositions of all phases in the vitrified or partially vitrified samples are known (e.g., [45,46]. We attempted this approach, but did not have reliable microprobe analyses for all crystalline phases, especially gehlenite (Ca2Al2SiO7)-akermanite (Ca2Mg[Si2O7])-ferri-gehlenite (Ca2Fe3+[AlSiO7]) solid solution crystals in some partially vitrified samples and thus many of the mass balance calculations were not well-constrained. For samples in which only small amounts of wollastonite were observed, calculated glass contents agree within errors with other methods (XRPD, ImageJ) used to estimate sample glass contents.

3. Results and Discussion

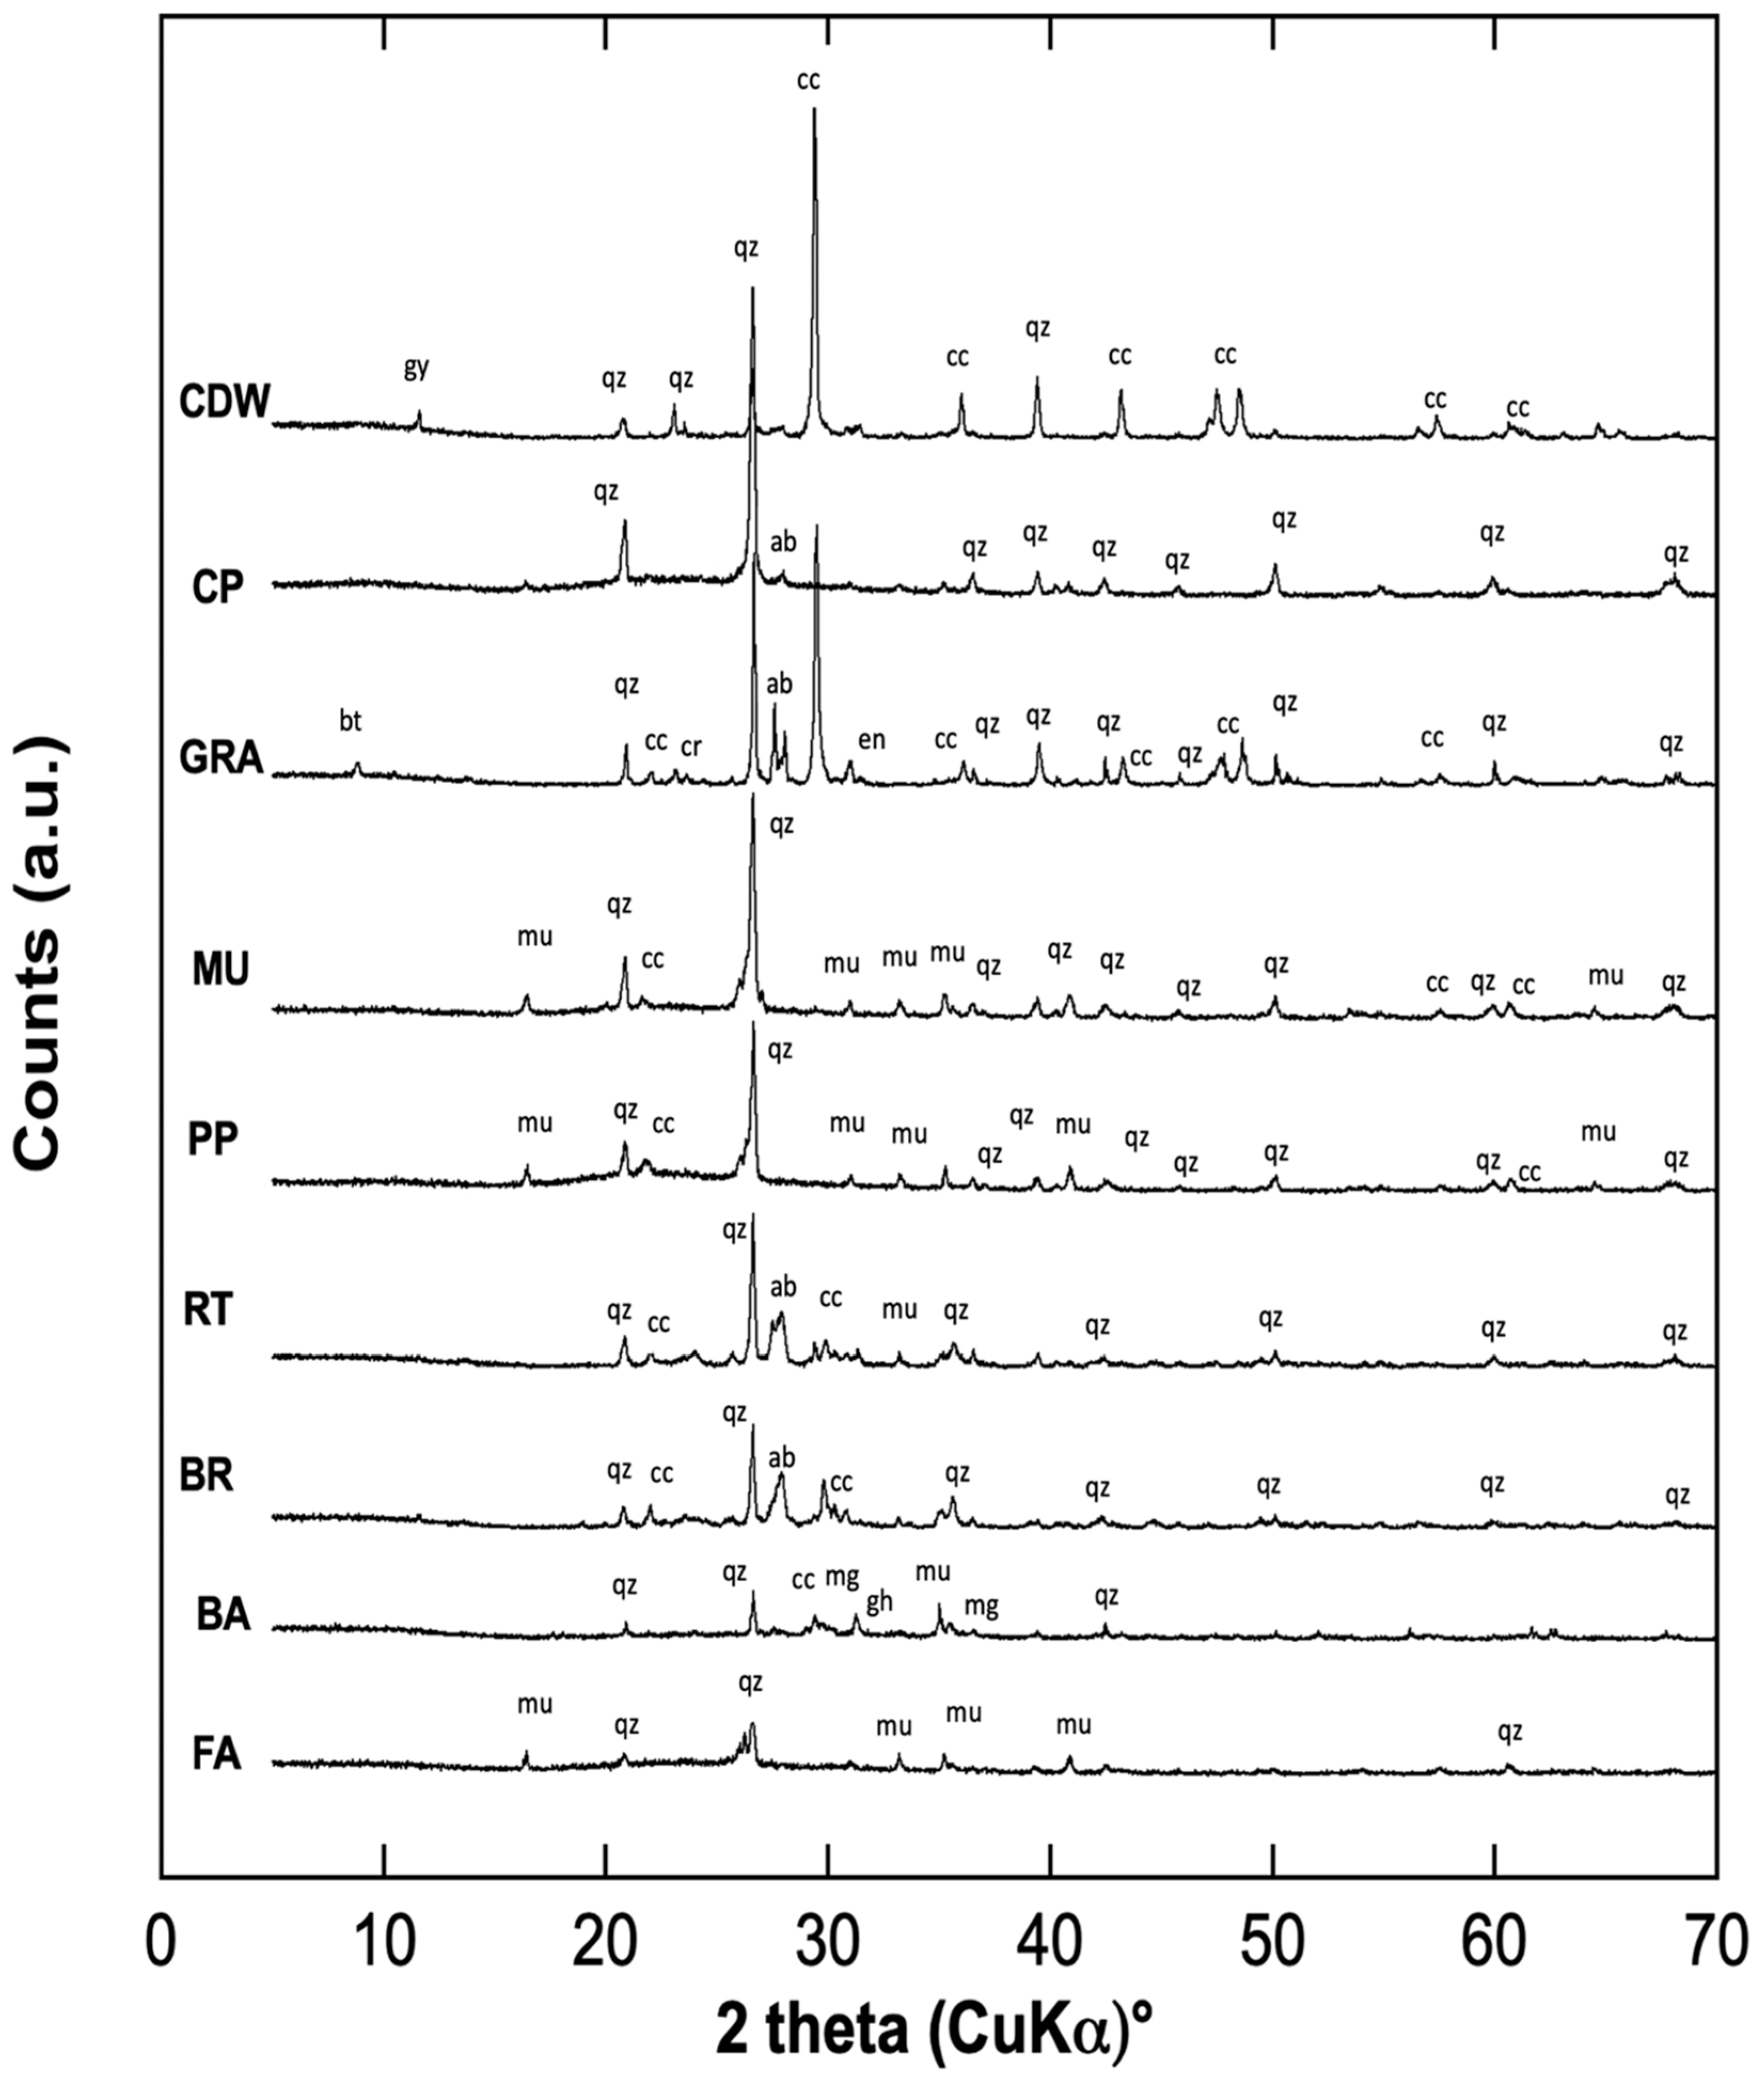
3.1. Materials Characterization

All wastes considered here for vitrification experiments with CDW contain ~80–95% of oxide components falling within the CaO–Al2O3–SiO2 (CAS) system [47,48] and are outlined in Figure 1, together with approximate areas of selected waste compositions from the literature [28,30]. Major element analyses for the different waste materials and descriptions of sample names used are presented in Table 1. The main difference in composition between the examined waste materials is the relative amounts of Ca-Al-Si oxides. The glass samples (GLU and G15) have higher SiO2 and lower Al2O3 compared to all the other waste samples, while CP, PP, MU (industrial ceramic waste) and FA have similar compositions in spite of the different origin, with relatively high SiO2, low CaO and some Al2O3. In particular, FA shows higher values of CaO (ca. 5 wt.%) with also some FeO (ca. 8 wt.%; low or absent in other industrial ceramic waste). BA, BR and RT have comparable oxide amounts: quite high SiO2 and relatively high CaO and Al2O3, with BA showing slightly lower Al2O3 but high FeO* (16 wt.%; FeO* is all iron calculated as FeO). CDW and GRA have higher CaO and lower Al2O3, with CDW showing the lowest SiO2 content, mainly due to the large amount of calcium carbonate components (from limestone building materials) and cement phases present (see Table 1). Apart from the three main oxides (CaO, Al2O3, SiO2), minor oxides present are Na2O, K2O, MgO and FeO* (=total Fe, expressed as FeO).
The studied CDW sample (triangle symbol in Figure 1) falls near the Ca-rich end of the Portland clinker composition area, close to the tricalcium silicate (alite; C3S)-dicalcium silicate (belite; C2S) compounds, with ~15 wt% of tricalcium aluminate (C3A) [49] which is also dominant in Ca-aluminate cements [32,50]. The oval fields labelled as CDW in Figure 1 indicate possible large variations in SiO2 content at near-constant Ca/Al of ~9:1.
In Table 1, the crystalline phases present and their abundance are reported together with information on the amorphous fraction, as determined by the RIR method using the XRPD data. The XRPD pattern (Figure 2) of the CDW sample shows the presence of calcite (CaCO₃) and quartz (SiO2) in the crystalline fraction, with calcite strongly predominant (44 wt.%) over quartz (SiO2) with a high amorphous component (48 wt.%) (Table 1). Besides the completely amorphous waste samples (glasses GLU and G15), the XRPD data for other waste samples (Figure 2) indicate that quartz content varies from 8 to 37 wt.% in CDW and porcelain/ceramic samples (PP and MU), respectively. Calcite is abundant also in GRA sludge, and some is present in RT and BA (probably as secondary calcite, produced by reaction with atmospheric CO2 during storage); albite (NaAlSi3O8) is present in RT and BR, while mullite (Al6Si2O13) (40 wt.%) is only present in the FA. BA also shows some additional minor phases such as gehlenite (Ca2Al[AlSiO7]), magnesioferrite (MgFe2O4) and wollastonite (CaSiO3). The amorphous content in the waste samples analyzed here ranges between a minimum value of 39 wt.% in GRA and a maximum of 70 wt.% in FA.
Given the high amount of CaO, vitrified products from the same CDW sample as studied by [32] resulted in a deficiency in network-forming elements like Si and Al that would have otherwise lowered the liquidus temperature, thus facilitating vitrification. Normally, for many CDW compositions, some additives are needed for vitrification at non-extreme temepratures (1100–1200 °C; [51]). Here, given the Ca-rich and Si-poor characteristics of the investigated CDW, rather than add fluxing agents to CDW to enhance the formation of amorphous phases during the thermal treatments [2], we chose to modify the chemical composition by using other waste materials to obtain a series of different mixes for vitrification experiments (CDW with other added waste in different proportions). This approach offers the advantage of potentially using a larger amount of waste materials, starting from CDW fine fractions, normally destined for disposal in landfills or reused only for some downgrading applications.

3.2. Vitrification Products
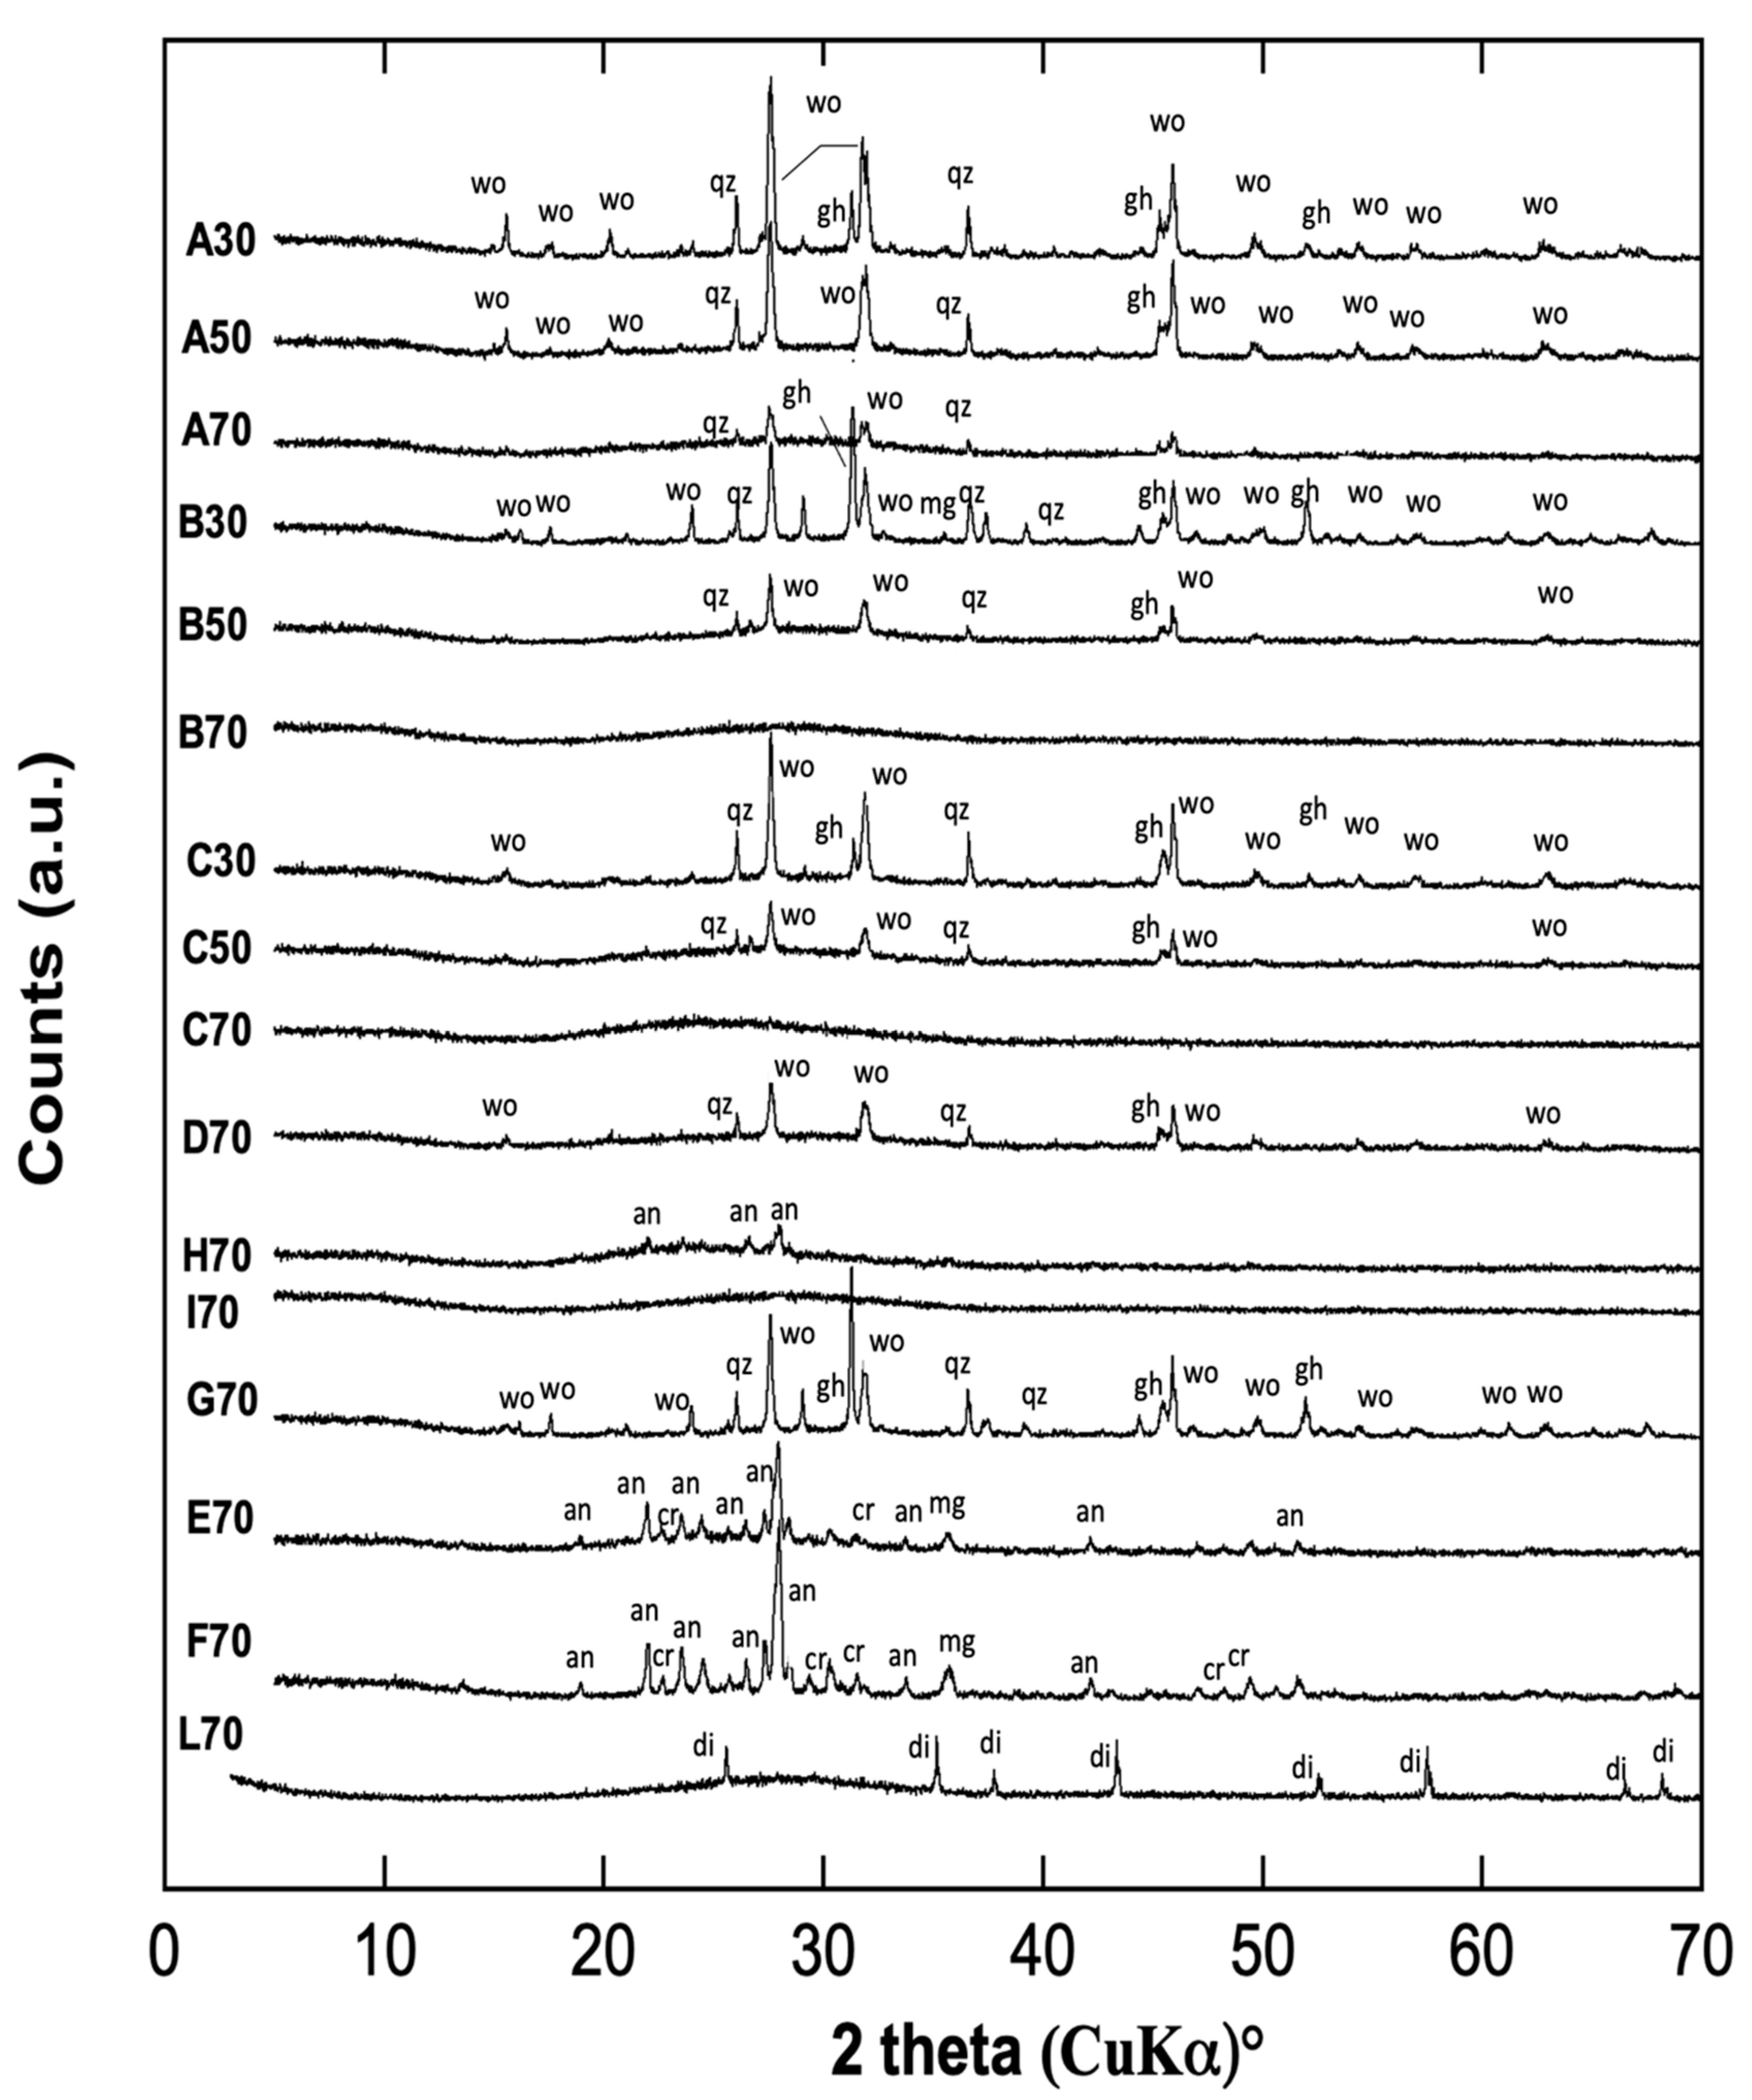
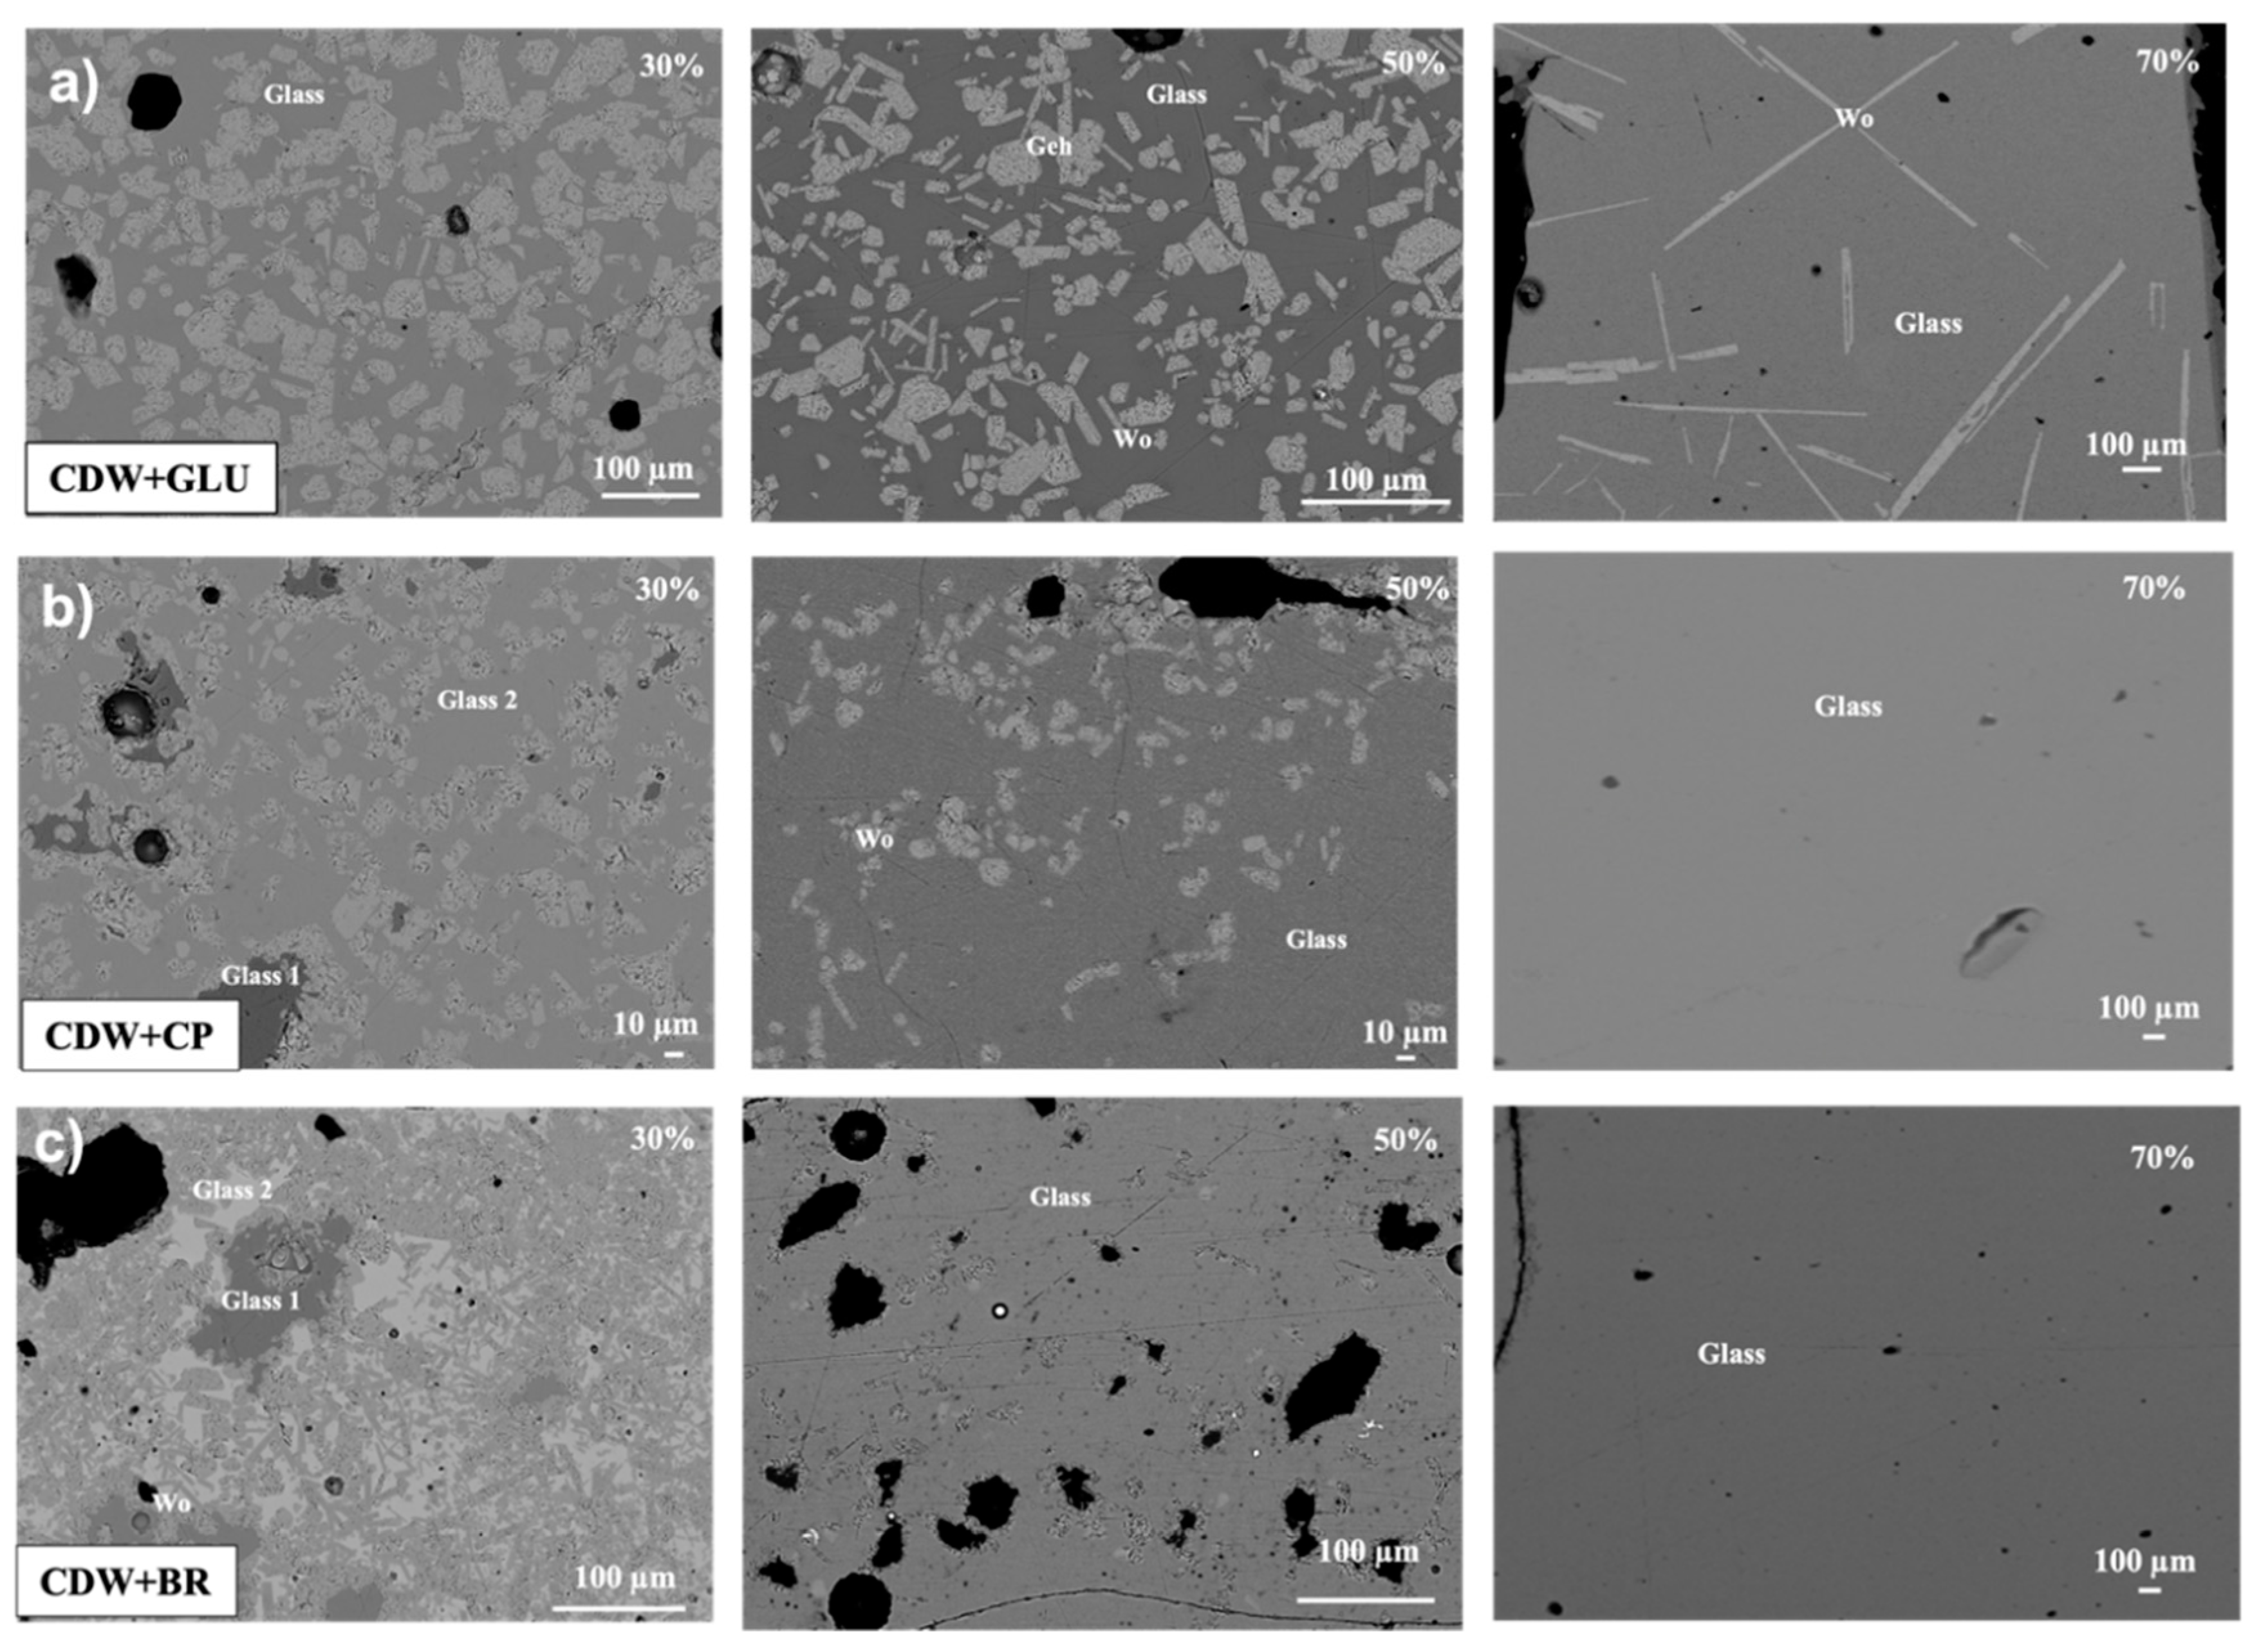
The vitrification treatments were performed at laboratory scale and were carried out on 10 waste combinations of CDW (30 wt.%) with a different waste type (70 wt.%). Further experiments, using CDW with added waste percentage reduced to 30 and 50 wt.%, were specifically conducted on three binary systems which demonstrated interesting results in the preliminary tests, i.e., CDW-GLU (car windshield glass, A series), CDW-BR (bricks, B series) and CDW-CP (ceramic powder, C series) (Table 2). In order to follow the vitrification process, all the thermally treated samples were characterized by XRPD.

3.2.1. Mineralogy

XRPD results (Figure 3) show that the vitrification process did not occur to the same extent for all the mixed-waste samples, as expected given their compositional variability. XRPD data revealed that, after the thermal treatment at 1200 °C, the main crystalline phases, newly formed and embedded in the glass matrices, are all Ca-bearing silicates or aluminosilicates, in variable amounts in the samples, such as wollastonite (10–33 wt.%), gehlenite (5–25 wt.%), anorthite (11–43 wt.%) and diopside (41 wt.%). Among all the 70 wt.% waste samples, only three (B70, containing BR waste; C70, containing CP waste; I70, containing RT waste) became completely amorphous, as evidenced by XRPD results (Figure 3), while all the others showed a lower content of the amorphous component, with minimum values of 58–59 wt.% for the samples containing FA and BA (Table 2). Mixes made using glass waste (A70 with GLU waste and D70 with G15 waste) reached up to 90 and 67 wt.% amorphous contents, respectively. All ceramic wastes inserted in the mixes produced instead very high amorphous contents, variable between 82 to 100 wt.%.
Data obtained using the RIR method are in agreement with textural analysis carried out by evaluation of BSE Images for the samples A70, B70 and C70 (Figure 4a–c). In particular, textural analysis of the samples B70 and C70 shows no crystalline phases present, whereas sample A70 (GLU waste) shows a small amount (<5%) of wollastonite needles in a glassy matrix, consistent with RIR abundance calculations based on XRPD (~90% glass, 10 wt.% Wo).

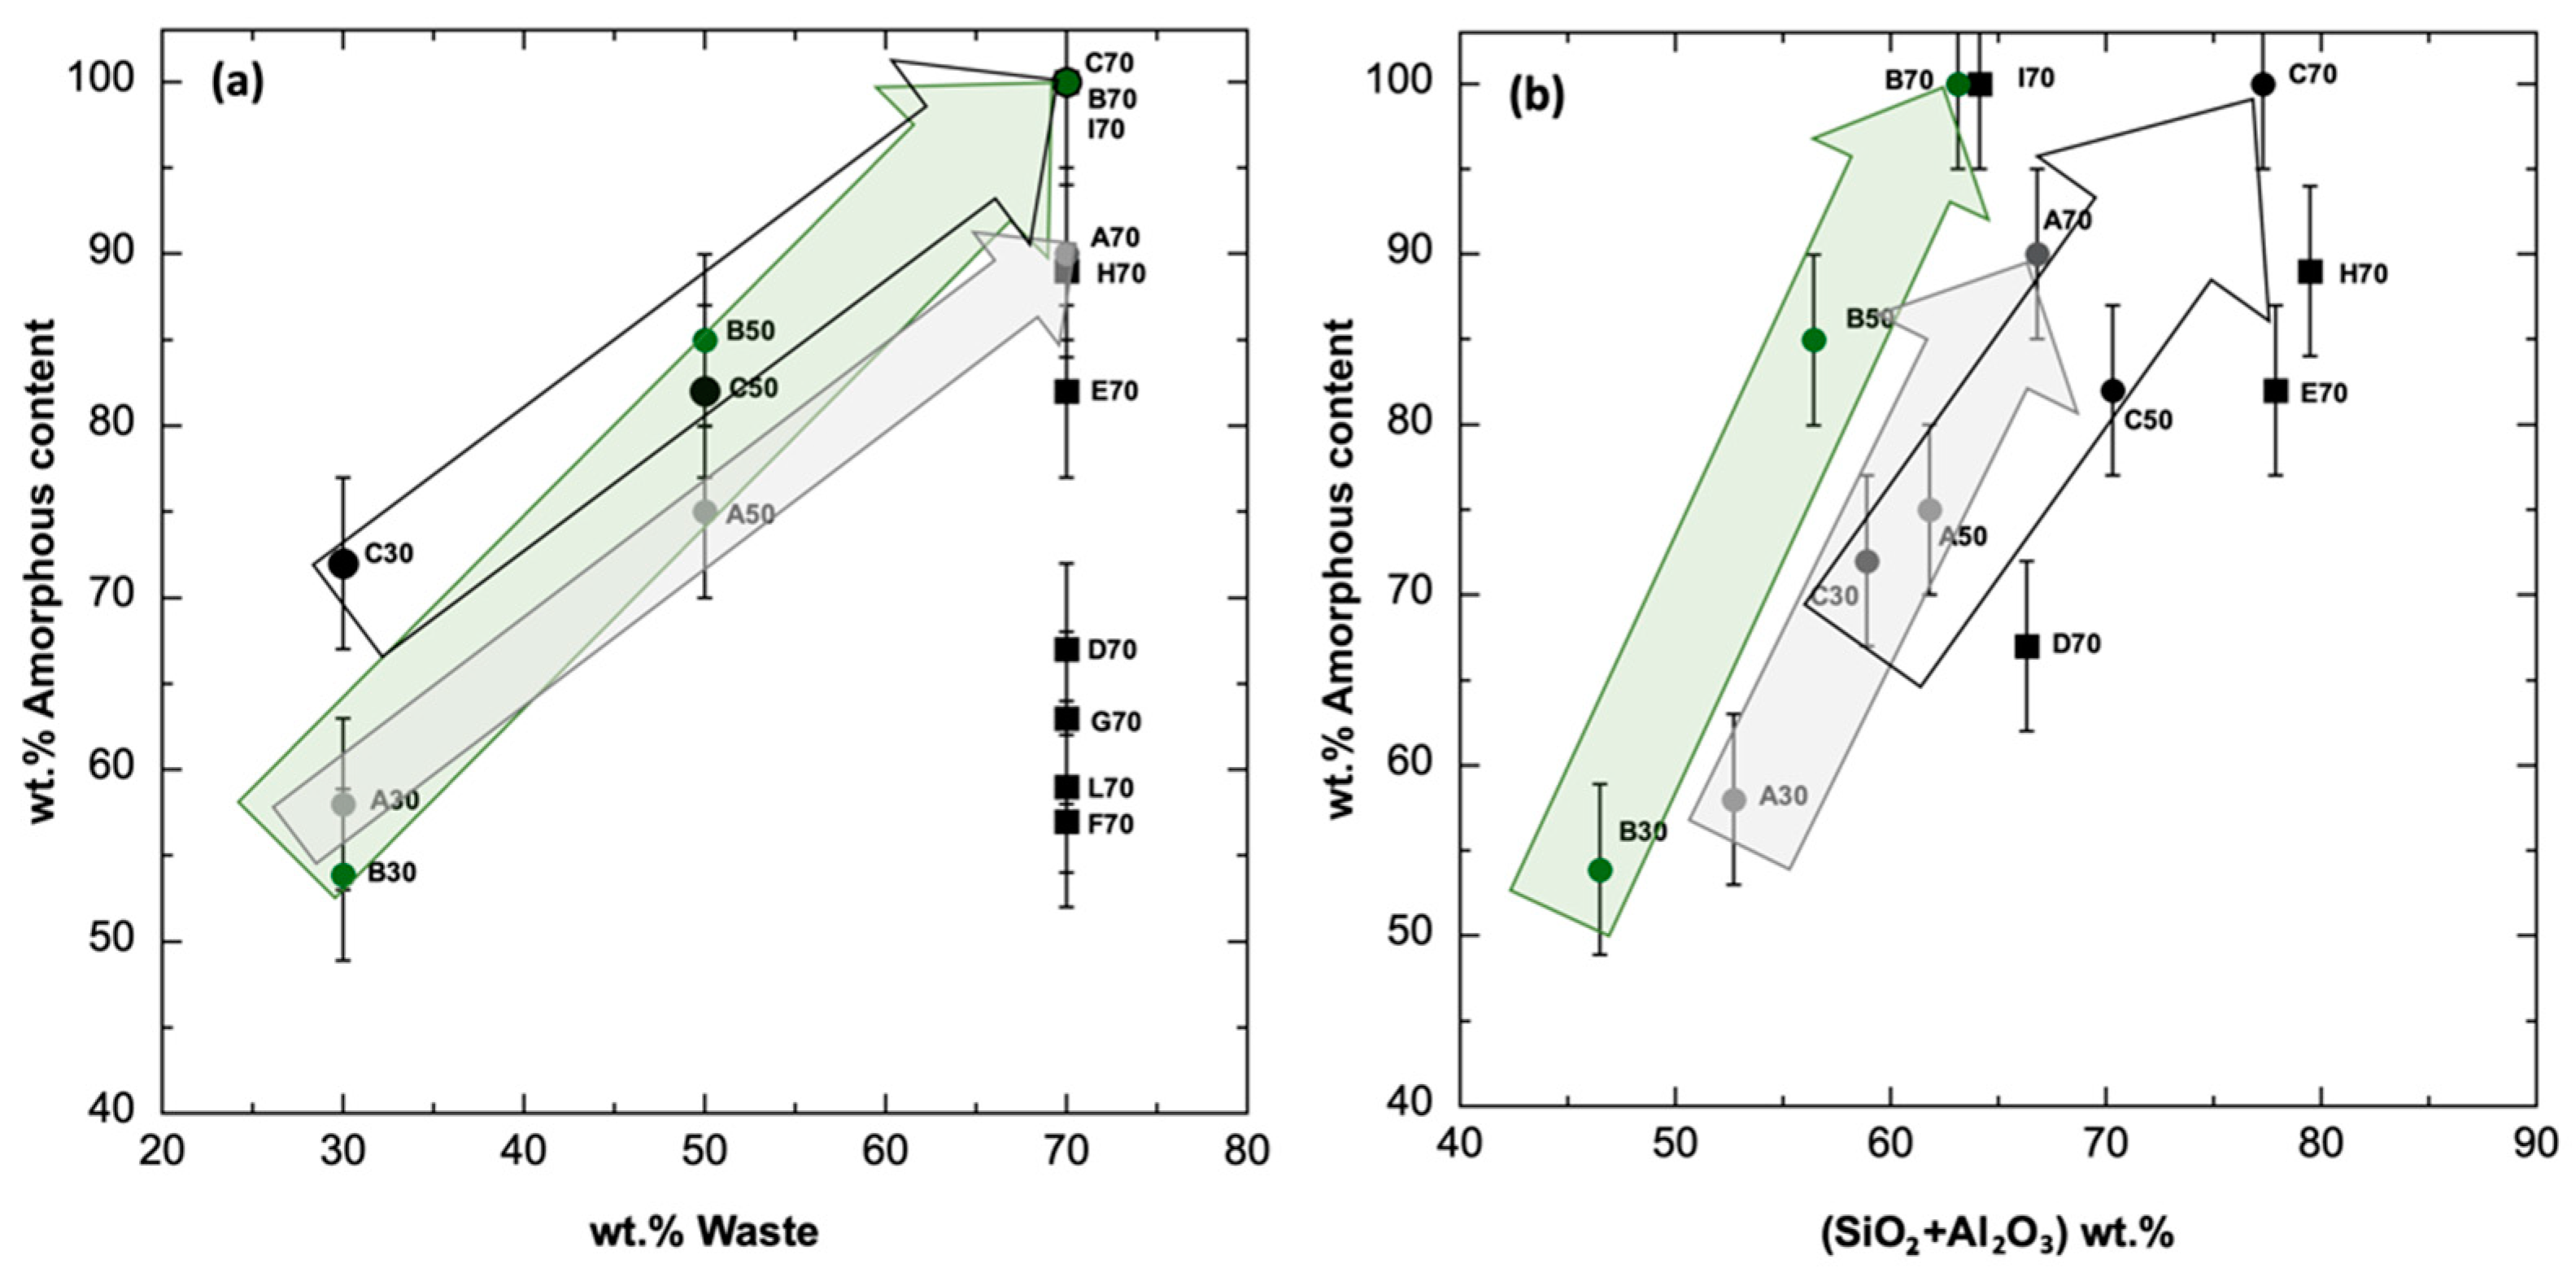
3.2.2. Compositional Variations

Major oxide compositions of waste batches after vitrification are reported in Table 2. The variations in amorphous phase abundance, occurring as a consequence of the thermal treatment with increasing amounts of different waste material added to the CDW base composition, are illustrated in Figure 5. Figure 5a reports the amorphous content (wt.%) of the different mixes plotted versus the waste quantity (wt.%), showing that, at increasing quantities of the same waste added to CDW, there is an increase in amorphous content (gray arrow, A series; green arrow, B series; white arrow, C series), although not with the same trends and slopes among the three series. Also, for a comparison among the 70 wt.% waste mixes, Figure 5a shows the vitrification efficacy of the series B, C and I samples and, to a lesser extent, A and H, in comparison to other samples, which are all below 70 wt.% in amorphous (glass) content. Figure 5b reports the sum of the two main oxides (SiO2 + Al2O3) versus the waste quantity (wt.%) in order to examine the effect of abundance of network-forming cations on vitrification. The amorphous content of the vitrification products increases with adding waste to the CDW mixes in the A, B and C series as highlighted by the colored arrows, due to an obvious increased (SiO2 + Al2O3) content. However, it is evident that the addition of ceramic waste materials (ceramic powder, roof tile and brick wastes, i.e., B70, C70 and I70 samples) produces the highest amorphous contents in the CDW waste mixes (100 wt.%) (Figure 5a,b).
The difference in the amorphous content can be 10–15 wt.% between the two categories of waste-based products (70% glass wastes versus 70% ceramics wastes; Figure 5b). The larger effects of ceramic waste materials on vitrification efficiency may be related to the fact that these compositions also have more chemical components outside of the CaO-Al2O3-SiO2 system. This is also valid for the samples D, E, F, G, H. For example, other cations, such as alkali metals (Na, K) or alkaline earths (Ca, Mg) and FeO-Fe2O3, present in the silicate glass structures act as network modifiers (except some Fe3+; [52,53,54]) and produce less polymerized glass networks [55].
Other authors also investigated, in particular, the effect of the CaO/SiO2 or C/S ratio on the vitrification process in fly ashes. [56] observed that the vitrified batch with the lowest C/S (and CaO/Al2O3, i.e., C/A) was the ideal batch for vitrification, while the crystallization occurred more readily for the batches with higher C/S and C/A. Similarly, [57] studied the effect of C/S (0.07-1.54 molar ratio) on the crystallization behavior of fly ash and they observed that higher C/S ratios lead to increased crystallization (which depends also on T and other components). Following these observations, the lower C/S molar ratio of 0.26 for the C70 sample compared to 0.30 for A70 (see Table 2) can also explain the higher amorphous content in the former sample. However, other ceramic waste products, i.e., E70 and H70, with low C/S ratios of 0.25 and 0.24, respectively, and also low Ca/Al did not show such a high degree of vitrification when compared with B70, that displays a C/S ratio of 0.50 and 100 wt.% amorphous content. Some of these differences may be related to the presence of additional components not present in the simple system SiO2-Al2O3-CaO.

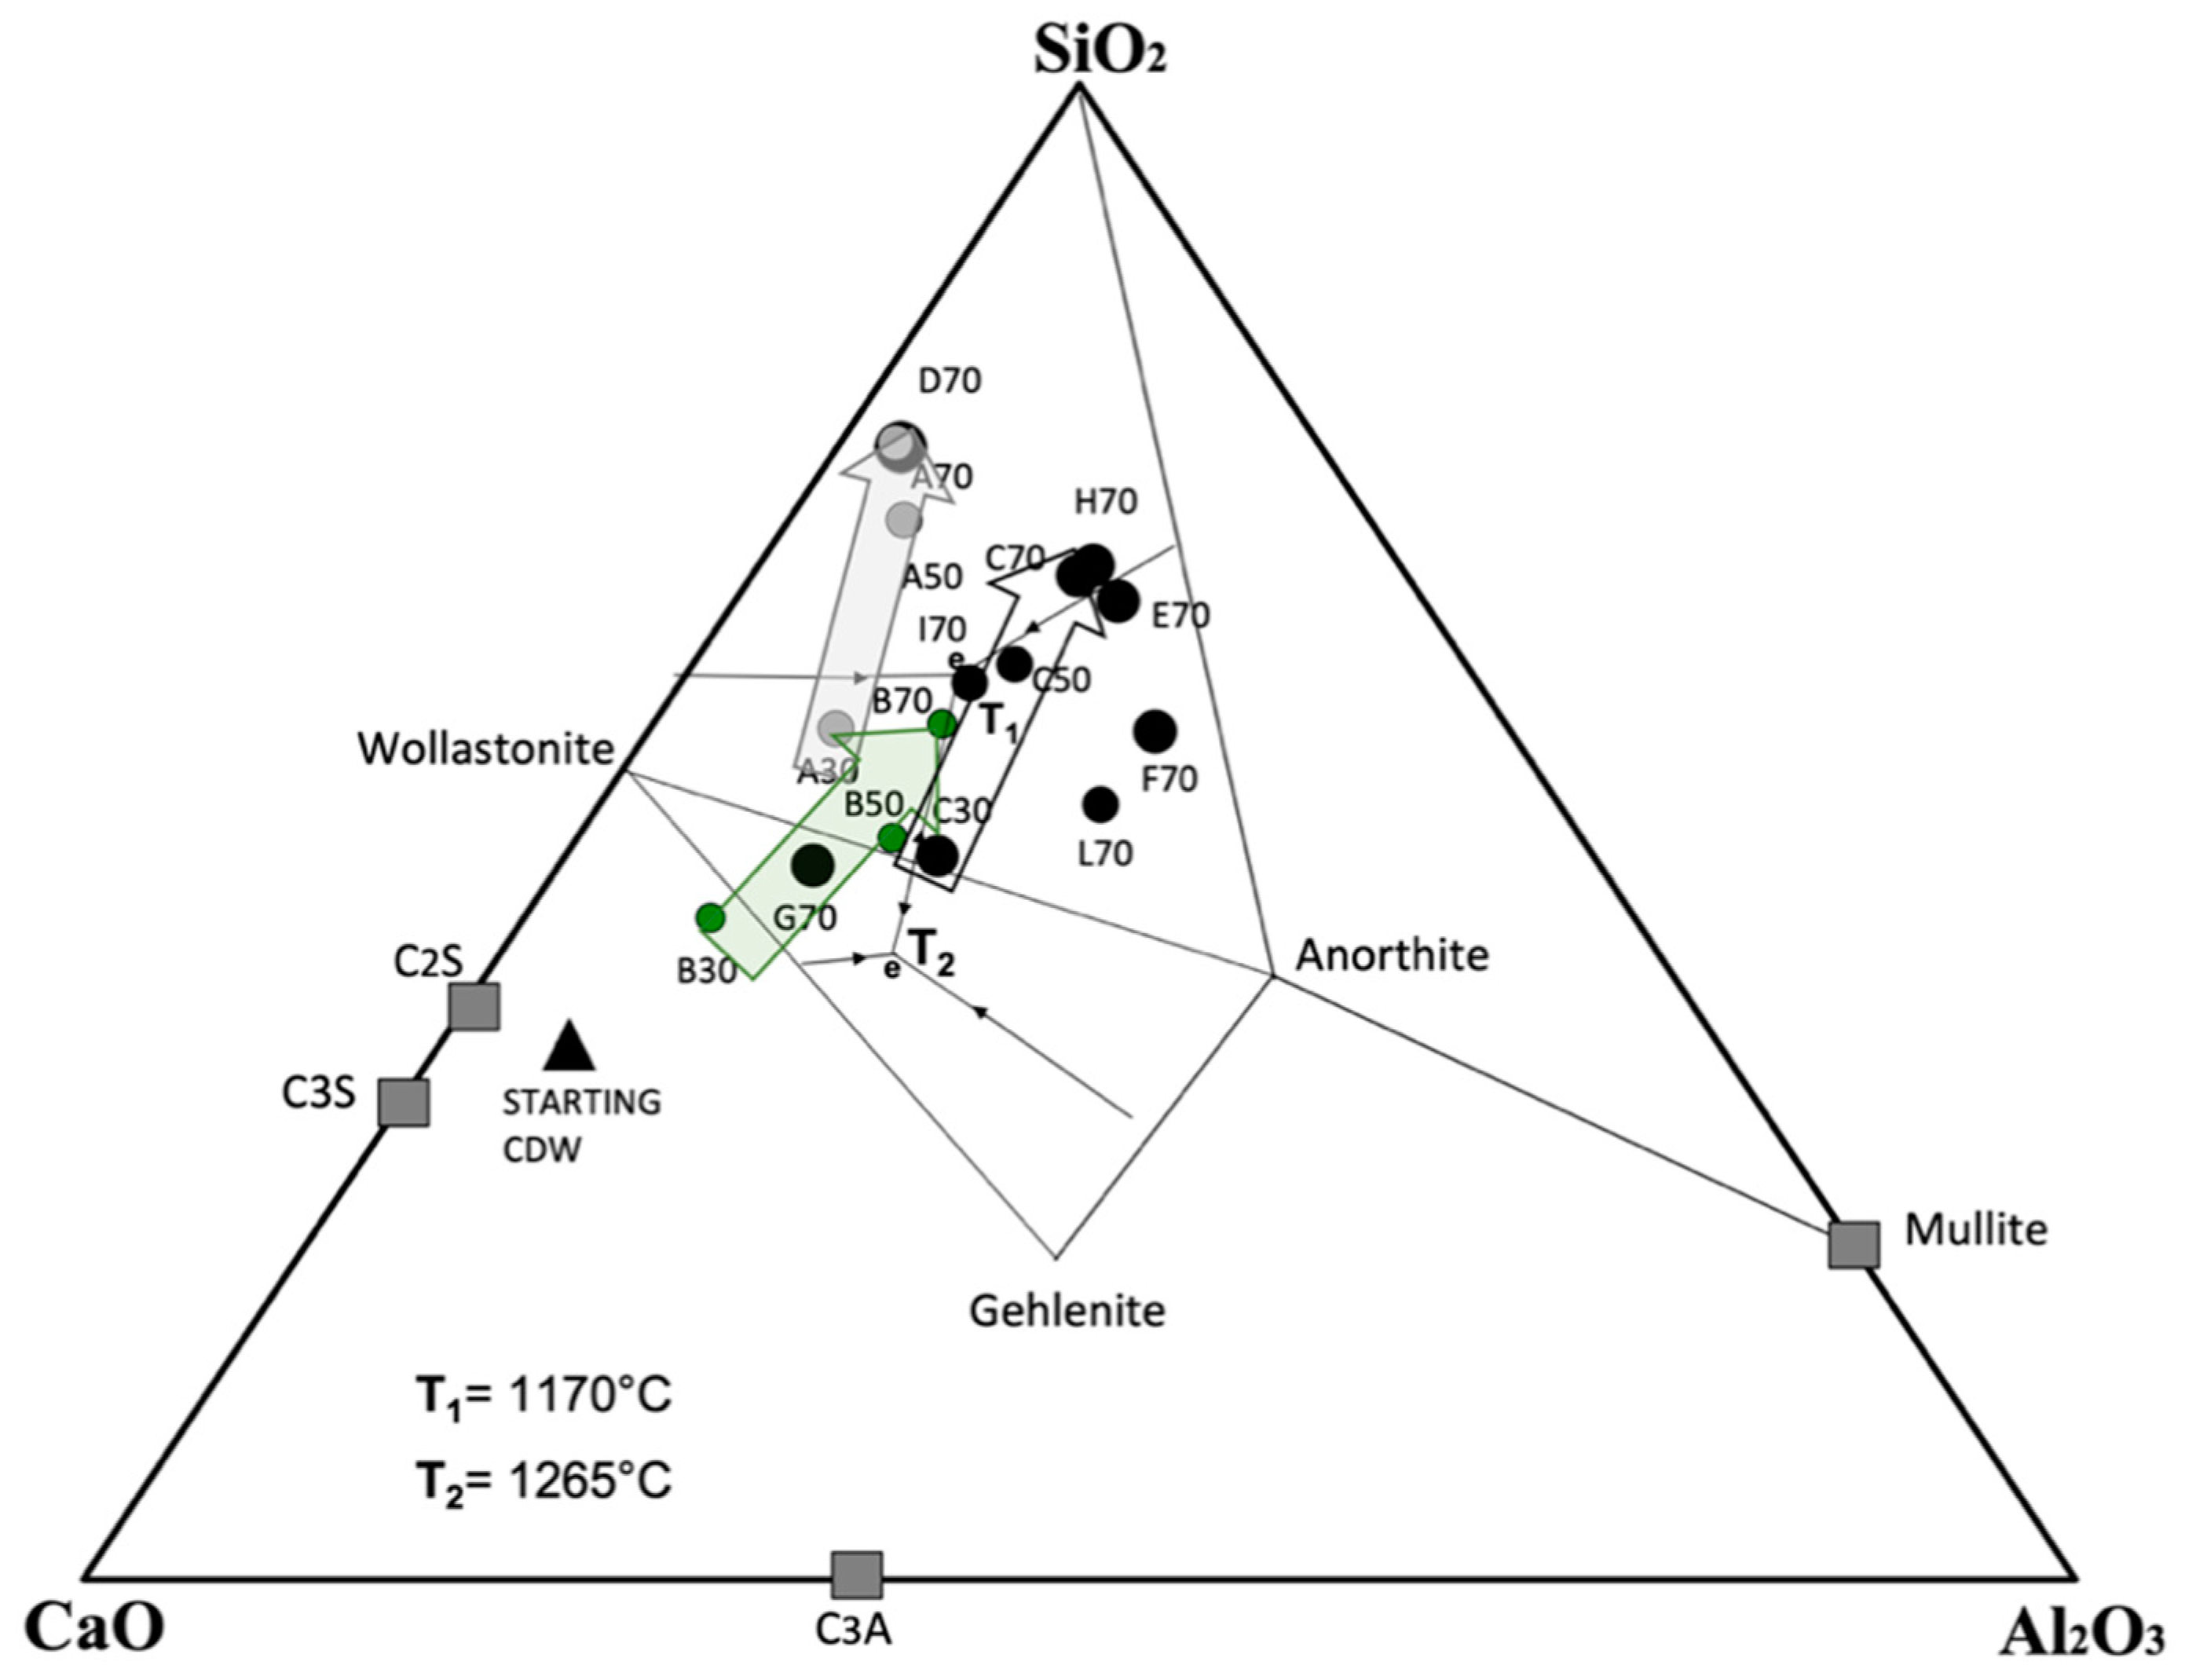
3.2.3. Phase Equilibrium Considerations

To better display the oxide compositions of the glassy waste mixes, we report all the products in the CAS diagram in Figure 6. Here, the phase diagram of the CaO-SiO2-Al2O3 system, originally determined by [58] has been modified to represent the different regions where a given oxide component crystallizes from the corresponding melt. The MgO-Al2O3-SiO2 phase diagram should be considered when systems contain much more Mg (e.g., [59,60]) because this can combine with Si and/or Al at high-T to form enstatite, cordierite and similar phases, and this inevitably reduces the amorphous content as more Si is consumed.
In the complex multicomponent systems investigated in this study, formation of the amorphous phase appears to be favored by a “deep” thermal minimum area, located near ~25% CaO, 60% SiO2 and 15% Al2O3 (wt.%; T1eutectic (L+Qz+Gehl+Wo) in Figure 6), defining compositions with the lowest expected liquidus temperatures and, thus, enhancing glass (melt) formation.
All experimental products containing a high amorphous fraction fall near the cotectic lines and close to the ternary minimum T1 shown in Figure 6, suggesting that the vitrification product can form from melt at near-eutectic conditions. In particular, two distinctive regions can be defined: the lower T region (~1170 °C) bounded by wollastonite–anorthite–quartz (presence of small amounts of Gehl observed in some of our experiments likely results from presence of non-ternary components like Fe2O3 in some samples) and the higher T area (around eutectic T2, ~1265 °C in Figure 6) bounded by wollastonite–gehlenite–anorthite. The lowest T region (~1170 °C) occurs at compositions richer in both SiO2 and Al2O3 compared with the CDW starting material. The geometry of this low-T region in the diagram, in fact, provides guidelines for the type of material to mix with CDW of the composition used here, in order to obtain vitrification at the lowest temperatures possible (desirable for energy considerations and cost of vitrification at high T).
Adding commercial soda-lime-silica glass (waste G15) results in compositions that fall to the left of the thermal minimum (less melt at 1200 °C), but ceramic wastes, which are richer in Al2O3 (and may contain some Na, K and Fe), produce instead compositions very close to the thermal minimum area, and thus experimental samples which are almost completely vitrified at 1200 °C. In particular, roof tile (RT) waste mixed with CDW (I70 sample) produces compositions showing an amorphous content of 100 wt.%, which falls almost exactly at the low thermal minimum, and the B70 sample (reaching 100 wt.% amorphous content, but obtained using brick waste, BR) falls also very close to this point.

3.2.4. Final Considerations

The challenge of recycling waste and reducing the use of raw materials from natural sources has motivated other studies, including different vitrification technologies to treat different type of waste including fly ash, bottom ash, asbestos, electronic sludge, lead industrial waste, etc. (see [2] for a review). The idea is to produce a vitreous matrix from the final residues, but in most cases flux agents or additives are used to achieve vitrification at not-extreme temperature; for instance, 10 wt.% of ZnO (analytical grade crystalline) was added to the municipal solid waste by [61] and 50 wt.% of different types of silica, namely silica sand and glass cullet, were used for vitrifying fly ash from incineration [56]. These additions can be efficient but imply the use of raw materials and chemicals.
Some authors studied adding different waste materials as inert components in cement production, by the melting and subsequent cooling and grinding of fly ash, which is then additionally melted with CaO or Al2O3 [62]or other wastes, such as fly ash of foundry sand or production sludge [63] for optimizing performance. Similarly, [64] chose construction and demolition waste and/or shells from shellfish to obtain particles of size similar to blast furnace slag (BFS), fly ash or gypsum which are common components used in the manufacture of cement.
Therefore, it is useful to emphasize here the novelty of the present research idea, focused on treating chemically and mineralogically different combinations of difficult-to-recycle waste types, fine in granulometry, without using additives or glass-forming oxides to aid the vitrification process. Our approach allows for the avoidance of the use of new virgin materials, reducing the environmental impacts of extraction and producing an industrially oriented proposal for upcycling applications of waste of different compositions and origin.
Environmental and economic impact together with associated savings are currently being evaluated at the laboratory scale using Environmental Life Cycle Analysis (E-LCA) and Life Cycle Cost (LCC) assessments [65]. If successful, then the current method of practice can be challenged to facilitate the uptake of CDW in different areas of industrial applications.

4. Conclusions

The results obtained from this study can be summarized as follows:
(a)
New glassy materials can be easily produced from the vitrification of CDW combined with different industrial wastes at 1200 °C. Completely amorphous materials are obtained if CDW of this composition is combined with ceramic waste, bricks or roof tiles and thermal minima in the CaO-Al2O3-SiO2 system provide useful guidelines for producing mixture compositions with the lowest melting temperatures. The amorphous content reached a range of different values depending on the type of waste added to the mix, which affected the melting temperature.
(b)
The finest fraction of CDW materials is usually considered the most problematic in terms of recycling, being difficult to treat and usually discarded. However, our results show that, provided the composition is determined, this finer material is suitable for vitrification treatments to obtain bulk compositions with relatively low melting temperatures;
(c)
Vitrification, although representing an energy-intensive process, can still be considered as a sustainable option in terms of reducing the extraction of raw materials and improving upcycling processes of unused fine waste fractions that would otherwise be landfilled.
Also, it should be possible to design novel market-value materials in order to prepare glass, glass ceramics or even refractory products for their intended applications representing the end products of circular economy processes.

Author Contributions

Conceptualization, E.P.; methodology, E.P., P.S. and A.A.; investigation, P.S. and A.A.; data curation, P.S. and M.R.C.; writing—original draft preparation, P.S. and A.A.; writing—review and editing, P.S., M.R.C. and E.P.; supervision, E.P. and M.R.C.; project administration, E.P. All authors have read and agreed to the published version of the manuscript.

Funding

This research has been partially supported by the EU LIFE project (LIFE14 ENV/ IT/000801 ECO TILES) and PRIN 2022 to EP; PRIN 2017 (2017J277S9) and PRIN 2020 (202037YPCZ) to MRC.

Data Availability Statement

All materials used in paper are available in the published Tables and figures.

Conflicts of Interest

The authors declare no conflict of interest.

References

  1. Barracco, F.; Demichelis, F.; Sharifikolouei, E.; Ferraris, M.; Fino, D.; Tommasi, T. Life cycle assessment for the production of MSWI fly-ash based porous glass-ceramics: Scenarios based on the contribution of silica sources, methane aided, and energy recoveries. Waste Manag. 2023, 157, 301–311. [Google Scholar] [CrossRef]
  2. Sanito, R.C.; Bernuy-Zumaeta, M.; You, S.-J.; Wang, Y.-F. A review on vitrification technologies of hazardous waste. J. Environ. Manag. 2022, 316, 115243. [Google Scholar] [CrossRef]
  3. Alam, Q.; Florea, M.V.A.; Schollbach, K.; Brouwers, H.J.H. A two-stage treatment for Municipal Solid Waste Incineration (MSWI) bottom ash to remove agglomerated fine particles and leachable contaminants. Waste Manag. 2017, 67, 181–192. [Google Scholar] [CrossRef]
  4. Sharifikolouei, E.; Baino, F.; Galletti, C.; Fino, D.; Ferraris, M. Adsorption of Pb Cd in rice husk their immobilization in porous glass-ceramic structures. Int. J. Appl. Ceram. Technol. 2020, 17, 105–112. [Google Scholar] [CrossRef]
  5. Colombo, P.; Brusatin, G.; Bernardo, E.; Scarinci, G. Inertization and reuse of waste materials by vitrification and fabrication of glass- based products. Curr. Opin. Solid State Mater. Sci. 2003, 7, 225–239. [Google Scholar] [CrossRef]
  6. Schulz, R.L. Microwave Remediation of Electronic Circuitry Waste and the Resulting Gaseous Emissions. Ph.D. Thesis, University of Florida, Gainesville, FL, USA, 1998. [Google Scholar]
  7. Schulz, R.L.; Wicks, G.G.; Folz, D.C.; Clark, D.E. Overview of hybrid microwave technology. J. South Carol. Acad. Sci. 2011, 9, 25–29. [Google Scholar]
  8. Wang, Y.F.; Wang, L.C.; Hsieh, T.L.; Li, H.W.; Jiang, H.C.; Lin, Y.S.; Tsai, C.H. Effect of temperature and CaO addition on the removal of polychlorinatee. Aerosol Air Qual. Res. 2012, 22, 191–199. [Google Scholar] [CrossRef]
  9. Kavouras, P.; Kaimakamis, G.; Ioannidis, T.A.; Kehagias, T.; Komninou, P.; Kokkou, S.; Pavlidou, E.; Antonopoulos, I.; Sofoniou, M.; Zouboulis, A.; et al. Vitrification of lead-rich solid ashes frim incineration of hazardous industrial waste. Waste Manag. 2003, 23, 361–371. [Google Scholar] [CrossRef]
  10. Silva, A.C.; Mello-Castanho, S.R.H. Vitrified galvanic waste chemical stability. J. Eur. Ceram. Soc. 2007, 27, 565–570. [Google Scholar] [CrossRef]
  11. Bingham, P.A.; Hand, R.J. Vitrified metal finishing wastes: I Composition, density and chemical durability. J. Hazard. Mater. 2005, 119, 125–133. [Google Scholar] [CrossRef]
  12. Kuo, Y.M.; Huang, K.L.; Lin, C.L. Metal behaviour during vitrification of municipal solid waste incinerator fly ash. Aerosol Air Qual. Res. 2012, 12, 1379–1385. [Google Scholar] [CrossRef]
  13. Stabile, P.; Bello, M.; Petrelli, M.; Paris, E.; Carroll, M.R. Vitrification treatment of municipal solid waste bottom ash. Waste Manag. 2019, 95, 250–258. [Google Scholar] [CrossRef]
  14. Hemmings, R.T.; Berry, E.E. On the glass in coal fly ashes: Recent advances. MRS Proc. 1987, 113, 3–38. [Google Scholar] [CrossRef]
  15. Pan, X.C.; Yan, J.H.; Xie, Z.M. Detoxifying PCDD/Fs heavy metals in fly ash from medical waste incinerators with a DC double arc plasma torch. J. Environ. Sci. 2013, 25, 1362–1367. [Google Scholar] [CrossRef] [PubMed]
  16. Zhang, Z.; Li, A.M.; Wang, X.X.; Zhang, L. Stabilization/solidification of municipal solid waste incineration fly ash via co-sintering with waste-derived vitrified amorphous slag. Waste Manag. 2016, 56, 238–245. [Google Scholar] [CrossRef] [PubMed]
  17. Pei, S.L.; Chen, T.L.; Pan, S.Y.; Yang, Y.L.; Sun, Z.H.; Li, Y.J. Addressing environmental sustainability of plasma vitrification technology for stabilization of municipal solid waste incineration fly ash. J. Hazard Mater. 2020, 398, 122959. [Google Scholar] [CrossRef]
  18. Zhao, P.; Ni, G.; Jiang, Y.; Chen, L.W.; Chen, M.Z.; Meng, Y.D. Destruction of inorganic municipal solid waste incinerator fly ash in a DC arc plasma furnace. J. Hazard Mater. 2010, 181, 580–585. [Google Scholar] [CrossRef]
  19. Deloitte. Study on Resource Efficient Use of Mixed Wastes, Improving Management of Construction and Demolition Waste—Final Report; Prepared for the European Commission DG ENV; European Commission: Luxembourg, 2017. [Google Scholar]
  20. Henderson, G.S.; Calas, G.; Stebbins, J.F. The structure of silicate glasses and melts. Elements 2006, 2, 269–273. [Google Scholar] [CrossRef]
  21. Favaretto, P.; Hidalgo, G.E.N.; Sampaio, C.H.; Silva, R.D.A.; Lermen, R.T. Characterization and use of construction and demolition waste from south of Brazil in the production of foamed concrete blocks. Appl. Sci. 2017, 7, 1090. [Google Scholar] [CrossRef]
  22. Galderisi, A.; Iezzi, G.; Bianchini, G.; Paris, E.; de Brito, J. Petrography of construction and demolition waste (CDW) from Abruzzo region (Central Italy). Waste Manag. 2022, 137, 61–71. [Google Scholar] [CrossRef]
  23. Galderisi, A.; Bravo, M.; Iezzi, G.; Cruciani, G.; Paris, E.; Brito, J. Physico-Mechanical Performances of Mortars Prepared with Sorted Earthquake Rubble: The Role of CDW Type and Contained Crystalline Phases 2023. Materials 2023, 16, 2855. [Google Scholar] [CrossRef]
  24. Whittaker, M.J.; Grigoriadis, K.; Soutsos, M.; Sha, W.; Klinge, A.; Paga-noni, S.; Casado, M.; Brander, L.; Mousavi, M.; Scullin, M.; et al. Novel construction and demolition waste (CDW) treatment and uses to maximize reuse and recycling. Adv. Build. Energy Res. 2019, 15, 253–269. [Google Scholar] [CrossRef]
  25. Abidi, S.; Nait-Ali, B.; Joliff, Y.; Favotto, C. Impact of perlite, vermiculite and cement on the thermal conductivity of a plaster composite material: Experimental and numerical approaches. Compos. Part B 2015, 68, 392–400. [Google Scholar] [CrossRef]
  26. Jedidi, M.; Benjeddou, O.; Soussi, C. Effect of expanded perlite aggregate dosage on properties of lightweight concrete. Jordan J. Civ. Eng. 2015, 9, 278–291. [Google Scholar] [CrossRef]
  27. Herki, B.; Khatib, J. Valorisation of waste expanded polysteyrene in concrete using a novel recycling technique. Eur. J. Environ. Civ. Eng. 2017, 21, 1384–1402. [Google Scholar] [CrossRef]
  28. Bernal, S.A.; Rodríguez, E.D.; Kirchheim, A.P.; Provis, J.L. Management and valorisation of wastes through use in producing alkali-activated cement materials. J. Chem. Technol. Biotechnol. 2016, 91, 2365–2388. [Google Scholar] [CrossRef]
  29. Ossoli, E.; Volpintesta, F.; Stabile, P.; Reggiani, A.; Santulli, C.; Paris, E. Upcycling of composite materials waste into geopolymer-based mortars for applications in the building sector. Mater. Lett. 2022, 333, 133625. [Google Scholar] [CrossRef]
  30. Volpintesta, F.; Ossoli, E.; Reggiani, A.; Stabile, P.; Santulli, C.; Paris, E. Geopolymers-based application for the up-cycling utilization of construction and demolition waste from the 2016 central Italy earthquakes. Mater. Lett. 2023, 336, 133849. [Google Scholar] [CrossRef]
  31. Barbieri, L.; Corradi Bonamartini, A.C.; Lancellotti, I. Alkaline and alkaline-earth silicate glasses and glass-ceramics from municipal and industrial wastes. J. Eur. Ceram. Soc. 2000, 20, 2477–2483. [Google Scholar] [CrossRef]
  32. Abudurehman, A.; Stabile, P.; Carroll, M.R.; Santulli, C.; Paris, E. Mineralogical and chemical characterization of CDW as function of particle size and thermal treatments for potential recycling. Detritus 2021, 15, 40–50. [Google Scholar] [CrossRef]
  33. Zanelli, C.; Conte, S.; Molinari, C.; Soldati, R.; Dondi, M. Waste recycling in ceramic tiles: A technological outlook. Resources. Conserv. Recycl. 2021, 168, 105289. [Google Scholar] [CrossRef]
  34. Karamanov, A.; Karamanova, E.; Ferrari, A.M.; Ferrante, F.; Pelino, M. The effect of fired scrap addition on the sintering behavior of hard porcelain. Ceram. Int. 2006, 32, 727–732. [Google Scholar] [CrossRef]
  35. Gomes, M.L.P.; Carvalho, E.A.; Sobrinho, L.N.; Monteiro, S.N.; Rodriguez, R.J.; Vieira, C.M.F. Production and characterization of a novel artificial stone using brick residue and quarry dust in epoxy matrix. J. Mater. Res. Technol. 2018, 7, 492–498. [Google Scholar] [CrossRef]
  36. Perugini, V.; Paris, E.; Giuli, G.; Carroll, M.R. The use of urban ceramic wastes in eco-sustainable durable cement. In Proceedings of the 34th Cement and Concrete Science, Sheffield, UK, 14–17 September 2014; Conference Paper Number 223. University of Sheffield: Sheffield, UK, 2014. [Google Scholar]
  37. Baeza-Brotons, F.; Percis, G.; Payá, J.; Saval, J. Portland cement systems with addition of sewage sludge ash. Application in concretes for the manufacture of blocks. J. Clean. Prod. 2014, 82, 112–124. [Google Scholar] [CrossRef]
  38. Luo, H.; Cheng, Y.; He, D.; Yang, E.-H. Review of leaching behavior of municipal solid waste incineration (MSWI) ash. Sci. Total Environ. 2019, 668, 90–103. [Google Scholar] [CrossRef]
  39. Chipera, S.J.; Bish, D.L. Fitting full X-ray diffraction patterns for quantitative analysis: A method for readily quantifying crystalline and disordered phases. Adv. Mater. Phys. Chem. 2013, 3, 47–53. [Google Scholar] [CrossRef]
  40. Boncio, P.; Amoroso, S.; Galadini, F.; Galderisi, A.; Iezzi, G.; Liberi, F. Earthquake- induced liquefaction features in a late Quaternary fine-grained lacustrine succession (Fucino Lake, Italy): Implications for microzonation studies. Eng. Geol. 2020, 272, 105621. [Google Scholar] [CrossRef]
  41. Abramoff, M.D.; Magalhaes, P.J.; Ram, S.J. Image processing with ImageJ. Biophotonics Int. 2004, 11, 36–42. [Google Scholar]
  42. Schneider, C.A.; Rasband, W.S.; Eliceiri, K.W. NIH Image to ImageJ: 25 years of image analysis. Nat. Methods 2012, 9, 671–675. [Google Scholar] [CrossRef]
  43. Arzilli, F.; Stabile, P.; Fabbrizio, A.; Landi, P.; Scaillet, B.; Paris, E.; Carroll, M.R. Crystalliza- tion kinetics of alkali feldspar in peralkaline rhy- olitic melts: Implications for pantelleria volcano. Front. Earth Sci. 2020, 8, 177. [Google Scholar] [CrossRef]
  44. Hammer, J.E.; Cashman, K.V.; Hoblitt, R.P.; Newman, S. Degassing and microlite crystallisation during pre-climactic events of the 1991 eruption of Mt. Pinatubo, Philippines. Bull. Volcanol 1999, 60, 355–380. [Google Scholar] [CrossRef]
  45. Wright, T.L.; Doherty, P.C. A linear programming and least squares computer method for solving petrologic mixing problems. Geol. Soc. Am. Bull. 1970, 81, 1925–2008. [Google Scholar] [CrossRef]
  46. Stormer, J.C., Jr.; Nicholls, J. XLFRAC: A program for the interactive testing of magmatic differentiation models. Comput. Geosci. 1978, 4, 143–159. [Google Scholar] [CrossRef]
  47. Caurant, D. Glass-ceramics for waste immo- bilization. In Glass to Crystal—Nucleation, Growth and Phase Separation: From Research to Applications; Neuville, D., Cormier, L., Caurant, D., Montagne, L., Eds.; EDP Sciences: Les Ulis, France, 2017; pp. 492–525. [Google Scholar]
  48. Karamanov, A.; Paunovic, P.; Ranguelov, B.; Ljatifi, E.; Kamusheva, A.; Nacevski, G.; Karamanova, E.; Grozdanov, A. Vitrification of hazardous Fe-Ni wastes into glass-ceramic with fine crystalline structure elevated exploitation chracteristics. J. Environ. Chem. Eng. 2017, 5, 432–441. [Google Scholar] [CrossRef]
  49. Manning, D.A.C. Cement and Plasters Industrial Minerals; Chapman & Hall: London, UK, 1995; pp. 141–155. [Google Scholar]
  50. Bianchini, G.; Marrocchino, E.; Tassinari, R.; Vaccaro, C. Recycling of construction and demolition waste materials: A chemical–mineralogical appraisal. Waste Manag. 2005, 25, 149–159. [Google Scholar] [CrossRef]
  51. McCloy, J.S.; Schuller, S. Vitrification of wastes: From unwanted to controlled crystallization, a review. Comptes Rendus. Géosci. 2022, 354, 121–160. [Google Scholar] [CrossRef]
  52. Stabile, P.; Webb, S.; Knipping, J.L.; Behrens, H.; Paris, E.; Giuli, G. Viscosity of pantelleritic and alkali silicate melts: Effect of Fe redox state and Na/(Na + K) ratio. Chem. Geol. 2016, 442, 73–82. [Google Scholar] [CrossRef]
  53. Stabile, P.; Giuli, G.; Cicconi, M.R.; Paris, E.; Trapananti, A.; Behrens, H. The effect of oxygen fugacity Na/(Na + K) ratio on iron speciation in pantelleritic glasses. J. Non-Cryst. Solids 2017, 478, 65–74. [Google Scholar] [CrossRef]
  54. Stabile, P.; Sicola, S.; Giuli, G.; Paris, E.; Carroll, M.R.; Deubener, J.; Di Genova, D. The effect of iron and alkali on the nanocrystal-free viscosity of volcanic melts: A combined Raman spectroscopy and DSC study. Chem. Geol. 2021, 559, 119991. [Google Scholar] [CrossRef]
  55. Schaffer, H.A.; Langfeld, R.; Benz-Zauner, M. Glastechnik. Glass: The Material; Deutsches Museum Verlag: Munich, Germany, 2010; ISBN 978-3-940396-35-8. [Google Scholar]
  56. Sharifikolouei, E.; Baino, F.; Salvo, M.; Tommasi, T.; Pirone, R.; Fino, D.; Ferraris, M. Vitrification of municipal solid waste incineration fly ash: A successful batch composition. Ceram. Int. 2021, 47, 7738–7744. [Google Scholar] [CrossRef]
  57. Kucharczyk, S.; Sitarz, M.; Maciej, Z.; Deja, J. The effect of CaO/SiO2 molar ratio of CaO-Al2O3-SiO2 glasses on their structure and reactivity in alkali activated system. Spectrochim. Acta Part A Mol. Biomol. Spectrosc. 2018, 194, 163–171. [Google Scholar] [CrossRef] [PubMed]
  58. Rankin, G.A. The ternary system CaO–Al2O3–SiO2, with optical study by F. E. Wright. Am. J. Sci. 1915, 39, 1–79. [Google Scholar] [CrossRef]
  59. Wang, S.; Gainey, L.; Marinelli, J.; Deer, B.; Wang, X.; Mackinnon, I.D.R.; Xi, Y. Effects of vermiculite on in-situ thermal behaviour, microstructure, physical and mechanical properties of fired clay bricks. Constr. Build. Mater. 2022, 316, 125828. [Google Scholar] [CrossRef]
  60. Wang, S.; Gainey, L.; Mackinnon, I.D.R.; Allen, C.; Gu, Y.; Xi, Y. Thermal behaviors of clay minerals as key components and additives for fired brick properties: A review. J. Build. Eng. 2023, 66, 105802. [Google Scholar] [CrossRef]
  61. Flesoura, G.; Dilissen, N.; Dimitrakis, G.; Vleugels, J.; Pontikes, Y. A new approach for the vitrification of municipal solid waste incinerator bottom ash by microwave irradiation. J. Clean. Prod. 2021, 284, 124784. [Google Scholar] [CrossRef]
  62. Bahoria, B.V.; Parbat, D.K.; Naganaik, P.B. Replacement of natural sand in concrete by waste products: A State of Art. J. Environ. Res. Dev. 2013, 7, 1651–1657. [Google Scholar]
  63. Lin, K.L.; Wang, K.S.; Tzeng, B.Y.; Lin, C.Y. The hydration characteristics and utilization of slag obtained by the vitrification of MSWI fly ash. Waste Manag. 2004, 24, 199–205. [Google Scholar] [CrossRef]
  64. Rodriguez, M.; Alonso-Fariñas, B.; Baena-Moreno, F.; Leiva, C.; Navarrete, B.; Vilches, L. Synthetic Slag Production Method Based on a Solid Waste Mix Vitrification for the Manufacturing of Slag-Cement. Materials 2019, 12, 208. [Google Scholar] [CrossRef]
  65. Stabile, P.; Radica, F.; Ranza, L.; Carroll, M.R.; Santulli, C.; Paris, E. Dimensional, Mechanical and LCA Characterization of Terrazzo Tiles along with Glass and Construction, and Demolition Waste (CDW). Recent Prog. Mater. 2021, 3, 2101006. [Google Scholar] [CrossRef]
Figure 1. CaO-Al2O3-SiO2 (CAS) diagram showing the initial waste chemical compositions together with some approximate waste and industrial and related materials’ compositional areas from the literature [28,30]. Waste samples in this study as described in text and in Table 1 (CDW sample, triangle; other waste samples, black circles).
Minerals 13 01378 g001
Figure 2. X-ray powder diffraction patterns of all the investigated wastes of this study. Major diffraction peaks indicate cc = calcite, qz = quartz, ab = albite, mu = mullite, cr = cristobalite, gh = gehlenite, mg = magnesioferrite, bt = biotite, gy = gypsum. Sample names and compositions as in Table 1.
Minerals 13 01378 g002
Figure 3. X-ray powder diffraction patterns of all the vitrification products. Notes: gh = gehlenite, wo = wollastonite, qz = quartz, an = anorthite, cr = cristobalite, di = diopside, mg = magnesioferrite.
Minerals 13 01378 g003
Figure 4. Back-scattered electron (BSE) images of the 3 complete series of CDW mixes made with selected waste materials; (a) GLU = car windshield, (b) CP = ceramic powder waste, (c) BR = brick powder. Values at the top right of figures refer to the amount of waste (%) in the mix. Textural data were obtained using ImageJ (details in the text). Percentage of the total image areas occupied by the amorphous fraction have been determined, in volume % (assumed = area % on images), as follows: (a) 53%, 63%, 87%; (b) 54%, 67%, 100%; (c) 64%, 77%, 100%, for the samples obtained by 30, 50, 70 wt.% mixes, respectively.
Minerals 13 01378 g004
Figure 5. Quantity (wt.%) of amorphous material ((am) values reported in the tables) versus (a) amount of waste added (wt.%) to CDW and (b) versus the sum (SiO2 + Al2O3) of selected vitrification products. Notes: arrows are only eye guides of the different trends.
Minerals 13 01378 g005
Figure 6. Distribution in the CaO-Al2O3-SiO2 (CAS) diagram (P = 1 atm.) of the waste-based vitrification products. The sub-systems wollastonite-anorthite-quartz and wollastonite-gehlenite-anorthite with indication of thermal minima temperatures (indicated as e, T1 = 1170 °C and T2 = 1265 °C) are reported.
Minerals 13 01378 g006
Table 1. Chemical composition (wt.%) and crystalline phases and amorphous component present in the starting waste samples.
Starting
Sample
SiO2Al2O3FeOCaOMgOMnONa2OK2OP2O5TotalPhases Present
(wt.%)
CDW32.896.422.7954.431.60-0.581.29-100gy(tr), qz(8), cc(44), am(48)
CP73.3217.821.160.900.740.023.612.320.09100ab(tr), qz(35), am(65)
GRA *45.786.195.3136.563.280.121.431.250.08100ab(tr), cr(tr), en(tr), bt(tr), qz(28), cc(33), am(39)
MU68.2525.290.811.151.280.020.812.350.05100cc(tr), mu(tr), qz(37), am(63),
PP68.0525.870.640.830.570.010.783.220.02100mu(tr), cc(tr), qz(37), am(63)
RT60.6014.405.4010.303.100.101.602.300.10100mu(tr), cc(4), ab(21), qz(33), am(42)
BR58.2914.266.1013.973.040.110.963.080.19100cc(tr), qz(17), ab(43), am(40)
BA46.189.3416.3617.252.711.135.500.960.58100mu(5), mg(6), cc(6), gh(10), qz(17), am(56)
FA58.3821.498.055.222.680.080.942.470.67100mu(12), qz(18), am(70)
G1572.253.430.4111.121.25-10.191.35-100am(100)
GLU74.550.800.109.804.40-10.090.40-100am(100)
Notes: Totals have been normalized to 100. XRF 1σ errors based on counting statistics for major oxides (wt.%) are the following: 0.37 SiO2, 0.56 Al2O3, 0.16 FeO, 0.01 CaO, 0.20 MgO, 0.01 MnO, 0.03 Na2O, 0.04 K2O, 0.02 P2O5. * Loss on ignition (LOI) in GRA sample was 24.2%.CDW = starting composition from Abudurehman et al. (2021) [32]; PP = porcelain plate; G15 = municipal glass; CP = ceramic powder; GLU = windshield glass; MU = ceramic cup; GRA = cement tiles cutting sludge; RT = roof tile MPA09 from [22]; BR = brick; FA = fly ash collected at Rimini incinerator; BA = bottom ash from [13]. Crystalline phases identified by XRPD: cc = calcite; qz = quartz; mu = mullite; ab = albite; en = enstatite; bt = biotite; gy = gypsum; mg = magnesioferrite; gh = gehlenite; am = amorphous phase component. The Reference Intensity Ratio (RIR) method was used to quantify the crystalline and the amorphous phases present.
Table 2. Chemical composition (wt.%) and mineralogical and amorphous phases present in the vitrified samples.
SamplesPhaseSiO2Al2O3FeOCaOMgOMnONa2OK2OP2O5TotalPhases Present (wt.%)Ca/Si, Moles
A30
CDW-70%
GLU-30%
Glass45.27(0.39)7.45(0.16)2.52(0.06)26.86(0.50)3.31(0.14)0.09(0.04)9.88(0.21)1.48(0.04)0.13(0.03)97.00qz(nd), gh(9), wo(33), am(58)0.64
Wollastonite50.98(0.37)0.03(0.03)0.04(0.03)48.05(0.27)0.02(0.01)0.01(0.01)0.05(0.04)0.01(0.01)0.00(0.00)99.21
A50
CDW-50%
GLU-50%
Glass57.14(0.10)4.68(0.13)1.34(0.11)18.87(0.14)3.91(0.67)0.06(0.03)10.83(0.13)0.94(0.02)0.07(0.05)97.84qz(nd), gh(nd),
wo(25), am(75)
0.35
Wollastonite51.04(0.79)0.02(0.02)0.03(0.03)47.64(0.25)0.05(0.02)0.02(0.02)0.06(0.01)0.02(0.01)0.03(0.03)98.92
A70
CDW-30%
GLU-70%
Glass64.47(0.12)2.36(0.07)0.52(0.02)18.00(0.10)3.42(0.05)0.04(0.03)10.68(0.11)0.52(0.02)0.03(0.01)100.02qz(tr), wo(10), am(90)0.30
Wollastonite51.35(0.89)0.01(0.01)0.02(0.03)47.92(0.21)0.04(0.03)0.02(0.01)0.08(0.08)0.03(0.04)0.08(0.01)99.48
B30
CDW-70%
BR-30%
Glass37.49(0.46)9.00(0.22)6.08(0.40)38.12(0.14)1.45(0.12)0.21(0.04)0.92(0.06)2.70(0.17)0.37(0.04)96.34qz(nd), mg(tr),wo(22), gh(25), am(53)1.09
Wollastonite48.11(0.81)3.29(0.61)0.75(0.05)45.99(0.56)0.79(0.06)0.03(0.02)0.20(0.01)0.18(0.08)0.02(0.02)99.35
B50
CDW-50%
BR-50%
Glass42.79(0.25)13.63(0.06)4.81(0.06)29.81(0.06)2.55(0.10)0.10(0.02)0.86(0.05)2.27(0.05)0.14(0.05)96.97qz(tr), gh(tr),
wo(15), am(85)
0.75
Wollastonite50.29(0.91)0.99(0.13)0.48(0.46)46.44(0.83)0.21(0.22)0.01(0.01)0.11(0.01)0.24(0.02)0.02(0.02)98.80
B70
CDW-30%
BR-70%
Glass50.15(0.08)12.99(0.08)4.89(0.08)24.41(0.09)2.43(0.03)0.07(0.01)0.84(0.03)2.39(0.03)0.12(0.05)98.29am(100)0.52
C30
CDW-70%
CP-30%
Glass42.45(0.50)16.42(0.18)2.25(0.09)28.90(0.34)1.45(0.04)0.09(0.02)2.68(0.06)2.39(0.04)0.16(0.03)96.78qz(nd), gh(5), wo(23), am(72)0.73
Wollastonite50.83(0.52)0.40(0.77)0.09(0.11)47.66(0.70)0.04(0.06)0.00(0.00)0.09(0.14)0.09(0.11)0.01(0.02)99.20
SAMPLEPhaseSiO2Al2O3FeOCaOMgOMnONa2OK2OP2O5TotalPhases present (wt.%)C/S
C50
CDW-50%
CP-50%
Glass55.60(0.78)14.70(0.21)1.28(0.12)20.57(0.89)0.91(0.06)0.05(0.03)2.49(0.14)2.05(0.12)0.10(0.05)97.76qz(tr), gh(tr),
wo(18), am(82)
0.40
Wollastonite51.47(0.61)0.27(0.14)0.08(0.03)46.90(0.60)0.03(0.02)0.03(0.02)0.11(0.07)0.13(0.07)0.03(0.03)99.05
C70
CDW-30%
CP-70%
Glass62.18(0.99)15.11(0.25)1.17(0.11)15.28(0.73)0.77(0.08)0.06(0.04)2.50(0.09)1.74(0.12)0.12(0.02)98.94am(100)0.26
D70
CDW-30%
G15-70%
Glass63.64(0.56)2.67(0.13)0.76(0.04)17.75(0.36)2.02(0.05)0.05(0.03)10.72(0.20)0.86(0.04)0.05(0.03)98.54qz(nd), gh(tr),
wo(33), am(67)
0.30
Wollastonite51.45(0.54)0.00(0.00)0.02(0.02)47.79(0.40)0.02(0.02)0.02(0.02)0.07(0.02)0.03(0.01)0.02(0.01)99.44
H70
CDW-30%
PP-70%
Glass63.75(2.06)15.75(1.74)0.89(0.10)14.47(0.53)0.90(0.13)0.02(0.02)0.96(0.02)2.00(0.18)0.07(0.07)98.80an(11), am(89)0.24
I70
CDW-30%
RT70%
Glass51.60(0.42)12.54(0.39)4.61(0.07)21.98(0.21)2.52(0.05)0.06(0.04)1.22(0.07)2.54(0.05)0.14(0.03)97.22am(100)0.46
G70
CDW-30%
GRA-70%
Glass39.39(0.26)10.52(0.13)7.23(0.13)32.58(0.29)2.10(0.17)0.23(0.02)1.83(0.12)2.15(0.06)0.19(0.09)96.22qz(nd), gh(18), wo(19), am(63)0.89
E70
CDW-30%
MU-70%
Glass60.18(1.60)17.70(2.18)0.85(0.010)14.12(0.37)1.10(0.19)0.04(0.01)0.70(0.04)2.27(0.18)0.11(0.06)97.04cr(tr), mg(tr), an(18), am(82)0.25
F70
CDW-30%
FA-70%
Glass49.58(0.62)22.24(1.12)5.14(0.27)15.58(0.40)1.87(0.19)0.06(0.02)0.54(0.03)2.06(0.18)0.45(0.06)97.52cr(tr), mg(tr), an(43), am(57)0.34
L70
CDW-30%
FA-BA70%
Glass44.91(0.47)21.87(0.72)5.31(1.97)19.98(1.34)1.09(0.090.25(0.02)1.94(0.54)0.82(0.06)0.18(0.07)96.33di(41), am(59)0.48
Notes: Microprobe analyses on glasses are based on 10 measurements on each glass fragment, using analysis conditions as described in text. The 1σ standard deviation errors for glasses and for the single phases are reported in parenthesis. Percentages of 30%, 50% and 70% are wt.% referring to the amount of non-CDW material added to the CDW mixes. Major crystalline phases identified: wo = wollastonite; an = anorthite; gh = gehlenite; di = diopside; cr = cristobalite; mg = magnesioferrite; qz = quartz; am = X-ray amorphous material. The Reference Intensity Ratio (RIR) method [39,40] was used to quantify the crystalline and the amorphous phases abundances. C/S = CaO/SiO2 molar ratio in bulk material, calculated from proportions of material (Table 1) used in mixtures. (nd) and (tr) mean not determined and trace, respectively.
Disclaimer/Publisher’s Note: The statements, opinions and data contained in all publications are solely those of the individual author(s) and contributor(s) and not of MDPI and/or the editor(s). MDPI and/or the editor(s) disclaim responsibility for any injury to people or property resulting from any ideas, methods, instructions or products referred to in the content.

