Article

Preparation and Characterization of Mercapto-Functionalized Calcined Attapulgite and Its Removal of Pb (II) and Cd (II) Solution

College of Environment and Resources, Southwest University of Science & Technology, Mianyang 621010, China
*
Author to whom correspondence should be addressed.
Minerals 2023, 13(10), 1337; https://doi.org/10.3390/min13101337
Submission received: 10 September 2023 / Revised: 4 October 2023 / Accepted: 13 October 2023 / Published: 17 October 2023

Abstract

:
To enhance the sorption efficacy of attapulgite for heavy metals, mercapto-functionalized attapulgite (ATP-SH) was synthesized with mercaptan functional groups. When the mass-to-volume ratio of calcined attapulgite (ATP-C) to 3-Mercapropyltrimethoxysilane (MPTMS) was 1 g:0.5 mL (ATP-SH-0.5) and the pH was set to 8, a strong adsorption capacity for Cd (II) and Pb (II) was demonstrated. This indicates excellent adsorption performance for these heavy metals. ATP-SH-0.5 exhibited a maximum adsorption capacity of 43.81 mg/g and 274.83 mg/g for Cd (II) and Pb (II), respectively, in a single ion system. In a binary ion system, the maximum adsorption capacity was 31.86 mg/L and 254.45 mg/L for Cd (II) and Pb (II), respectively. Various characterizations and experiments showed that the adsorption of Cd (II) and Pb (II) onto ATP-SH-0.5 involves ion exchange reactions involving hydroxyl and thiol functional group complexation reactions. This adsorption process follows a single-molecule layer adsorption mechanism. XPS results indicate that hydroxyl and grafted thiol functional groups on the surface of mercapto-functionalized attapulgite participated in surface complexation reactions with Cd (II) and Pb (II), resulting in the formation of Cd-S and Pb-S species. Overall, this study provides a promising mercapto-functionalized modification material for the remediation of polluted water and soil.

1. Introduction

Due to the continuous development of industrial technologies, the treatment of wastewater containing heavy metals remains a challenging issue for ecosystems and biosecurity [1]. Lead (Pb) and cadmium (Cd) are the most common toxic heavy metals [2,3], and they can have toxic effects on organisms even at low concentrations. Cd primarily enters the human body through food consumption and can cause symptoms such as difficulty breathing, drooling, nausea, vomiting, anemia, abdominal pain, and diarrhea. In severe cases, cadmium exposure can result in kidney disease and even death, particularly when the cadmium concentration in the kidneys reaches 200 mg/kg [4,5,6]. Pb mainly enters the human body through the respiratory and digestive tracts, and can cause damage to almost all tissues and organs. Mild inhalation of lead may cause high blood pressure, decreased nerve function, and limb pain and weakness, whereas excessive inhalation can lead to kidney damage, miscarriage, severe brain damage, and ultimately death [7,8].
Numerous studies have investigated the removal of heavy metals such as Pb (II) and Cd (II) using various methods, including photocatalysis degradation, membrane filtration, ion-exchange, flocculation, chemical precipitation, electrochemical treatment, and adsorption [9,10,11]. Among these methods, adsorption is considered one of the most efficient and simple approaches due to its operational simplicity, high efficiency and selectivity, recyclability, and low cost. The key to successful adsorption lies in selecting the optimal adsorption material and preparation processes, which directly affect the final remediation results. Natural or modified clay minerals have received much attention as potential adsorbents due to their low cost and special crystal layer structure for removing heavy metal pollution. Attapulgite, a type of water-bearing magnesium-rich aluminum silicate clay mineral with a layered chain structure, is evaluated as an appropriate adsorbent due to its layered structure and good chemical and mechanical stability [12,13,14]. However, natural attapulgite has limitations such as limited adsorption capacity, unstable adsorption products, and low heavy metal selectivity. To overcome these limitations, attapulgite is often modified or mixed with inorganic salts [13,14,15] to improve the stability of adsorbed products and the selectivity of metal types.
It is widely recognized that mercaptan groups can significantly enhance the removal of heavy metal ions. Ref. [16] synthesized mercapto-modified coal gangue (CG-SH), which displayed outstanding performance in removing Pb (II), Cd (II), and Hg (II) with adsorption capacities of 332.8 mg/g, 110.4 mg/g, and 179.2 mg/g, respectively. Ref. [17], prepared a (3-mercaptopropyl) triethoxysilane-functionalized ordered mesoporous silica modified polyvinylidene fluoride (MPTMS-OMS/PVDF) membrane, which demonstrated a high removal efficiency of Cd2+ with 90% removal at an MPTMS-OMS content of 5 wt%. In contrast, the pure PVDF membrane showed no Cd2+ adsorption capacity, indicating the potential of the MPTMS-OMS/PVDF membrane to effectively eliminate Cd2+ during the decontamination of aqueous streams containing low concentrations of contaminants. In addition, materials modified with thiol groups will enhance the selective adsorption of a certain heavy metal. The chemical properties of materials modified with thiol groups will change. The thiol grafted chitosan-modified biochar (TH@CT-BC) was introduced by a two-step combination to enhance the adsorption ability of biochar [18], which retained its efficiency in a spiked river water system, removing up to 89% of Cd in river water spiked with 30 mg/L Cd. Ref. [19] prepared a chelating resin with amine-mercaptan groups, suggesting that Hg (II) could be selectively separated from Ca (II), Mg (II), Pb (II), Cd (II), Cu (II), and Zn (II) at pH 2.7. Therefore, mercaptan groups as an effective adsorbent of heavy metals from aqueous systems can be studied as a potential candidate for practical wastewater treatment applications.
In this study, we investigated the potential of attapulgite modified with mercaptan groups (ATP-SH) to remove heavy metal ions through the formation of heavy metal complexes and coprecipitates, as well as the enhancement of oxidation-reduction reactions. By introducing -SH and S-S groups, ATP-SH was expected to exhibit improved adsorption capacity for Pb (II) and Cd (II) in water. To further explore the adsorption mechanisms and competitive adsorption of Pb (II) and Cd (II) in binary (Pb-Cd) systems, X-ray photoelectron spectroscopy (XPS) was utilized to qualitatively analyze the effects of Pb (II) and Cd (II) adsorption.

2. Materials and Methods

2.1. Materials

Ethanol was acquired by Chengdu Cologne Chemistry. 3-Mercapropyltrimethoxysilane (MPTMS) was offered by Shanghai Aladdin Biochemical Technology Co., Ltd. (Shanghai, China). The attapulgite raw ore (ATP-O) and calcined attapulgite (ATP-C) were provided by Xuyi County Zhongcai Attapulgite Clay Co., Ltd. (Huai’an, China). The chemical composition of ATP is shown in Table 1.

2.2. Preparation and Screening of Mercapto-Functionalized Attapulgite (ATP-SH-X)

2.2.1. Selection of Modified Raw Materials

ATP-O and ATP-C were selected. Both types of attapulgite were air-dried naturally, followed by storage for further analysis. The samples were sieved to a particle size below 100 mesh. The raw materials were ground into powder using an analytical grinder. Each attapulgite sample (0.1 g) was placed into a centrifuge tube with a capacity of 50 mL; 30 mL of 100 mg/L Cd (II) and 500 mg/L Pb (II) mixed solutions were added to the respective samples. All sample solutions were shaken at room temperature and then centrifuged. The supernatant was analyzed by passing it through a water filtration membrane.

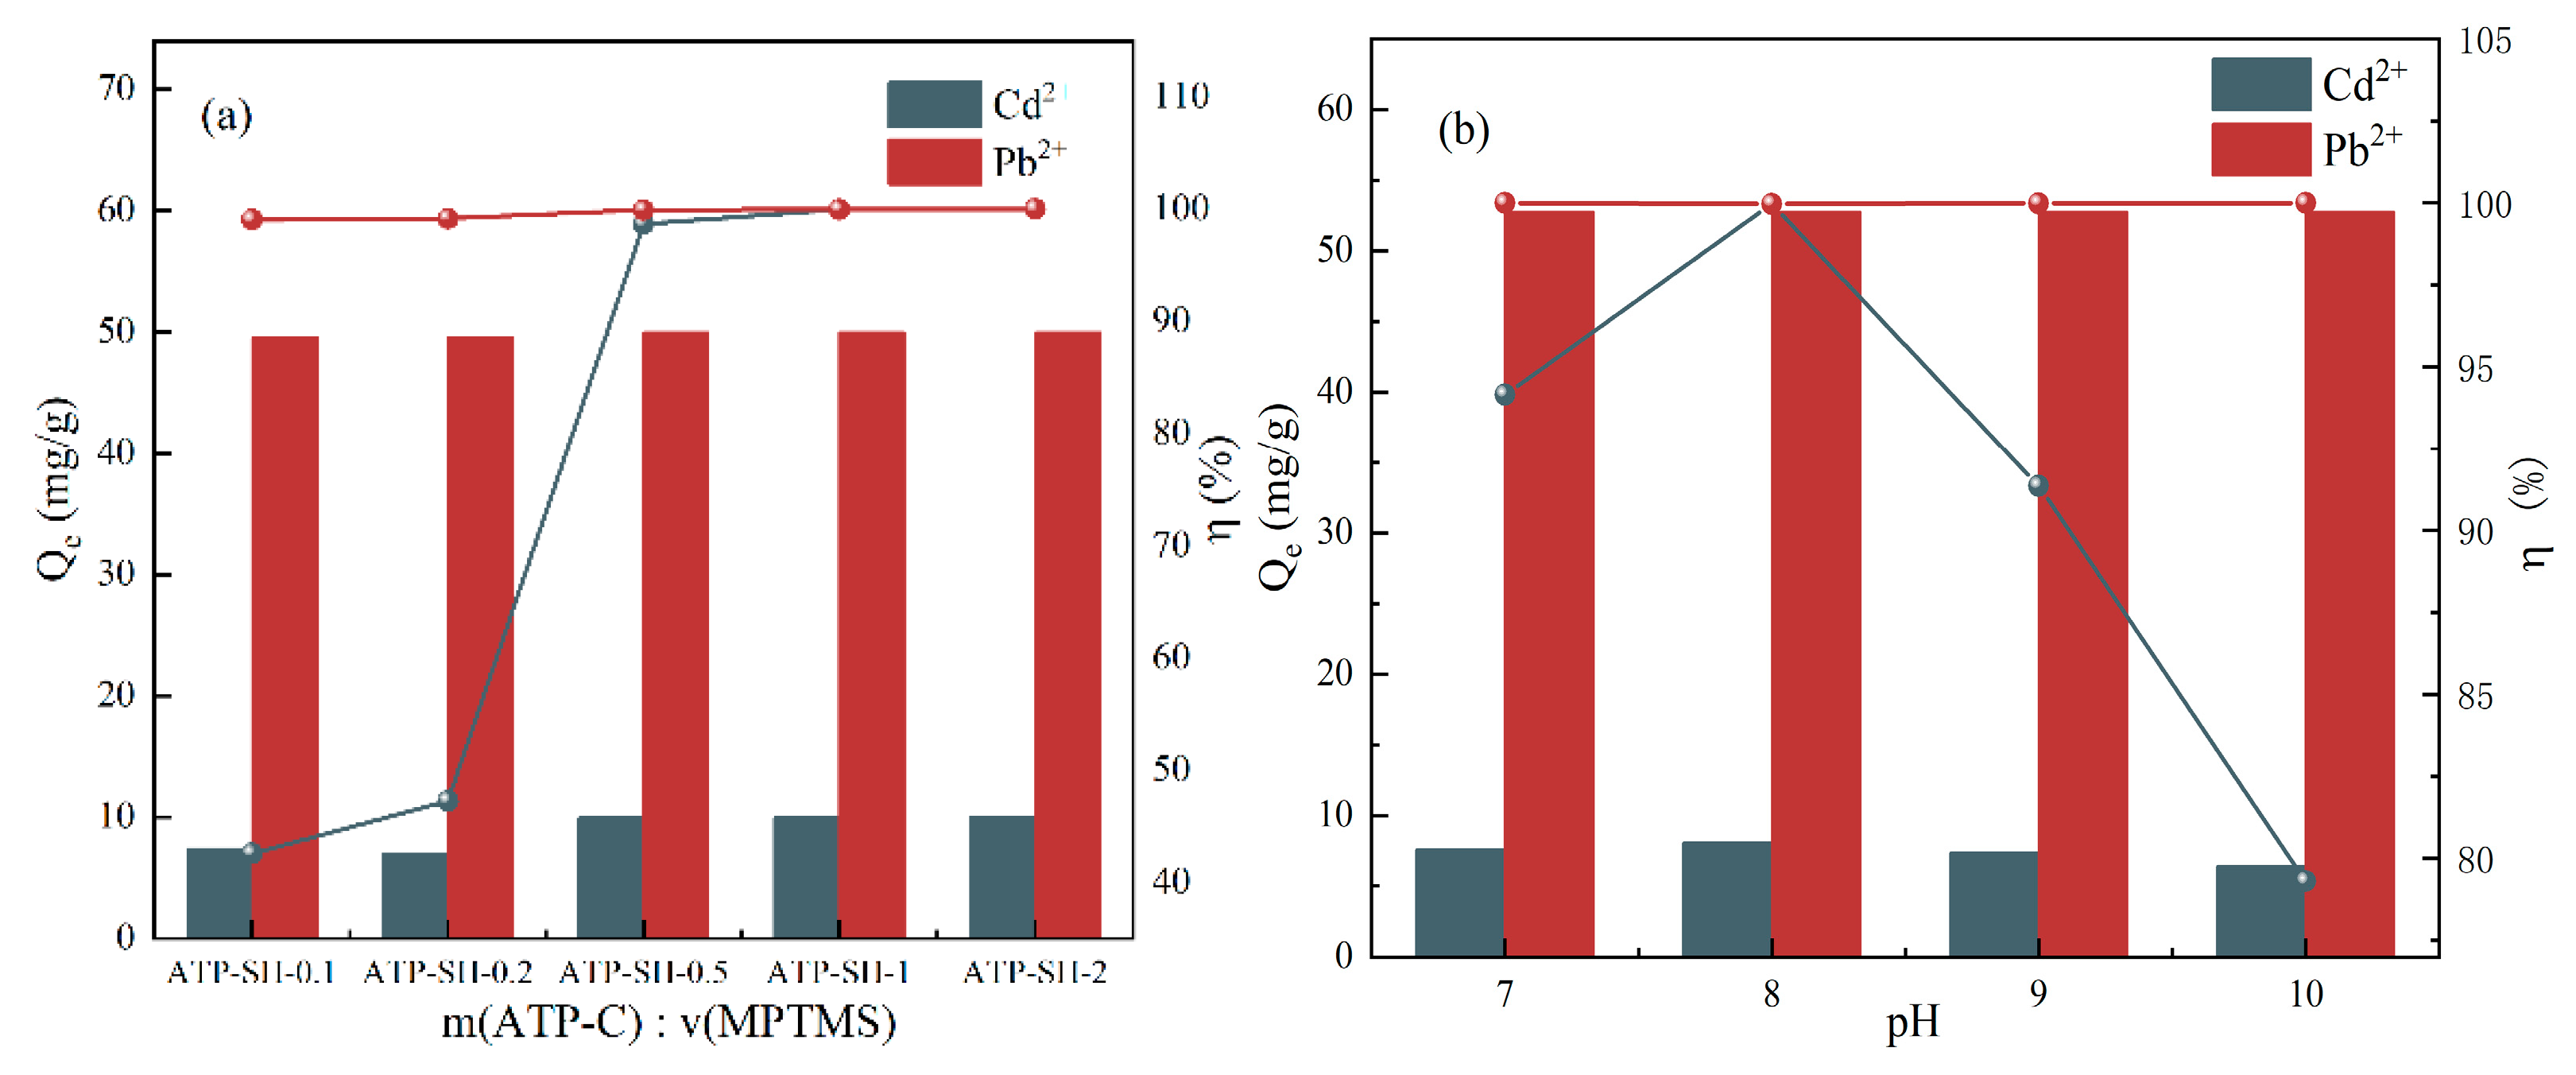
2.2.2. The Influence of Different Substrate Addition Ratios

To functionalize ATP-C with thiol groups, MPTMS was dissolved in 30 mL of 25% ethanol, and ATP-C was gradually added with stirring. The mixture was stirred at room temperature for 3 h, filtered, and dried. Samples were labeled ATP-SH-0.1, ATP-SH-0.2, ATP-SH-0.5, ATP-SH-1, and ATP-SH-2, depending on the ratio of m(ATP) to v(MPTMS) ranging from 1 g:0.1 mL, 1 g:0.2 mL, 1 g:0.5 mL, 1 g:1 mL, to 1 g:2 mL. ATP-SH-0.5 exhibited the highest adsorption capacity for Pb (II) and Cd (II) and was also the most cost-effective, thus it was selected for further characterization analysis.

2.2.3. pH Gradient Setting Experiment on the Modification Process

The influence of pH on the modification process was investigated under the aforementioned substrate ratio conditions. Different pH values (7, 8, 9, and 10) were adjusted using 0.1 mol/L NaOH and 0.1 mol/L HNO3 during the stirring process. After a duration of 3 h, the mixture was allowed to settle and then centrifuged. Subsequently, it was dried, ground, and stored for further use. Subsequently, different modified pH conditions were employed to perform adsorption experiments using ATP-SH-0.5 on a mixed solution of 100 mg/L Cd (II) and 500 mg/L Pb (II).

2.3. Characterizations

The BET-specific surface area was analyzed using an automated surface area and porosity analyzer (ASAP2460, Micromeritics Instrument Corporation, Norcross, GA, USA). The surface groups or bonds of ATP-SH were analyzed with Fourier Transform Infrared spectrometers (Frontier Perkinier, Phoenix, AZ, USA). XRD was applied to identify the phase composition of the samples using an X-ray diffractometer (D/max IIIA Co., Ltd., Tokyo, Japan). Material surface morphology was analyzed using field emission scanning electron microscopy (FESEM, GeminiSEM 300, Zeiss Group, Aalen, Germany). The surface charge of the material is determined by the Zeta potential (Zetasizer Nano ZS90, Malvern, UK). X-ray photoelectron spectra were collected to identify the chemical environment of adsorption on ATP-SH-0.5 (XPS, ESCALABX-250, USA). The concentrations of Pb (II) and Cd (II) were determined by inductively coupled plasma-mass Spectrometry (ICP800DV, TMO, USA).

2.4. Adsorption Experiments

2.4.1. Selecting Experiments

A mixed solution of 30 mL containing 100 mg/L Cd (II) and 500 mg/L Pb (II) was added to 50 mL centrifuge tubes, followed by the addition of 0.01 g of the material. The centrifuge tubes were shaken at a speed of 200 rpm at an ambient temperature of 298 K. inductively coupled plasma (ICP) was used to detect the heavy metals. The equilibrium adsorption capacity (Qe, mg/g) and the removal efficiency (η, %) of the heavy metals were calculated using the following equations:
Q e = ( C 0 C e ) V m
η = ( C 0 C e ) C 0 × 100 %
where C0 is the initial and resulting concentrations of the heavy metal solution (mg/L), Ce is the equilibrium concentration of the heavy metal solution (mg/L), V is the volume of the solution (L), and m is the mass of the adsorbent (g).

2.4.2. pH Gradient Setting Experiment on the Adsorption Process

The pH gradient was adjusted based on the characteristics of the heavy metals. As Pb (II) can precipitate at pH values above 7, the effect of pH on the adsorption of Cd (II) and Pb (II) was evaluated by varying the initial pH from 1 to 6 using 0.1 mol/L NaOH and 0.1 mol/L HNO3 solutions in both single and binary metal ion systems with iron.

2.4.3. Adsorption Studies

To investigate the kinetics of adsorption, 0.3 g of ATP-SH-0.5 was added to a mixed solution containing 30 mL of 500 mg/L Pb (II) and 100 mg/L Cd (II) at 298 K at pH 8 for various time intervals (15 min, 30 min, 45 min, 60 min, 90 min, 120 min, 240 min, 360 min, 480 min, 720 min, 960 min, 1440 min, and 1920 min) shaking at 200 rpm, and then test the ion concentration in the solution after centrifugal filtration. Thermodynamic tests were also conducted at different temperatures (288–318 K) and pH 5, using initial Cd (II) concentrations in the range of 100–200 mg/L and Pb (II) concentrations ranging from 700–17,000 µg/L. Additional details on the isotherms, kinetics, and thermodynamic equations associated with the adsorption model can be found in Table 2 and Table 3.

3. Results and Discussion

3.1. Modification Condition Screening

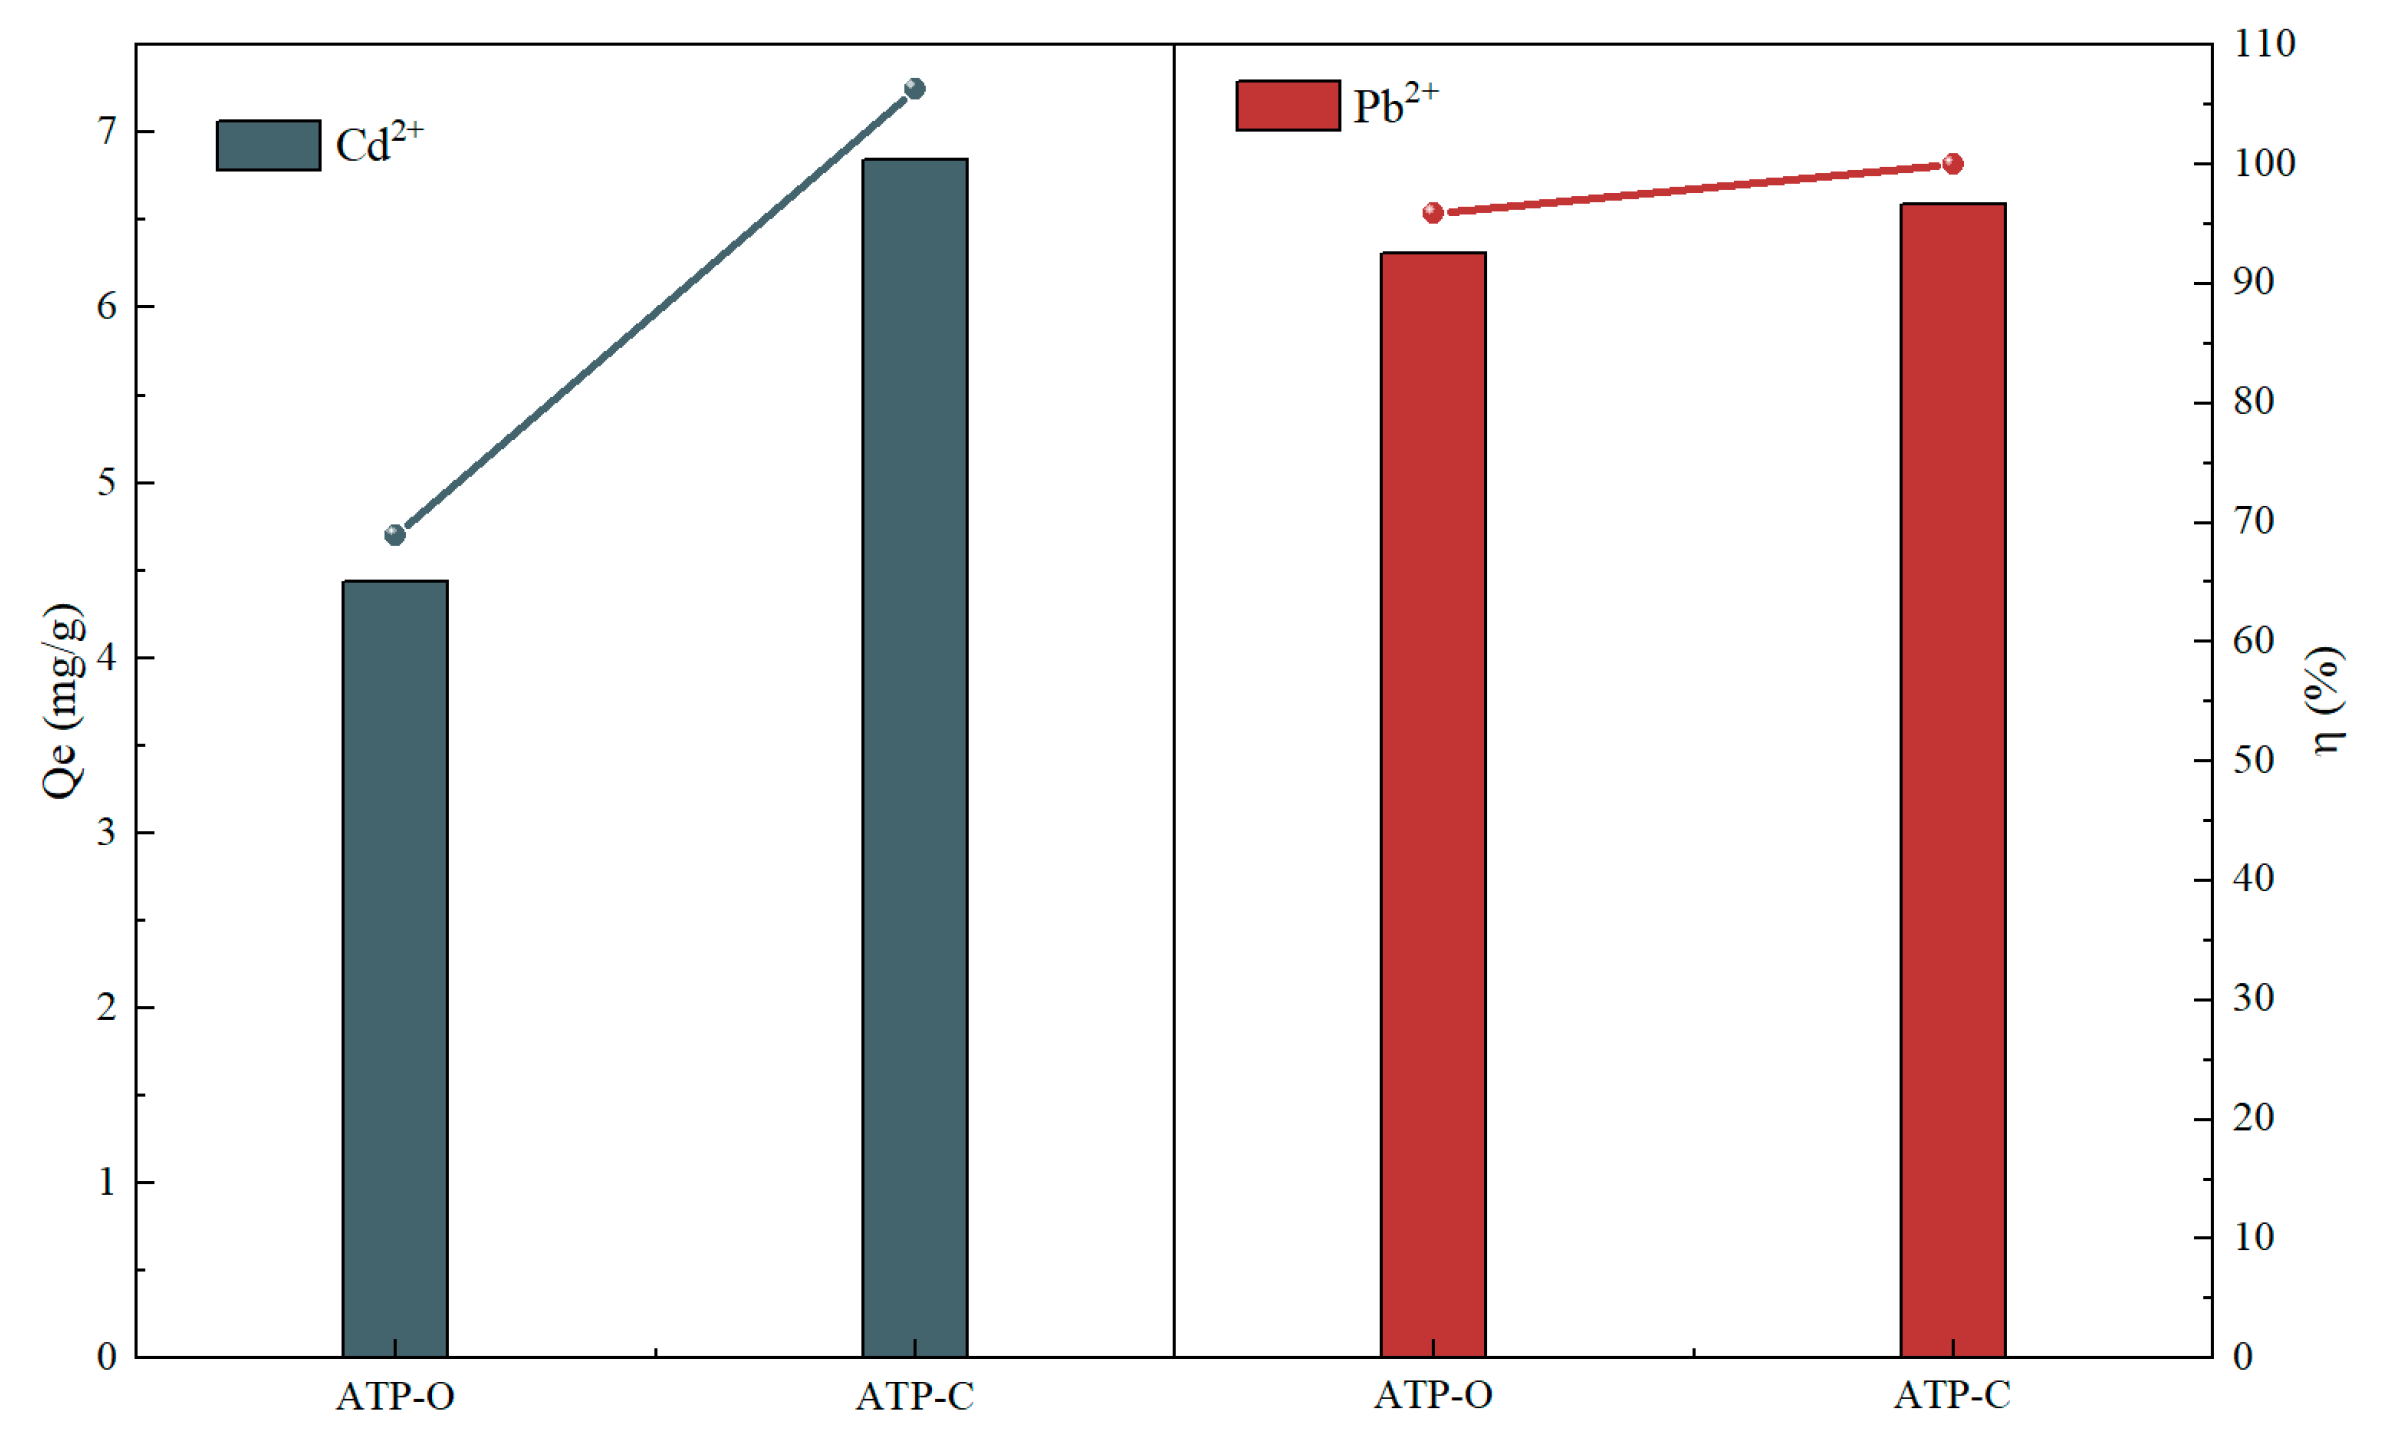
3.1.1. Screening of ATP-O and ATP-C

Figure 1 depicts the adsorption of Cd (II) and Pb (II) by ATP-O and ATP-C in a binary system. The adsorption capacity of ATP-O was 4.44 mg/g, with an adsorption rate of 43.86%. In comparison to ATP-O, ATP-C exhibited a significant increase in cadmium adsorption, reaching 6.85 mg/g with an adsorption rate of 67.69%. The adsorption capacity showed an increase of 2.41 mg/g, corresponding to a 23.83% rise in the adsorption rate. However, as an adsorbent for remediating lead and cadmium pollution in water bodies, the adsorption efficiency fell short of the desired outcome. Therefore, ATP-C was selected to modify with thiol functional groups.

3.1.2. Screening of Different Composite Ratio Materials and Modified pH

ATP-SH-X samples were obtained by varying the ratios of m(ATP-C) and v(MPTMS) during the thiolation process of attapulgite. Figure 2a illustrates that ATP-SH-0.5, ATP-SH-1, and ATP-SH-2 exhibited optimal removal properties for Pb (II) and Cd (II). Considering the need to reduce manufacturing costs, ATP-SH-0.5 was determined to be the most appropriate choice. Increasing the ratio of m (ATP-C) and v (MPTMS) during the thiolation process resulted in the production of mercapto-functionalized attapulgite with a greater number of functional groups. As shown in Figure 2b, the adsorption efficiency of ATP-SH-0.5 for Pb (II) showed no significant trend with varying pH. However, the adsorption efficiency of ATP-SH-0.5 for Cd (II) increased initially and then decreased with increasing pH. At pH 8.0, ATP-SH exhibited the highest adsorption efficiency for Cd (II), reaching 99.97%. Therefore, for subsequent experiments, a modified suspension pH of 8.0 was chosen.

3.2. Characterization

3.2.1. BET Surface Area and Pore Analysis

The results of the BET surface area and pore analysis are presented in Table 4. Compared to ATP-O, the calcined ATP-C exhibited further increases in specific surface area, external surface area, micropore area, total pore volume, and micropore volume. The increase in specific surface area was primarily attributed to the increase in micropore area. The increase in external surface area and total pore volume resulted in an increased number of adsorption sites on the sample surface and an enlarged pore capacity, thereby enhancing the adsorption capacity of the sample. The results of BET surface area and pore analysis demonstrated that ATP-C was more suitable as a carrier for thiol functional groups compared to ATP-O.

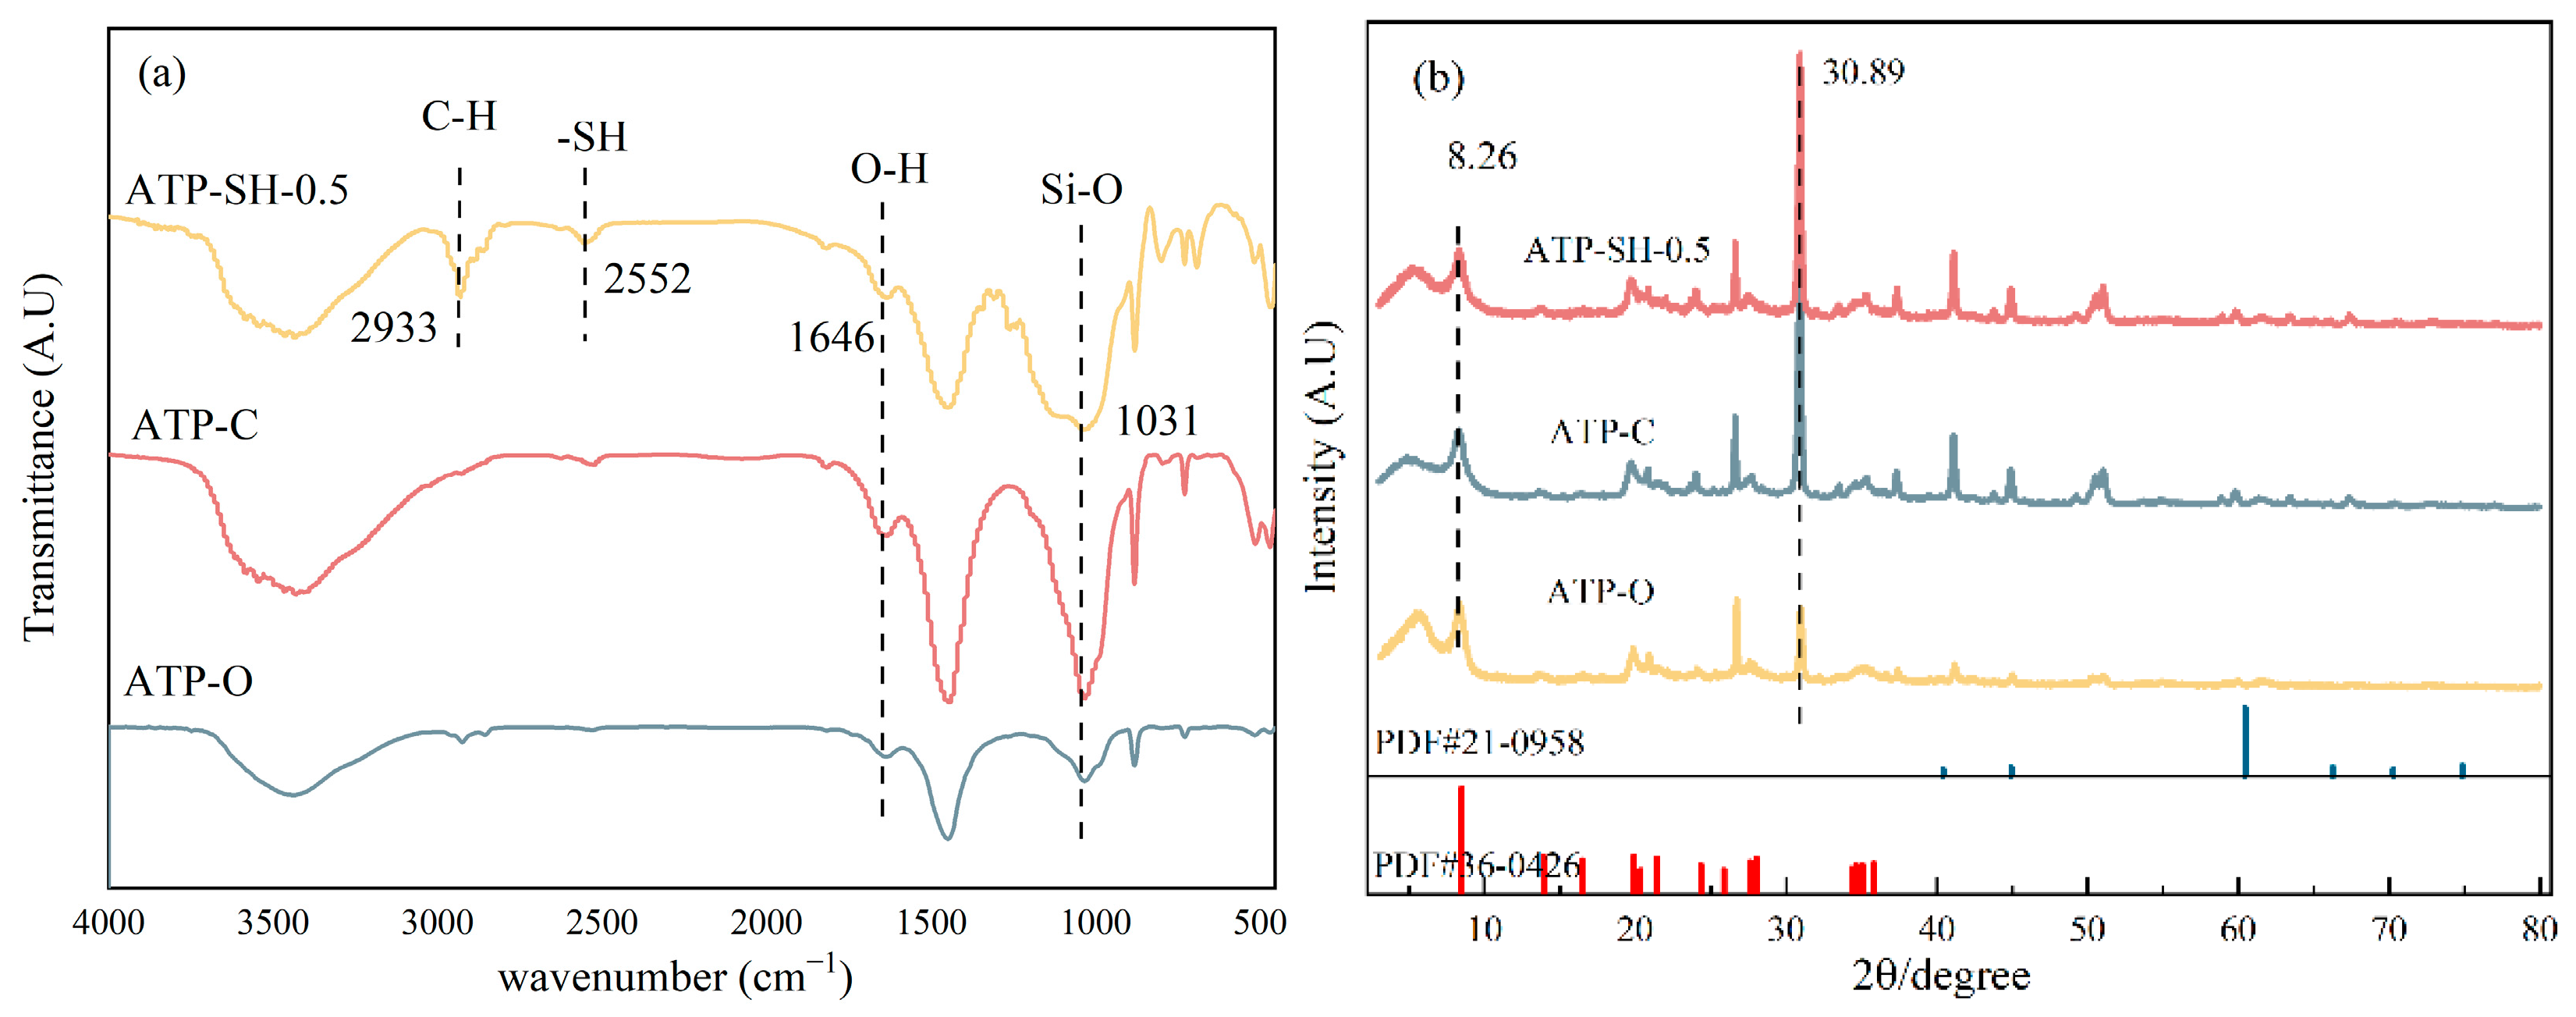
3.2.2. FTIR Analysis and XRD Analysis

Figure 3a shows the Fourier Transform Infrared (FTIR) spectra of ATP-O, ATP-C, and ATP-SH-0.5. The similarity in the structures of ATP-O and ATP-C suggested that calcination did not cause significant changes to the surface functional groups. The broad absorption peak observed at approximately 1646 cm−1 was attributed to the O-H bending vibration between the interlayers of the attapulgite. The peak observed at 1031 cm−1 was associated with the stretching vibrations of Si-O-Si. In comparison to ATP-C, the intensity of this peak was observed to decrease in ATP-SH-0.5. This suggested that the Si-O-Si bond in the lattice of ATP was hydrolyzed and broken into a large number of Si-O bonds during the modification process [20]. The successful synthesis of ATP-SH-0.5 was confirmed by the appearance of absorption bands at 2933 cm−1 and 2552 cm−1, which corresponded to the stretching vibrations of C-H and -SH, respectively, due to the presence of the organic layer [21]. In addition, Figure 3b depicts the X-ray diffraction (XRD) patterns of ATP-O, ATP-C, and ATP-SH-0.5. All three samples exhibited characteristic diffraction peaks at 2θ = 8.26, corresponding to the (110) crystal plane of goethite. No significant differences in the positions and spacing (d) of the characteristic diffraction peaks were observed between ATP-O, ATP-C, and ATP-SH-0.5, indicating that the crystal structure and crystallinity of ATP-SH-0.5% remained largely unchanged [22]. The characteristic peaks of quartz were also observed in the goethite structure.

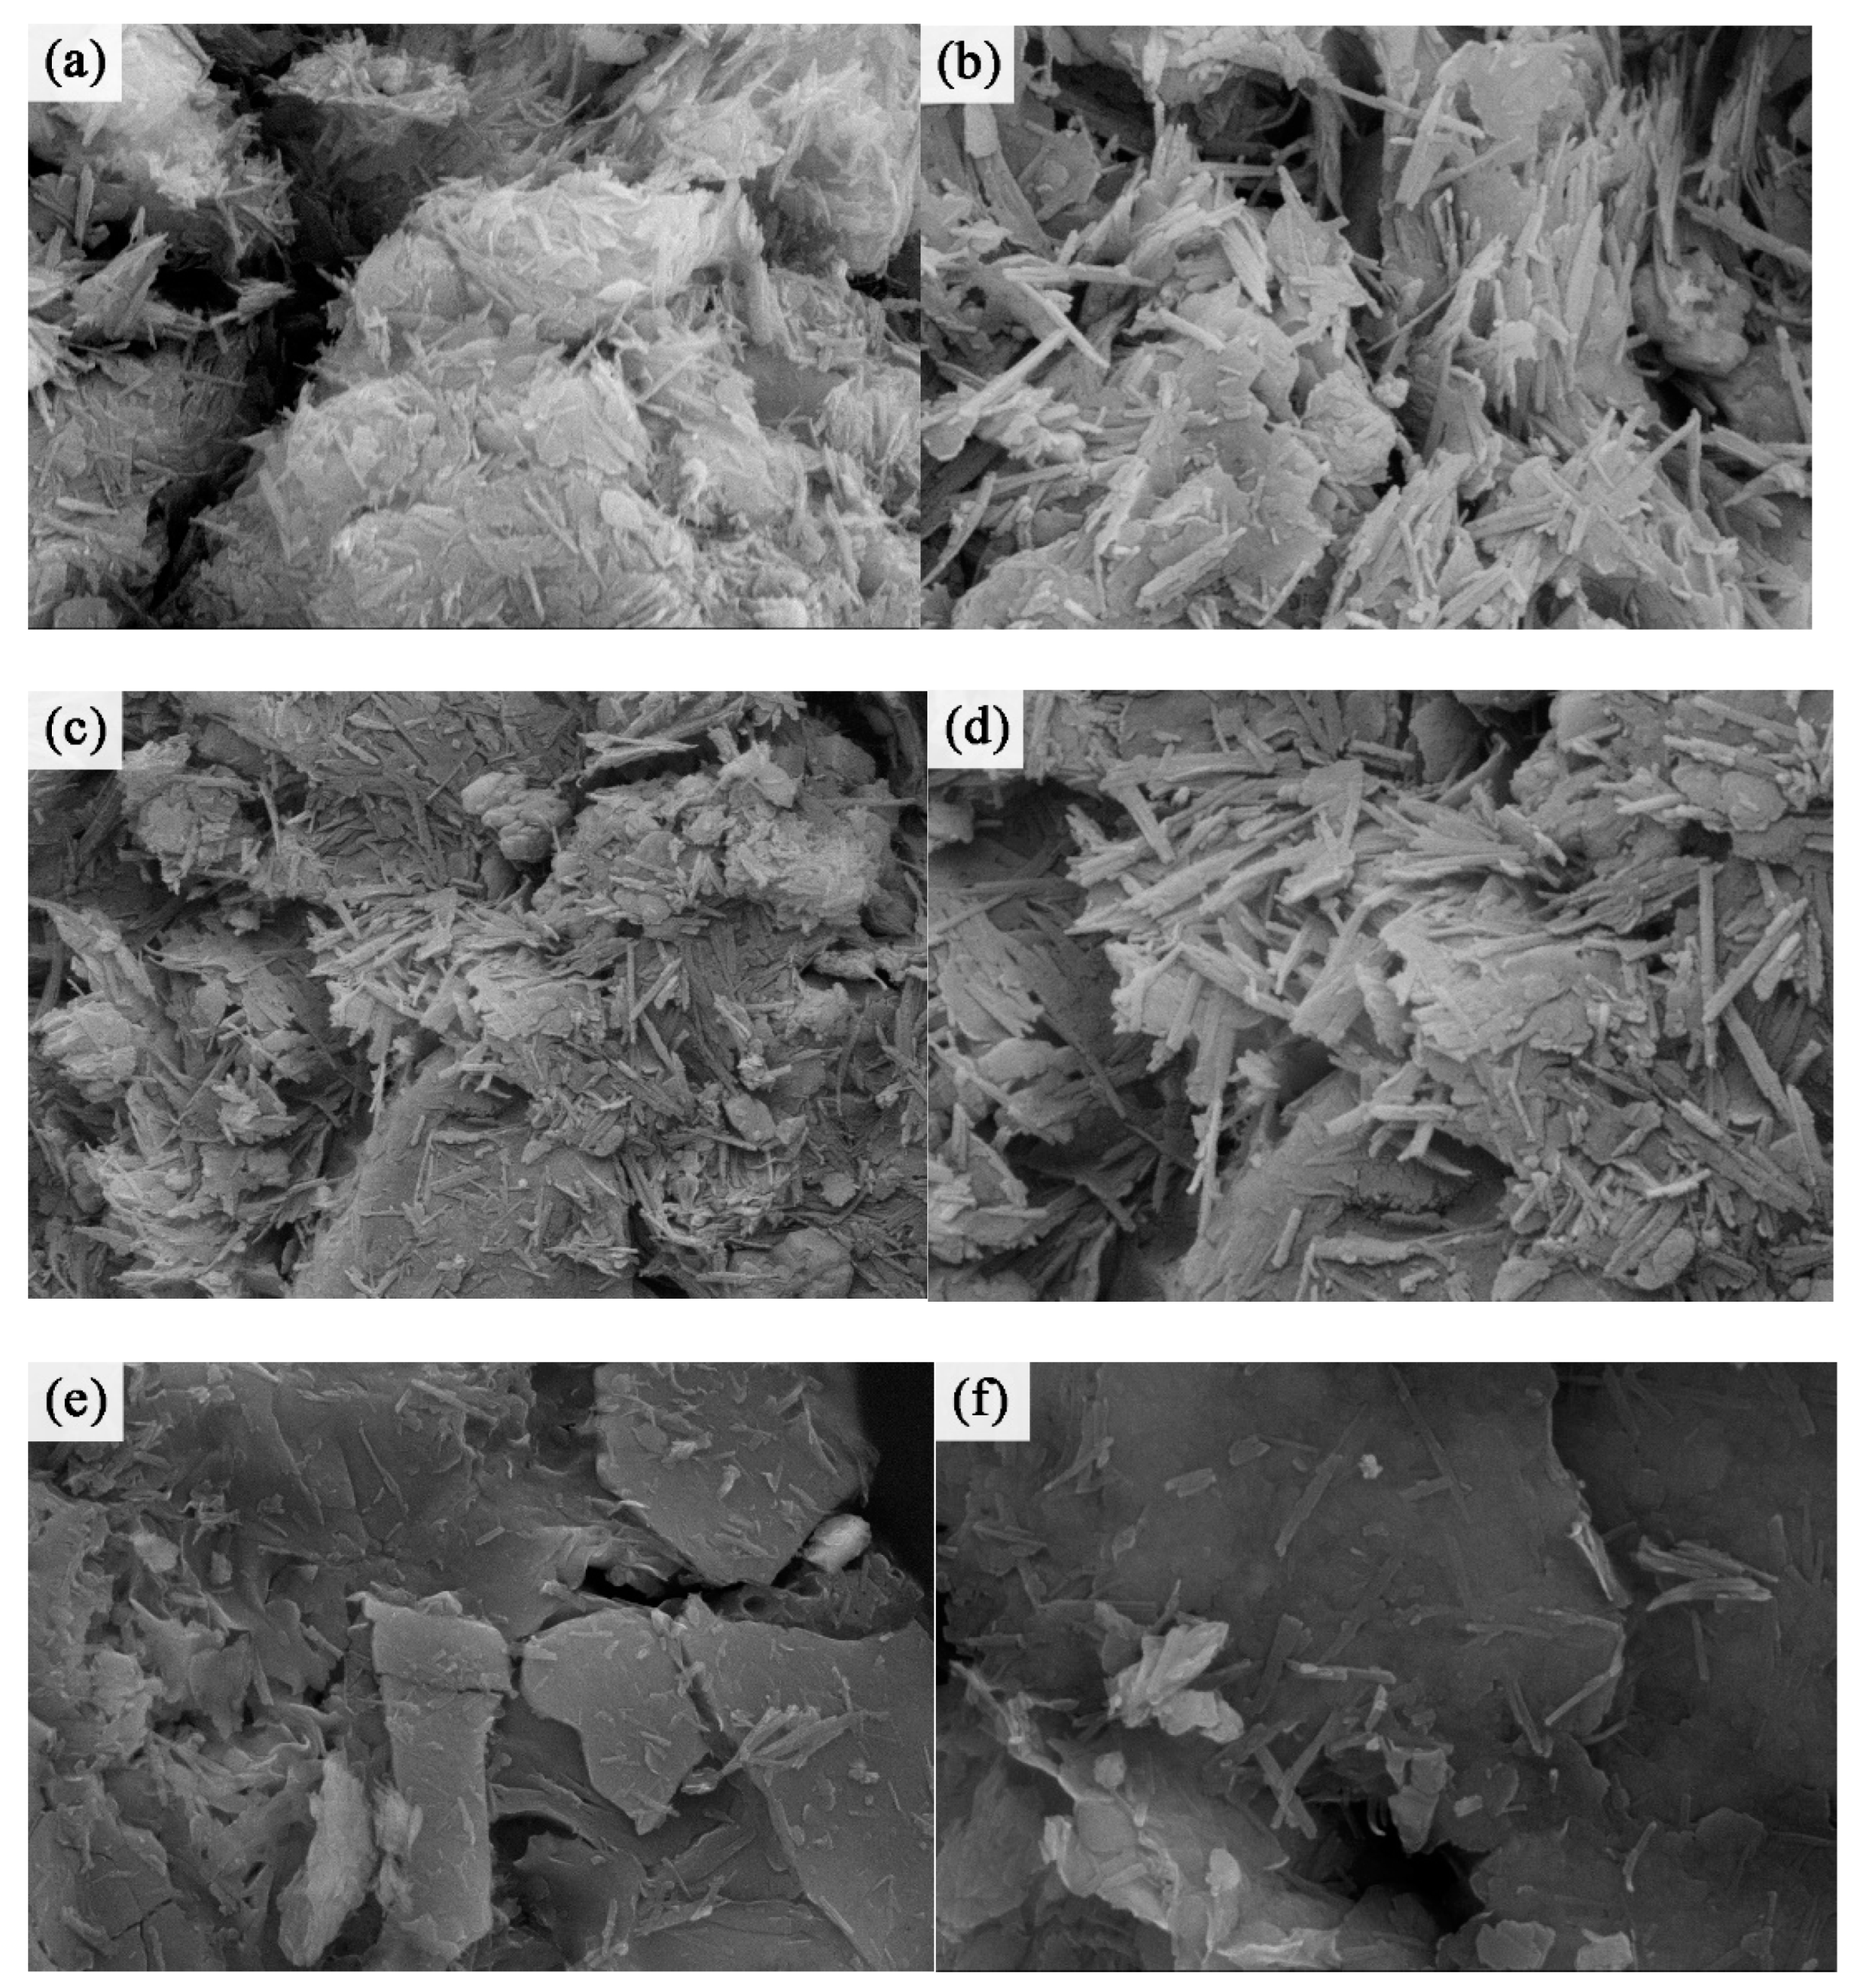
3.2.3. FESEM Analysis

As shown in Figure 4a,b, the original ore exhibited noticeable quartz impurities on the surface. The surface of the ATP-O displayed elongated needle-like structures with a smooth texture. These needle-like structures were tightly aggregated in the form of rod-shaped bundles. These rod-shaped bundles, along with minerals such as calcite and montmorillonite, formed block-like aggregates. After calcination (Figure 4c,d), the ATP-C showed evident changes in its rod-shaped crystals. The crystals appeared shorter and thicker, and the surface became rough with the presence of attachments and cracks. The rod-shaped bundles exhibited noticeable disintegration, and the arrangement of the rods became looser and irregular. The structure of calcined attapulgite was loose and irregularly arranged, with a significant increase in the number of active sites [14], which was more conducive to the loading of thiol groups. Calcination also facilitated the removal of impurities from the internal pores of the rough attapulgite crystals. After mercapto-functionalization (Figure 4e,f) the number of single crystals decreased while the number of crystal bundles increased, forming a large number of block-like aggregates. This indicated that attapulgite single crystals underwent fracture, and the grafted thiol functional group enhanced the force between the single crystals, leading to aggregation and the formation of crystal bundles and block-like aggregates.

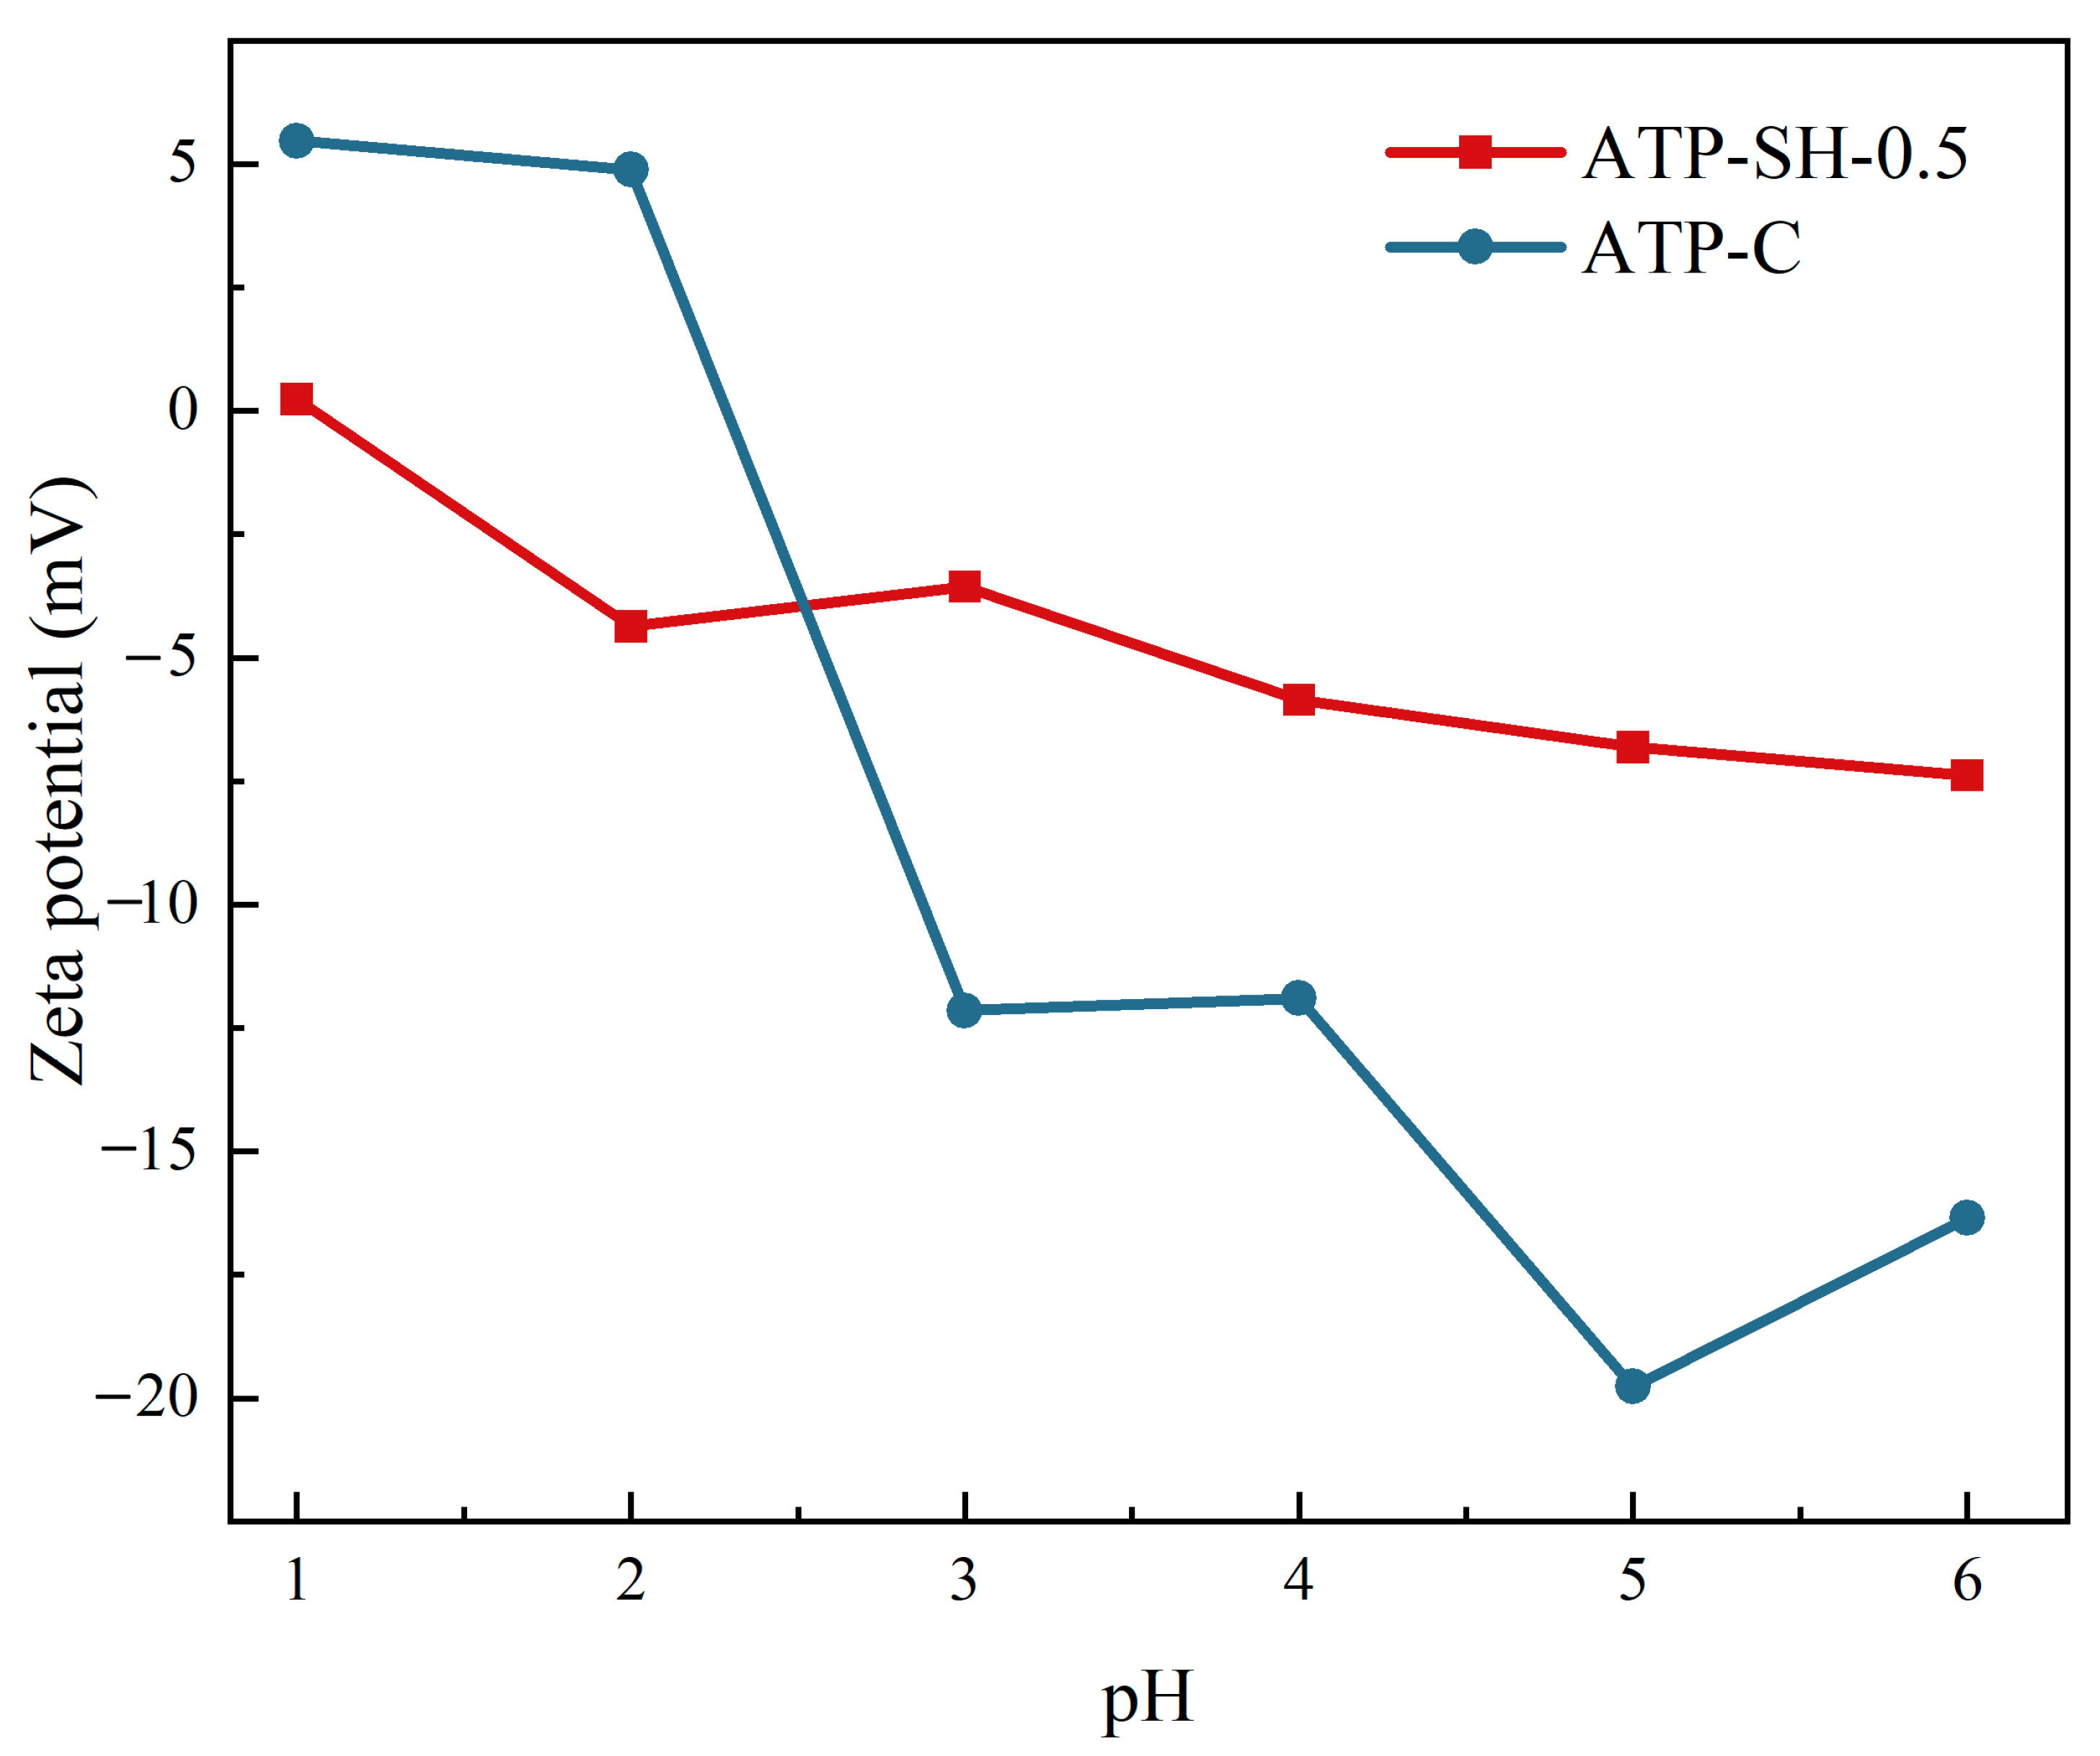
3.2.4. Zeta Analysis

The determination of Zeta potential can explain the effect of surface charge on the adsorption of adsorbents. The Zeta distribution diagrams of ATP-C and ATP-SH-0.5 are shown in Figure 5. ATP-C exhibited an isoelectric point at pH 1.07 within the pH range of 1–6. ATP-SH-0.5 was positively charged at pH 1–2 and gradually became negative with increasing pH, resulting in an isoelectric point at pH 2.3. Compared to ATP-C composite materials, ATP-SH-0.5 had more negative surface charges and a stronger surface adsorption capacity for cations.

3.3. Heavy Metal Ion Removal Capacity in the Adsorption Process

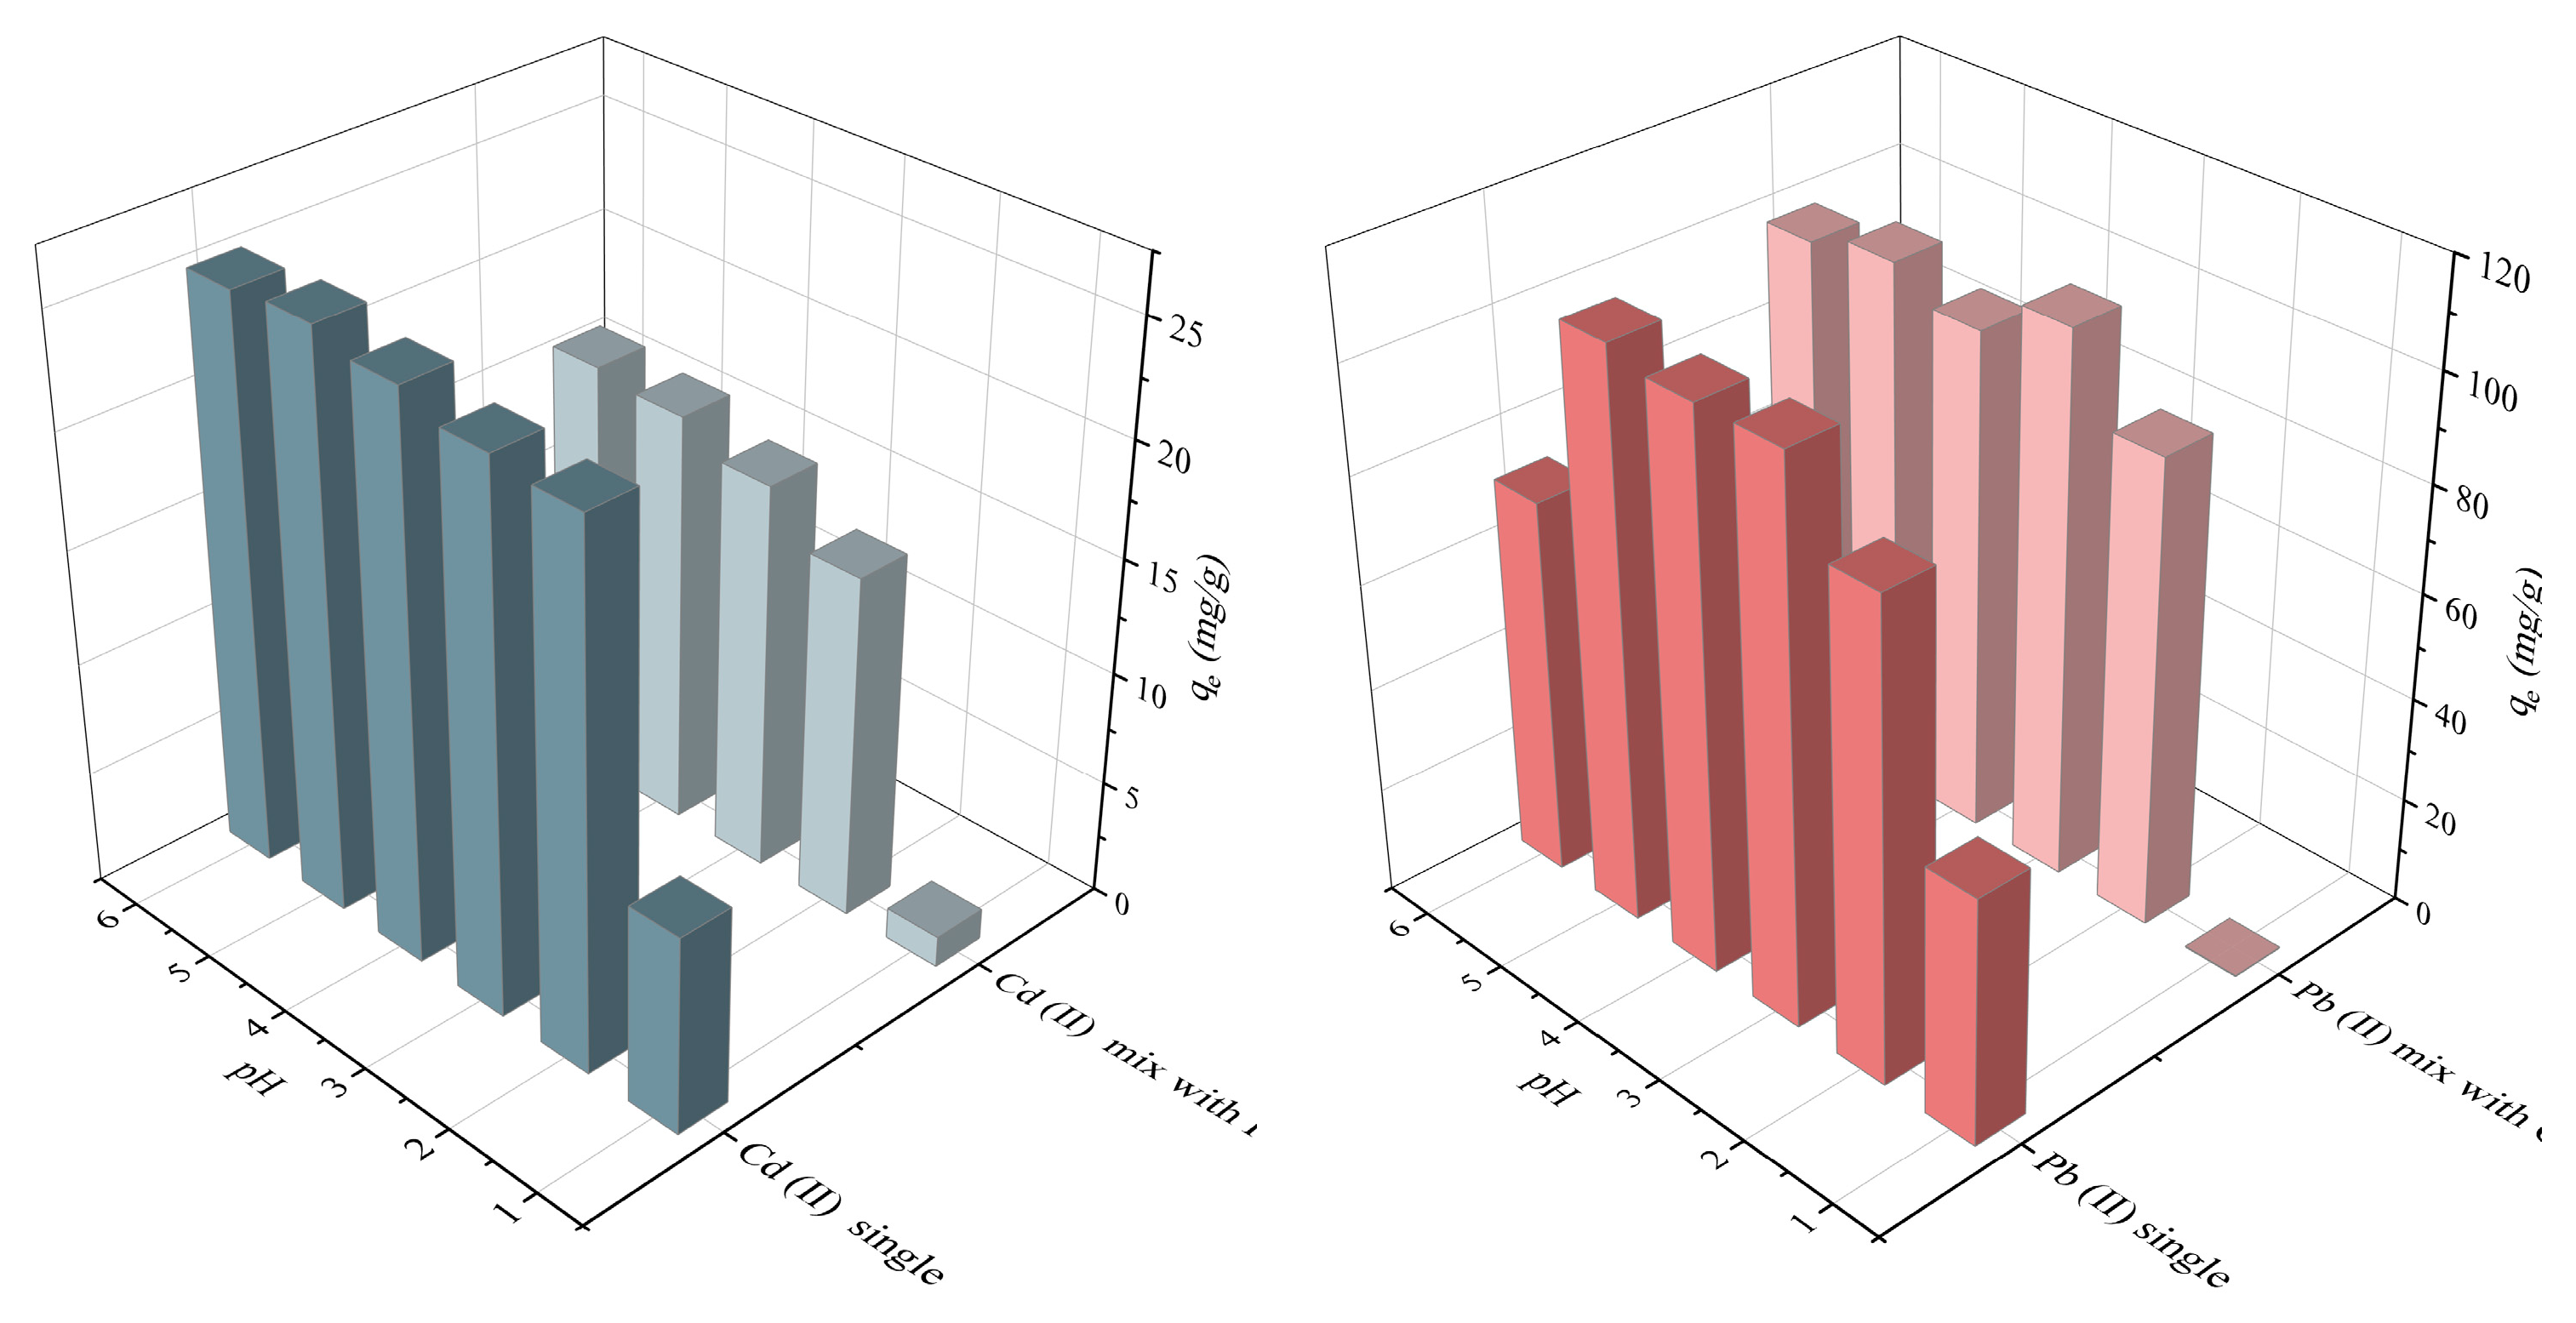
3.3.1. Effect of pH on the Adsorption Process

In general, the surface charge of an adsorbent material is influenced by the pH of the solution. Understanding the effect of pH on the surface charge and solution chemistry is crucial for optimizing the adsorption capacity of a material for specific applications [23,24]. Considering the precipitation behavior of Pb (II) and Cd (II), the adsorption process was carried out at pH values ranging from 1.0 to 6.0. Figure 6 showed that the adsorption capacity for Cd (II) and Pb (II) increased with increasing pH values from 1.0 to 5.0, and then remained at a relatively high value at pH 5.0 in both single and binary heavy metal ion systems, with adsorption capacities of 18.61 mg/g and 107.88 mg/g, respectively. In highly acidic media, acidic protons and metal ions compete for available alkaline sites [25]. Therefore, the optimal pH value of 5 was chosen for subsequent experiments. ATP-SH-0.5 had good adsorption performance for Cd (II) and Pb (II) in single and bi-heavy metal ion systems under acidic conditions and can be used for in-situ remediation of acidic soils.

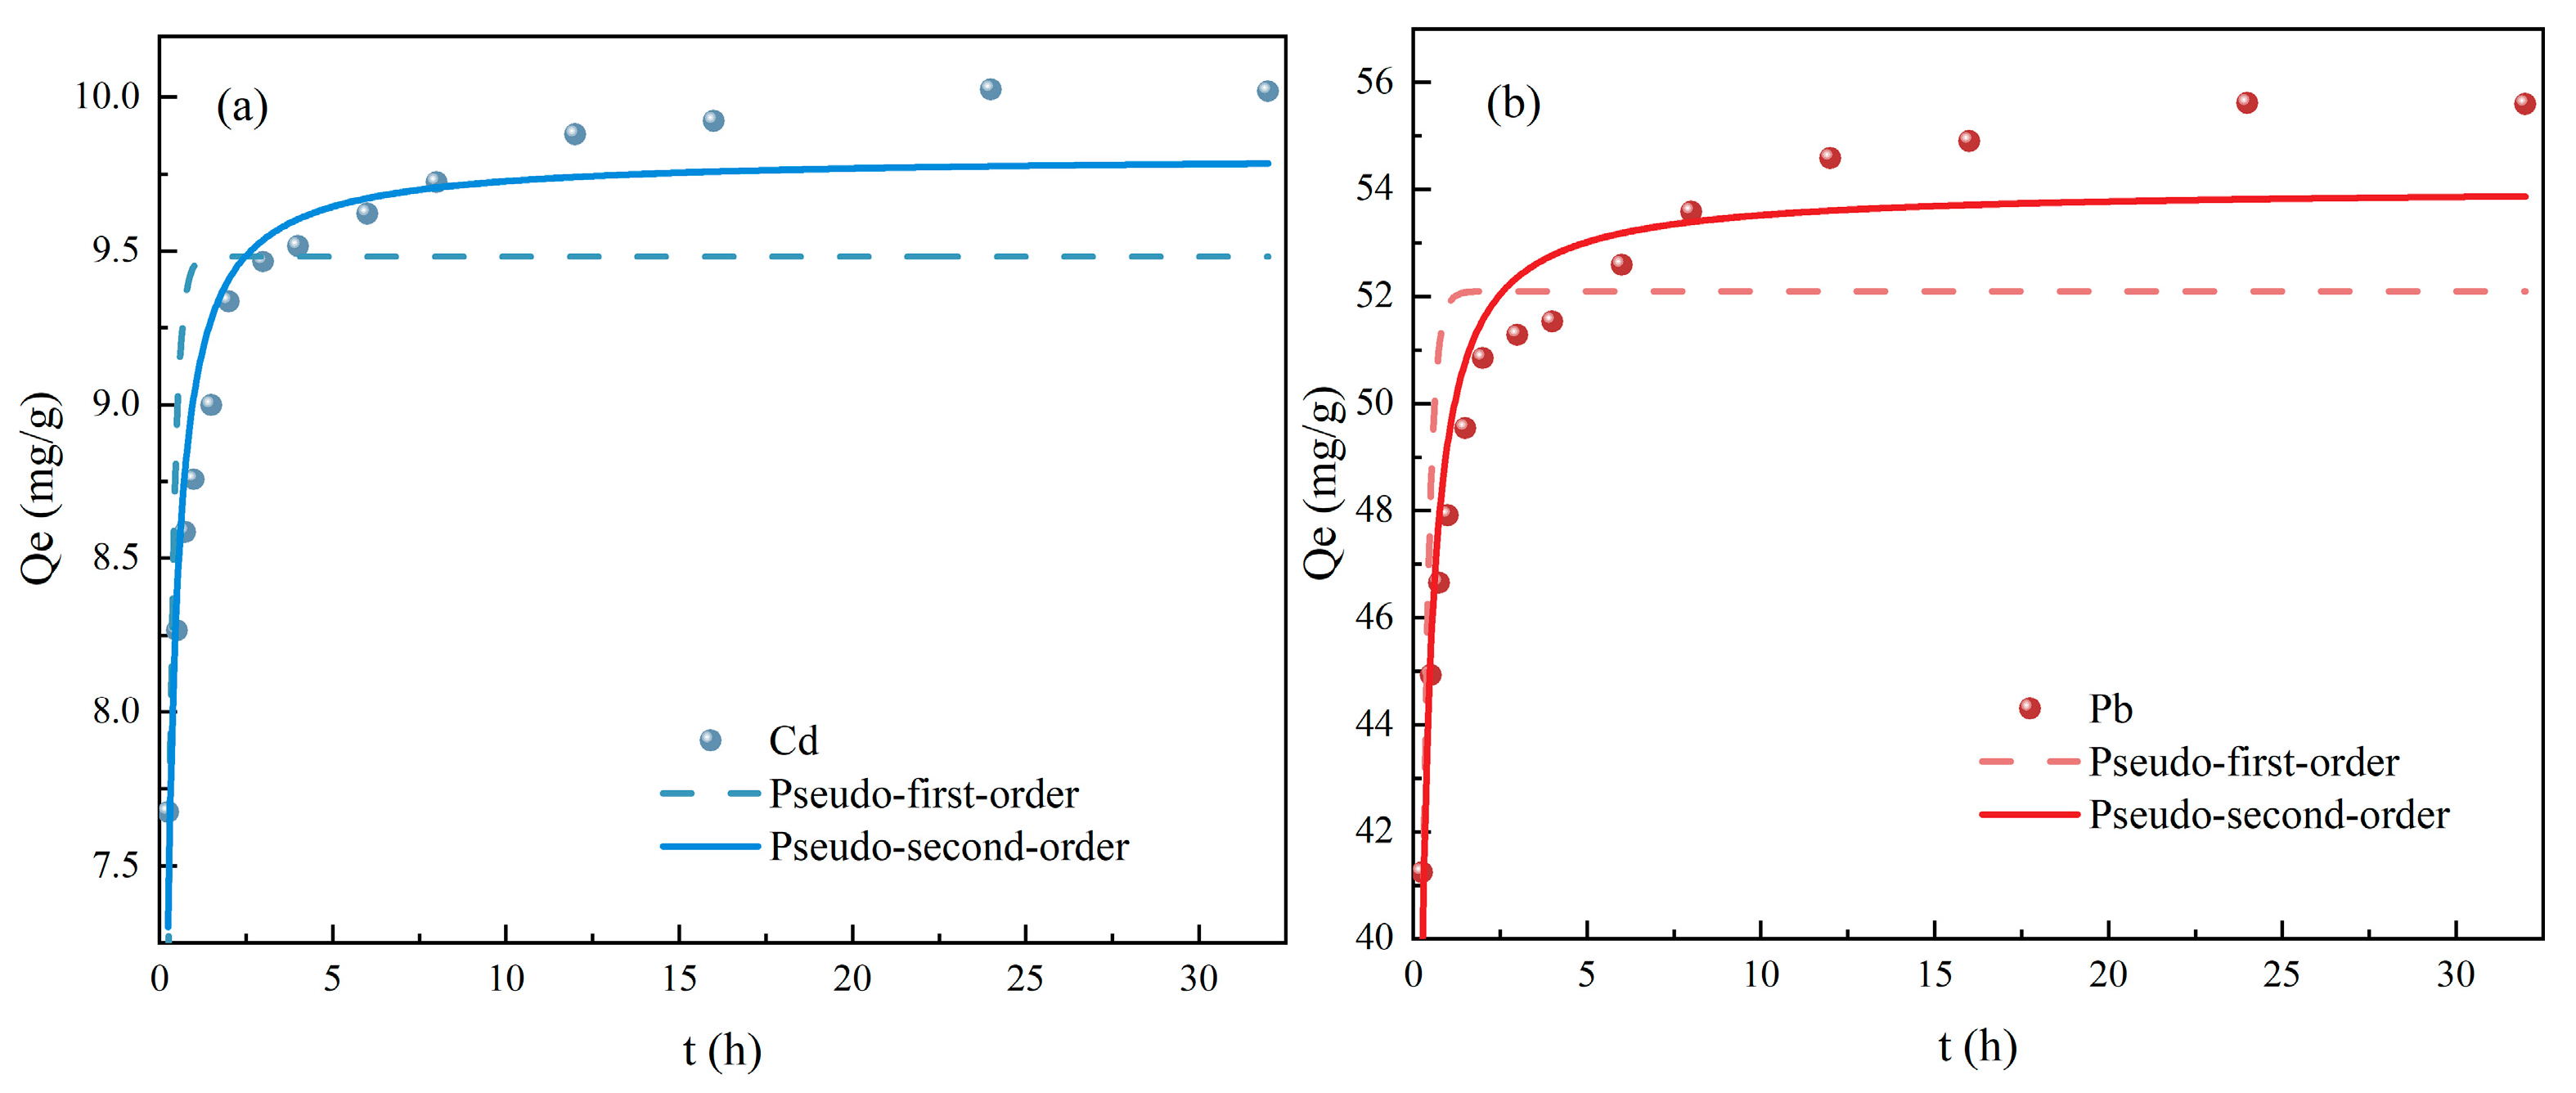
3.3.2. Adsorption Kinetics

Adsorption is a complex phenomenon that involves the transfer of adsorbate from the liquid to the solid phase, as well as potential chemical or physical interactions that may occur between the adsorbate and the adsorbent. An investigation of adsorption kinetics can provide valuable information about the mechanism of adsorption. The experimental data can be analyzed using various models, including the Pseudo-first-order model [26], Pseudo-second-order [27], Elovich [28], Intraparticle diffusion [29] models and Double constant equation [30] to determine important parameters related to the adsorption process.
The parameters of the Pseudo-first-order and Pseudo-second-order models are presented in Figure 7. The adsorption of Cd (II) (a) and Pb (II) (b) by ATP-SH-0.5 can be divided into three different stages. The first stage corresponded to the initial period of adsorption, with the fastest adsorption rate; the second stage was a period during the adsorption process where the adsorption rate slows down; the third stage was reached when the adsorption reaches equilibrium, and the adsorption rate remains relatively constant. As the adsorption time increases, the adsorption rate of each stage continuously decreases, and the adsorption rate changes until eventually reaching equilibrium.
The non-linear fitted curves for other kinetic models were shown in Figures S1 and S2, and Table 2 listed the kinetic constants obtained from the fitted data using non-linear regression analysis. In comparison with the Pseudo-first-order model, the adsorption processes of Cd (II) and Pb (II) were better described by the Pseudo-second-order model, with correlation coefficients above 0.9. Moreover, the equilibrium adsorption calculated by the Pseudo-second-order model (10.23 mg/g for Cd (II) and 56.18 mg/g for Pb (II)) closely matched the experimental data (10.11 mg/g for Cd (II) and 55.53 mg/g for Pb (II)). These findings further supported the conclusion that the actual adsorption process followed second-order kinetics and belonged to chemical adsorption [31]. The fitting results of the Elovich equation suggested that the adsorption of Cd (II) and Pb (II) by ATP-SH was also affected by the surface properties of the adsorbent, which were related to the coverage of the material surface.

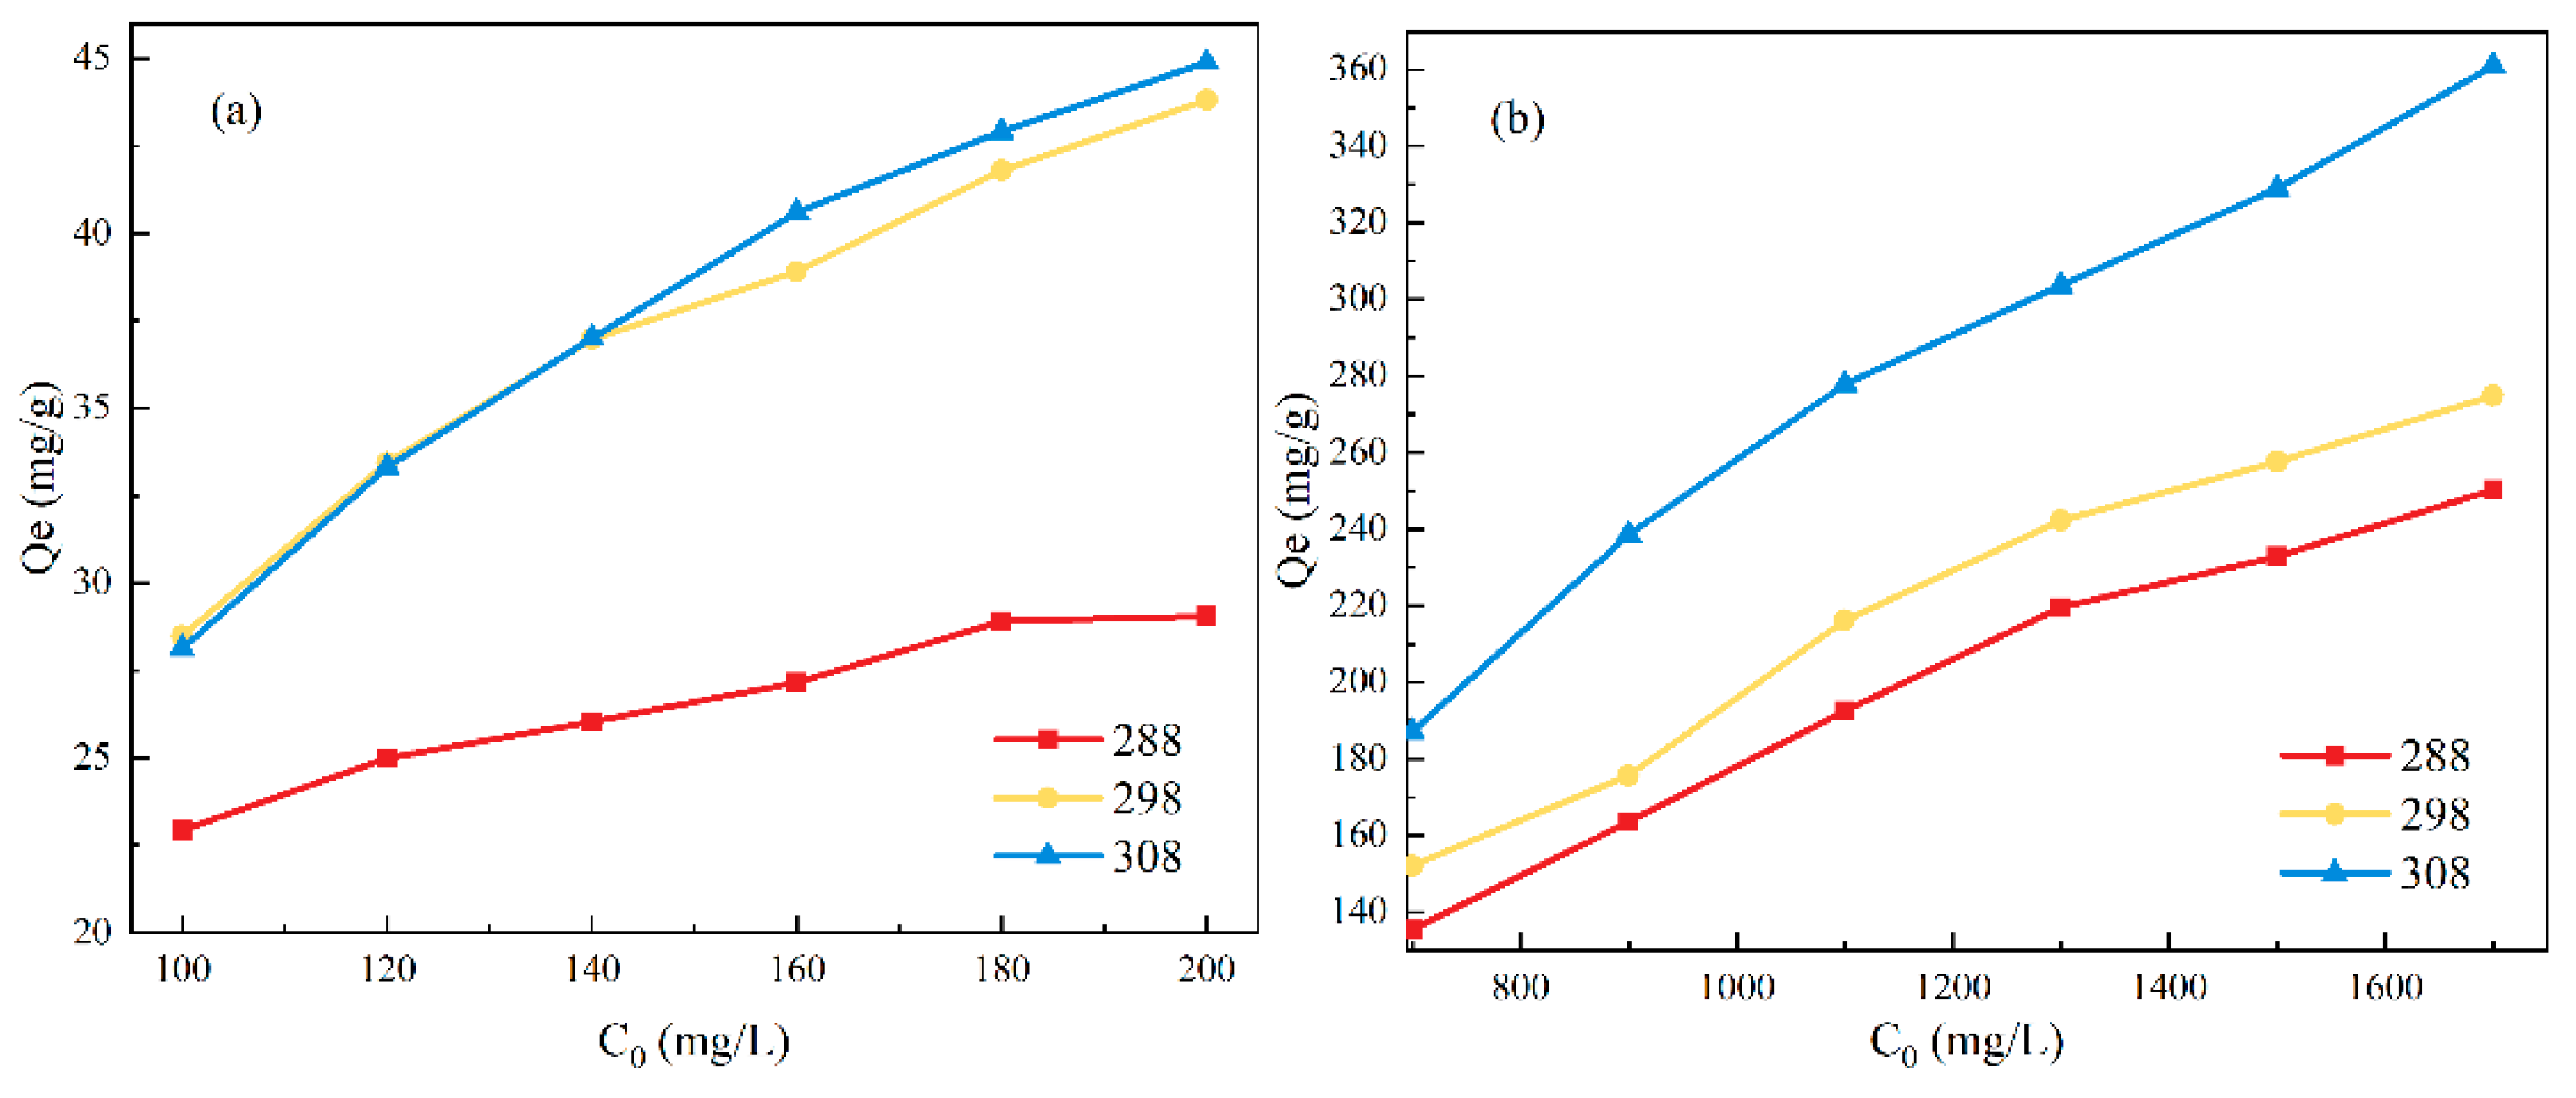
3.3.3. Adsorption Isotherm

To explore the maximum possible adsorption capacity of ATP-SH-0.5, different initial concentrations of Cd (II) and Pb (II) were evaluated in binary systems (Figure 8). As the initial concentrations of Cd (II) and Pb (II) increased, the adsorption capacity gradually increased until saturation was reached. The theoretical saturated adsorption capacities of ATP-SH-0.5 for Cd (II) were 32.50 mg/g, 44.32 mg/g, and 47.25 mg/g, and for Pb (II) were 430.44 mg/g, 389.70 mg/g, and 406.1673 mg/g at temperatures of 288 K, 298 K, and 308 K, respectively. In the binary competitive adsorption system, the affinity of ATP-SH-0.5 for Pb (II) was greater than that for Cd (II), indicating that ATP-SH-0.5 had a greater advantage in adsorbing Pb (II). Table 5 shows the results of adsorption of Cd (II) and Pb (II) on different sulfhydryl functionalized materials at 298 K. The theoretical adsorption capacity of ATP-SH-0.5 was significantly enhanced compared to mercapto-functionalized unpurified attapulgite [32] at 298 K. Compared to mercapto-functionalized other clay minerals, ATP-SH-0.5 demonstrated good adsorption efficiency for Cd (II) and superior adsorption efficiency for Pb (II) [12,16,32,33,34,35].
Four adsorption isotherm models, namely Langmuir, Freundlich, Temkin, and Dubinin-Radushkevich (D-R) models [36], were employed to interpret the adsorption behavior of Cd (II) and Pb (II) on ATP-SH-0.5. The non-linear fitted curves of the four model isotherms at different temperatures are shown in Figures S3 and S4. As presented in Table 3, the Langmuir, Freundlich, and Dubinin-Radushkevich models all achieved good correlations. The Langmuir model indicates that the adsorption of Cd (II) and Pb (II) on ATP-SH-0.5 was monolayer adsorption [37]. The values of the separation factor KL for all isotherm models were less than 1, indicating that ATP-SH-0.5 was favorable for both Cd (II) and Pb (II) adsorption [38]. In the Freundlich model, the values of 1/nF were greater than 0 and less than 1, which implies that the adsorbent is favorable for the adsorption of metal ions [39]. Furthermore, the values of 1/nf gradually decreased as the temperature increased, which is consistent with the results of adsorption thermodynamics (Figure 9). Additionally, correlation (R2) values for Cd (II) and Pb (II) were all above 0.9 in the Temkin model, indicating that physisorption of metal ions occurs on ATP-SH-0.5. The Dubin-in-Radushkevich model isotherm model is often used to identify physical or chemical adsorption, as the Dubin-in-Radushkevich model constant E is used to determine the sorption energy [38]. The EDR parameter for the adsorption of Cd (II) (a) and Pb (II) all increased with increasing temperature, suggesting that increasing temperature was beneficial for the exchange of Cd (II) (a) and Pb (II).

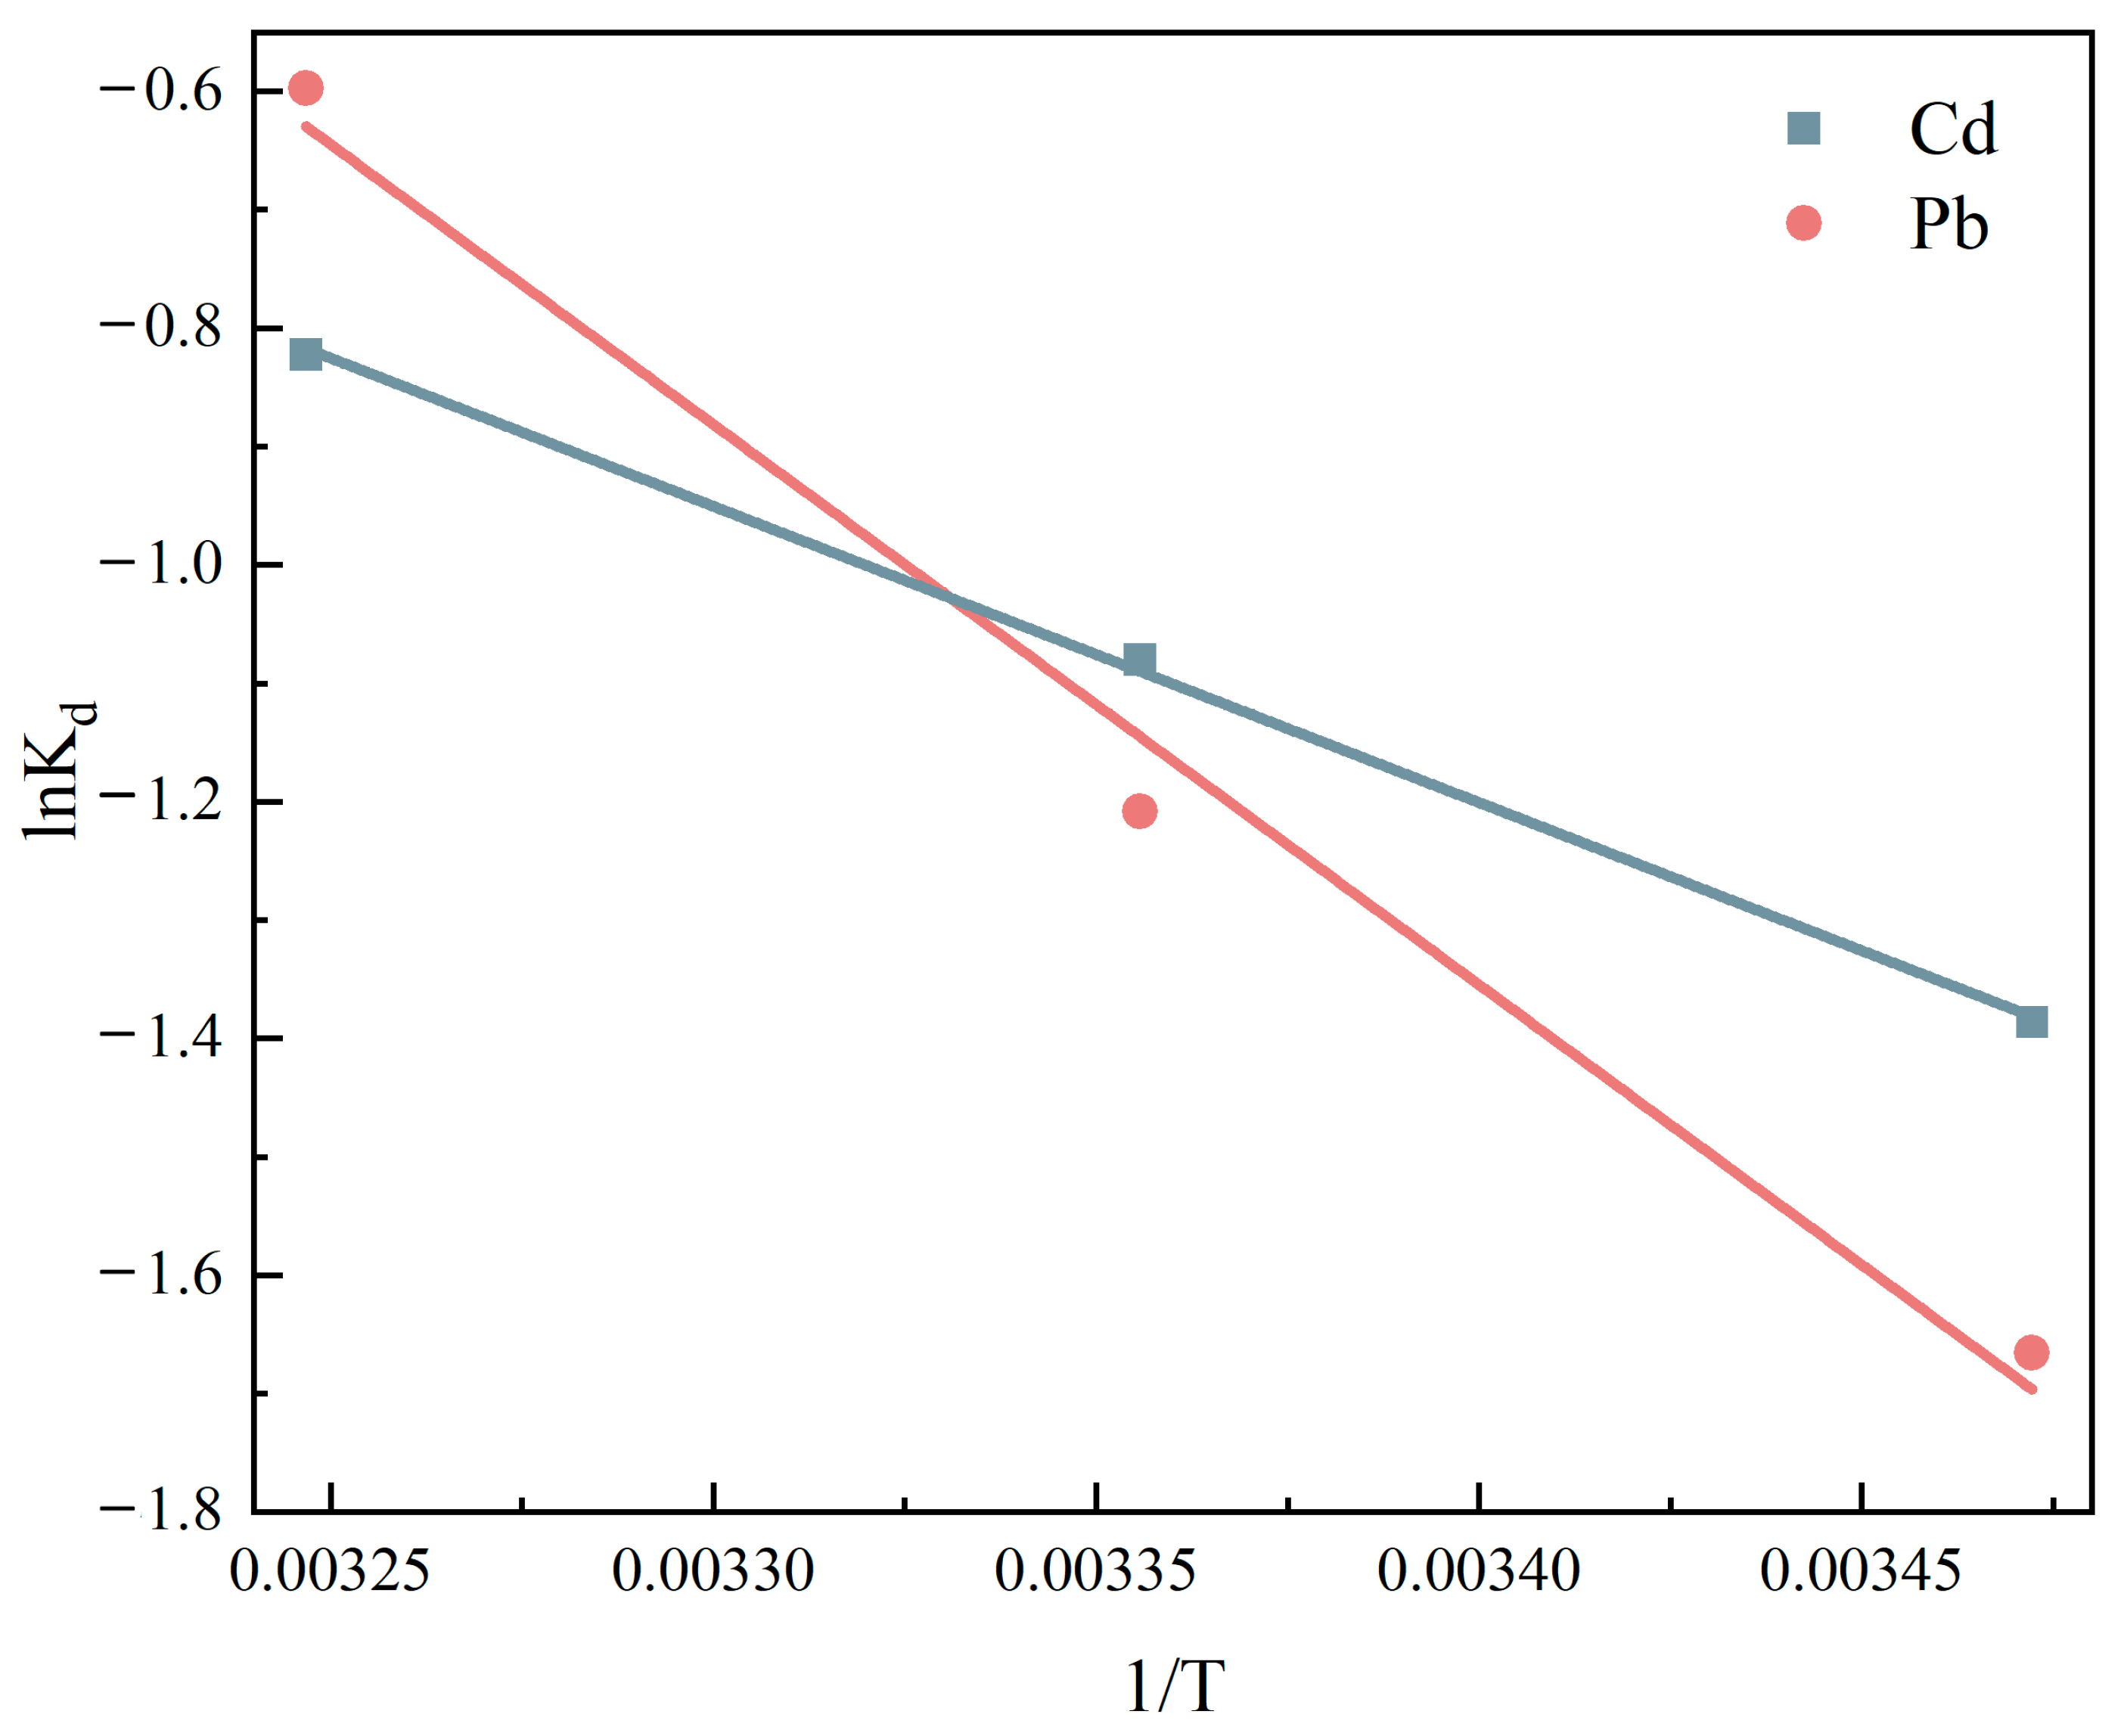
3.4. Adsorption Thermodynamics
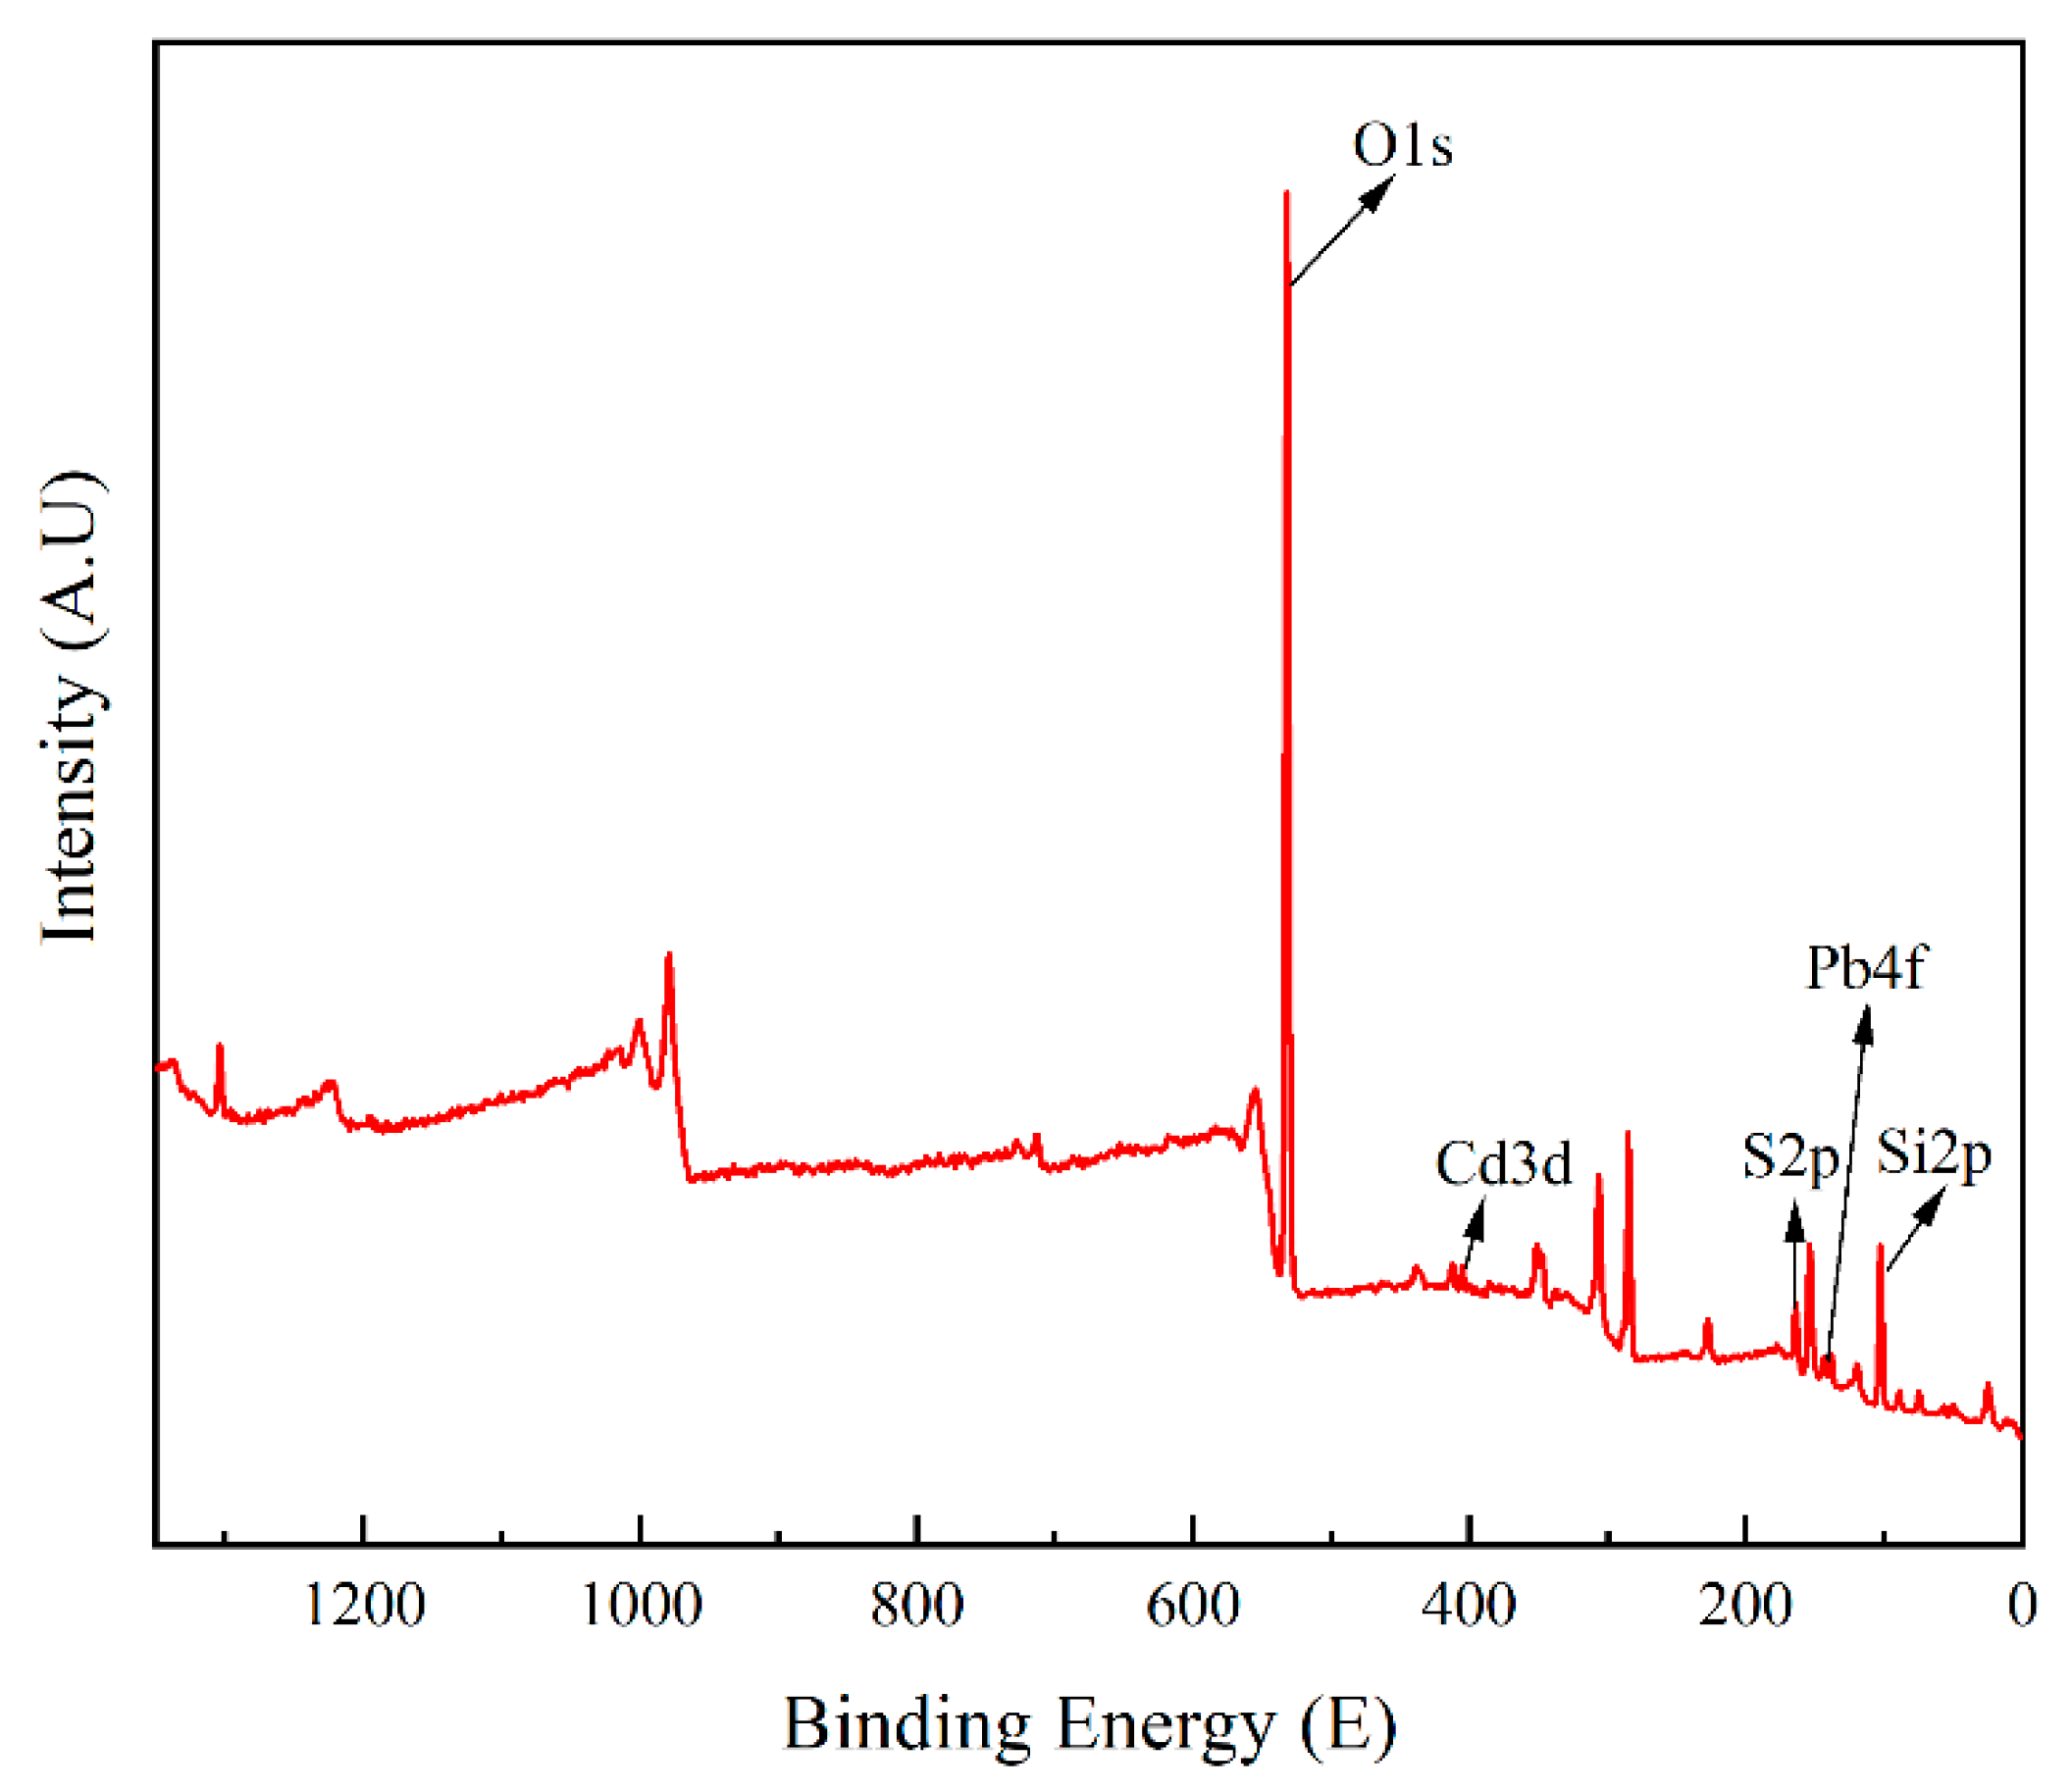
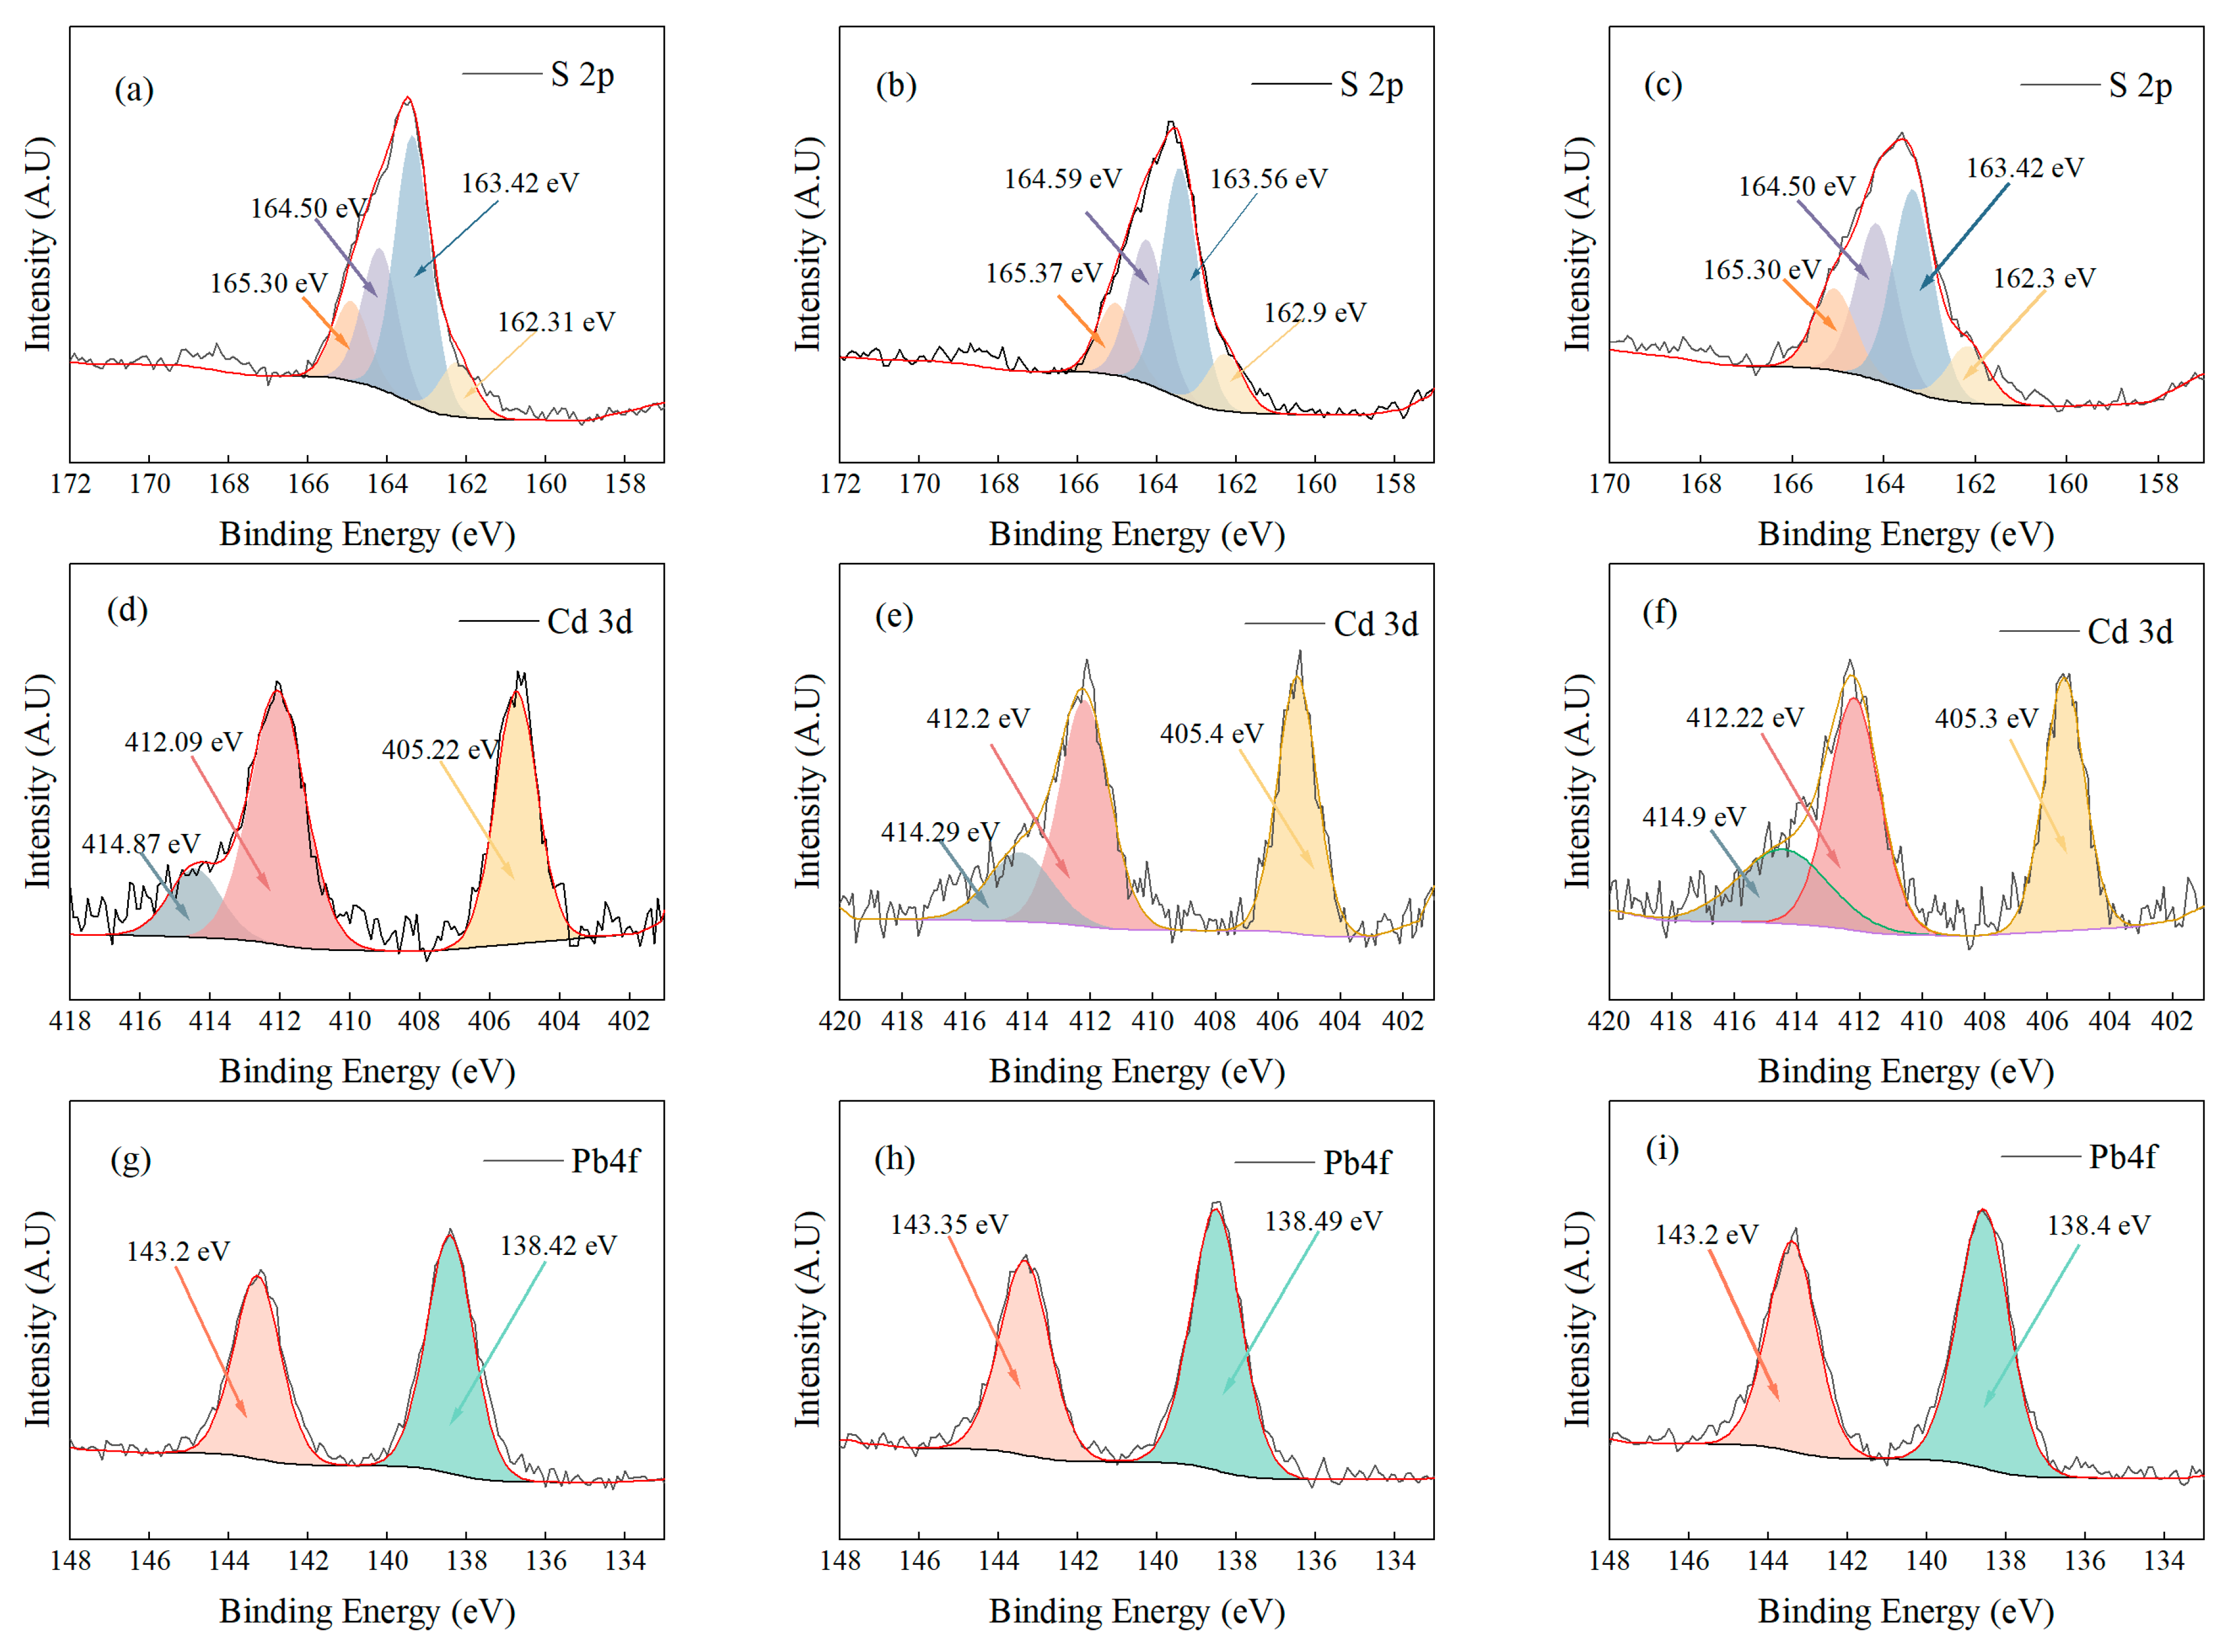
To investigate the adsorption types of Cd (II) and Pb (II) by ATP-SH-0.5, the thermodynamic parameters of the adsorption process were calculated. The effect of temperature on the adsorption of Cd (II) and Pb (II) on ATP-SH-0.5 is shown in Figure 9. The thermodynamic parameters, including the entropy change (ΔS0) and enthalpy change (ΔH0), were obtained by linearly fitting the plot of lnKd and 1/T. (Figure 9). The calculated thermodynamic parameters were listed in Table 6. The values of ΔS0 for the adsorption of Cd (II) and Pb (II) were positive, indicating that the adsorption process was spontaneous. The values of ΔH0 for the adsorption of Cd (II) and Pb (II) were negative, indicating that the adsorption of Cd (II) and Pb (II) by ATP-SH-0.5 was an endothermic reaction and that an increase in temperature was favorable for the reaction to proceed [33].

3.5. XPS Analysis

To gain a deeper understanding of the adsorption mechanism, X-ray photoelectron spectroscopy (XPS) was used to analyze ATP-SH-0.5 after Cd (II) and Pb (II) adsorption. The total spectrum (Figure 10) showed characteristic peaks for Cd, Pb, and S in the ATP-SH-0.5 spectra. In order to investigate the adsorption behavior of Cd (II) and Pb (II) in ATP-SH-0.5, ATP-SH-0.5-Pb/Cd was subjected to etching treatment to determine their fate. Table 7 presents the XPS data of ATP-SH-0.5-Pb/Cd samples at different etch depths (0, 2, 4 nm). As shown in Figure 11a–c), the peaks at 163.42 eV and 163.56 eV were attributed to the vibration of isolated mercapto (-SH) groups, while the peaks at 164.5 eV and 164.59 eV were ascribed to the disulfide (-S-S) bond due to the oxidation of the neighboring -SH groups [40]. The peaks at 164.5 eV and 164.59 eV were assigned to S2p1/2, while the peaks at 163.42 eV and 163.56 eV were assigned to S2p3/2. The appearance of these peaks indicated that sulfur existed in a chemical state as a free mercapto group throughout the organic monolayer. In contrast to natural attapulgite, both the surface hydroxyl groups and the graft mercapto groups of mercapto-functionalized attapulgite participate in the surface complexation reaction. The bonding energies of about 162 eV corresponded to Cd-S and Pb-S. As shown in Figure 11d–f, the Cd 3d spectra in ATP-SH-0.5 after Cd (II) and Pb (II) adsorption had three different bonding energy peaks. The peaks at about 405 eV and about 412 eV were assigned to Cd 3d5/2 and Cd 3d3/2, respectively, which is consistent with the binding energy of Cd-S [41]. Furthermore, the peaks at about 414 eV indicated the loss feature of Cd metal. The XPS subpeaks for Pb (II) (Figure 11g–i) indicated that most of the Pb existed as Pb (II) in the form of Pb-S (at approximately 138.4 eV). The binding energies of Pb 4f7/2 were approximately 138.4 eV, which is consistent with the formation of Pb (II) bidentate complexation on sulfhydryl-containing adsorbents based on activated carbon and similar to small lead sulfide clusters [42]. This suggests that one Pb (II) ion reacted with two mercapto groups to form bidentate complexation.

4. Conclusions

In this study, a simple co-precipitation method was employed to successfully load mercapto groups onto attapulgite. Comparing ATP-O and ATP-C, it was found that ATP-C was more suitable as a modified material. When the mass-to-volume ratio of ATP-C to MPTMS was 1 g:0.5 mL and the pH was set to 8, mercapto-functionalized calcined attapulgite had the best adsorption effect. The adsorption of Cd (II) and Pb (II) by ATP-SH was mainly influenced by the oscillation time, solution pH, and adsorption temperature. When the pH value of the adsorption process is 5 and the temperature is 308 K, ATP-SH-0.5 has the best adsorption effect on Cd and Pb. At adsorption times of 480 min and 720 min, the adsorption amounts of Cd and Pb reached their maximum, respectively. In a single-ion system, the maximum adsorption capacity of ATP-SH-0.5 for Cd (II) was 43.81 mg/L, and the maximum adsorption capacity for Pb (II) was 274.83 mg/L, respectively. In a binary-ion system, the maximum adsorption capacity of ATP-SH-0.5 for Cd (II) was 31.86 mg/L, and the maximum adsorption capacity for Pb (II) was 254.45 mg/L, respectively. Various characterizations and experiments showed that the adsorption of Cd (II) and Pb (II) onto ATP-SH-0.5 involves an initial ion exchange reaction, which continues until all surface sites are fully occupied. Subsequently, Cd and Pb diffuse into the interlayer and intraparticle micropores of ATP-SH-0.5 and undergo further ion exchange, hydroxyl, and thiol functional group complexation reactions. This adsorption process follows a single-molecule layer adsorption mechanism, and the surface of the adsorbent is non-uniform, with the surface coverage increasing with the rise in adsorption temperature. The adsorption process is primarily governed by chemical adsorption, which is a spontaneous endothermic process. Increasing the temperature of the system is favorable for the adsorption of Cd (II) and Pb (II) onto ATP-SH-0.5 due to the favorable thermodynamic conditions that promote the adsorption process. XPS results indicate that hydroxyl and grafted thiol functional groups on the surface of mercapto-functionalized attapulgite participated in surface complexation reactions with Cd (II) and Pb (II), resulting in the formation of Cd-S and Pb-S species. Overall, this study provides a promising mercapto-functionalized modification material for the removal of heavy metals from both aqueous and soils.

Supplementary Materials

The following supporting information can be downloaded at: https://www.mdpi.com/article/10.3390/min13101337/s1, Figure S1: Fitting curve of Pseudo-first-order and Pseudo-second-order (a), Elovich model (b), Double constant equation model (c) and Intraparticle diffusion model (d) of ATP-SH-0.5 for Cd (II) adsorption in binary heavy metal ion system.; Figure S2: Fitting curve of Pseudo-first-order and Pseudo-second-order (a), Elovich model (b), Double constant equation model (c) and Intraparticle diffusion model (d) of ATP-SH-0.5 for Pb (II) adsorption in binary heavy metal ion system.; Figure S3: The non-linear fitted curves of the four model isotherms at different temperatures for Cd: Langmuir and Freundlich models at 288 K (a), 298 K (b), 308 K (c); Dubinin-Radushkevich model at 288 K (d), 298 K (e), 308 K (f); Temkin model at 288 K (g), 298 K (h), 308 K (i); Figure S4: The non-linear fitted curves of the four model isotherms at different temperatures for Pb: Langmuir and Freundlich models at 288 K (a), 298 K (b), 308 K (c); Dubinin-Radushkevich model at 288 K (d), 298 K (e), 308 K (f); Temkin model at 288 K (g), 298 K (h), 308 K (i).

Author Contributions

Data curation, J.Z., Y.L., Z.Z., X.F., Q.Z., D.T. and C.L.; Methodology, J.Z.; Project administration, J.Z. and Z.W.; Resources, Z.W., Y.Z. and S.C. All authors have read and agreed to the published version of the manuscript.

Funding

This work was supported by grants from the Ministry of Science and Technology of the People’s Republic of China [grant numbers 2019YFC1803500, 2019YFC1803504]; the Natural Science Foundation of Sichuan Province [grant numbers 2018SZ0298, 2023YFS0390]; the National Natural Science Foundation of China [grant number No. 41402248]; the Biological and Chemical Engineering Laboratory of Panzhihua College [grant numbers JDH-2019-E-01, GR-2020-E-02]; the Bureau of Science and Technology Panzhihua City [grant number 2017CY-N-8]; Bureau of Science and Technology Aba Qiang Tibetan Autonomous Prefecture [grant numbers R22YYJSYJ0004, R23YYJSYJ0010].

Data Availability Statement

The data and materials used and analyzed during the current study are available from the corresponding author on reasonable request.

Acknowledgments

The authors thank the Analytical Testing Center of Southwest University of Science and Technology for providing total heavy metal analysis services.

Conflicts of Interest

The authors declare no conflict of interest.

References

  1. Song, Y.; Zhao, Z.; Li, J.; You, Y.; Ma, X.; Li, J.; Cheng, X. Preparation of silicon-doped ferrihydrite for adsorption of lead and cadmium: Property and mechanism. Chin. Chem. Lett. 2021, 32, 3169–3174. [Google Scholar] [CrossRef]
  2. Feng, C.; Huang, M.; Huang, C. Specific chemical adsorption of selected divalent heavy metal ions onto hydrous γ-Fe2O3-biochar from dilute aqueous solutions with pH as a master variable. Chem. Eng. J. 2023, 451, 138921. [Google Scholar] [CrossRef]
  3. Sun, Y.; Liu, C.; Gao, Y.; Zhang, T.; Jia, Y.; Wang, S. All-in-one strategy to prepare molded biochar with magnetism from sewage sludge for high-efficiency removal of Cd(Ⅱ). J. Hazard. Mater. 2023, 454, 131488. [Google Scholar] [CrossRef]
  4. Wang, Q.; Wang, B.; Lee, X.; Lehmann, J.; Gao, B. Sorption and desorption of Pb(II) to biochar as affected by oxidation and pH. Sci. Total Environ. 2018, 634, 188–194. [Google Scholar] [CrossRef]
  5. Sun, F.; Chen, J.; Chen, F.; Wang, X.; Liu, K.; Yang, Y.; Tang, M. Influence of biochar remediation on Eisenia fetida in Pb-contaminated soils. Chemosphere 2022, 295, 133954. [Google Scholar] [CrossRef] [PubMed]
  6. Ahmed, W.; Mehmood, S.; Mahmood, M.; Ali, S.; Shakoor, A.; Núñez-Delgado, A.; Asghar, R.M.A.; Zhao, H.; Liu, W.; Li, W. Adsorption of Pb(II) from wastewater using a red mud modified rice-straw biochar: Influencing factors and reusability. Environ. Pollut. 2023, 326, 121405. [Google Scholar] [CrossRef]
  7. Hasan, G.A.; Das, A.K.; Satter, M.A.; Asif, M. Distribution of Cr, Cd, Cu, Pb and Zn in organs of three selected local fish species of Turag river, Bangladesh and impact assessment on human health. Emerg. Contam. 2023, 9, 100197. [Google Scholar] [CrossRef]
  8. Luo, J.; Xing, W.; Ippolito, J.A.; Zhao, L.; Han, K.; Wang, Y.; Qiu, K.; Li, L. Bioaccessibility, source and human health risk of Pb, Cd, Cu and Zn in windowsill dusts from an area affected by long-term Pb smelting. Sci. Total Environ. 2022, 842, 156707. [Google Scholar] [CrossRef]
  9. Jin, Y.; Wang, Y.; Li, X.; Luo, T.; Ma, Y.; Wang, B.; Liang, H. Remediation and its biological responses to Cd(II)-Cr(VI)-Pb(II) multi-contaminated soil by supported nano zero-valent iron composites. Sci. Total Environ. 2023, 867, 161344. [Google Scholar] [CrossRef]
  10. Li, Y.; Wu, J.; Qian, J.; Sun, J.; Huang, T.; Li, H.; Chen, X. Environmental remediation of Pb–Cd contaminated soil with organic phosphonic acids-saponin: Conditions, effectiveness, ecological risk and recovery. Chemosphere 2023, 322, 138122. [Google Scholar] [CrossRef]
  11. Lyu, P.; Li, L.; Huang, X.; Xie, J.; Ye, J.; Tian, Y.; Huang, J.; Zhu, C. Ternary Ca–Mg–Al layered double-hydroxides for synergistic remediation of As, Cd, and Pb from both contaminated soil and groundwater: Characteristics, effectiveness, and immobilization mechanisms. J. Hazard. Mater. 2023, 442, 130030. [Google Scholar] [CrossRef] [PubMed]
  12. Qu, G.; Zhou, J.; Liang, S.; Li, Y.; Ning, P.; Pan, K.; Ji, W.; Tang, H. Thiol-functionalized multi-walled carbon nanotubes for effective removal of Pb(II) from aqueous solutions. Mater. Chem. Phys. 2022, 278, 125688. [Google Scholar] [CrossRef]
  13. Chen, H.; Ai, Y.; Jia, Y.; Li, J.; Gu, M.; Chen, M. Effective and simultaneous removal of heavy metals and neutralization of acid mine drainage using an attapulgite-soda residue based adsorbent. Sci. Total Environ. 2022, 843, 157120. [Google Scholar] [CrossRef] [PubMed]
  14. Huang, R.; Lin, Q.; Zhong, Q.; Zhang, X.; Wen, X.; Luo, H. Removal of Cd(II) and Pb(II) from aqueous solution by modified attapulgite clay. Arab. J. Chem. 2020, 13, 4994–5008. [Google Scholar] [CrossRef]
  15. Liu, J.; Zhang, J.; Xing, L.; Wang, D.; Wang, L.; Xiao, H.; Ke, J. Magnetic Fe3O4/attapulgite hybrids for Cd(II) adsorption: Performance, mechanism and recovery. J. Hazard. Mater. 2021, 412, 125237. [Google Scholar] [CrossRef]
  16. Shang, Z.; Zhang, L.; Zhao, X.; Liu, S.; Li, D. Removal of Pb(II), Cd(II) and Hg(II) from aqueous solution by mercapto-modified coal gangue. J. Environ. Manag. 2019, 231, 391–396. [Google Scholar] [CrossRef]
  17. Zhao, F.; Yao, X.; Liu, C.; Ran, X.; Wang, C.; Lu, B. Mercapto-functionalized ordered mesoporous silica-modified PVDF membrane for efficiently scavenging Cd2+ from water. J. Environ. Manag. 2022, 302, 114103. [Google Scholar] [CrossRef]
  18. Hamid, Y.; Liu, L.; Haris, M.; Usman, M.; Lin, Q.; Chen, Y.; Rashid, M.S.; Ulhassan, Z.; Hussain, M.I.; Yang, X. Novel thiol-grafted composite of chitosan and rice straw biochar (TH@CT-BC): A two-step fabrication for highly selective adsorption of cadmium from contaminated water. J. Environ. Chem. Eng. 2023, 11, 110527. [Google Scholar] [CrossRef]
  19. Asem, A.A.; Ahmed, M.D.; Khalid, Z.E. Selective separation of mercury (II) using a synthetic resin containing amine and mercaptan as chelating groups. React. Funct. Polym. 2005, 65, 267–275. [Google Scholar] [CrossRef]
  20. Liang, J.; He, Q.; Zhao, Y.; Yuan, Y.; Wang, Z.; Gao, Z.; Hu, Z.; Zhao, X.; Yue, T. Synthesis of sulfhydryl modified bacterial cellulose gel membrane and its application in adsorption of patulin from apple juice. LWT 2022, 158, 113159. [Google Scholar] [CrossRef]
  21. Mohammad, K.U. A review on the adsorption of heavy metals by clay minerals, with special focus on the past decade. Chem. Eng. J. 2017, 308, 438–462. [Google Scholar]
  22. Zhang, Y.; Wang, W.; Zhang, J.; Liu, P.; Wang, A. A comparative study about adsorption of natural palygorskite for methylene blue. Chem. Eng. J. 2015, 262, 390–398. [Google Scholar] [CrossRef]
  23. Ihsanullah, I.; Sajid, M.; Khan, S.; Bilal, M. Aerogel-based adsorbents as emerging materials for the removal of heavy metals from water: Progress, challenges, and prospects. Sep. Purif. Technol. 2022, 291, 120923. [Google Scholar] [CrossRef]
  24. Zhu, S.; Khan, M.A.; Kameda, T.; Xu, H.; Wang, F.; Xia, M.; Yoshioka, T. New insights into the capture performance and mechanism of hazardous metals Cr3+ and Cd2+ onto an effective layered double hydroxide based material. J. Hazard. Mater. 2022, 426, 128062. [Google Scholar] [CrossRef] [PubMed]
  25. Chen, F.; Huang, G.-Y.; Wang, K.-A.; Zhu, H.-B. Zn(II)-MOF derived N-doped carbons achieve marked ORR activity in alkaline and acidic media. Chem. Commun. 2022, 59, 736–739. [Google Scholar] [CrossRef]
  26. Irving, L. The adsorption of gases on plane surfaces of glass, mica and platinum. J. Am. Chem. Soc. 2002, 40, 1361–1403. [Google Scholar] [CrossRef]
  27. Blanchard, G.; Maunaye, M.; Martin, G. Removal of heavy metals from waters by means of natural zeolites. Water Res. 1984, 18, 1501–1507. [Google Scholar] [CrossRef]
  28. Debord, J.; Harel, M.; Bollinger, J.-C.; Chu, K.H. The Elovich isotherm equation: Back to the roots and new developments. Chem. Eng. Sci. 2022, 262, 118012. [Google Scholar] [CrossRef]
  29. Al-Shathr, A.; Shakor, Z.M.; Al-Zaidi, B.Y.; Majdi, H.S.; AbdulRazak, A.A.; Aal-Kaeb, S.; Shohib, A.A.; McGregor, J. Reaction Kinetics of Cinnamaldehyde Hydrogenation over Pt/SiO2: Comparison between Bulk and Intraparticle Diffusion Models. Int. J. Chem. Eng. 2022, 2022, 8303874. [Google Scholar] [CrossRef]
  30. Ho, Y.; McKay, G. The kinetics of sorption of divalent metal ions onto sphagnum moss flat. Water Res. J. Int. Water Assoc. 2000, 34, 735–742. [Google Scholar]
  31. Susmita, S.G.; Rishna, G.B. Treatment of water contaminated with Pb(II) and Cd(II) by adsorption on kaolinite, montmorillonite and their acid-activated forms. Indian J. Chem. Technol. 2009, 16, 457–470. [Google Scholar]
  32. Fu, C.; Zhu, X.; Dong, X.; Zhao, P.; Wang, Z. Study of adsorption property and mechanism of lead(II) and cadmium(II) onto sulfhydryl modified attapulgite. Arab. J. Chem. 2021, 14, 102960. [Google Scholar] [CrossRef]
  33. Yang, Y.; Zeng, L.; Lin, Z.; Jiang, H.; Zhang, A. Adsorption of Pb2+, Cu2+ and Cd2+ by sulfhydryl modified chitosan beads. Carbohydr. Polym. 2021, 274, 118622. [Google Scholar] [CrossRef]
  34. Sun, X.; Liu, X.; Yang, B.; Xu, L.; Yu, S. Functionalized chrysotile nanotubes with mercapto groups and their Pb(II) and Cd(II) adsorption properties in aqueous solution. J. Mol. Liq. 2015, 208, 347–355. [Google Scholar] [CrossRef]
  35. Cao, B.; Qu, J.; Yuan, Y.; Zhang, W.; Miao, X.; Zhang, X.; Xu, Y.; Han, T.; Song, H.; Ma, S.; et al. Efficient scavenging of aqueous Pb(II)/Cd(II) by sulfide-iron decorated biochar: Performance, mechanisms and reusability exploration. J. Environ. Chem. Eng. 2022, 10, 107531. [Google Scholar] [CrossRef]
  36. Li, G.; Zhang, J.; Liu, J.; Sun, C.; Yan, Z. Adsorption characteristics of white pottery clay towards Pb(II), Cu(II), and Cd(II). Arab. J. Geosci. 2020, 13, 519. [Google Scholar] [CrossRef]
  37. Sun, X.; Zeng, H.; Tang, T. Molecular Simulations on the Coalescence of Water-in-Oil Emulsion Droplets with Non-ionic Surfactant and Model Asphaltene. Langmuir ACS J. Surf. Colloids 2023, 39, 2233–2245. [Google Scholar] [CrossRef]
  38. Parmanbek, N.; Sütekin, D.S.; Barsbay, M.; Mashentseva, A.A.; Zheltov, D.A.; Aimanova, N.A.; Jakupova, Z.Y.; Zdorovets, M.V. Hybrid PET Track-Etched Membranes Grafted by Well-Defined Poly(2-(dimethylamino)ethyl methacrylate) Brushes and Loaded with Silver Nanoparticles for the Removal of As(III). Polymers 2022, 14, 4026. [Google Scholar] [CrossRef]
  39. Abeykoon, K.G.M.D.; Dunuweera, S.P.; Liyanage, D.N.D.; Rajapakse, R.M.G. Removal of fluoride from aqueous solution by porous Vaterite calcium carbonate nanoparticles. Mater. Res. Express 2020, 7, 035009. [Google Scholar] [CrossRef]
  40. Zuo, J.; Torres, E. Comparison of adsorption of mercaptopropyltrimethoxysilane on amphiphilic TiO2 and hydroxylated SiO2. Langmuir ACS J. Surf. Colloids 2010, 26, 15161–15168. [Google Scholar] [CrossRef]
  41. Liu, Y.; Zhou, H.; Zhou, B.; Li, J.; Chen, H.; Wang, J.; Bai, J.; Shangguan, W.; Cai, W. Highly stable CdS-modified short TiO2 nanotube array electrode for efficient visible-light hydrogen generation. Int. J. Hydrog. Energy 2010, 36, 167–174. [Google Scholar] [CrossRef]
  42. Ren, J.; Zheng, L.; Su, Y.; Meng, P.; Zhou, Q.; Zeng, H.; Zhang, T.; Yu, H. Competitive adsorption of Cd(II), Pb(II) and Cu(II) ions from acid mine drainage with zero-valent iron/phosphoric titanium dioxide: XPS qualitative analyses and DFT quantitative calculations. Chem. Eng. J. 2022, 445, 136778. [Google Scholar] [CrossRef]
Figure 1. Adsorption of Cd (II) and Pb (II) by ATP-O and ATP-C.
Minerals 13 01337 g001
Figure 2. Effect of different ratios (a) of m(ATP) and v (MPTMS) on Cd (II) and Pb (II) and adsorption of Cd (II) and Pb (II) by ATP-SH-0.5 under different modified pH (b) bi-heavy metal ion systems.
Minerals 13 01337 g002
Figure 3. FTIR spectra (a) and XRD patterns (b) of ATP-O, ATP-C, and ATPSH-0.5.
Minerals 13 01337 g003
Figure 4. SEM of ATP-O at 20,000 (a) and 40,000 (b) times magnification; SEM of ATP-C at 20,000 (c) and 40,000 (d) times magnification; and SEM of ATP-SH at 20,000 (e) and 40,000 (f) times magnification.
Minerals 13 01337 g004
Figure 5. Zeta potential distribution of ATP-C and ATP-SH-0.5 at different pH.
Minerals 13 01337 g005
Figure 6. Adsorption of Cd (II) and Pb (II) by ATP-SH-0.5 at different pHs under single and bi-heavy metal ion systems.
Minerals 13 01337 g006
Figure 7. Fitting curve of Pseudo-first-order and Pseudo-second-order models of ATP-SH-0.5 for Cd (II) (a) and Pb (II) (b) adsorption in binary heavy metal ion systems.
Minerals 13 01337 g007
Figure 8. Adsorption kinetics for the adsorption of Cd (II) (a) and Pb (II) (b) in a binary heavy metal ion system.
Minerals 13 01337 g008
Figure 9. Effect of thermodynamic curves on the adsorption of Cd (II) and Pb (II) by ATP-SH-0.5.
Minerals 13 01337 g009
Figure 10. XPS spectra for ATP-SH-0.5 after Cd (II) and Pb (II) adsorption.
Minerals 13 01337 g010
Figure 11. XPS spectra of ATP-SH-0.5 after Cd (II) and Pb (II) adsorption. (ac) S 2p high-resolution spectra of ATP-SH-0.5-Pb/Cd at 0, 2, and 4 nm; (df) Cd 3d high-resolution spectra of ATP-SH-0.5-Pb/Cd at 0, 2, and 4 nm; (gi) Pb 4f high-resolution spectra of ATP-SH-0.5-Pb/Cd at 0, 2, and 4 nm.
Minerals 13 01337 g011
Table 1. The main chemical composition of ATP-O and ATP-C.
SubstanceWeight Percent (%)
ATP-OATP-C
SiO268.5252.53
Al2O39.9213.25
MgO12.578.8
Fe2O3 + FeO6.257.3
CaO0.357.09
Na2O0.070.06
K2O0.960.97
Table 2. Kinetic model parameters of ATP-SH-0.5 for Cd (II) and Pb (II) adsorption in a binary heavy metal ion system.
Models’ParametersValues
Cd (Ⅱ)Pb (Ⅱ)
Pseudo-first-orderk1 (min−1)0.009557450.00886655
qe (mg/g)2.2208539555.737728575
R20.50870.75874
RSS0.046720.06869
Pseudo-second-orderk2 (g·mg−1 min−1)0.0117335110.00260686
qe (mg/g)10.23436756.17977528
R20.907940.91502
RSS0.037970.03754
Elovichα2.1633783320.356691897
β1,173,873.4021,017,753.137
R20.900980.94288
Double constant equationb0.051280.0599
R20.825990.78416
Intraparticle diffusionkid (mg·g−1·min1/2)0.051750.29547
C (mg/g)8.5347145.4196
R20.578240.72437
Where k1 is the Pseudo-first-order adsorption rate constant (min−1), qe is the Pseudo-second-order adsorption capacity (mg/g), RSS is the Residual Sum of Squares, k2 is the second-order adsorption rate constant (g/mg·min), α is the chemical adsorption rate constant of the Elovich equation, β is a constant related to surface coverage, kid is the diffusion rate constant within the particle (mg·g−1·min−0.5), and C is the intercept of intraparticle diffusion.
Table 3. Isotherm model parameters of ATP-SH-0.5 for Cd (II) and Pb (II) adsorption in a single heavy metal ion system.
Models’ParametersValues
Cd (Ⅱ)Pb (Ⅱ)
288 K298 K308 K288 K298 K308 K
LangmuirKL (L/mg)0.10510.346780.24290.001670.003090.01207
qm (mg/g)32.5019744.3233947.25244389.70008406.1673430.44418
R20.903990.936550.976240.955520.956120.96382
RSS0.079810.034520.010370.157490.036910.0126
FreundlichKF (mg/g)/(mg/L)n)14.5258823.0325621.068137.3130315.9211457.30351
1/nF0.152190.158540.193530.526570.430950.29548
R20.980520.929570.951550.927150.945790.94889
RSS0.052332.796170.077780.096180.087650.05655
TemkinKT (L/g)9.8769520.8113516.1658555.9211239.9012828.72258
BT9.62539653446.640829.1785450.0098937850.0254210720.146883777
R20.796290.923240.95760.904380.953910.96426
Dubinin-RadushkevichKDR (mol2/kJ2)29.5501848739.4336741.5846279.8489519261.4230562332.5732046
E (kJ/mol)0.6505250.737980.823849072.4433072483.4164572055.525020335
R20.902480.930740.95310.946960.929140.92734
Where KL is the Langmuir adsorption constant, qm is the theoretical saturated adsorption capacity (mg/g), RSS is the Residual Sum of Squares, KF is the Freundlich adsorption constant, 1/nF is the adsorption index of Freundlich, KDR is the saturated adsorption capacity of the Dubinin-Radushkevich, and E is the adsorption free energy (kJ/mol).
Table 4. Specific surface area and pore channel.
SampleBet Surface Area (cm2/g)Surface Area (cm2/g)Microporous Area (cm2/g)Total Pore Volume (cm3/g)Microporous Volume (cm3/g)
ATP-O66.30449.35416.9500.14200.031
ATP-C97.54375.78721.7560.29750.057
Table 5. Compared with the maximum theoretical adsorption capacity of different sulfhydryl functionalized materials at 298 K.
Adsorbents SamplesAdsorption Equilibrium Time
(min)
Maximum Theoretical Adsorption Capacity (mg/g)k1 (min−1)k2 (g· mg−1 min−1)Sorption MechanismReferences
SH-ATPCd: 240
Pb: 1080
Cd: 20.24
Pb: 65.79
Cd: 0.0517
Pb: 0.0122
Cd: 0.0622
Pb: 0.0266
chemisorption[32]
CG-SHCd: 240
Pb: 1200
Cd:110.4
Pb:332.8
Cd:0.00227
Pb:0.0301
Cd:0.01223
Pb:0.00478
chemisorption[16]
MWCNT-SHPb: 60Pb: 144.9Pb: 0.1Pb: 0.002chemisorption[12]
DMSA-CSCd: 180
Pb: 180
Cd: 183.1
Pb: 273.7
Cd: 0.0517
Pb: 0.0122
Cd: 0.0622
Pb: 0.0266
chemisorption[33]
ChNTs-SH-Cd: 39.23
Pb: 83.96
Cd: 0.09471
Pb: 0.1956
Cd: 0.05784
Pb: 0.01255
chemisorption[34]
BC-Fe-SCd: 30
Pb: 30
Cd: 57.71
Pb: 124.62
Cd: 1.0833
Pb: 1.3845
Cd:0.0484
Pb: 0.0231
chemisorption[35]
ATP-SH-0.5Cd:480
Pb: 720
Cd: 44.33
Pb: 406.16
Cd: 0.00955745
Pb: 0.00886655
Cd: 0.011733511
Pb: 0.00260686
chemisorptionThis work
Where SH-ATP: mercapto-functionalized unpurified attapulgite, CG-SH: mercapto-modified coal gangue, MWCNT-SH: thiol-functionalized multi-walled carbon nanotubes, DMSA-CS: sulfhydryl-modified chitosan beads, ChNTs-SH: Chrysotile nanotubes (ChNTs) synthesized under hydrothermal conditions were functionalized by surface grafting in toluene with 3-mercaptopropyltrimethoxysilane (MPTMS), and BC-Fe-S: Sulfide-iron decorated biochar.
Table 6. Thermodynamic parameters of ATP-SH-0.5 for Cd (II) and Pb (II) adsorption.
T (K)Cd (II)Pb (II)
ΔG0 (kJ/mol)ΔH0 (kJ/mol)ΔS0 (J/(mol⋅K))ΔG0 (kJ/mol)ΔH0 (kJ/mol)ΔS0 (J/(mol⋅K))
308−2.10622041420.8060.73152522−1.52851357939.33122.4594002
298−2.675763502−2.993515844
288−3.319198819−3.988218172
Where ΔG0 is Gibbs free energy, ΔS0 is entropy change, and ΔH0 is enthalpy change.
Table 7. XPS data of ATP-SH-0.5-Pb/Cd samples at different etch depths.
Etch DepthS 2pCd 3d3/2Pb 4f7/2
B.E (eV)At (%)B.E (eV)At (%)B.E (eV)At (%)
0 nm-11.01405.220.67138.420.49
2 nm-11.03405.40.71138.490.59
4 nm-6.98405.30.53138.40.43
Disclaimer/Publisher’s Note: The statements, opinions and data contained in all publications are solely those of the individual author(s) and contributor(s) and not of MDPI and/or the editor(s). MDPI and/or the editor(s) disclaim responsibility for any injury to people or property resulting from any ideas, methods, instructions or products referred to in the content.

