Abstract
Horizontal boundary identification of causative sources is an essential tool in potential field data interpretation due to the feasibility of automatically retrieving the boundary information of subsurface gravity or geomagnetic structures. Although many approaches have been proposed to address these issues, it is still a hot research topic for many researchers to derive novel methods or enhance existing techniques. We present two high-resolution edge detectors based on the Gudermannian function and the modifications of the second-order derivative of the field. The effectiveness of the newly proposed filters was initially tested on synthetic gravity anomalies and geomagnetic responses with different assumptions (2-D and 3-D; imposed and superimposed; noise-free and noise-contaminated). The obtained results verified that the two novel methods yield the capability of producing high-resolution, balanced amplitudes and accurate results for better imaging causative sources with different geometrical and geophysical properties, compared with the other nine representative edge enhancement techniques. Furthermore, the yielded results from the application of the two strategies to a real-world aeromagnetic data set measured from the Central Puget Lowland (C.P.L) of the United States and a gravity data set surveyed from the Jalal Abad area of Kerman province, Iran, with detailed comparative studies validated that the edges identified via the two methods are in good agreement with the major geological structures within the study areas and the determined lateral information using the tilt-depth, top-depth estimation method. These features make them valuable tools for solving edge detection problems.
1. Introduction
Imaging the horizontal boundaries of anomalous structures provides impressive visibility to determine lateral changes in gravity and magnetic data [1,2,3,4,5,6,7,8,9,10]. Acquired horizontal boundary information from buried causative sources has an essential role in modeling and interpreting gravity and magnetic data. Edge detection filters are constantly applied to delineate geologic structures in the form of faults, contacts, dykes, mineral deposits, and other tectonic features [5,6,10]. In the geophysical literature, many different filters have been presented to locate the geologic structures from measured data based on the horizontal and vertical derivatives of the gravity anomalies, the reduced-to-the-pole magnetic anomalies, or the ratios of these directional derivatives [9,11,12,13,14,15,16,17,18,19,20]. For comparison purposes, some conventional and standard edge detectors have been selected.
The total horizontal gradient (THG) filter of the potential field is given by Equation (1) [16]. THG is stable and popular for enhancing the edges of causative sources. The lateral boundaries of causative structures are determined by the peaks of the THG amplitude.
where M is the gravity or the reduced-to-the-pole magnetic field, is the field gradient in the x direction, and is the field gradient in the y direction.
The analytical signal (AS) technique is another edge delineation filter proposed by [17]. The amplitude maxima are directed over the edge center; however, AS cannot balance the edges of various sources at different depths and would be dominated by larger amplitudes caused by shallow bodies [18]. The AS method is constructed as follows:
where is the measured field gradient in the z direction [17].
The tilt angle (TA) phase-based filter was proposed by [19], which is a normalized function of the THG filter. The TA edge detection method equation is given by
The lateral boundaries of subsurface sources are delineated by the zero crossing [19]. However, tilt angle edge detector usually generates blurry results, namely, TA suffers from the deficiency of yielding low-resolution outputs, especially in the case of thin and deep causative structures [7,9].
The total horizontal gradient of the tilt angle (TA-THG) filter was proposed by [20], which is calculated using Equation (4):
The edges of buried structures are recognized by the peaks of the TA-THG amplitude [20,21,22,23]. The TA-THG estimates diffuse results that are wider than true edges [5].
The TA of the THG (TAHG) method was introduced by [24]. This technique is popular for detecting the horizontal boundaries of buried structures, but TAHG is not suitable for discrimination between closely spaced bodies [13,14,23], which is defined as follows:
The TAHG filter has the feature of simultaneously maintaining both smaller and larger amplitudes. The edges of buried structures are retrieved by the maximum values of the processed results via TAHG [7,10,13,14,21,22,23,24].
The improved local phase (ILF) method was introduced by [25], which is constructed by calculating different order gradients of potential field data. The ILF is given by
where and are the second-order horizontal gradients of field. The ILF maximum values correspond to the horizontal boundaries of gravity and magnetic causative sources.
Moreover, the tilt angle of the first-order vertical gradient of the total horizontal gradient defines the THVH method [26]. The THVH filter is estimated using Equation (7):
where THV is the derivative of the THG filter in the z direction [26]. The THVH maximum amplitudes indicate the edges of buried sources. The THVH is capable of extracting more information from the potential field data, especially for superimposed bodies [26].
The TA of the balanced total horizontal gradient (TBHG) filter was proposed by [27].
The TBHG filter is expressed as follows:
where
In Equation (9), and are the directional Hilbert transforms of THG, and the p value is a parameter that controls the balance effect of different amplitudes induced by different sources with different properties [27,28]. Following the suggestion of [27], p = 1 within this study. Similar to previously introduced representative edge detectors, the maximal amplitude values are located over the source edges, which can be utilized as an indicator describing the geometric distribution features of various causative sources.
The introduced TA [19], TA-THG [20], TAHG [24], ILF [25], THVH [26], and TBHG [27] filters are equalizing methods; in other words, the basic motivation for constructing these filters is to balance the amplitudes derived from shallow and deep buried structures with various characteristics. However, the adaptiveness of these filters is guaranteed by the premise that the processed potential field anomalies contain independently situated causative sources only, or they will produce false artifacts (erroneous edge information) with low resolutions when dealing with spatially superimposed and imposed sources (more common in field applications).
In order to address these issues further, ref. [18] proposed a fast sigmoid high-resolution filter (FS) and verified its effectiveness in producing clear and precise edge information related to causative sources regardless of the source spatial correlations from potential field data [18]. The FS filter is calculated using Equation (10):
The FS strategy provides maximum amplitudes over the horizontal boundaries of the causative sources. The peaks of the FS filter can be implemented to balance the horizontal boundaries of buried sources with different geometric features [18].
2. Hyperbolic Domain (Gudermannian Function) Filters
This work proposes two novel filters based on the hyperbolic domain (also termed the Gudermannian function) to extract high-resolution horizontal boundaries of different anomalous sources located at different depths. Mathematically, the Gudermannian function is an odd function [29,30,31] which obtains an almost identical shape to the arctangent function commonly used for edge enhancement of buried structures in the literature [9]. The first filter is a combination of the hyperbolic domain (Gudermannian function), the second-order derivative of the field, and the corresponding directional derivatives. The second approach is comprised of the hyperbolic domain (Gudermannian function) and the improved total horizontal derivative obtained by the directional Hilbert transforms. This hyperbolic domain edge detection () filter is given by
where
In Equation (12), and are the field horizontal gradients in the z direction.
Here, in order to improve the effectiveness of the TBHG filter in increasing the resolution of edge detection and removing spurious edges, we introduce the second filter built on the Gudermannian function. This hyperbolic domain filter () is given by
where
where are the 2-D directional Hilbert transforms [28] and .
is a positive number that should be specified by the interpreter before the implementation of and regarding the measured potential field anomalies. It is worth stating that the distinction between the two filters is essentially that the filter uses the second-order derivative of the field; however, the filter combines the directional Hilbert transforms and the second-order derivative of the field instead. The amplitude maxima of the two Gudermannian-function-based filters can be utilized to identify the edges of the buried sources.
To validate the effectiveness of balancing amplitudes from sources at different depths and mitigating superimposed or imposed source effects of the proposed new filters (), we perform the Gudermannian-function-based filters on four synthetic data sets, including two profile anomalies and two plane gravity and magnetic responses derived from extremely imposed and superimposed sources with and without noise corruption, a real-world aeromagnetic data set acquired from the Central Puget Lowland (C.P.L) of the United States, and a real-world gravity data set acquired from the Jalal Abad mine, Iran. Moreover, detailed comparative studies are presented with previously described traditional and popular edge detectors (e.g., THG, AS, TA, TA-THG, TAHG, ILF, THVH, TBHG, and FS). The obtained results verified that the proposed filters can address the aforementioned issues with the best performance in terms of producing output images with good resolution, balanced amplitudes, and avoiding drawing false edges.
3. Evaluation of Parameter
A 2-D geomagnetic fault model is considered to investigate the influence of of the newly presented and filters and its contribution to enhancing the edges and controlling the resolution. The basic characteristic parameters of the buried fault structure are the strength of the geomagnetic field (47,000 nT), the fault dip = , the strike = , the inclination = , and the susceptibility contrast = 0.02 SI. The profile anomaly has a data interval of 50 m along the x direction. The geomagnetic anomaly is shown in Figure 1a. Subsequently, the edge enhancement filters are applied to the calculated geomagnetic data with increasing values of from 0 to 9 (Figure 1b–k). The filtered results show that the maximum amplitudes of the filters in all cases are equal and perfectly match the lateral boundary of the fault plane. Furthermore, both of the novel filters produce sharp edges when the = 0.5 and maintain its sharpness until the reaches 8. The extracted edges are unreliable if is larger than 8. Therefore, the value of can be selected from 0.5 to 8 in order to maintain the efficiency of and obtain reliable edge information. The methods’ maximum amplitudes indicate the edges of buried sources in radians. The amplitude changes between −π/2 and π/2.
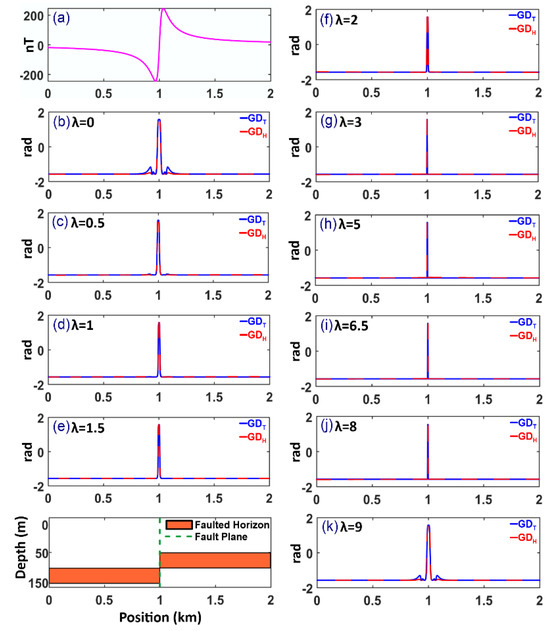
Figure 1.
Evaluating the performance of the filters with the parameter varying from 0 to 9 using a simulated geomagnetic anomaly (a) the geomagnetic response (nT) over the fault model. The processed results of the filters at (b) = 0, (c) = 0.5, (d) = 1, (e) = 1.5, (f) = 2, (g) = 3, (h) = 5, (i) = 6.5, (j) = 8, and (k) = 9. Notably, the schematic representation of the 2-D synthetic fault model is placed at the bottom left of this figure.
4. Application to Simulated Profile Data
A 2-D synthetic gravity model consisting of a vertical dyke-like model situated at a depth of 300 m with a density contrast of 1000 kg/m3 is created. The gravity anomaly generated over this two-dimensional model with a data interval of 50 m along the x direction is shown in Figure 2a. Figure 2b–l shows the application of different filters, including THG, AS, TA, TA-THG, TAHG, ILF, THVH, TBHG, FS, . The maximum values of the processed results of THG (Figure 2b) and AS (Figure 2c) indicate the edges and the center of the buried gravity model, respectively. Hence, both THG and AS can be utilized as indicators for describing the geometric features of the buried structure in terms of the boundaries and geometric center, even though the provided information suffers from low resolution. Figure 2d shows that TA is able to generate a sharp response over the geometric center of the gravity source, making TA a more useful tool than the described THG and AS methods. However, if the source shifts, the edges are visible [13]. Figure 2e–i gives the results of the TA-THG, TAHG, ILF, THVH, and TBHG filters. These techniques are generally effective in outlining the edge information of the vertical dyke-like structure, but the extracted boundaries are diffusive and lack simplicity. Comparatively, FS obtains a relative high-resolution result (Figure 2j). The processed result is sharper, which makes the subsequent interpretation process easier. Moreover, as the results presented in Figure 2k–l show, the newly proposed filters yield the merit of delineating the horizontal boundaries of the subsurface gravity anomalous body with maximal clarity without compromising the effectiveness of avoiding the generation of annoying artifacts or erroneous edges simply by finding the maximal amplitude values within the responses calculated.
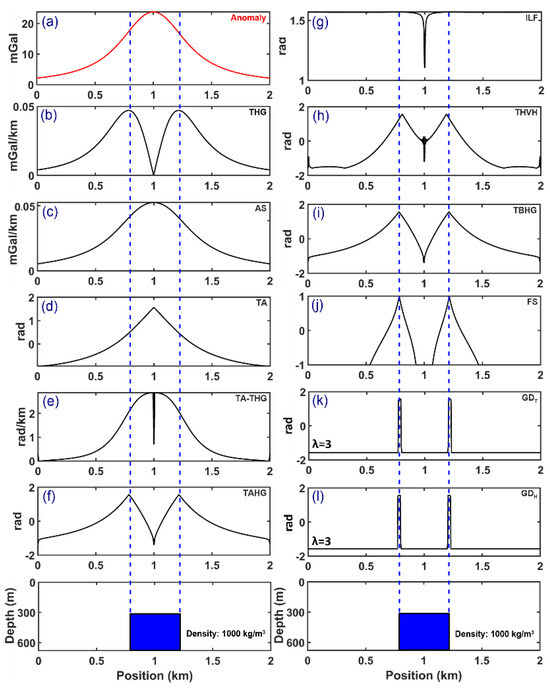
Figure 2.
Produced results of various edge detection techniques over the synthetically constructed 2-D gravity dyke model: (a) the calculated gravity anomaly response over the dyke body, (b) THG, (c) AS, (d) TA, (e) TA-THG, (f) TAHG, (g) ILF, (h) THVH, (i) TBHG, (j) FS, (k) (l) . Likewise, the cross section of the synthetic dyke-like model is illustrated at the bottom of this figure.
5. Application to Synthetic Data
This section utilizes several 3-D synthetic gravity and magnetic models with and without the consideration of noise corruption to examine the effectiveness of the edge determination filters further. It should be noted that, in this study, = 0.5 in the mathematical equations of the and filters assigned for the rest of the experiments, including processing simulated 3-D potential field anomalies and the real-world aeromagnetic and gravity data application.
5.1. The Gravity Model
Figure 3a,b shows the side and bird’s-eye views of the designed gravity model, which contains five buried dyke-like prismatic sources (G1, G2, G3, G4, and G5) with different properties, including different geometric parameters and positive and negative density contrasts. Amongst the causative sources, three prisms share the same size but different density contrasts and depths (G1, G2, and G3), and the remaining two prisms yield different sizes, depths, and density contrasts (G4 and G5). The characteristic parameters of the synthetic 3-D gravity model are given in Table 1. The 2-D gravity anomaly of the synthetic model was produced on 12 km × 12 km grid nodes with a node interval of 0.05 km along the x and y directions.
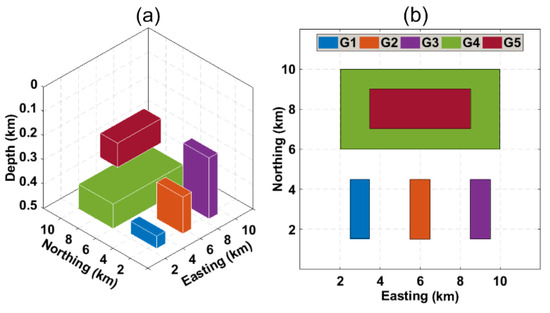
Figure 3.
(a) 3-D view of the synthetic gravity model; (b) top view of the complex 3-D model with five buried sources.

Table 1.
Density contrasts and geometric parameters of the constructed gravity model displayed in Figure 3.
Figure 4a shows the calculated gravity anomaly from the constructed 3-D model in Figure 3. As shown in Figure 4b,c, the THG and AS maps are dominated by the strong amplitudes generated by the buried shallow sources, while the signal intensities from sources at deeper positions are degraded much more intensively, so that the edge information of deeper sources simply cannot be recognized satisfactorily from the processed results of THG and AS due to the deficiency of the two filters to balance the amplitudes produced by structures at different depths. The TA extracts the edges of bodies G1, G3, and G4 successfully; however, it is less effective for the interpretation of bodies G2 and G5 (Figure 4d). Although the horizontal boundaries can be outlined by the zero contours of TA, it produces false edges between sources, obtaining positive and negative density contrasts [5]. Additionally, Figure 4e displays the result of TA-THG, indicating that TA-THG is capable of reflecting all the boundaries; however, the displayed edges are very blurry. The TAHG approach can equalize the low and high amplitudes derived from different sources simultaneously and can also avoid generating erroneous edges in the produced results. Nevertheless, the TAHG method provides the boundary information in a low-resolution manner. Figure 4g depicts the processed result of ILF with respect to the gravity anomaly in Figure 4a. It can be observed that the maximum amplitudes of ILF cannot reflect the boundaries of G1, G2, G3, and G4, and ILF also creates a false contour inside the source G5. Figure 4h–i displays the filtered results of the THVH and TBHG methods, respectively. Unlike the filters described above, THVH and TBHG are suitable for balancing the weak and strong amplitudes produced by these sources at different depths, but both of the THVH and TBHG filters produce low-resolution outputs, and further, THVH also produces unwanted artifacts. Finally, Figure 4j–l stores the results of the FS, , and strategies. The last three methods can perfectly mitigate the amplitude effect without generating annoying false edges, that is, they can enhance the boundaries of all sources with different properties and only reflect the true boundaries. Furthermore, compared with the FS filter, the recommended filters based on the Gudermannian function obtain superior resolution, namely, the produced maps containing the boundary information of the subsurface gravity structures are clearer.
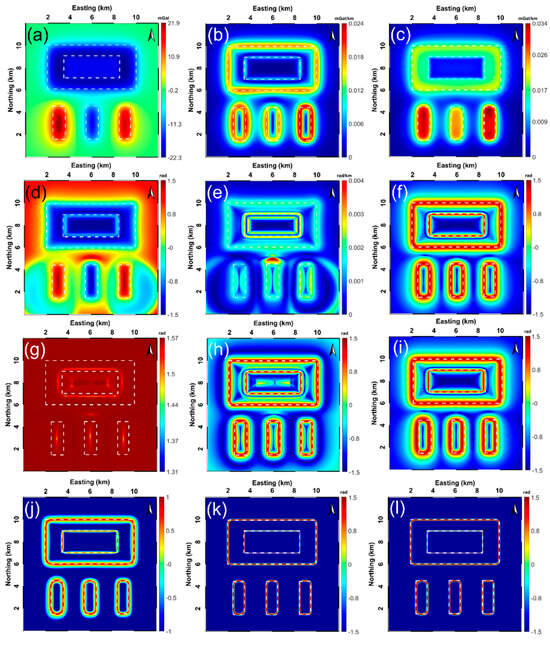
Figure 4.
Detailed comparison of the effectiveness of the aforementioned edge enhancement strategies via the synthetic complex 3-D gravity model displayed in Figure 3 (dashed white lines represent the true boundaries of the sources buried): (a) synthetically produced 2-D gravity anomaly with respect to the five-prism model with positive and negative density contrasts, correspondingly processed results of (b) THG, (c) AS, (d) TA, (e) TA-THG, (f) TAHG, (g) ILF, (h) THVH, (i) TBHG, (j) FS, (k) , and (l) .
5.2. The Gravity Model with Noise Contamination
In order to test the robustness of the involved filtering strategies for resisting noise corruption, 3% of the amplitude of the anomaly displayed in Figure 4a was considered to generate the noisy gravity anomaly (Figure 5a). Before applying the aforementioned edge enhancement filters (THG, AS, TA, TA-THG, TAHG, ILF, THVH, TBHG, FS, , and ), the constantly utilized upward continuation technique regarding the noise-contaminated gravity data was performed to relieve the noise effect (the upward continued height is 0.15 km).
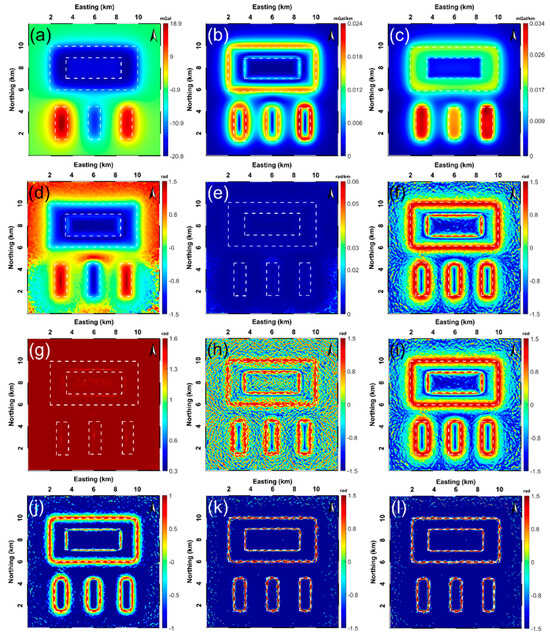
Figure 5.
Performing the filtering strategies within this study on the noise-corrupted gravity data (likewise, dashed white lines represent the true boundaries of the sources buried): (a) the generated noisy gravity anomaly (the noise degree = 3%), processed results of (b) THG, (c) AS, (d) TA, (e) TA-THG, (f) TAHG, (g) ILF, (h) THVH, (i) TBHG, (j) FS, (k) , and (l) .
Figure 5b,c displays the processed results of the THG and AS techniques under consideration of the noise effect, respectively. The outcomes are still dominated by large amplitudes due to the shallow sources situated; however, the small amplitudes controlled by deeply buried sources are also ambiguously represented. The TA method still yields the ability to balance the weak and strong signals caused by different sources, but it sacrifices resolution in terms of detecting the edges of the G1, G2, G3, and G4 sources much wider than the true ones (Figure 5d). Figure 5e illustrates the filtered result of TA-THG associated with the noisy gravity response. It can be clearly seen that, in this situation, the maximum amplitudes of TA-THG cannot coherently correlate with the lateral boundaries of the imposed gravity model. In Figure 5f, the TAHG filtering method is able to detect the edges of all the buried sources regardless of the depth at which they are located, but this edge information is diffusively exhibited and easily affected by the noise component remaining. Figure 5g displays the result of the ILF filter. The ILF produces an unsatisfactory result considering the imposed gravity structure [26]. The filtered maps of THVH and TBHG are displayed in Figure 5h–i, respectively. Both of the two methods are able to detect all the edges. Nevertheless, THVH obtains lower anti-noise ability compared with the TBHG technique, and TBHG encounters the same problem as TAHG, that is, the retrieved edge information has a low-resolution. The yielded maps at the bottom row of Figure 5 keep the filtered results of the FS, , and methods, which demonstrate that not only can the three strategies delineate the edges of all structures buried at different depths with comparatively high resolution, but their performances can be mildly eroded by the noise perturbation. Therefore, the recommended and filters share the same capability as the FS method to robustly attenuate the noise influence so that the boundaries are more visible and clearer. Hitherto, we can conclude that the proposed and methods are useful tools for producing high-resolution and balanced amplitude edge detection results.
5.3. The Geomagnetic Model
To further investigate the capability of the and filters, a superimposed synthetic geomagnetic model (the inclination and declination angles are set to and , respectively), consisting of ten dyke-like prisms named M1-M10 at different depths and extents, is simulated (Figure 6). The detailed model parameters of the established complex model are listed in Table 2. The total magnetic intensity (TMI) is estimated on a 12 km × 12 km grid with a grid spacing of 0.05 km along the x and y directions. Figure 7a shows the simulated RTP geomagnetic anomaly.
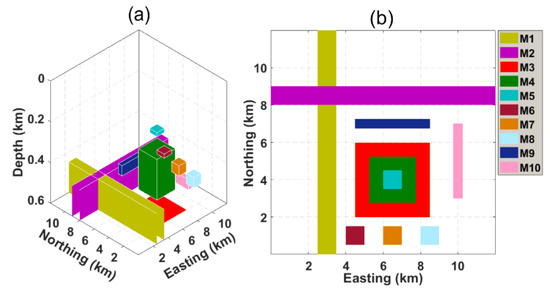
Figure 6.
(a) 3-D view of the theoretical geomagnetic model; (b) top view of the second model with ten buried dyke-like geomagnetic structures.

Table 2.
Geomagnetic susceptibilities and geometric parameters of the superimposed geomagnetic model.
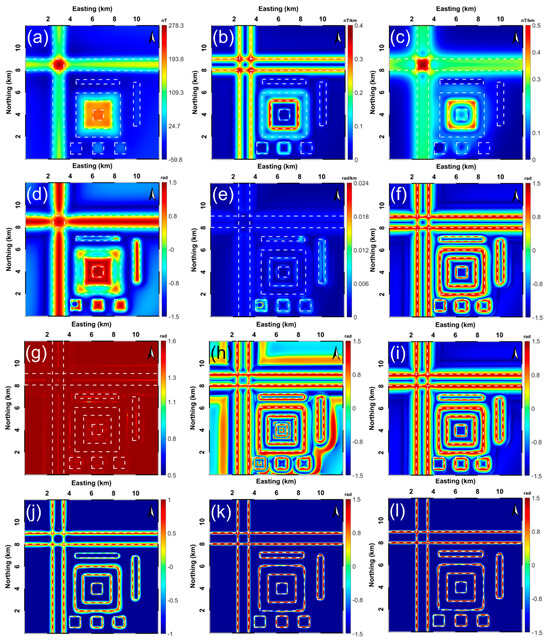
Figure 7.
Detailed comparison of the effectiveness of the aforementioned edge detectors via the synthetic complex 3-D geomagnetic model displayed in Figure 6 (dashed white lines represent the true boundaries of the sources buried): (a) synthetic RTP geomagnetic response derived from the superimposed model with positive and negative magnetic susceptibilities, performed results of (b) THG, (c) AS, (d) TA, (e) TA-THG, (f) TAHG, (g) ILF, (h) THVH, (i) TBHG, (j) FS, (k) , and (l) .
Following the same processing procedure, we performed the 11 edge detectors on the RTP geomagnetic anomaly generated. Correspondingly filtered results are presented in Figure 7b–l, with the white dashed lines representing the true boundaries of all the causative bodies buried. Figure 7b–c displays the results of the THG and AS filters, showing coherent conclusions generated in the 3-D gravity data experiment containing an imposed effect. The THG and AS filters cannot balance the amplitudes caused by sources buried at different depths; this feature makes them inapplicable for dealing with superimposed structures. Figure 7d shows the extracted edges using the TA method. Although the edges of some sources can be distinguished successfully by reading the zero contours from the processed map of TA, there are chances to generate false contours between buried sources, which make the subsequent interpretation process inconvenient to continue. Also, the edges of M5 and M9 are faintly detected. Figure 7e shows the result created by applying the TA-THG method. It can be seen that, in this case, the maximum amplitudes of TA-THG cannot delineate the horizontal boundaries of M1-M10. Figure 7f presents the result of the TAHG method. Obviously, TAHG detects all the edge information via the maximal amplitudes in the filtered map in a more effective way without causing false edges than the TA method. The only problem with TAHG is that the coherent edges obtain low resolutions. Figure 7g shows the recuperated edges of the synthetic 3-D complex geomagnetic model in Figure 6 using the ILF method. The edges are faint and drawn very diffusely, making this filter not suitable for outlining the edges of the imposed and superimposed structures. Figure 7h–i displays the edges detected from the THVH and TBHG methods, respectively. As depicted in the two maps, the THVH and TBHG methods provide low-resolution edge information related to the causative sources. Although the THVH method can locate all the true boundaries, it inevitably produces fake positive contours around the sources M6, M7, M8, and M10. The amplitude result of the FS filter is shown in Figure 7j. Compared to the results mentioned above, the FS clearly outlines the horizontal boundaries of the ten superimposed sources and simultaneously enhances the visibility and sharpness of the buried structures. The final edge detection results of the and filters are displayed in Figure 7k–l, validating that the newly designed and methods are distinguished in producing balanced and coherent horizontal boundaries of the superimposed geomagnetic sources without generating disturbing artifacts compared with the other methods discussed. The FS, , and filters’ maximum values lie directly over the source edge and enhance the horizontal boundaries to be more visible and sharper, compared to the THG, AS, TA, TA-THG, TAHG, ILF, THVH, and TBHG methods.
5.4. The Geomagnetic Anomaly with Noise Corruption
This section discusses the performance of the involved filters in dealing with the noise-corrupted RTP geomagnetic anomaly presented in Figure 8a. The random noise component has an amplitude of 3% of the noise-free data. For the purpose of maintaining the coherence of testing, the and filters are implemented on the noisy geomagnetic data with the comparison of the selected nine filters (THG, AS, TA, TA-THG, TAHG, ILF, THVH, TBHG, and FS).
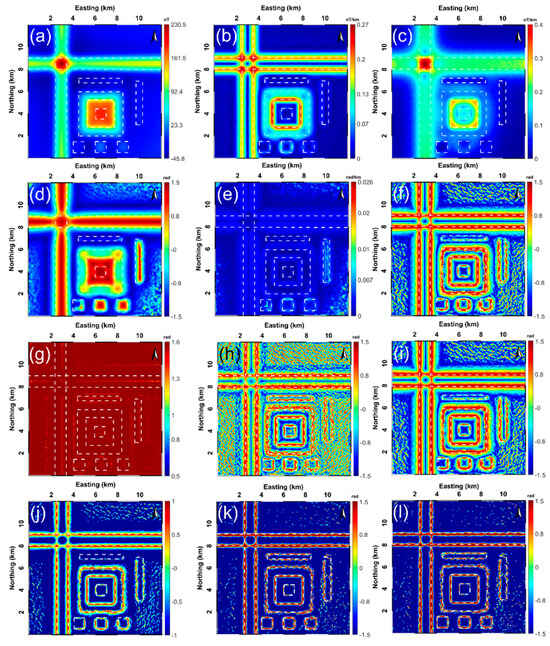
Figure 8.
Performing the filtering strategies within this study on the noise-corrupted geomagnetic data (dashed white lines display the true edges of the buried sources): (a) the geomagnetic data of the synthetic model with random noise with an amplitude of 3% of the anomaly amplitude, produced results using (b) THG, (c) AS, (d) TA, (e) TA-THG, (f) TAHG, (g) ILF, (h) THVH, (i) TBHG, (j) FS, (k) , and (l) .
Notably, the upward continuation method is utilized again regarding the noisy 2-D geomagnetic anomaly at a height of 0.15 km prior to the filtering process of the involved edge detectors in order to better simulate real applications.
Retrieved edge information with the noise effect using the THG and AS methods is displayed in Figure 8b,c, which are still incapable of balancing the amplitudes induced by sources situated at different depths. Instead, both of the filters are robust enough to resist noise contamination. Figure 8d depicts the result of the TA technique, creating many spurious edges that cannot reflect the true ones and showing less robustness in suppressing the noise effect. Moreover, the TA-THG method is still unable to draw horizontal borders via the maximum amplitudes in the noisy case. Relatively, Figure 8f depicts the edges (maximal amplitudes) that can be extracted coherently but are partially affected by the noise effect and low resolution by applying the TAHG filter. Especially, the geomagnetic body M9 failed to be recovered. According to the filtered output shown in Figure 8g, as expected, the ILF filter fails to delineate all the edges regardless of the thin, deep, and shallow structures. Figure 8h–j shows the final results of implementing the THVH, TBHG, and FS filters. All three filters yield corresponding results describing the true edges in Figure 6. However, FS yields the most clear and compact signals, namely, FS generates the highest resolution result with the most effective anti-noise ability amongst the three filters, due to its unique mathematical structure. Finally, results from the implementation of the and filters are displayed in Figure 8k,l, respectively, showing that the and filters provide successful estimations of all the boundaries of the buried sources with different characteristics, even with the involvement of 3% degrees of noise content. In other words, the and approaches are very useful for generating high-resolution, balanced amplitude results and are less sensitive to noise edge detection results.
6. Application to Field Aeromagnetic Data
This section emphasizes the test of the practicability of the aforementioned traditional nine filters (THG, AS, TA, TA-THG, TAHG, ILF, THVH, TBHG, and FS) and the proposed and filters via a high-resolution field geomagnetic response belonging to the Central Puget Lowland (C.P.L), in the northwestern United States, published in 1997 by the U.S. Geological Survey (USGS). Figure 9 displays the geological map of the C.P.L study area and the adjacent area at a scale of (adapted from [32]). The study area is located within the geological complex above the Juan de Fuca plate that is actively subducting beneath the western margin of North America [5,33,34]. The high-resolution aeromagnetic data of the study area are displayed in Figure 10a. The flight height was 300 m, and the flight lines were in the E–W direction with a grid interval of 400 m [35,36]. The acquired aeromagnetic data were reduced to the pole (RTP) using an inclination angle of and a declination angle of , to reposition the anomalies from their casual sources, as depicted in Figure 10b [5]. To attenuate the short-wavelength noise effects, the filter using a 0.3 km upward continuation distance of the RTP aeromagnetic data was implemented to stabilize the latter filtering process (Figure 11a). Figure 11b–l displays the results of the THG, AS, TA, TA-THG, TAHG, ILF, THVH, TBHG, FS, , and edge determination filters, respectively.
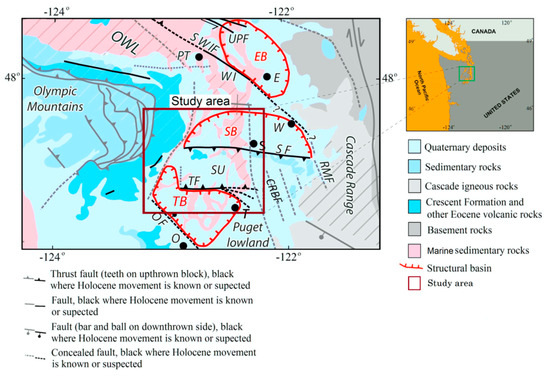
Figure 9.
The location and the simplified geologic map of the Central Puget Lowland area (adjacent regions are shown; adapted from [5,32]). EB Everett basin, SB Seattle basin, TB Tacoma basin, SU Seattle uplift, PT Port Townsend, S Seattle, T Tacoma, WI Whidbey Island, CRBF Coast Range boundary fault, OF Olympia fault, RMF Rattlesnake Mountain fault, SWIF Southern Whidbey Island fault, SF Seattle fault, TF Tacoma fault, UPF Utsalady Point fault.
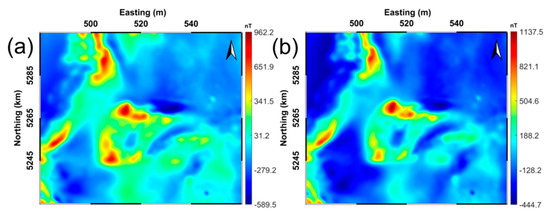
Figure 10.
(a) The acquired field aeromagnetic anomaly (nT); (b) the corresponding RTP result.
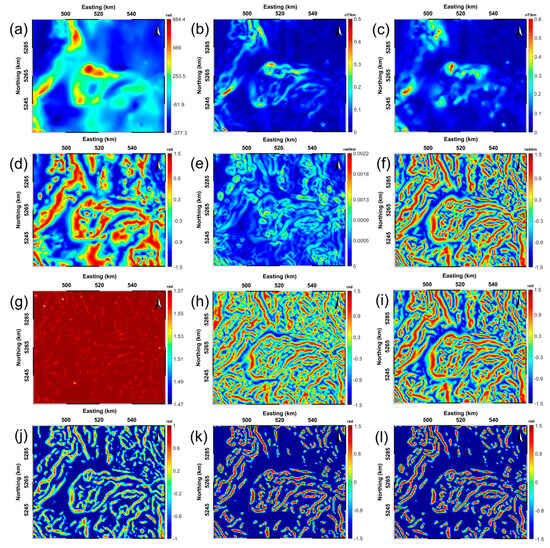
Figure 11.
Processed results of the RTP aeromagnetic data using the aforementioned 11 edge detectors: (a) reduction-to-the-pole magnetic anomaly (the upward continuation height = 0.3 km), retrieved results of (b) THG, (c) AS, (d) TA, (e) TA-THG, (f) TAHG, (g) ILF, (h) THVH, (i) TBHG, (j) FS, (k) , and (l) .
Figure 11b,c exhibits the edge information delineated by performing the THG and AS filters on the upward continued RTP aeromagnetic data, respectively. As can be observed, the THG and AS methods are dominated by the large amplitudes produced by shallow structures buried, so the generated signals are not balanced effectively [5]. Figure 11d illustrates the map obtained by the TA method. Although this technique can balance the shallow and deep anomalies simultaneously, it cannot clearly determine the geological edges within the study area. Figure 11e shows the filtered result of the TA-THG filter. TA-THG fails to effectively delineate the horizontal boundaries via the maximum amplitudes; this phenomenon shows high consistency with the synthetic tests. The filtered signals using the TAHG filter are presented in Figure 11f, confirming that TAHG is an effective method for highlighting the geometric distribution of the buried geological structures within the study area. Figure 11g displays the output of the ILF filter. Considering the test results generated synthetically and practically, ILF is not suitable for edge determination and should not be considered as an edge detection tool in this study. Figure 11h–i keeps the lateral boundaries estimated by the THVH and TBHG methods. Although the lateral boundaries can be recognized clearly by the maximum contours of THVH and TBHG, the THVH filter produces additional spurious contours, degrading the efficiency of subsequent interpretations. Finally, Figure 11j–l shows the edges delineated by the FS, , and edge determination filters. The FS filter is validated again to be a prominent filter that is capable of equalizing the amplitudes caused by geological structures with different properties. Comparatively, the recommended Gudermannian-based , , and FS approaches provide even better results than the other filters and display more details than the filters of THG, AS, TA, TA-THG, TAHG, ILF, THVH, and TBHG in terms of balanced amplitude results and high-resolution edges without suspicious artifacts. These features make the , , and FS methods valuable tools for quantitatively extracting edge information from potential field data.
In addition to the detection of horizontal boundaries, the depth estimation of causative bodies is also important for the interpretation of magnetic data [37]. In this work, to estimate the top depth of the structures retrieved, we used the popular tilt-depth (TD) technique [38]. The significant advantages of the tilt-depth method are that it does not depend on the structural index (SI) or the window size (WS) and can automatically yield depth information. Figure 12 shows the result of applying the tilt-depth method to the study area. The histogram of the estimated depths is shown in Figure 12c, which describes that 50% of these structures obtained exist at 0.3–1.5 km depth. The depth of the majority of the lateral boundaries varies between 0.2–5 km, being disturbed randomly all over the Central Puget Lowland area. For detailed comparisons, the lateral boundaries in Figure 11k,l are superimposed on the tilt-depth map. Clearly, the positions of the buried source points are mostly correlated with the lateral boundaries determined by the and filters. Also, we can see that many edges match the geological features. The determined boundaries illustrate a good correlation with the trending faults and other anomalies in the western and southeastern parts of the area. Therefore, with the help of the superimposed map from the processed results of the Gudermannian function filters and the tilt-depth method, it is possible to make reliable interpretations of the study area qualitatively and quantitatively.
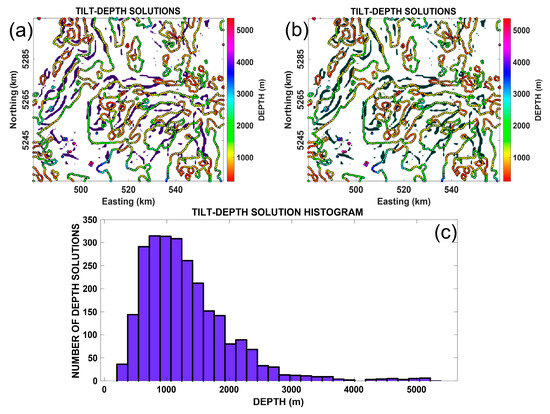
Figure 12.
(a) The top depths derived from the tilt-depth technique (retrieved geological edges from Figure 11k are superimposed on the tilt-depth map); (b) the top depths derived from the TD technique (retrieved geological edges from Figure 11l are superimposed on the TD map); (c) histogram of the top depth estimated from the TD method regarding the first field application.
7. Application to Field Gravity Data
This section emphasizes the test of the practicability of the aforementioned traditional nine filters (THG, AS, TA, TA-THG, TAHG, ILF, THVH, TBHG, and FS) and the proposed and filters via a real gravity anomaly belonging to the hematite ore body in the Jalal Abad area, Iran. The study area is located in the southeast of Iran, Zarand city, Kerman province, to the north of the Jalal Abad iron mine. Figure 13 shows the geological map of the study area [39]. The host rock of this area is the Rizzo series of alluvial and volcanic rocks [39]. Small masses of igneous rocks such as microgabbro and some dikes and sills, together with diorite and diabase outcrops, can be seen in the area. The younger dikes and sills intruded into alluvial and volcanoclastic rocks. It was found that dikes and sills are older or occur simultaneously with iron mineralization in the area [40]. Iron mineralization is deep in the Jalal Abad ore deposit, and very few outcrops of iron can be seen in the entire area of the site. The general form of deposits around the mine site is similar to the stretched lens along the northwest–southeast, which is located in a folded structure. Hematite has been created mainly from magnetite through the secondary oxidation process and is obvious in areas where abundant fractures are present. Pyrite and chalcopyrite are sulfide minerals found in the Jalal Abad deposit [39]. Figure 14a shows the gravity anomaly map of the area after the corrections and the required pre-processing tasks. The gravity survey was conducted at a spacing of 20 × 40 m. In this map, a low-intensity gravity anomaly can be seen, but due to the presence of iron outcrops, it is more likely to be attributed to iron anomalies. This area was selected to show the efficiency of the proposed methods for the edge detection of iron and hematite deposits. To attenuate the short-wavelength noise effects, the filter using a 50 m upward continuation distance of the gravity data was implemented to stabilize the latter filtering process (Figure 14b).
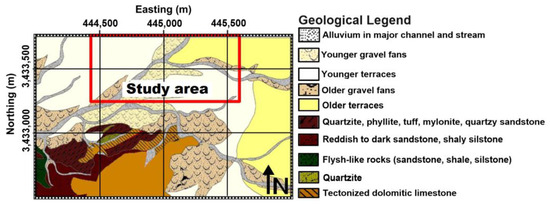
Figure 13.
The simplified geologic map of the Jalal Abad mine area [39,40].

Figure 14.
(a) The acquired field gravity anomaly (mGal); (b) the upward continued result at 50 m.
Figure 15a–k displays the results of the THG, AS, TA, TA-THG, TAHG, ILF, THVH, TBHG, FS, , and edge determination filters, respectively.
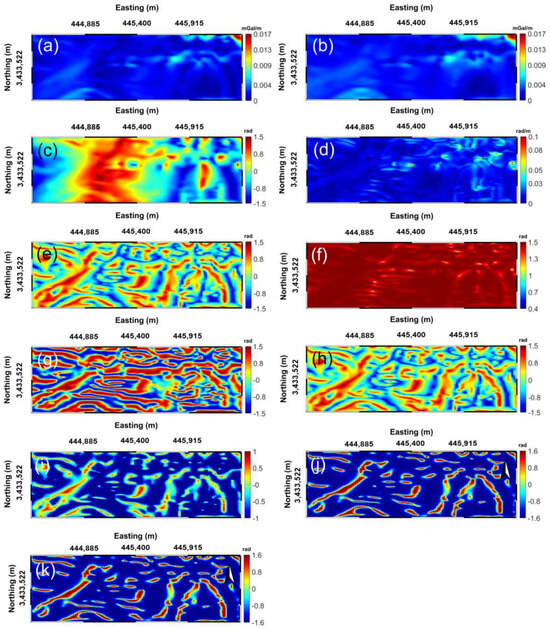
Figure 15.
Results of edge detection in the Jalal Abad mine: (a) THG, (b) AS, (c) TA, (d) TA-THG, (e) TAHG, (f) ILF, (g) THVH, (h) TBHG, (i) FS, (j) , and (k) .
As can be seen, THG and AS are dominated by anomalies in the Jalal Abad area, possibly caused by the shallow structures. The maps of AS and THG are blurred and unreliable for finding clear boundaries for subsurface sources. Figure 15c shows the images produced with the TA method. The TA is relatively insensitive to the depth of a buried source and resolves shallow and deep source anomalies equally well, allowing the anomalies to be identified in the study area. The TA method was used to determine the horizontal location of shallow and deep sources in the Jalal Abad mine. Again, TA-THG cannot delineate the boundaries of the buried sources (Figure 15d). In Figure 15e, the maximum amplitude of the TAHG filter works well for shallow and deep sources. TAHG can define the horizontal boundaries of the buried sources. However, one of the disadvantages of this method is the generation of low-resolution boundaries. Again, ILF cannot delineate the boundaries of the buried sources (Figure 15f). Figure 15g shows the results of applying the THVH filter. This filter produces some false boundaries that are inconsistent with the lateral boundaries. Figure 15h,i shows the results created with the TBHG and FS techniques, respectively. The results obtained with these two filters are of low resolution. Figure 15j,k shows the results obtained with the and edge determination filters. It is clear that the proposed filters were much more successful than the others in improving the source boundaries.
In addition to the detection of horizontal boundaries, the depth estimation of causative bodies is also important for the interpretation of gravity data [37]. In this paper, to estimate the top depth of the structures retrieved, we applied the popular tilt-depth (TD) technique [21,41]. Figure 16 shows the result of applying the tilt-depth method to the study area. The histogram of the estimated depths is shown in Figure 16c, which shows that 50% of these structures obtained exist at 10–40 m depth. The top depth of the majority of the lateral boundaries varies between 5 and 120 m, being disturbed randomly all over the Jalal Abad area. For detailed comparisons, the lateral boundaries in Figure 15i,k are superimposed on the tilt-depth map. Clearly, the positions of the buried source points are mostly correlated with the lateral boundaries determined by the and filters. Also, we can see that many edges match the geological features. The determined boundaries illustrate a good correlation with the trending structures and other anomalies within the study area. Therefore, with the help of the superimposed map from the processed results of the Gudermannian function filters and the tilt-depth method, it is possible to make reliable interpretations of the study area both qualitatively and quantitatively. TD results are in good agreement with the available drilling data and other works [39].
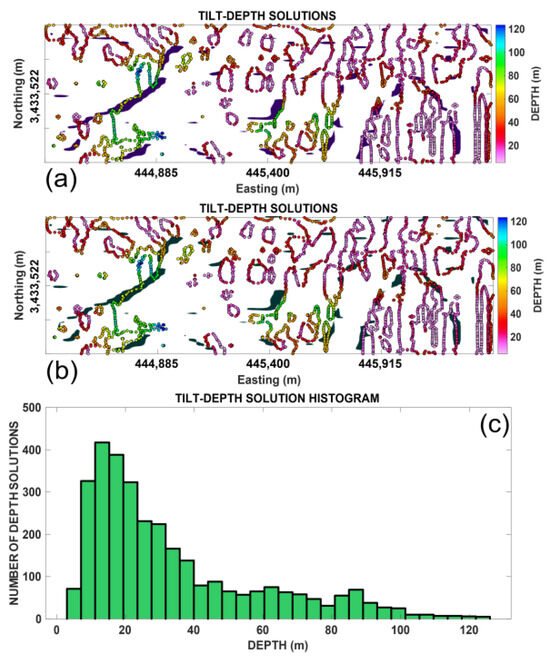
Figure 16.
(a) The top depths derived from the TD technique (retrieved geological edges from Figure 15j are superimposed on the tilt-depth map); (b) the top depths derived from the TD technique (retrieved geological edges from Figure 15k are superimposed on the TD map); (c) histogram of the top depth estimated from the TD depth estimation method regarding the second field application.
8. Conclusions
We presented two effective edge enhancement methods, termed and , based on the Gudermannian function and the second-order derivative of the field. The efficiency of the two newly presented methods was testified using both synthetic potential data sets with various assumptions and two field anomalies including a real aeromagnetic response from the United States and ground-based gravity data from Iran. The processed results from the application of the two filters were compared further with those of other existing representative strategies. Synthetic experiments designed for different scenarios (2-D and 3-D; imposed and superimposed; noise-free and noise-contaminated) have verified that the proposed filters can effectively balance the large and small amplitudes due to causative sources situated at different depths, without compromising the resolution and accuracy of subtle details. Furthermore, both and yield the merit of avoiding erroneous artifacts when the anomalous bodies were assigned opposite-sign geophysical properties. The retrieved results from the application of the two filters to the acquired aeromagnetic and gravity data are in good agreement with the main geological structures within the study areas and the determined lateral information via the popular tilt-depth method. Hitherto, combining the conclusions generated from the theoretical experiments and field applications, the and filters are valuable tools for producing reliable, accurate, and robust edge detection results from processing potential field data sets. Both filters are recommended for locating potential ore and mineral deposits.
Author Contributions
Conceptualization, A.A. and H.A.; methodology, A.A., K.S. and H.A.; software, A.A. and H.A.; validation, A.A., K.S. and H.A.; formal analysis, K.S.; investigation, A.A., K.S., H.A. and V.E.A.; data curation, A.A., K.S. and H.A.; writing—original draft preparation, A.A., K.S., H.A. and V.E.A.; writing—review and editing, A.A., K.S., H.A., V.E.A. and C.L.; visualization, A.A., K.S., H.A., V.E.A. and C.L.; supervision, A.A., K.S. and H.A.; project administration: A.A., K.S., H.A., V.E.A. and C.L. All authors have read and agreed to the published version of the manuscript.
Funding
This research did not receive any specific grant from funding agencies in the public, commercial, or not-for-profit sectors.
Data Availability Statement
Data may be available from the corresponding authors upon reasonable request.
Acknowledgments
We thank the anonymous reviewers for their guidance and constructive comments which have greatly improved the quality of the paper. We also thank the United States Geological Survey (accessible at https://earthexplorer.usgs.gov (accessed on 18 August 2023)) for permission to use the geologic map and aeromagnetic data in Figure 9 and Figure 10a. We are grateful for the help of Luan Thanh Pham (Vietnam National University, Vietnam) for preparing Figure 9 and Figure 10a and Madankav Engineering Co., Ltd., for preparing Figure 13 and Figure 14a.
Conflicts of Interest
The authors declare no conflict of interest.
References
- Cooper, G.R.J.; Cowan, D.R. Enhancing potential field data using filters based on the local phase. Comput. Geosci. 2006, 32, 1585–1591. [Google Scholar] [CrossRef]
- Sun, Y.; Yang, W.; Zeng, X.; Zhang, Z. Edge enhancement of potential field data using spectral moments. Geophysics 2016, 81, G1–G11. [Google Scholar] [CrossRef]
- Dwivedi, D.; Chamoli, A. Source edge detection of potential field data using wavelet decomposition. Pure Appl. Geophys. 2021, 178, 919–938. [Google Scholar] [CrossRef]
- Pham, L.T.; Oksum, E.; Do, T.D. Edge enhancement of potential field data using the logistic function and the total horizontal gradient. Acta Geod. Geophys. 2019, 54, 143–155. [Google Scholar] [CrossRef]
- Pham, L.T.; Van Vu, T.; Le Thi, S.; Thi Trinh, P. Enhancement of Potential Field Source Boundaries Using an Improved Logistic Filter. Pure Appl. Geophys. 2020, 177, 5237–5249. [Google Scholar] [CrossRef]
- Pham, L.T.; Oksum, E.; Le, D.V.; Ferreira, F.J.F.; Le, S.T. Edge detection of potential field sources using the soft sign function. Geocarto Int. 2021, 37, 4255–4268. [Google Scholar] [CrossRef]
- Prasad, K.N.D.; Pham, L.T.; Singh, A.P. Structural mapping of potential field sources using BHG filter. Geocarto Int. 2022, 37, 11253–11280. [Google Scholar] [CrossRef]
- Alvandi, A.; Toktay, H.D.; Pham, L.T. Capability of improved Logistics filter in determining lateral boundaries and edges of gravity and magnetic anomalies Tuzgolu, Area Turkey. Iran. J. Min. Eng. 2022, 17, 57–72. (In Persian) [Google Scholar] [CrossRef]
- Ibraheem, I.M.; Tezkan, B.; Ghazala, H.; Othman, A.A. A New Edge Enhancement Filter for the Interpretation of Magnetic Field Data. Pure Appl. Geophys. 2023, 180, 2223–2240. [Google Scholar] [CrossRef]
- Alvandi, A.; Ardestani, V.E. Edge detection of potential field anomalies using the Gompertz function as a high-resolution edge enhancement filter. Bull. Geophys. Oceanogr. 2023, 64, 279–300. [Google Scholar] [CrossRef]
- Chen, A.G.; Zhou, T.F.; Liu, D.J.; Zhang, S. Application of an enhanced theta-based filter for potential field edge detection: A case study of the luzong ore district. Chin. J. Geophys. 2017, 60, 203–218. [Google Scholar]
- Weihermann, J.D.; Ferreira, F.J.F.; Oliveira, S.P.; Cury, L.F.; de Souza, J. Magnetic interpretation of the Paranaguá Terrane, southern Brazil by signum transform. J. Appl. Geophys. 2018, 154, 116–127. [Google Scholar] [CrossRef]
- Nasuti, Y.; Nasuti, A. NTilt as an improved enhanced tilt derivative filter for edge detection of potential field anomalies. Geophys. J. Int. 2018, 214, 36–45. [Google Scholar] [CrossRef]
- Nasuti, Y.; Nasuti, A.; Moghadas, D. STA: A novel approach for enhancing and edge detection of potential field data. Pure Appl. Geophys. 2019, 176, 827–841. [Google Scholar] [CrossRef]
- Eldosouky, A.M. Aeromagnetic data for mapping geologic contacts at Samr El-Qaa area, North Eastern Desert. Egypt. Arab J. Geosci. 2019, 12, 2. [Google Scholar] [CrossRef]
- Cordell, L.; Grauch, V.J.S. Mapping Basement Magnetization Zones from Aeromagnetic Data in the San Juan Basin. In The Utility of Regional Gravity and Magnetic Anomaly Maps; SEG Publication: Houston, TX, USA, 1985; pp. 181–197. [Google Scholar] [CrossRef]
- Roest, W.R.J.; Verhoef, J.; Pilkington, M. Magnetic interpretation using the 3-D analytic signal. Geophysics 1992, 57, 116–125. [Google Scholar] [CrossRef]
- Oksum, E.; Le, D.V.; Vu, M.D.; Nguyen, T.H.T.; Pham, L.T. A novel approach based on the fast-sigmoid function for interpretation of potential field data. Bull. Geophys. Oceanogr. 2021, 62, 543–556. [Google Scholar]
- Miller, H.G.; Singh, V. Potential field tilt—A new concept for location of potential field sources. J. Appl. Geophys. 1994, 32, 213–217. [Google Scholar] [CrossRef]
- Verduzco, B.; Fairhead, J.D.; Green, C.M.; MacKenzie, C. New insights into magnetic derivatives for structural mapping. Lead. Edge 2004, 23, 116–119. [Google Scholar] [CrossRef]
- Alvandi, A.; Ghanati, R. Using magnetic data for estimating the location of lateral boundaries and the depth of the shallow salt dome of Aji-Chai, East Azerbaijan Province, Iran. Int. J. Min. Geo-Eng. 2023, 57, 251–258. [Google Scholar] [CrossRef]
- Alvandi, A.; Toktay, H.D.; Ardestani, V.E. Edge detection of geological structures based on a logistic function: A case study for gravity data of the Western Carpathians. Int. J. Min. Geo-Eng. 2023, 57, 267–274. [Google Scholar] [CrossRef]
- Othman, A.A.; Ibraheem, I.M. Origin of El-Maghara Anticlines, North Sinai Peninsula, Egypt: Insights from Gravity Data Interpretation Using Edge Detection Filters. Arab. J. Sci. Eng. 2023. [Google Scholar] [CrossRef]
- Ferreira, F.J.F.; de Souza, J.; Bongiolo, A.B.S.; de Castro, L.G. Enhancement of the total horizontal gradient of magnetic anomalies using the tilt angle. Geophysics 2013, 78, J33–J41. [Google Scholar] [CrossRef]
- Ma, G. Edge detection of potential field data using improved local phase filter. Explor. Geophys. 2013, 44, 36–41. [Google Scholar] [CrossRef]
- Zhang, X.; Yu, P.; Tang, R.; Xiang, Y.; Zhao, C.J. Edge enhancement of potential field data using an enhanced tilt angle. Explor. Geophys. 2014, 46, 276–283. [Google Scholar] [CrossRef]
- Eshaghzadeh, A.; Dehghanpour, A.; Kalantari, R.A. Application of the tilt angle of the balanced total horizontal derivative filter for the interpretation of potential field data. Boll. Geofis. Teor. Appl. 2018, 59, 161–178. [Google Scholar]
- Cooper, G.R.J. Balancing images of potential field data. Geophysics 2009, 74, L17–L20. [Google Scholar] [CrossRef]
- Gudermann, C. Grundriss der Analytischen Sphärik; DuMont-Schauberg: Köln, Germany, 1830. (In German) [Google Scholar]
- Zwillinger, D. CRC Standard Mathematical Tables and Formulae; Chapman and Hall/CRC: Boca Raton, FL, USA, 2002. [Google Scholar] [CrossRef]
- Romakina, L.N. The inverse Gudermannian in the hyperbolic geometry. Integral Transform. Spec. Funct. 2018, 29, 384–401. [Google Scholar] [CrossRef]
- Sherrod, B.L.; Blakely, R.J.; Weaver, C.S.; Kelsey, H.M.; Barnett, E.; Liberty, L.; Meagher, K.L.; Pape, K. Finding concealed active faults: Extending the southern Whidbey Island fault across the Puget Lowland, Washington. J. Geophys. Res. 2008, 113, B05313. [Google Scholar] [CrossRef]
- Johnson, S.Y.; Potter, C.J.; Miller, J.J.; Armentrout, J.M.; Finn, C.; Weaver, C.S. The southern Whidbey Island fault: An active structure in the Puget Lowland, Washington. Geol. Soc. Am. Bull. 1996, 108, 334–354. [Google Scholar] [CrossRef]
- Saltus, R.W.; Blakely, R.J.; Haeussler, P.J.; Wells, R.E. Utility of aeromagnetic studies for mapping of potentially active faults in two forearc basins: Puget Sound, Washington, and Cook Inlet, Alaska. Earth Planets Space 2005, 57, 781–793. [Google Scholar] [CrossRef]
- Blakely, R.J.; Wells, R.E.; Weaver, C.S. Puget Sound Aeromagnetic Maps and Data. U.S. Geological Survey Open-File Report. 1999; pp. 99–514. Available online: https://pubs.usgs.gov/of/1999/of99-514, (accessed on 15 March 2020).
- Blakely, R.J.; Sherrod, B.L.; Hughes, J.F.; Anderson, M.L.; Wells, R.E.; Weaver, C.S. Saddle Mountain fault deformation zone, Olympic Peninsula, Washington: Western boundary of the Seattle uplift. Geosphere 2009, 5, 105–125. [Google Scholar] [CrossRef]
- Alvandi, A.; Toktay, H.D.; Nasri, S. Application of direct source parameter imaging (direct local wave number) technique to the 2-D gravity anomalies for depth determination of some geological structures, for depth determination of some geological structures. Acta Geophys. 2022, 70, 659–667. [Google Scholar] [CrossRef]
- Salem, A.; Williams, S.; Fairhead, J.D.; Ravat, D.J.; Smith, R. Tilt-depth method: A simple depth estimation method using first-order magnetic derivatives. Lead. Edge 2007, 26, 1502–1505. [Google Scholar] [CrossRef]
- Joulidehsar, F.; Moradzadeh, A.; Doulati Ardejani, F. An Improved 3D Joint Inversion Method of Potential Field Data Using Cross-Gradient Constraint and LSQR Method. Pure Appl. Geophys. 2018, 175, 4389–4409. [Google Scholar] [CrossRef]
- Madankav. Report of Geophysical Investigation of Jalal Abad Iron Mine. Madankav Company: Tehran, Iran, 2013. (In Persian) [Google Scholar]
- Oruç, B. Edge detection and depth estimation using a tilt angle map from gravity gradient data of the Kozaklı-Central Anatolia Region, Turkey. Pure Appl. Geophys. 2010, 168, 1769–1780. [Google Scholar] [CrossRef]
Disclaimer/Publisher’s Note: The statements, opinions and data contained in all publications are solely those of the individual author(s) and contributor(s) and not of MDPI and/or the editor(s). MDPI and/or the editor(s) disclaim responsibility for any injury to people or property resulting from any ideas, methods, instructions or products referred to in the content. |
© 2023 by the authors. Licensee MDPI, Basel, Switzerland. This article is an open access article distributed under the terms and conditions of the Creative Commons Attribution (CC BY) license (https://creativecommons.org/licenses/by/4.0/).