Abstract
The study of jarosite produced under diverse conditions is essential to gain insight into its diverse formation mechanisms on earth. Such investigations can even pave ways to better understanding of the genesis of jarosite discovered in extra-terrestrial bodies such as Mars. Jarosite samples from two costal locations in central Norway are investigated through the application of multiple analytical techniques. The jarosite-rich encrustations on seaward cliff walls were studied with a focus on the characterization of their micromorphology and geochemistry. Light and electron microscopic analyses revealed distinct laminations and microlaminations in the samples. These layered laminations likely imply the existence of favorable periods in a cyclic manner for mineralization/biomineralization of jarosite in tandem with gypsum formation and dissolution. The pH level measured is not low similar to that usually described as conducive for jarosite formations. Different viable jarosite formation mechanisms are explored. Though some indicators are implied from microstructural and compositional analyses, further investigations are required for establishing the biogenic nature of the mechanism involved. Signs of the possible formation of jarosite in the Mid-Pleistocene Transition, 1.1–1.3 million years B.P., are acquired from Ar39/Ar40 geochronological determinations. Useful paleoenvironmental and paleobiological information could be found preserved in the microstructures of such jarosite formations.
1. Introduction
Jarosite was first described in the mid-19th century by the mineralogist August Breithaupt in the Barranco del Jaroso (Jaroso Ravine) of Sierra Almagrera, southeastern Spain [1]. The name jarosite, given to the mineral potassium iron sulfate hydroxide [2], is also directly derived from Jara, the Spanish name for a yellow flower from Sierra Almagrera, because of their similarities in color. Jarosites are complex iron sulfates denoted by the general formula AFe3(SO4)2(OH)6. Various jarosite minerals can be formed depending on the substitution of A with monovalent (K+, Na+, H3O+, NH4+, Ag+) and divalent (Ca2+, Sr2+, Ba2+, Pb2+) cations. Jarosites with trivalent and quadrivalent A substitutions also exist. However, jarosite commonly refers to the potassium form of the compound KFe3(SO4)2(OH)6. With sodium substitution in the place of A, natrojarosite NaFe3(SO4)2(OH)6 results. Jarosites can be formed through two general routes: biologically and chemically. Jarosite is found to be precipitated from highly acidic (pH < 3) media, in oxidizing aqueous solutions where sulfur-containing compounds are present. Moreover, laboratory experiments demonstrated that minerals from the alunite group (such as jarosite and alunite) remain stable only in acidic media (pH < 5) but tend to dissociate in circumneutral media (pH 6.5–7.5) [3,4].
Minerals of jarosite are quite common and can be formed in different environments [5]. Mine and acid-rock drainages, mine tailings of sulfide ores as well as refining and hydrometallurgical processes can result in such highly acidic and sulfate-rich environments [6,7,8,9,10,11,12]. Sulfide oxidation and acidic conditions, leading to jarosite formation, can also occur in volcanic craters and hot geothermal springs [5,13,14].
Yellow-colored mineral crust known as “sulfate blooms” is usually connected to sulfide-rich bedrocks and often identified as jarosite encrustations. Acid mine drainage is known to be a result of the exposure of minerals such as pyrite, chalcopyrite and pyrrhotitic minerals to atmospheric oxygen and water [5,8,15,16,17,18,19]. Jarosite-group minerals are known to be part of secondary phases associated with weathered sections of sulfide-containing mineral deposits and sulfide-bearing sediments [20]. Jarosite has attracted attention and been well studied because of its significance as a constituent of acid-mine waste and by-product of the metal-processing industry [21]. In addition to abiotic oxidation of sulfide minerals, jarosite can also be produced via biotic oxidation. Biological activities are known to speed up the oxidation of ferrous ion into ferric ion at low pH and thereby facilitate the formation of jarosite among other iron hydroxy sulfates. Acidithiobacillus ferrooxidans, an aerobic bacterium, is a case in point taking part in such biomineralization activities [18,22,23,24,25,26,27]. As an iron and sulfur oxidizer, this chemolithotrophic autotroph is capable of utilizing the energy acquired from the oxidations of iron and sulfur. In addition to the microbial jarosite formation through iron oxidation (microbial-Fe jarosite), microbial sulfide oxidation is also suggested as a plausible formation pathway for microbial jarosite formation (microbial-S jarosite) [18]. Acidithiobacillus ferrooxidans is capable of gaining energy through the oxidation of ferrous ion and reduced sulfur compounds, such as sulfides, for bacterial growth [28].
The aim of the present study is to better understand the formation of jarosite observed on the sea cliffs along the coast of central Norway. Better insight into jarosite mineralization is not only of interest to terrestrial mineralogy and environmental science, but it also has relevance to planetary sciences and the quest for microbial life on the planet Mars [29,30,31,32,33,34,35,36]. Jarosite is regarded as possible evidence for a hydrous, acidic, and oxidizing environment on the early Mars surface, where it was found [37]. The diversity of geochemical environments in which jarosite forms is an area of investigation that still needs to be addressed well. In this context, the exploration of different ways of formation of jarosite on earth can be relevant and valuable. This investigation covers the case of jarosite formation on seaward cliffs under non-acidic pH conditions. The possible routes of formation are explored. The investigations capitalize on the characterization of the jarosite samples from two sites through the application of a combination of analytical techniques including microscopy, elemental and molecular spectroscopies and mineralogical ones.
1.1. Regional and Local Geography and Geology
The locations examined are in coastal central Norway, Ørland municipality, Trøndelag County, Norway (Figure 1). The area is within the Western Gneiss Region and the Scandinavian Caledonides [38]. The regional geology is strongly impacted by the closure of the Iapetus Sea [39] following the plate collision between the Laurentia continent in the west and Baltica to the east, resulting in heavily folded metamorphic bedrocks of Silurian–Devonian age [40]. Bedrocks of the sampling areas are dominated by garnet-rich amphibolite, paragneisses/calc-silicate gneisses, psammitic schist, and coarse-grained marbles [41,42,43,44]. At the two locations examined, i.e., the islands Stefføya and Valen, the gneisses are heavily folded with alternating calcite psammites and schists [41,43]. The coastal area is characterized by extensive beach lowland, a landform common in the Norwegian coast consisting of a planar erosion surface on the seabed [45], towards the west and the sea, while mountains reaching 300–500 m asl. dominate the landscape eastwards. The topography of the area is strongly influenced by the last glaciation. Maximum sea level in the area was 115 m approximately 10,000 years B.P. [46]. The sites sampled are 1.5–3 m above the present-day high tide. Seashore displacement curves indicate that the historical sea level reached 5 m above present at approximately 1500 years B.P. [46,47].
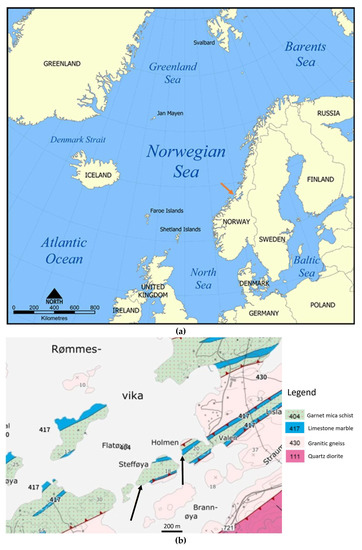
Figure 1.
(a). Regional map with the sampling location indicated by the orange arrow (from CC BY-SA 3.0, https://commons.wikimedia.org/w/index.php?curid=292869, accessed on 20 December 2022); (b). geological map of the sampling sites at Stefføya and Valen indicated by the black arrows (from NGU Nasjonal berggrunnsdatabase [48]).
1.2. The Sampling Locations
1.2.1. Stefføya
The location Stefføya (63°51′13″ N, 9°50′56″ E) is approximately 1 km southwest of the mainland farm Valen (Figure 1b). The sampling site is a south–southwest facing, up to 5 m high cliff, rising from the sea with an inclination of approximately 60–70 degrees (Figure 2b). The vegetation at the top of cliffs is dominated by Calluna vulgaris heath and small bushes of Juniperus communis. The bedrock on the site is characterized by garnet-rich amphibolite and patches of coarse-grained limestone. A few scattered vascular plants are found in the cliff wall and crustaceous lichens occur scarcely. Various genera of cyanobacteria (Anabena spp., Nostoc spp., Scytonema spp.) commonly occur in regularly wetted parts of the cliffs. Yellow-colored mineral crust (Figure 2a–c) was collected at approximately 1.5–2 m above sea level close to a vertical crack in westward-facing part of the cliff.
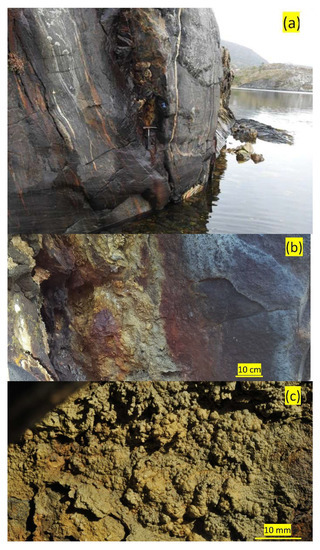
Figure 2.
Jarosite formation at Stefføya indicated by a geological hammer (a). The middle image (b) shows a closer view of the jarosite and the micrograph of the jarosite from the same site is displayed at the bottom (c).
1.2.2. Valen
The sampling site at Valen (63°85′69″ N, 9°85′95″ E) is located on the mainland 200 m west of the farm bearing the same name. The landscape is characterized by coastal flats with small hills up to 20–30 m above sea level. The southwest-facing cliffs, approximately 5 m in height, have an inclination of 60 degrees. The vegetation at the top of the cliffs is dominated by Calluna vulgaris heath and small bushes of Juniperus communis and Populus tremula. The sampling site of Valen was at the bottom of two rocks (approximately 1 × 0.5 m) partly intersecting in a V-shaped orientation, creating a free space of approximately 30 cm above the ground in a south–southwest-facing cliff at approximately 3 m above sea level. (Figure 3a,b). The rock on which the jarosite formed is comprised of mica-rich schist and paragneiss. The encrustations found at Valen differ in color (black) and size (larger botryoidal formations) compared to specimens observed elsewhere.
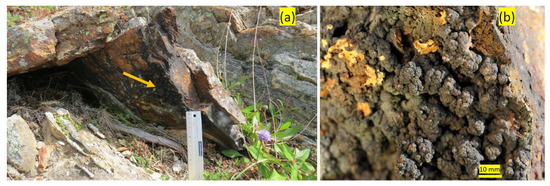
Figure 3.
The sampling site at Valen (a) with a dark crust of jarosite on the right stone (arrow) along with a 15 cm ruler. Details of the jarosite pointed by the arrow is shown in (b).
1.3. Materials and Methods
Specimens of bedrock crust were collected with tweezers or chisel and hammer. The samples were stored in clean medical containers and refrigerated (approximately −18 °C) before treatment and analyses. Bedrock samples were cut by a water-cooled diamond saw (Lortone TS8). Thin sections were produced at the Department of Geosciences, Oslo University (Oslo, Norway) and at the Institute of Geology, the Norwegian Arctic University (Tromsø, Norway). Samples for light microscopic analyses were also prepared with sterile scalpels and studied in sterile water or embedded in SYN-Matrix medium (MicroTechLab). Microscopic analysis was performed both on site and in the laboratory using Dino-Lite microscopes with 30x–900x magnifications (models AM4515T8, AM7013MZT4, AM4113T-FV2W and AM4113T-RFYW) in white light, UV365 nm, UV610 nm and polarized light. An epi-fluorescence phase contrast Zeiss Standard microscope with 400x–1000x magnification was utilized together with a Dino-Eye (AM7023X) digital 5 MP eyepiece camera. A Leitz Laborlux K transmission light microscope with 400x–1000x magnification and equipped with a Leitz EC3 digital camera was also used. Digital images were acquired, and measurements carried out using the software Leica Acquire and Dinocapture. SEM-EDS analyses were performed on different samples using various instruments: HITACHI ultra-high-resolution SEM microscope model 8230 on samples sputtered with silver, SEM-table top Hitachi TM3030, Zeiss Merlin VP field emission microscope equipped with the Oxford Instruments EDS spectrometer X-Max 80 mm2 (SDD) and Aztec software, Zeiss Supra 35VP SEM coupled with EDS detector of EDAX Octane Elite 25 and TEAM software. Silver, copper and palladium coatings were also used to render the samples conductive for the SEM- EDS analyses. Samples for light microscopy and some of them for electron microscopy were prepared as cross-sections and thin sections.
XRD analyses of two mineral crust samples, obtained from the Stefføya and Valen, were acquired using Bruker D8 ADVANCE. The software platform Diffrac Suite EVA and the PDF-4+ database were used for mineral identification and semi-quantification. The Rietveld procedure (Topas 4) was utilized in mineral quantification. XRF analyses of two mineral crust samples from the sites were carried out using Bruker S8 Tiger 4 kW X-ray spectrometer. At Stefføya XRF analyses were also performed on site using a portable Niton XL3t (Thermo Scientific, Waltham, MA, USA) XRF instrument. In addition, a Bruker Alpha FTIR spectrometer in the ATR mode and a confocal micro-Raman spectrometer (Renishaw-inVia Qontor) using 633 and 532 nm lasers were utilized for the investigation of the jarosite samples. Ar39/Ar40-isotope dating of sample from Stefføya (on one crust) was performed at the Institute of Geological Sciences, Universität Bern, Bern, Switzerland and irradiated at McMaster University reactor, Hamilton, Canada. The sample was run in two aliquots: a very small one and a larger one, >150 mg.
The air temperature, approximately two centimeters above the cliff surface at Stefføya, was logged continuously every hour from August 2013 to April 2014 with a TinytagPlus2 logger. The accuracy of the logger is 0.8 °C with a PT1000 sensor. The sensor was placed in the cliff wall approximately 15 m from the sampling site of jarosite crust and at the same height above sea level. From April 2014 to August 2016, the sensor was cemented around one centimeter beneath a layer of Portland grey cement with quartz sand (Weber Craft concrete). The purpose was to obtain measurements representative of the parent bedrock. A portable infrared measuring device, Bosch PTD1, was also applied in measuring surface temperatures of rocks at the sampling site of Stefføya. The degree of emissivity of the surfaces measured was adjusted. The accuracy of the infrared thermometer is ±1 °C in the range 10–30 °C and ±3 °C below 10 °C and above 30 °C. Running water and ice regularly emerge from the cliffs at Stefføya. Samples of dripping water were collected in clean medical containers during different seasons of the year from 2014 to 2016. On one occasion during the winter season, ice emerging from the amphibolitic bedrock, approximately three meters to the east of the sampling site at Stefføya, was melted and the pH of the water was measured. The pH of all water samples was measured using a Hannah HI 98,128 tester (electrode HI73127) with an accuracy of ±0.05 pH, and with automatic temperature correction and calibrated by standard buffers.
2. Results
The mineral crust collected from Stefføya consists of layered botryoidal sheets that are yellowish brown and yellowish green in color (Figure 4). Crust with a similar morphology and color was observed on several nearby locations. However, it was best developed and most extensive at Stefføya. It apparently represents the most common crust type and thus was analyzed in more detail. In addition, samples from the Valen were analyzed because of their dark color and thicker crust.
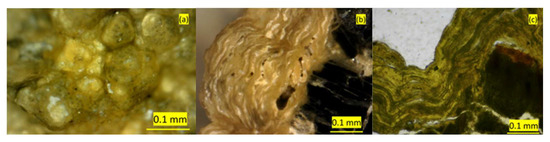
Figure 4.
Micrographs of Stefføya samples: (a) surface of mineral crust showing botryoidal formations, (b) cross-section of botryoids showing laminated crust structure on the parent rock (black in color), and (c) polished thin section with lamina.
The individual botryoidal formations on the crust surface of the Stefføya samples measure 0.01–0.5 mm in diameter and are aggregated in groups up to 5 mm in diameter. Some of the botryoidal formations at the two locations appear in the polarized reflected light microscopy with dark agglomerations beneath the surface varnish (Figure 4a). Reflected light microscopy shows groups of 1–2 mm long transparent white or yellow crystals on the crust surface, appearing like swallow-tailed structures, possibly composed of gypsum and calcite as indicated by elemental and molecular spectroscopic analyses. Grey-colored tower-like structures (approximately 2 mm high and 0.5 mm wide) with a rim of transparent microcrystals at their top (identified to be gypsum) are also found on the surface as detailed later. Analyses by transmission light microscopy of two polished longitudinal thin sections of samples from Stefføya (Figure 4c) and Valen (Figure 5c) revealed a similar layered crust structure with several smaller lamina inside each layer and increasing porosities in the crust towards the parent rock. The analyses by polarized transmission light microscopy also show a thin distinct anisotropic layer (interference colors) in the outermost parts of the crust surface with several microlamina, each measuring approximately 0.01 mm or less. Back-scatter electron (BSE) images of a thin section from Stefføya confirms the microlamination (Figure 6).
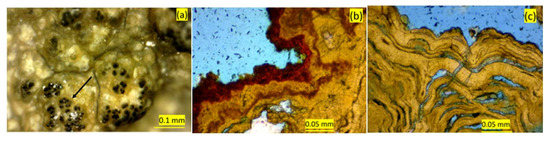
Figure 5.
Micrographs of Valen samples: (a) surface of the mineral crust showing botryoidal 199 formations with dark agglomerations (arrow), (b) cross-section of the crust showing lamina and likely formation of iron oxides/hydroxyoxides on the surface as weathering products of the jarosite (dark red material at the surface), and (c) polished thin section showing laminated crust structure. The scale is 0.1 mm in (a) and 0.05 mm in (b,c), respectively.
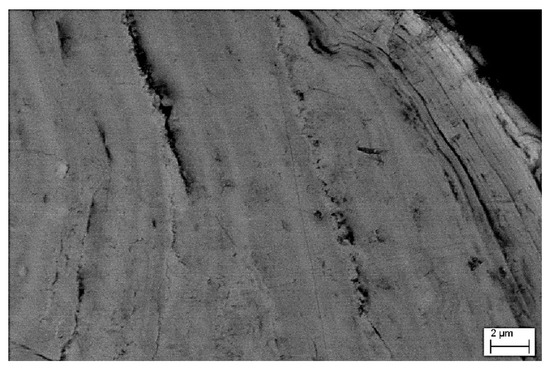
Figure 6.
BSE image of a thin section of a sample from Stefføya displaying the laminar structure.
XRD analyses were performed on crust samples collected from Stefføya and Valen. Visible fragments of parent rock were removed before analysis. The Stefføya samples show a dominance (66%) of jarosite minerals, i.e., AFe3(SO4)2(OH)6, where A may represent potassium or sodium (Table 1 and Supplementary Materials S1–S5). Further analyses using SEM-EDS, XRD, micro-Raman and FTIR revealed that both potassium jarosite, KFe3(OH)6(SO4)2, and natrojarosite, NaFe3(SO4)2(OH)6, exist in the different samples analyzed (details in later sections and the Supplementary Materials S1–S3, and S5). In some parts of the samples, one type of the jarosite could be the dominant jarosite formation (Supplementary Material S1). XRD analysis has also implied the possible presence of hydronium jarosite. The end members jarosite, natrojarosite and hydronium jarosite have a tendency to form isomorphous solid solution series and, as a result, have similarities in their XRD diffractograms. Other minerals represented by minor quantities in the Stefføya crust sample are gypsum, quartz, and potassium feldspar. Laboratory XRF analysis (Table 2) of a sample from Stefføya showed iron (28.86%) and silica (25.62%) as the most common elements of the crust and nearly similar levels of potassium (2.56%) and sodium (3.03%). Results obtained with a handheld XRF for on-site measurements at Stefføya also provided similar information as the bench top XRF elemental determination regarding the major and minor components.

Table 1.
XRD quantification (in percentage) of jarosite samples from Valen and Stefføya. bdl–below detection limit.
Table 2.
XRF quantification (in percentage) of jarosite samples from Valen and Stefføya. bdl—below detection limit; LOI—loss on ignition.
Crust samples obtained from the bottom of the two V-shape-oriented rocks at Valen have a black surface color and are thicker and greater in the sizes of the agglomerations compared to the samples from Stefføya (Figure 2, Figure 3, Figure 4 and Figure 5 and S6). However, their micromorphology in longitudinal thin sections was similar. The XRD quantification show a dominance (95%) of jarosite minerals with low levels of gypsum and quartz. However, the coexistence of jarosite, natrojarosite and possibly other members, such as hydronium jarosite, are implied from studies conducted on various samples employing multiple techniques (Table 1 and Supplementary Materials S1–S5). The relative proportions of jarosites were considerably higher at Valen than Stefføya as can be seen in Table 1.
Laboratory XRF analysis of sample from Valen also demonstrates higher concentration of iron (43.4%) as compared with that from Stefføya (28.86%) and similarly there is a higher concentration of sulfur in the former (2.23%) than the later (1.75) (Table 2). This agrees with the relative percentages of jarosite determined by XRD (Table 1). The high concentrations of iron could partly be due to the relatively high concentration of iron oxides and iron hydroxyoxides from the weathering of jarosite. In comparison, higher degree of weathering is implied in the case of Valen. This is further supported by the optical micrographs that show depositions of iron oxides and hydroxyoxides at the surface (Figure 5). Simultaneous gypsum formation, another weathering product of jarosite, is also indicated by the gray coloration at the surface of the botryoidal formations. Relatively higher percentage of gypsum is noted in the Stefføya samples than Valen (Table 1). The relatively high percentage of calcium in Stefføya samples determined by the XRF is also additional evidence for the high abundance of gypsum at Stefføya than Valen. The total sum of sulfur (including those in jarosite and gypsum) in Valen samples is higher compared to that of Stefføya. This is reasonable considering the comparatively higher percentage of jarosite at Valen than Stefføya. The levels of potassium measured by the XRF quantification are not drastically different for the samples gathered from both sites. In addition to jarosite, the origin of potassium could be the constituent minerals in the rock on which the jarosite is formed among others. The possibility of the co-existence of jarosite and natrojarosite is also implied by multiple analytical techniques upon further analysis of diverse samples from the two sites.
Morphological and elemental analysis with SEM-EDS of the crust surface of a sample from Stefføya shows several gypsum crystals (Figure 7 and Figure 8) along with the jarosite formations. As expected for jarosite, sulfur and iron are found to be the most common elements on the surface (Figure 9 and Figure 10). Silicates and aluminosilicates of potassium and sodium such as feldspars are also implied. These aluminosilicates originate from the rock on which the jarosites are formed. The simultaneous detection of sodium and potassium could partly be due to the coexistence of jarosite and natrojarosite. The contributions from the parent rock fragments cannot be totally ruled out. High-magnification SEM analyses also demonstrated that large parts of the surface are covered by encrusted rods and globules measuring approximately 0.5−1 µm long (Figure 11b). Based on their size and morphology, these features in the secondary electron (SE) image, could be interpreted as mineralized remnants of bacteria or other microorganisms.
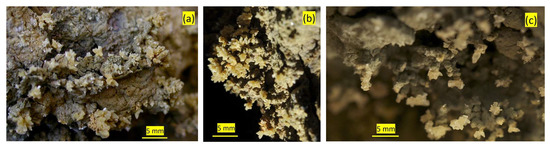
Figure 7.
Photographic images taken in different years at the Stefføya site showing the formation gypsum crystals on the top of jarosite formations. The calcium needed could have originated from the water access during tidal cycles in different seasons. The same water source could also be responsible for the subsequent dissolution of gypsum in a cyclic manner in tandem with formations of jarosite. The images from left to right are taken in 2013 (a), 2015 (b) and 2009 (c), respectively.
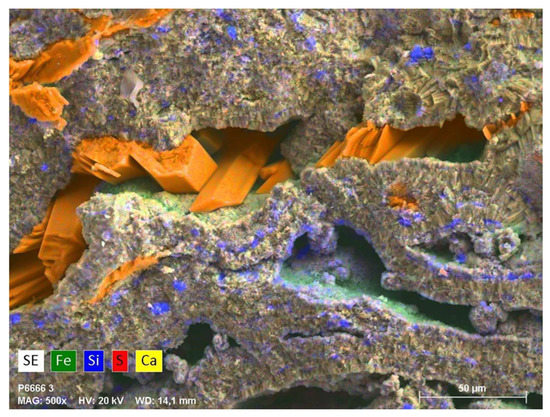
Figure 8.
Overlayered elemental mapping of iron, silica, sulfur, and calcium acquired from a longitudinal thin section sample from the Stefføya site. Formation of gypsum crystals (bright orange colored) inside cavities of the crust, enhancement of iron compounds (likely iron oxides/hydroxyoxides), greenish and greenish blue, and silica (violet), in some localities, are notable from the mapping. The vacant spaces could be due to gypsum lost through dissolution after being formed as weathering product of jarosite.
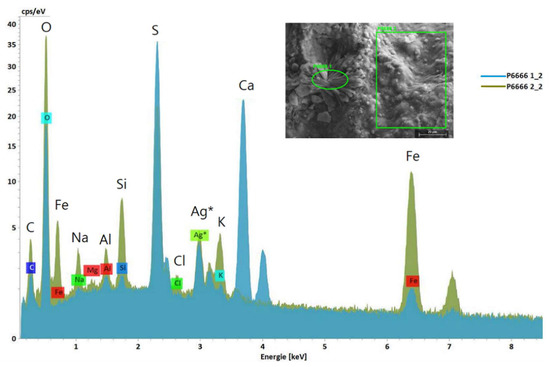
Figure 9.
SEM image with selected areas from Stefføya sample for SEM-EDS analyses (inset) and the corresponding overlayered EDS spectra acquired. Jarosite, natrojarosite, gypsum, aluminosilicates and silicates are implied from the elements detected. The oval green area resulted in the light blue spectrum (gypsum) whereas the rectangular area selected gave the olive green one (jarosite, silicates and aluminosilicates). The silver detected is from the coating used to make the sample electrically conductive in the analysis. Larger symbols are used for visibility in addition to the ones generated by the EDS software.
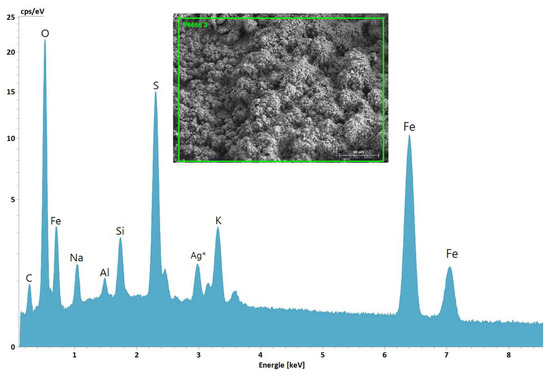
Figure 10.
SEM image with selected area for EDS analysis (inset) and the corresponding EDS spectrum acquired from a sample of Stefføya. Jarosite, natrojarosite, aluminosilicates and silicates are implied from the elements detected.
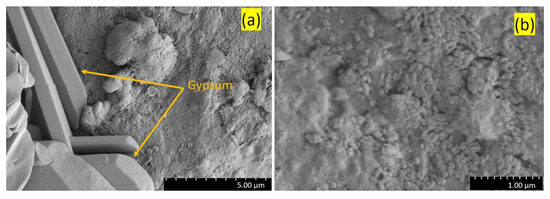
Figure 11.
SEM high-magnification images (SE) of the surface of jarosite formation showing gypsum crystals from Stefføya (a) and rod and globular morphologies (b).
SEM-EDS analysis of a longitudinal thin section cut through a crust sample from Stefføya shows characteristic gypsum crystals inside cavities of the crust as well as several (1–2 µm) trigonal antiprismatic crystals of jarosite (Figure 8, Figure 11a and Figure 12). Jarosite is the most common member of the alunite supergroup and belongs to trigonal structure. The gypsum formation could be related to the weathering of jarosite, where the sulfate released forms gypsum upon contact with calcium-rich microenvironment.
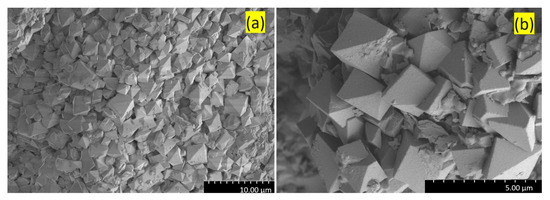
Figure 12.
SEM images (SE) of the trigonal antiprismatic crystals of jarosite at different magnifications acquired from a Stefføya sample: (a) at lower and (b) higher magnifications.
A thin section, cut perpendicular to the crust surface towards the parent bedrock, was subject to line EDS analyses (Figure 13). Despite being low in the scale used, there appears to be relative increments in sulfur, potassium, and sodium where jarosites are located. The distribution of elements shows some patterns in agreement with jarosite distribution. Here, mixed jarosites with both potassium and sodium jarosites could also be implied.
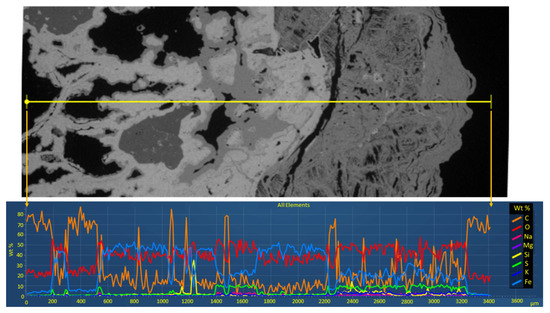
Figure 13.
SEM image with the line selected for mapping (top) and the corresponding line mapping (bottom) conducted on a sample from Stefføya. Enhancement in the concentrations of potassium, sodium, and sulfur is related to the jarosite-rich parts of the thin section. More enhancement of these elements is evident as one traverses from the rock on which the jarosite is formed to the right (jarosite covered surface). Iron and oxygen are the main components of the rock in addition to that of jarosite.
In addition to the characterization of the different types of jarosites in the samples, the weathering products and parts of the rock on which the jarosites were formed (including surface depositions) were investigated using microscopic and elemental methods (SEM-EDS and XRF), molecular techniques such as FTIR and micro-Raman spectroscopy and a mineralogical technique (XRD). Some of the results are shown in Figure 14, Figure 15, Figure 16, Figure 17, Figure 18 and Figure 19. Additional results are also provided in the Supplementary Materials (S1–S5).
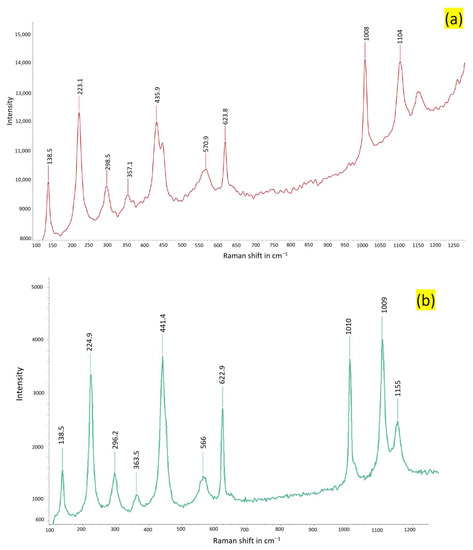
Figure 14.
Raman spectra of samples acquired from Stefføya. The first one is composed more of jarosite (a) and the second likely contains more natrojarosite proportion (b). The peaks are similar. The strong bands between 1000 cm−1 and 1110 cm−1 are used for the distinctions.
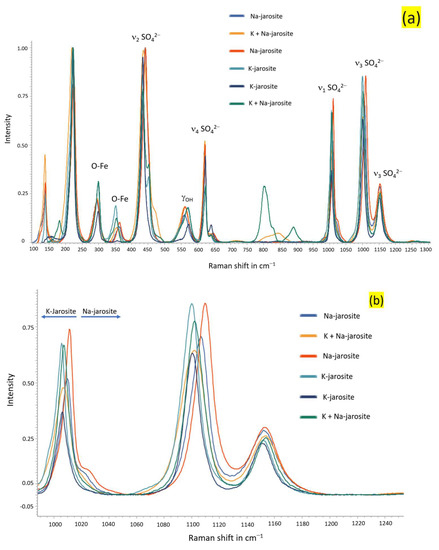
Figure 15.
Overlayered Raman spectra of samples from Stefføya along with the peak assignments (a) and the closer view in the range centered around 1000 cm−1 and 1100 cm−1 (b). The suggested compositions are based on the relative shifts in the peaks shown in (b). However, many shifts are also noted in other peaks as displayed in (a). Na-jarosite—natrojarosite; K-jarosite—jarosite.
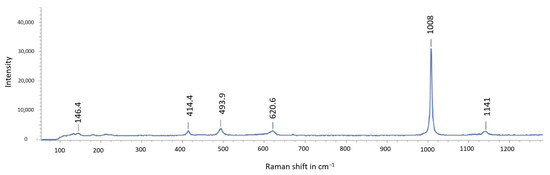
Figure 16.
Raman spectrum acquired from a crystal formed on the top of jarosite from Stefføya. Gypsum is confirmed.
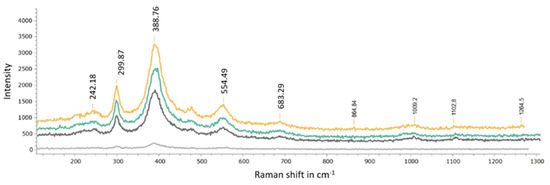
Figure 17.
Overlayered spectra acquired from samples of Stefføya. Goethite presence in the samples, along with jarosites, is confirmed.
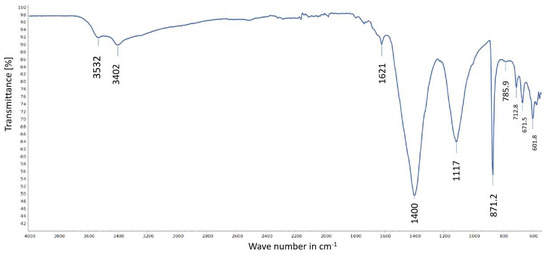
Figure 18.
FTIR spectrum of a sample from Stefføya showing the co-existence of calcite and gypsum.
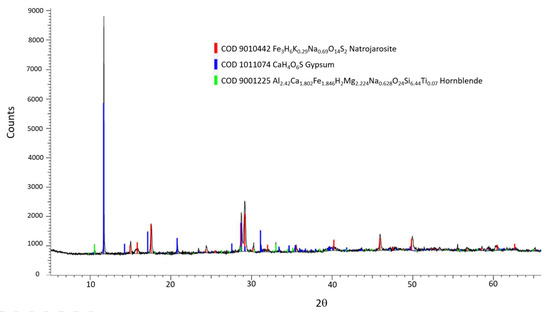
Figure 19.
XRD diffraction pattern acquired from a weathering jarosite sample of Stefføya. The inset shows some of the minerals identified using Crystallography Open Database (COD). Gypsum is the major component along with natrojarosite. The co-existence of jarosite and natrojarosite is also implied from the X-ray diffraction patterns of other samples from Stefføya. Hornblende is part of the rock on which the jarosite was formed.
The Raman spectra displayed in Figure 14 belong to the jarosites. Jarosites are composed of sulfate, and, as with other oxyanions, they can be characterized using molecular techniques such as FTIR and Raman spectroscopy. The sulfate anion has a Td symmetry and is identified by the Raman bands at 1008 and 1010 cm−1 (ν1), 435.9 and 441.4 cm−1 (ν2), 1104 and 1155 cm−1 (ν3), and 623.8 and 622.9 cm−1 (ν4) [49,50,51]. Jarosite and natrojarosite are just few examples of the endmember jarosites. Intermediate jarosites, consisting of mixtures of alkali-site cations (K+ and Na+, or H3O+ and K+) in different proportions, can exist. Natural endmember jarosites are not often found physically segregated [52]. This is indicated by the shifts in the Raman peaks observed in the different samples examined (Figure 14 and Figure 15). Cation substitution in the alkali site (A site of AFe3(SO4)2(OH)6) chiefly alters the A-O bond length, which, in tun, causes the Fe-O bonds to lengthen and shorten [21]. These types of changes are observed in the spectra acquired (Figure 15).
The jarosites formed are apparently composed of mixtures of jarosite and natrojarosite, if not more. This is reflected in the shifts of the Raman peaks obtained (Figure 15). The gypsum formed in associated with jarosite is confirmed by Raman and FTIR spectra (Figure 16 and Figure 18).
Similar to gypsum, the presence of goethite is also identified by the Raman spectroscopic investigations (Figure 17). The gypsum bands are identified as 1008 cm−1 ν1(SO4), 1141 cm−1 ν3 (SO4), 620.6 cm−1 ν4 (SO4), 493.9.6 cm−1 ν2 (SO4), and 414.4 cm−1 ν2 (SO4) [53,54]. The peaks 242.18, 299.87, 388.76, 554.49. and 683.29 cm−1 belong to goethite: 242.18 cm−1 (Fe-O symmetrical stretching), 299.87 cm−1 (Fe-OH symmetrical bending), 388.76 cm−1 (Fe-O-Fe/-OH symmetrical stretching), 554.49 cm−1 (Fe-OH asymmetrical stretching) and 683.29 cm−1 (Fe-O symmetrical stretching) [55,56]. In some samples, the co-existence of calcite and gypsum is indicated by the results from FTIR analyses (Figure 18). The characteristic bands of calcite are identified at 1400, 871.2, 712.8 cm−1 and agree with similar assignments ([57] and references cited therein). Gypsum peaks are assigned as follows: 3532 cm−1 υ3(H2O), 3402 cm−1 υ1(H2O), 1620 cm−1 υ2(H2O), 1117 cm−1 υ3(SO4), 671.5 cm−1 υ4(SO4), and 601.8 cm−1 υ4(SO4) [58,59].
3. Discussion
Jarosite encrustations are known from diverse environments in Norway such as mining ores and dumps and caves [60,61]. The macro- and micromorphology of the crust samples analyzed here resemble jarosite nodules, laminar and granular coatings in coastal environments in Australia [62]. In the present study, various light microscopy and SEM analysis results reveal a distinct lamination and microlamination in the samples examined. This wavy lamination pattern looks like the growth rings of trees and implies possible occurrences of periodic favorable conditions for jarosite development. Similar cyclic trends of formations followed by weathering/dissolution could have happened to the gypsum, recognized to form on the top surface of jarosite, to result in the microstructures observed. The formation of gypsum on the surface of jarosite is detected during on-site examination and using microscopic techniques (Figure 7, Figure 8, Figure 9, Figure 11, Figure 20 and Figure 21). It can appear gray. The gray coloration could have emanated from accumulation of carbonaceous matter on the gypsum formed during weathering of the jarosite. The proximity to water, the sites being in the coastal area, results in exposure to water that could also facilitate the dissolution of the gypsum with time. The gypsum formation could be related to the weathering of jarosite, where the sulfate released forms gypsum upon contact with calcium-rich microenvironments. Other weathering products of jarosite such as iron compounds (iron oxides/hydroxyoxides such as goethite) and silica are also present, especially in the areas surrounding the crust cavities (Figure 8). The vacant spaces could be due to gypsum lost through dissolution under favorable condition after being formed as weathering product of jarosite. The jarosite, implied by the layered lamination pattern, could have been formed in repetitive cycles of jarosite and then gypsum formations followed by dissolution of gypsum. Images taken in different years show the formations of gypsum on top of jarosite. There are holes, cracks, and fissures where there is less likelihood for the exposure of gypsum to seawater and rain, and subsequent dissolution than in the exterior parts (Figure 7, Figure 20 and Figure 21). In such places, well-crystalized gypsum is visible. Diatom skeletons, often in highly weathered states, are quite commonly seen in the jarosite samples analyzed, suggesting the interaction of water with the jarosite formations (Figure 22).
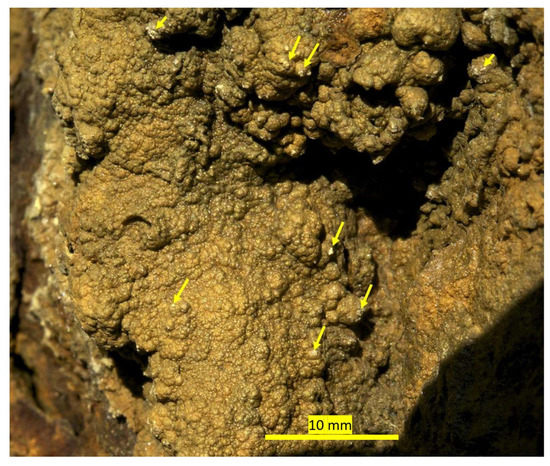
Figure 20.
Jarosite formation at Stefføya site. Some tiny gypsum formations on top of the jarosite are noticeable. Some of the small gypsum formations are shown in the yellow arrows. Probably, some of them, which were dissolved, are re-precipitating to the left side of the jarosite formation at the edge (white precipitation, out of focus).
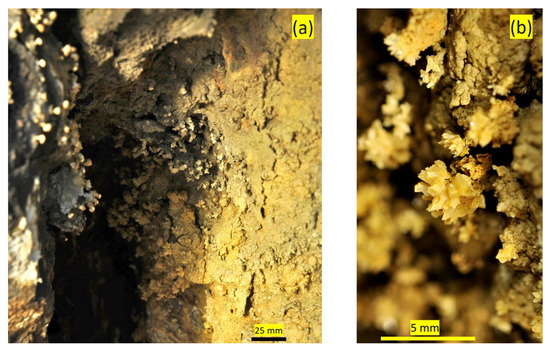
Figure 21.
Image of gypsum formation in a sheltered part of a hole-like structure (a) in the rock at Stefføya. The image to the right (b) is a closer view of the gypsum formed on top of the jarosite. There is a contrast between the inner part of hole and the outer part. The gypsum formed on the top of the jarosite is likely to be dissolved in the outer part, where there is a greater chance of exposure to water, compared to the interior one.
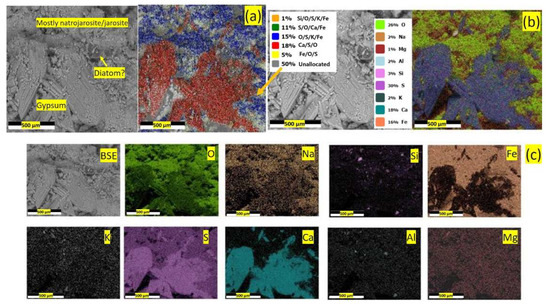
Figure 22.
BSE image and overlayered phase mapping (a), overlayered elemental mapping (b) and individual elemental mapping (c) in one of the samples collected from Stefføya. The insets in (a,b) are the relative percentage of the different phases and elements, respectively, detected in the selection area. Gypsum formation in association with mostly natrojarosite is evident. Remnants of weathered diatoms are also identified in the microscopic investigation.
The SEM-EDS analysis result of the jarosite crust surface displayed in Figure 22 shows a case where gypsum is associated with mostly natrojarosite weathering. In addition, other weathering products noticed, such as iron oxides, hydroxyoxides (including goethite and similar thermodynamically stable minerals produced under oxic conditions) and silica, support this possible weathering phenomena involving gypsum formation. The process of jarosite laminate formation could have taken place over a very long time as indicated by the timescale of up to one million years as the Argon radiometric dating shows.
The combined results from XRD, XRF and FTIR analyses reveal that both jarosite and natrojarosite are present in the different samples examined. In some parts of the samples, each one of them can be the dominant components or even exist as sole component. Both potassium jarosite and natrojarosite are found in caves of northern Norway and often together with gypsum and iron oxide [61]. Jarosite, natrojarosite and hydroniumjarosite were also identified in other parts of Scandinavia such as the different localities of Sweden [63,64]. Jarosite appears to be a more common mineral than natrojarosite [60,65]. The weathering of silicate and aluminosilicate minerals could serve as sources of cations (e.g., K and Na) incorporated in the jarosites. These include clay minerals such as illite or potassium-feldspar such as microcline, orthoclase and sanidine. The interaction of water and pyrite-bearing rocks could result in local acidic and high sulfate conditions, that can lead to the formation of jarosites considering the available sodium and potassium ions from the rock weathering. The source of sulfur could be the parent rock harbouring minerals such as pyrite and chalcopyrite. Indications of weathering phenomena associated with these minerals are acquired from SEM-EDS analyses (Figure 23). The closeness to the sea could also supply sulfates.
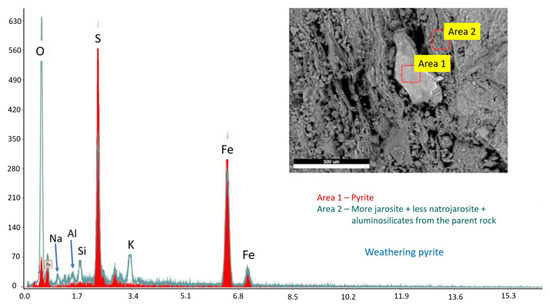
Figure 23.
BSE image with areas selected for EDS analyses (inset) and the corresponding overlayered EDS spectra. The pyrite-containing particle under weathering condition is surrounded by jarosite and natrojarosite formations and aluminosilicates of the surrounding rock material.
Efflorescence (i.e., laminar surface coatings or nodules of jarosite minerals) could be formed both inorganically and via biomineralization taking place in acidic and oxidizing environments that are rich in iron and sulfides or sulfates [63,66,67]. The sampling spot at Stefføya is not acidic as water samples analyzed showed that the pH level in the area is in the range of 7.5–8.1. Results from dissolution investigations indicated that the stability of jarosite decreases with increasing pH [4,68]. The sampling site at Stefføya is regularly impacted by sea spray maintaining approximately pH 8. Studies suggest that regular exposure to sea spray, with high sulfate and sodium concentrations, could contribute to the formation and conservation of encrustations of jarosite in a non-acidic environment [4,69].
Stefføya offers a variety of environmental factors that could be favorable to jarosite mineralization. During warm sunny days, the dark-colored rocks, amphibolite, could reach surface temperatures of approximately 50 °C while temperatures inside artificially applied concrete reached 30 °C during the summer period. High rock temperatures combined with a porous and regularly wet interior of the rocks might have contributed to microenvironments conducive for inorganic mineralization and biomineralization. Mineral-rich water could be supplied both as surface run off or beneath the rock surface or from sea spray. Water with solutes might also rise by capillary diffusion through the porous parent bedrock and crust. It is known that jarosite decomposes readily into goethite under alkaline conditions [70]. Iron oxides, including iridescent surface coatings, often referred to as rock varnish, are composed of goethite and hematite, among others. SEM-EDS analyses, spectroscopic investigations and light microscopic imaging on prepared and non-prepared samples indicated that iron oxides are associated with jarosite weathering (Figure 5, Figure 8, Figure 17 and Supplementary Materials S1 and S6). In addition, in microscopic examinations, deposition of iron oxides/hydroxyoxides at the surface is also observed at Valen (e.g., Figure 5b). Even a large-scale mineral map acquired by Airborne Visible and InfraRed Imaging Spectrometer (AVIRIS) showed an interesting pattern in the distribution of jarosite, goethite and hematite at an abandoned mine site (Venir mine-waste pile in Colorado). There is a progression from a jarosite-rich center to jarosite/gothite mixture, followed by primarily goethite, and then to hematite in the outer layers [71].
SEM analyses of a sample from Stefføya showed a patchwork of mineralized microbes in the crust (Figure 11b). In preparation for SEM analysis, most of the surface biofilm with living microbes have probably been removed and only fossilized microbes are observed. Reflected light microscopy (white and polarized light) reveals that the freshly collected samples from the mineral crust surfaces contain dark agglomerations (0.01 mm) in the “varnish” layer as well as a network of tread-like structures. Different groups of microorganisms are apparently present as the SEM analyses revealed, including one-celled microbes (bacteria) and scattered filamentous structure. In the present study, it was not possible to decide conclusively whether the organic structures and microbe remnants observed are connected to biomineralization or biologically induced mineralization. Microstructural and morphological features of the jarosite formation, however, point to a possible microbial activity causing the successive depositions of jarosites, followed by their weathering, in cyclic manner over a very extended time frame. Layered accretionary and laminar structures commonly found in stromatolites, that are produced by microorganisms such as cyanobacteria, resemble the repetitive wavy microstructures of the jarosites observed in this study. The repetitive wavy structures are found among the laminar patterns in the formation of the stromatolites.
The pattern of formation of jarosite, along with its weathering products comprised of iron oxides, iron hydroxyoxides and gypsum, is also relevant. At Stefføya, these are mostly associated with holes, cracks, and fissures in the rock (Figure 20, Figure 21, Figure 24, Figure 25 and Supplemental Material S6). This could be linked with prevalence of favorable microenvironment for the proliferation of the microbes and transportation of sulfur-containing compounds needed for the formation of jarosite. The formation of jarosite along with its possible weathering products, such as oxides and hydroxyoxides of iron and gypsum, are evident. Sulfides of iron and copper are identified from the elemental analysis of some samples from the site. Microbial activities could possibly be associated with the transport of the needed chemical elements and formation of jarosite in the surroundings of the holes, cracks, and fissures in the rocks of Stefføya where jarosite appears. The white precipitation (Figure 20), likely composed of gypsum, appears to be re-crystallization from dissolution of gypsum formed on top of the jarosite formation upon exposure to high humidity and direct water in rainy seasons.
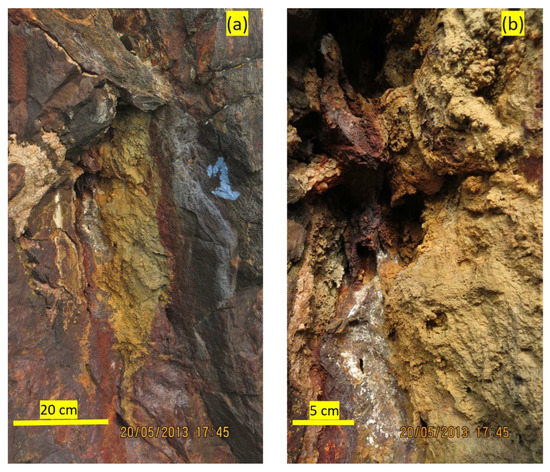
Figure 24.
Jarosite formation at one spot of Stefføya. The image to the right (b) is the closer view of the surrounding of a kind of hole in the rock (shown by the arrow in (a)).
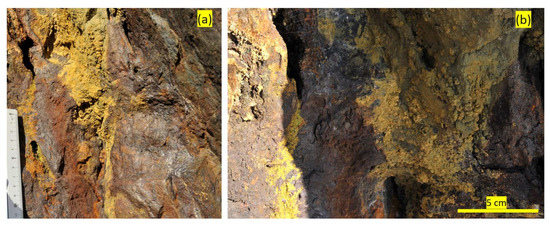
Figure 25.
Additional examples of jarosite formations and their weather products in proximity to the holes and cracks in the rock at Stefføya. The image to the right (b) is a closer view of one of the holes visible on the rock surface (top left in (a)). The visible part of the reference ruler length in (a) is 11.5 cm long.
The iridescence of the rock varnish, known to be associated with iron oxides and hydroxyoxides, close to the jarosite formation is a common phenomenon at the site (Figure 24, Figure 25 and Supplemental Material S6). FTIR analyses revealed that some of the samples from such features are found to contain jarosite. The red, reddish-brown and part of the yellowish parts are composed of iron oxides and hydroxyoxides as indicated by the SEM-EDS and Raman analyses conducted.
Further investigations are required to establish the nature of the jarosite formation mechanisms including characterization of the preserved and mineralized microbes. It could help in deciphering the microbial diversity and microbial metabolisms that are associated with the formation of the jarosites. Sulfate-reducing bacteria belonging to the genera Acidithiobacillus spp. (formerly Thiobacillus spp.) are known to enhance deposition of jarosite, as well as gypsum and calcite, but under low pH [70,72,73]. Biosynthesis by Acidithiobacillus ferroxidans of both potassium jarosite and natrojarosite have been carried out in laboratory studies [74,75,76]. There is research indicating that some fungi can induce biomineralization of jarosites in environments rich in ferric ions and sulfates [77]. In nature, biologically induced formation and biomineralization of jarosites are described by several authors. These include studies on ferric-rich river sediments [78] and subglacial microbial communities [79]. There is a distinct transition from the parent rock to the jarosite crust in the Stefføya samples. This could imply that the crust establishment is connected to a change in environmental conditions. Further investigation is required to understand whether these encrustations are formed in historical times under near present-day conditions during the Holocene or might have formed in the past when the environment was more acidic. Formation of a jarosite crust is described from studies of recent sub- or periglacial ice margins of glaciers [80,81,82]. In these environments of the Taylor glacier in Antarctica, jarosite is described to have been formed from a “pool of marine brine in a ferrous pH circumneutral environment and a metabolically active, mainly marine microbial “assemblage” [83]. Stefføya and the surrounding area show indications of a Holocene high energy sub- or periglacial ice margin with strong glaciofluvial seashore erosion, including several plastic forms and potholes. However, the age of one sample from Stefføya, as determined by Ar/Ar dating, show an age estimated to 1.11 Ma (isochron age) and 1.3 Ma (age spectrum), implying the Mid-Pleistocene Transition (MPT). This means that the jarosite mineral crust at Stefføya most likely originate from a pre-Holocene period when the climate became colder with increased intensity of glacial cycles including removal of regoliths and falling sea levels [84]. There have been several periods of glaciation of these coastal areas in Norway during the last one million years with heavy erosion and changes in sea levels [85]. The present-day jarosite crust could have been formed in rock fissures during the Mid-Pleistocene Transition at approximately 1.2 MA years and later exposed by erosion and made visible in recent times.
4. Conclusions
In the present study, jarosite-rich encrustations on seaward cliff walls have been analyzed with a focus on their micromorphology and geochemistry. Combinations of light and electron microscopic, elemental and molecular spectroscopic as well as mineralogical techniques were employed for characterization of the morphology, microstructure, and composition of the jarosite formations. Both potassium jarosite and natrojarosite are identified in the samples examined. In some parts of the samples, they were found together in different proportions and in others, separately.
The laminated nature of the jarosite formations likely implies the existence of favorable periods in a cyclic manner for mineralization/biomineralization of jarosite in tandem with gypsum formation and dissolution, as well as simultaneous depositions of other weathering products of jarosite. The alternate deposition of jarosite in different seasons followed by its weathering products (formation of gypsum succeeded by its dissolution as well as iron oxides, hydroxy oxides, and silica formation) could have resulted in the distinctive patterns in which these different layers are segregated. Over a long time span, these phenomena could have led to the laminated and microlaminated microstructures observed in the samples from Valen and Stefføya. The weathering products could have served as binding media. The preservation of the laminated structures in the strata without total disturbance, further strengthens the hypothesis of a possible biotic activity linked to the jarosite formation.
The formation of jarosite along with its possible weathering products, such as oxides and hydroxyoxides of iron and gypsum, are noted to be associated with holes, cracks, and fissures in the rocks at Stefføya. The localized accumulation of the jarosite in the opening of the rock could imply favorable microclimatic condition for the proliferation of the microbes and transport of sulfur-containing compounds from the inner part of the rock as sulfides of iron and copper are identified from the investigations on some samples from the site. Microbial activities could possibly be linked with the formation of jarosite surrounding these holes, cracks, and fissures in the rocks as well as what look like sheltered spots on the rock surfaces at the two sites.
In the present study, it was not possible to decide conclusively whether the organic structures and remnant microbes observed are connected to biologically induced mineralization. Microstructural and morphological features of the jarosite formation, however, imply the likelihood of microbial activity associated with the successive depositions and weathering of jarosite in cyclic manner over a very extended period. Observations at the site also indicate that it could be a process still on going to date. Further investigations are necessary to ascertain the nature of the jarosite formations including characterization of the preserved and mineralized microbes. Better insight into the microbially mediated formation and transformation of jarosite could require isolation and characterization of the responsible microbes. This could, in turn, support the elucidation of the biomineralization mechanism involved. The Ar dating revealed that jarosite formation at Stefføya could have been as old as the pre-Holocene period.
Supplementary Materials
The following supporting information can be downloaded at: https://www.mdpi.com/article/10.3390/min13010048/s1. The following supporting information covering some results from multiple analytical techniques (XRF, XRD, FTIR and micro-Raman), images from the sites of sampling and their surroundings along with some of the light micrographs of the sample preparations from the two sites can be downloaded at. S1: Some results from SEM-EDS analyses; S2. Some results from micro-Raman analysis; S3: A few of the FTIR analysis results; S4. Qualitative results of XRF analysis on some samples; S5: Some XRD results; S6: Images of the sampling sites and their surroundings at different scales along with some of the micrographs from light microscopy.
Author Contributions
Conceptualization, S.O.J.; methodology, S.O.J. and K.F.G.; investigation, S.O.J. and K.F.G.; writing—original draft preparation, S.O.J.; writing—review and editing, S.O.J. and K.F.G.; visualization, S.O.J. and K.F.G., All authors have read and agreed to the published version of the manuscript.
Funding
This research received no external funding.
Data Availability Statement
The data presented in this study are available in the article and Supplementary Materials.
Acknowledgments
The authors are grateful to Martin Bühner at nanoAnalytics GbmH, Wilhelm Dall at SINTEF and Kai Neufeld at UiT the Norwegian Arctic University for providing some of the SEM-EDS analysis and SEM images of specimens and to Laurentius Tijhuis and Torill Sørløkk at the Department of Geology and Mineral Resources Engineering, NTNU, for some of the XRD and XRF results. Thin sections were prepared by Salah Akhavan at Department of Geosciences Oslo University and Merete Dahl at the Institute of Geology, UiT the Norwegian Arctic University. We are grateful to Igor Villa at the Institute of Geological Sciences, Universität Bern, for the Ar39/Ar40 isotope age determination. Thanks to Dalibor Matysek at VSB-Technical University of Ostrava for comments on analyses of sulfate minerals and Jan Mangerud at Bjerknes, Centre for Climate Research, for valuable comments about the Ar/Ar dating in view of the history of glaciation in Norway. We are also thankful to the Museum of Archaeology, University of Stavanger for some of the physico-chemical investigations conducted.
Conflicts of Interest
The authors declare no conflict of interest.
References
- Breithaupt, J.F.A. Beschreibung der zum Theil neuen Gang-Mineralien des Baranco Jaroso in der Sierra Almagrera. Berg-Undhüttenmännisches Ztg. Mit Bes. Berucksicht. Der Miner. Und Geol. 1852, 11, 65–69. [Google Scholar]
- Anthony, J.W.; Bideaux, R.A.; Bladh, K.W.; Nichols, M.C. Handbook of Mineralogy: Volume I.; Elements, Sulfides, Sulfosalts; Mineral Data Publishing: Tucson, AZ, USA, 1990. [Google Scholar]
- Elwood Madden, M.E.; Madden, A.S.; Rimstidt, J.D.; Zahrai, S.; Kendall, M.R.; Miller, M.A. Jarosite dissolution rates and nanoscale mineralogy. Geochim. Cosmochim. Acta 2012, 91, 306–321. [Google Scholar] [CrossRef]
- Pritchett, B.N.; Elwood Madden, M.E.; Madden, A.S. Jarosite dissolution rates and maximum lifetimes in high salinity brines: Implications for Earth and Mars. Earth Planet. Sci. Lett. 2012, 357–358, 327–336. [Google Scholar] [CrossRef]
- Dutrizac, J.E.; Jambor, J.L. Jarosites and Their Application in Hydrometallurgy. Rev. Miner. Geochem. 2000, 40, 405–452. [Google Scholar] [CrossRef]
- Cruells, M.; Roca, A. Jarosites: Formation, Structure, Reactivity and Environmental. Metals 2022, 12, 802. [Google Scholar] [CrossRef]
- Burton, E.D.; Karimian, N.; Johnston, S.G.; Schoepfer, V.A.; Choppala, G.; Lamb, D. Arsenic-Imposed Effects on Schwertmannite and Jarosite Formation in Acid Mine Drainage and Coupled Impacts on Arsenic Mobility. ACS Earth Space Chem. 2021, 5, 1418–1435. [Google Scholar] [CrossRef]
- Murray, J.; Kirschbaum, A.; Dold, B.; Guimaraes, E.M.; Miner, E.P. Jarosite versus Soluble Iron-Sulfate Formation and Their Role in Acid Mine Drainage Formation at the Pan de Azúcar Mine Tailings (Zn-Pb-Ag), NW Argentina. Minerals 2014, 4, 477–502. [Google Scholar] [CrossRef]
- Fanning, D.S.; Rabenhorst, M.C.; Fitzpatrick, R.W. Historical developments in the understanding of acid sulfate soils. Geoderma 2017, 308, 191–206. [Google Scholar] [CrossRef]
- Qin, B.; Haarberg, G.M. The Study of Jarosite Waste Used for Suspension Electrolysis in Aqueous NaOH Electrolyte. J. Electrochem. Soc. 2022, 169, 073506. [Google Scholar] [CrossRef]
- Han, H.; Sun, W.; Hu, Y.; Jia, B.; Tang, H. Anglesite and silver recovery from jarosite residues through roasting and sulfidization-flotation in zinc hydrometallurgy. J. Hazard. Mater. 2014, 278, 49–54. [Google Scholar] [CrossRef]
- Piervandi, Z.; Khodadadi Darban, A.; Mousavi, S.M.; Abdollahy, M.; Asadollahfardi, G.; Funari, V.; Dinelli, E.; Webster, R.D.; Sillanpää, M. Effect of biogenic jarosite on the bio-immobilization of toxic elements from sulfide tailings. Chemosphere 2020, 258, 127288. [Google Scholar] [CrossRef] [PubMed]
- Jones, B.; Renaut, R.W. Selective mineralization of microbes in Fe-rich precipitates (jarosite, hydrous ferric oxides) from acid hot springs in the Waiotapu geothermal area, North Island, New Zealand. Sediment. Geol. 2007, 194, 77–98. [Google Scholar] [CrossRef]
- Hinman, N.W.; Bishop, J.L.; Gulick, V.C.; Dettmann, J.M.K.; Morkner, P.; Berlanga, G.; Henneberger, R.M.; Bergquist, P.; Richardson, C.D.; Walter, M.R.; et al. Targeting mixtures of jarosite and clay minerals for Mars exploration. Am. Miner. 2021, 106, 1237–1254. [Google Scholar] [CrossRef]
- Figueiredo, M.-O.; Pereira da Silva, T. The Positive Environmental Contribution of Jarosite by Retaining Lead in Acid Mine Drainage Areas. Int. J. Environ. Res. Public Health. 2011, 8, 1575–1582. [Google Scholar] [CrossRef]
- Coggon, M.; Becerra, C.A.; Nüsslein, K.; Miller, K.; Yuretich, R.; Ergas, S.J. Bioavailability of jarosite for stimulating acid mine drainage attenuation. Geochim. Cosmochim. Acta 2012, 78, 65–76. [Google Scholar] [CrossRef]
- Liao, Y.; Zhou, L.; Bai, S.; Liang, J.; Wang, S. Occurrence of biogenic schwertmannite in sludge bioleaching environments and its adverse effect on solubilization of sludge-borne metals. Appl. Geochem. 2009, 24, 1739–1746. [Google Scholar] [CrossRef]
- Norlund, K.L.I.; Baron, C.; Warren, L.A. Jarosite formation by an AMD sulphide-oxidizing environmental enrichment: Implications for biomarkers on Mars. Chem. Geol. 2010, 275, 235–242. [Google Scholar] [CrossRef]
- Bigham, J.M.; Nordstrom, D.K. Iron and Aluminum Hydroxysulfates from Acid Sulfate Waters. Rev. Miner. Geochem. 2000, 40, 351–403. [Google Scholar] [CrossRef]
- Desborough, G.A.; Smith, K.S.; Lowers, H.A.; Swayze, G.A.; Hammarstrom, J.M.; Diehl, S.F.; Leinz, R.W.; Driscoll, R.L. Mineralogical and chemical characteristics of some natural jarosites. Geochim. Cosmochim. Acta 2010, 74, 1041–1056. [Google Scholar] [CrossRef]
- Basciano, L.C.; Peterson, R.C. Jarosite–hydronium jarosite solid-solution series with full iron site occupancy: Mineralogy and crystal chemistry. Am. Miner. 2007, 92, 1464–1473. [Google Scholar] [CrossRef]
- Bhatti, T.M.; Bigham, J.M.; Carlson, L.; Tuovinen, O.H. Mineral Products of Pyrrhotite Oxidation by Thiobacillus ferrooxidans. Appl. Environ. Microbiol. 1993, 59, 1984–1990. [Google Scholar] [CrossRef] [PubMed]
- Jensen, A.B.; Webb, C. Ferrous sulphate oxidation using Thiobacillus ferrooxidans: A review. Process Biochem. 1995, 30, 225–236. [Google Scholar] [CrossRef]
- Daoud, J.; Karamanev, D. Formation of jarosite during Fe2+ oxidation by Acidithiobacillus ferrooxidans. Miner. Eng. 2006, 19, 960–967. [Google Scholar] [CrossRef]
- Jiang, L.; Zhou, H.; Peng, X. Bio-oxidation of pyrite, chalcopyrite and pyrrhotite by Acidithiobacillus ferrooxidans. Chin. Sci. Bull. 2007, 52, 2702–2714. [Google Scholar] [CrossRef]
- Bao, Y.; Guo, C.; Lu, G.; Yi, X.; Wang, H.; Dang, Z. Role of microbial activity in Fe(III) hydroxysulfate mineral transformations in an acid mine drainage-impacted site from the Dabaoshan Mine. Sci. Total Environ. 2018, 616–617, 647–657. [Google Scholar] [CrossRef] [PubMed]
- Chabert, N.; Bonnefoy, V.; Achouak, W. Quorum sensing improves current output with Acidithiobacillus ferrooxidans. Microb. Biotechnol. 2018, 11, 136–140. [Google Scholar] [CrossRef] [PubMed]
- Zhan, Y.; Yang, M.; Zhang, S.; Zhao, D.; Duan, J.; Wang, W.; Yan, L. Iron and sulfur oxidation pathways of Acidithiobacillus ferrooxidans. World J. Microbiol. Biotechnol. 2019, 35, 60. [Google Scholar] [CrossRef]
- Burns, R.G. Ferric sulfates on Mars. J. Geophys. Res. Solid Earth 1987, 92, E570–E574. [Google Scholar] [CrossRef]
- Christensen, P.R.; Jakosky, B.M.; Kieffer, H.H.; Malin, M.C.; Mcsween, H.Y., Jr.; Nealson, K.; Mehall, G.L.; Silverman, S.H.; Ferry, S.; Caplinger, M. The Thermal Emission Imaging System (THEMIS) for the Mars 2001 Odyssey Mission. Space Sci. Rev. 2004, 110, 85–130. [Google Scholar] [CrossRef]
- Klingelhoefer, G.; Morris, R.; Bernhardt, B.; Schröder, C.; Rodionov, D.; De Souza, P.; Yen, A.; Gellert, R.; Evlanov, E.; Zubkov, B.; et al. Jarosite and Hematite at Meridiani Planum from Opportunity’s Mössbauer Spectrometer. Science 2005, 306, 1740–1745. [Google Scholar] [CrossRef]
- Golden, D.C.; Ming, D.W.; Morris, R.V.; Graff, T.G. Hydrothermal synthesis of hematite spherules and jarosite: Implications for diagenesis and hematite spherule formation in sulfate outcrops at Meridiani Planum, Mars. Am. Miner. 2008, 93, 1201–1214. [Google Scholar] [CrossRef]
- Farrand, W.H.; Glotch, T.D.; Rice, J.W.; Hurowitz, J.A.; Swayze, G.A. Discovery of jarosite within the Mawrth Vallis region of Mars: Implications for the geologic history of the region. Icarus 2009, 204, 478–488. [Google Scholar] [CrossRef]
- King, P.L.; McLennan, S.M. Sulfur on Mars. Elements 2010, 6, 107–112. [Google Scholar] [CrossRef]
- Roach, L.H.; Mustard, J.F.; Lane, M.D.; Bishop, J.L.; Murchie, S.L. Diagenetic haematite and sulfate assemblages in Valles Marineris. Icarus 2010, 207, 659–674. [Google Scholar] [CrossRef]
- Morrison, S.M.; Downs, R.T.; Blake, D.F.; Vaniman, D.T.; Ming, D.W.; Hazen, R.M.; Treiman, A.H.; Achilles, C.N.; Yen, A.S.; Morris, R.V.; et al. Crystal chemistry of martian minerals from Bradbury Landing through Naukluft Plateau, Gale crater, Mars. Am. Miner. 2018, 103, 857–871. [Google Scholar] [CrossRef]
- Bhattacharya, S.; Mitra, S.; Gupta, S.; Jain, N.; Chauhan, P.; Parthasarathy, G.; Ajai. Jarosite occurrence in the Deccan Volcanic Province of Kachchh, western India: Spectroscopic studies on a Martian analog locality. J. Geophys. Res. Planets 2016, 121, 402–431. [Google Scholar] [CrossRef]
- Osmundsen, P.T.; Eide, E.A.; Haabesland, N.E.; Roberts, D.; Andersen, T.B.; Kendrick, M.; Bingen, B.; Braathen, A.; Redfield, T.F. Kinematics of the Høybakken detachment zone and the Møre–Trøndelag Fault Complex, central Norway. J. Geol. Soc. London 2006, 163, 303–318. [Google Scholar] [CrossRef]
- Gasser, D.; Grenne, T.; Corfu, F.; Bøe, R.; Røhr, T.S.; Slagstad, T. Concurrent MORB-type and ultrapotassic volcanism in an extensional basin along the Laurentian Iapetus margin: Tectonomagmatic response to Ordovician arc-continent collision and subduction polarity flip. GSA Bull. 2021, 134, 1635–1659. [Google Scholar] [CrossRef]
- Seranne, M. Late Palaeozoic kinematics of the Møre-Trøndelag Fault Zone and adjacent areas, central Norway. Nor. J. Geol. 1992, 72, 141–158. [Google Scholar]
- Piasecki, M.A.J.; Cliff, R.A. Rb-Sr dating of strain-induced mineral growth in two ductile shear zones in the Western Gneiss Region of Nord-Trøndelag, Central Norway. In NGU Bulletin, Norwegian Geological Survey; NGU: Trondheim, Norway, 1988; pp. 33–50. [Google Scholar]
- Sæter, H.S.B. Fault-Slip Inversion and Palaeostress Analyses above and below a Post-Caledonian Extensional Detachment; NTNU: Trondheim, Norway, 2006. [Google Scholar]
- Haabesland, N.E. Sedimentarkitektur og Migrasjon av Sedimentære Faciesenheter ved Innfylling av et Tektonisk Aktivt Halvgraven Basseng, et Eksempel Fra Asenøy Devonbassenget, Fosen, Trøndelag; University of Oslo: Olso, Norway, 2002. [Google Scholar]
- Roberts, D. Geology of the Fosen Peninsula and Trondheimsfjord Region: A Synopsis and Excursion Guide; Report 98.119; NGU: Trondheim, Norway, 1998. [Google Scholar]
- Holtedahl, H. The Norwegian strandflat puzzle. Nor. J. Geol. 1998, 78, 47–66. [Google Scholar]
- Kjemperud, A. Late Weichselian and Holocene shoreline displacement in the Trondheimsfjord area, Central Norway. Boreas 2008, 15, 61–82. [Google Scholar] [CrossRef]
- Romundet, A.; Lakeman, T.R. Shoreline displacement at Ørland since 6000 cal. yr. BP. In Environment and Settlement: Ørland 600 BC–AD 1250: Archaeological Excavations at Vik, Ørland Main Air Base; Ystgaard, I., Ed.; Cappelen Damm Akademisk: Oslo, Norway, 2019; pp. 51–67. [Google Scholar]
- Thorsnes, T.; Solli, A. Berggrunnskart Bjugn 1522-1 M 1: 50,000; NGU: Trondheim, Norway, 2019. [Google Scholar]
- Frost, R.L.; Wills, R.-A.; Weier, M.L.; Martens, W.; Mills, S. A Raman spectroscopic study of selected natural jarosites. Spectrochim. Acta Part A 2006, 63, 1–8. [Google Scholar] [CrossRef] [PubMed]
- Frost, R.L.; Wills, R.-A.; Weier, M.L.; Martens, W. Comparison of the Raman spectra of natural and synthetic K- and Na-jarosites at 298 and 77 K. J. Raman Spectrosc. 2005, 36, 435–444. [Google Scholar] [CrossRef]
- Chio, C.H.; Sharma, S.K.; Muenow, D.W. Micro-Raman studies of hydrous ferrous sulfates and jarosites. Spectrochim. Acta, Part A 2005, 61, 2428–2433. [Google Scholar] [CrossRef] [PubMed]
- Desborough, G.A.; Smith, K.S.; Lowers, H.A.; Swayze, G.A.; Hammarstrom, J.M.; Diehl, S.F.; Driscoll, R.; Leinz, R.W. The use of synthetic jarosite as an analog for natural jarosite. In Proceedings of the Seventh International Conference on Acid Rock Drainage, St. Louis, MO, USA, 26–20 March 2006; pp. 458–475. [Google Scholar]
- Sarma, L.P.; Prasad, P.S.R.; Ravikumar, N. Raman spectroscopic study of phase transitions in natural gypsum. J. Raman Spectrosc. 1998, 29, 851–856. [Google Scholar] [CrossRef]
- Krishnamurthy, N.; Soots, V. Raman Spectrum of Gypsum. Can. J. Phys. 1971, 49, 885–896. [Google Scholar] [CrossRef]
- Legodi, M.A.; de Waal, D. The preparation of magnetite, goethite, hematite and maghemite of pigment quality from mill scale iron waste. Dye. Pigment. 2007, 74, 161–168. [Google Scholar] [CrossRef]
- Li, S.; Hihara, L.H. A Micro-Raman Spectroscopic Study of Marine Atmospheric Corrosion of Carbon Steel: The Effect of Akaganeite. J. Electrochem. Soc. 2015, 162, C495. [Google Scholar] [CrossRef]
- Andersen, F.A.; Brecevic, L. Infrared Spectra of Amorphous and Crystalline Calcium Carbonate. Acta Chem. Scand. 1991, 45, 1018–1024. [Google Scholar] [CrossRef]
- Anbalagan, G.; Mukundakumari, S.; Murugesan, K.S.; Gunasekaran, S. Infrared, optical absorption, and EPR spectroscopic studies on natural gypsum. Vib. Spectrosc. 2009, 50, 226–230. [Google Scholar] [CrossRef]
- Hug, S.J. In SituFourier Transform Infrared Measurements of Sulfate Adsorption on Hematite in Aqueous Solutions. J. Colloid Interface Sci. 1997, 188, 415–422. [Google Scholar] [CrossRef]
- Selbekk, R.S. Norges Mineraler; Tapir Akademisk Forlag: Trondheim, Norway, 2010. [Google Scholar]
- Kilhavn, H.; Gabrielsen, I.; Skoglund, R.; Lauritzen, S. Mineral-and fine-grain sedimentology of the Reingardslia karst, Rana, North Norway. In Proceedings of the 17th International Congress of Speleology, Sydney, Australia, 23–29 July 2017; pp. 247–250. [Google Scholar]
- Whitworth, A.J.; Brand, H.E.A.; Wilson, S.A.; Frierdich, A.J. Iron isotope geochemistry and mineralogy of jarosite in sulfur-rich sediments. Geochim. Cosmochim. Acta 2020, 270, 282–295. [Google Scholar] [CrossRef]
- Öborn, I.; Berggren, D. Characterization of jarosite-natrojarosite in two northern Scandinavian soils. Geoderma 1995, 66, 213–225. [Google Scholar] [CrossRef]
- Löfvendahl, R. Jarosite minerals in Sweden. Geol. Föreningen I Stockh. Förhandlingar 1980, 102, 91–94. [Google Scholar] [CrossRef]
- Raade, G. On natrojarosite in Norway. Nor. J. Geol. 1971, 51, 195–197. [Google Scholar]
- Bigham, J.M.; Schwertmann, U.; Traina, S.J.; Winland, R.L.; Wolf, M. Schwertmannite and the chemical modeling of iron in acid sulfate waters. Geochim. Cosmochim. Acta 1996, 60, 2111–2121. [Google Scholar] [CrossRef]
- Zahrai, S.K.; Elwood Madden, M.E.; Madden, A.S.; Rimstidt, J.D. Na-jarosite dissolution rates: The effect of mineral composition on jarosite lifetimes. Icarus 2013, 223, 438–443. [Google Scholar] [CrossRef]
- Madden, A.S.; Elwood Madden, M.E.R.J.D.; Kendall, M.R. Investigation of jarosite dissolution reaction products with AFM, SEM, TEM, and XRD demonstrated patterns indicative of reaction progress and solution conditions. In Proceedings of the 43rd Lunar and Planetary Science Conference, Woodlands, TX, USA, 19–23 March 2012. [Google Scholar]
- Papike, J.J.; Karner, J.M.; Shearer, C.K. Comparative planetary mineralogy: Implications of martian and terrestrial jarosite. A crystal chemical perspective. Geochim. Cosmochim. Acta 2006, 70, 1309–1321. [Google Scholar] [CrossRef]
- Tazaki, K.; Mori, T.; Nonaka, T. Microbial jarosite and gypsum from corrosion of portland cement concrete. Can. Miner. 1992, 30, 431–444. [Google Scholar]
- Swayze, G.A.; Desborough, G.A.; Smith, K.S.; Lowers, H.A.; Hammarstrom, J.M.; Diehl, S.F.; Leinz, R.W.; Driscoll, R.L. Understanding Jarosite—From Mine Waste to Mars. In Understanding Contaminants Associated with Mineral Deposits; Verplanck, P.L., Ed.; US Geological Survey (USGS): Reston, VA, USA, 2008. [Google Scholar]
- Bosselmann, F.; Epple, M. Sulfate-containing biominerals. Met. Ions Life Sci. 2008, 4, 207–217. [Google Scholar]
- Wolicka, D.; Borkowski, A. Precipitation of CaCO3 under Sulphate-Reduction Conditions. In Advances in Stromatolite Geobiology; Reitner, J., Quéric, N.-V., Arp, G., Eds.; Springer: Berlin/Heidelberg, Germany, 2011; pp. 151–160. [Google Scholar]
- Ivarson, K.C.; Ross, G.J.; Miles, N.M. Microbiological Transformations of Iron and Sulfur and Their Applications to Acid Sulfate Soils and Tidal Marshes. In Acid Sulfate Weathering; Soil Science Society of America: Madison, WI, USA, 1982; pp. 57–75. [Google Scholar]
- Wang, Y.; Li, H.; Li, D. Biosynthesis of natrojarosite by immobilized iron-oxidizing bacteria. Int. J. Miner. Process. 2013, 120, 35–38. [Google Scholar] [CrossRef]
- Matýsek, D.; Jirásek, J.; Osovský, M.; Skupien, P. Minerals formed by the weathering of sulfides in mines of the Czech part of the Upper Silesian Basin. Miner. Mag. 2014, 78, 1265–1286. [Google Scholar] [CrossRef]
- Oggerin, M.; Tornos, F.; Rodríguez, N.; del Moral, C.; Sánchez-Román, M.; Amils, R. Specific jarosite biomineralization by Purpureocillium lilacinum, an acidophilic fungi isolated from Río Tinto. Environ. Microbiol. 2013, 15, 2228–2237. [Google Scholar] [CrossRef] [PubMed]
- Oggerin, M.; Tornos, F.; Rodriguez, N.; Pascual, L.; Amils, R. Fungal Iron Biomineralization in Río Tinto. Minerals 2016, 6, 37. [Google Scholar] [CrossRef]
- Achberger, A.M.; Michaud, A.B.; Vick-Majors, T.J.; Christner, B.C.; Skidmore, M.L.; Priscu, J.C.; Tranter, M. Microbiology of Subglacial Environments. In Psychrophiles: From Biodiversity to Biotechnology; Margesin, R., Ed.; Springer International Publishing: Cham, Switzerland, 2017; pp. 83–110. [Google Scholar]
- Cull, S.; McGuire, P.C.; Gross, C.; Myers, J.; Shmorhun, N. A new type of jarosite deposit on Mars: Evidence for past glaciation in Valles Marineris? Geology 2014, 42, 959–962. [Google Scholar] [CrossRef]
- Cooper, R.J.; Wadham, J.L.; Tranter, M.; Hodgkins, R.; Peters, N.E. Groundwater hydrochemistry in the active layer of the proglacial zone, Finsterwalderbreen, Svalbard. J. Hydrol. 2002, 269, 208–223. [Google Scholar] [CrossRef]
- Cousins, C. Volcanogenic Fluvial-Lacustrine Environments in Iceland and Their Utility for Identifying Past Habitability on Mars. Life 2015, 5, 568–586. [Google Scholar] [CrossRef]
- Mikucki, J.A.; Pearson, A.; Johnston, D.T.; Turchyn, A.V.; Farquhar, J.; Schrag, D.P.; Anbar, A.D.; Priscu, J.C.; Lee, P.A. A contemporary microbially maintained subglacial ferrous “ocean”. Science 2009, 324, 397–400. [Google Scholar] [CrossRef]
- Clark, P.U.; Archer, D.; Pollard, D.; Blum, J.D.; Rial, J.A.; Brovkin, V.; Mix, A.C.; Pisias, N.G.; Roy, M. The middle Pleistocene transition: Characteristics, mechanisms, and implications for long-term changes in atmospheric pCO2. Quat. Sci. Rev. 2006, 25, 3150–3184. [Google Scholar] [CrossRef]
- Mangerud, J.; Gyllencreutz, R.; Lohne, Ø.; Svendsen, J.I. Chapter 22—Glacial History of Norway. In Developments in Quaternary Sciences; Ehlers, J., Gibbard, P.L., Hughes, P.D., Eds.; Elsevier: Amsterdam, The Netherlands, 2011; Volume 15, pp. 279–298. [Google Scholar]
Disclaimer/Publisher’s Note: The statements, opinions and data contained in all publications are solely those of the individual author(s) and contributor(s) and not of MDPI and/or the editor(s). MDPI and/or the editor(s) disclaim responsibility for any injury to people or property resulting from any ideas, methods, instructions or products referred to in the content. |
© 2022 by the authors. Licensee MDPI, Basel, Switzerland. This article is an open access article distributed under the terms and conditions of the Creative Commons Attribution (CC BY) license (https://creativecommons.org/licenses/by/4.0/).